Abstract
A stormwater detention pond in a low-income residential area in Cape Town, South Africa, was retrofitted to enhance its infiltration capacity and support, among other things, Managed Aquifer Recharge (MAR) in the Cape Flats Aquifer (CFA). Continuous field monitoring was not feasible owing to theft and vandalism risks, leading to the development of a calibrated and validated hydrological model. This model, which integrated the surface and subsurface interactions, evaluated the pond’s performance under six scenarios. The scenarios included: pre- and post-retrofit (Scenarios 1 and 2); potential MAR coupled with the planned abstraction and additional MAR by the City of Cape Town in the CFA (Scenario 3); the impact of an increased infiltration area coupled with a lowered water table (Scenario 4); and climate change impacts on MAR (Scenarios 5 and 6). The study found that retrofitting increased recharge by 118% even with a high water table—i.e., 1.2 m below ground level—(Scenario 2). Scenario 3 indicated groundwater abstraction could increase MAR by up to 290% as the water table is lowered. These findings demonstrate the potential hydrological benefits of retrofitted ponds in enhancing MAR while maintaining their detention functions.
1. Introduction
Water scarcity is a significant challenge affecting millions worldwide, especially in arid and semiarid regions such as South Africa that require sustainable water resource management approaches. South Africa’s growing population and climate change are putting additional strain on the already limited water resources, underlining the need for innovative approaches to ensure sustainable water supply in South Africa [1,2].
Managed aquifer recharge (MAR) involves the intentional recharge of groundwater to supplement natural recharge and enhance aquifer storage [3]. It can provide a cost-effective and sustainable solution for water supply in water-scarce regions because it enables the storage of excess water during periods of high rainfall for use during dry spells [4,5]. However, MAR requires suitable injection or infiltration sites to ensure adequate recharge rates and to prevent contamination of the underlying aquifer.
In Cape Town, South Africa, the Cape Flats Aquifer (CFA) is a groundwater resource that can potentially provide a significant portion of the city’s water supply [6]. The City of Cape Town (CoCT) intends to abstract water from the CFA as part of its New Water Program [7]. Although the CFA has not yet been overexploited, it is imperative to ensure its sustainable use. To this end, the proposed abstraction from the CoCT’s production wells will be coupled with MAR through the injection of high-quality treated wastewater effluent into several recharge wells.
Stormwater has also been identified as a viable method for water resource augmentation in CoCT. The resource is appealing because of increasing water scarcity, as exemplified by the 2015–2018 drought that saw the CoCT narrowly escaping Day Zero, the date when it had been projected that the city’s taps would be shut off [7,8,9].
Okedi (2019) [10] identified MAR into the CFA as an effective method for implementing stormwater harvesting (SWH). He proposed that stormwater could be harvested by retrofitting stormwater detention ponds for MAR, highlighting that some of the 230+ detention ponds in the CoCT could theoretically be retrofitted to improve their infiltration capacity for this purpose. While stormwater retrofitting is a well-established concept in the urban water management literature, its practical application to South African public infrastructure for facilitating urban MAR remains an underexplored research area. Advancing knowledge in this area is critical to assessing the technical, social, and economic feasibility of retrofitting stormwater infrastructure in the CoCT to implement urban MAR and enhance water security.
In previous studies [11,12], one stormwater detention pond was retrofitted and tested in a low-income residential area in Mitchells Plain, Cape Town, to evaluate its potential for enhancing SWH through MAR. However, the risk of theft and vandalism in the area (and in South Africa more broadly) made real-time, long-term field monitoring of the pond’s SWH performance unfeasible. To address this limitation, this study employs a hydrological modelling approach to assess the long-term performance of the retrofitted detention pond.
In this study, the modelling was carried out using the PCSWMM Professional (ver. 7.5) software, a commonly used tool for simulating urban drainage systems and their impacts on water quality and quantity [13,14]. The model was calibrated and validated using historical rainfall, runoff, and groundwater data. Six scenarios were developed to assess the effects of different design configurations and climatic parameters on the pond’s performance.
This paper presents the results of this study, offering insights into the performance of a retrofitted stormwater detention pond as a MAR site over an unconfined aquifer. It contributes to the growing literature on using SuDS and MAR as sustainable water-supply solutions in water-scarce regions. The modelling approach used in this study is a potentially valuable tool that can be used to evaluate the likely performance of retrofitted stormwater detention ponds for MAR, especially in areas where continuous and extended field monitoring is not feasible owing to security concerns. The findings also contribute to the global effort towards achieving Sustainable Development Goal 6, which aims to ensure the availability and sustainable management of water and sanitation for all.
2. Modelling SuDS
Conventional stormwater management approaches typically aim to collect and convey precipitation as quickly and efficiently as reasonably possible to nearby receiving waters through engineered structures. Although this may reduce the risk of local flooding and property damage, it usually fails to maintain the pre-development water balances and address water quality concerns. By contrast, Sustainable Drainage Systems (SuDS) have emerged as an alternative stormwater management approach. SuDS are ‘drainage systems that are environmentally beneficial, causing minimal or no long-term detrimental impact’ [15]. Also known as Low Impact Development (LID), SuDS offer a holistic means of managing stormwater by mimicking the natural hydrological cycle to preserve and recreate pre-development ecosystems [16,17,18]. They generally encourage stormwater from small and frequent rainfall events to infiltrate and/or evaporate at the catchment, neighbourhood, and individual lot scales [19].
The impact of SuDS on water systems can be assessed through time-consuming and costly field monitoring [20], or with hydrological and hydraulic models that enable the user to predict the short- and long-term impacts of different types of SuDS interventions [21]. Although the impact of SuDS on surface water systems has been well documented, its influence on aquifer recharge is less understood.
Hydrological models are essential tools for water-related systems as they provide solutions for resolving problems, filling temporal and spatial data gaps, and optimising networks. They can aid in planning, designing, and operating water systems, including flood routing, forecasting, stormwater design, and analysis [22]. They are also helpful for evaluating stormwater infrastructure such as pipes, drains, and ponds, enabling the cost-effective prediction of various interventions and hydrological conditions [23].
Among the various software developed for simulating single- or long-term hydrological events [18,24], the Stormwater Management Model (SWMM) is arguably the most popular. Originally developed by the United States Environmental Protection Agency (USEPA) and CDM Inc. (Turnersville, NJ, USA) in 1971, SWMM is an open-source window-based desktop program that has, in recent years, used the SWMM5 computational engine [23,25]. PCSWMM, a commercial user interface for the SWMM software, was first released in 1984 [26].
Models built using the SWMM engine are largely deterministic, that is, they use limited, known scientific knowledge with limited observed data. However, the SWMM engine includes subroutines that rely on statistical models, including regression and stochastic models [22] (James, 2005). Therefore, assessing uncertainty is essential to ensure the accuracy and validity of modelling results.
PCSWMM has limited subsurface modelling capabilities compared to groundwater modelling software, such as MODFLOW, which limits its use in modelling some SuDS (called LIDs in the software), such as infiltration ponds, especially in areas with high water tables that influence the infiltration rate [27]. While SWMM engine-driven software like PCSWMM does not simulate groundwater interaction particularly well, it remain popular for modelling SuDS [27,28,29,30,31]. The software performs reasonably well in areas where the infiltration rate is minimally affected by the water table. PCSWMM’s functionality for modelling shallow aquifers (high water tables) can be enhanced by subsurface calibration, application of lateral groundwater equations, or modifying SWMM functions.
Coupled models, which link surface and groundwater models, are better suited to modelling flow in areas with shallow water tables; however, the coupling process is complex and often requires advanced coding experience. Furthermore, coupled models are only applicable and helpful if calibrated and validated [32,33,34,35]. In instances where calibration and validation of both surface and subsurface are unachievable, SWMM-based software can nevertheless provide valuable insights into hydrological systems with their limited surface and subsurface modelling capabilities.
3. Materials and Methods
3.1. Description of the Study Area
This paper presents a study conducted in Cape Town, the second most populous city in South Africa, with approximately 5 million inhabitants in 2024 (Figure 1). Cape Town is located at latitude 34° S 18° E. The city experiences a Mediterranean climate characterised by warm, dry summers and cold, wet winters [36,37,38].
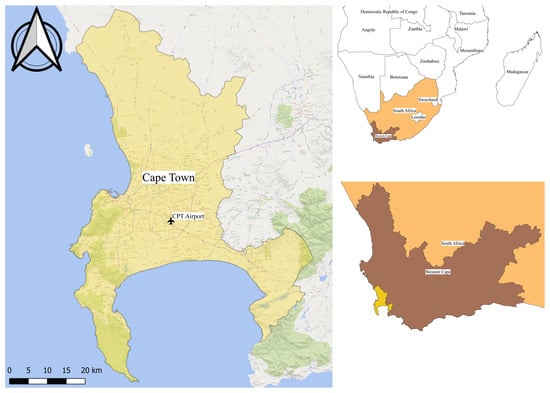
Figure 1.
City of Cape Town location.
Cape Town is in a water-scarce region. The City authorities have implemented various measures to manage its water resources and mitigate risks [2,7]. These include exploring new water sources such as desalination, and maximising previously underutilised sources, such as groundwater from the Cape Flats Aquifer (CFA).
The CFA is an unconfined, sandy aquifer covering an area of ≈630 km2 with surface elevations ranging from 0 to 110 m above sea level [39,40] comprising of quaternary sands overlying the weathered Malmesbury Formation, Table Mountain Sandstone, and Cape Granite Basement [40,41]. It is relatively shallow with a maximum thickness of 40–55 m and a groundwater capacity of around 600 Mm3 [7,42]. It is a significant source of irrigation water [39,43]. Significantly for this study, the aquifer is overlaid by many detention ponds, some of which may be retrofitted for managed aquifer recharge.
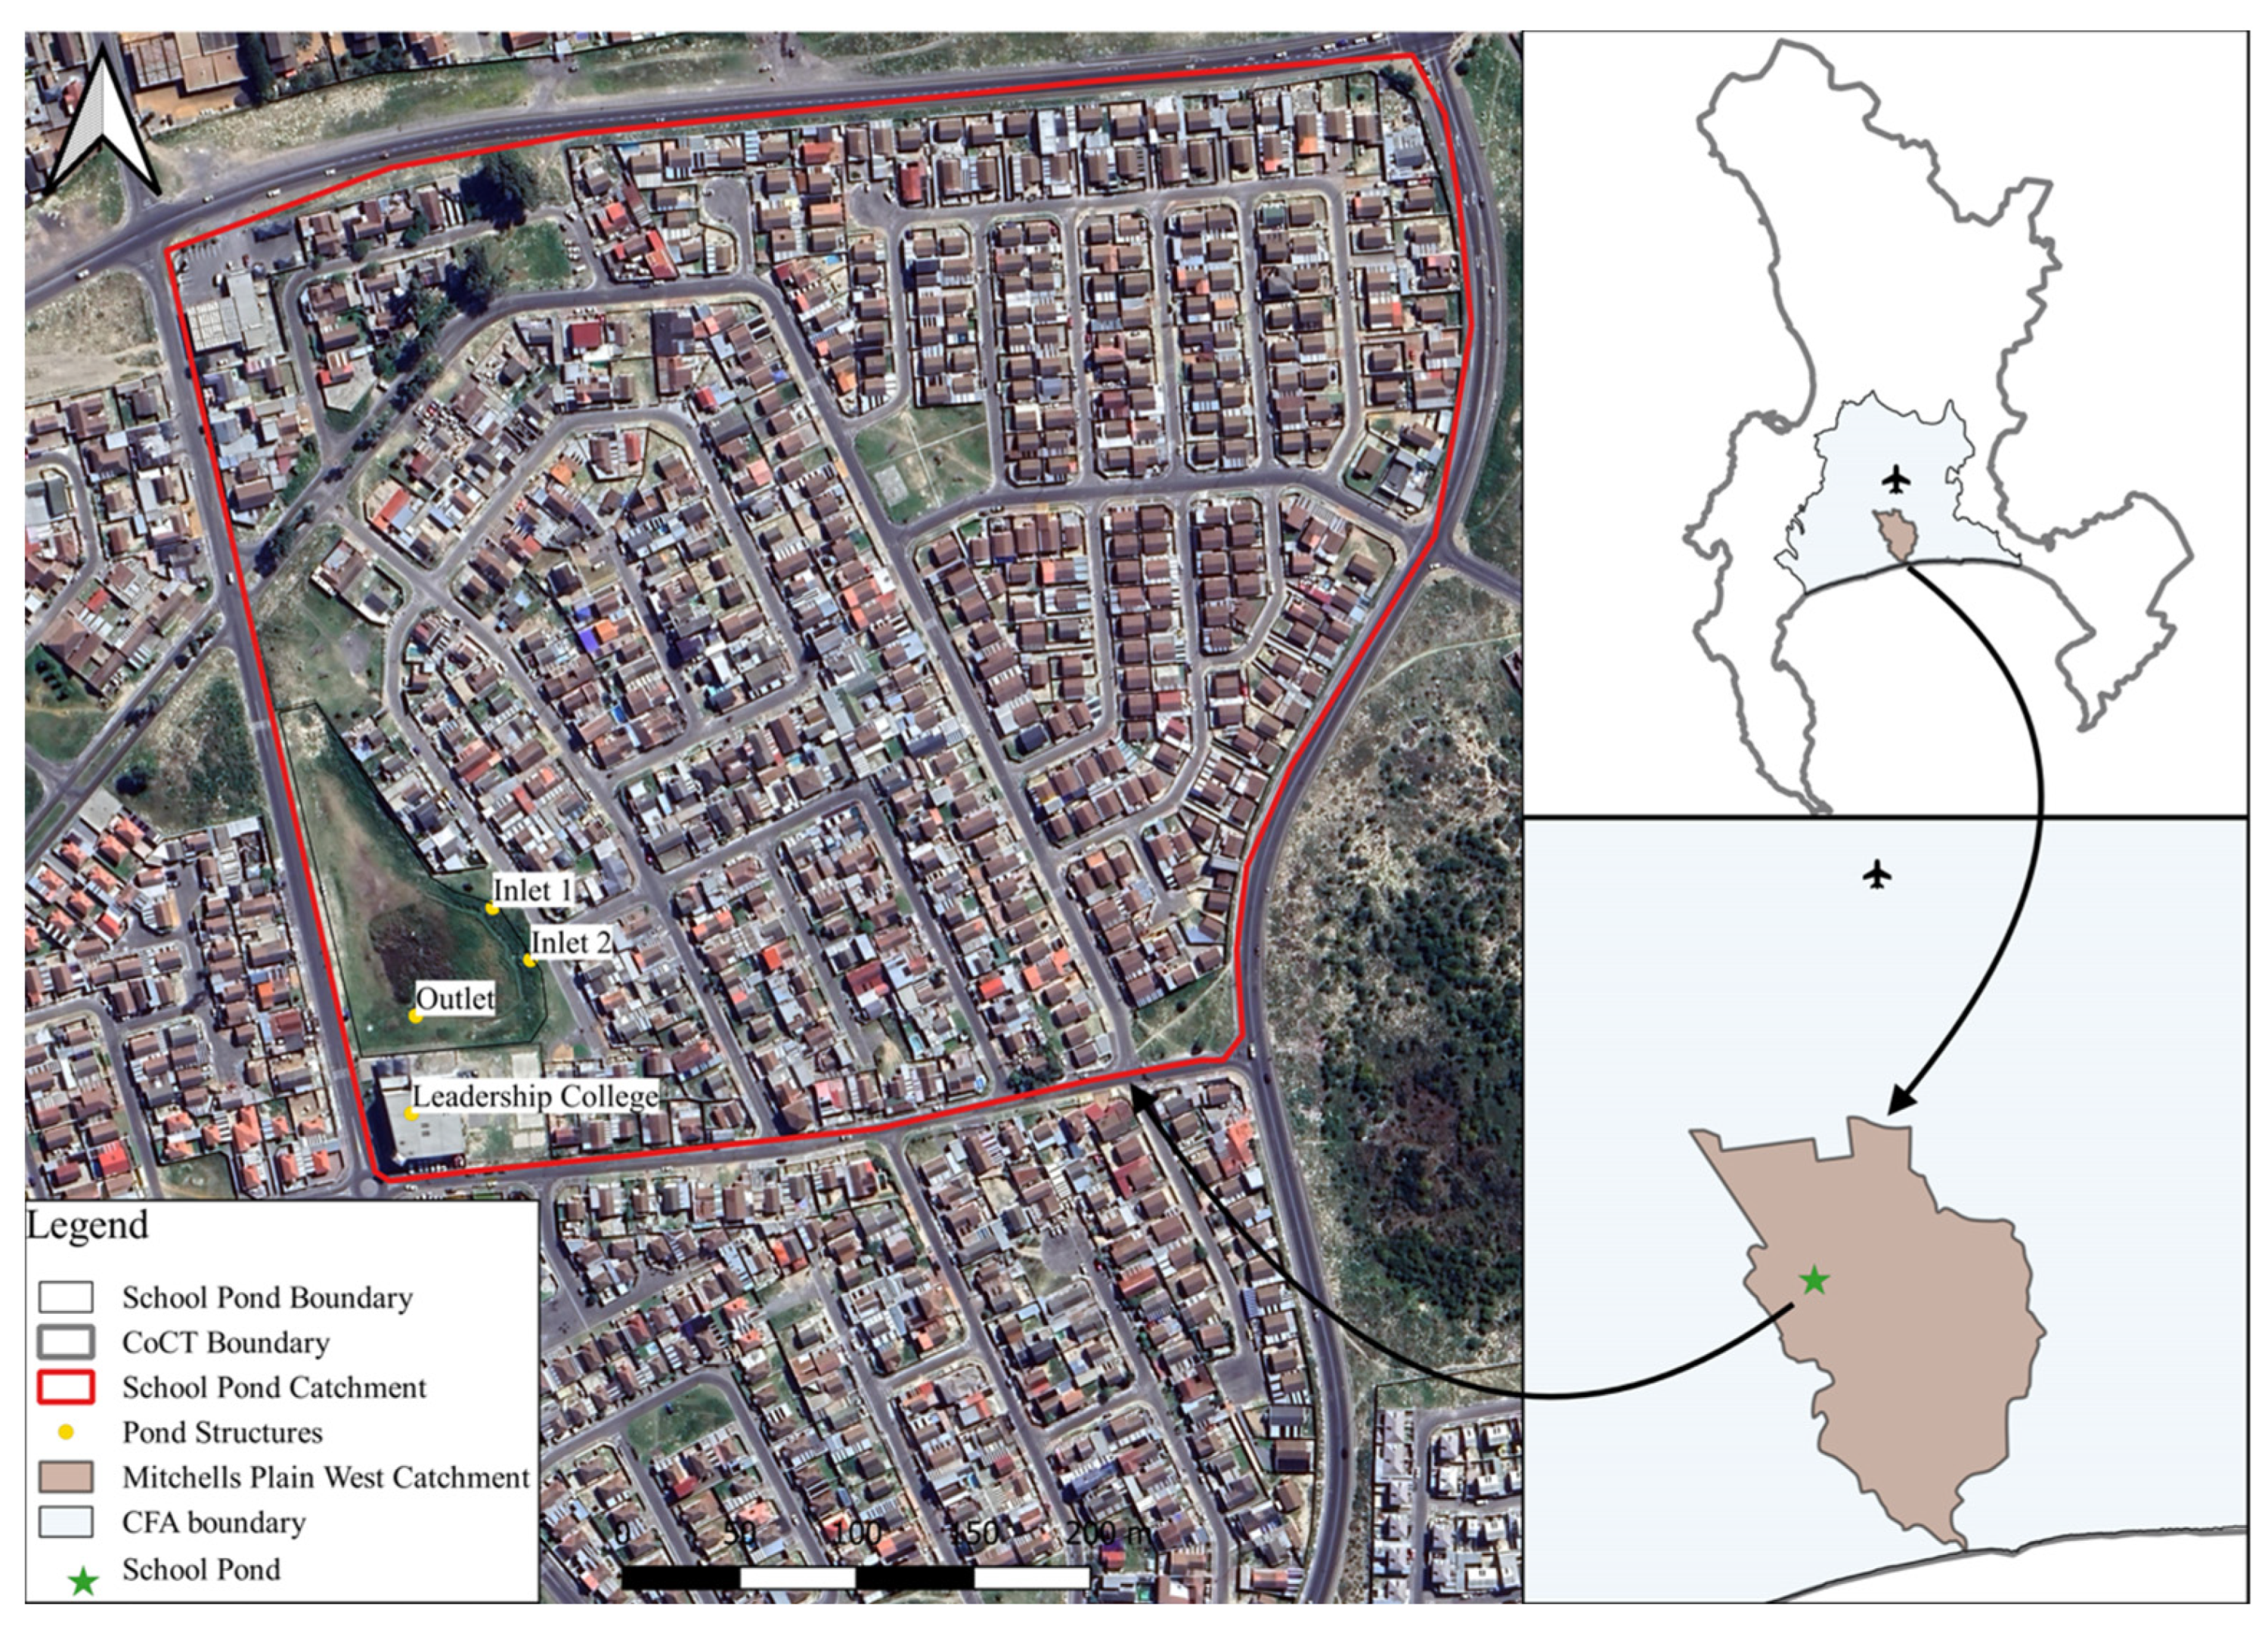
A detention pond was chosen for use in a case study from the 234 available dry detention ponds. The selection criteria for the study site included: location within the CFA, proximity to an urban settlement, accessibility to the public, current functionality and condition of the pond, hydrological feasibility for retrofitting as a MAR site, proximity to a stormwater source, safety and security, and the potential for community involvement and education. The selected pond, named ‘School Pond’ by the researchers and located in Rondevlei Park, Mitchells Plain (Figure 2), was the best compromise [11].
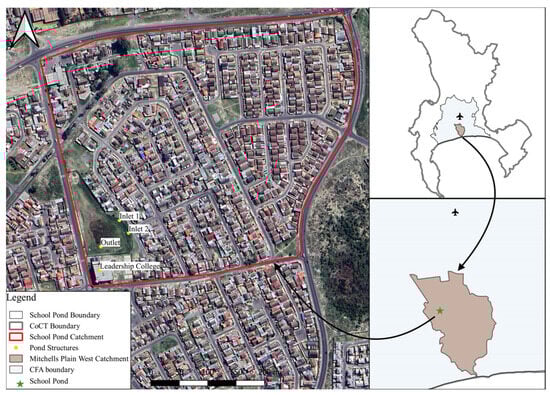
Figure 2.
School Pond locality map.
The School Pond is owned and maintained by the CoCT and falls within the Mitchells Plain West hydrological catchment. It has a surface area of 9950 m2, a maximum depth of approximately 2 m, two inlets, and one outlet. It was originally designed as a flood attenuation hydraulic structure to hold back runoff from significant storm events from the surrounding 170,600 m2 catchment before gradually releasing it into downstream storm conduits.
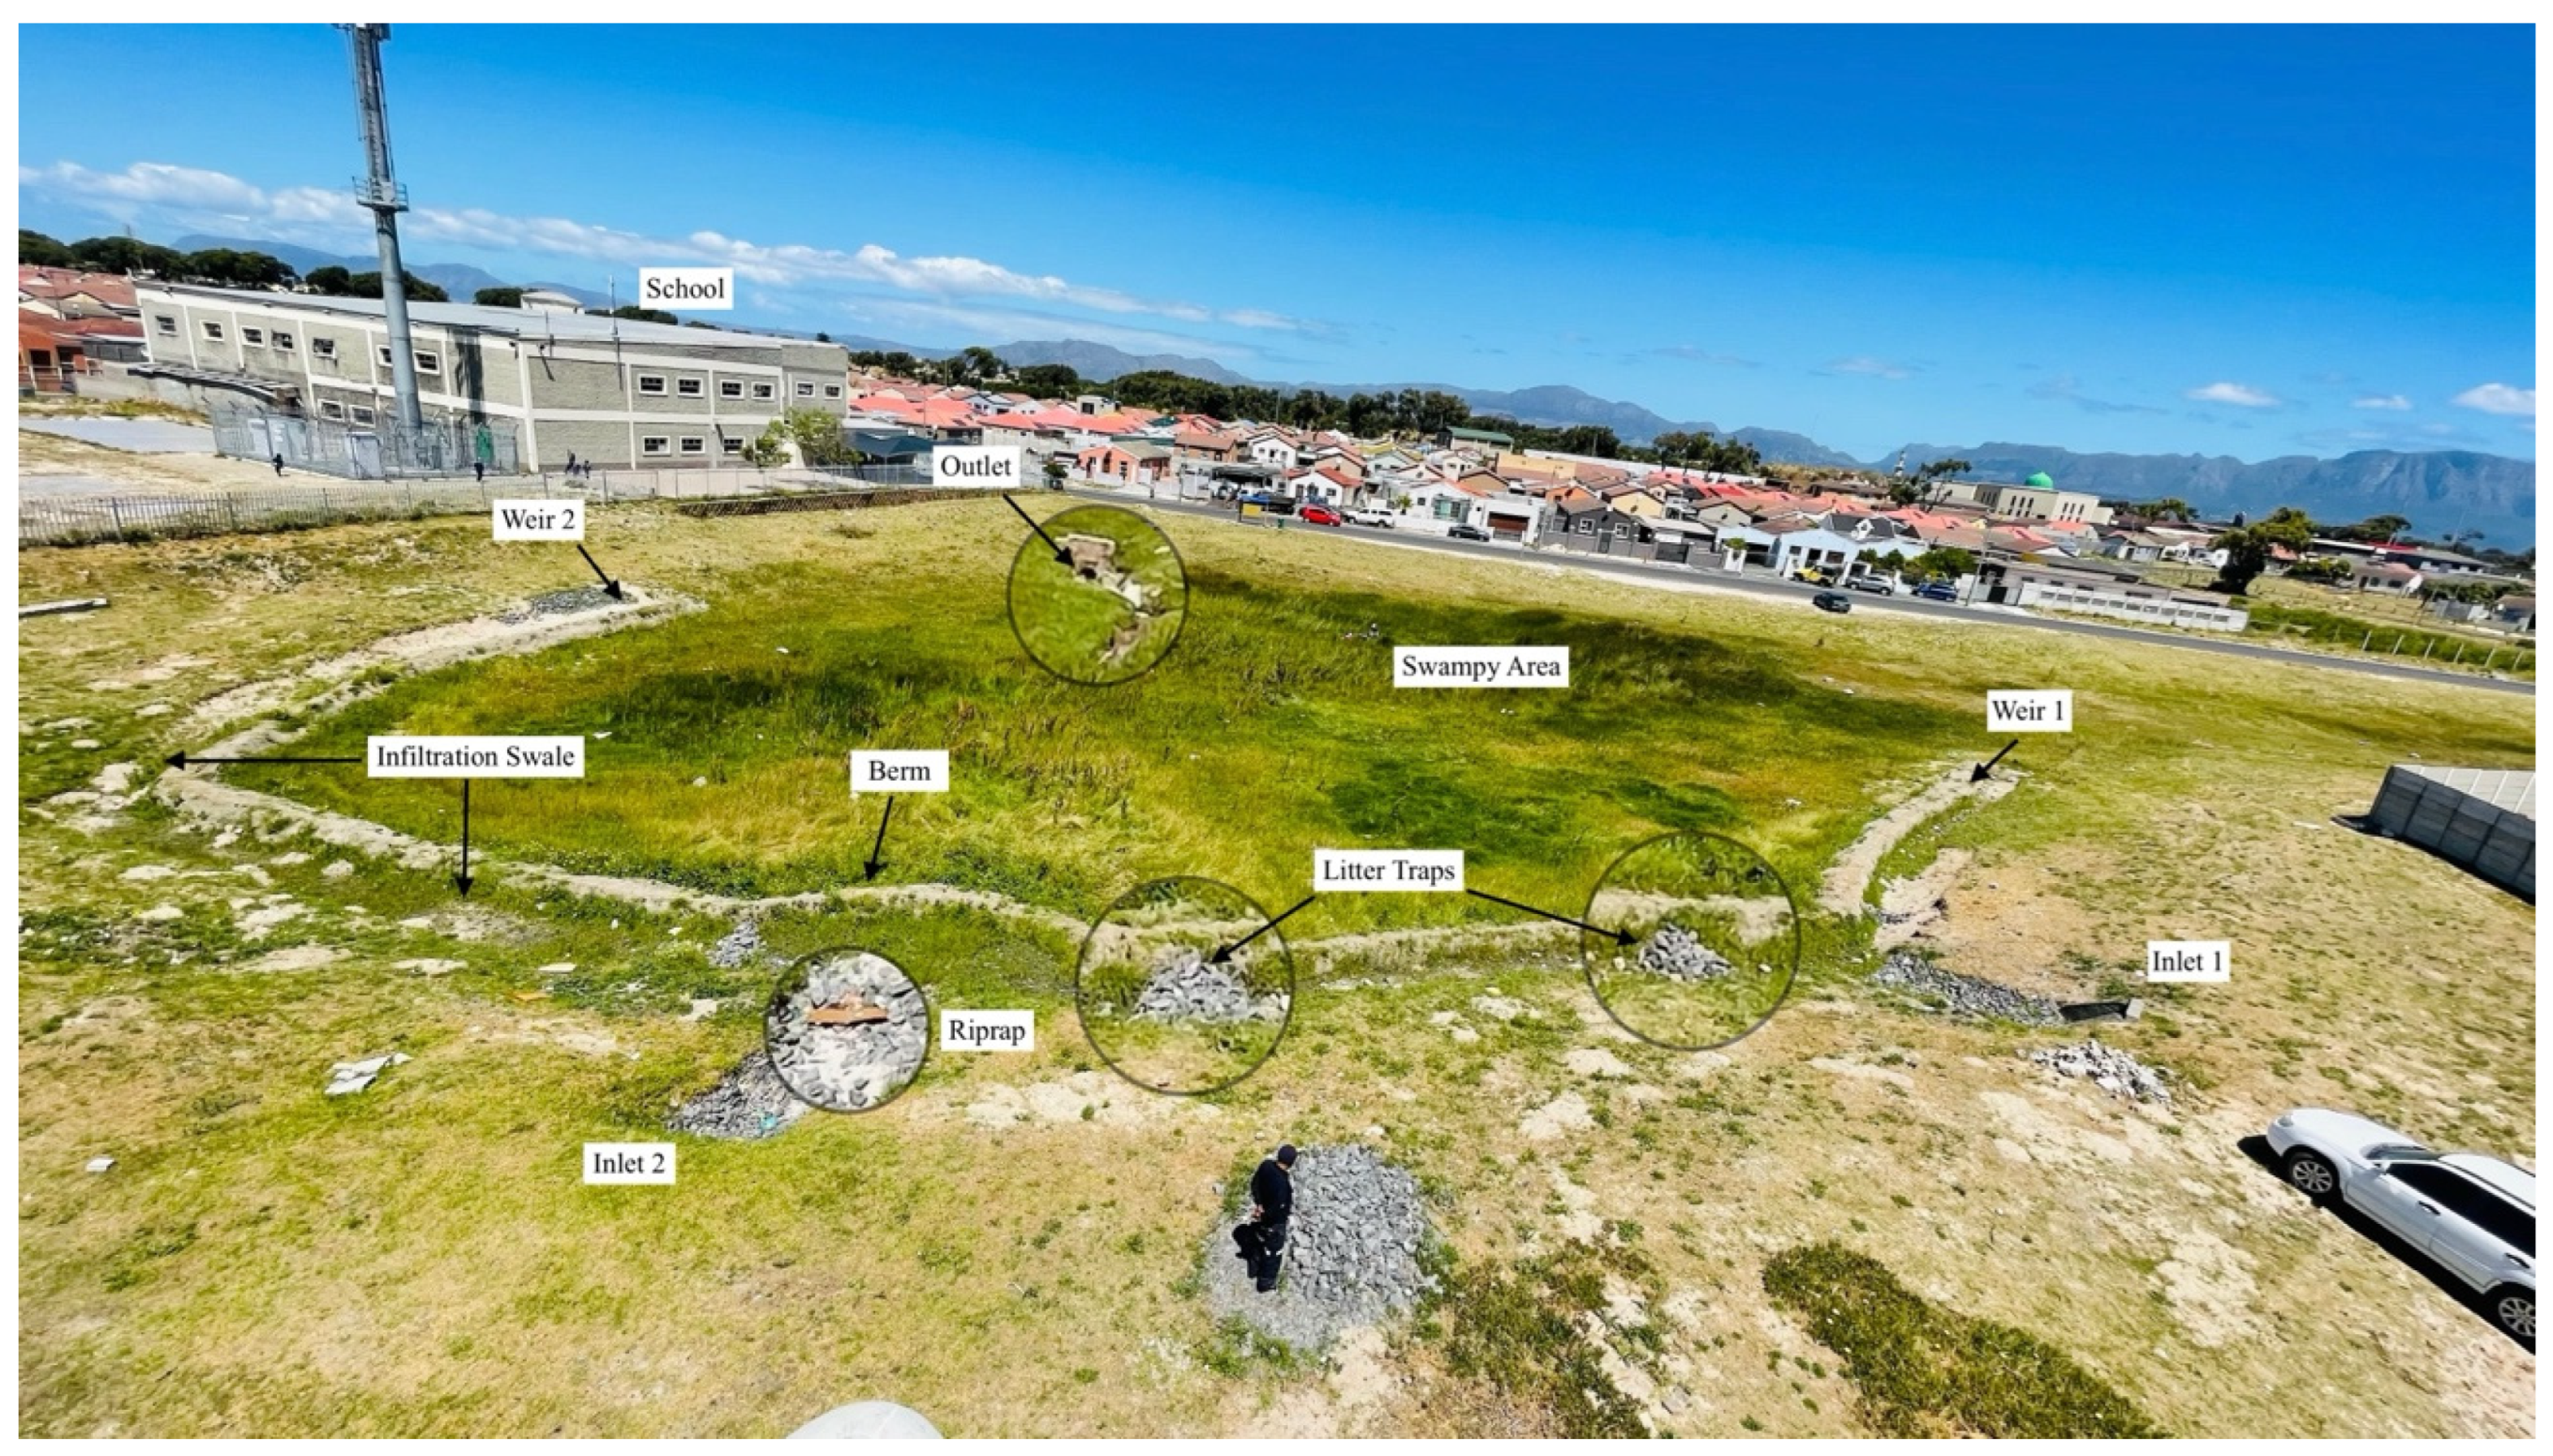
The pond was redesigned to retrofit infiltration areas to promote MAR, incorporating limited landscaping to extend the pond’s amenities. The workforce was recruited from the community [11,12]. Infiltration in the pond was enhanced by constructing a 90 m long infiltration swale by placing vertical PVC sheeting supported by sandbags to create a berm that detained water to a depth of 300 mm along a contour in front of the inlets. Excess stormwater overflows over two weirs at either end of the berm, through a swampy area in the lower portion of the pond and out through a stormwater pipe into the regional underground stormwater system. The capital cost of the retrofit amounted to ZAR 667,000, with a present value maintenance cost of ZAR 108,700 over 10 years (as of 2023). The construction process was completed in 25 working days, and the final retrofit elements are shown in Figure 3.

Figure 3.
Retrofitted detention pond [11].
3.2. Model Development
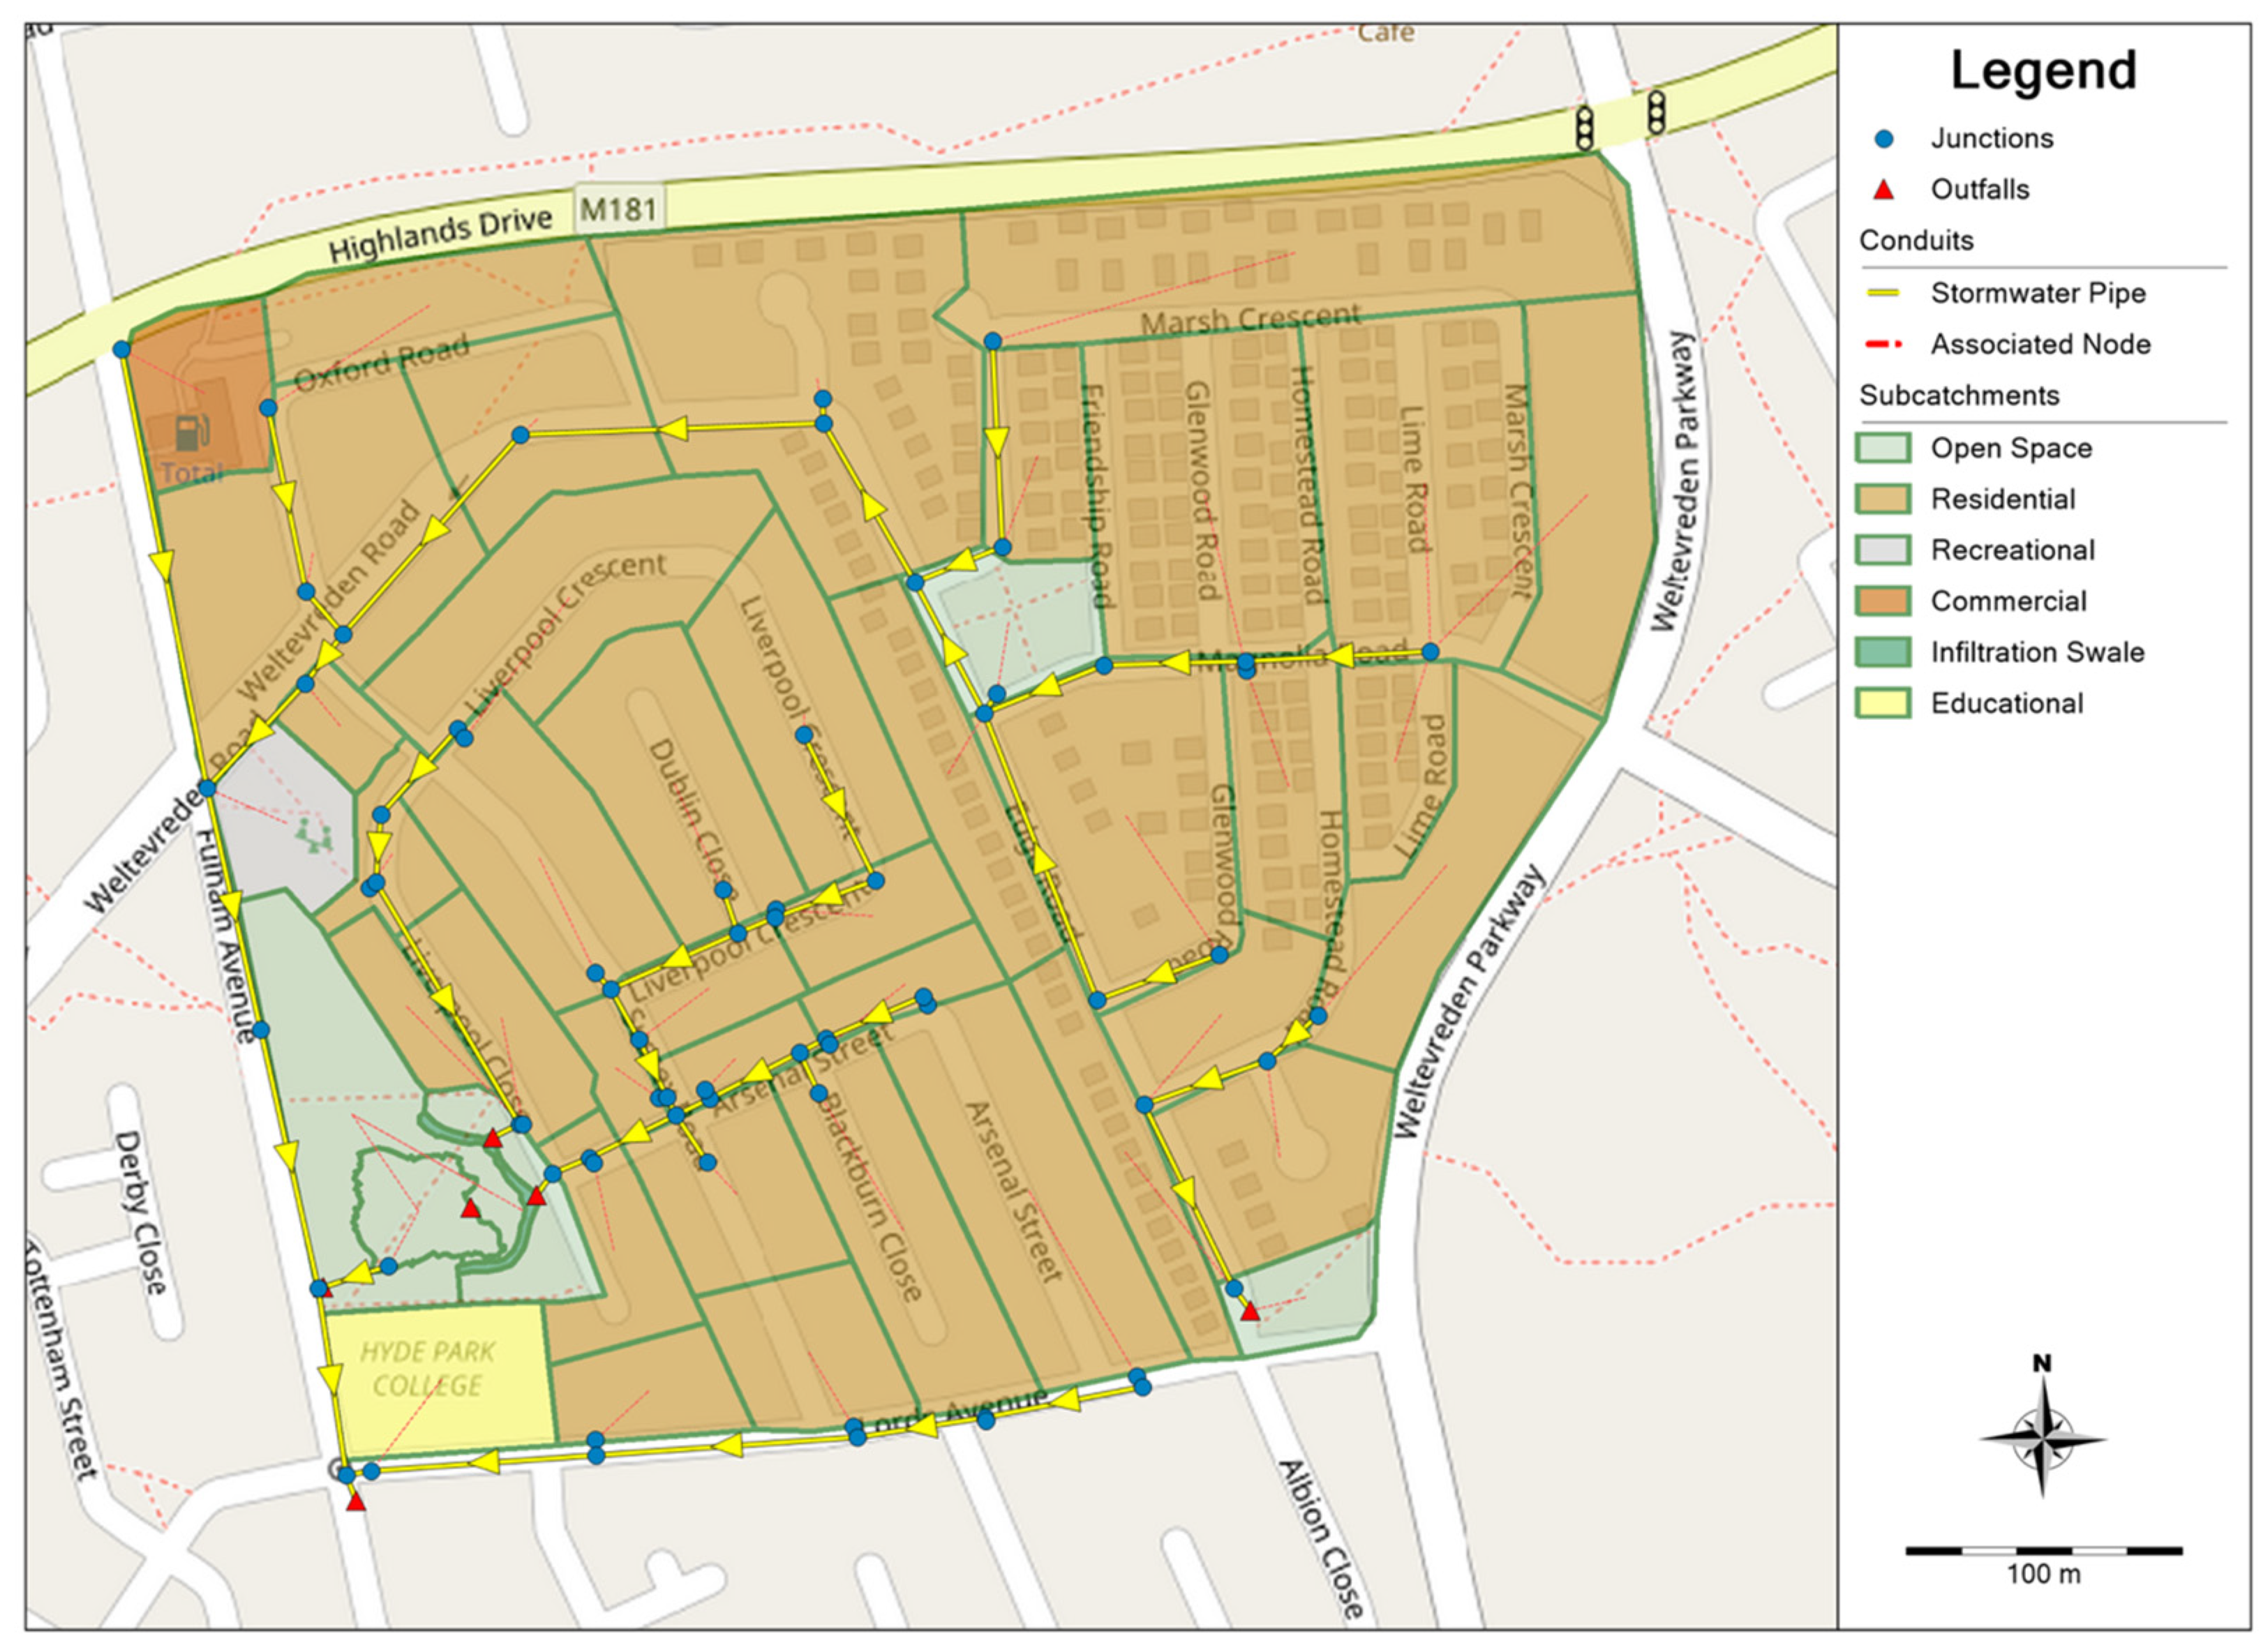
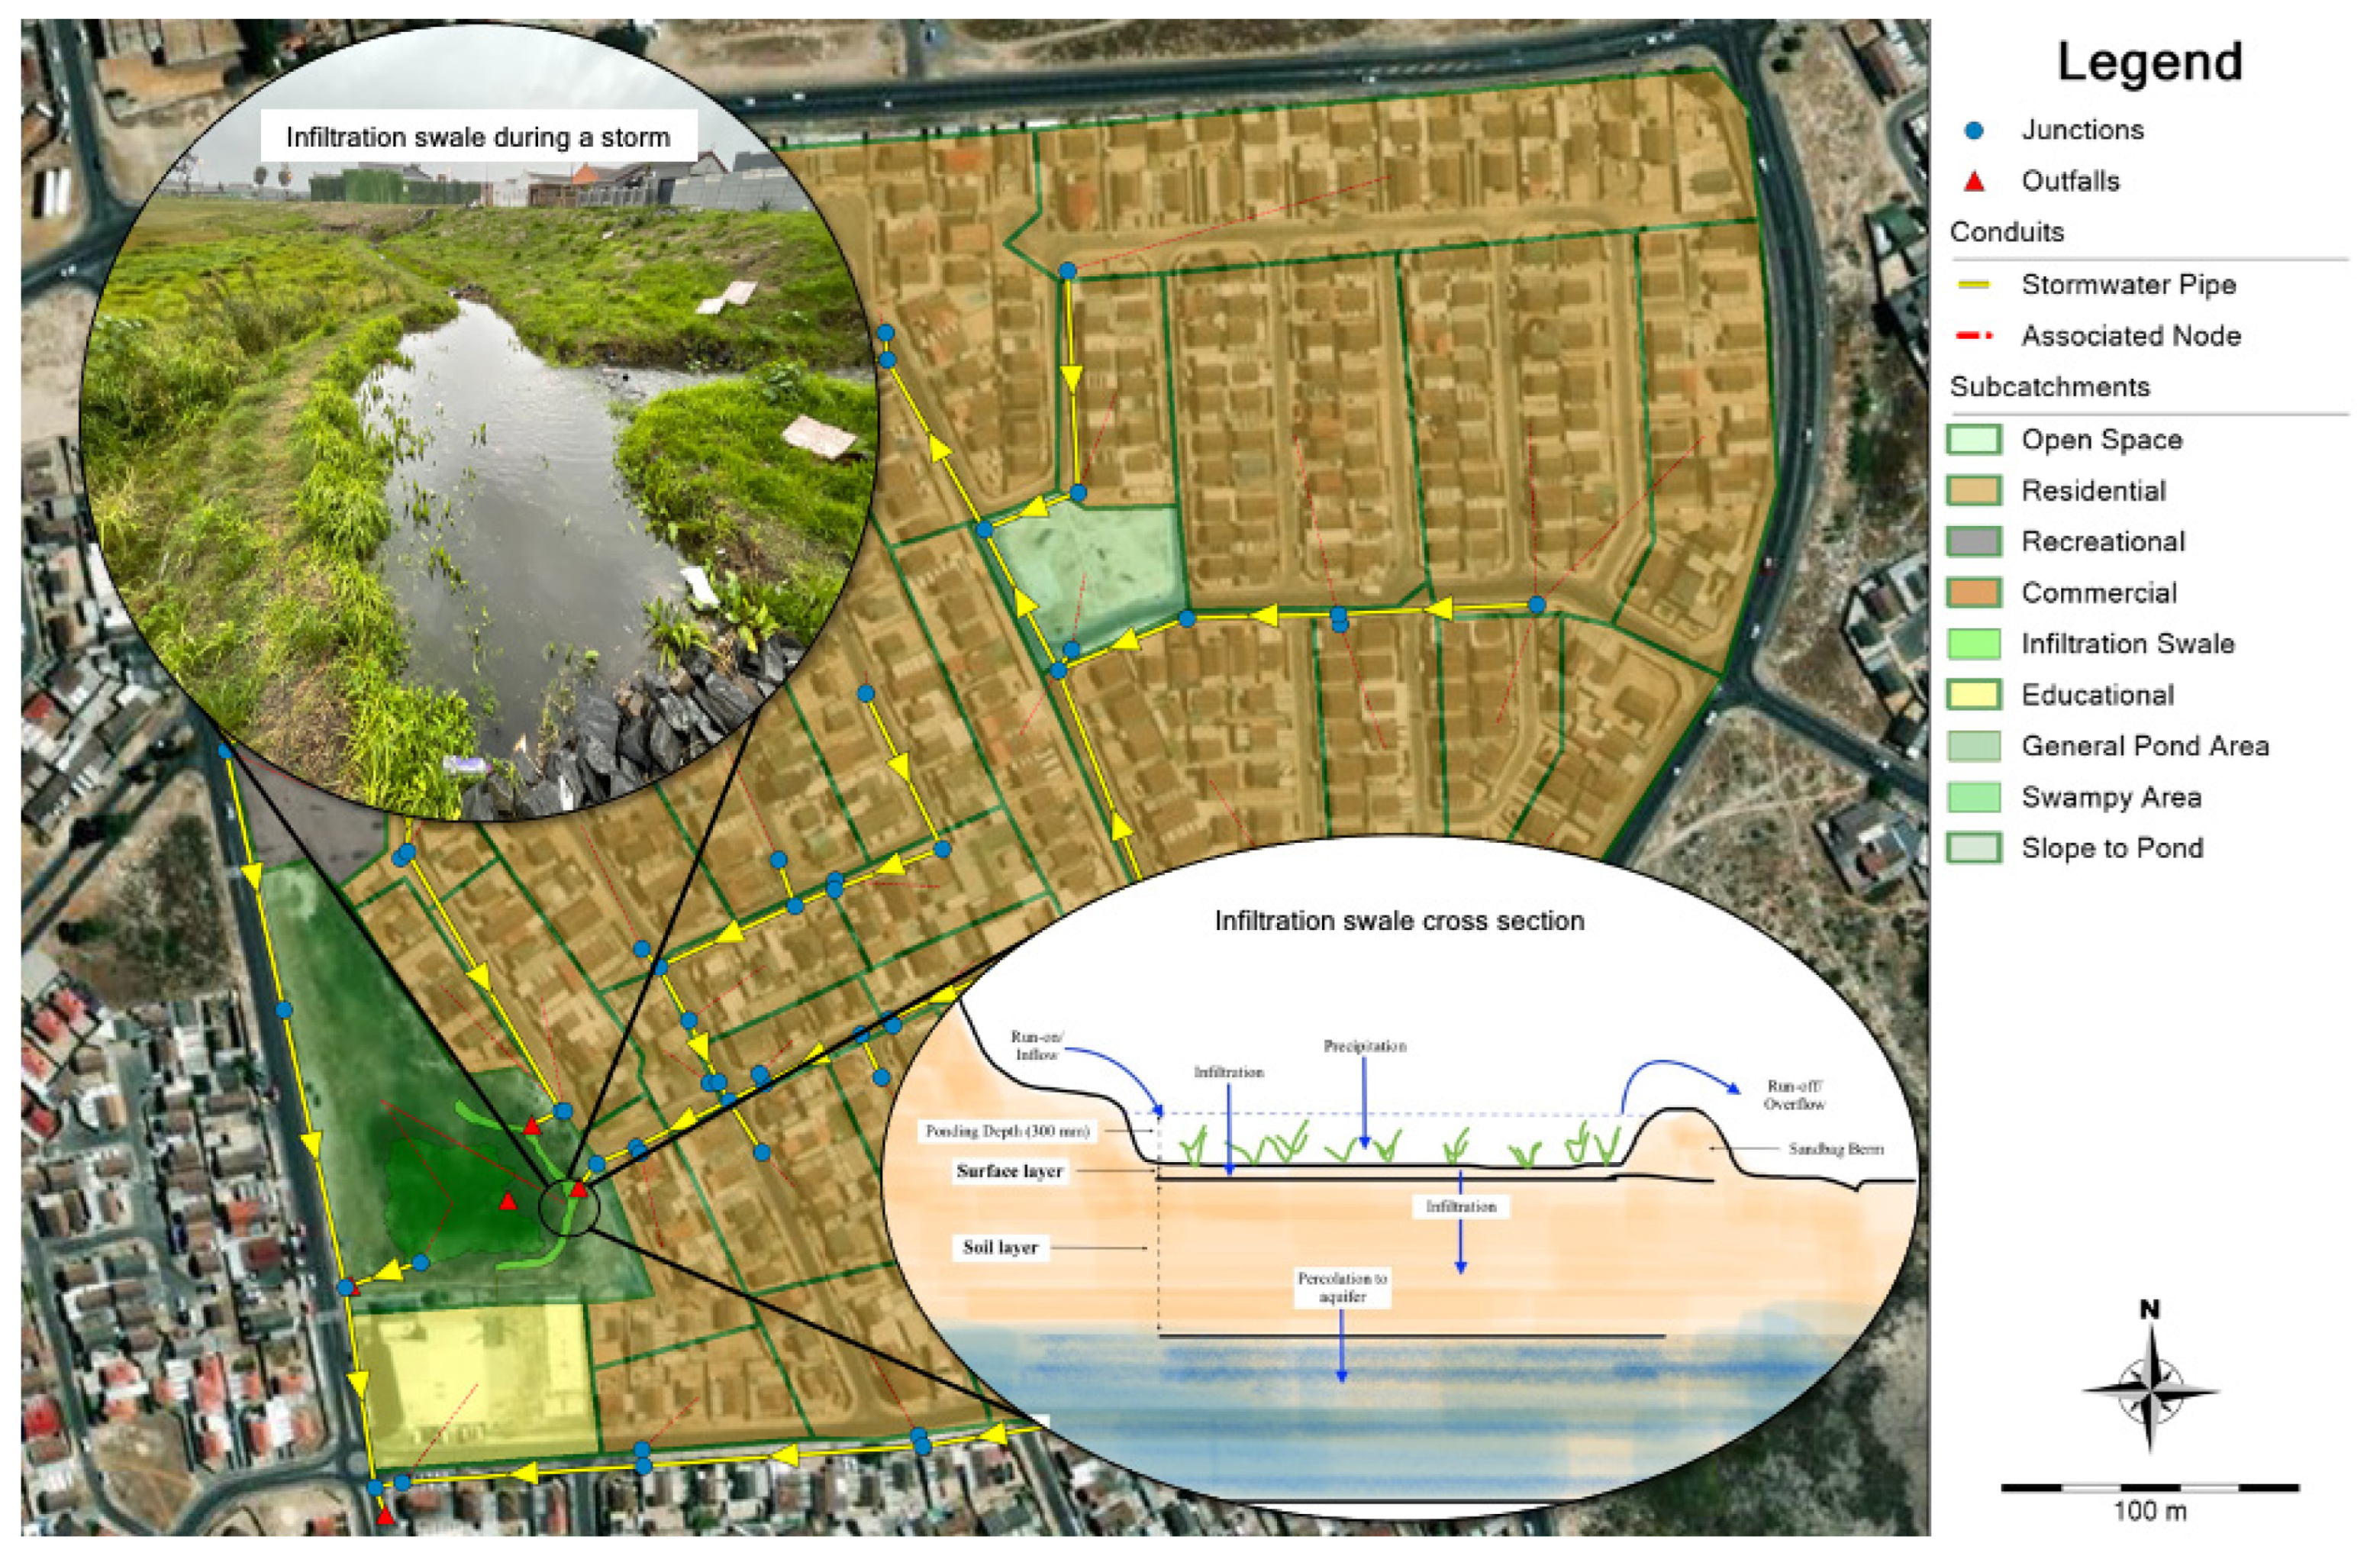
Modelling provides a simplified representation of real-world conditions in a controlled, simulated environment [44]. The PCSWM model (Figure 4) was developed using data from various sources, including the CoCT, the UCT-GIS laboratory, the literature, and field surveys. Local weather data, spanning 2005 to 2022, was obtained from nearby weather stations managed by the South African Weather Services (SAWS), supplemented by climate change data from the UCT Climate Systems Analysis Group (CSAG). The groundwater, soil, and infiltration characteristics were derived from site-specific hydrogeological surveys.

Figure 4.
‘School Pond’ PCSWM model layout (arrows denote direction of stormwater flow).
A 0.5 m bare earth digital elevation model (DEM) from a Light Detection and Ranging (LiDAR) survey and stormwater infrastructure shapefiles were integrated into PCSWMM Professional (ver. 7.5), facilitating watershed and sub-catchment delineation. Sub-catchments, with a typical area of around 0.25 ha, were defined to reflect different hydrological areas and land uses. The flow paths and areas contributing to the pond inflow and outflow were also defined. Geometric properties were automatically assigned, while land cover and soil properties were sourced from the literature and field data.
The model was calibrated and validated against observed data, including rainfall depths, temperature, and inflow rates. A ‘LID’ was assigned to the pond following surface model calibration. Groundwater data from the installed groundwater monitoring wells in the pond were used to calibrate the subsurface model. The calibrated PCSWM model incorporating an infiltration swale was then used to evaluate the hydraulic performance of the retrofitted swale under various scenarios.
3.3. Model Conceptualisation
Real-time monitoring was not feasible owing to theft risks, necessitating parameter estimation through modelling. The PCSWMM model was developed to evaluate the hydraulic performance of the retrofitted detention. The system was divided into surface and subsurface components, which were dynamically linked and interacted within the PCSWMM environment. Although PCSWMM has some noted limited subsurface modelling capabilities, a moisture balance approach was employed, tracking water movement and storage across layers using a water balance equation. This approach, along with model calibration and validation (discussed in subsequent sections), provided an adequate representation of the aquifer despite inherent limitations. Field measurements were incorporated for model validation, offering additional ground truthing. Furthermore, ongoing studies at the site employ IoT techniques to collect continuous data, which enhances the accuracy of moisture balance calculations and provides deeper insights into system dynamics. These findings will be detailed in subsequent publications.
3.3.1. Surface Model
The surface model in this study attempted to encompass the dynamic interactions between precipitation, catchment features, stormwater networks, and evapotranspiration. Parameters such as precipitation data, catchment characteristics, stormwater network specifications, and temperature data are required for PCSWMM to reasonably replicate the complex dynamics between precipitation, catchment properties, and the stormwater network. Precipitation is routed onto the various sub-catchments where it is initially stored in depressions for potential infiltration and/or evaporation. Runoff occurs when depressions overflow, directing excess water along defined pathways, generally the roads, into the stormwater network via catch pits, ultimately reaching the retrofitted detention pond.
3.3.2. Sub-Surface Model
The subsurface model involves the infiltration of water captured by surface processes. Various parameters such as soil properties and land cover determine the infiltration rate and volume. These parameters, which are challenging to determine accurately, may be estimated from the literature, GIS tools, and field tests, and adjusted during model calibration. This study focused on the pond area and the retrofitted ‘School Pond’ infiltration swale. The swale was modelled in PCSWMM as a ‘Rain Garden’ LID. Both the real and modelled swale had both a surface layer and an unsaturated soil layer with fluctuating saturation due to seasonal water table changes (Figure 5). Water infiltrates the soil layer from the surface before percolating into the aquifer. The soil parameters were derived from the literature and laboratory studies conducted with both this and associated studies, such as Jones (2019) [45] and Mavundla (2022) [46]. PCSWMM was used to conduct moisture balance calculations for each layer, tracking water movement and storage. The lateral movement of water was simulated by creating an outlet node in the aquifer object. The calibrated transfer rate modelled the lateral groundwater flow.
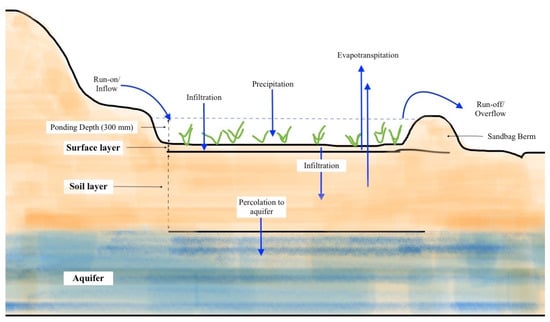
Figure 5.
Conceptualised ‘School Pond’ surface-subsurface processes.
3.4. Model Input Parameters
3.4.1. Rainfall
Three rainfall datasets were used: one for model calibration and validation, another for continuous simulation spanning 17 years, and a third to assess the impacts of climate change on managed aquifer recharge. Data from an on-site weather station aided calibration, while a station 3.6 km away from the pond (Wolfgat station) provided continuous simulation data. Rainfall data from both stations were processed as time-series files. Two climate change models from the 26 available models were chosen to evaluate their impact on MAR in the retrofitted pond. The Hadley Global Environment Model 2 climate change RCP8.5 (HadGEM2-CC-rcp85) and the Institute of Numerical Climate Model version 4 RCP4.5 (inmcm4-rcp45) were chosen for this study as they represented the wettest and driest scenarios observed at the Cape Town Airport station [10]. The climate change rainfall data were disaggregated into 15-min intervals using NetSTORM software (version 2022.02) employing paired stochastic rainfall disaggregation methods.
3.4.2. Stormwater Network
The road and stormwater for the Rondevlei Park neighborhood were obtained from the as-built drawings. Drawings containing pipe diameters, slopes, invert levels, catch pit locations, and inlet and outlet positions in the pond were digitized using PCSWMM.
3.4.3. Catchment Characteristics
Sub-catchments were classified by land use and assigned properties from the literature and desktop studies. Imperviousness percentages were calculated using high-resolution satellite imagery from Google Earth Pro (version 7.1) and Sentinel 2A data. Manning’s roughness coefficients and depression storage depths were obtained from the literature [25,47].
3.4.4. Infiltration Parameters
The study defined infiltration parameters using empirical and experimental methods for hydraulic modelling. The SCS curve method was used for built-up areas, and the Horton infiltration model was used for undeveloped areas, including the pond [48]. The Horton parameters were derived from double-ring infiltration tests [45]. The infiltration parameters are important calibration parameters.
3.4.5. Evapotranspiration
Evapotranspiration (ETo) is essential in surface modelling, as it can significantly affect the volume of water lost to the atmosphere. Several empirical ETo models exist, but the Hargreaves method is mainly used in data-scarce regions because it requires minimal data to estimate ETo [49]. This study thus used the Hargreaves method to derive hourly evapotranspiration values using the best publicly available extra-terrestrial radiation dataset and historical temperature data.
3.4.6. LID Control Parameters
This study modelled the retrofitted infiltration swale as a SuDS, evaluating various SuDS processes, including infiltration, storage, and percolation. The swale was modelled as an infiltration trench comprising surface and soil layers. The surface and soil layer parameters are listed in Table 1 and Table 2, respectively. Soil samples were collected from the pond during the installation of the monitoring wells. The soil layer thickness (vadose zone) was determined from the borehole logs (monitoring well logs). The soil samples were used to determine the porosity of the soil layers by calculating the void volume ratio and total volume using standard soil property equations from soil mechanics and geology [50].

Table 1.
Surface layer parameters.
Table 2.
Soil layer parameters.
3.4.7. Aquifer Attributes
The SWMM computational engine includes subsurface elements, such as groundwater-surface interaction, bank storage, and a threshold-saturated water zone. Subsurface representation involves an unsaturated upper zone (UZ) and a lower saturated zone (LZ). The water table fluctuates within the UZ and LZ, which receive vertical inflow from pervious sub-catchments and lose moisture via evapotranspiration. The percolation equation governs the flow from UZ to LZ. Lateral groundwater flow is modelled using equations like the linear reservoir, Dupuit–Forchheimer, or Hooghoudt [51]. However, the two-zone model in SWMM has limitations, particularly in simulating groundwater mounding and lateral flows between aquifers beneath multiple sub-catchments. Specifically, these limitations include (1) that it is a simplistic representation comprising one saturated and unsaturated zone and does not allow for multi-layered aquifer systems modelling; (2) Water is assumed uniformly spread across the entire catchment area (the water table responds uniformly under pervious and impervious areas), which means groundwater mounding under infiltration areas cannot be simulated; (3) the capillary fringe of the saturated zone cannot move upwards by either diffusion or capillary action. (4) Lateral groundwater flows between aquifer systems that underlie several sub-catchments cannot be simply simulated and require modifying the model structure. Despite these limitations, it is possible to route infiltration from sub-catchments to an aquifer modelled as a ‘tank’ and then use the Dupuit-Forchheimer equation to model lateral groundwater flow to a channel or node. The Dupuit-Forchheimer parameters influencing aquifer response can be calibrated using observed data to develop a more realistic long-term groundwater response [14]. This approach was employed in this study.
3.5. Model Calibration and Validation
Model calibration involves adjusting parameters to align the simulated outputs with observed ones to account for model structure uncertainties and minimise errors. It aims to maintain various objective functions within acceptable limits, typically 25% accuracy, although some models demand tighter tolerances and aim for less than 10%. The recommended range for wet weather flow is ±10% of volume and ±15% of the flow peak. Calibration requires at least three significant events [22]. Evaluation criteria typically include flow volume between −10% and +20%, peak flow between −15% and +25%, and similar shapes of hydrographs.
Short-term time series data can provide credible calibration if accurately measured, while long-term data, such as precipitation, aid validation and inference. Input parameter estimation and optimisation involves statistical analysis of observed and modelled data using methods like maximum likelihood or sum of squares. PCSWMM calibrates various parameters, including runoff, pollutant wash-off, groundwater flow, elevation, node depth, inflow, flooding, water quality, and flow rate [51]. Sensitivity analysis identifies uncertain parameters requiring adjustment to fit simulated data to observed data and assesses the extent and impact of different adjustment levels. Calibration quality is assessed using objective functions (OF) like Integral Square Error (ISE) (1) and Nash–Sutcliffe Efficiency (NSE) [22]. Table 3 displays the ranges and interpretations of the two commonly used objective functions.
Table 3.
ISE and NSE ranges for model calibration and validation [52,53].
3.5.1. Surface Model Calibration
A portable area-velocity flow meter (AVFM) was used to measure the inflow from one of the inlets to the pond during rainfall events. The choice of a portable meter aimed to reduce the risk of instrumentation theft, although on-site robbery or hijacking remained a potential concern. The risk of robbery was mitigated by the presence of a neighbourhood watch, which conducted regular patrols during flow-logging events. The AVFM contained a submersible ultrasonic sensor that measures flowing water’s velocity and depth (level) in an open channel or pipe. This information is relayed to a programmable battery-powered data logger box that computes and records the water profile area given the pipe diameter and, consequently, the flow rate. Flow readings are stored in a data logger. The AVFM has an accuracy of ±0.25% of the reading and can measure flows with a range of 0.1 to 6.2 m/s. It was used in conjunction with a weather site (www.windy.com accessed from 1 January 2020) that gave advance warning of incoming storms. Four storm events, each lasting at least three hours, were recorded with flow rates measured at one-minute intervals. Three of these events were used for calibration, while the fourth was reserved for validation (Table 4).
Table 4.
Selected storms for calibration and validation.
A subsequent sensitivity analysis using the SRTC tool evaluated parameters influencing pond inflow, identifying 15 as most sensitive (Figure 6). These parameters were then optimised based on data derived from the AVFM’s flow rate measurements.
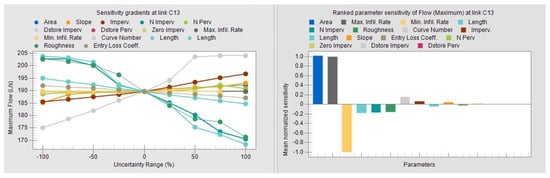
Figure 6.
Sensitivity gradients for parameters influencing inflow.
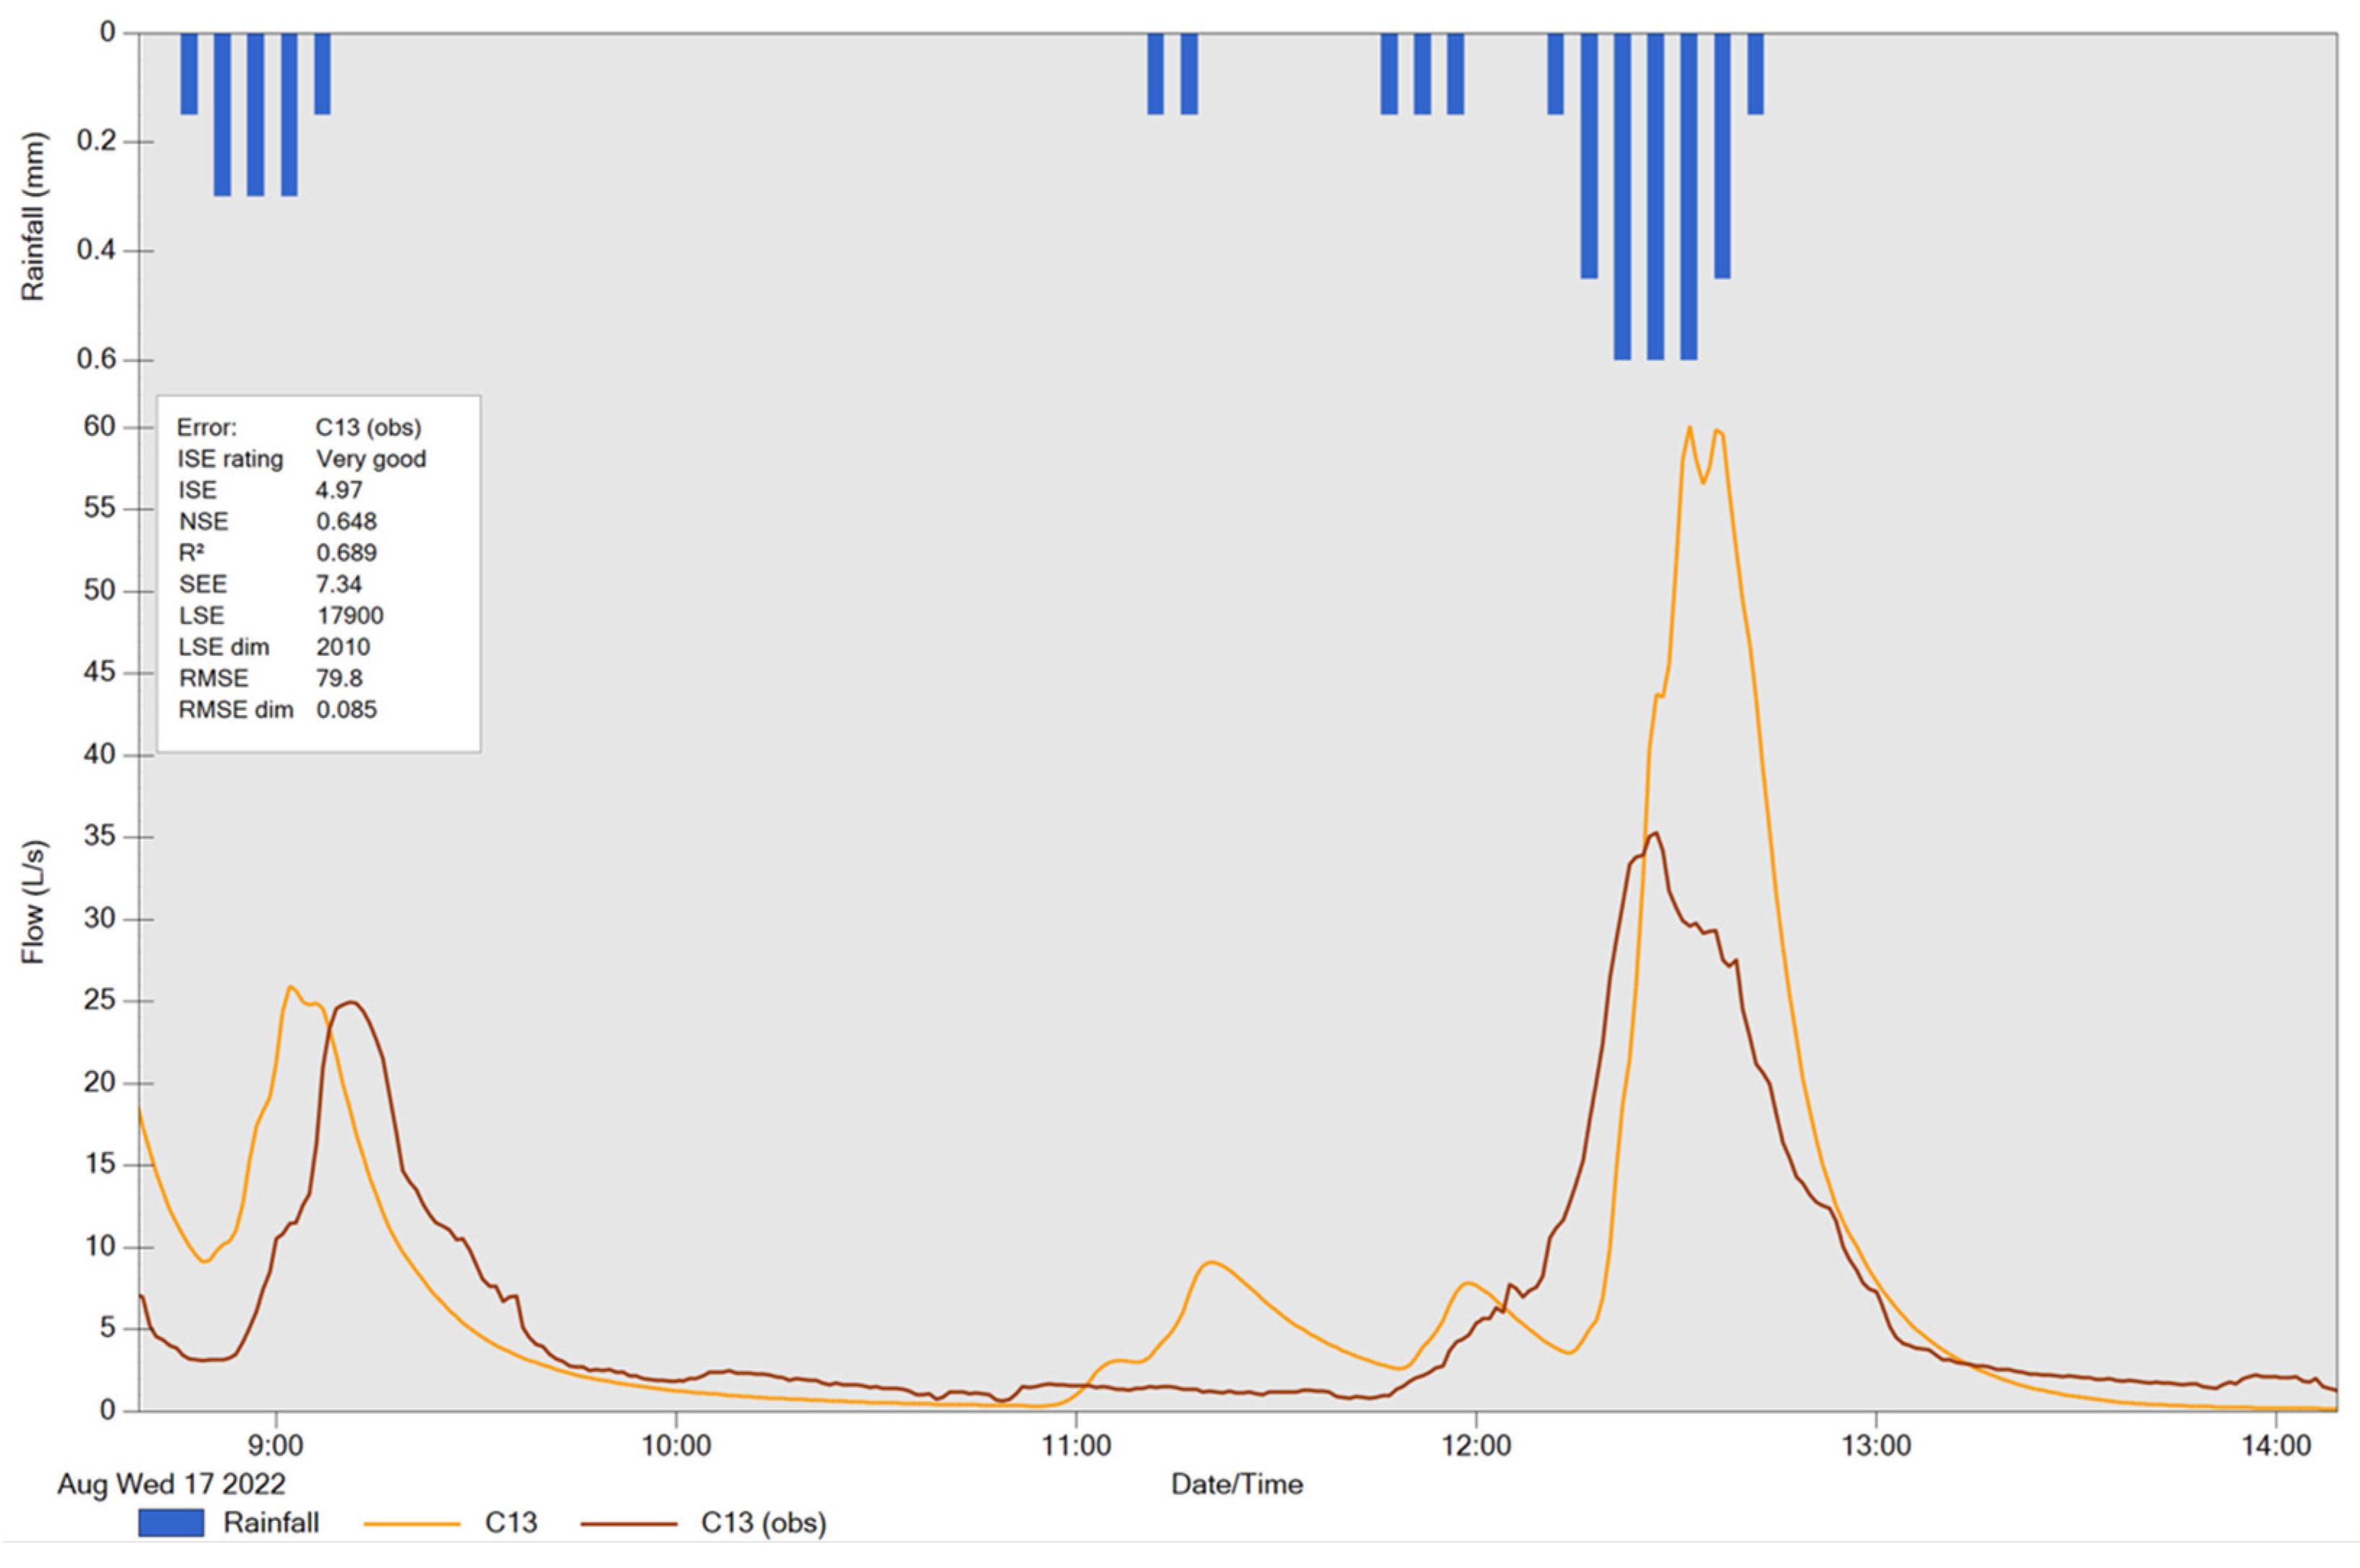
Manual calibration of model parameters ensued, focusing on achieving the best fit for simulated hydrograph shape, peak flow rates, and peak time. Integral Square Error (ISE) and Nash–Sutcliffe Efficiency (NSE) served as calibration objective functions (OF). While the simulated hydrograph closely resembled the observed one (Figure 7), a five-minute phase discrepancy was observed, attributed to a partially blocked stormwater pipe affecting pond inflow.
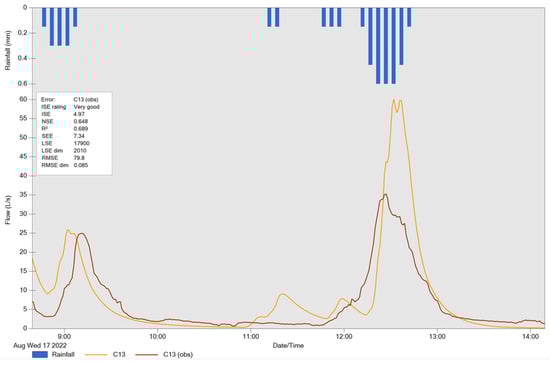
Figure 7.
Event used for model validation.
Validation indicated satisfactory performance based on NSE and ISE. Despite a 41% higher simulated peak flow compared to the observation, falling beyond the recommended ranges, it was considered acceptable given the model’s primary objective of estimating volumes rather than peak flows. This deviation aligns with the findings by Randall et al. (2019) [28]. Table 5 summarises objective function values and interpretations for calibration and validation exercises, consolidating the surface model’s refinement process outcomes.
Table 5.
Summary of the surface model calibration results.
3.5.2. Subsurface Model Calibration
The calibration of the subsurface model in this study was crucial due to its significant impact on stormwater infiltration rates and volumes within a retrofitted pond. Groundwater calibration utilised data from monitoring wells within the pond, collecting monthly readings in summer and fortnightly in winter, spanning 203 days from 13 October 2021 to 4 May 2022. A sensitivity analysis of 34 parameters using the SRTC tool, with four sensitivity points, resulted in 136 model runs, identifying lower evaporation depth as the most influential parameter on mean groundwater level.
Parameter optimisation was aimed at attaining a realistic groundwater profile using NSE as the objective function. However, adjusting certain parameters yielded unrealistic outcomes, such as water table levels exceeding the swale surface elevation and improbable values, such as field capacity surpassing soil porosity. Adjusting the B1 coefficient, a component of the Dupuit-Forchheimer equation that influences the rate of lateral groundwater flow, to achieve a desirable positive NSE value resulted in dimensionally heterogeneous values. Hence, a dimensionally homogenous Dupuit-Forchheimer approximation for lateral groundwater flow was adopted, with B1 maintained at a value of 2.
Trade-offs were made during iterative parameter fine-tuning to balance profile shape, realistic aquifer parameter values, and NSE and ISE values. Validation of the groundwater model was hindered by a lack of usable data owing to Cape Mole Rats (Bathyergus suillus) digging tunnels under the berm that drained the swale and thus upset the experiment until such time as the PVC barrier could be extended deeper than the rats were prepared to dig. Meantime, concerns that the observed water level in the groundwater monitoring well might not reflect infiltration in the swale meant that some data could not be used for model validation.
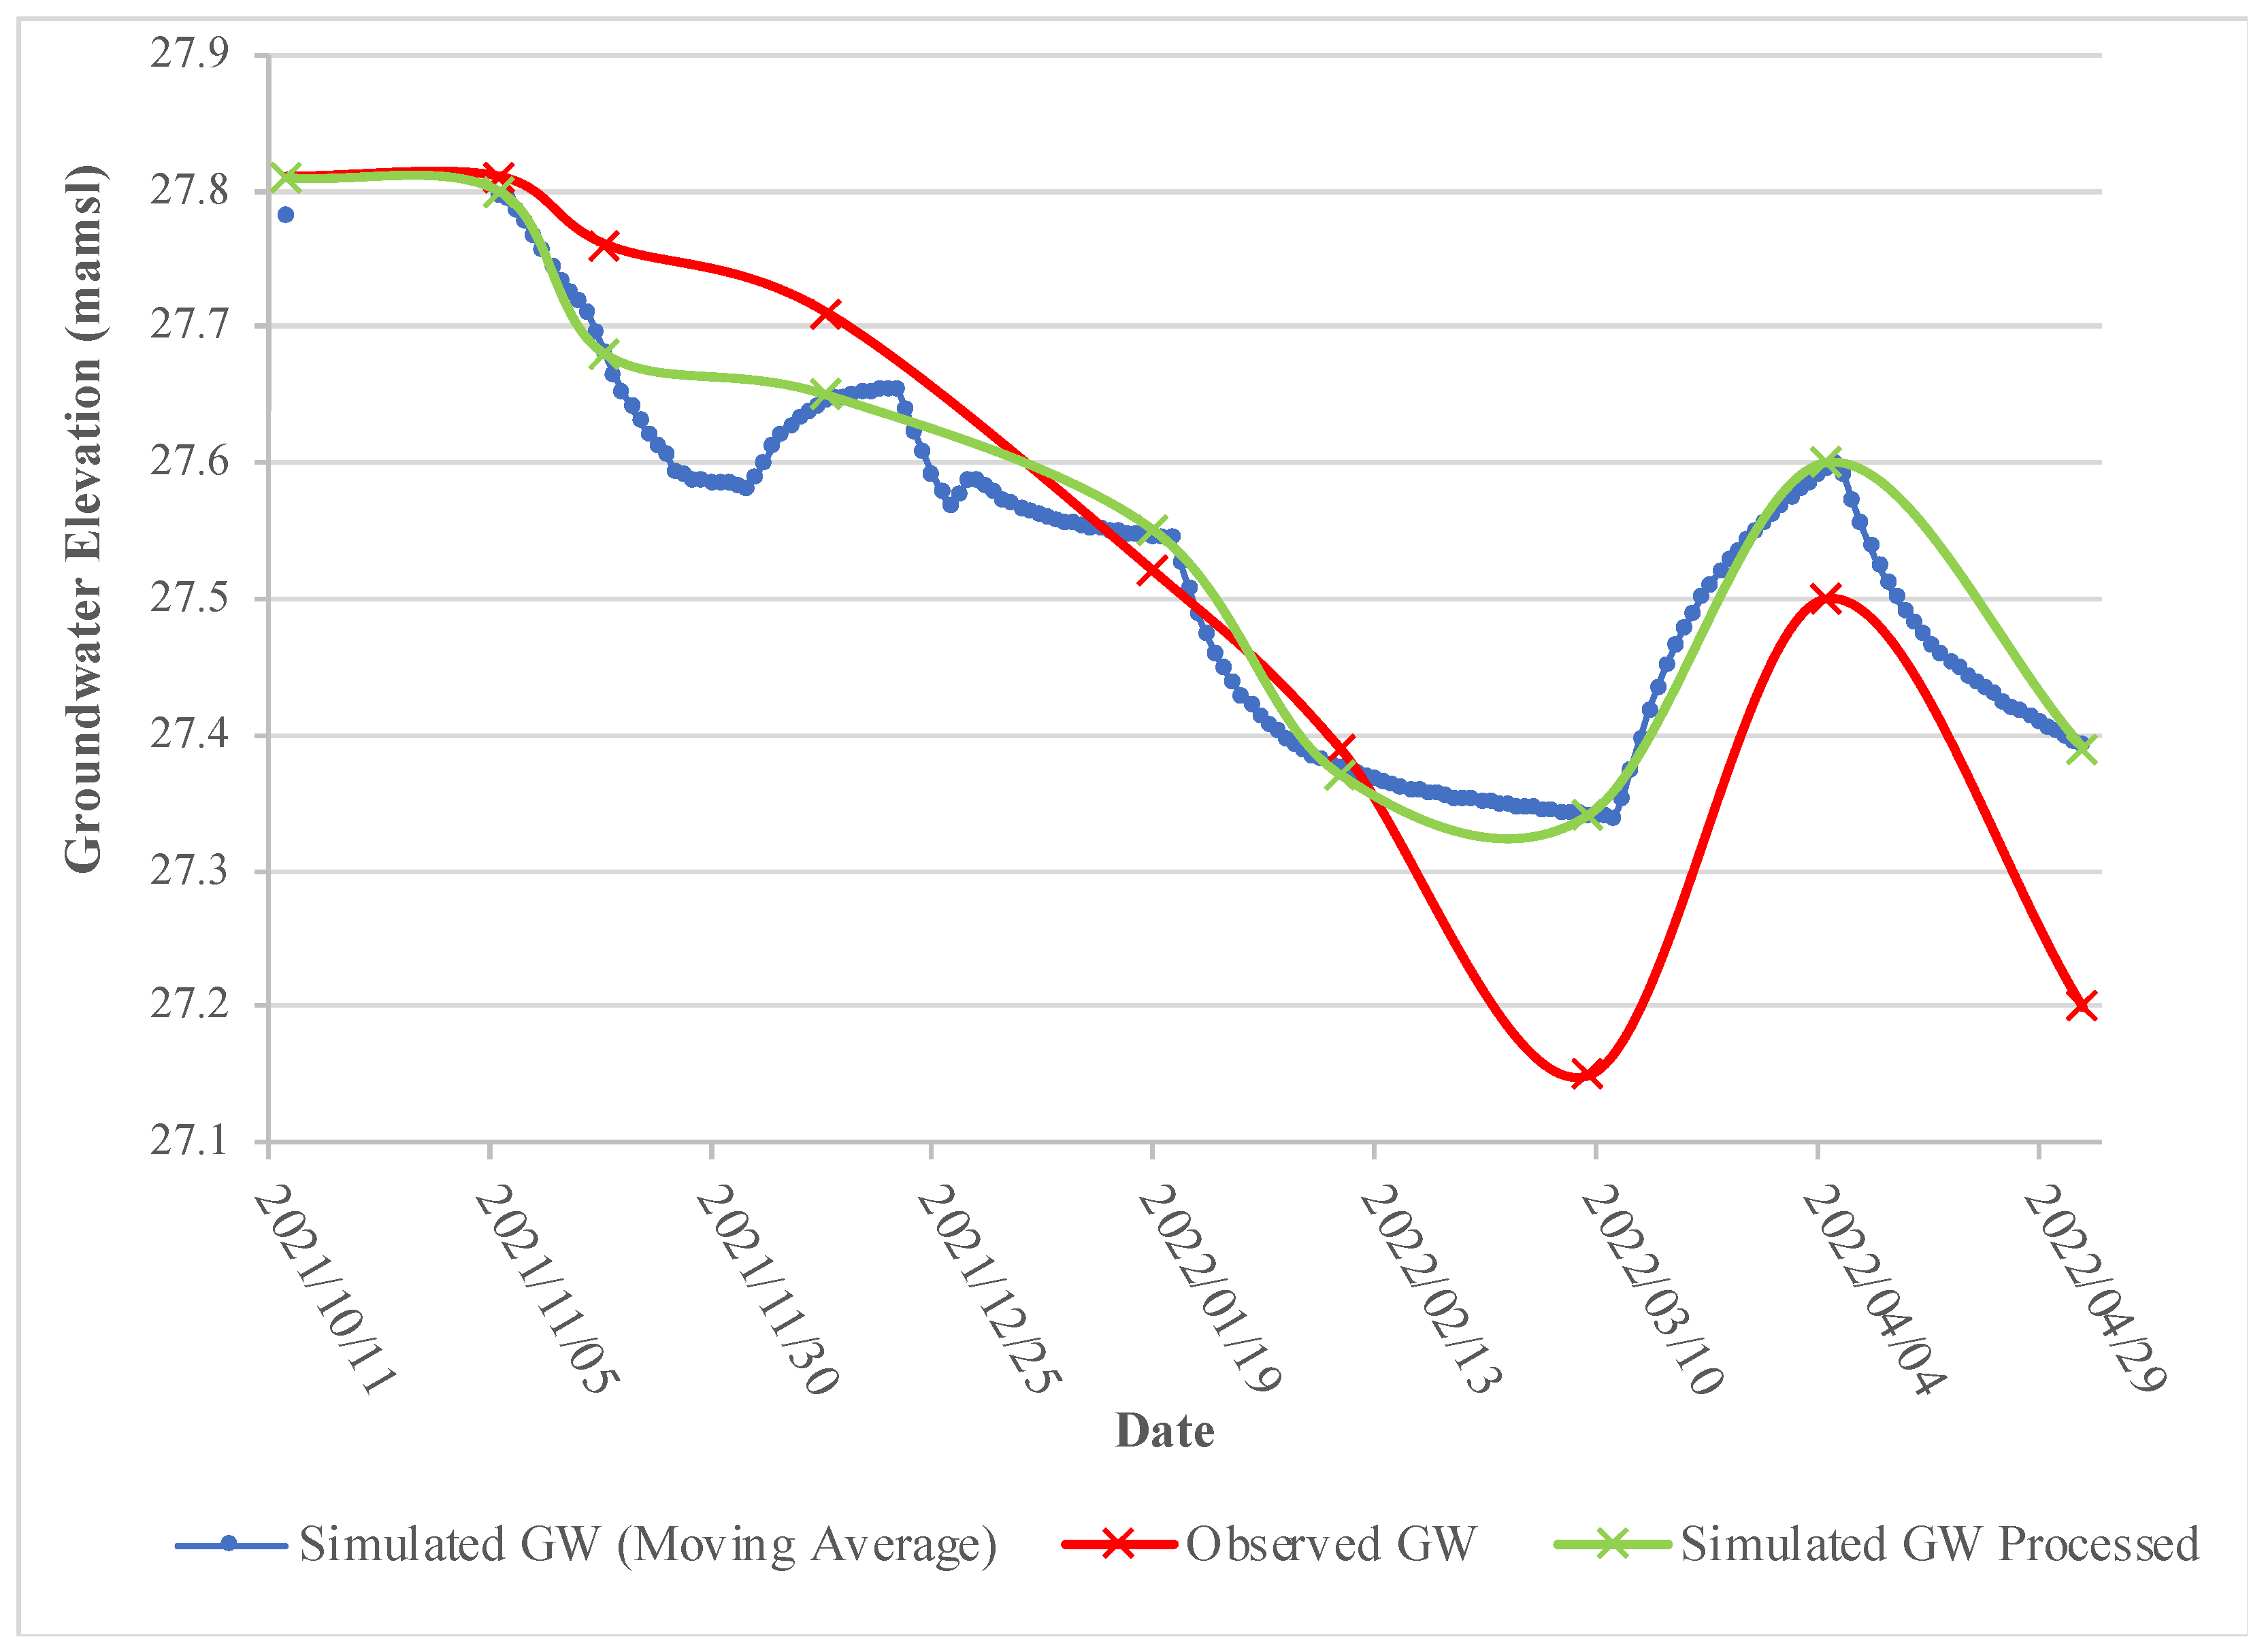
PCSWMM uses instantaneous data points (at 15-min intervals) to calculate NSE and ISE values, which presents a challenge when comparing continuous simulated data to observed monthly data points. Thus, the simulated groundwater levels were exported to Microsoft Excel 2022, and the simulated data’s moving averages (mean) were computed. This process resulted in a closer match between the computed and observed data, leading to higher NSE and ISE values compared to those derived directly from the PCSWMM software (Figure 8, Table 6).
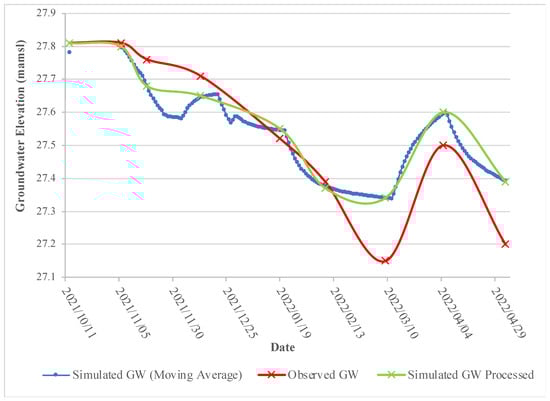
Figure 8.
Groundwater elevation curves with processed observed data.
Table 6.
Summary of groundwater calibration using processed data.
The ISE ratings were excellent in both observed and simulated groundwater elevation graphs, with NSE ratings ranging from good to excellent, depending on data processing methods. The mean difference between observed and simulated water tables was minimal at 0.04 m, suggesting reasonable confidence in utilising the model for long-term groundwater simulations. Despite challenges, the model demonstrated adequacy for predicting groundwater dynamics over extended periods.
3.5.3. MAR Volumes
For all scenarios, the infiltrated volume in the detention pond—considered the volume contributing to MAR—was calculated using the water balance presented in Equation (1).
where INFgw is the infiltration to groundwater, Iv is the inflow volume into the pond from the two inlets, Rv is the runoff volume resulting from rainfall falling over the pond area, Ov is the resulting outflow that drains to the existing stormwater network, and Evapsurface is the evaporation from the pond surface mainly evaporation from depression storage and ponded water. The stored groundwater volume (MAR) is then derived from Equation (2).
where, Evapgw is evaporation from the upper and lower saturated aquifer zones via evapotranspiration, and GWseepage is groundwater seepage defined as percolation into the deep aquifer [51].
3.6. Model Scenarios
The retrofitted pond’s performance was analysed under six scenarios to determine infiltrated stormwater (MAR) volume using water balance. Scenarios 1 and 2 assessed the pre- and post-retrofit (Figure 9) long-term swale performance and recharge volumes spanning 17 years (2005–2022).
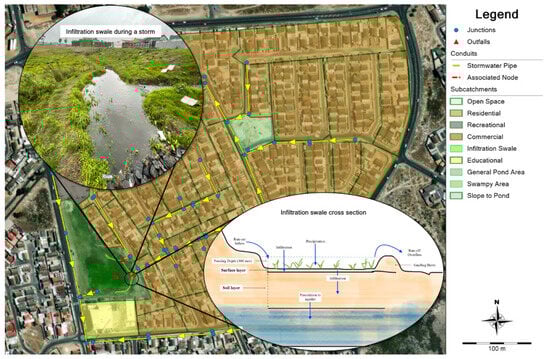
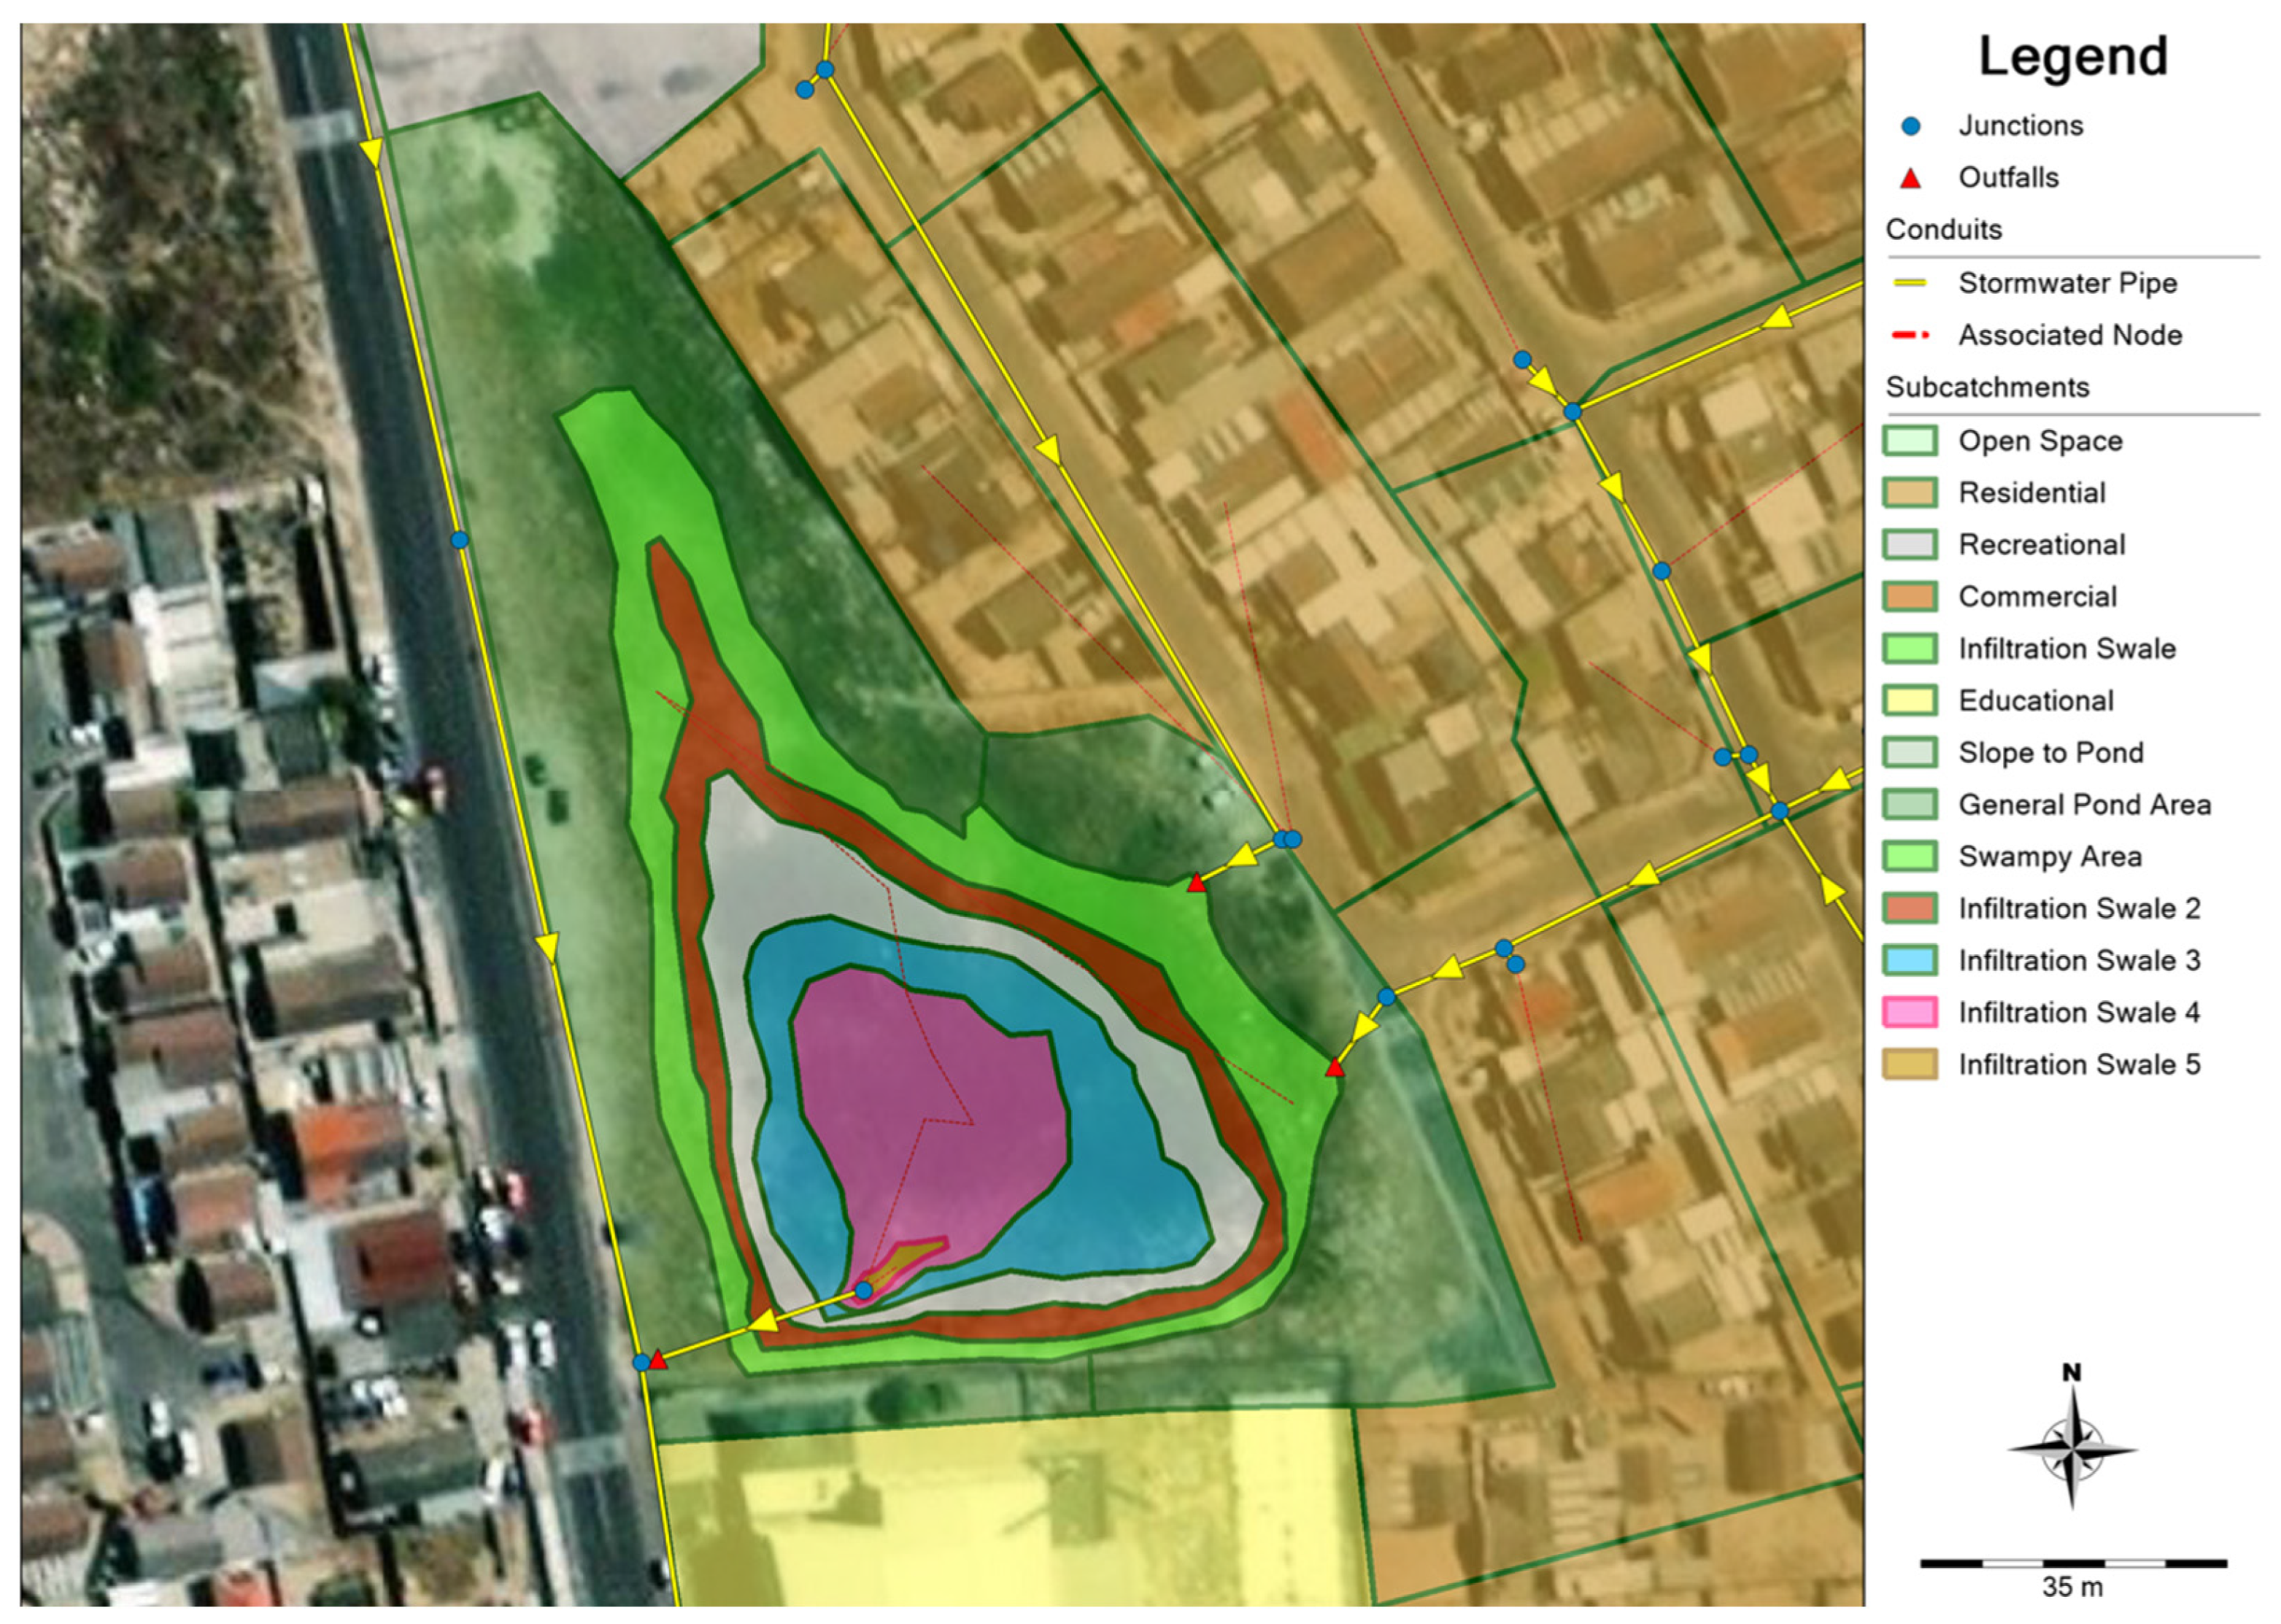
Figure 9.
Post-retrofit model structure (arrows denote direction of stormwater flow).
Scenario 3 investigated potential MAR if the City of Cape Town implemented its planned abstraction and MAR from the CFA [7,54], anticipating a 2.5 m decline in the School Pond’s water table and potentially enhancing infiltration volume. Scenario 4 examined a larger infiltration area amidst lowered water tables (Figure 10). Scenarios 5 and 6 assessed climate change impact on MAR, employing HadGEM2-CC-rcp85 and inmcm4-rcp45 models representing the wettest and driest scenarios from 2084 to 2100.
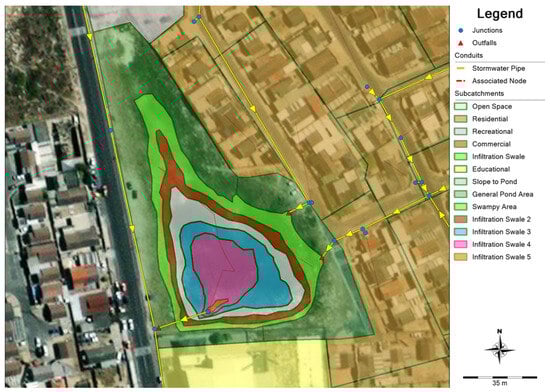
Figure 10.
Extended LID area model structure (arrows denote direction of stormwater flow).
4. Results
4.1. Scenarios 1–4
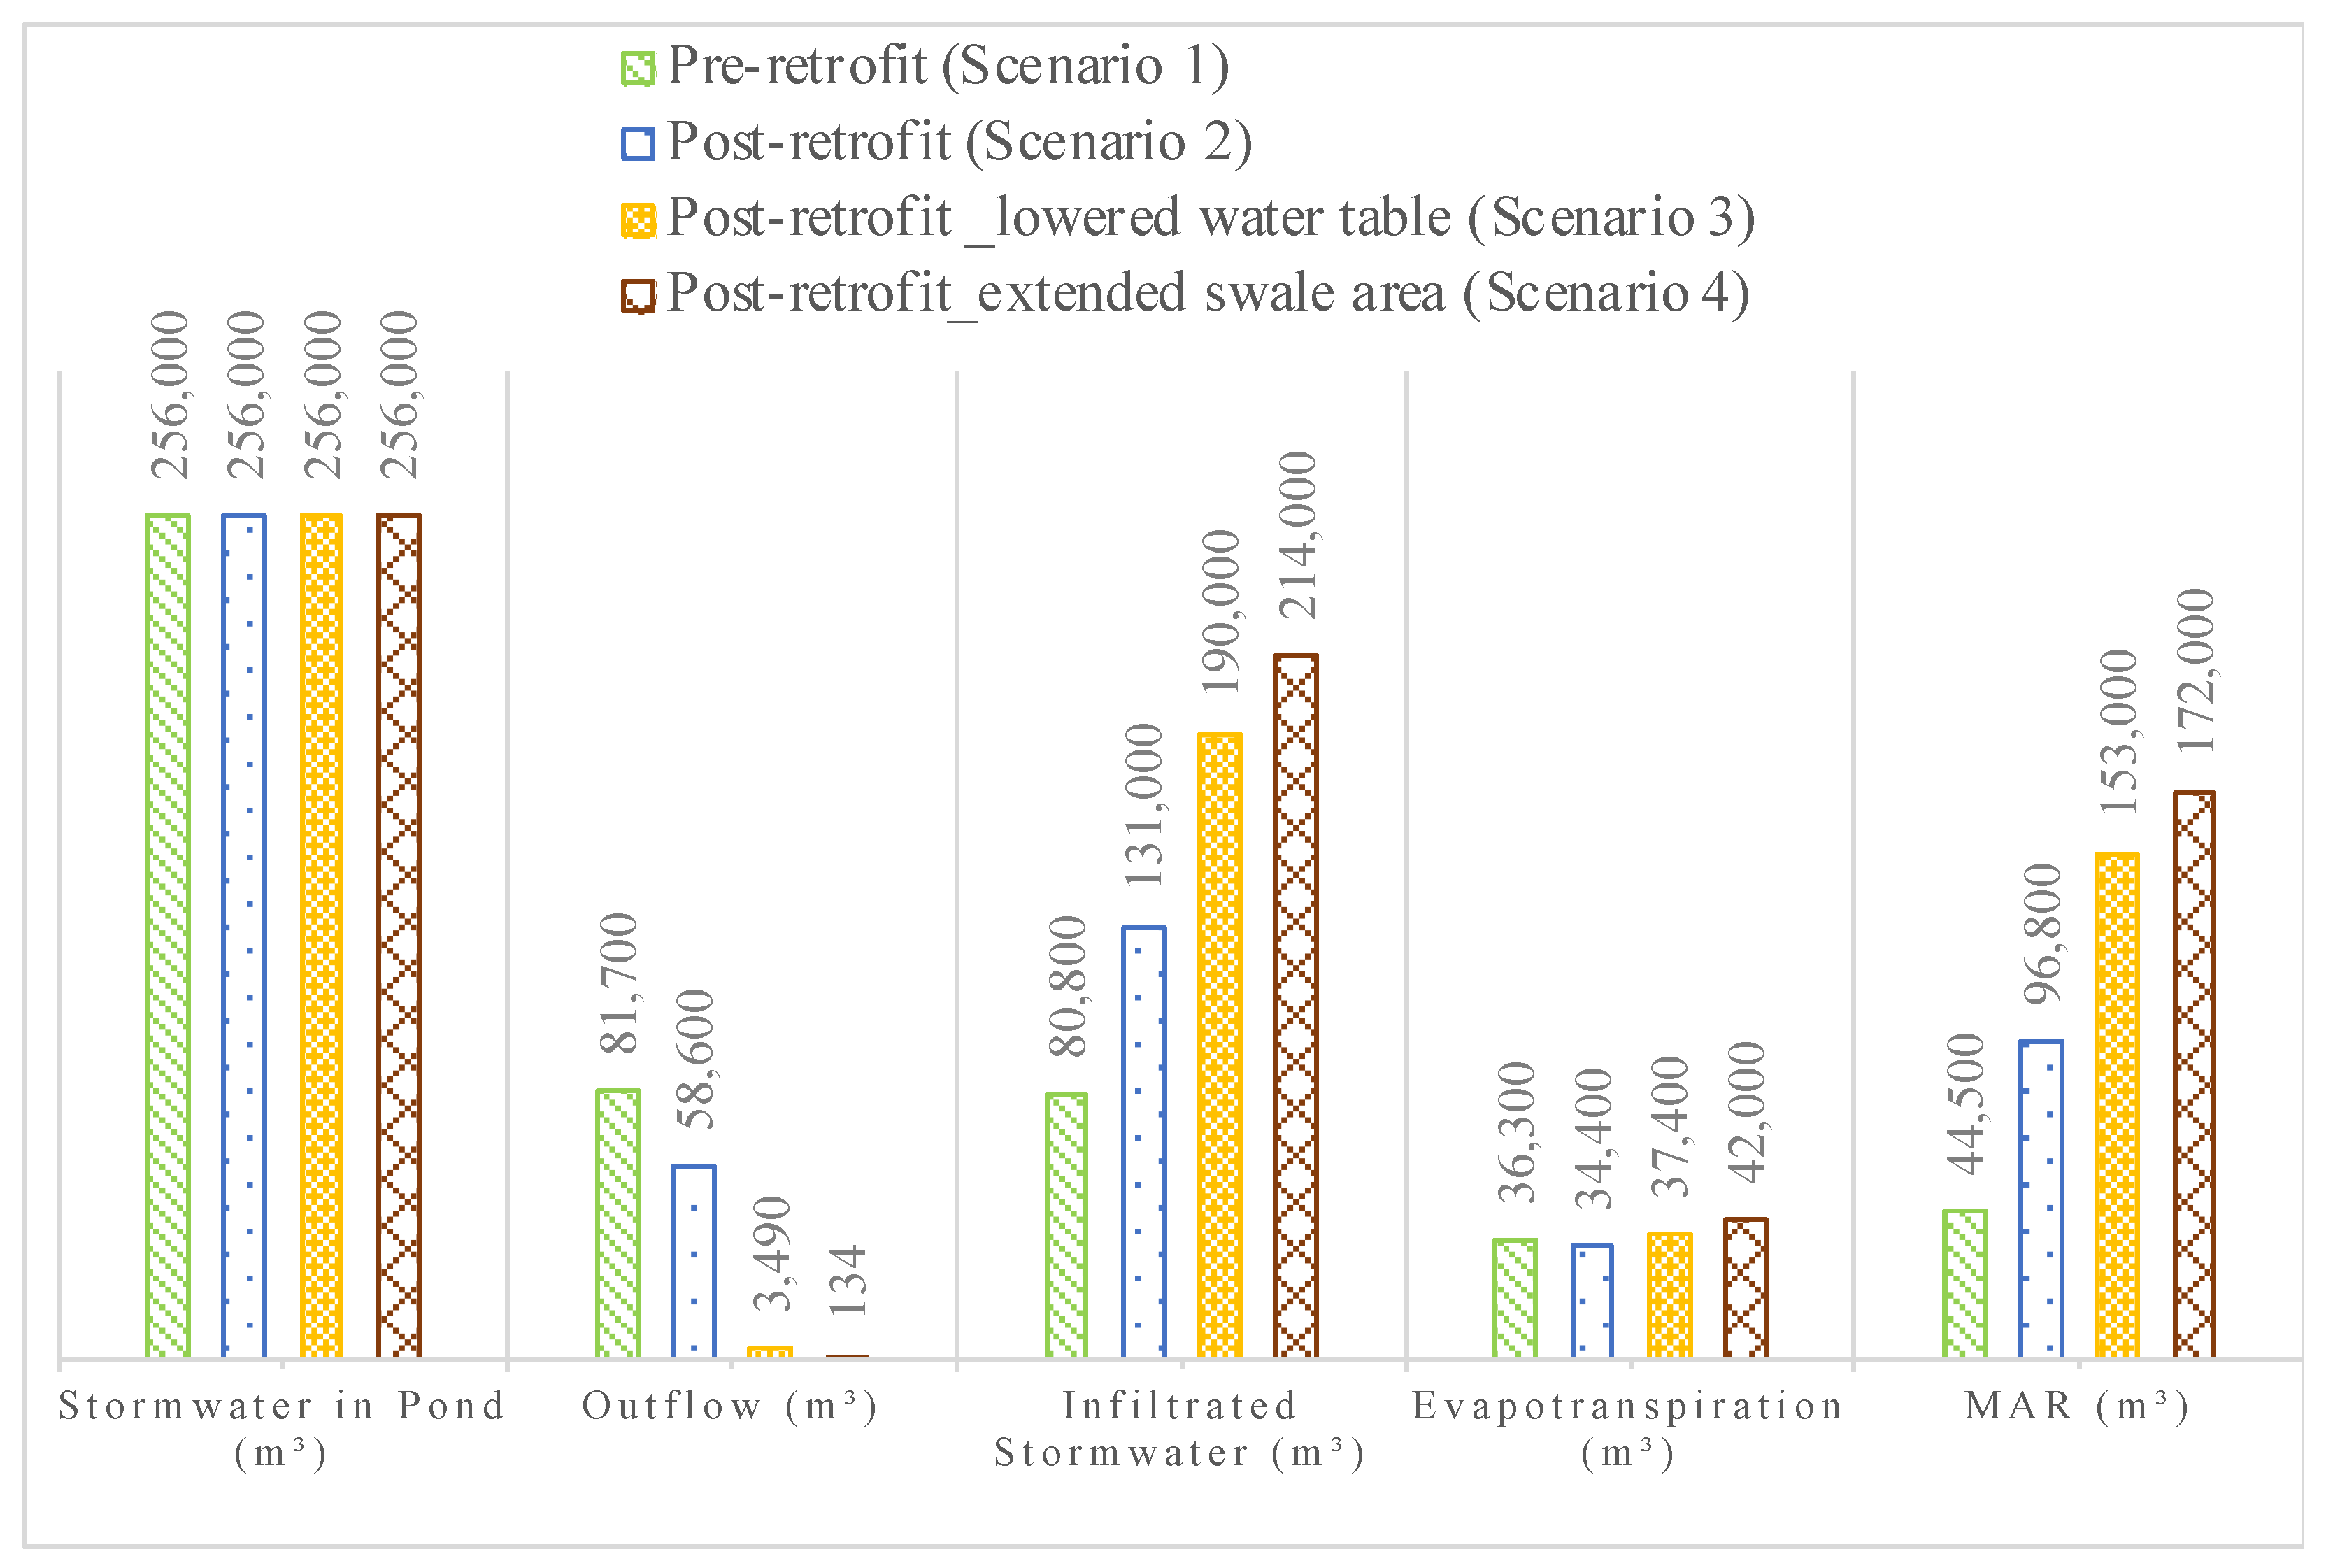
A 17-year continuous simulation assessed the infiltration swale’s performance under varying hydrological conditions. The two inlets and direct precipitation onto the pond contributed an estimated total stormwater volume of 256,000 m3 (256 ML) in Scenarios 1 to 4. The School Pond’s infiltration potential was an estimated 17% of the stormwater inflow pre-retrofit. In Scenario 1, 45% of infiltrated water was lost through evapotranspiration, a trend consistent across scenarios (Figure 11). This percentage increased in scenarios with a lower water table due to increased water availability for evapotranspiration.

Figure 11.
Water balance for Scenarios 1 to 4.
The post-retrofit scenario demonstrated that the swale should capture a greater fraction of infiltrated stormwater compared with the pre-retrofit scenario. The swale’s higher permeability compared to the general pond and swampy areas allows more water to be directly stored in the CFA, thereby reducing the amount of water available for evapotranspiration. The total recharge was increased by 118% or 52,300 m3 with the retrofit introduction, albeit with a higher water table. Lowering the water table by 2.5 m increased the potential recharge by 244%, an additional 108,500 m3. Enlarging the swale area further boosted the recharge by 286% compared to pre-retrofit.
The simulation results from the four scenarios demonstrated that the retrofit significantly increased recharge by detaining and infiltrating water that would otherwise be lost to the stormwater network (Table 7).
Table 7.
Results for Scenarios 1–4.
4.2. Scenarios 5–6
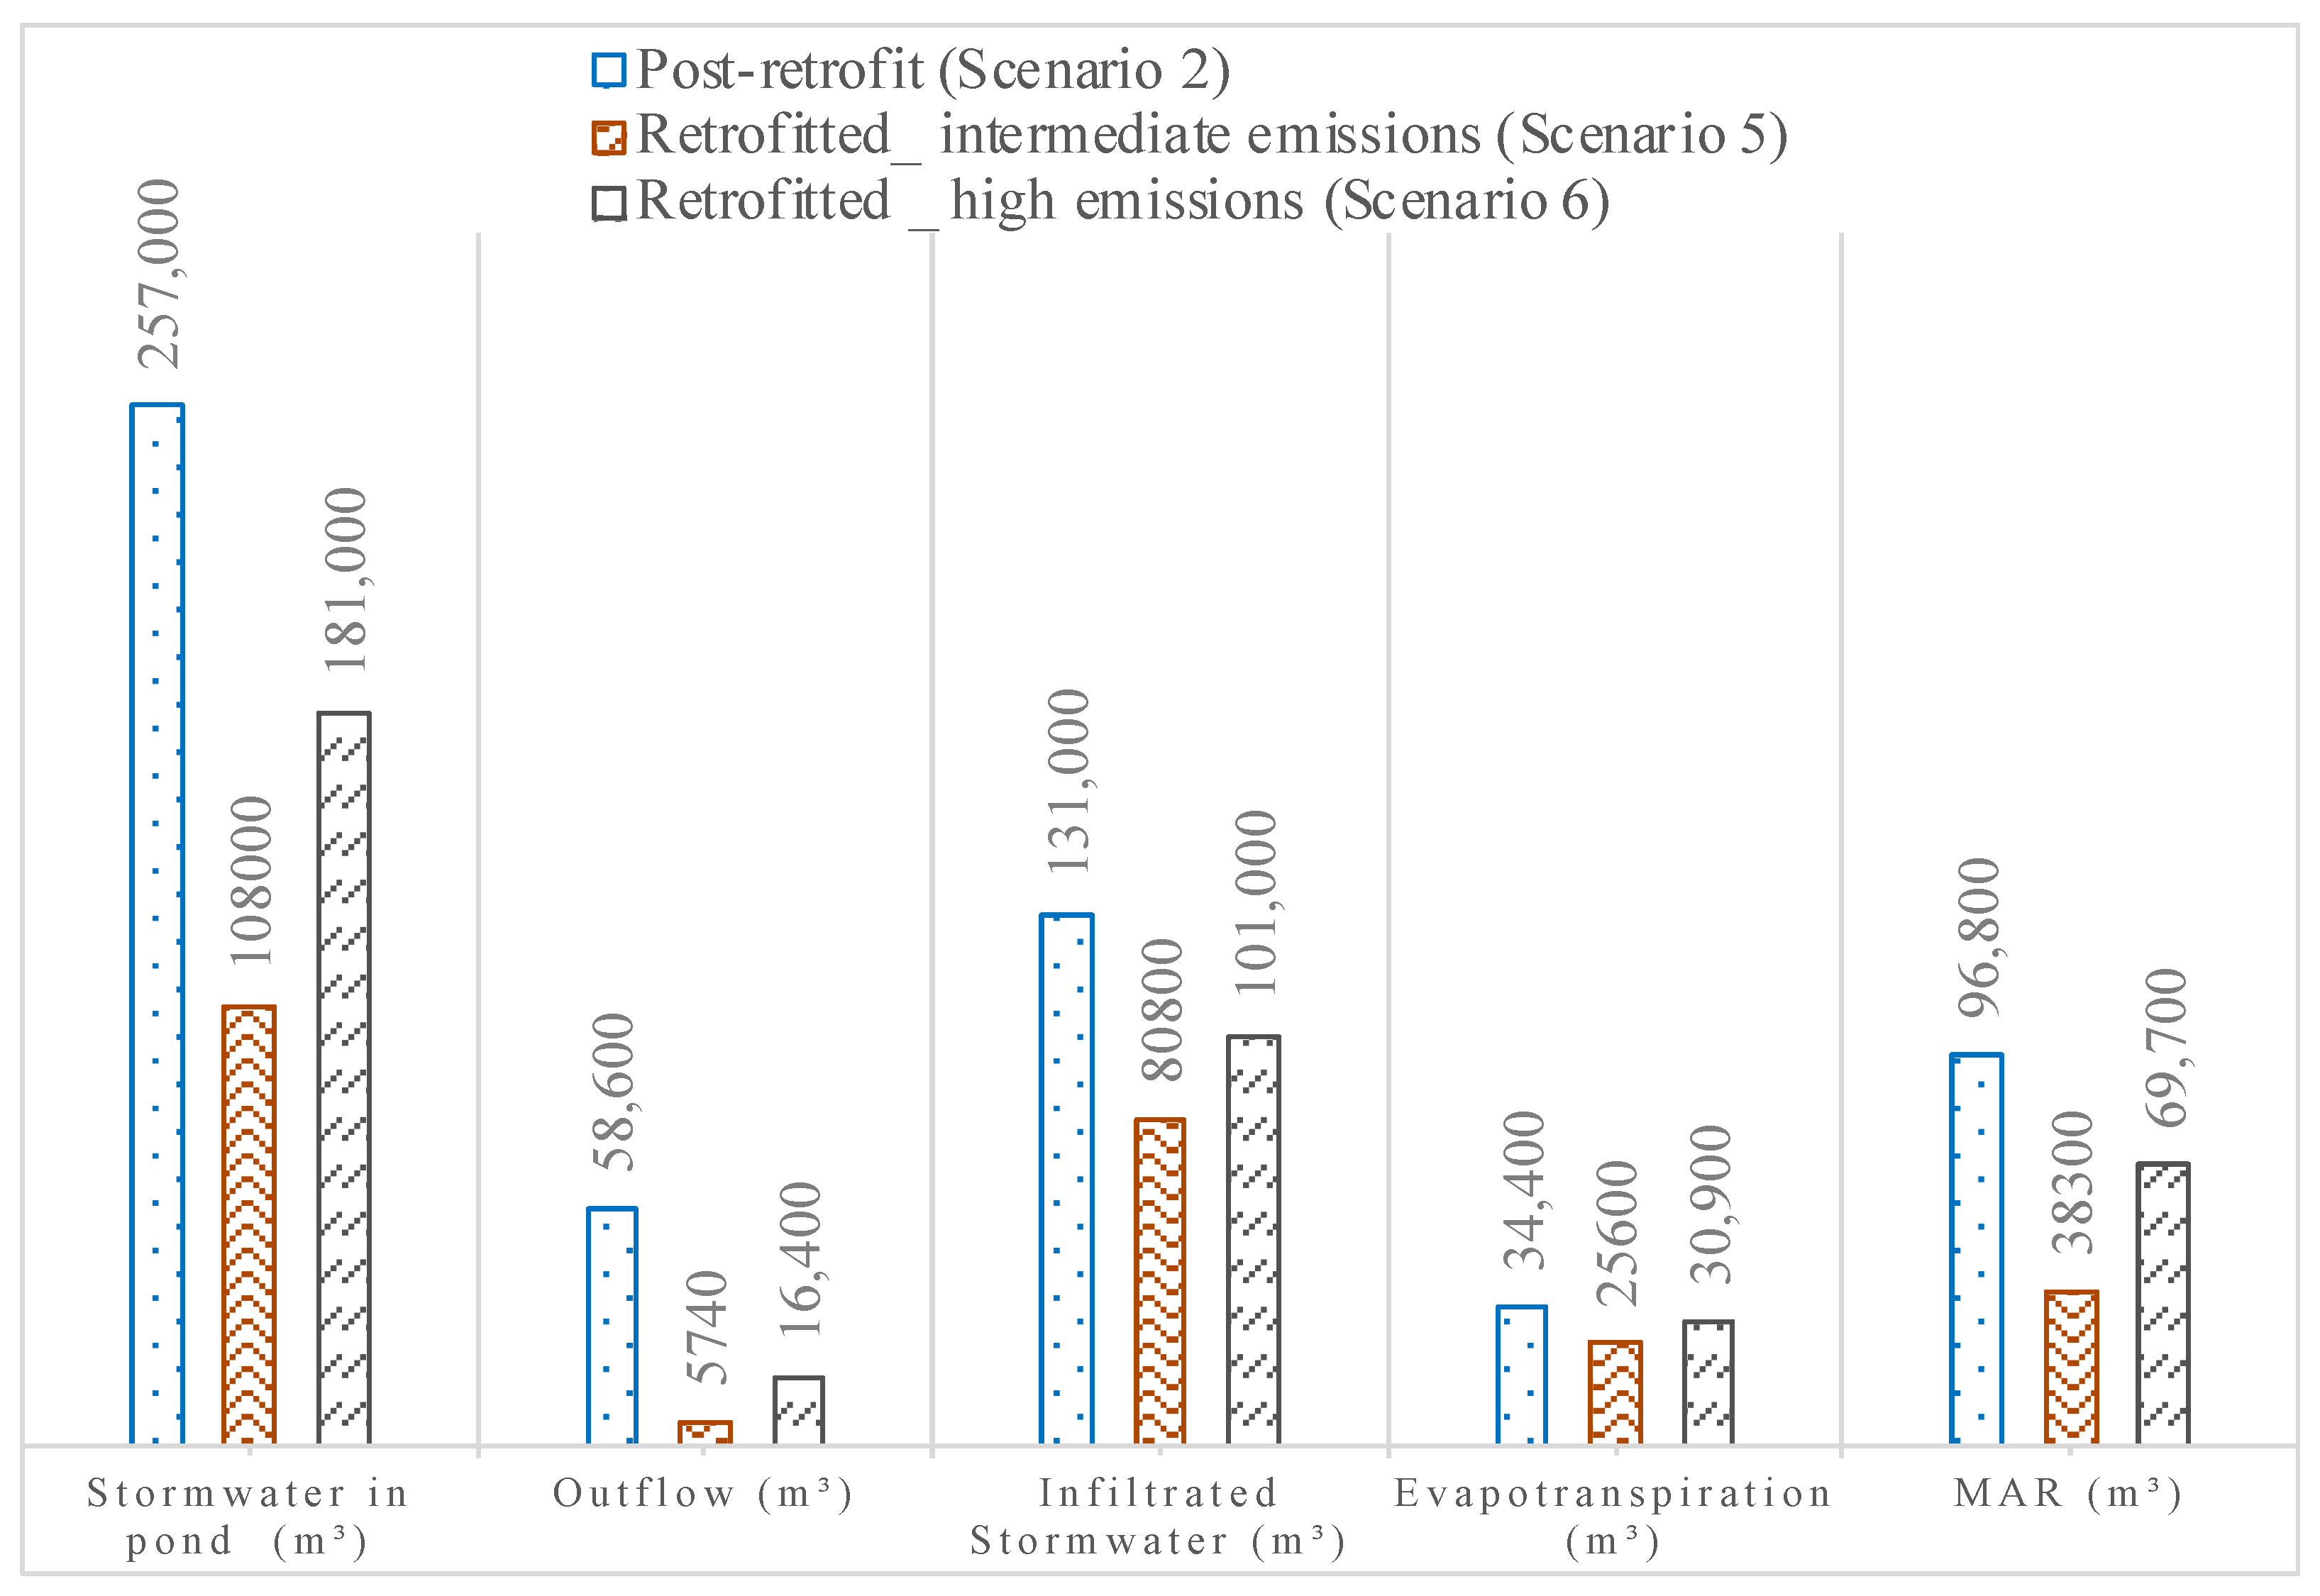
Two climate change scenarios, intermediate and high emissions pathways, were simulated using continuous rainfall data to assess the infiltration swale’s performance in managing stormwater. Scenario 2, based on historical data from the past 17 years, served as the baseline. The total rainfall projections for Cape Town from 2084 to 2100 were 5284 mm and 8023 mm for the intermediate and high emissions scenarios, respectively. Stormwater infiltration decreases with declining rainfall. During drier years, the retrofitted basin will capture a greater proportion of water leading to reduced outflow (Figure 12). For example, Scenarios 5 and 6 indicated only 5% and 9% loss of stormwater as outflow, respectively, compared with 23% for Scenario 2, with a higher total rainfall. Dry spells also allow for more substantial water table recovery, enhancing infiltration but also resulting in increased evapotranspiration (Table 8). Over 17 years, the MAR volumes for Scenarios 5 and 6 would likely contribute around 4% and 8% of the City of Cape Town’s peak daily demand in the summer of 2022 [55].
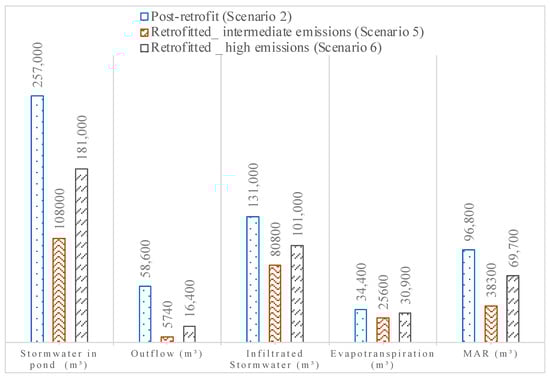
Figure 12.
Water balance for Scenarios 2, 5 and 6.
Table 8.
Results for Scenarios 2, 5 and 6.
5. Discussion
5.1. Impact of Pond Retrofits on MAR
The modelling results showed a significant 118% increase in infiltration with the introduction of retrofitting (Scenario 1 vs. Scenario 2), validating the hydraulic benefits of retrofitting in Cape Town’s detention ponds. Retrofitting enhances infiltration by retaining and infiltrating water, thus preventing its loss to the stormwater network. However, the high winter water tables in the CFA may restrict MAR, as Seyler et al. (2016) [56] and Mauck (2017) [42] noted. Encouragingly, planned groundwater abstraction in the CFA can augment MAR volume and aquifer replenishment. This is validated by the sensitivity analysis, which indicated the significance of CFA characteristics in shaping groundwater response, except for the SuDS soil thickness. Lowering the water table creates opportunities for expanding the swale area, leading to a substantial 290% increase in infiltration volumes compared to pre-retrofit scenarios. While individual pond contributions to CoCT’s daily demand are modest, they emphasize the potential of pond retrofitting for MAR. Comparable benefits may be achievable in other ponds with similar CFA characteristics, even when approaching the upper limits of allowable vadose depths. Thus, further investigation is recommended to explore the ramifications of such retrofits in broader catchment areas.
5.2. Impact of Climate Change on SWH via MAR
The study highlighted the significant impact of climate change on rainfall and the consequent stormwater volume received at the pond. Both climate change scenarios indicated a reduction in MAR, with the high emissions scenario showing greater MAR due to increased rainfall. Climate change will also escalate evapotranspiration rates as summers (and winters) become hotter and drier. The higher evapotranspiration rates from the retrofitted pond could positively contribute to urban cooling and mitigate the heat island effects through evaporative cooling—a process in which evaporated water absorbs heat from the surrounding air and surfaces—see Coutts et al. (2013); Qiu et al. (2013); Moss et al. (2019); and Bakhshoodeh et al. (2022) [57,58,59,60].
5.3. Model Limitations
The geohydrological model was constrained by the various assumptions made during its development and implementation, which inevitably impact the reliability of the results and consequent conclusions.
Calibration relied on storm events rather than continuous flow data because of the impracticality of installing a permanent flow meter at the study site. Only four of the seven recorded storm events were usable because of logger error. Although calibration can be carried out with this number [61], the model’s response under extreme conditions is uncertain.
Using PCSWMM to simulate the local aquifer flow characteristics meant the assumption of a constant aquifer transfer rate, neglecting variability. However, the absence of the necessary data to calibrate and validate the flux-dependent aquifer boundary conditions in MODFLOW led to the conclusion that a coupled model such as SWMM-MODFLOW would not provide superior results compared with the calibrated and validated PCSWMM model selected.
The absence of appropriate instrumentation prevented recording pond outflow volumes due to the high costs and theft risks associated with installing an instrumented weir.
These limitations underscore the need for cautious interpretation of the findings and highlight areas for future model refinement, such as addressing data constraints and exploring alternative calibration approaches to enhance model robustness and reliability.
6. Conclusions
This study evaluated the short- and long-term hydrological impacts of retrofitting a pond using PCSWMM software. Extensive field monitoring of inflows, outflows, and evapotranspiration was replaced with a model to estimate MAR due to concerns about instrumentation theft and vandalism at School Pond. Despite these constraints, some field monitoring of inflows, temperature, rainfall, groundwater quality, and depths was conducted with additional groundwater research by Schneuwly et al. (2024) [62]. The findings from this study demonstrate that it is feasible to calibrate and validate both surface and subsurface models with PCSWMM software within acceptable parameters.
Six scenarios were developed to evaluate the effectiveness of the retrofitted ponds. This study established that detention ponds in a sandy aquifer, such as CFA, have some current infiltration potential, but pond retrofits can enhance recharge. In the case study site, retrofitting potentially increases recharge volume by 118% when the water table is high. However, if the CoCT implements groundwater abstraction over the CFA, resulting in a lower water table, a more significant increase in MAR is possible. Although the likely increase in the MAR offered by the School Pond alone is unlikely to contribute substantially to CoCT’s supply, if it is possible to extend this approach to many more ponds with similar characteristics, there could be a substantial impact on the CoCT supply, as explored by Okedi (2019) [10]. On the other hand, climate change is likely to lead to decreased rainfall; thus, any retrofitted ponds are anticipated to collect less MAR in the future.
The study results highlight the potential advantages of retrofitting detention ponds for MAR while preserving their primary function of flood management. Although high water tables currently limit the realization of MAR benefits, future scenarios suggest that more water may be harvested and stored as the water table drops. Thus, the potential for increased MAR volumes and replenishment of the aquifer for groundwater abstraction presents a promising opportunity for future research and implementation.
Author Contributions
Writing—original draft, conceptualization, methodology, investigation, formal analysis, visualization, C.T.T.; supervision, conceptualization, methodology, funding acquisition, project administration, writing—review and editing, N.P.A.; supervision, conceptualization, methodology, writing—review and editing, J.O. All authors have read and agreed to the published version of the manuscript.
Funding
The authors acknowledge the funding provided by the Danish Ministry of Foreign Affairs (DANIDA MFA) for the ‘Pathways to Water-Resilient South African Cities’ (PaWS) project under grant number DFC-18-M05-KU as well as the Donald McGregor Scholarship and the South African National Research Fund for supporting the principal researcher.
Data Availability Statement
The data presented in this study are available on request from the corresponding author. The data are not publicly available as the repository is still being set up.
Acknowledgments
The authors express their gratitude to the entire PaWS team for their contribution to the elements of this study, the South African Weather Services (SAWS), and the University of Cape Town (UCT) Climate Systems Analysis Group (CSAG) for providing the climate data used in this study. Furthermore, the authors extend their appreciation to the City of Cape Town for sharing stormwater infrastructure data and shapefiles. Finally, the authors acknowledge Computational Hydraulics International (CHI) for awarding a student grant to use the PCWSMM licence.
Conflicts of Interest
The authors declare that the research was conducted in the absence of any commercial or financial relationships that could be construed as potential conflicts of interest.
References
- Kummu, M.; Guillaume, J.H.A.; de Moel, H.; Eisner, S.; Flörke, M.; Porkka, M.; Siebert, S.; Veldkamp, T.I.E. The world’s road to water scarcity: Shortage and stress in the 20th century and pathways towards sustainability. Sci. Rep. 2016, 6, 38495. [Google Scholar] [CrossRef] [PubMed]
- Donnenfeld, Z.; Crookes, C.; Hedden, S. A delicate balance: Water scarcity in South Africa. S. Afr. Rep. 2018, 13, 1–24. [Google Scholar]
- Dillon, P.; Page, D.; Vanderzalm, J.; Toze, S.; Simmons, C.; Hose, G.; Martin, R.; Johnston, K.; Higginson, S.; Morris, R. Lessons from 10 Years of Experience with Australia’s Risk-Based Guidelines for Managed Aquifer Recharge. Water 2020, 12, 537. [Google Scholar] [CrossRef]
- Maliva, R.G. Economics of managed aquifer recharge. Water 2014, 6, 1257. [Google Scholar] [CrossRef]
- Megdal, S.B.; Dillon, P. Policy and economics of managed aquifer recharge and water banking. Water 2015, 7, 592. [Google Scholar] [CrossRef]
- Mauck, B.; Winter, K. Assessing the potential for managed aquifer recharge (MAR) of the Cape Flats Aquifer. Water SA 2021, 47, 505–514. [Google Scholar] [CrossRef]
- CoCt. Our Shared Water Future: Cape Town’s Water Strategy; City of Cape Town: Cape Town, South Africa, 2019; p. 108. [Google Scholar]
- Ziervogel, G.; Franklin, B.; Thorson, J. Unpacking the Cape Town Drought: Lessons Learned; Cities Support Programme: Cape Town, South Africa, 2019. [Google Scholar]
- Taing, L.; Chang, C.C.; Pan, S.; Armitage, N.P. Towards a water secure future: Reflections on Cape Town’s Day Zero crisis. Urban Water J. 2019, 16, 530–536. [Google Scholar] [CrossRef]
- Okedi, J. The Prospects for Stormwater Harvesting in Cape Town, South Africa Using the Zeekoe Catchment as a Case Study; University of Cape Town: Cape Town, South Africa, 2019; p. 227. [Google Scholar]
- Mclachlan, J.; Tanyanyiwa, C.T.; Schneuwly, R.; Carden, K.; Armitage, N.P.; Abrams, A.; Mguni, P.; Herslund, L.B. Pathways to water resilient South African cities—From mono-functiona l to multi-functional stormwater infrastructure. Sci. Afr. 2023, 20, e01674. [Google Scholar]
- Tanyanyiwa, C.T.; Abrams, A.L.; Carden, K.; Armitage, N.P.; Schneuwly, R.; Mguni, P.; Herslund, L.B.; Mclachlan, J. Managing stormwater in South African neighbourhoods: When engineers and scientists need social science skills to get their jobs done. AQUA-Water Infrastruct. Ecosyst. Soc. 2023, 74, 456–464. [Google Scholar] [CrossRef]
- Gironás, J.; Roesner, L.A.; Davis, J.; Rossman, L.A.; Supply, W. Storm Water Management Model Applications Manual; National Risk Management Research Laboratory, Office of Research and Development, US Environmental Protection Agency: Cincinnati, OH, USA, 2009.
- Charbonneau, C.; Bradford, A. Wetland Modeling in PCSWMM: Exploring Options to Define Wetland Features and Incorporate Groundwater Exchanges. J. Water Manag. Model. 2016, 24. [Google Scholar] [CrossRef]
- Woods-Ballard, B.; Kellagher, R.; Ballard, B.W. The SuDS Manual; CIRIA: London, UK, 2015; pp. 174–180. [Google Scholar]
- Coffman, L.S. Low-Impact Development Design: A New Paradigm for Stormwater Management Mimicking and Restoring the Natural Hydrologic Regime an Alternative Stormwater. 2000, pp. 158–167. Available online: https://www.semanticscholar.org/paper/Low-%E2%80%93Impact-Development-Design%3A-A-New-Paradigm-for-Coffman/b927bee609e6ed4f52729d1c92ccd41ffd038e5d (accessed on 10 November 2022).
- Cheng, M.S.; Coffman, L.S.; Clar, M.L. Low-impact development hydrologic analysis. Urban Drain. Model. 2001, 659–681. [Google Scholar] [CrossRef]
- Armitage, N.; Vice, M.; Fisher-Jeffes, L.; Winter, K.; Spiegel, A.; Dunstan, J. Alternative Technology for Stormwater Management South African Guideli nes for Sustainable Drainage Systems. Rep. TT 2013, 558, 13. [Google Scholar]
- Mooers, E.W.; Jamieson, R.C.; Hayward, J.L.; Drage, J.; Lake, C.B. Closure to “Low-Impact Development Effects on Aquifer Recharge Using Coupled Surface and Groundwater Models” by Eva W. Mooers, Rob C. Jamieson, Jenny L. Hayward, John Drage, and Craig B. Lake. J. Hydrol. Eng. 2019, 23, 04018040. [Google Scholar]
- Wissler, A.D.; Hunt, W.F.; McLaughlin, R.A. Hydrologic and water quality performance of two aging and unmaintained dry detention basins receiving highway stormwater runoff. J. Environ. Manag. 2020, 255, 109853. [Google Scholar] [CrossRef] [PubMed]
- Burszta-Adamiak, E.; Mrowiec, M. Modelling of Green roofs’ hydrologic performance using EPA’s SWMM. Water Sci. Technol. 2013, 68, 36–42. [Google Scholar] [CrossRef] [PubMed]
- James, W. Rules for Responsible Modeling, 4th ed.; Computational Hydraulics International (CHI): Guelph, OH, Canada, 2005; p. 307. [Google Scholar]
- USEPA. Storm Water Management Model (SWMM) User’s Manual Version 5.1; USEPA: Washington, DC, USA, 2015; pp. 1–353.
- Lockie, T. Catchment Modelling Using SWMM. In Modelling Stream; Auckland, New Zealand. 2009. Available online: https://www.waternz.org.nz/Folder?Action=View%20File&Folder_id=135&File=lockie_t.pdf (accessed on 10 November 2022).
- Rossman, L.A.; Huber, C.W. Storm Water Management Model Reference Manual Volume II—Hydraulics. Environ. Prot. 2017, II, 37–46. [Google Scholar]
- James, W.; Rossman, L.A.; Robert, W.; James, C. User’s Guide to SWMM5, 13th ed.; CHI Press Publication: Guelph, OH, Canada, 2010. [Google Scholar]
- Zhang, K.; Chui, T.F.M.; Yang, Y. Simulating the hydrological performance of low impact development in shallow groundwater via a modified SWMM. J. Hydrol. 2018, 566, 313–331. [Google Scholar] [CrossRef]
- Randall, M.; Sun, F.; Zhang, Y.; Jensen, M.B. Evaluating Sponge City volume capture ratio at the catchment scale using SWMM. J. Environ. Manag. 2019, 246, 745–757. [Google Scholar] [CrossRef] [PubMed]
- Palla, A.G.I. Hydrologic modelling of Low Impact Development systems at the urban catchment scale. J. Hydrol. 2015, 528, 361–368. [Google Scholar] [CrossRef]
- Aparicio Uribe, C.H.; Bonilla Brenes, R.; Hack, J. Potential of retrofitted urban green infrastructure to reduce runoff—A model implementation with site-specific constraints at neighborhood scale. Urban For. Urban Green. 2022, 69, 127499. [Google Scholar] [CrossRef]
- Le Floch, N.; Pons, V.; Hassan Abdalla, E.M.; Alfredsen, K. Catchment scale effects of low impact development implementation scenarios at different urbanization densities. J. Hydrol. 2022, 612, 128178. [Google Scholar] [CrossRef]
- Rivard, G.; Frenette, R.; Bolgov, M.; Pozgniakov, S. Modeling Surface Runoff, Groundwater Flow, and their Interaction with PCSWMM and MODFLOW—For the City of Rostov the Great, Russia. J. Water Manag. Model. 2004, 12, 71–89. [Google Scholar] [CrossRef]
- Inc., E.; Marchildon, M.; Kassenaar, D. Analyzing Low Impact Development Strategies Using Continuous Fully Distributed Coupled Groundwater and Surface Water Models. J. Water Manag. Model. 2013, 6062, 319–336. [Google Scholar] [CrossRef]
- Wu, B.Z.Y.; Walski, T.; Mankowski, R.; Herrin, G.; Gurrieri, R. Calibrating Water Distribution Model Via Genetic Algorithms. In Proceedings of the AWWA IMTech Conference, Kansas City, MI, USA, 14–17 April 2002; pp. 1–10. [Google Scholar]
- Babaie, S.; Ghazavi, R.; Erfanian, M. Quantifying the impact of urban runoff injection on groundwater Enhancement in a semi-arid environment using SWMM and MOFLOW Model. Glob. NEST J. 2021, 23, 556–564. [Google Scholar]
- Ziervogel, G.; Waddell, J.; Smit, W.; Taylor, A. Flooding in Cape Town’s informal settlements: Barriers to collaborativ e urban risk governance. S. Afr. Geogr. J. 2016, 98, 1–20. [Google Scholar] [CrossRef]
- LaVanchy, G.T.; Kerwin, M.W.; Adamson, J.K. Beyond ‘Day Zero’: Insights and lessons from Cape Town (South Africa). Hydrogeol. J. 2019, 27, 1537–1540. [Google Scholar] [CrossRef]
- Olivier, D.W.; Xu, Y. Making effective use of groundwater to avoid another water supply cris is in Cape Town, South Africa. Hydrogeol. J. 2019, 27, 823–826. [Google Scholar] [CrossRef]
- Department of Water Affairs and Forestry. The Assessment of Water Availability in the Berg Catchment (WMA19) by Means of Water Resource Related Models. Pretoria, South Africa. 2008. Available online: https://www.dws.gov.za/Documents/Other/WMA/19/Reports/Rep9-Vol7-GW%20TMG%20Aquifer%20Piketberg%20Model.pdf (accessed on 10 November 2022).
- Adelana, S. Groundwater Resource Evaluation and Protection in the Cape Flats, South Africa; University of the Western Cape: Cape Town, South Africa, 2010. [Google Scholar]
- Schalke, H.J.W.G. The Upper Quaternary of the Cape Flats Area (Cape Province, South Africa). Scr. Geol. 1973, 15, 1–67. [Google Scholar]
- Mauck, B.A. The Capacity of the Cape Flats Aquifer and Its Role in Water Sensitive Urban Design in Cape Town; University of Cape Town: Cape Town, South Africa, 2017. [Google Scholar]
- Rust, I.C. Environmental geology of the coastal zone: A South African perspective. S. Afr. J. Mar. Sci. 1991, 10, 397–405. [Google Scholar] [CrossRef]
- Robinson, S. A Tutorial on Conceptual Modeling for Simulation; IEEE: Huntington Beach, CA, USA, 2015. [Google Scholar]
- Jones, M. Evaluation of Cape Town’s Stormwater Ponds for Managed Aquifer Recharge; University of Cape Town: Cape Town, South Africa, 2019; pp. 1–83. [Google Scholar]
- Mavundla, P. An Experimental Study on the Infiltration Potential of Stormwater Ponds in Zeekoe Catchment, Cape Town, South Africa; University of Cape Town: Cape Town, South Africa, 2022; pp. 1–199. [Google Scholar]
- Chow, V.T. Open Channel Hydraulics, 1st ed.; McGraw-Hill: New York, NY, USA, 1959. [Google Scholar]
- South African National Roads Agency Limited. Drainage Manual; South African National Roads Agency Limited: Pretoria, South Africa, 2013; p. 22.
- Hargreaves, G.H.; Allen, R.G. History and Evaluation of Hargreaves Evapotranspiration Equation. J. Irrig. Drain. Eng. 2003, 129, 53–63. [Google Scholar] [CrossRef]
- Craig, R.F. Craig’s Soil Mechanics, 7th ed.; Taylor & Francis Group: New York, NY, USA, 2004; Volume 1. [Google Scholar]
- Rossman, L.A.; Huber, W.C. Storm Water Management Model Reference Manual Volume I—Hydrology; U.S. Environmental Protection Agency: Washington, DC, USA, 2016; Volume I, 231p.
- Sarma, P.; Delleur, J.; Rao, A. Comparison of rainfall-runoff models for urban areas. J. Hydrol. 1973, 18, 329–347. [Google Scholar] [CrossRef]
- Moriasi, D.N.; Arnold, J.G.; van Liew, M.W.; Bingner, R.L.; Harmel, R.D.; Veith, T.L. Model evaluation guidelines for systematic quantification of accuracy in watershed simulations. Trans. ASABE 2007, 50, 885–900. [Google Scholar] [CrossRef]
- CoCt. New Water Programme–Cape Flats Aquifer Management Scheme: March 2020—April 2021 Hydrochemical Monitoring Report, in New Water Programme–Cape Flats Aquifer Management Scheme; City of Cape Town: Cape Town, South Africa, 2021; p. 89. [Google Scholar]
- Government, W.C. Economic Water Resilience|110% Green. 2022. Available online: https://www.westerncape.gov.za/110green/economic-water-resilience (accessed on 10 November 2022).
- Seyler, H.; Bollaert, M.; Witthüser, K. Regional Water Sensitive Urban Design Scenario Planning for Cape Town Using an Urban (Geo)Hydrology Model; Water Research Commission: Pretoria, South Africa, 2016; p. 130. [Google Scholar]
- Coutts, A.M.; Tapper, N.J.; Beringer, J.; Loughnan, M.; Demuzere, M. Watering our cities: The capacity for Water Sensitive Urban Design to support urban cooling and improve human thermal comfort in the Austral ian context. Prog. Phys. Geogr. 2013, 37, 2–28. [Google Scholar] [CrossRef]
- Qiu, G.Y.; Li, H.Y.; Zhang, Q.T.; Wan, C.; Liang, X.J.; Li, X.Z. Effects of Evapotranspiration on Mitigation of Urban Temperature by Ve getation and Urban Agriculture. J. Integr. Agric. 2013, 12, 1307–1315. [Google Scholar] [CrossRef]
- Moss, J.L.; Doick, K.J.; Smith, S.; Shahrestani, M. Influence of evaporative cooling by urban forests on cooling demand in cities. Urban For. Urban Green. 2018, 37, 65–73. [Google Scholar] [CrossRef]
- Bakhshoodeh, R.; Ocampo, C.; Oldham, C. Exploring the evapotranspirative cooling effect of a green façade. Sustain. Cities Soc. 2022, 81, 103822. [Google Scholar] [CrossRef]
- Titterington, J.; Squibbs, G.; Digman, C.; Allitt, R.; Osborne, M.; Eccleston, P.; Wisdish, A. Code of Practice for the Hydraulic Modelling of Urban Drainage Systems; The Chartered Institution of Water and Environmental Management: London, UK, 2017; p. 169. [Google Scholar]
- Schneuwly, R.; Tanyanyiwa, C.T.; Carden, K. Water Quality and Blue-Green Infrastructure in Shallow Urban Groundwat Er: A Case Study in the Cape Flats, South Africa—Data Set; University of Cape Town: Cape Town, South Africa, 2024. [Google Scholar]


Disclaimer/Publisher’s Note: The statements, opinions and data contained in all publications are solely those of the individual author(s) and contributor(s) and not of MDPI and/or the editor(s). MDPI and/or the editor(s) disclaim responsibility for any injury to people or property resulting from any ideas, methods, instructions or products referred to in the content. |
© 2025 by the authors. Licensee MDPI, Basel, Switzerland. This article is an open access article distributed under the terms and conditions of the Creative Commons Attribution (CC BY) license (https://creativecommons.org/licenses/by/4.0/).