Article

Elucidating the Electrochemical Corrosion of a Water Pump Impeller in an Industrial Cooling System with Zero Liquid Discharge

by
Mina Mousavi Jarrahi
1,
Ehsan Khajavian
1,
Amir Hossein Noorbakhsh Nezhad
1,
Ehsan Mohammadi Zahrani
1,* and
Akram Alfantazi
2
1
Department of Materials Science and Engineering, Faculty of Engineering, Ferdowsi University of Mashhad, Mashhad 91775-1111, Iran
2
Department of Chemical Engineering, Khalifa University of Science and Technology, Abu Dhabi P.O. Box 2533, United Arab Emirates
*
Author to whom correspondence should be addressed.
Water 2025, 17(2), 173; https://doi.org/10.3390/w17020173
Submission received: 26 November 2024 / Revised: 13 December 2024 / Accepted: 7 January 2025 / Published: 10 January 2025
(This article belongs to the Special Issue Water Engineering Safety and Management)

Abstract

:
The electrochemical corrosion of a single-suction centrifugal water pump impeller made of gray cast iron operating at 85 °C was investigated in two industrial water media, i.e., groundwater extracted from a borehole and treated wastewater. Open circuit potential (OCP) measurement plus potentiodynamic polarization (PDP) and electrochemical impedance spectroscopy (EIS) techniques elucidated the electrochemical corrosion performance and inductively coupled plasma-optical emission spectroscopy (ICP-OES) characterized the water samples. The retired and brand-new impellers were studied using scanning electron microscopy (SEM), energy-dispersive X-ray spectroscopy (EDX), and visual and metallographic examinations. Impeller trailing edges were vulnerable to corrosion damage due to increased total fluid pressure, velocity, and temperature. The groundwater was more contaminated with Ca, Mg, Na, Si, and S elements and possessed higher conductivity, pH, and suspended solids than the treated wastewater. The impeller was more susceptible to graphitic corrosion in the groundwater due to emerging microgalvanic cells. A kinetic control electrochemical mechanism was elucidated as the corrosion rate-controlling step in the wastewater. A mixed kinetic and diffusion control mechanism was predominant in the groundwater because a short Warburg impedance element emerged. This study showcased the significance of integrated industrial water management and treatment strategies to protect pumps’ integrity and uptime in critical industrial units implementing a zero-liquid discharge program.

1. Introduction

Cooling systems are significant in industrial applications, acting as a bottleneck in most production plants, particularly in the food and beverage industry [1]. Water pumps are known as a critical component of cooling systems. The failure of different cooling system parts, particularly pump impellers, flangs, and casings, adversely affects the performance and uptime [2]. The main reasons for the early retirement of water pump impellers are premature failures caused by hydraulic, mechanical, and corrosion factors. In this regard, pump operating conditions are prominent factors contributing to pump reliability and lifespan [2,3]. The critical variables in cooling system pump operation include working temperature, water–electrolyte corrosivity, fluid chemical composition, pressure, pH, flow rate, flow disturbance, the presence of erosive solid particles in the fluid, the quality of the material utilized for manufacturing the pump components, and impeller/casing design [2,3]. Yu et al. argued that a centrifugal water pump’s flow disturbance and hydrodynamic flow characteristics could affect the impeller’s corrosion performance and longevity [4]. An increased circulating fluid temperature is to blame for excessive corrosion damage and the shortening of the lifespan of pump components [4].
Electrochemical corrosion is a well-known mechanism of the premature failure and degradation of pump components, mainly those operating under hot water containing erosive solid particles and corrosive species [5]. Corrosion damage in cooling water systems increases water consumption, declines pump efficiency, and causes subsequent malfunctions [6]. Increased water consumption and electricity in circulating cooling water systems could be a significant challenge for industrial units operating in countries with water scarcity and electricity shortage in relatively dry geographic zones (e.g., Khorasan Razavi province, Eastern Iran), particularly in sensitive food and beverage production facilities [7]. Anodic film is progressively damaged at the alloy–electrolyte interface, where electrochemical anodic and cathodic reactions occur on the impeller, leading to subsequent severe corrosion degradation, surface roughening, and edge breakage due to metallic wall thinning and stress concentration caused by corrosion products [8,9,10,11]. Cast iron has typically been used to manufacture centrifugal water pump impellers and sewage and water piping systems, and its application is still viable because of its inherent merits. It is a cost-effective choice compared to stainless steel and copper for use in aqueous media with low to moderate corrosivity [12,13]. Gray cast iron (Fe-C-Si alloy) microstructure comprises graphite flakes in a ferrous matrix of ferrite and pearlite [14]. Gray cast iron pump impellers are susceptible to galvanic corrosion and general corrosion damage due to the presence of electrochemical microcells between noble graphite and ferrite–pearlite matrix [12,15].
Nonetheless, using gray cast iron for impeller manufacturing is still a practical solution for cooling water systems in industrial units, particularly in developing countries, due to its (a) low cost, (b) the ease of mass production of parts with complex shapes and geometry by sand molded casting because of reasonable liquidity at the casting temperature, (c) a relatively lower thermal expansion coefficient compared to its carbon steel and ductile iron counterparts, (d) its intrinsic vibration energy adsorption and, (e) compelling heat transfer capabilities, i.e., it is beneficial in rotating equipment such as centrifugal water pumps [12,13]. Fluid flow numerical simulation is critical for investigating and subsequent troubleshooting and designing in engineering systems and industries, particularly water pumps [14,15]. One of the numerical analysis methods that can be used to investigate pump performance is the computational fluid dynamics (CFDs) simulation [16,17,18]. It can investigate the effects of fluid parameters such as flow rate, pressure, and temperature on the pump impeller performance at desired rotational speeds [16,17,18].
By implementing a zero-liquid discharge (ZLD) program in industrial units, groundwater extraction through boreholes or wells from natural water reservoirs should eventually be eliminated. Because of strict environmental considerations, industrial wastewater should be treated and reused [19,20,21]. However, recycling/reusing industrial wastewater or groundwater could affect the lifetime and integrity of the different equipment exposed to water during operation [22]. In the real world, many industries cannot completely switch to recycling/reusing industrial wastewater because of a limited water treatment capacity or a limited wastewater supply, making the partial use of groundwater essential. Accordingly, the integrity of water pump components, particularly the impeller, is crucial wherever treated wastewater and groundwater are alternatively used. A recent publication argued that the poor quality of recycled industrial wastewater contributed to a steel complex’s premature failure of a boiler feed water heat exchanger [23]. It showcased that compromising the wastewater treatment process could disrupt the plant’s integrity [23].
The present study deals with the electrochemical corrosion failure of a single-suction centrifugal water pump impeller made of gray cast iron using EIS modeling and a CFDs simulation of the pump. The impeller was utilized in a cooling water system of a canned food production line in a significant local food factory in eastern Iran. Due to local water reservoir restrictions and strict environmental regulations, municipal/industrial wastewater was treated at a local water treatment facility (called wastewater throughout the paper) and partially used in the system. Groundwater extracted through a local well (called well water throughout the paper) was also occasionally supplied to the cooling system due to the limited capacity of the water treatment facility. Overall, the water pump impellers in this facility experience a 50% shorter lifespan than expected. The impellers had to be replaced every two months. In addition to replacing the impeller, halting the production line can be costly. The novel electrochemical findings merit the industrial community’s ability to enhance their fundamental understanding of gray cast iron pump impellers’ corrosion behavior and to protect cooling systems’ integrity and uptime.

2. Materials and Methods

Figure 1 shows the canned food production line (Figure 1a) and the centrifugal pump location (Figure 1b). In the system, the supplied water is heated to 85 °C and transmitted to the showers shown in Figure 1a by the centrifugal pump to cool down the glass canned food in the final production stage. The poured water is collected and transmitted to the primary tank for recycling and subsequent reuse. The investigated component is a closed impeller, as shown in Figure 2. Gray cast iron is a long-lasting, cost-effective material that is used in the industrial cooling system’s water pump impeller manufacturing market. Nonetheless, the electrochemical corrosion simulation of gray cast iron in industrial water media has not been systematically carried out using EIS and equivalent electric circuit models. Herein, we used EIS as a powerful method for corrosion investigation [24]. The present study provided a detailed insight into the gray cast iron impeller’s susceptibility to electrochemical corrosion. It elucidated the underlying electrochemical corrosion mechanisms utilizing rationalized equivalent electric circuit models, as discussed elsewhere [5]. The EIS profiles were simulated with appropriate equivalent electric circuit models to elucidate the interfacial electrochemical processes at the impeller interface with the circulating water- medium. The CFD simulation examined the operating conditions of the pump impeller in more detail.
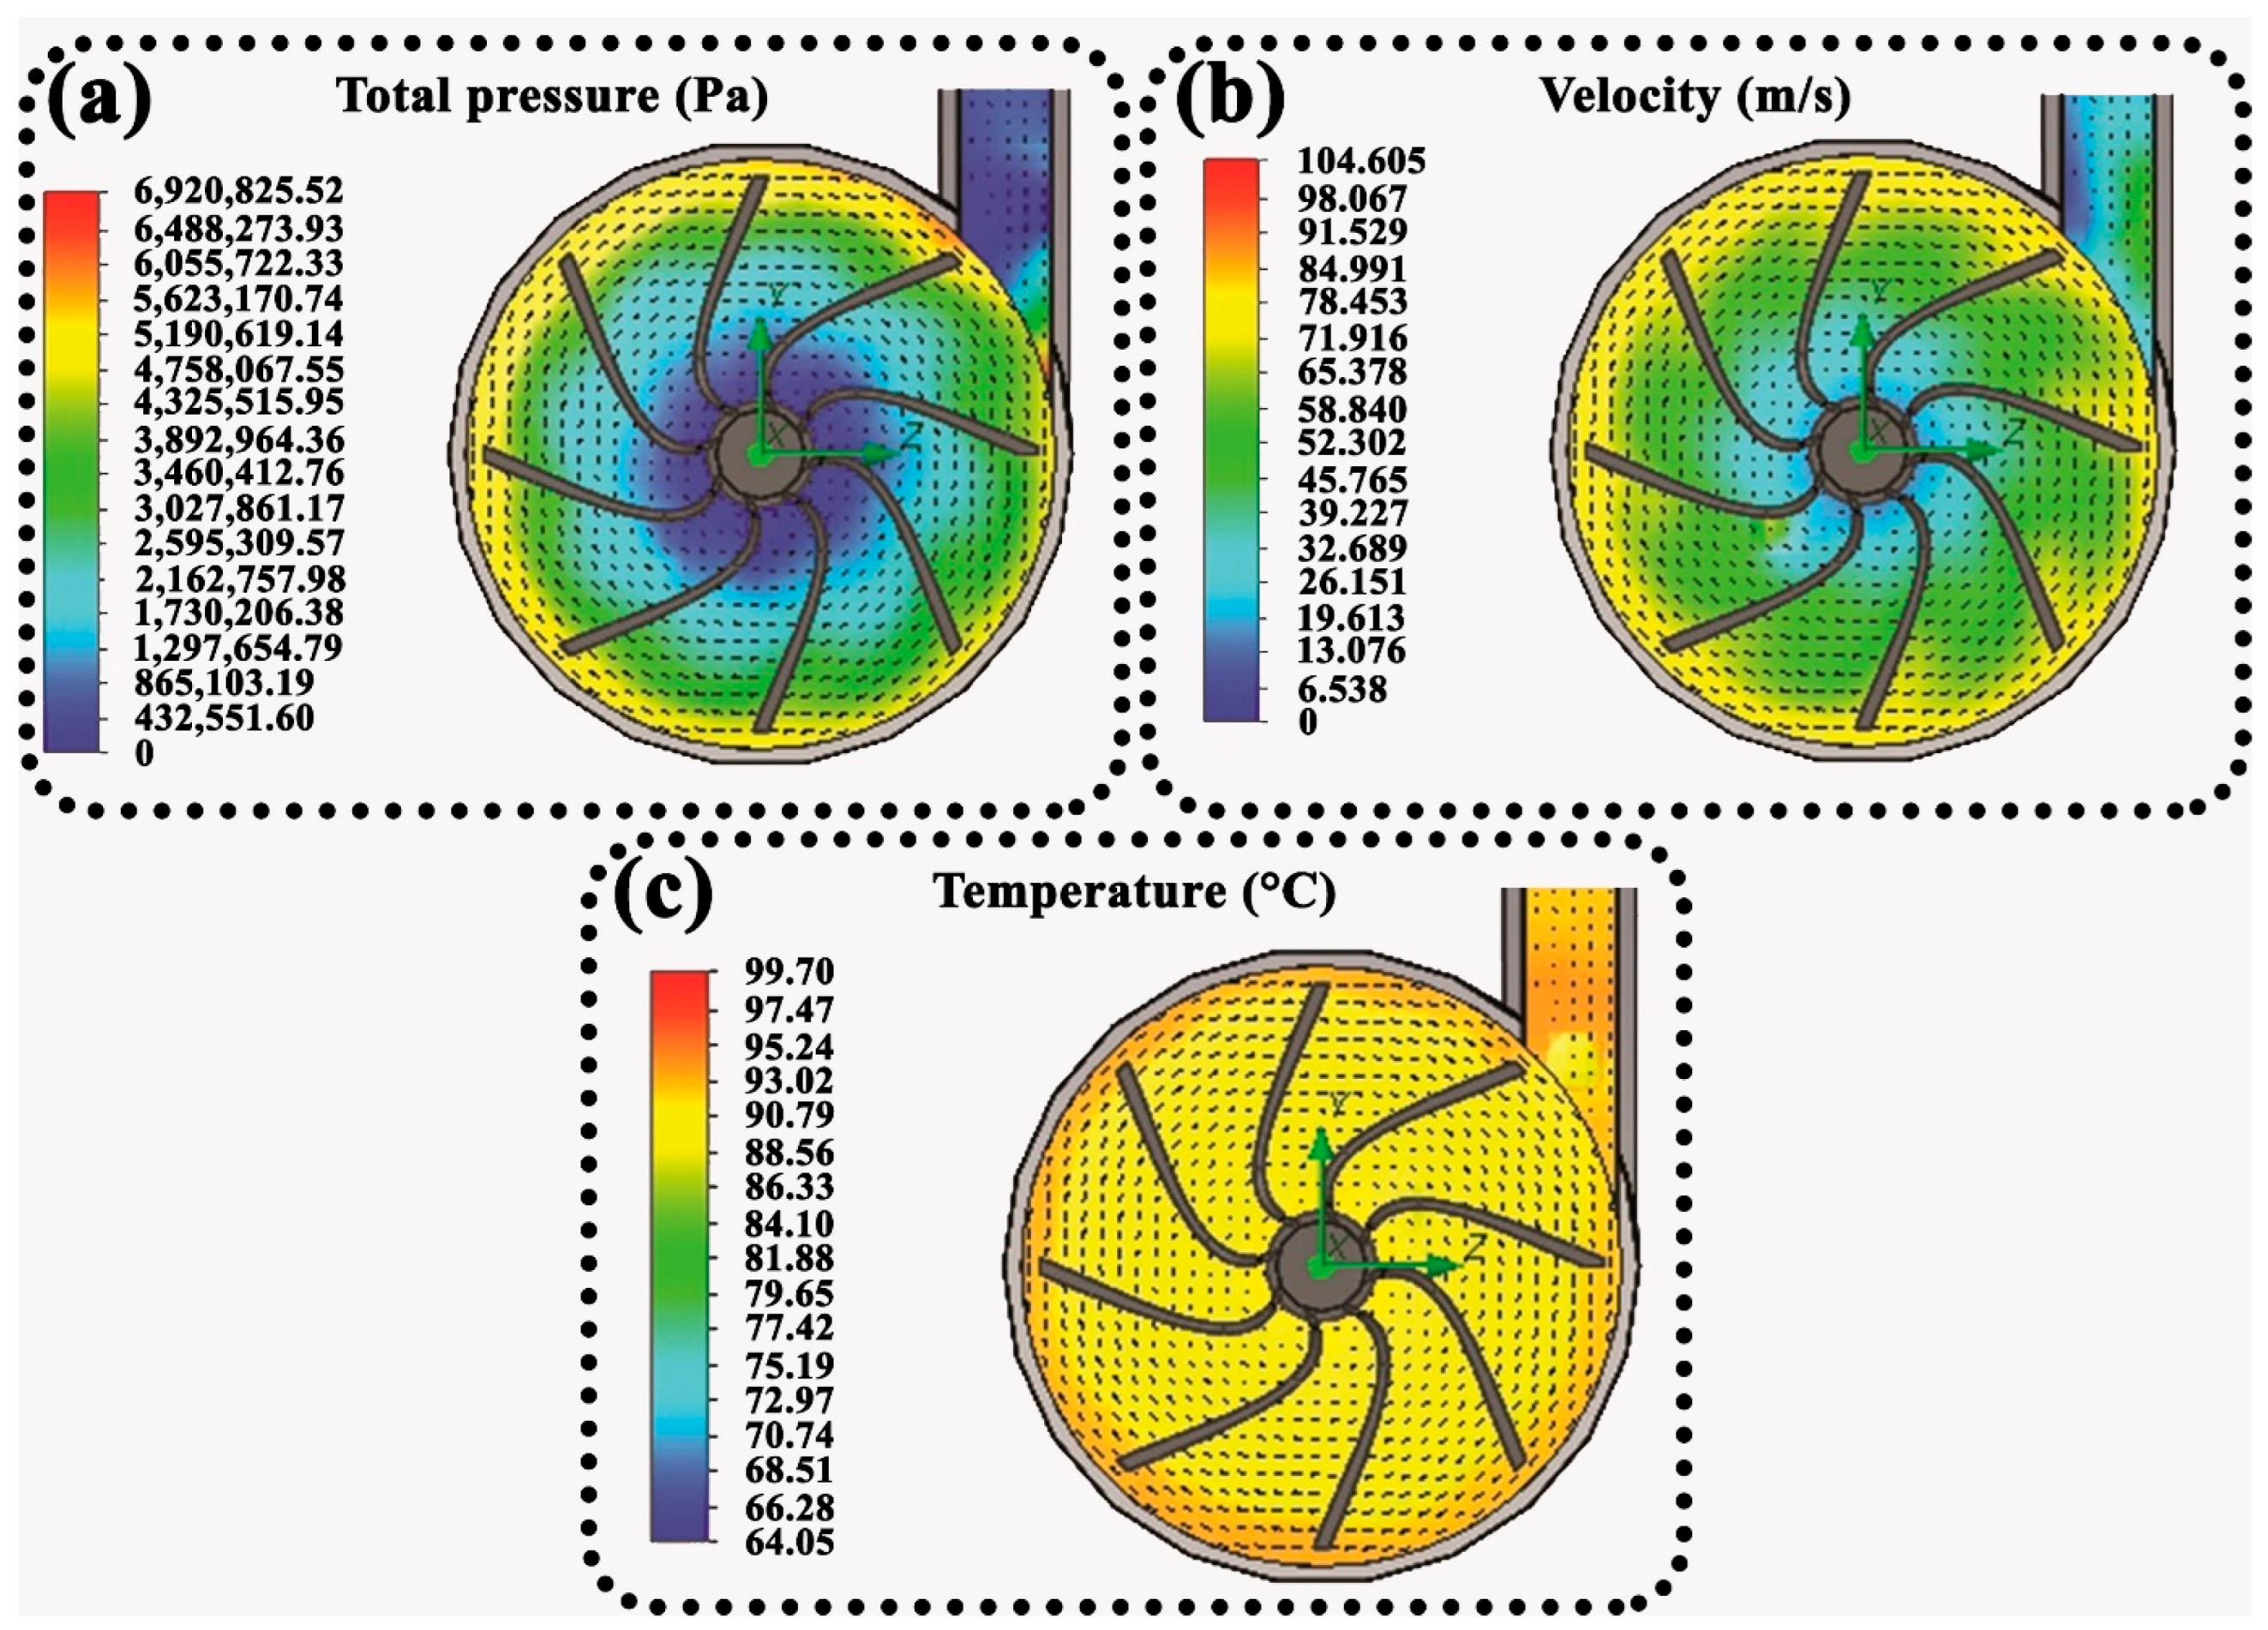
The centrifugal pump impeller was modeled using the SOLIDWORKS software package (version 2013) to investigate the flow field and its effects. The pump sucks water at 85 °C from the tank through the eye impeller section, and the impeller, which spins at 5000 rpm, directs water to the showers (Figure 1a) through the outlet. Meshing was carried out automatically on the inlet and outlet area plus impeller and volute by software at Level 4. The flow simulation type was internal, and the fluid temperature was 85 °C. The pump inlet and outlet boundary provided a constant static pressure and flow rate, respectively. Fluid pressure, velocity, and temperature distribution in the volute casing were simulated.
The failed pump impeller was examined visually at the beginning of the experiment to take photographs. The microstructure of the samples, cut from a retired and a brand-new gray cast iron impeller, was investigated using a digital optical microscope (Olympus Microscope BX60M Reflected Light, Tokyo, Japan) and a scanning electron microscope with 20 kV accelerating voltage (SEM, ZEISS LEO 1450 VP, Oberkochen, Baden-Württemberg, Germany). The SEM was equipped with an energy-dispersive X-ray spectroscopy analysis instrument (EDX, Oxford instruments X-Max, Abingdon, Oxfordshire, England). A Au coat was applied to the SEM samples to enhance electric conductivity. The SEM/EDX technique was carried out to examine the failed impeller, study the corrosion products and the morphologies of the corroded surfaces, and the chemical composition of the corroded zones. The microscopic images were quantitatively analyzed using the ImageJ software package (version 1.52) to quantify the content of the different phases. Optical emission spectroscopy (OES, Hitachi Foundry-Master Smart, Tokyo, Japan) determined the impeller’s chemical composition. Both water samples collected from the canned food production plant (i.e., well water and wastewater) were assessed via inductively coupled plasma-optical emission spectroscopy (ICP-OES, Spectro Arcos, Kleve, Germany). The well water and wastewater samples were used as electrolytes in the electrochemical corrosion investigations in as-received conditions.
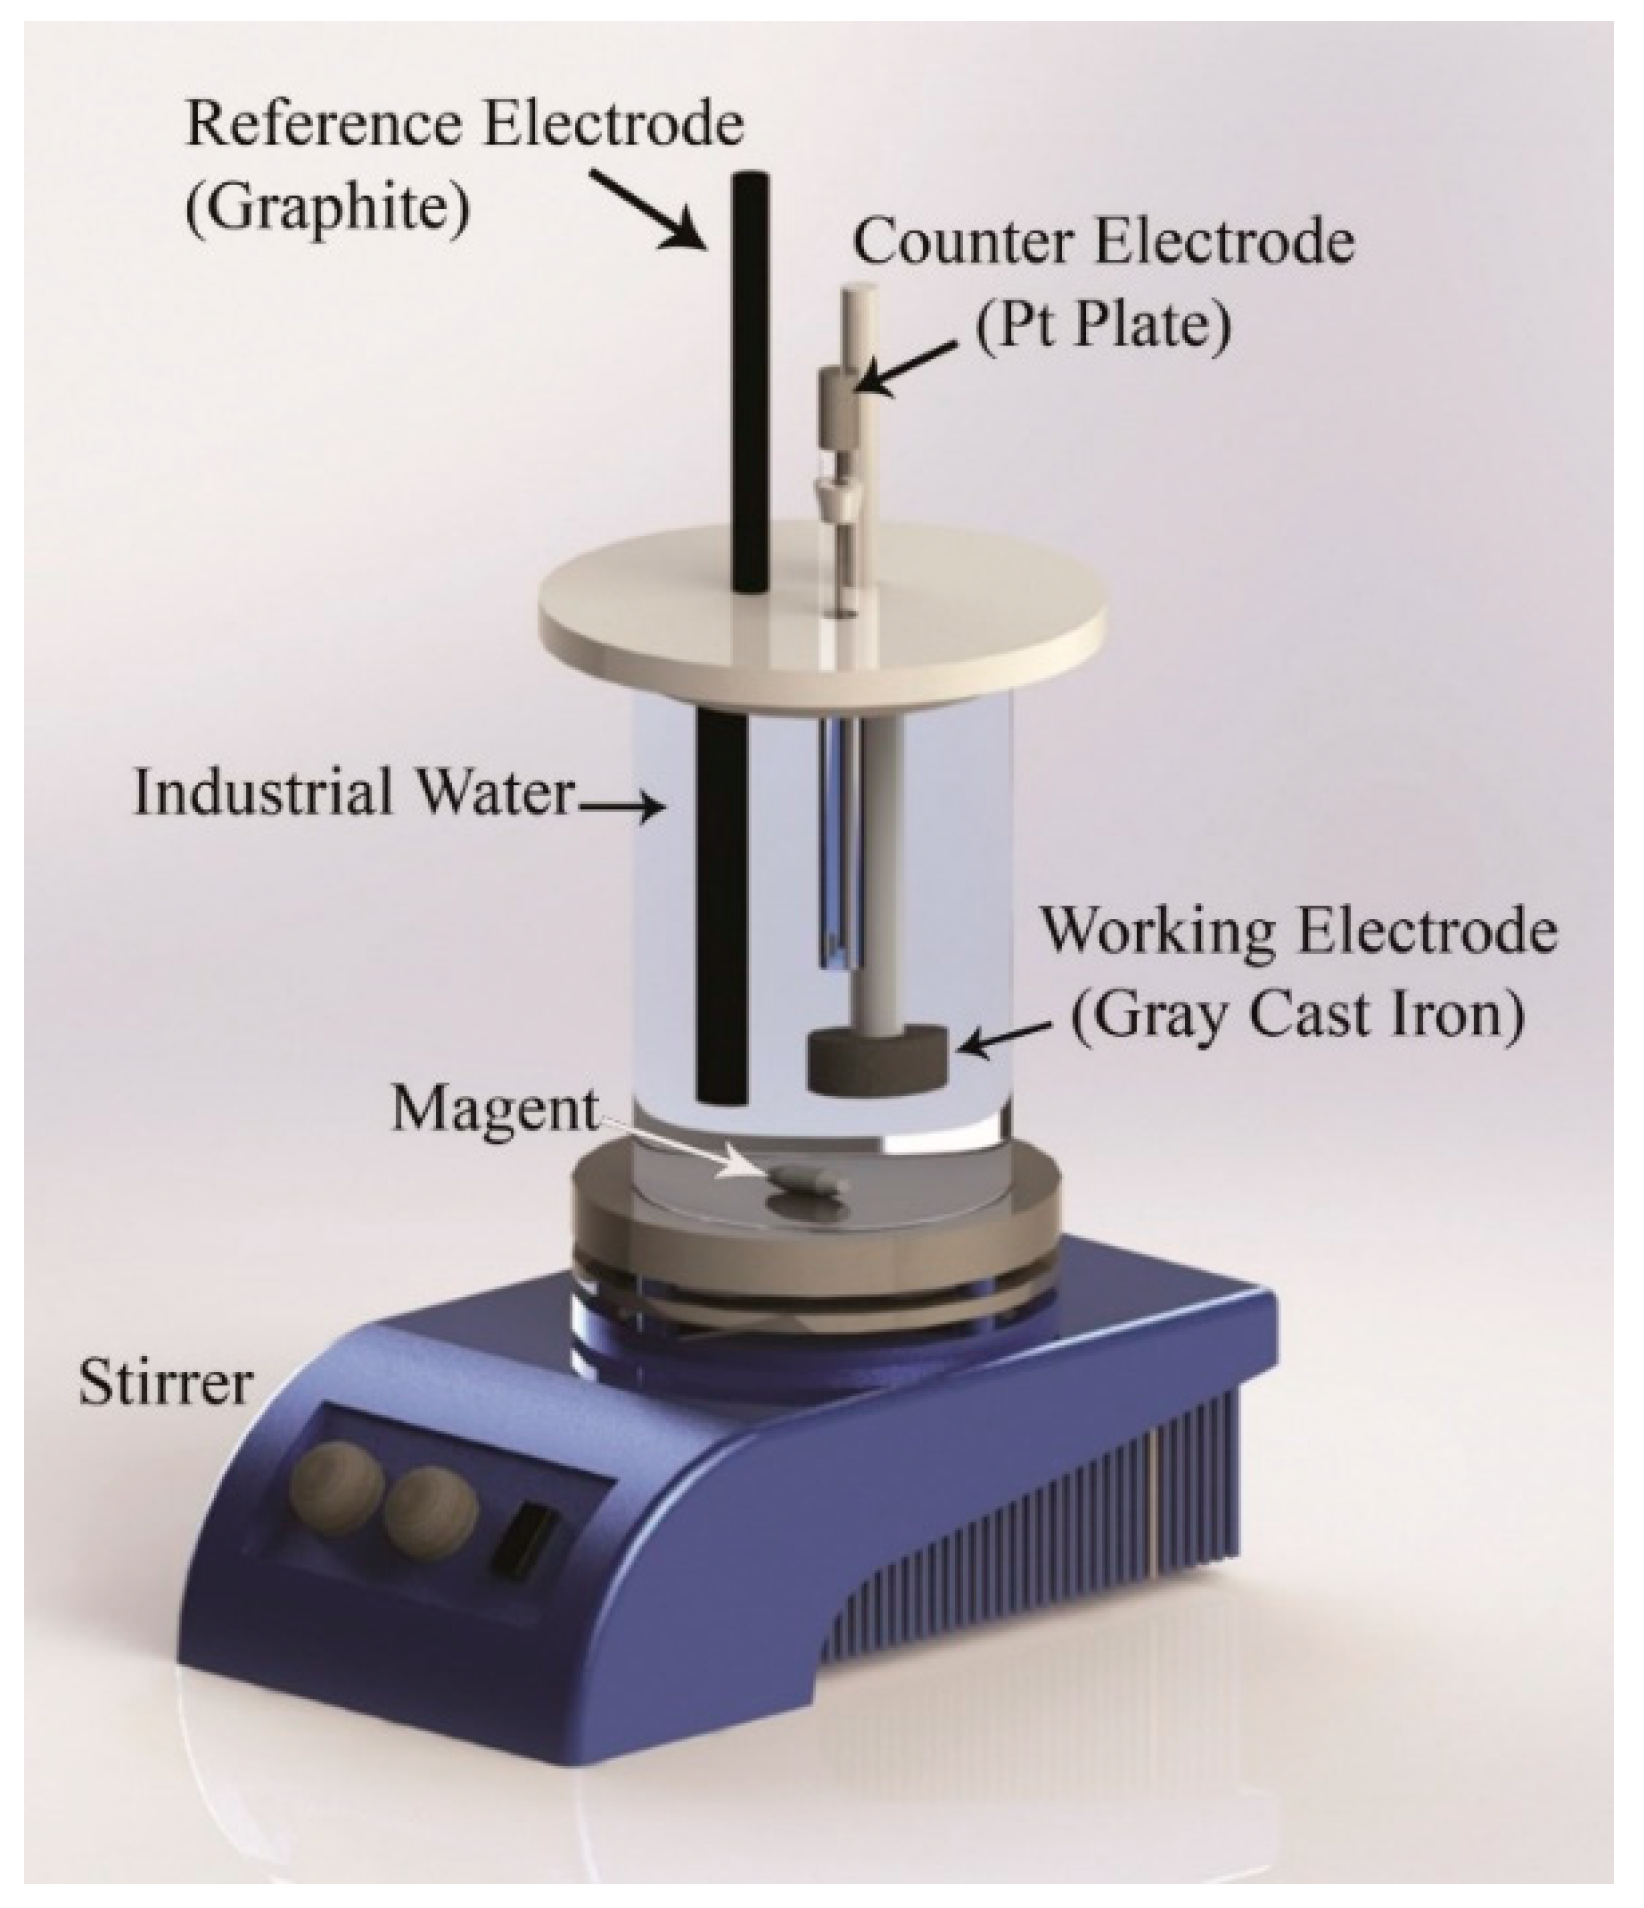
Figure 3 shows a schematic of the corrosion testing apparatus consisting of an integrated three-electrode electrochemical cell. A potentiostat/galvanostat (ZIVE SP1: ZIVELAB WonATech Co., Ltd., Seoul, Republic of Korea) was connected to the electrochemical cell. The potentiostat/galvanostat hardware had an integrated frequency response analyzer for the EIS test plus SmartManager corrosion analysis software to conduct OCP, EIS, and PDP tests. The three-electrode cell arrangement comprised pseudo-reference (graphite), counter (99.99% pure platinum), and working electrodes. Disk-shaped gray cast iron coupons with a diameter of 10 mm were cut from a brand-new impeller and mounted in a cold epoxy resin as the working electrodes. The working electrodes were ground using 120-, 240-, 320-, 400-, 600-, and 1200-grit silicon carbide wet sandpapers, rinsed with distilled water and ethanol, and dried under a warm air stream.
First, the intact working electrodes were exposed to the stagnant electrolyte (200 mL) for 120 min, and the OCP was simultaneously recorded (i.e., free corrosion conditions). No external anodic/cathodic overpotential was applied to the electrochemical cell under free corrosion conditions to establish equilibrium oxidation–reduction (redox) reactions at the electrochemical interface at the OCP. The 2 h immersion test and OCP monitoring aimed to study the steady-state electrode phenomena, anodic film growth tendency, and the electrode’s tendency toward electrochemical corrosion from a thermodynamic standpoint. Second, the intact working electrodes were exposed to stirring electrolytes (200 mL) for 0, 30, and 60 min. Those test conditions are labeled as the 0, 30, and 60 data points in figures and associated graphs throughout the paper. The magnetic stirrer bar’s (20 mm in length) rotation speed was 5000 rpm with an electrolyte temperature of 85 °C in a glass container. Then, the magnetic stirrer was turned off. Subsequently, in the same corrosion test cell at 85 °C, the OCP was monitored for 30 min to ensure a steady-state equilibrium potential between the working and pseudo-reference electrodes under stagnant electrolyte conditions. A steady-state OCP is essential to achieve robust, reproducible PDP and EIS results for corrosion kinetics studies [25]. Finally, PDP and EIS tests were conducted in the same corrosion cell wherein the electrochemical interface achieved a steady-state OCP. Each electrochemical test was repeated twice to ensure the electrochemical data’s reproducibility and robustness. A new intact working electrode was utilized for each PDP test, the EIS test, and the subsequent test repetitions. In other words, the PDP and EIS tests were not conducted on identical electrodes to ensure no systematic error in the test data [5]. The PDP was conducted at a scan rate of 1 mV/s over −300 mV to +300 mV potential range versus an established OCP. The Tafel extrapolation technique determined the values of βa (anodic Tafel slope), icorr (corrosion current density), and Ecorr (corrosion potential) from the PDP curves. EIS was carried out over a frequency domain of 1 kHz to 10 mHz with a ±10 mV AC (alternating current) voltage amplitude under free corrosion conditions (i.e., steady-state OCP). The ZView software package (version 3.2) computed the EIS data. Rationalized equivalent electric circuit models with a fitting statistical error under 5% were used. The models’ physical meanings were schematically explained to elucidate the electrodes’ kinetics. The significance of equivalent electric circuit model rationalization and statistical verification was emphasized in a previous work on deconvoluting EIS profiles [5].

3. Results and Discussion

3.1. CFD Simulation

Figure 4a illustrates the total pressure distribution within the impeller. The total pressure changes from low to high, bypassing the center of the impeller to reach the volute wall because of wake turbulence, leading to an unsteady fluid flow [26,27]. Consequently, a low-pressure area next to the suction surface is followed by a pressure gradient at the blade location towards the high-pressure zone. As seen in Figure 4b, the velocity gradient is the same as total pressure because more space is available for the fluid in areas farther from the center of the impeller due to the higher mass flow rate. The low pressure at the suction inlet decreases the fluid velocity due to geometric constraints from entering the volute [28].
The oxygen solubility increases in the fluid due to increasing pressure, followed by an increased corrosion rate [29,30]. In this case, the fluid turbulence is higher at the trailing edges, which causes more damage [28]. In addition, increasing the fluid velocity leads to faster oxygen access to the metal surface. Suspended solid particles could accelerate corrosion at when the fluid inside the pump experiences high rotational speeds [5]. Thus, increasing the speed around the trailing edge causes more damage to the impeller [31,32]. The corrosion rate directly correlates with temperature because of the increased dissolved oxygen concentration in the fluid, which fosters corrosion kinetics. It is plausible that the extent of corrosion damage positively correlates with the temperature. Due to the increase in total pressure, velocity, and temperature in the areas around the trailing edges, corrosion in this area is expected to be more significant than in other areas. As shown in Figure 5, the failed impeller in the cooling system is further degraded in the trailing edge region, confirming the validity of the simulation results. The cumulative temperature, velocity, and pressure contributions affect the overall corrosion kinetics. As the trailing edges of the impeller are visually more vulnerable to corrosion, it is deduced that the overall synergistic effects of water flow velocity, temperature, and pressure could enhance corrosion kinetics and, thus, the corrosion rate.

3.2. Visual Inspection

The external surface of the impeller was corroded uniformly (Figure 5). The impeller’s external surfaces were not directly exposed to the corrosive electrolyte. The uniform degradation is likely due to atmospheric corrosion, which is not expected to be a significant factor contributing to the premature failure of the impeller because atmospheric corrosion is a slow kinetic phenomenon. The blades’ metal loss, visible corrosion damages, and ruptures and cracks are observed adjacent to the trailing edges (Figure 5). As the simulation results conveyed, the higher velocity and pressure of the turbulent water–electrolyte and excessive dissolved oxygen and temperature around the impeller’s trailing edges foster corrosion damage, metal loss, ruptures, and cracks, consistent with the visual observations.

3.3. Microscopic Examination

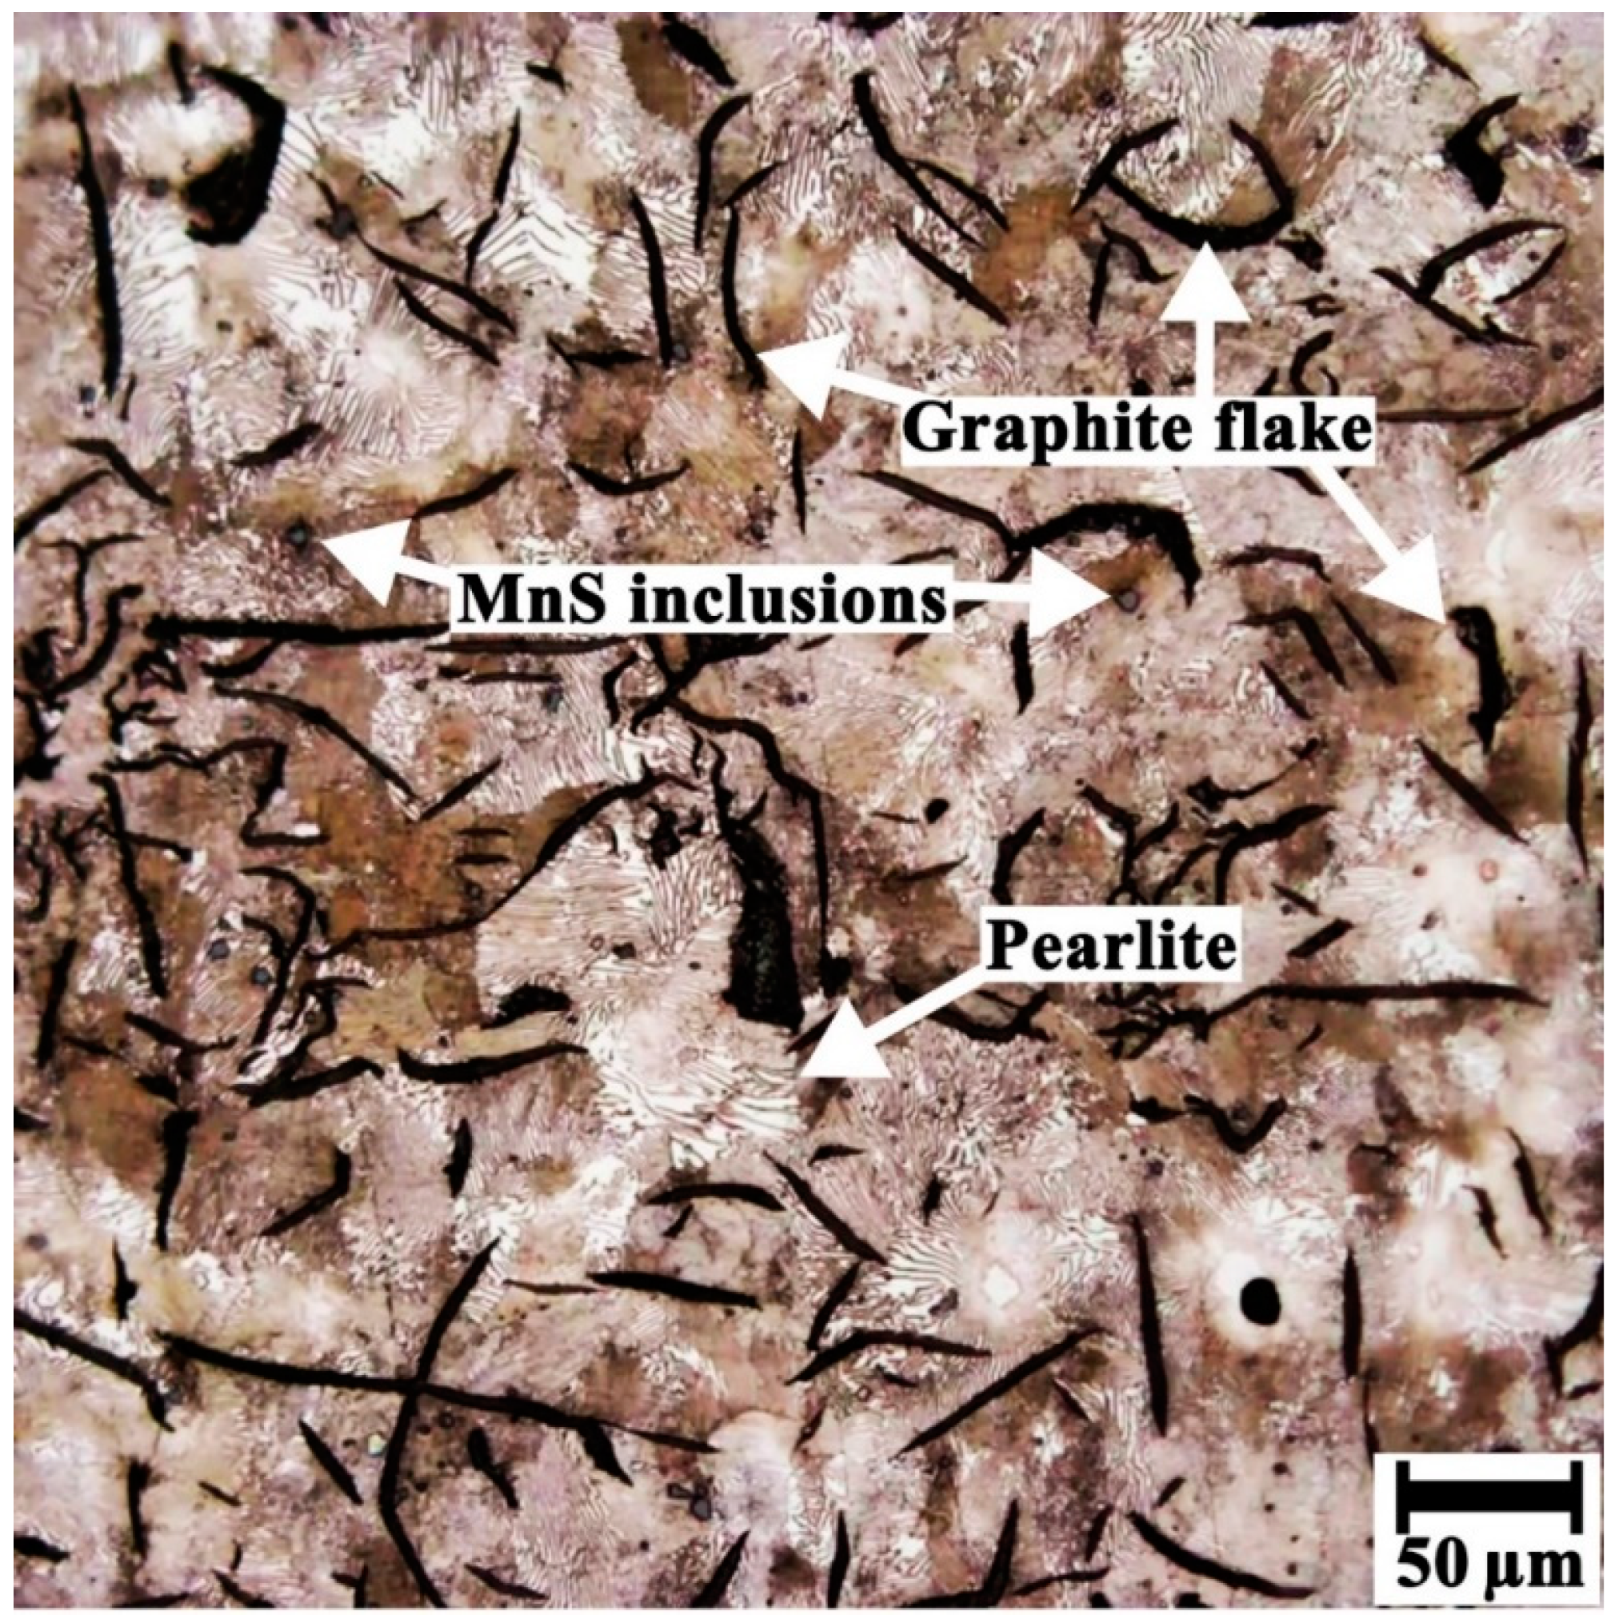
The optical photomicrograph in Figure 6 refers to the brand-new gray cast iron impeller. The microstructure consists of graphite flakes with a size of 10–100 microns in a eutectic pearlitic matrix and a minor content of ferrite phase constituent. It is a typical microstructure for impellers made of gray cast iron [33]. Table 1 shows that the Mo and Mn concentrations are relatively low, eliminating the formation of austenite and bainite phases. Above 98% of the matrix consists of the pearlite phase primarily because of the low Cu content of the cast iron, although Si > 2 wt.% [33,34]. It should be noted that the amounts of C, Si, and S in Table 1 are slightly higher than the normal range reported for gray cast iron [15]. Reportedly, excessive amounts of C and Si reduced the yield strength and hardness of the gray cast iron structure [14]. The high percentage of graphite flakes (Figure 6), due to excessive Si (Table 1), caused the gray cast iron to have a low fatigue resistance [14,35]. An excessive S content (Table 1) causes inclusions, e.g., MnS, in the gray cast iron microstructure [35].
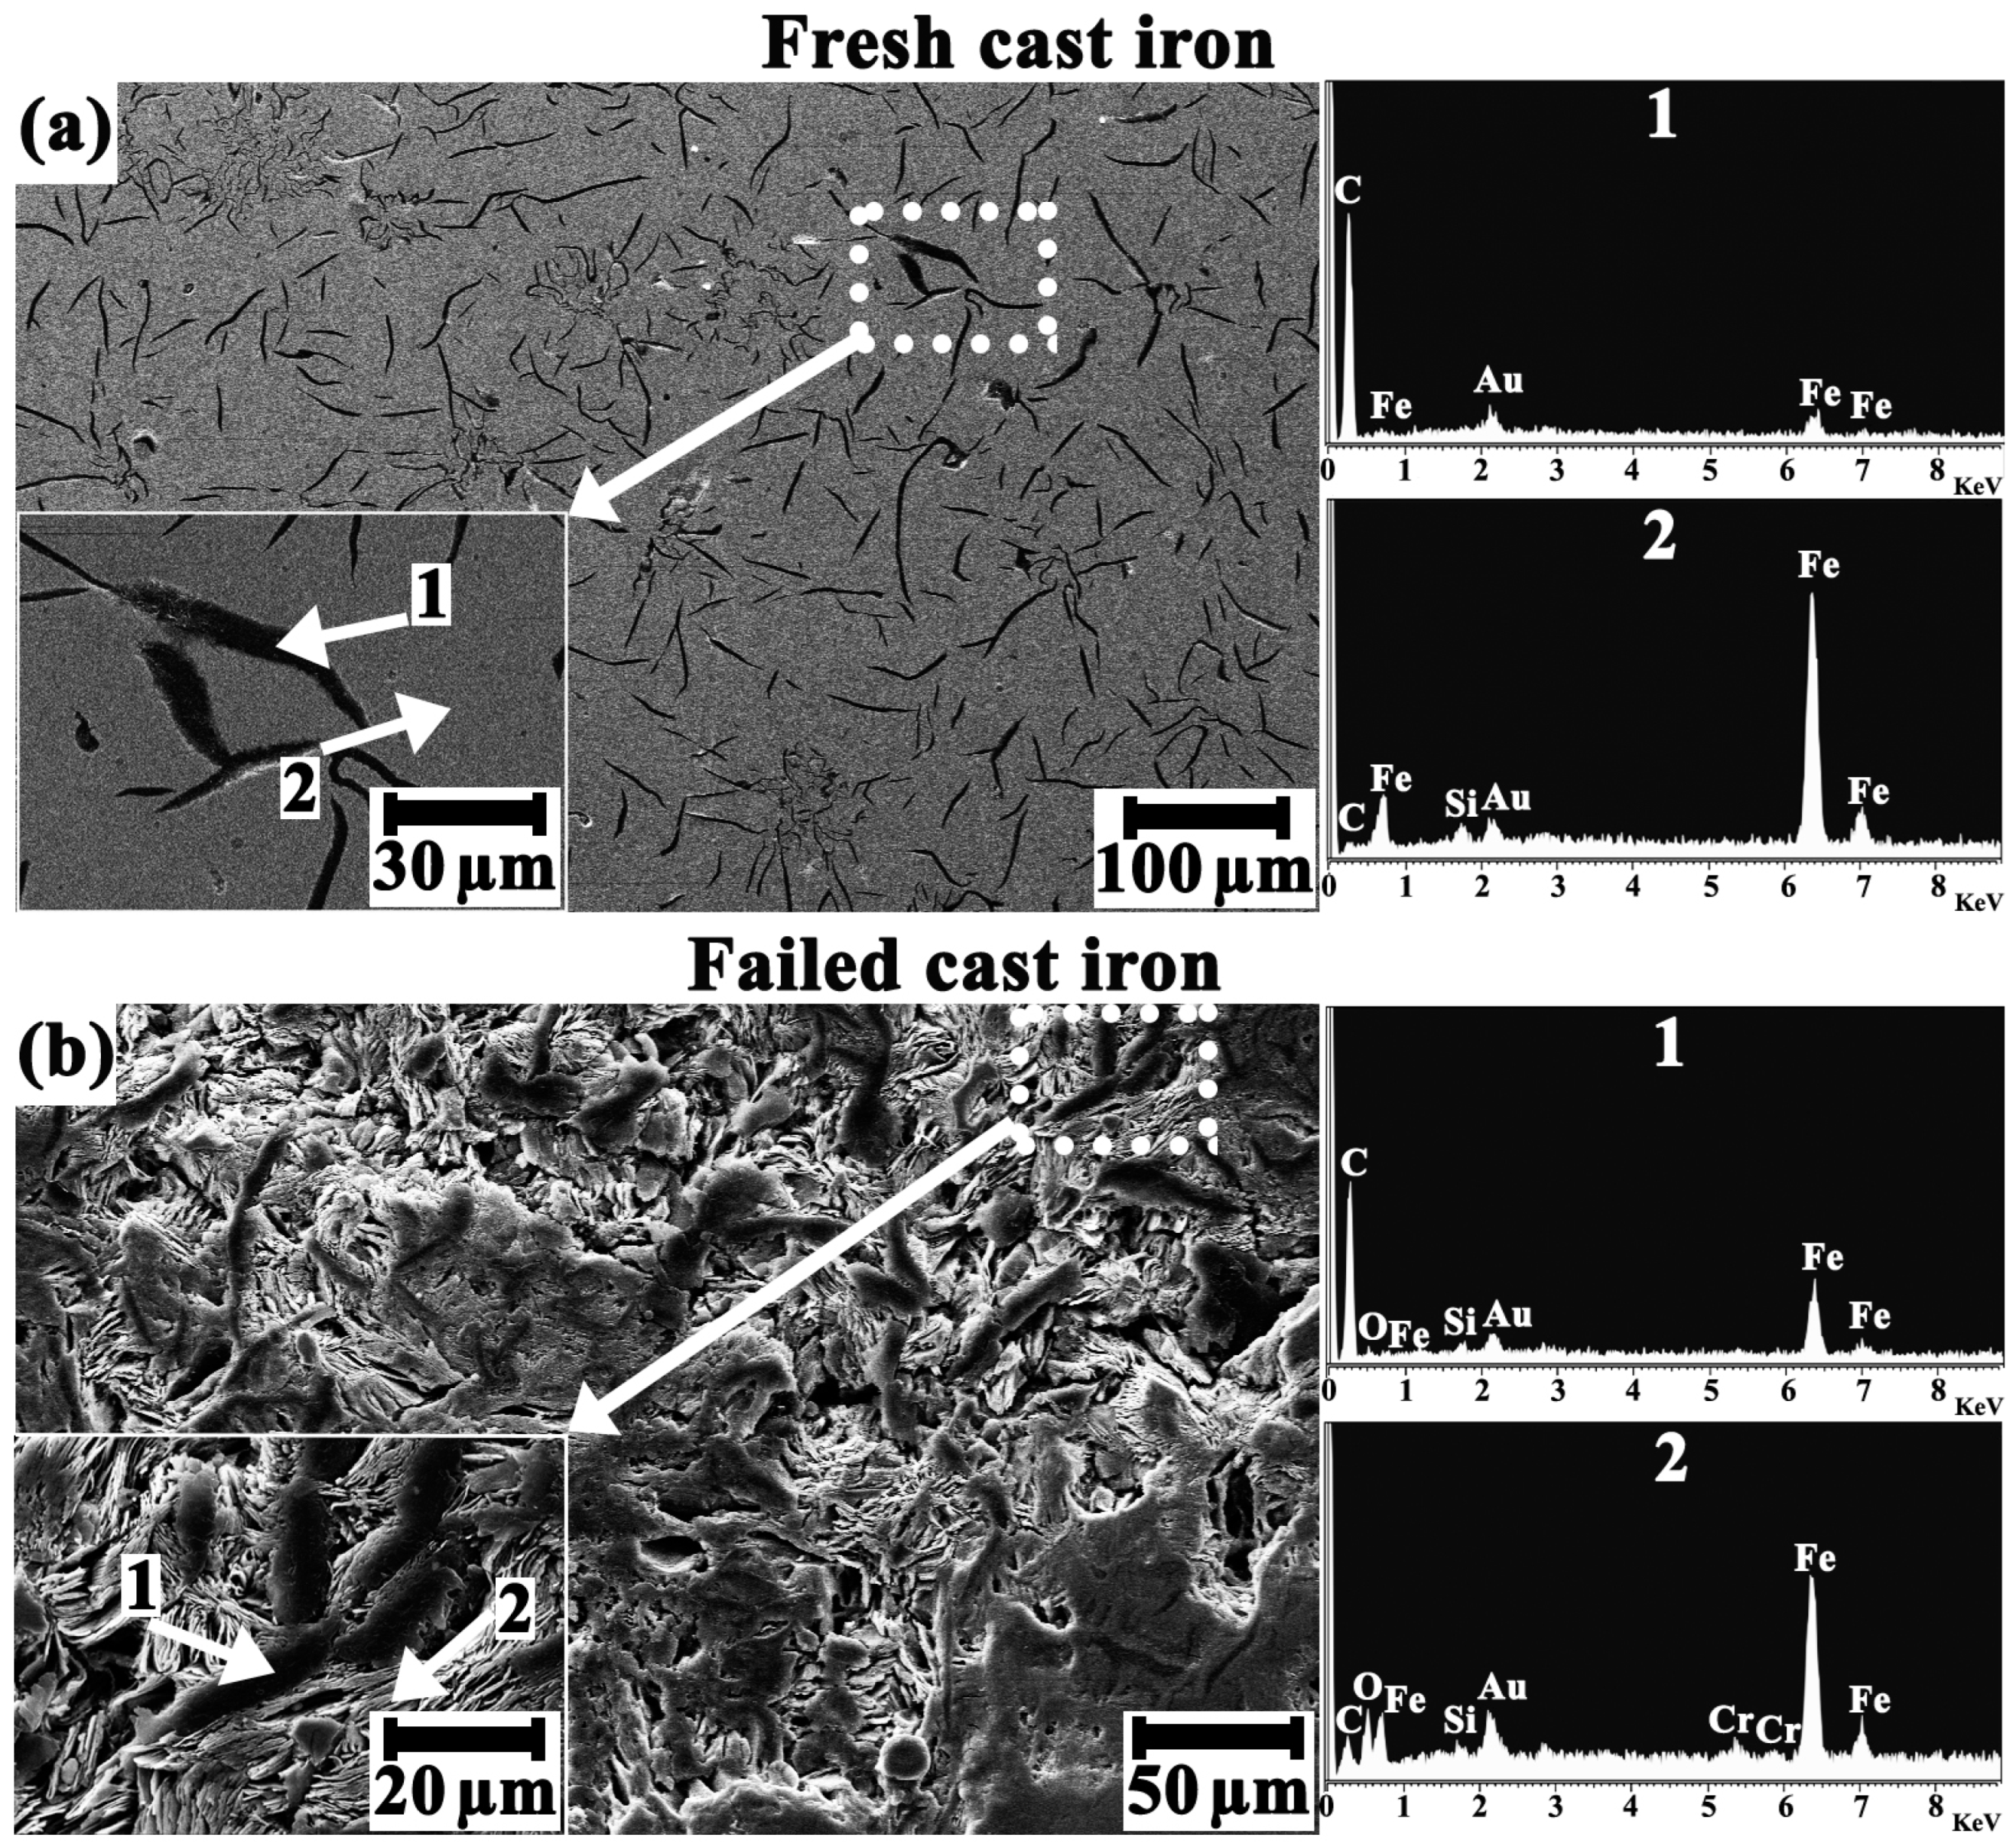
Figure 7 represents the surface morphology and EDX analysis of the intact brand-new and failed gray cast iron impellers, i.e., the interior surfaces exposed to the flowing electrolyte. In Figure 7b, the ferrous matrix of cast iron adjacent to the graphite flakes is corroded, altering the surface morphology. The EDX elemental analysis in Figure 7b confirms that the interior corroded surfaces of the impeller are rich in Fe and O, alluding to rust formation. Arguably, localized galvanic microcells form between graphite flakes (noble cathodic sites) and the pearlitic matrix (active anodic sites), also known as graphitic corrosion [36,37,38]. The microstructure features in Figure 7 are consistent with those reported by Jur et al. [38]. Plausibly, graphitic corrosion accelerates the trailing edges’ degradation, leading to cracks and ruptures in the thinner parts (Figure 5), compromising the component’s integrity, service life, and pump efficiency. Micro-galvanic corrosion (i.e., graphitic corrosion [38]) is the primary mechanism of corrosion attack in gray cast iron in a corrosive environment during its early service life, in agreement with Al-Hashem et al. [37] and Karassik et al. [11]. Due to micro-galvanic corrosion, the cast iron matrix is gradually leached, and intact graphite flakes are exposed to water flow with suspended solid particles, diminishing mechanical properties (i.e., load-bearing capability) and causing metal thickness loss, cracks, and rupture [38].

3.4. Water Chemical Analysis

According to Table 2, mineral elements such as Ca, Na, K, P, S, and Mg can be deposited on the interior surfaces of the impeller and alter the corrosion resistance by changing the surface morphology and interfacial phenomena [23]. The total suspended solids (TSSs) were also measured and are reported in Table 2 as contributing to impeller corrosion. The concentrations of TSSs in the well water and wastewater are 230 and 30.0 mg/L, respectively. The well water, with a relatively higher content of dissolved elements and TSSs, possesses the highest conductivity and water hardness (i.e., the sum of Ca and Mg content), and a more basic pH. The pH difference between the two water samples is insignificant.

3.5. Electrochemical Corrosion Study

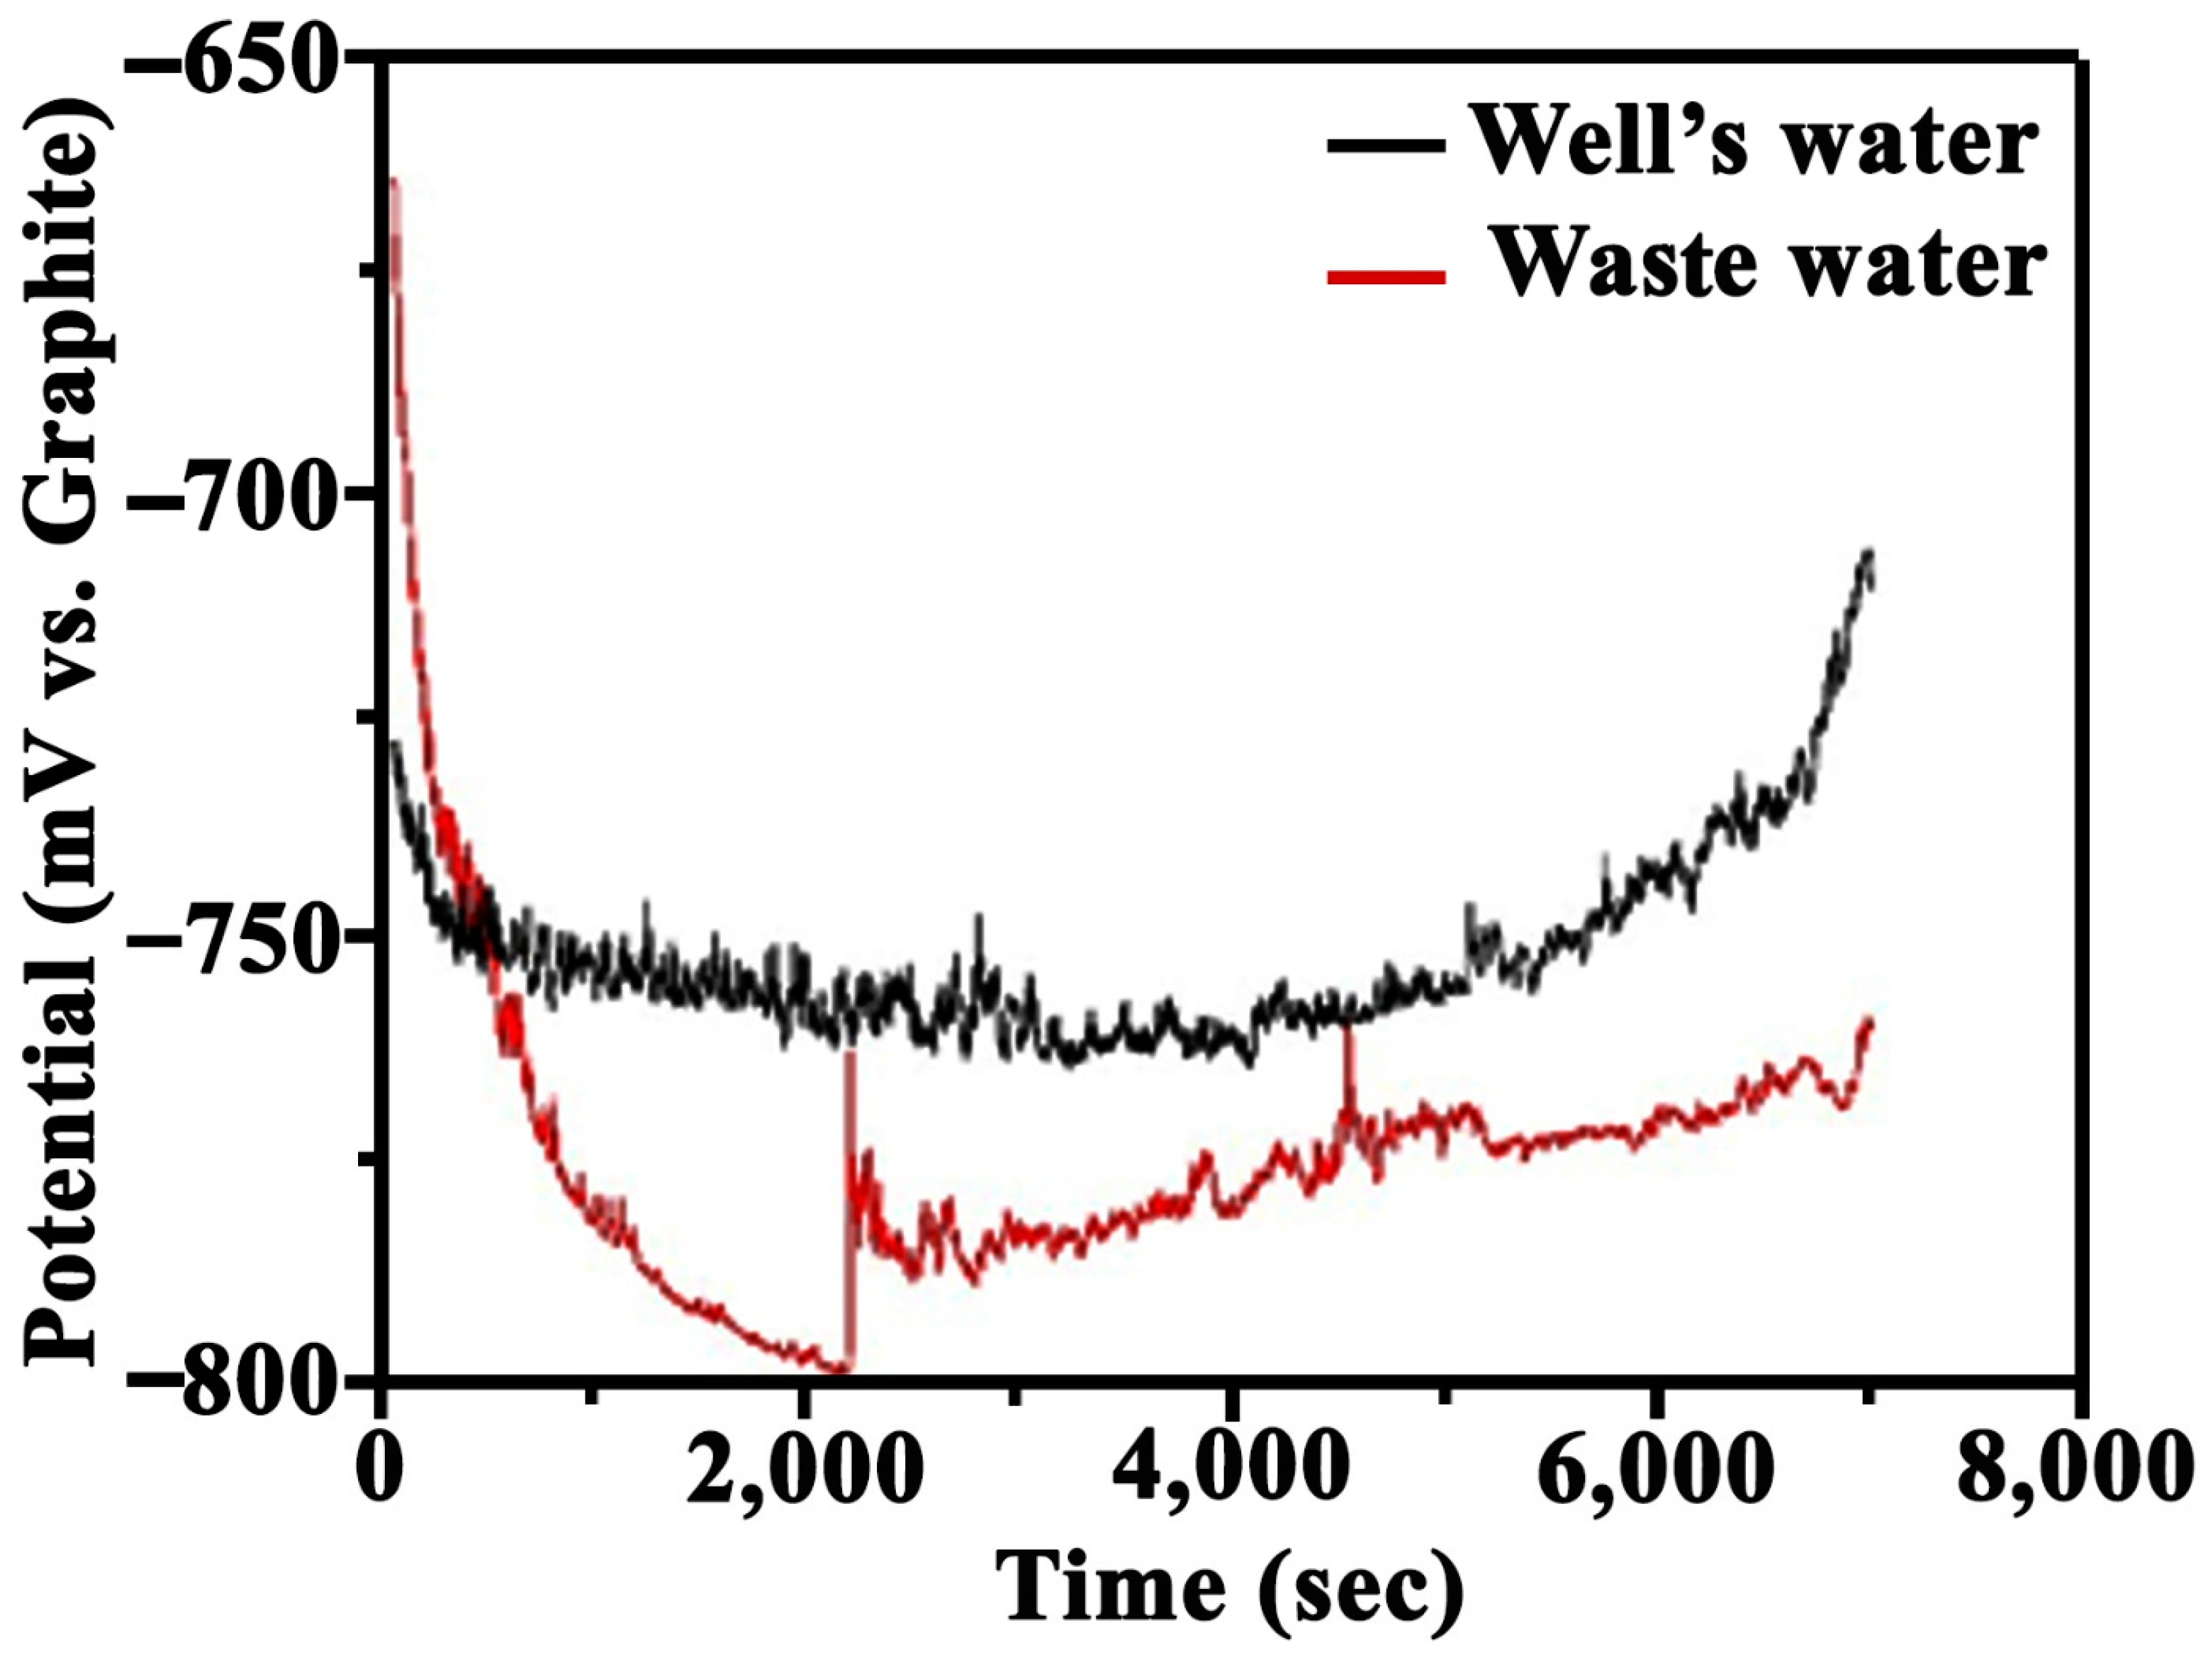
At the onset of immersion (i.e., t = 0 s in Figure 8), the corrosion potential of the gray cast iron in the well water is more active than that in the wastewater. With continued immersion at 85 °C, after approximately 500 s, the OCP value corresponding to the wastewater reaches a more negative potential than the well water. With longer immersions, the OCP in the well water shifts toward more noble values (higher potentials) than the wastewater (Figure 8). Over the initial 2 h immersion test in the stagnant electrolyte, the OCP values declined at the beginning of the working electrode’s exposure to the electrolytes due to the onset of electrochemical corrosion reactions within the first 2000 s of immersion (Figure 8).
At this stage, the oxide scale (corrosion product layer) is gradually developed with partial surface coverage. At immersion times of about 2000 to 5000 s, the OCPs fluctuate within a narrower potential window of about 25–50 mV (i.e., a more stable OCP) due to a steady state condition at the electrochemical interface and the progressive growth of a non-protective anodic film on the electrode surfaces, i.e., (Fe, O)-rich oxide corrosion products. In immersion times of 5000 s and above, the OCP curve in the well water moves towards a nobler direction, alluding to the progressive formation of oxide scales due to ongoing redox reactions. This indicates that gray cast iron’s behavior in the well water is more active than that in wastewater during prolonged immersion. The negative OCPs indicate the working electrode’s tendency to actively corrode without the application of an external overpotential to the electrochemical cell under the free corrosion condition (|ηc| = ηa = 0) [39]. From a thermodynamic standpoint, a decrease in the OCP indicates a decrease in the activation energy required to exchange electrons in redox reactions occurring at the electrode/electrolyte interface, followed by an increase in the probability of corrosion [40]. However, the OCP could not determine the corrosion kinetics [40].
Figure 9 showcases optical photomicrographs of working electrodes exposed to stirring wastewater (a–c) electrolytes and the well water (d–f). The working electrodes were exposed to the stirred electrolytes under free corrosion conditions for (a,d) 5 min, (b,e) 30 min, and (c,f) 60 min, revealing their corrosion mechanisms and the morphologies of the corroded surfaces. The corroded surface morphology indicates the progressive formation of scales (corrosion products). Accordingly, the corrosion attacks are more severe on the working electrode exposed to the well water due to the higher kinetics of oxide scale formation. The reddish layer on the surface corresponds to rust formation [23,41]. Figure 10 shows the PDP curves of the working electrodes. Figure 11 and Figure 12 depict the extrapolation of the linear portion of the anodic branch and the selected points for drawing the tangent lines to quantify corrosion kinetics according to the Tafel extrapolation technique.
Due to their noble nature, graphite flakes in the iron matrix altered the cathodic current density when the working electrode is polarized cathodically due to different dissolved ions in the electrolytes (Table 2), possibly introducing errors into the corrosion current density values determined using the Tafel extrapolation technique. Consequently, only anodic branches of the curves were extrapolated to extract electrochemical parameters (i.e., Ecorr, icorr, and βa) from the PDP curves (Table 3). It was essential to eliminate the risk of a systematic error in corrosion kinetics calculations [42]. The Stern–Geary equation, Equation (1), was utilized to calculate polarization resistance (Rp) values using icorr and βa parameters following ASTM G102-89 standard specifications [43].
R P = β a 2.303 × i c o r r
Overall, the corrosion current density of the working electrodes in the well water is higher than that in the wastewater for identical exposure times. The trend is consistent with the observations in Figure 9 and the trends in the Rp values in Table 3. The tabulated results in Table 2 also indicate the higher corrosivity of the well water. In Table 3, the icorr decreases, and Rp increases with increasing exposure times in the electrolytes, corresponding to the progressive growth of anodic films. Nevertheless, the variation in the corrosion potentials is negligible.
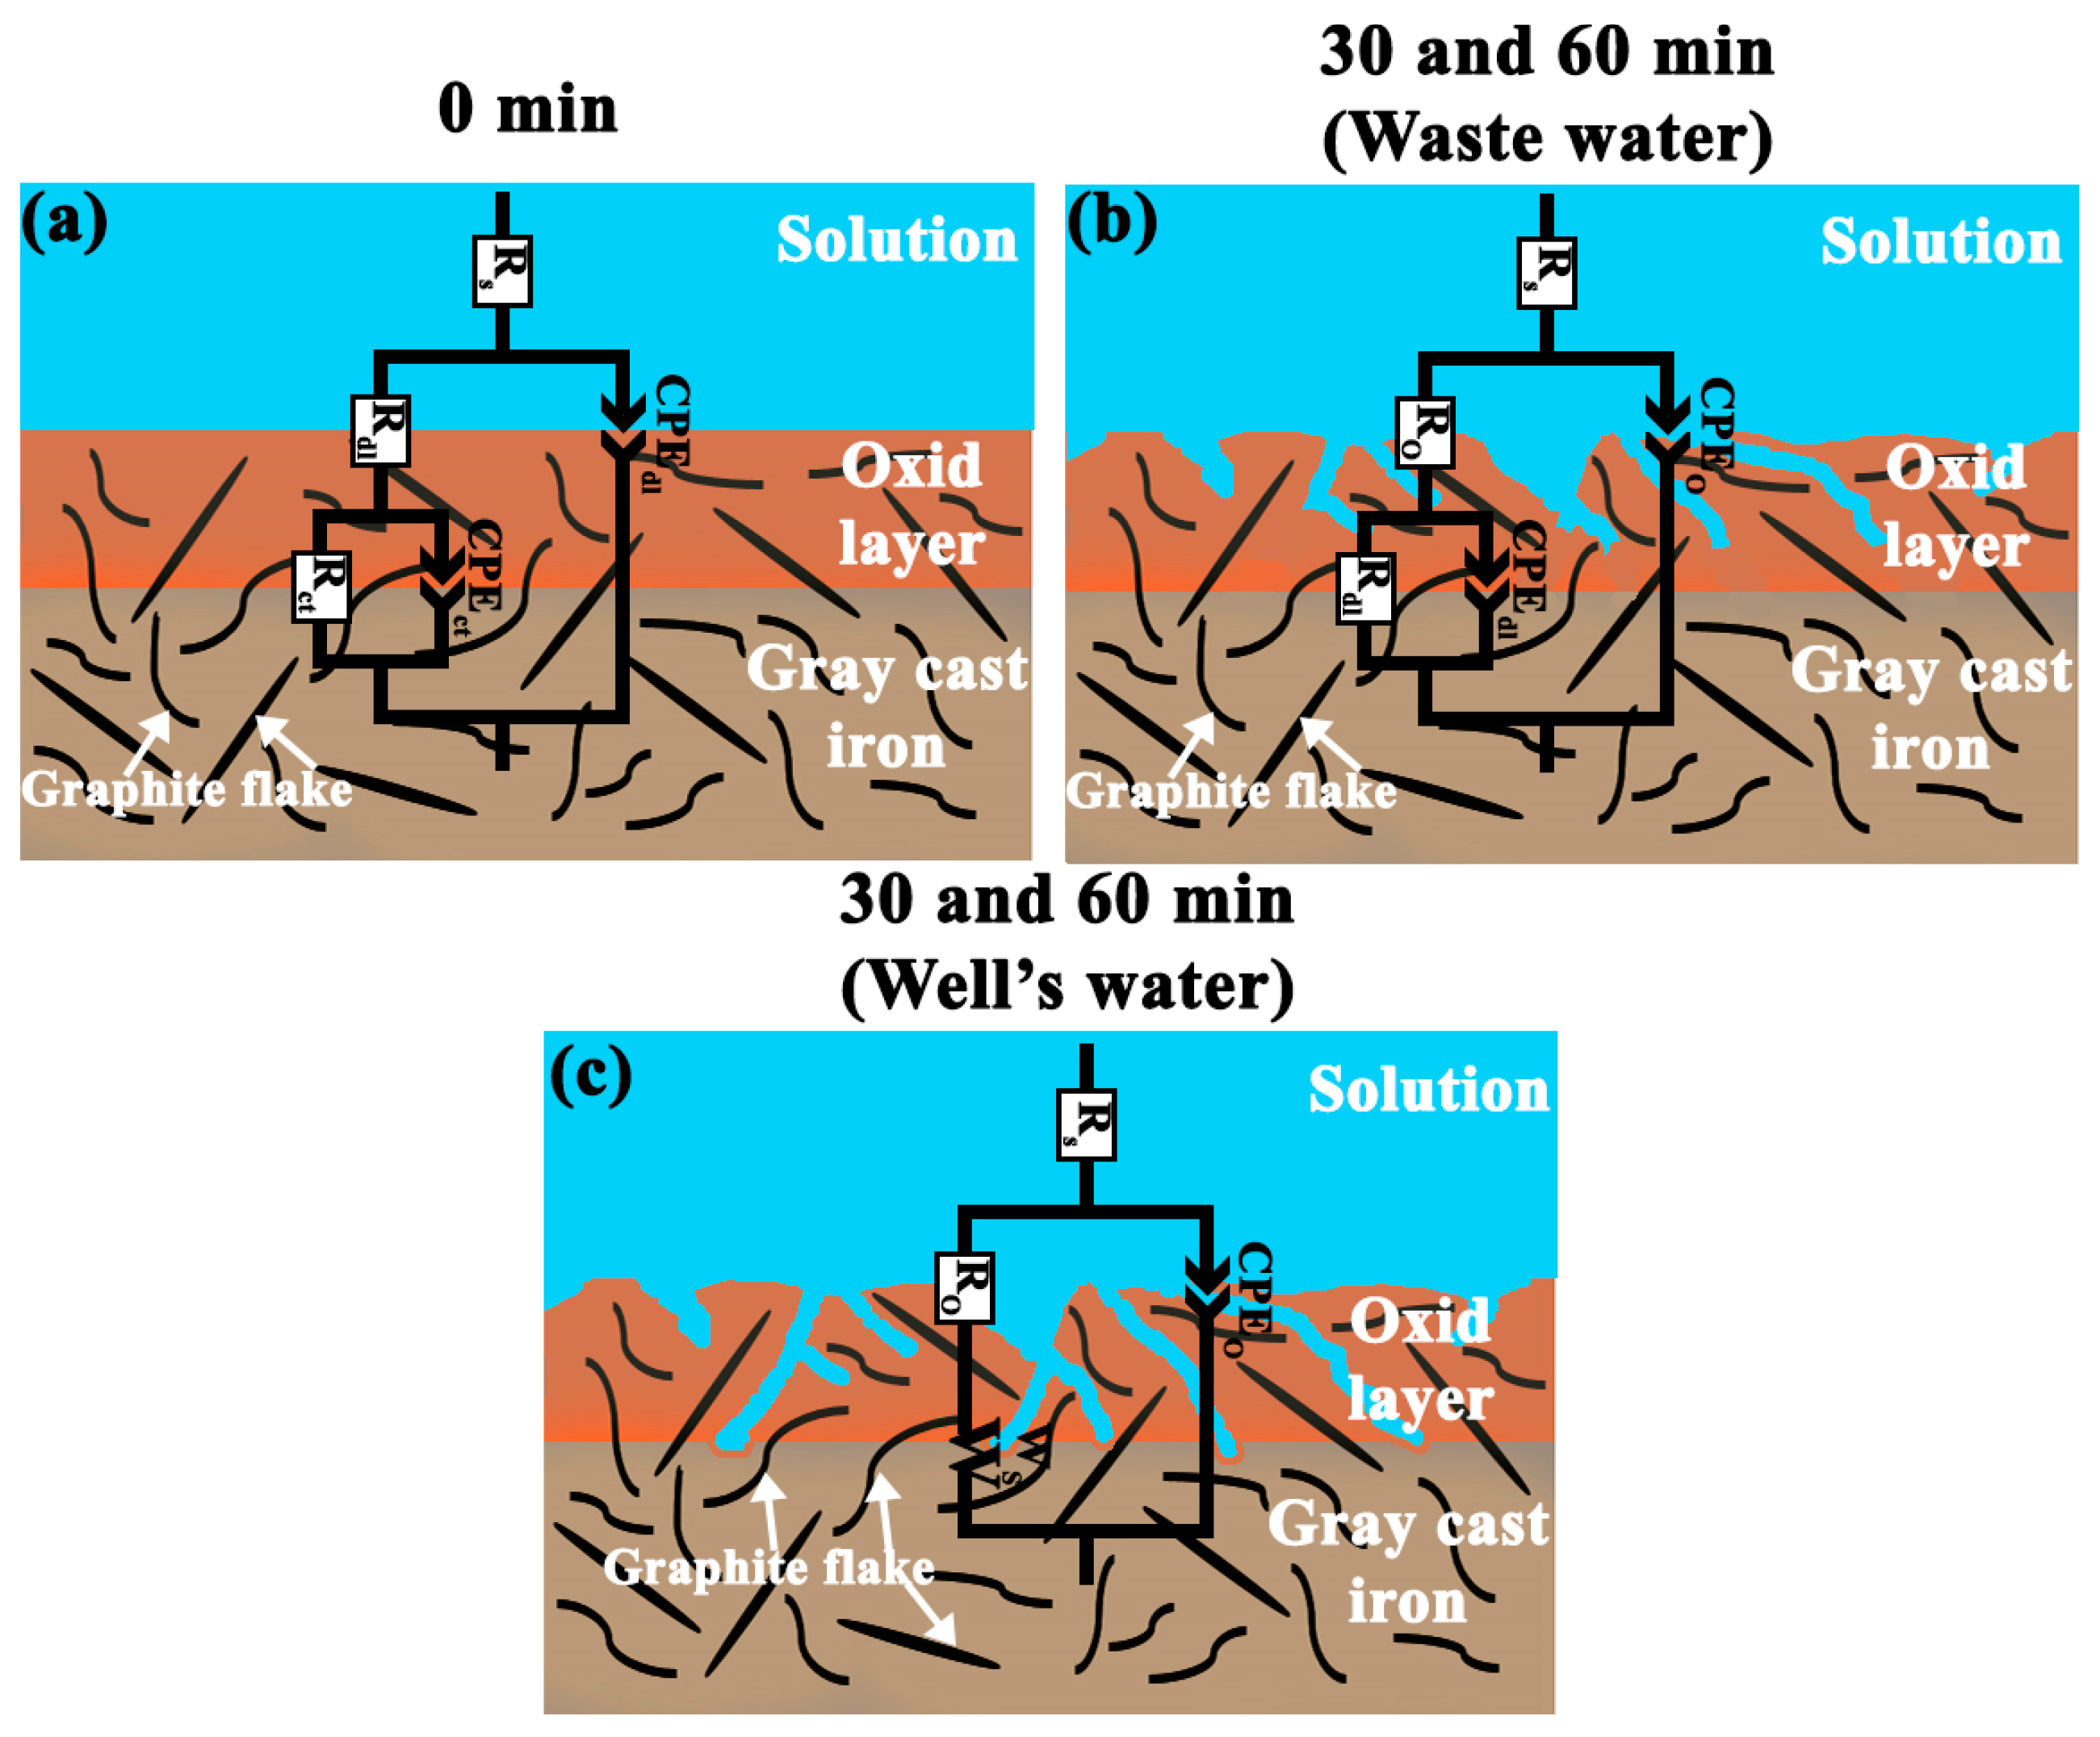
Figure 13 shows the EIS spectra of gray cast iron working electrodes in the wastewater and well water electrolytes. The EIS profiles include Nyquist plots and Bode plots of total impedance magnitude and phase angle. The critical frequencies are labeled on the Bode plots of the phase angle corresponding to the critical time constants emerging at the electrochemical interface. The equivalent electrical circuits (Figure 14) simulate the EIS profiles, allowing us to calculate the EIS model parameters presented in Table 4. The EIS profiles fit into a porous scale model considering the relatively non-conductive, porous iron oxide scale formed on the gray cast iron working electrodes. The physical representation of the EIS models in Figure 14 visualizes the electrochemical phenomena attributed to relatively compact (0 min) and porous scales (30 and 60 min). In other words, EIS quantifies the electric features of the oxide scale evolving on the working electrode surfaces and the electrochemical response of the working electrode interface with the electrolyte. It elucidates the interfacial rate-controlling phenomena (electrode kinetics) and the physical nature of the scales. Orazem and Tribollet described the principles of EIS deconvolution corresponding to porous scales [44], as discussed in our previous work [5].
The depressed semicircle-like shape of the Nyquist plots in Figure 13a,c was caused by an interfacial redox reaction’s response to small sinusoidal potential perturbation. The Nyquist plot’s depression corresponds to the non-ideal capacitive behavior of the iron oxide layer [45]. Plausibly, a constant phase element (CPE) appears in the equivalent electric circuit models (Figure 14) defined by the parameters of Q, R, and n (Table 4), statistically enhancing the mathematical fitting results in contrast to a pure capacitive behavior (C). The time-constant distribution at the electrode interface could explain CPE emergence [44,46]. The addition of CPE to the equivalent electric circuit model showcases a non-ideal impedance response, resulting in a deviation from the pure capacitive behavior of the ideal capacitor [5,44]. In the gray cast iron working electrodes, surface heterogeneities such as graphite flakes, inclusions, and inhomogeneous pearlitic microstructure could initiate the distribution of surface properties such as conductivity, roughness, and porosity. The electrode’s surface inhomogeneities and roughening caused by progressive surface etching (corrosion) promote nonuniform interfacial mass transfer and distribution of interfacial time constants, thus promoting a CPE response [5]. As a result, the CPE’s physical interpretation could be justified, validating the EIS models (Figure 14). Equation (2) represents the mathematical expression of CPE impedance corresponding to a blocking electrode. The Q and n variables are frequency-independent [5,44]. The angular frequency (rad/s) is represented by ω , and Re stands for ohmic resistance [5,44]. The sn/Ω cm2 or F/s(1−n) cm2 are the units of the Q (n < 1) [5,44]. The Q parameter could also be expressed in F/cm2 (n = 1) [47,48]. An ideal capacitance emerges in this circumstance, replacing CPE [5].
Z ω = R e + 1 ( j ω ) n Q
Table 4 shows the electrolytic solution resistance between working and pseudo-reference electrodes (Rs). Rdl stands for charge transfer resistance at the end of the pores within the emerging oxide scale, as shown in Figure 14. Corrosive species penetrate the open pores throughout the porous iron oxide layer, reaching the cast iron. R o represents the pore resistance corresponding to the iron oxide scale. Figure 9 confirms the formation of an iron oxide layer on the working electrodes in the wastewater and the well water. In addition, Qdl and Cdl represent the double-layer capacitance. The electrochemical double layer forms at the end of the emerging open pores within the oxide scale, wherein the penetrated electrolyte reaches the cast iron. Overall, Qdl and Rdl are attributed to the penetration of electrolytes into the oxide layer and graphite branches [48]. Q o and C o represent the capacitive behavior of the iron oxide scale (Figure 14). The n parameter in Table 4 is related to the depression of the semicircles in the corresponding Nyquist plots (Figure 13). The n value varies between 0 and 1. It has no established physical expounding [5]. By increasing n, the deviation of CPE from pure capacitive behavior decreases [5,44]. The n parameter is primarily affected by surface roughness [5,44]. In the present case, graphitic corrosion affects the surface roughness. In Table 4, the porous iron oxide scale’s deviation from pure capacitive behavior is more significant at the 30 and 60 min test points than the 0 min test point because of the lower n o values corresponding to the progressive formation of the porous scale. Overall, at identical test points, the lowest n o values belong to the well water. This could allude to enhanced graphitic corrosion kinetics in the well water than the wastewater, correlating with the PDP findings.
According to the R o values in Table 4 for the 30 and 60 min test points, the pore resistance ( R o ) of the iron oxide layer against the penetration of corrosive species is higher in wastewater, indicating enhanced corrosion kinetics in the well water. This is consistent with the icorr trend in Table 3 and the trend observed in the values of n o in Table 4. Concerning the well water, a sudden significant increase in Q o , at 30 and 60 min test points compared to the 0 min test point, indicates an improved interfacial charge transfer, alluding to enhanced corrosion kinetics. The pore resistance ( R o ) variation in the well water is negligible compared to the wastewater, indicating progressive corrosion at different test points in the well water, i.e., relatively fast corrosion kinetics.
Concerning the 30 and 60 min test points in the wastewater in Figure 13a,b, two depressed capacitive loops are noticeable in the Nyquist plots, supported by two shoulders in the bode plots of phase angle. The iron oxide scale’s shoulder corresponding to the dielectric properties appears at high-to-medium frequencies, and the depressed shoulder represents dielectric properties of the electrochemical double layer at lower frequencies (Figure 13b) at the 30 and 60 min test points. An asymmetric shoulder at high-to-medium frequencies is evident at the 30 and 60 min test points (Figure 13b) because of the significantly higher pore resistance values at 30 and 60 min test points compared to the 0 min test point in the wastewater (Table 4). Concerning the 0 min test point (Figure 13a,b), only one capacitive loop in the Nyquist plot and one relatively symmetrical maximum in the frequency range of 0.13 to 0.06 Hz in the Bode plot are visible, which can be attributed to the double layer’s dielectric properties. In other words, no shoulder corresponding to the iron oxide scale at the 0 min test point appears in the Bode plot of phase angle (Figure 13b) because it is masked by a relatively sizeable symmetrical maximum associated with the double-layer capacitance. As noticed in Table 4, Rdl (912.7 Ω cm2) is significantly higher than R o (60.14 Ω cm2) for the 0 min test point in the wastewater electrolyte. The shape of the EIS profiles and the equivalent electrical circuit models indicate that the kinetic control mechanism is predominant at the OCP (free corrosion condition) at the 0 min test point for both the well water and wastewater and the 30 and 60 min test points for the wastewater only. The principles of deducing the rate-controlling mechanism from corresponding equivalent electric circuits and the shape of the EIS profiles were discussed in our previous works [5,39].
The electrochemical corrosion of gray cast iron in the well water and wastewater is a faradaic reaction. Thus, the effective capacitance values (Cdl and C o ) reported in Table 4 were calculated from the CPE parameters (Q, n, and Re) via Equation (3) proposed by Brug et al., as mentioned elsewhere [5]. The formula applies to faradaic systems and blocking electrodes [49].
C e f f = Q × R e ( 1 n ) 1 n
It has been argued that the minimum number of time constants (RC) in an electrochemical interface could be determined by assessing the emerging maxima and corresponding shoulders in the Bode phase angle plot for a faradaic system [50,51]. Accordingly, the Nyquist plot and Bode plots of the phase angle and total impedance magnitude must be considered to holistically derive a rationalized equivalent electric circuit model for deconvoluting a particular electrochemical system [39,52]. The phase angle deviation from 90 degrees in the Bode plots of phase angle (Figure 13b,d) accounts for surface roughness, relaxation effects, porosity mass transport effects, and the frequency dispersion of time constants caused by local inhomogeneities in a dielectric material (e.g., scales or corrosion products) [50,51]. Accordingly, surface inhomogeneities due to graphite flakes and a pearlite–ferrite microstructure with MnS inclusions and diffusional mass transport effects through evolving porous scales are the possible causes of phase angles below 40 degrees in the present study. The mass transport effect throughout the porous scale mainly arises in the well water. A short Warburg impedance appears in the EIS spectra (Figure 13c,d) and the corresponding equivalent electrical circuits (Figure 14c), indicating diffusion and mass transfer effects which mainly emerge at very low frequencies [5].
Figure 13c,d show a diffusive tail in the low-frequency range, alluding to the short Warburg impedance response of the working electrodes immersed in the well water at the 30 and 60 min test points. The diffusional impedance, i.e., short Warburg element (Ws), in the equivalent electrical circuit in Figure 14c, corresponds to nonuniform diffusion on the gray cast iron impeller through multiple mass transport paths in the porous iron oxide scale evolving on the working electrodes [5,53]. Accordingly, the redox reactions are under a mixed mechanism of diffusion–kinetic control at the working electrode interface with the well water at the 30 and 60 min test points. These findings indicate that the evolving oxide scale on the gray cast iron impeller operating in the well water is less protective than that of the wastewater under an identical corrosion mechanism, i.e., graphitic corrosion.
Z W s = R W s × tanh [ j ω T W s n W s ] ( j ω T W s ) n W s
Table 4 reports the Ws parameters of R W s (Ω cm2), n W s , and T W s (second) deduced from the EIS profiles deconvolution. Equation (4) presents the mathematical expression of the short Warburg impedance [54]. The physical interpretations of the short-range Warburg coefficient ( R W s ), T W s , and n W s parameters and their correlation with the characteristics of a porous layer remain controversial [5]. Equation (5) is the mathematical relationship of T W s with the d variable (i.e., effective diffusion thickness) and D parameter (i.e., the effective diffusion coefficient of diffusive corrosive species in the electrolyte) [5,54]. Calculating or measuring the absolute values of the d and D variables in the electrolytes presented in Table 2 with complex chemical composition is not practically viable. Multiple chemical species in the electrolytes are likely to contribute to electron exchange in redox reactions at the electrochemical interface.
T W s = d 2 D
The results showcased how an industrial unit’s water sourcing plan could unexpectedly alter corrosion rate-controlling steps, and thus pump integrity and lifespan, under identical corrosion mechanisms, as diffusional Warburg impedance behavior emerged in the groundwater medium sourced from boreholes rather than the wastewater. The findings emphasized that industrial units must exercise due care in sourcing water, wherein the ZLD program has been implemented in dry geographic zones of the world to protect the integrity of centrifugal process water pumps in critical applications such as cooling systems.

4. Conclusions

  • The premature electrochemical corrosion failure of a single-suction centrifugal water pump impeller made of gray cast iron operating at 85 °C was investigated experimentally and numerically in two electrolytes, including groundwater (well water) and treated wastewater. The groundwater was more contaminated with Ca, Mg, Na, Si, and S elements and possessed a higher conductivity, hardness, and pH (basic) and more suspended solids than the wastewater.
  • According to the CFDs simulation results, increased total fluid pressure, velocity, and temperature at the trailing edges, i.e., turbulent flow regions, exacerbated the corrosion of the impeller blades, causing ruptures and cracks in the areas adjacent to the trailing edges, visually verified.
  • In essence, emerging micro-galvanic cells between graphite flakes (noble cathodic sites) and the pearlitic matrix (active anodic sites) promoted the graphitic corrosion of the impeller blades.
  • A porous-scale equivalent electrical circuit with two parallel time constants deconvoluted the EIS profiles of the gray cast iron impeller. The EIS profiles showed the non-ideal capacitive behavior of the iron oxide layer caused by the distribution of surface properties such as conductivity, roughness, and porosity due to the inhomogeneous microstructure of the gray cast iron.
  • A kinetic control electrochemical mechanism was predominant at the electrochemical interface under free corrosion conditions at (a) the 0 min test point for both the well water and wastewater and (b) the 30 and 60 min test points for the wastewater.
  • A mixed diffusion–kinetic control electrochemical mechanism emerged under free corrosion conditions (OCP) in the well water at the 30 and 60 min test points because a short Warburg diffusional impedance emerged in the corresponding equivalent electrical circuit supported by a diffusive tail in the bode plots of phase angle at low frequencies.

5. Recommendations

  • This study showed the significance of establishing an integrated water treatment strategy in industrial units that employ rotating equipment such as pumps to improve equipment integrity and service life. According to Zahrani [23], sustainable wastewater treatment can reduce water corrosivity by controlling pH, hardness, and total suspended solids and eliminating dissolved Ca, Mg, Na, Si, and S elements.
  • Despite its low cost and ease of fabrication, gray cast iron suffers from poor mechanical properties and corrosion resistance due to inhomogeneous microstructure and flake graphite [33,34,55]. Considering more durable materials with improved mechanical and corrosion properties could be an option in critical applications despite higher manufacturing and materials costs, which might be a significant shortcoming in the Global South. Some alternative alloys for manufacturing centrifugal water pump impellers discussed in the literature were as follows: Cu-Al alloys [56], Zn [57], bronze [57], 17-4PH stainless steel [58,59], and ductile Ni-resistant cast iron [60]. Except for ductile Ni-resistant cast iron, which could be recommended for general applications due to its reasonable cost, the other alternative alloys could be considered for more advanced critical applications wherein process safety and integrity requirements support costly material options. Pitting corrosion resistance and quality of the alloys are important considerations when applying active-passive alloys, e.g., stainless steel, in water pump impellers [61].

Author Contributions

M.M.J.: Investigation, Formal Analysis, Writing—Original Draft. E.K.: Investigation, Formal Analysis, Software, Writing—Original Draft, A.H.N.N.: Investigation, Formal Analysis, Software, Data Curation, Visualization. E.M.Z.: Conceptualization, Investigation, Methodology, Formal analysis, Data curation, Validation, Visualization, Supervision, Project administration, Resources, Funding acquisition, Writing—Original Draft, Writing—Review and editing. A.A.: Writing—Review and Editing. All authors have read and agreed to the published version of the manuscript.

Funding

The Ferdowsi University of Mashhad financially supported this work (Grant No. FUM-2102).

Data Availability Statement

The raw data required to reproduce the findings have already been included in the present paper.

Acknowledgments

Amir Hossein Noorbakhsh Nezhad acknowledged FUM for providing a research assistantship grant (No. FUM-40968).

Conflicts of Interest

The authors declare that they have no known competing financial interests or personal relationships that could have appeared to influence the work reported in this paper.

References

  1. Ibrahim, A.O.; Ighodaro, O.O.; Fasogbon, S.K.; Orumwense, E.F.; Waheed, M.A. Failure investigation of the tube of a dual fired steam boiler in a western nigerian food and beverage manufacturing plant. Eng. Fail. Anal. 2023, 143, 106906. [Google Scholar] [CrossRef]
  2. Ro, Y.; Choi, W.S.; Park, H.; Shin, K.C. Failure analysis of casting Ni-Cr-Mo impeller after long-term weak acid exposure. J. Fail. Anal. Preven. 2024, 24, 510–519. [Google Scholar] [CrossRef]
  3. da Silveira, N.N.A.; Meghoe, A.A.; Tinga, T. Integration of multiple failure mechanisms in a life assessment method for centrifugal pump impellers. Adv. Mech. Eng. 2023, 15, 18. [Google Scholar] [CrossRef]
  4. Yu, T.; Shuai, Z.; Jian, J.; Wang, X.; Ren, K.; Dong, L.; Li, W.; Jiang, C. Numerical study on hydrodynamic characteristics of a centrifugal pump influenced by impeller-eccentric Effect. Eng. Fail. Anal. 2022, 138, 106395. [Google Scholar] [CrossRef]
  5. Nezhad, A.H.N.; Zahrani, E.M.; Alfantazi, A.M. Erosion-corrosion of electrodeposited superhydrophobic Ni-Al2O3 nanocomposite coatings under jet saline-sand slurry impingement. Corros. Sci. 2022, 197, 110095. [Google Scholar] [CrossRef]
  6. Zhao, S.; Jing, Y.; Liu, T.; Zhao, W.; Li, F. Corrosion behavior and mechanism of carbon steel in industrial circulating cooling water system operated by electrochemical descaling technology. J. Clean. Prod. 2024, 434, 139817. [Google Scholar] [CrossRef]
  7. Stringer, L.C.; Mirzabaev, A.; Benjaminsen, T.A.; Harris, R.M.B.; Jafari, M.; Lissner, T.K.; Stevens, N.; der Pahlen, C.T.-V. Climate change impacts on water security in global drylands. One Earth 2021, 4, 851–864. [Google Scholar] [CrossRef]
  8. Zhao, Y.; Wang, Y.; Zhang, M.; Li, M.; Zhao, Z.; Liu, L. Failure analysis of the outlet pipeline and ball valve of the circulating pump in the desulfurization liquid concentration tower. Eng. Fail. Anal. 2024, 161, 108338. [Google Scholar] [CrossRef]
  9. Kannaujia, V.; Bhore, S.P.; Goyal, H.S. A case study on the failure analysis of 1 hp house hold electrical submersible pump in Prayagraj India. Eng. Fail. Anal. 2024, 156, 107742. [Google Scholar] [CrossRef]
  10. Pan, H.; Li, D.; Hu, H. Failure analysis of mechanical seal of nitrobenzene sulfuric acid pump. Eng. Fail. Anal. 2022, 141, 106660. [Google Scholar] [CrossRef]
  11. Karassik, I.J.; Messina, J.P.; Cooper, P.; Heald, C.C. Pump Handbook, 4th ed.; McGRAW-HILL: New York, NY, USA, 2008; Available online: https://www.accessengineeringlibrary.com/content/book/9780071460446 (accessed on 20 February 2021).
  12. Park, I.-C.; Kim, S.-J. Effect of pH of the sulfuric acid bath on cavitation erosion behavior in natural seawater of electroless nickel plating coating. Appl. Surf. Sci. 2019, 483, 194–204. [Google Scholar] [CrossRef]
  13. Yu, R.; Liu, J. Failure analysis of centrifugal pump impeller. Eng. Fail. Anal. 2018, 92, 343–349. [Google Scholar] [CrossRef]
  14. Myszka, D. Cast iron–based alloys. In High-Performance Ferrous Alloys; Radhakanta, R., Ed.; Springer: Cham, Switzerland, 2021; pp. 153–210. [Google Scholar] [CrossRef]
  15. Stefanescu, D.M. (Ed.) Corrosion of Cast Irons, Cast Iron Science and Technology. In ASM Handbook; ASM International: Novelty, OH, USA, 2017; Volume 1A, pp. 502–510. [Google Scholar] [CrossRef]
  16. Spence, R.; Amaral-Teixeira, J. A CFD parametric study of geometrical variations on the pressure pulsations and performance characteristics of a centrifugal pump. Comput. Fluids 2009, 38, 1243–1257. [Google Scholar] [CrossRef]
  17. Yousefi, H.; Noorollahi, Y.; Tahani, M.; Fahimi, R.; Saremian, S. Numerical simulation for obtaining optimal impeller’s blade parameters of a centrifugal pump for high-viscosity fluid pumping. Sustain. Energy Technol. 2019, 34, 16–26. [Google Scholar] [CrossRef]
  18. Li, W. Effect of exit blade angle, viscosity and roughness in centrifugal pumps investigated by CFD computation. Task Q. 2011, 15, 21–41. Available online: https://task.gda.pl/files/quart/TQ2011/01/tq115b-e.pdf (accessed on 14 January 2018).
  19. Liang, Y.; Lin, X.; Kong, X.; Duan, Q.; Wang, P.; Mei, X.; Ma, J. Making waves: Zero liquid discharge for sustainable industrial effluent management. Water 2021, 13, 2852. [Google Scholar] [CrossRef]
  20. Xu, F.; Zhao, S.; Li, B.; Li, H.; Ling, Z.; Zhang, G.; Liu, M. Current status of zero liquid discharge technology for desulfurization wastewater. Water 2024, 16, 900. [Google Scholar] [CrossRef]
  21. Romo, S.A.; Elhashimi, M.; Abbasi, B.; Srebric, J. Mapping of a novel zero-liquid discharge desalination system based on humidification–dehumidification onto the field of existing desalination technologies. Water 2022, 14, 2688. [Google Scholar] [CrossRef]
  22. Van Bennekom, A.; Berndt, F.; Rassool, M. Pump impeller failures—A compendium of case studies. Eng. Fail. Anal. 2001, 8, 145–156. [Google Scholar] [CrossRef]
  23. Zahrani, E.M. Premature failure of grade-316Ti stainless steel tubing in a boiler feed-water heat exchanger in a steel complex. J. Fail. Anal. Prev. 2021, 21, 61–73. [Google Scholar] [CrossRef]
  24. Wang, S.; Zhang, J.; Gharbi, O.; Vivier, V.; Gao, M.; Orazem, M.E. Electrochemical impedance spectroscopy. Nat. Rev. Methods Primers 2021, 1, 41. [Google Scholar] [CrossRef]
  25. McCafferty, E. Introduction to Corrosion Science; Springer: New York, NY, USA, 2010. [Google Scholar] [CrossRef]
  26. Brennen, C.E. Hydrodynamics of Pumps, 1st ed.; Cambridge University Press: New York, NY, USA, 2011. [Google Scholar] [CrossRef]
  27. Barrio, R.; Blanco, E.; Parrondo, J.; González, J.; Fernández, J. The Effect of impeller cutback on the fluid-dynamic pulsations and load at the blade-passing frequency in a centrifugal pump. J. Fluids Eng. 2008, 130, 111102. [Google Scholar] [CrossRef]
  28. Cai, J.; Pan, J.; Guzzomi, A. The flow field in a centrifugal pump with a large tongue gap and back blades. J. Mech. Sci. Technol. 2014, 28, 4455–4464. [Google Scholar] [CrossRef]
  29. Al-Yasiri, M.; Al-Khateeb, M.; Wen, D. Examination of drill pipe corrosion in water-based drilling fluids under wellbore conditions, Corros. Eng. Sci. Technol. 2017, 53, 183–187. [Google Scholar] [CrossRef]
  30. Prasetia, A.E.; Salazar, A.T.N.; Toralde, J.S.S. Corrosion control in geothermal aerated fluids drilling projects in Asia Pacific. In Proceedings of the World Geothermal Congress, Bali, Indonesia, 25–29 April 2010. [Google Scholar]
  31. Badiea, A.; Mohana, K. Effect of temperature and fluid velocity on corrosion mechanism of low carbon steel in presence of 2-hydrazino-4,7-dimethylbenzothiazole in industrial water medium. Corros. Sci. 2009, 51, 2231–2241. [Google Scholar] [CrossRef]
  32. Tchada, A.M.; Tchoumboué, N.K.; Mesquita, A.L.A.; Hendrick, P. Enhancing Pump as Turbine (PAT) performances: A numerical investigation into the impact of impeller leading edge rounding. Heliyon 2024, 10, e34663. [Google Scholar] [CrossRef] [PubMed]
  33. Collini, L.; Nicoletto, G.; Konečná, R. Microstructure and mechanical properties of pearlitic gray cast iron. Mater. Sci. Eng. A 2008, 488, 529–539. [Google Scholar] [CrossRef]
  34. Sancy, M.; Gourbeyre, Y.; Sutter, E.; Tribollet, B. Mechanism of corrosion of cast iron covered by aged corrosion products: Application of electrochemical impedance spectrometry. Corros. Sci. 2010, 52, 1222–1227. [Google Scholar] [CrossRef]
  35. Xu, W.; Ferry, M.; Wang, Y. Influence of alloying elements on as-cast microstructure and strength of gray iron. Mater. Sci. Eng. A 2005, 390, 326–333. [Google Scholar] [CrossRef]
  36. Muhmond, H.M.; Fredriksson, H. Relationship between inoculants and the morphologies of MnS and graphite in gray cast iron. Metall. Mater. Trans. B 2013, 44, 283–298. [Google Scholar] [CrossRef]
  37. Al-Hashem, A.; Abdullah, A.; Riad, W. Cavitation corrosion of nodular cast iron (NCI) in seawater: Microstructural effects. Mater. Charact. 2001, 47, 383–388. [Google Scholar] [CrossRef]
  38. Jur, T.A.; Middleton, J.I.; Yurko, A.A.; Windham, R.L.; Grey, J.R., Jr. Case studies in graphitic corrosion of cast iron pipe. J. Fail. Anal. Prev. 2021, 21, 376–386. [Google Scholar] [CrossRef]
  39. Rahmati, M.; Zahrani, E.M.; Atapour, M.; Nezhad, A.H.N.; Hakimizad, A.; Alfantazi, A.M. In situ synthesis and electrochemical corrosion behavior of plasma electrolytic oxidation coating containing an osteoporosis drug on AZ31 magnesium alloy. Mater. Chem. Phys. 2024, 315, 128983. [Google Scholar] [CrossRef]
  40. Bard, A.J.; Faulkner, L.R.; White, H.S. Electrochemical Methods: Fundamentals and Applications, 3rd ed.; John Wiley & Sons: Hoboken, NJ, USA, 2022. [Google Scholar]
  41. Sharma, P. Premature failure of ductile iron pump impeller in cooling tower system. J. Fail. Anal. Prev. 2014, 14, 303–306. [Google Scholar] [CrossRef]
  42. McCafferty, E. Validation of corrosion rates measured by the Tafel extrapolation method. Corr. Sci. 2005, 47, 3202–3215. [Google Scholar] [CrossRef]
  43. ASTM G102-89; Standard Practice for Calculation of Corrosion Rates and Related Information from Electrochemical Measurements. ASTM International: West Conshohocken, PA, USA, 2010. [CrossRef]
  44. Orazem, M.E.; Tribollet, B. Electrochemical Impedance Spectroscopy, the Electrochemical Society Series, 2nd ed.; John Wiley & Sons: Hoboken, NJ, USA, 2017. [Google Scholar]
  45. Moradighadi, N.; Nesic, S.; Tribollet, B. Identifying the dominant electrochemical reaction in electrochemical impedance spectroscopy. Electrochim. Acta 2021, 400, 139460. [Google Scholar] [CrossRef]
  46. Hirschorn, B.; Orazem, M.E.; Tribollet, B.; Vivier, V.; Frateur, I.; Musiani, M. Determination of effective capacitance and film thickness from constant-phase-element parameters. Electrochim. Acta 2010, 55, 6218–6227. [Google Scholar] [CrossRef]
  47. Jorcin, J.B.; Orazem, M.E.; Pébère, N.; Tribollet, B. CPE analysis by local electrochemical impedance spectroscopy. Electrochim. Acta 2006, 51, 1473–1479. [Google Scholar] [CrossRef]
  48. Kerroum, Y.; Skal, S.; Guenbour, A.; Bellaouchou, A.; Boulif, R.; Anton, J.G.; Zarrouk, A. A novel investigation on the cast iron corrosion in polluted phosphoric acid. Surf. Interfaces 2020, 19, 100481. [Google Scholar] [CrossRef]
  49. Brug, J.; van den Eeden, A.L.G.; Sluyters-Rehbach, M.; Sluyters, J.H. The analysis of electrode impedance complicated by the presence of a constant phase element. J. Electroanal. Chem. 1984, 176, 275–295. [Google Scholar] [CrossRef]
  50. Zhang, R.; Sur, D.; Li, K.; Witt, J.; Black, R.; Whittingham, A.; Scully, J.R.; Hattrick-Simpers, J. Bayesian assessment of commonly used equivalent circuit models for corrosion analysis in electrochemical impedance spectroscopy. npj Mater. Degrad. 2024, 8, 120. [Google Scholar] [CrossRef]
  51. Orazem, M.E. Measurement model for analysis of electrochemical impedance data. J. Solid State Electrochem. 2024, 28, 1273–1289. [Google Scholar] [CrossRef]
  52. Vivier, V.; Orazem, M.E. Impedance analysis of electrochemical systems. Chem. Rev. 2022, 122, 11131–11168. [Google Scholar] [CrossRef] [PubMed]
  53. Yuan, X.Z.; Song, C.; Wang, H.; Zhang, J. Electrochemical Impedance Spectroscopy in PEM Fuel Cells: Fundamentals and Applications; Springer: London, UK, 2009. [Google Scholar] [CrossRef]
  54. Lasia, A. Electrochemical Impedance Spectroscopy and Its Applications; Springer: New York, NY, USA, 2014. [Google Scholar] [CrossRef]
  55. Khalid, Y.A.; Sapuan, S.M. Wear analysis of centrifugal slurry pump impellers. Ind. Lubr. Tribol. 2007, 59, 18–28. [Google Scholar] [CrossRef]
  56. Im, M.H. Cavitation characteristics on impeller materials of centrifugal pump for ship in sea water and fresh water. Corros. Sci. Technol. 2011, 10, 218–224. [Google Scholar]
  57. Babalola, P.O.; Omada, J.E.; Kilanko, O.; Banjo, S.; Ozour, O. Performance evaluation of a centrifugal pump with different impeller materials. J. Phys. Conf. Ser. 2019, 1378, 022091. [Google Scholar] [CrossRef]
  58. Huang, P.H.; Guo, M.J. A study on the investment casting of 17-4PH stainless steel helical impeller on centrifugal pump. Mater. Res. Innov. 2015, 19, S977–S981. [Google Scholar] [CrossRef]
  59. Wang, C.; Shi, W.; Si, Q.; Zhou, L. Numerical calculation and finite element calculation on impeller of stainless steel multistage centrifugal pump. J. Vibroeng. 2014, 16, 1723–1734. Available online: https://www.jvejournals.com/article/15031 (accessed on 21 March 2020).
  60. Alzafin, Y.A.; Mourad, A.H.; AbouZour, M.; Abuzeid, O.A. A study on the failure of pump casting made of ductile Ni-resist cast irons used in desalination plants. Eng. Fail. Anal. 2007, 14, 1294–1300. [Google Scholar] [CrossRef]
  61. Zahrani, E.M.; Saatchi, A.; Alfantazi, A. Pitting of 316L stainless steel in flare piping of a petrochemical plant. Eng. Fail. Anal. 2010, 17, 810–817. [Google Scholar] [CrossRef]
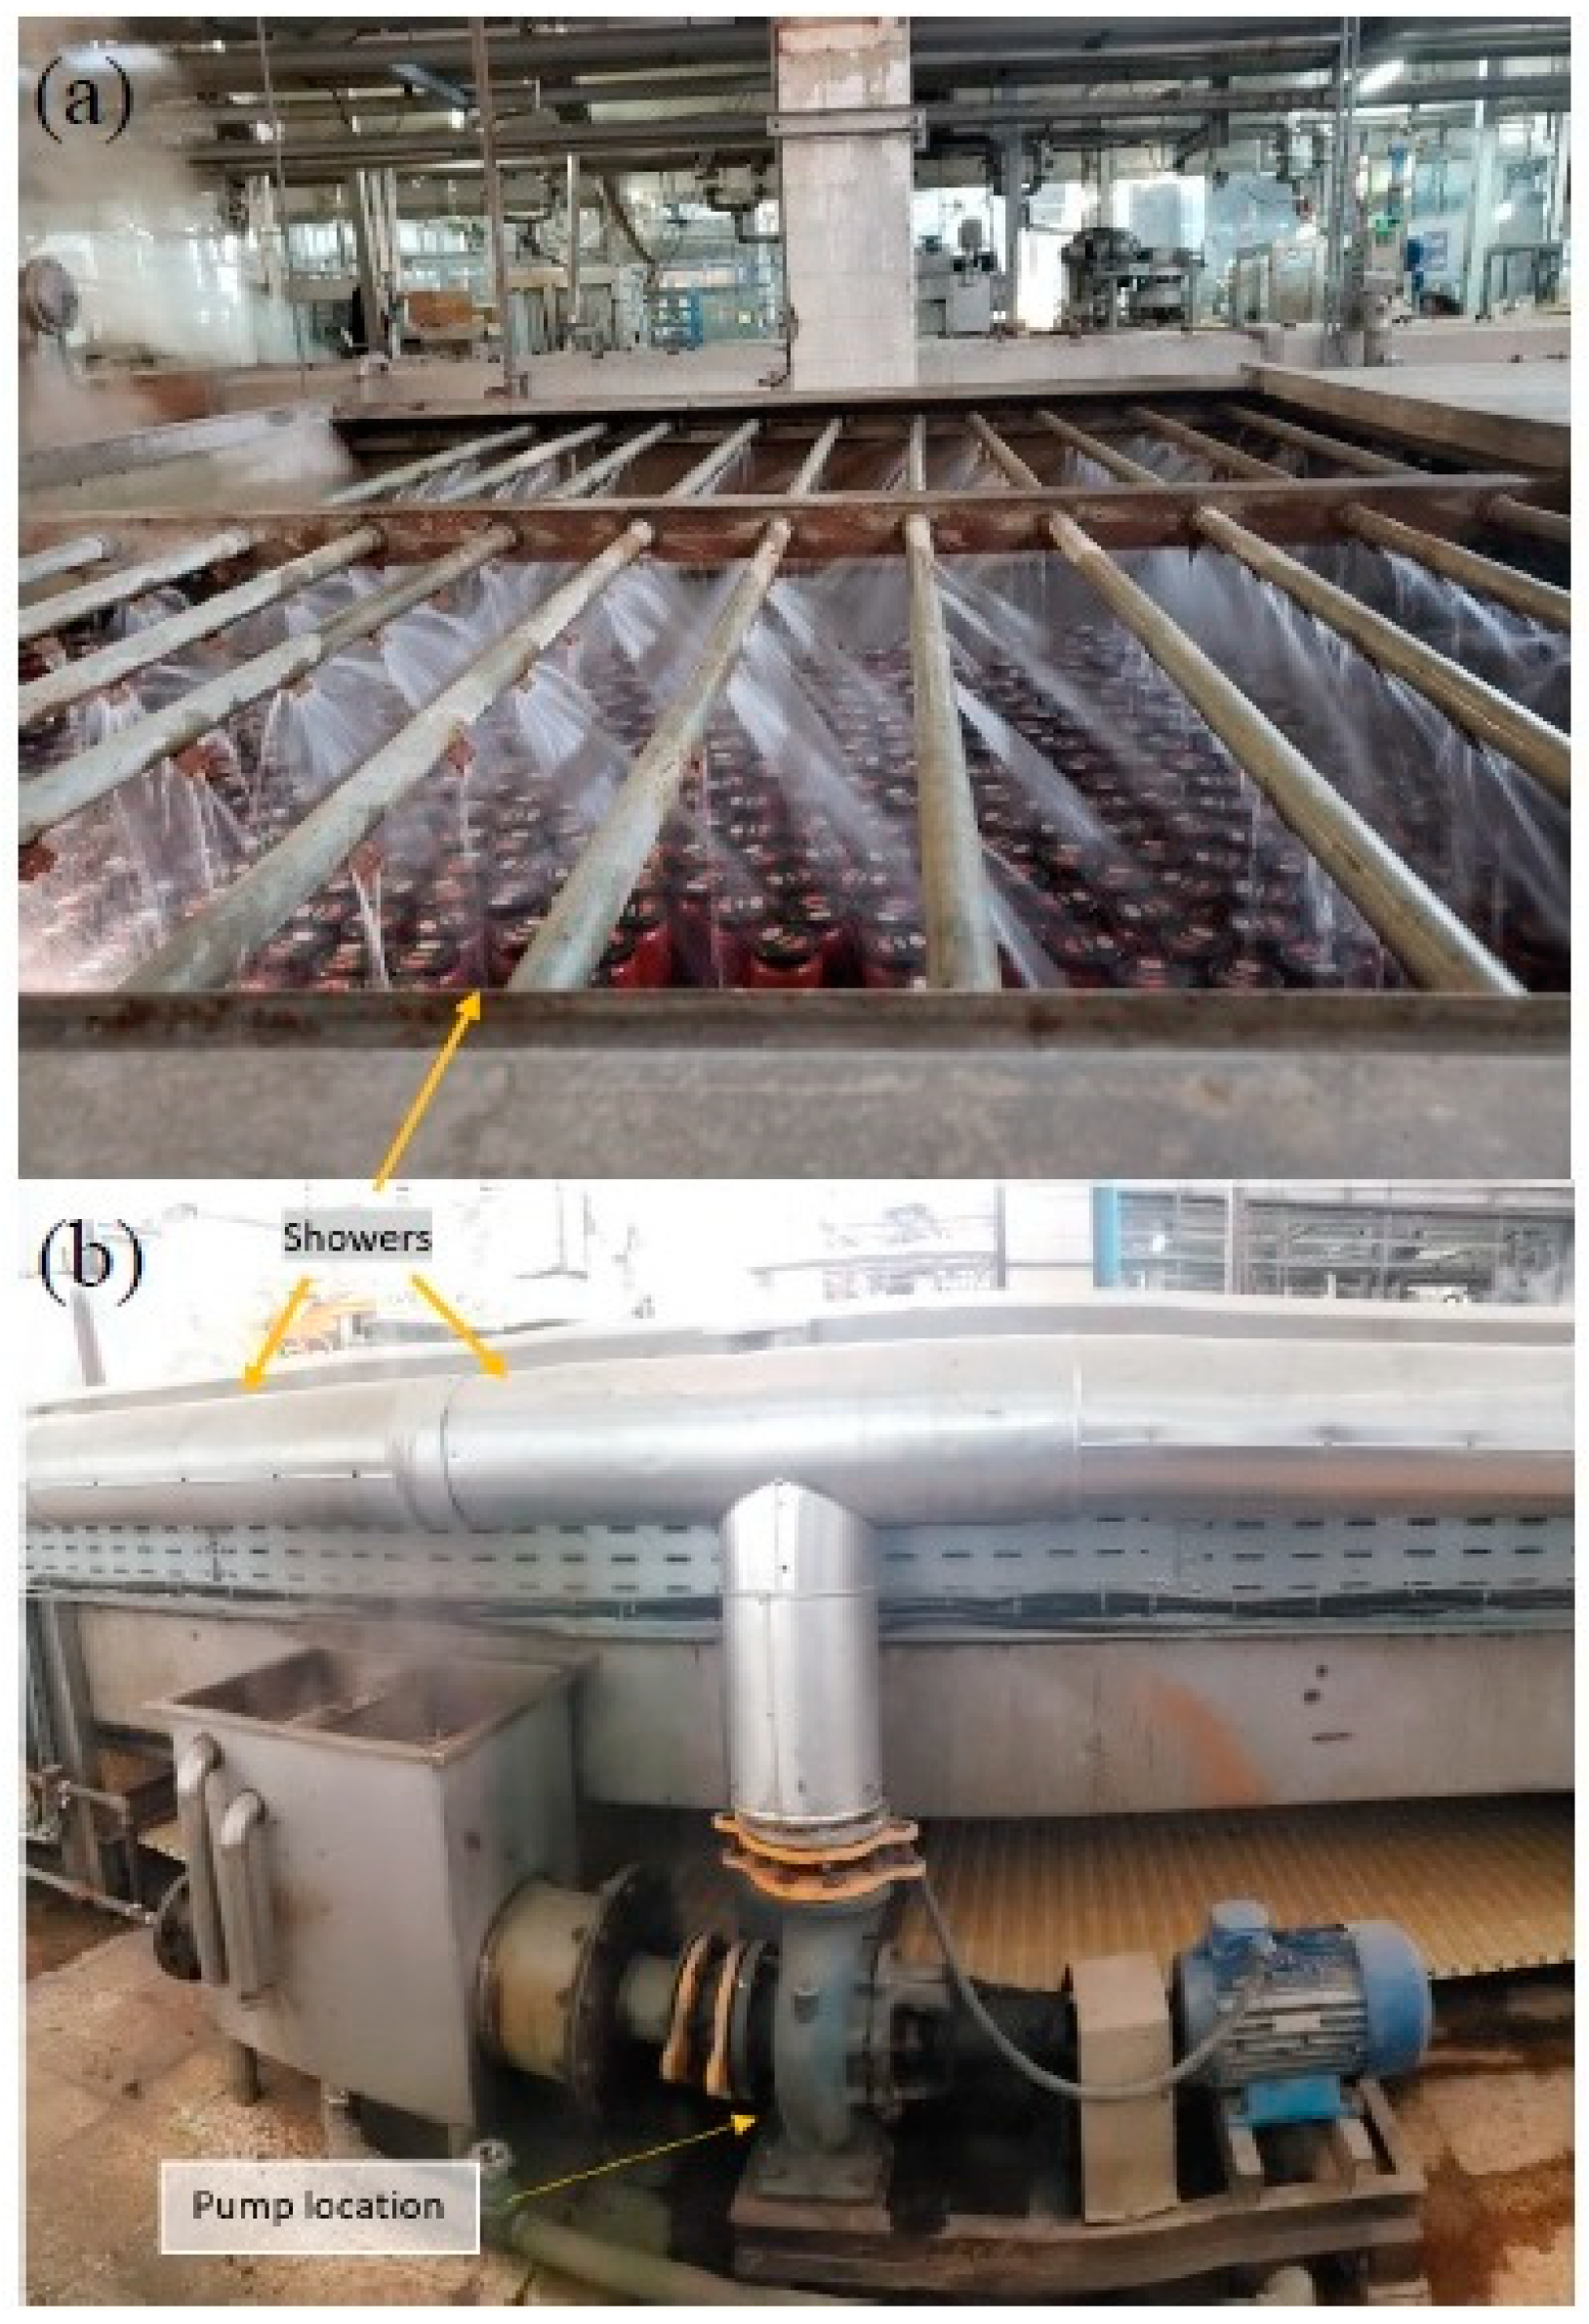
Figure 1. (a) Canned food production line, and (b) location of the centrifugal water pump.
Water 17 00173 g001
Figure 2. Schematics of (a) the single-suction centrifugal water pump shown in Figure 1b, (b) pump assembly parts, and (c) impeller, together with (d) a photograph of an impeller retired upon premature failure. The SOLIDWORKS software package (version 2013) designed the schematics.
Water 17 00173 g002
Figure 3. A bench-top corrosion test apparatus consisting of a three-electrode electrochemical cell arrangement. The SOLIDWORKS software package (version 2013) designed the schematic.
Water 17 00173 g003
Figure 4. The SOLIDWORKS CFDs simulation results: (a) pressure, (b) velocity, and (c) temperature distribution of the fluid in the volute case.
Water 17 00173 g004
Figure 5. Photograph for the visual inspection of the external and internal areas of the failed impeller.
Water 17 00173 g005
Figure 6. Optical photomicrograph of gray cast iron sample cut from a brand-new impeller after metallography examination shows the intact microstructure.
Water 17 00173 g006
Figure 7. SEM/EDX results corresponding to gray cast iron samples: (a) brand-new and (b) failed impeller.
Water 17 00173 g007
Figure 8. OCP curves of gray cast iron working electrodes upon 2 h immersion test in the well water and wastewater media under stagnant fluid conditions (free corrosion).
Water 17 00173 g008
Figure 9. Optical photomicrographs of working electrodes (ac) wastewater and (df) well water, exposed to the stirring electrolyte under free corrosion conditions for (a,d) 5 min, (b,e) 30 min, and (c,f) 60 min.
Water 17 00173 g009
Figure 10. PDP curves of working electrodes: (a) the wastewater and (b) the well water at 0, 30, and 60 min.
Water 17 00173 g010
Figure 11. PDP curves of the working electrodes in the wastewater at (a) 0, (b) 30, and (c) 60 min of exposure times depicting the extrapolation of the linear portion of the anodic branch and the selected points for drawing the tangent lines according to the Tafel extrapolation technique.
Water 17 00173 g011
Figure 12. PDP curves of the working electrodes in the well water at exposure times of (a) 0, (b) 30, and (c) 60 min depicting the extrapolation of the linear portion of the anodic branch and the selected points for drawing the tangent lines according to the Tafel extrapolation technique.
Water 17 00173 g012
Figure 13. EIS profiles of the working electrodes in the (a,b) wastewater and (c,d) well water: (a,c) Nyquist and (b,d) Bode plots of total impedance magnitude and phase angle upon exposure to the stirred electrolytes for 0, 30, and 60 min.
Water 17 00173 g013
Figure 14. Physical presentation of equivalent electrical circuits fitting into EIS profiles corresponding to exposure times of (a) 0 min in both the wastewater and well water, (b) 30 and 60 min in wastewater, and (c) 30 and 60 min in the well water.
Water 17 00173 g014
Table 1. Chemical composition of pump impeller (wt.%) made of gray cast iron.
ElementCSiMnSMoCrPTiCuFe
Gray Cast Iron4.5162.0840.2630.1600.0060.1840.0530.0180.235Bal.
Table 2. The water samples’ characteristics: chemical analysis, pH, conductivity, and the total suspended solids (TSSs).
Element/ParameterConcentration (mg/L)
Well WaterWastewater
B0.4400.215
Ca102.84258.367
Fe-0.329
K10.46622.166
Li0.8710.379
Mg30.31918.645
Na278.947163.206
P0.0140.344
S54.43322.100
Se0.0240.038
Si41.80734.581
Sr1.8581.056
Zn0.1760.069
Cl (ppm)<1<1
pH7.606.84
Conductivity (µs)1433963.0
TSS (mg/lit)23030.0
Table 3. Electrochemical parameters extracted from PDP curves using the Tafel extrapolation technique.
ElectrolyteExposure Time
(min)
βa
(V/dec.)
icorr
(µA/cm2)
Ecorr
(V)
RP
(Ω cm2)
Wastewater00.22259−0.53369
300.32153−0.62908
600.32148−0.65939
Well water00.25310−0.61350
300.30309−0.67421
600.32261−0.66534
Table 4. Electrochemical parameters extracted from EIS profiles upon fitting equivalent electrical circuits.
WaterTime
(min)
R s
(Ω cm2)
Q o
(µS sn/cm2)
n o R o
(Ω cm2)
Q d l
(µS sn/cm2)
n d l R d l
(Ω cm2)
Short Warburg Impedance W s C o
(µF/cm2)
C d l
(µF/cm2)
R W s
(Ω cm2)
T W s
(s)
n W s
Waste0155.415700.7460.1418700.71912.7---6902310
30134.914900.62578.129,9000.98534.9---135031,570
60140.217800.63326.510,9000.53929.4---130082,600
Well0139.113900.62311.726500.58335---8202430
30119.858700.59310---135612.750.478820-
6053.1550800.58310.3---426.455.450.627030-
Disclaimer/Publisher’s Note: The statements, opinions and data contained in all publications are solely those of the individual author(s) and contributor(s) and not of MDPI and/or the editor(s). MDPI and/or the editor(s) disclaim responsibility for any injury to people or property resulting from any ideas, methods, instructions or products referred to in the content.