Article

Hydrogeochemical Evolution, Isotopic Insights, and Genetic Models of Geothermal Water in Anhui Province, China

1
Nanjing Center, China Geological Survey, Nanjing 210016, China
2
Geological Survey of Jiangsu Province, Nanjing 210018, China
3
School of Soil and Water Conservation, Nanchang Institute of Technology, Nanchang 330099, China
*
Authors to whom correspondence should be addressed.
Water 2025, 17(2), 236; https://doi.org/10.3390/w17020236
Submission received: 13 December 2024 / Revised: 11 January 2025 / Accepted: 14 January 2025 / Published: 16 January 2025
(This article belongs to the Special Issue New Application of Isotopes in Hydrology and Hydrogeology)

Abstract

:
Anhui Province is rich in geothermal water resources, making the study of its hydrochemical evolution and genetic models essential for scientific development and sustainable utilization. This study combines hydrochemical and hydrogen–oxygen isotopic data from different regions of Anhui Province to analyze the hydrogeochemical evolution characteristics and recharge mechanisms of basin-type and mountainous-type geothermal waters. The results show that basin-type geothermal water is predominantly of the Cl–Na type, with water–rock interactions mainly including halite dissolution, gypsum dissolution, dedolomitization, and silicate hydrolysis. The groundwater system is relatively closed off, with slow flow rates. In contrast, mountainous geothermal water is mainly of the HCO3–Na·Ca, SO4–Na·Ca, and SO4–Na types, with water–rock interactions primarily involving calcite dissolution, dolomite dissolution, and gypsum dissolution. Enhanced precipitation infiltration due to fault structures leads to stronger recharge and an open-system characteristic. The genetic models of the two types of geothermal water reveal the structural and recharge mechanisms of thermal reservoirs under different geological settings, highlighting the significant control of geological background on geothermal water formation.

1. Introduction

Geothermal water resources are a valuable and clean energy source with a wide range of functions and applications, extensively used in industries [1], agriculture [2], healthcare [3,4], power generation [5,6,7], heating [8,9,10], and tourism [11,12]. The formation of geothermal water is not only controlled by magmatic activity but also closely related to tectonics, stratigraphic lithology, and hydrogeological conditions [13]. The geochemical composition of geothermal water is influenced by a complex interplay of various geological processes, including dissolution, cation exchange, and isotopic fractionation [14]. Numerous studies have demonstrated that hydrogeochemical analysis is an effective and important method for exploring and developing geothermal resources [15,16,17]. Many researchers have employed a combination of isotope analysis, ion ratios, and other methods to investigate the major and trace components of geothermal water, as well as to study water–rock interactions and the recharge and renewal capacity of geothermal systems [18,19,20].
In this study, we referenced several important publications to support our conclusions and underscore the relevance of existing research. For instance, Vengosha et al. (2002) used Br/Cl and Cl/δ18O ratios to identify Na–Cl-type water with marine origins, Na–HCO3-type water with high CO2 content, and Ca·Mg–HCO3·SO4-type water produced by water–rock interactions in the Menderes geothermal field [21]. Levet et al. (2002) conducted chemical and isotopic studies of the Bigorre geothermal field in France using Na+/Cl and (Ca2+ + Mg2+)/SO42− ratios, revealing that the geothermal water’s chemical composition mainly results from halite dissolution, gypsum dissolution, and chalcedony dissolution [22]. Liu et al. (2003) combined hydrochemical data, in situ titration, and stable carbon and oxygen isotope measurements to reveal the hydrochemical and isotopic characteristics of the Baishui Tai travertine landscape in southwest China [23]. Bianchini et al. (2005) analyzed Na+ and trace elements such as B and Li to discover seawater intrusion and cation exchange processes in the coastal region of the Cornia basin, Italy [24]. Petrini et al. employed hydrogeochemical methods to investigate the origin of low- to moderate-temperature thermal waters feeding the Monfalcone springs in northern Italy. The results indicated that the composition of these thermal waters is similar to seawater, with mixing occurring with low-salinity cold waters, and the thermal waters diluting the saline reservoir through karst-type freshwaters [25]. Lambrakis et al. (2013) investigated the origin and chemical composition of geothermal water in central Greece, concluding that geothermal water is primarily derived from precipitation, which undergoes water–rock interactions and deep crustal heating before mixing with shallow groundwater [26]. Haklidir et al. (2013) found that geothermal water in the Bursa region of Turkey resulted from water–rock interactions between groundwater and granite at temperatures of 37–80 °C [27]. Zhang et al. (2019) conducted hydrochemical and hydrogen–oxygen isotope analyses of two geothermal fields in the Litang region of Sichuan Province, discovering that the Kahui geothermal field is primarily influenced by dolomite, calcite precipitation, and silicates, while the Gezha geothermal field is affected by calcite dissolution, dolomite precipitation, and silicates [28]. Shoedarto et al. (2020) used δ18O and δ2H isotopes along with water–rock interaction studies to investigate water–rock interactions and recharge patterns of shallow and deep geothermal water circulation [29]. Li et al. analyzed the elemental geochemistry (ions and rare earth elements) and stable isotopes (D and O) of hot springs, geothermal fluids, rivers, and cold springs at various locations in the Xifeng geothermal field, revealing that the Xifeng geothermal system is a low-temperature, fault-controlled, deep-circulation atmospheric precipitation system [30]. Bao et al. conducted chemical isotope analyses of 35 water samples and 16 gas samples from the Tangquan hot spring, part of the three major geothermal systems in Nanjing, Jiangsu Province, China. The results showed that the direct geothermal reservoir temperature is 90 °C, but the temperature of deeper parts of the system could reach 150–205 °C, as determined using carbon isotope thermometers [31]. Wang et al. analyzed the conventional hydrochemical and hydrogen-oxygen isotope data of geothermal fields in the Zaozigou area of Gansu Province, China, using hydrogeochemical methods. They studied the geochemical characteristics and origins of geothermal water and proposed a conceptual model of the geothermal system [32]. Yang et al. (2024) employed hydrochemical and D–O–Sr isotopic techniques to analyze the formation of the Yangbajing geothermal field and its mineral scaling, finding that geothermal water is weakly alkaline, and silicate minerals (albite and orthoclase) dissolution and cation exchange control the hydrogeochemical processes. The geothermal water is recharged by snowmelt from the Nyainqentanglha and Tangshan Mountains [33]. Yin et al. (2024) compared the conventional ion and isotopic characteristics of geothermal water in northern Jinan, studying the hydrochemical characteristics in the formation of geothermal water and revealing the origin mechanism of porous sandstone geothermal water [34]. These studies provide theoretical support for our work and highlight the significance of hydrochemical and isotopic analyses in the study of similar geothermal systems.
The study area for this research is located in Anhui Province, China, which has abundant geothermal water resources and several geothermal manifestations. However, research on geothermal water in Anhui Province is limited. Liu et al. conducted a quantitative assessment of the recharge sources, reservoir temperatures, and thermal circulation depths of geothermal water in the Dabie orogenic belt of Anhui Province, studying the evolution of geothermal water and finding that the main anions and cations originate from silicate and gypsum dissolution, with precipitation as the primary recharge source [35]. Xu et al. performed hydrochemical and hydrogen–oxygen isotope analyses on geothermal water from the Qingdong Coal Mine in Huaibei, Anhui Province, showing that atmospheric precipitation and water–rock interactions are the main sources of geothermal water, with the chemical composition mainly derived from carbonate, silicate dissolution, and cation exchange [36]. Wang et al., based on an analysis of geological structure, lithology, and hydrogeochemical types of geothermal fluids in the study area, revealed the general situation and distribution characteristics of geothermal resources in the Yangtze River Economic Belt of Anhui [37]. Fang et al. analyzed the anion and isotope content as well as the source depth of groundwater from well No. 1 of the Lujiang geothermal spring and surrounding seismic observation wells and surface water samples. They conducted a comparative analysis to study the source depth of groundwater in the Lujiang geothermal spring well and its post-seismic effects and mechanisms [38]. Su et al. focused on six geothermal springs in the Chuhe Fault Zone in Anhui, analyzed the hydrochemical characteristics of water samples, and estimated the recharge elevation of the springs using hydrogen and oxygen isotopes, proposing a genetic model for the springs [39]. These studies primarily focus on geothermal water research in specific regions of Anhui Province. To date, no comprehensive study has been conducted on geothermal water throughout the entire province, and there is a lack of a unified understanding of the hydrochemical evolution and hydrogen–oxygen isotope characteristics of geothermal water in the region. This hinders the development of a comprehensive plan for the sustainable utilization of geothermal water.
The hydrochemical and hydrogen–oxygen isotopic characteristics of geothermal water often preserve key geochemical information about the formation and evolution of geothermal systems. Hydrogeochemical studies are an effective means of analyzing the formation mechanisms of geothermal systems and the conditions and circulation processes of geothermal water [40,41]. The differences in hydrochemical composition between geothermal areas with varying hydrothermal geological conditions reflect distinct information about the origins and circulation of geothermal water. However, this information has not been fully explored. In this paper, we combine basic geological background conditions with hydrogeochemical evolution and hydrogen–oxygen isotope analyses to clarify the sources and recharge origins of geothermal water under different tectonic conditions, revealing the genesis of geothermal water hydrochemistry in various structural types.

2. Study Area

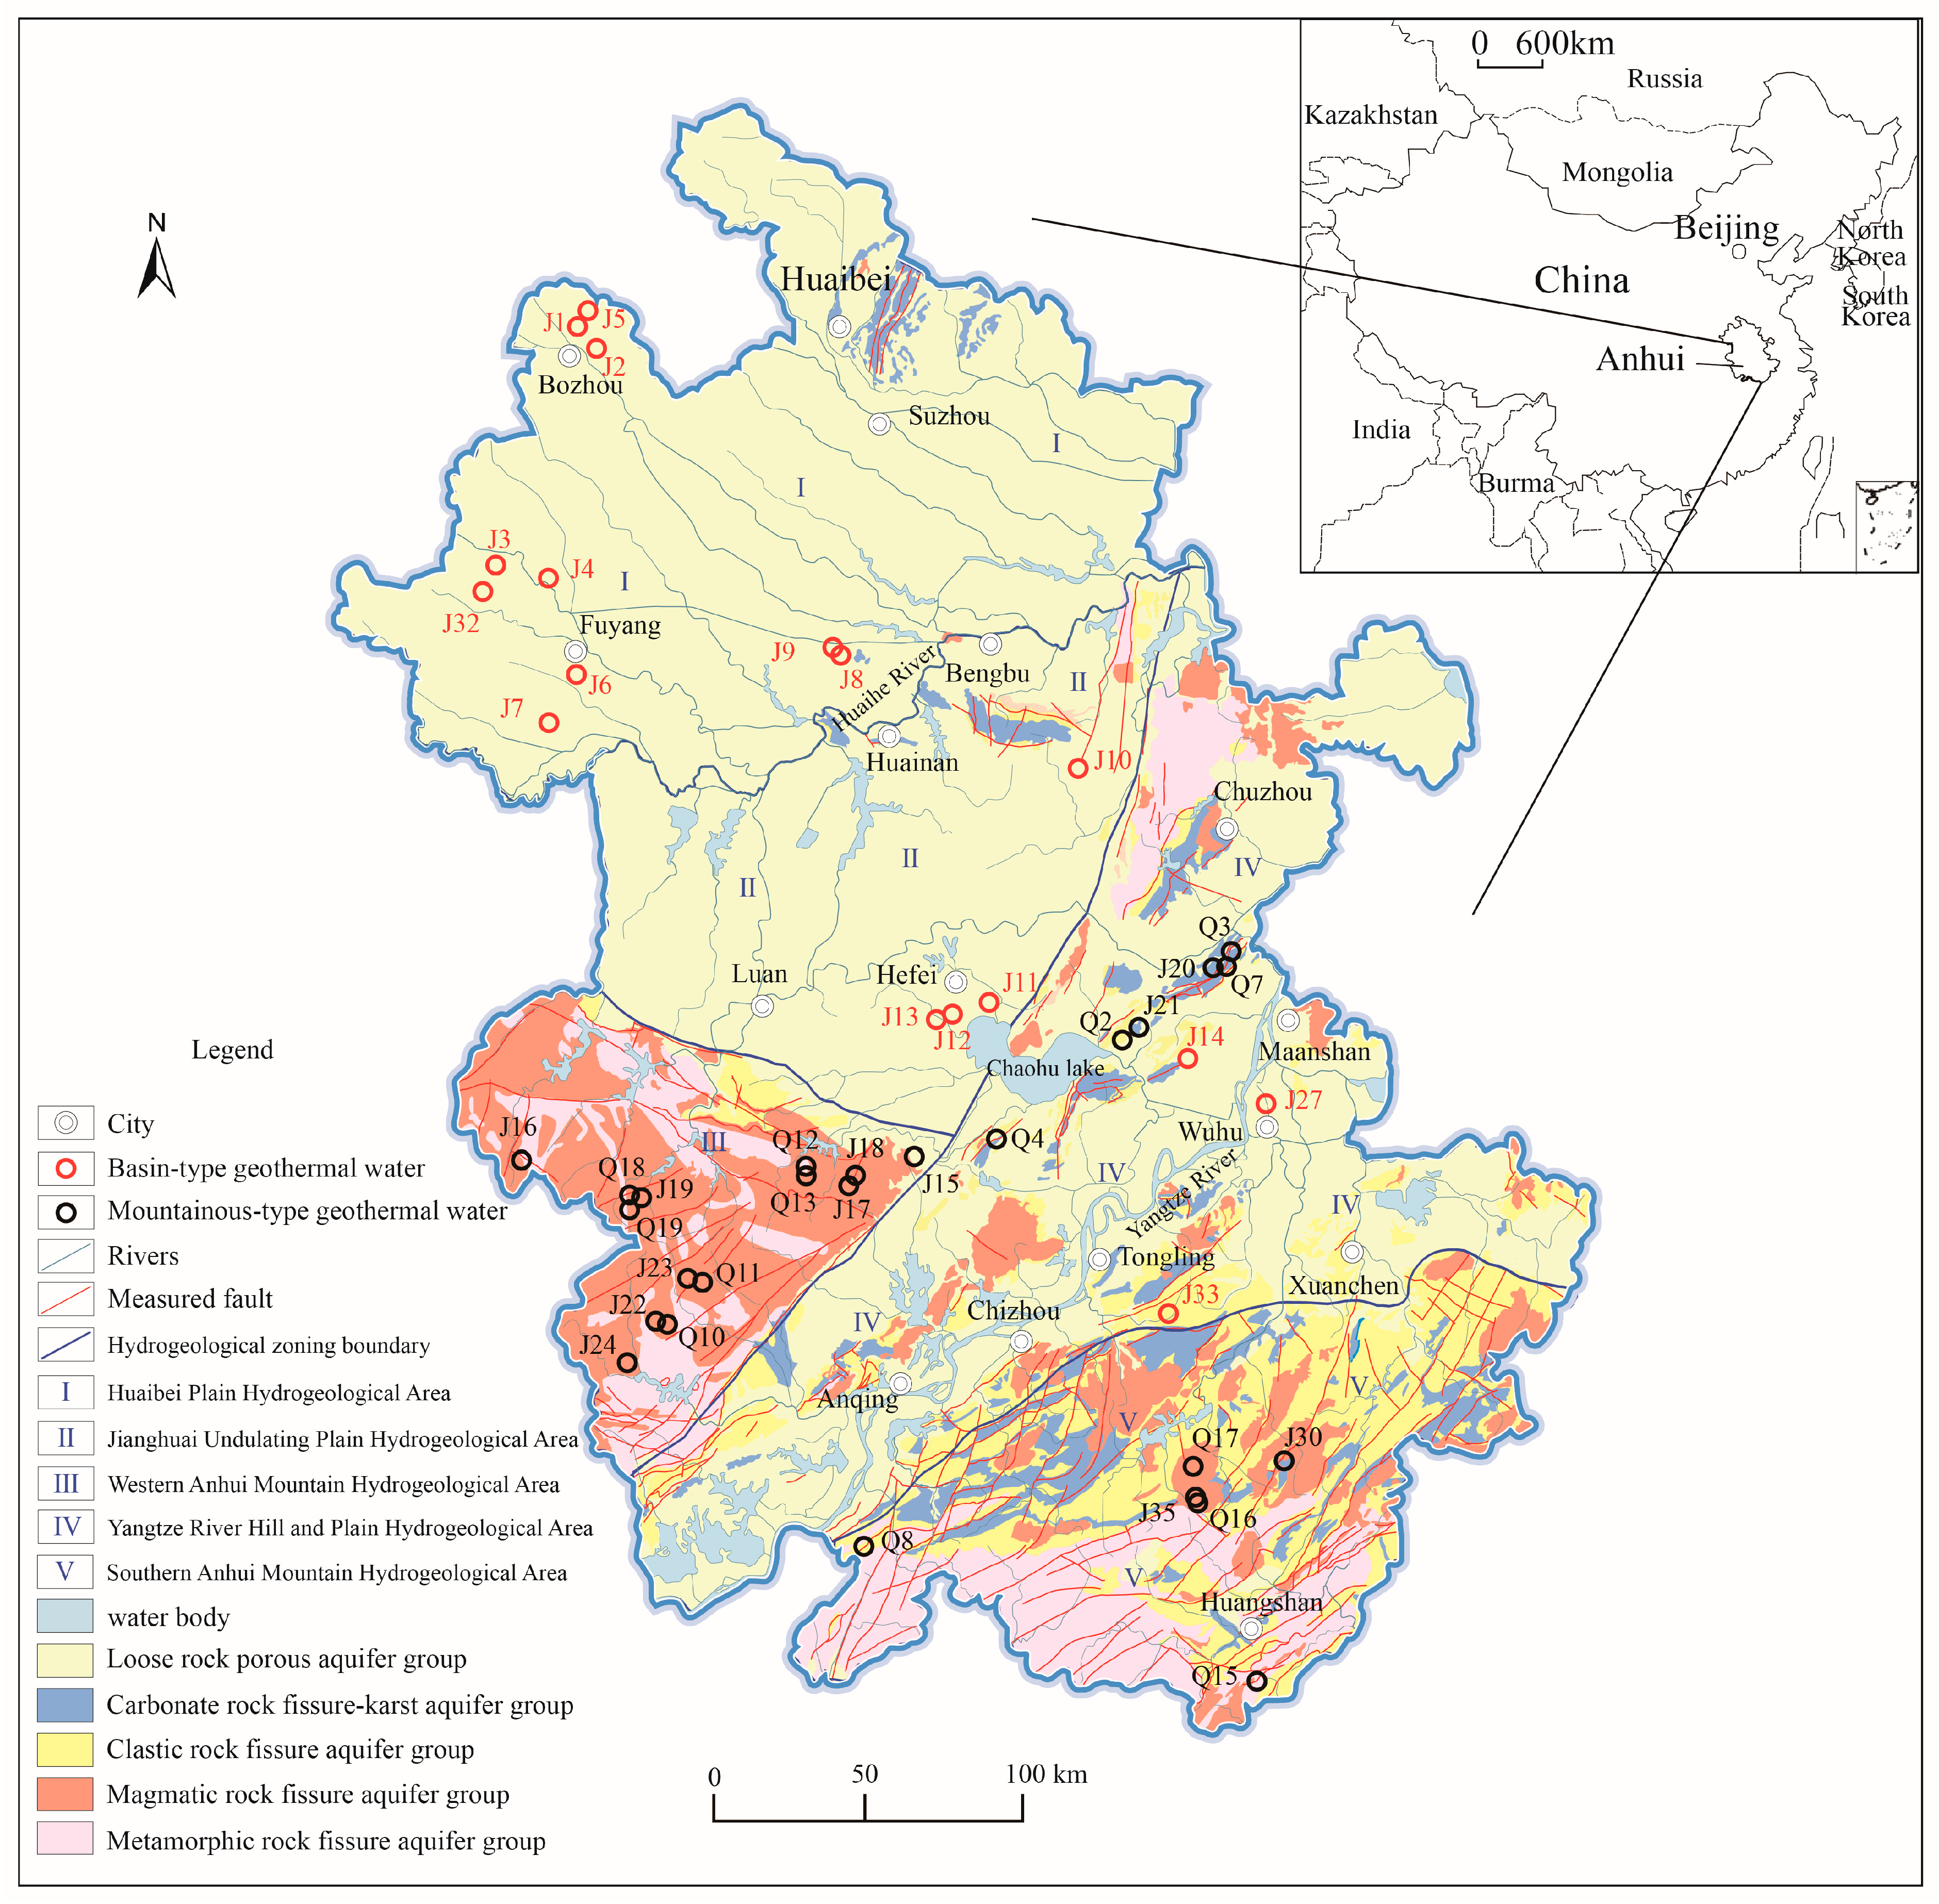
2.1. Physical Geography

Anhui Province is located in inland eastern China, situated in the middle and lower reaches of the Yangtze and Huai Rivers, at the heart of the Yangtze River Delta. The province covers a total area of 139,400 km2. Anhui has a well-developed river system, comprising three major waterways flowing from north to south: the Huai River, the Yangtze River, and the Xin’an River. The province also has numerous lakes, primarily concentrated along both sides of the Yangtze River, including Chaohu Lake, one of China’s five largest freshwater lakes.
Anhui lies in the mid-latitude region, characterized by a temperate, humid climate with distinct seasons. The Qinling–Huaihe Line, a significant geographical boundary in China, runs through the northern part of the province. As a result, areas north of the Huai River experience a warm temperate, semi-humid monsoon climate, while regions south of the Huai River enjoy a subtropical, humid monsoon climate. The annual average temperature across the province typically ranges from 14 °C to 17 °C, with a temperature difference of about 2 °C between the northern and southern parts. The frost-free period lasts approximately 200 to 250 days, being shorter in the north and longer in the south. Annual average precipitation ranges from 750 mm to 1700 mm, following a latitudinal distribution pattern, increasing with both decreasing latitude and rising elevation. Rainfall is unevenly distributed throughout the year, with the wet season typically occurring from May to August, during which around 50% of the total annual precipitation falls. The dry season usually spans from November to January, accounting for roughly 11% to 15% of the annual rainfall, while the remainder occurs during the intermediate season.
Anhui’s topography is diverse, featuring mountains, hills, and plains. Mid to low-altitude mountains are mainly found in the Dabie Mountains and the southern Anhui region. The highest peak in the Dabie Mountains is Baima Peak, with an elevation of 1774 m, while the highest point in southern Anhui is Lotus Peak in the Huangshan Mountain range, with an elevation of 1864.7 m. Hilly areas are primarily located between the Yangtze and Huai Rivers and along the Yangtze River, with elevations below 500 m. The plains are mainly situated north of the Huai River, with additional areas along the Yangtze River.

2.2. Geology and Structural Features

2.2.1. Geology

The stratigraphic system in Anhui Province is well developed, ranging from the Lower Proterozoic to the Quaternary. The province can be divided into three major stratigraphic regions: the North China Stratigraphic Region, the Northern Huaiyang Stratigraphic Region, and the Yangtze Stratigraphic Region. The North China Stratigraphic Region primarily covers the northern part of the study area and is mostly overlain by Quaternary deposits. The stratigraphic sequence in this region, from oldest to youngest, includes the Qingbaikou, Sinian, Cambrian, Ordovician, Carboniferous, Permian, Triassic, Jurassic, Cretaceous, Neogene, and Quaternary. Notably, the Middle to Upper Ordovician, Devonian, Silurian, and Oligocene of the Neogene are absent in this area. The Yangtze Stratigraphic Region is located in the southern part of the study area. Its stratigraphic sequence, from oldest to youngest, consists of the Qingbaikou, Sinian, Cambrian, Ordovician, Silurian, Devonian, Carboniferous, Permian, Triassic, Jurassic, Cretaceous, Neogene, and Quaternary. The Northern Huaiyang Stratigraphic Region lies between the North China and Yangtze Stratigraphic Regions. Its stratigraphy, from oldest to youngest, includes the Qingbaikou, Carboniferous, Jurassic, Cretaceous, Neogene, and Quaternary. However, the Cambrian, Ordovician, Silurian, Devonian, Permian, Lower Jurassic, and Oligocene of the Neogene are absent in this region.

2.2.2. Structural Features

The study area spans three primary tectonic units: the Sino–Korean Paraplatform, the Qinling Fold System, and the Yangtze Paraplatform. From the Late Paleozoic to the Cenozoic, the region has undergone a long geological evolution through eight tectonic cycles, ranging from the Bengbu cycle to the Himalayan cycle, which resulted in the formation of numerous faults and depressions (or faulted basins).
The study area is characterized by well-developed fault structures, including 13 deep faults and 29 large faults. These faults are distributed in a spatially regular pattern and can be categorized into five major fault systems: east–west trending, NNE trending, NE trending, north–south trending, and NW trending fault systems (Figure 1).

2.3. Geothermal Distribution and Geothermal Geological Conditions

The formation of geothermal resources is closely related to tectonic activities, magmatic processes, lithology, and hydrogeological conditions. The classification of geothermal resources varies depending on the research objectives. Common classification criteria include the geological background of geothermal formation, the lithology of the thermal reservoir, the temperature of geothermal fluids, pH, chemical composition, and genetic types. Based on geological background, this study classifies the geothermal water resources in the study area into basin-type geothermal water and mountainous-type geothermal water.
The distribution of geothermal resources in Anhui Province is strongly influenced by regional geological structures, primarily concentrated in faulted basins and uplifted mountainous areas. In faulted basins, geothermal resources are mainly distributed north of the Huai River, followed by the Hefei Basin, the Yangtze River Basin, and the Lu–Zong Basin. Most geothermal manifestations are artificially exposed, with few occurrences of natural hot springs. Subsurface geothermal water is generally formed under normal geothermal gradient conditions through deep groundwater circulation and thermal convection. The main thermal-bearing strata include Neogene siltstone, while in the Hefei and Lu–Zong Basins, the thermal reservoirs are primarily composed of Cretaceous siltstone and conglomerate. In the Yangtze River Basin, geothermal water is mainly stored in thick limestone layers from the Ordovician to Cambrian periods, as well as in igneous rocks.
In uplifted mountainous areas, geothermal manifestations are primarily in the form of hot springs, distributed mainly in the Dabie Mountain block uplift zone and the Chaohu dome fold zone. Hot springs are concentrated in the Dabie Mountain region, the Chaohu–Hexian area, and the southern mountainous region of Anhui. The key characteristics of mountainous geothermal areas include the absence of recent volcanic activity or magmatic heat sources in the shallow subsurface, a low thermal background, and terrestrial heat flow and geothermal gradients that are close to or slightly higher than average crustal values. The geothermal flow system is driven by deep groundwater circulation, and the temperature of geothermal water is predominantly influenced by the depth of circulation as well as recharge, runoff, and discharge conditions. In the study area, mountainous geothermal water includes both artificially exposed geothermal water and natural hot springs.
The high geothermal values in Anhui Province are closely related to geological structures, with geothermal manifestations predominantly distributed in the faulted basins, fault block uplifts, and deep major fault zones. Geothermal manifestations in faulted basins are mainly concentrated north of the Huaihe River, followed by the Hefei Basin, Yangtze River Basin, and Lu–Cong Basin, with most geothermal manifestations being artificially exposed. The temperature of the geothermal fluids ranges from a minimum of 25.5 °C to a maximum of 53 °C, and the specific flow rate of boreholes ranges from 0.001 to 1.85 L/s·m. Geothermal manifestations in fault block uplift areas are primarily hot springs, exposed in the Dabie Mountain fault block uplift and the Chaohu dome-fold belt, with fluid temperatures ranging from 32 °C to 63 °C. The maximum single spring flow is 1370 m3/d, and the minimum is 16.4 m3/d. In the Jiangnan platform uplift area, located to the east of the Gaotan deep fault and south of the Zhouwang deep fault, geothermal manifestations are all located in deep major fault zones, mainly consisting of hot springs, with fluid temperatures ranging from 28.5 °C to 47 °C and spring flow rates between 107.14 m3/d and 360.0 m3/d.

2.4. Sample Collection and Testing

The data for this study were obtained through collection, including 39 full geothermal water quality analyses, 34 stable hydrogen–oxygen isotope tests, and 32 tritium isotope tests. These data were obtained from a province-wide geothermal survey conducted between 2007 and 2009 (the only comprehensive geothermal water survey conducted in the province). The samples for this study were collected in August 2008. Except for geothermal spring samples, the remaining samples were collected through drilled geothermal wells, with depths ranging from 280 to 1390 m. When sampling, a smartroll multiparameter (MP) handheld device was used to measure in situ pH, groundwater temperature, electrical conductivity, oxidation reduction potential, dissolved oxygen, and total dissolved solids. Immediately after sampling, a small amount of hydrochloric acid should be added to the sample to ensure the complete dissolution of carbonates and bicarbonates, preventing the escape of carbon dioxide.
The water quality tests were performed by qualified testing institutions. Full water quality analyses were conducted at the Hefei Mineral Resources Supervision and Testing Center under the Ministry of Land and Resources. The cations (K+, Ca2+, Na+, and Mg2+) of the samples were measured using an iCAP–6300 inductively coupled plasma atomic emission spectrometer (Thermo Fisher Scientific, Waltham, MA, USA); anions such as Cl, NO3, and SO42− were measured by ICS–2100 ion chromatography (Thermo Fisher Scientific, Waltham, MA, USA); and HCO3 was measured by acid–base titration. While hydrogen–oxygen isotope (δ18O, δD, and 3H) tests were conducted at the State Key Laboratory of Hydrology, Water Resources, and Hydraulic Engineering at Hohai University. Hydrogen and oxygen isotopes were measured using the MAT253 Stable Isotope Mass Spectrometer, manufactured by Thermo Fisher Scientific (Bremen) GmbH, Bremen, Germany. All isotopic ratio results of the samples were reported in δ notation (‰) relative to the international Vienna Standard Mean Ocean Water (VSMOW) standard, and the analytical precision was ±0.6‰ for δD and ±0.2‰ for δ18O. Tritium isotopes were measured using a 1220 Quantulus ultra-low background liquid scintillation spectrometer, with a precision of less than 0.1 TU. A summary of the key hydrochemical indicators is provided in Table 1.

3. Results

3.1. Hydrochemical Characteristics

A boxplot is a graphical method used to describe the distribution of data, providing a clear visualization of its spread. In a boxplot, the thick line inside the rectangular box represents the median. The lower and upper edges of the box correspond to the first quartile (25%) and third quartile (75%), respectively. The horizontal lines extending from the ends of the box indicate the minimum and maximum values, with the lower line representing the minimum and the upper line representing the maximum. Any data points that fall outside of the box and lines are considered outliers.
To provide a clearer view of the overall hydrochemical characteristics of geothermal water, extreme outliers with Cl concentrations as high as 7068.74 mg/L were excluded from Figure 2b. As illustrated in Figure 2, significant differences in the Na+, Cl, and HCO3 concentrations are observed between the two types of geothermal water. In the basin-type geothermal water, the Na+ concentrations range from 13.27 to 4686 mg/L, with an average of 795.34 mg/L and a median of 299.23 mg/L. The Cl concentrations range from 5.27 to 7068.74 mg/L, averaging 1005.87 mg/L, with a median of 73.23 mg/L. The HCO3 concentrations range from 105.59 to 504 mg/L, with an average of 326.1 mg/L and a median of 371.38 mg/L. In contrast, the mountainous-type geothermal water has Na+ concentrations ranging from 7.7 to 310 mg/L, with an average of 94.58 mg/L and a median of 59.3 mg/L. The Cl concentrations range from 0.1 to 56.39 mg/L, averaging 13.99 mg/L, with a median of 6.38 mg/L. The HCO3 concentrations range from 32.17 to 292.26 mg/L, with an average of 119.72 mg/L and a median of 96.5 mg/L. Overall, the Na+, Cl, and HCO3 concentrations in basin-type geothermal water are significantly higher than those in mountainous-type geothermal water.
The Piper trilinear diagram, an effective tool for reducing and categorizing water quality data, visually illustrates distinct hydrochemical characteristics [42]. As shown in Figure 3, the distribution regions of basin-type and mountainous-type geothermal waters in the diamond field are nearly non-overlapping, indicating significant hydrochemical differences. Basin-type geothermal water has total dissolved solids (TDSs) ranging from 353.7 to 14,817.21 mg/L, predominantly exceeding 2000 mg/L. Its cation composition is dominated by Na+, while its anions are primarily HCO3 and Cl, with its hydrochemical types mainly classified as Cl–Na and HCO3–Na. HCO3–Na water samples are distributed in the lower part of the diamond field, with TDSs ranging from 420.9 to 621 mg/L and sampling depths of 123–1036 m, suggesting potential mixing with surface water or shallow groundwater during sampling. In comparison, the mountainous-type geothermal water exhibits lower TDSs, ranging from 97 to 1929 mg/L, with sample points distributed along the Ca axis and the HCO3+CO3 axis. Its cation composition is dominated by Na+ and Ca2+, and its anions by HCO3 and SO42−, indicating its hydrochemical types being mainly HCO3–Na·Ca, SO4–Na·Ca, and SO4–Na.

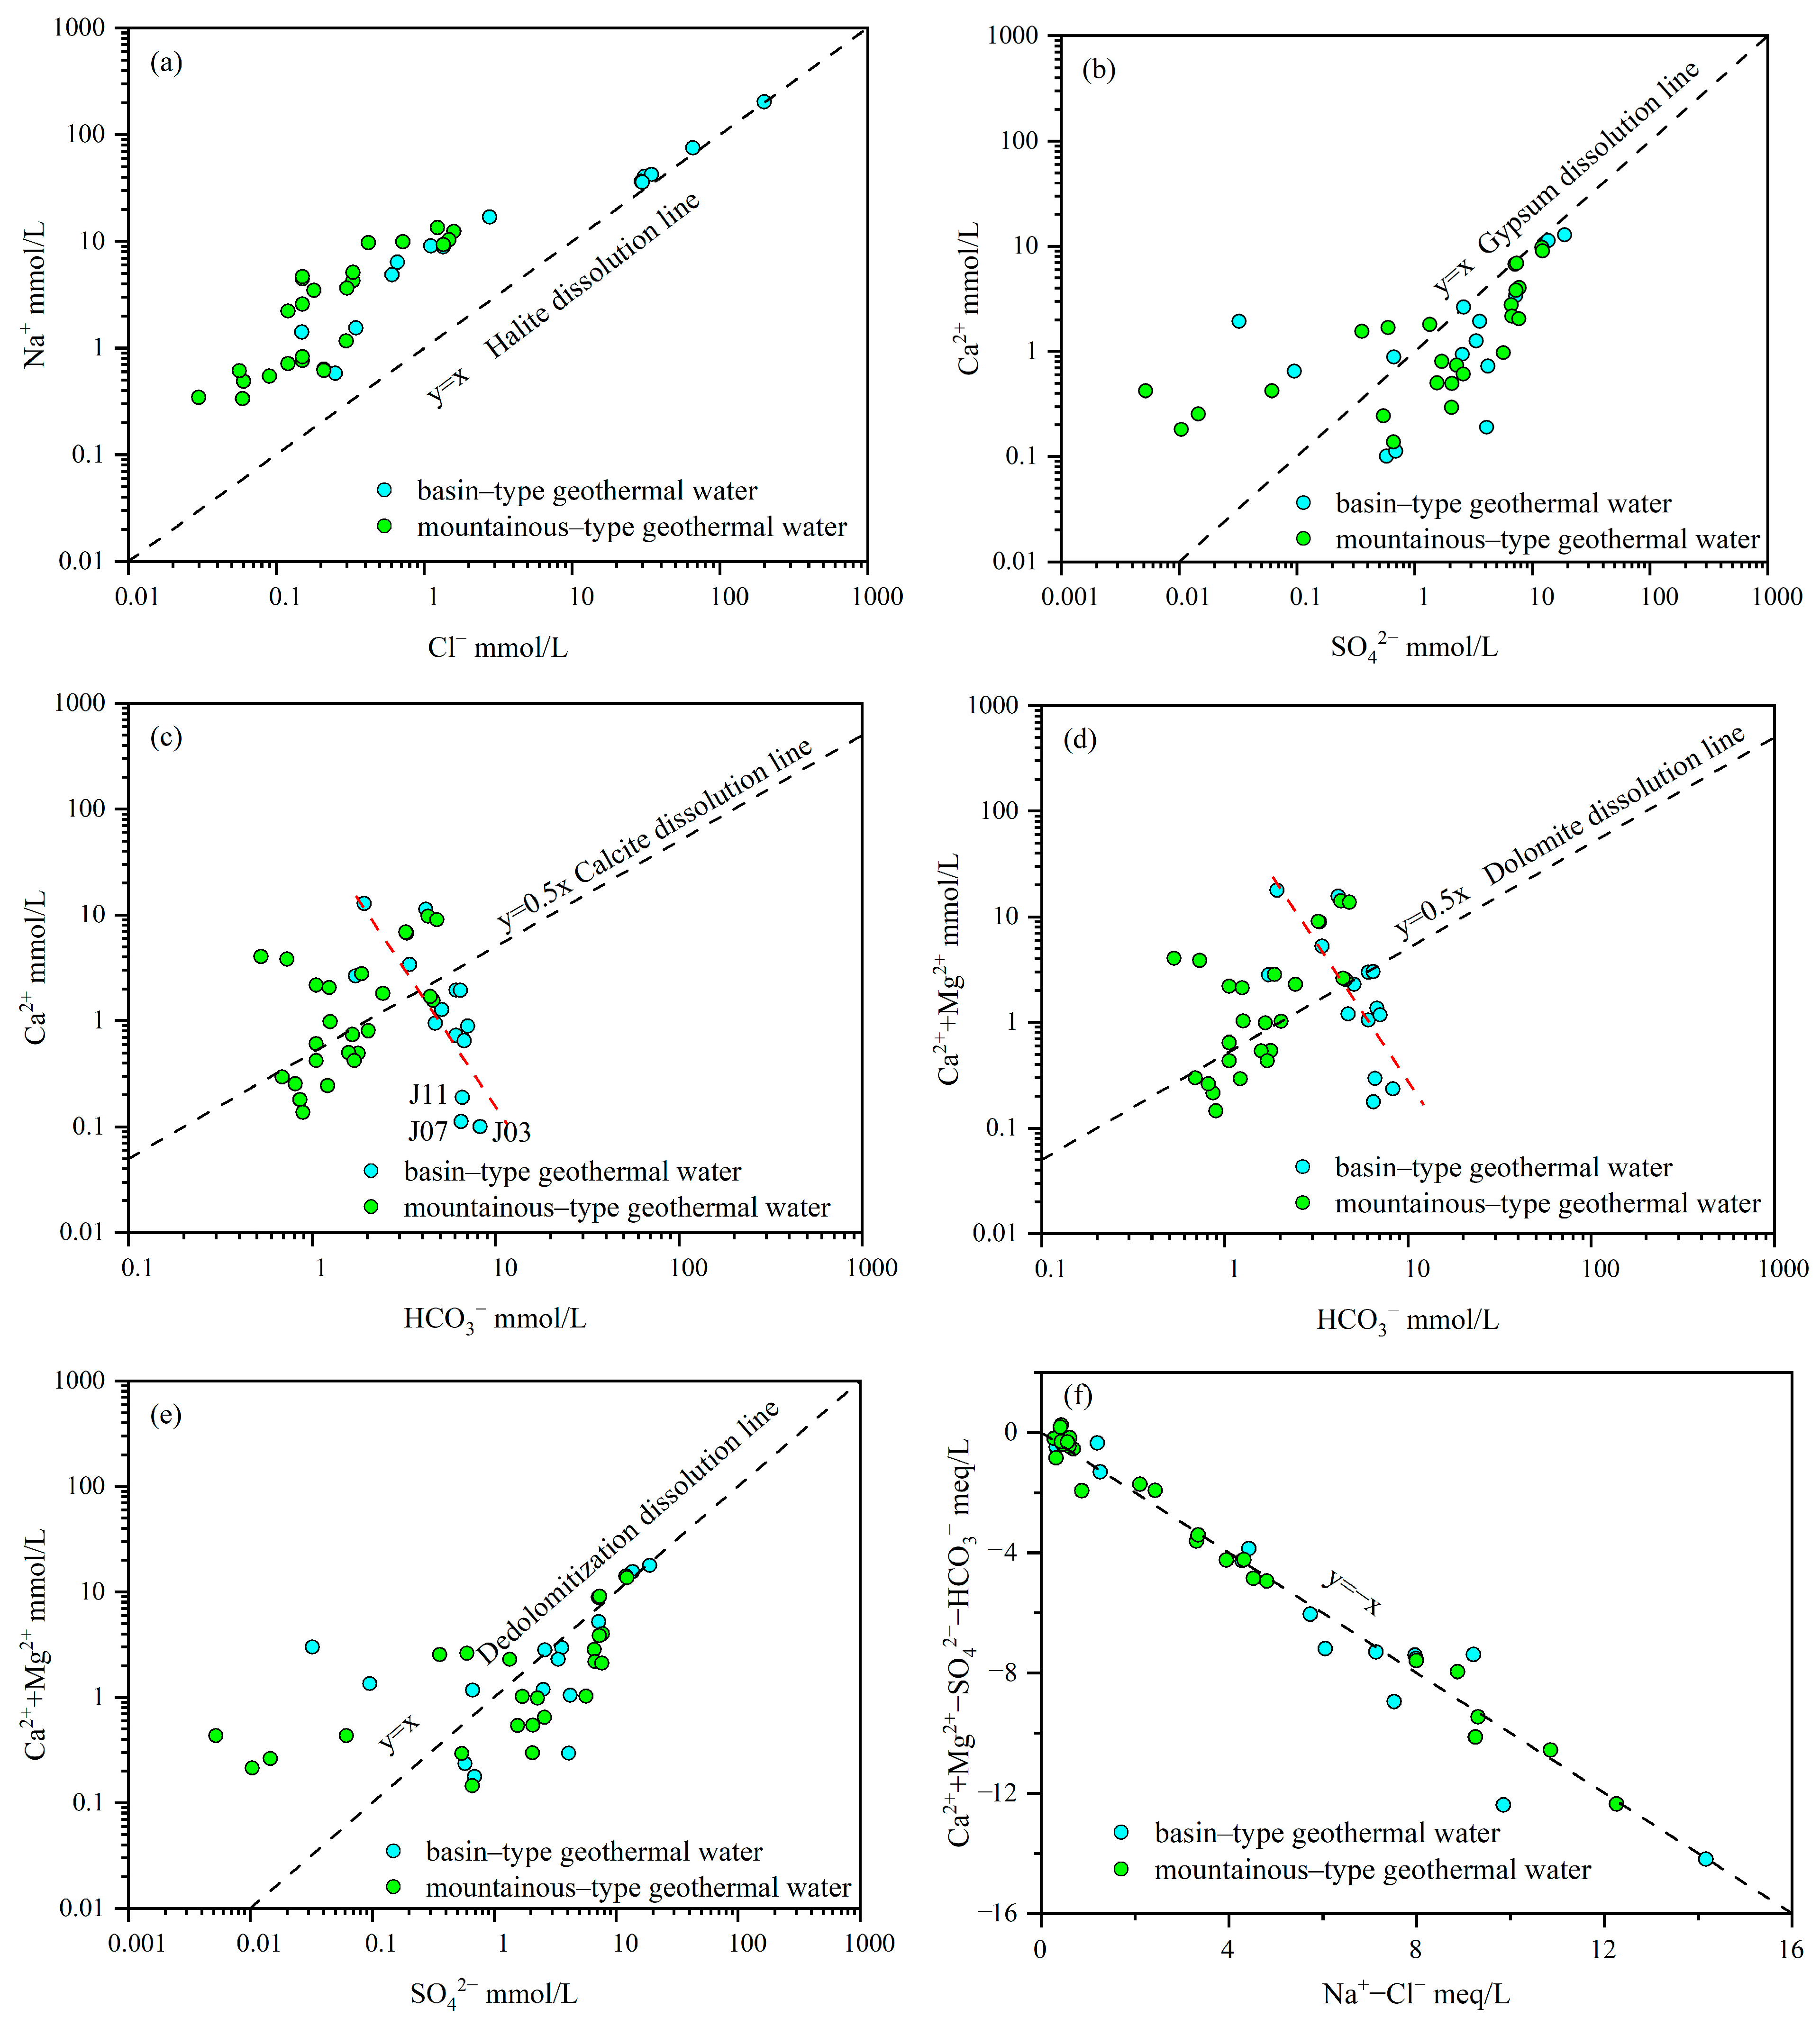
3.2. Hydrochemical Evolution

The geothermal water under varying geological conditions has undergone multiple water–rock interactions, resulting in diverse hydrochemical compositions. Dissolution, precipitation, and other chemical reactions between minerals and geothermal water are the primary processes determining water chemistry. Halite dissolution, gypsum dissolution, calcite dissolution, dolomite dissolution, dedolomitization, silicate hydrolysis, and ion exchange are major sources of Na+, Ca2+, Mg2+, HCO3, SO42−, and Cl [43,44,45]. Additionally, hydrolysis of orthoclase and albite contributes to Na+, K+, and HCO3 [46].
Figure 4a shows the distribution of Na+ and Cl in basin-type and mountainous-type geothermal waters. Some basin-type geothermal water samples align with the halite dissolution line, indicating dominance of halite dissolution. Other basin-type samples and mountainous-type geothermal waters show a similar distribution, slightly above and parallel to the halite dissolution line, with Na+ concentrations exceeding Cl, suggesting additional processes such as silicate hydrolysis that further enhance Na+ concentrations. Figure 4b presents the distribution of Ca2+ and SO42− in the two types of geothermal water. Most samples align with or fall below the gypsum dissolution line, indicating gypsum dissolution as the primary source of Ca2+ and SO42−. Some samples deviate below the gypsum dissolution line, with higher SO42− concentrations, suggesting other SO42− sources. Figure 4c,d illustrate the distribution of Ca2+ versus HCO3 and Ca2+ + Mg2+ versus HCO3, respectively, for basin-type and mountainous-type geothermal waters. Both exhibit similar distribution patterns, reflecting the common dissolution behavior of calcite and dolomite. However, basin-type geothermal water samples show a more scattered distribution along the red dashed line perpendicular to the dissolution line, indicating weaker calcite and dolomite dissolution. In contrast, mountainous-type geothermal water samples cluster along the dissolution line and its vicinity, suggesting stronger calcite and dolomite dissolution. Figure 4e displays the distribution of Ca2+ + Mg2+ versus SO42− for both geothermal water types. Samples predominantly align with or near the dedolomitization line, indicating significant dedolomitization processes. Most samples below the dedolomitization line suggest additional SO42− sources, as corroborated by Figure 4b. Figure 4f shows the distribution of Ca2+ + Mg2+–SO42−–HCO3 and Na+–Cl. Most geothermal water samples align with or near the ion exchange line, indicating notable ion exchange processes in both geothermal water types.
The saturation index (SI) is a key parameter for evaluating the chemical equilibrium between groundwater and minerals, qualitatively determining mineral dissolution or precipitation trends. SI = 0 indicates equilibrium; SI < 0 denotes undersaturation with continued dissolution, and SI > 0 indicates supersaturation with potential precipitation. To explore the saturation state of geothermal water concerning various minerals, PHREEQC Version 3 was used to calculate the SI of the geothermal water samples, with the results shown in Figure 5.
Figure 5a reveals that, except for sample J33, all basin-type geothermal water samples have calcite saturation indices (SIC) > 0, indicating calcite saturation. Similarly, all mountainous-type geothermal water samples, except for J35 and Q10, also have SIC > 0, suggesting calcite saturation. Figure 5b shows that, except for J33, all basin-type geothermal water samples have dolomite saturation indices (SID) > 0, indicating dolomite saturation. In contrast, mountainous-type geothermal water samples are primarily undersaturated (SID < 0) for dolomite dissolution, with three samples near equilibrium (SID ≈ 0) and eight samples oversaturated (SID > 0), suggesting varying saturation states. Figure 5c shows that all geothermal water samples have gypsum saturation indices (SIG) < 0, indicating undersaturation for gypsum dissolution. Similarly, Figure 5d indicates undersaturation (SIH < 0) for halite dissolution across all samples.
Overall, the analysis suggests that calcite and dolomite dissolution in basin-type geothermal water samples are saturated, indicating weak dissolution processes. These findings are consistent with the distribution patterns shown in Figure 4c,d, further supporting the inferred formation mechanisms of the geothermal water’s hydrochemical composition.

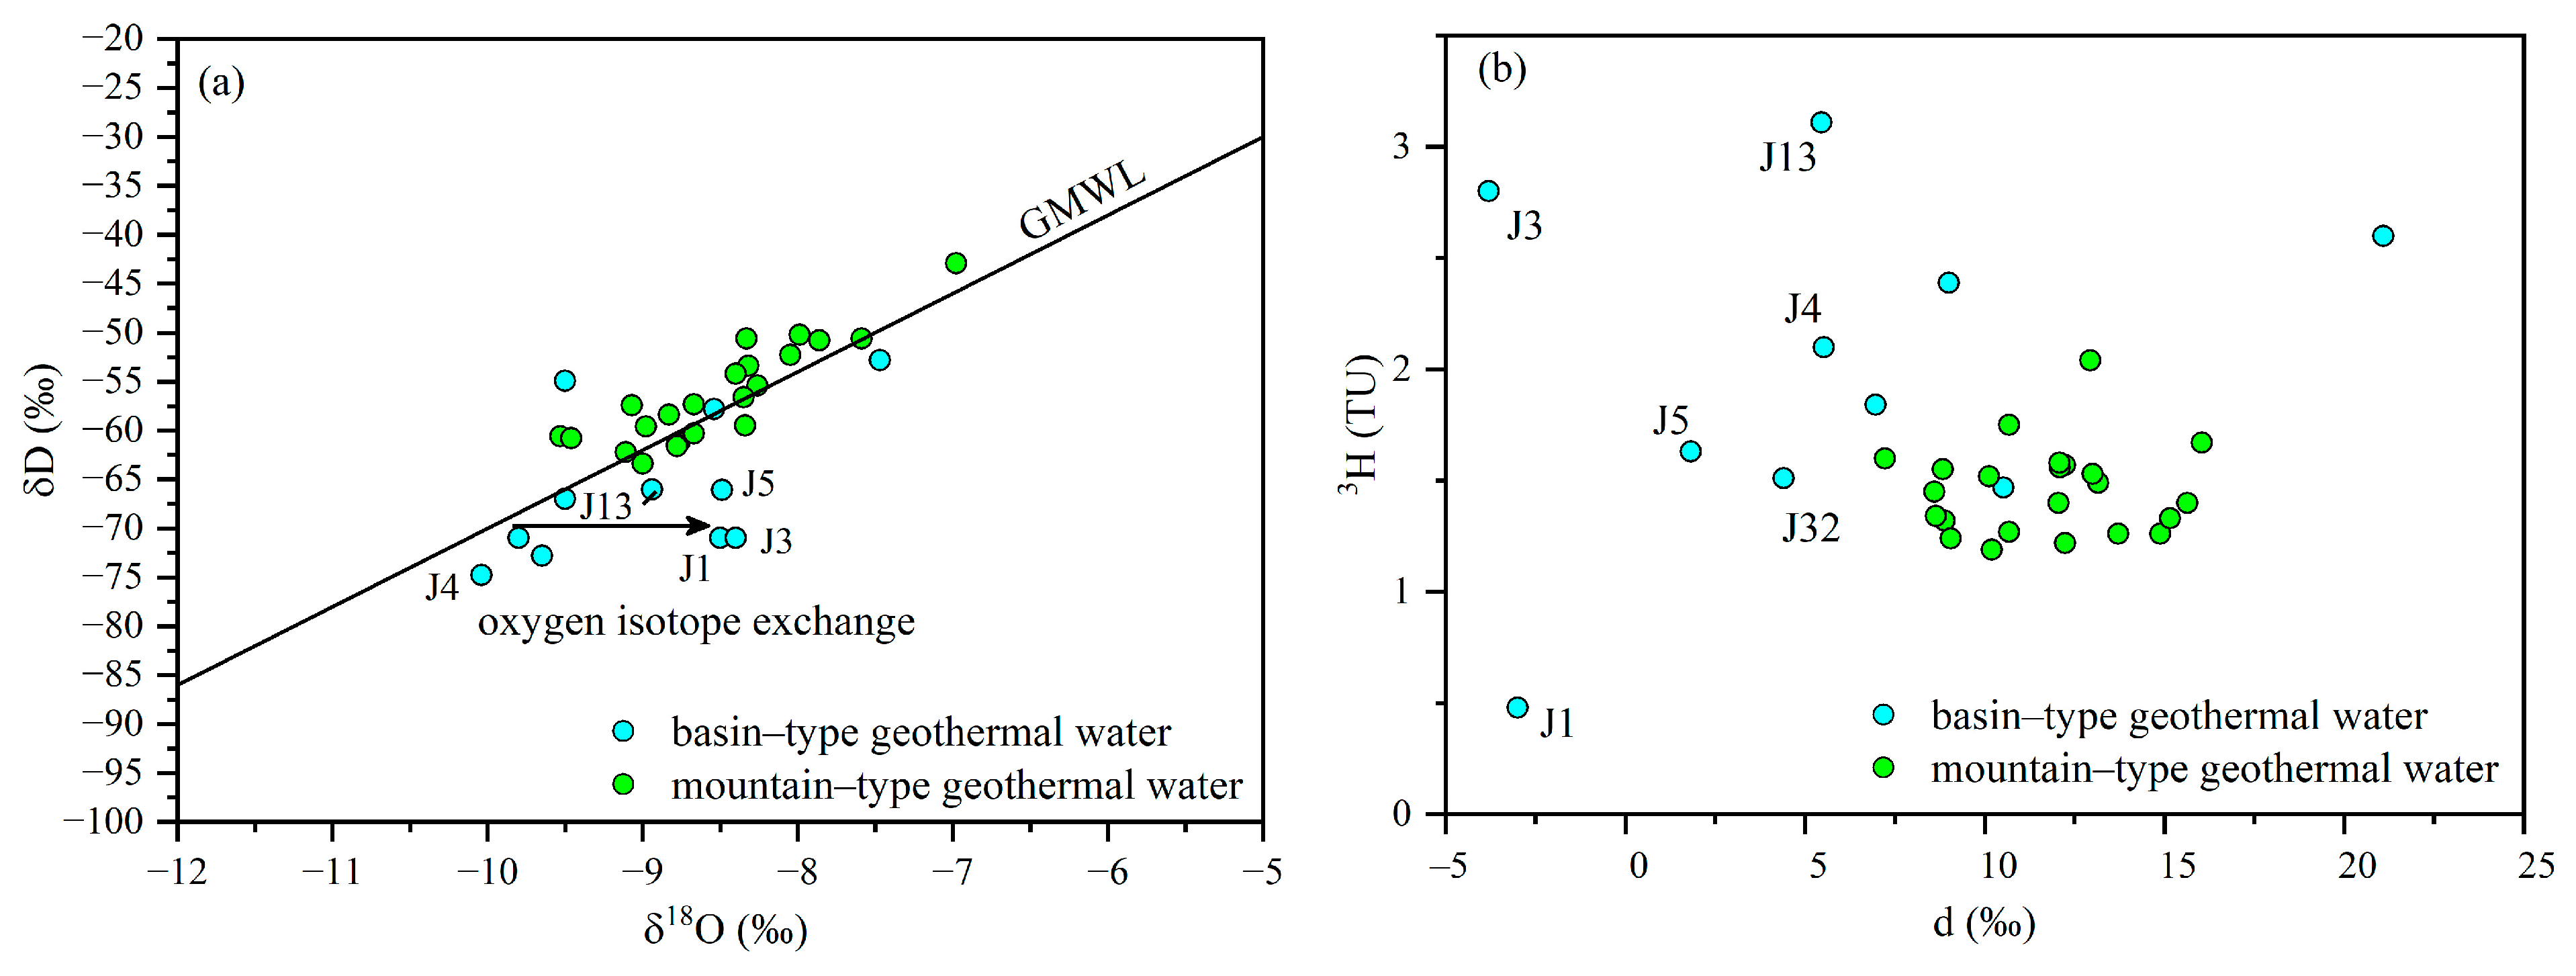
3.3. Hydrogen and Oxygen Isotope Analysis

Craig’s global meteoric water line (GMWL) provides an essential theoretical basis for studying groundwater origins [47]. Figure 6a illustrates the distribution of δD and δ18O isotopes for basin-type and mountain-type geothermal water. Except for a few outliers, these two geothermal water types are distributed in distinct regions, with most sample points located on or slightly deviating from the GMWL. This indicates that these waters are predominantly recharged by meteoric precipitation. Basin-type geothermal water has δD values ranging from −74.8‰ to −52.8‰, with an average of −65.93‰, and δ18O values ranging from −10.04‰ to −7.47‰, with an average of −8.98‰. Mountain-type geothermal water has δD values ranging from −63.4‰ to −42.9‰, with an average of −56.55‰, and δ18O values ranging from −9.53‰ to −6.98‰, with an average of −8.53‰. Overall, basin-type geothermal water exhibits more depleted δD and δ18O isotopic values compared to mountain-type geothermal water.
In basin-type geothermal water, some samples (e.g., J1, J3, J5, and J13) show significant oxygen isotope shifts. This suggests that these samples have undergone oxygen isotope exchange with quartz and feldspar minerals in the sandstone reservoir under high-temperature conditions during deep water circulation, as described by Equations (1) and (2).
The oxygen isotope exchange between quartz and geothermal water is described by Equation (1):
SiO18O + H2O↔SiO2 + H218O
The oxygen isotope exchange between feldspar and geothermal water is described by Equation (2):
CaAl2Si2O718O + H2O↔CaAl2Si2O8 + H218O
The extent of δ18O enrichment in groundwater depends on the chemical composition of oxygen-containing minerals in the aquifer, aquifer temperature, and groundwater residence time. In the same region, the δ18O value of groundwater correlates positively with its residence time [48]. According to Table 1, the water temperature of basin–type geothermal water is generally lower than that of mountain–type geothermal water. Excluding the influence of aquifer temperature, it can be inferred that the longer residence time of basin–type geothermal water in the aquifer is the primary reason for oxygen isotope exchange, indicating slower runoff velocity.
The deuterium excess parameter (d), defined as d = δD − 8δ18O by Dansgaard (1984), reflects the degree of water–rock oxygen isotope exchange in the aquifer [49]. In the same region, the d value of precipitation typically remains stable, minimally affected by factors such as seasonality and altitude. Therefore, the d value can eliminate the influence of seasonal or different recharge sources, directly indicating the extent of water–rock interactions and the aquifer’s openness. Lower d values suggest a more closed aquifer system and longer water residence times [50].
Figure 6b presents the distribution of tritium content and the d parameter for basin-type and mountain–type geothermal water. Basin–type geothermal water exhibits d values ranging from −3.8‰ to 21.1‰, with an average of 5.9‰, whereas mountain–type geothermal water has d values ranging from 7.22‰ to 16.04‰, with an average of 11.66‰. Basin–type geothermal water generally has lower d values, particularly in samples that experienced oxygen isotope exchange, indicating a more closed groundwater system with slower runoff and lower renewal rates. Conversely, mountain–type geothermal water is associated with a more open groundwater system, faster runoff, and higher renewal rates.
Groundwater age is a critical indicator for evaluating renewal capacity. According to Clark and Fritz (1997) and Cook et al. (2020) [51,52], groundwater can be categorized as modern (recharged after 1952), sub-modern (recharged between 0 and 1952 CE, 70–2000 years), and ancient (older than 2000 years). Tritium content is used for qualitative analysis of groundwater recharge. Groundwater with tritium content less than 0.8 TU is primarily recharged by sub–modern water; groundwater with tritium content between 0.8 and 4.0 TU is a mixture of sub-modern and modern water; and groundwater with tritium content greater than 4.0 TU is predominantly recharged by modern water.
Figure 6b’s δD and 3H isotope analyses reveal that the tritium content in basin-type geothermal water is more variable, ranging from 0.48 to 3.11 TU, with an average of 1.90 TU. In contrast, mountain-type geothermal water exhibits a narrower tritium range, from 1.19 to 2.04 TU, with an average of 1.46 TU. The tritium isotope analysis indicates that all samples, except J1 (recharged by sub-modern water), are recharged by a mix of sub-modern and modern water.

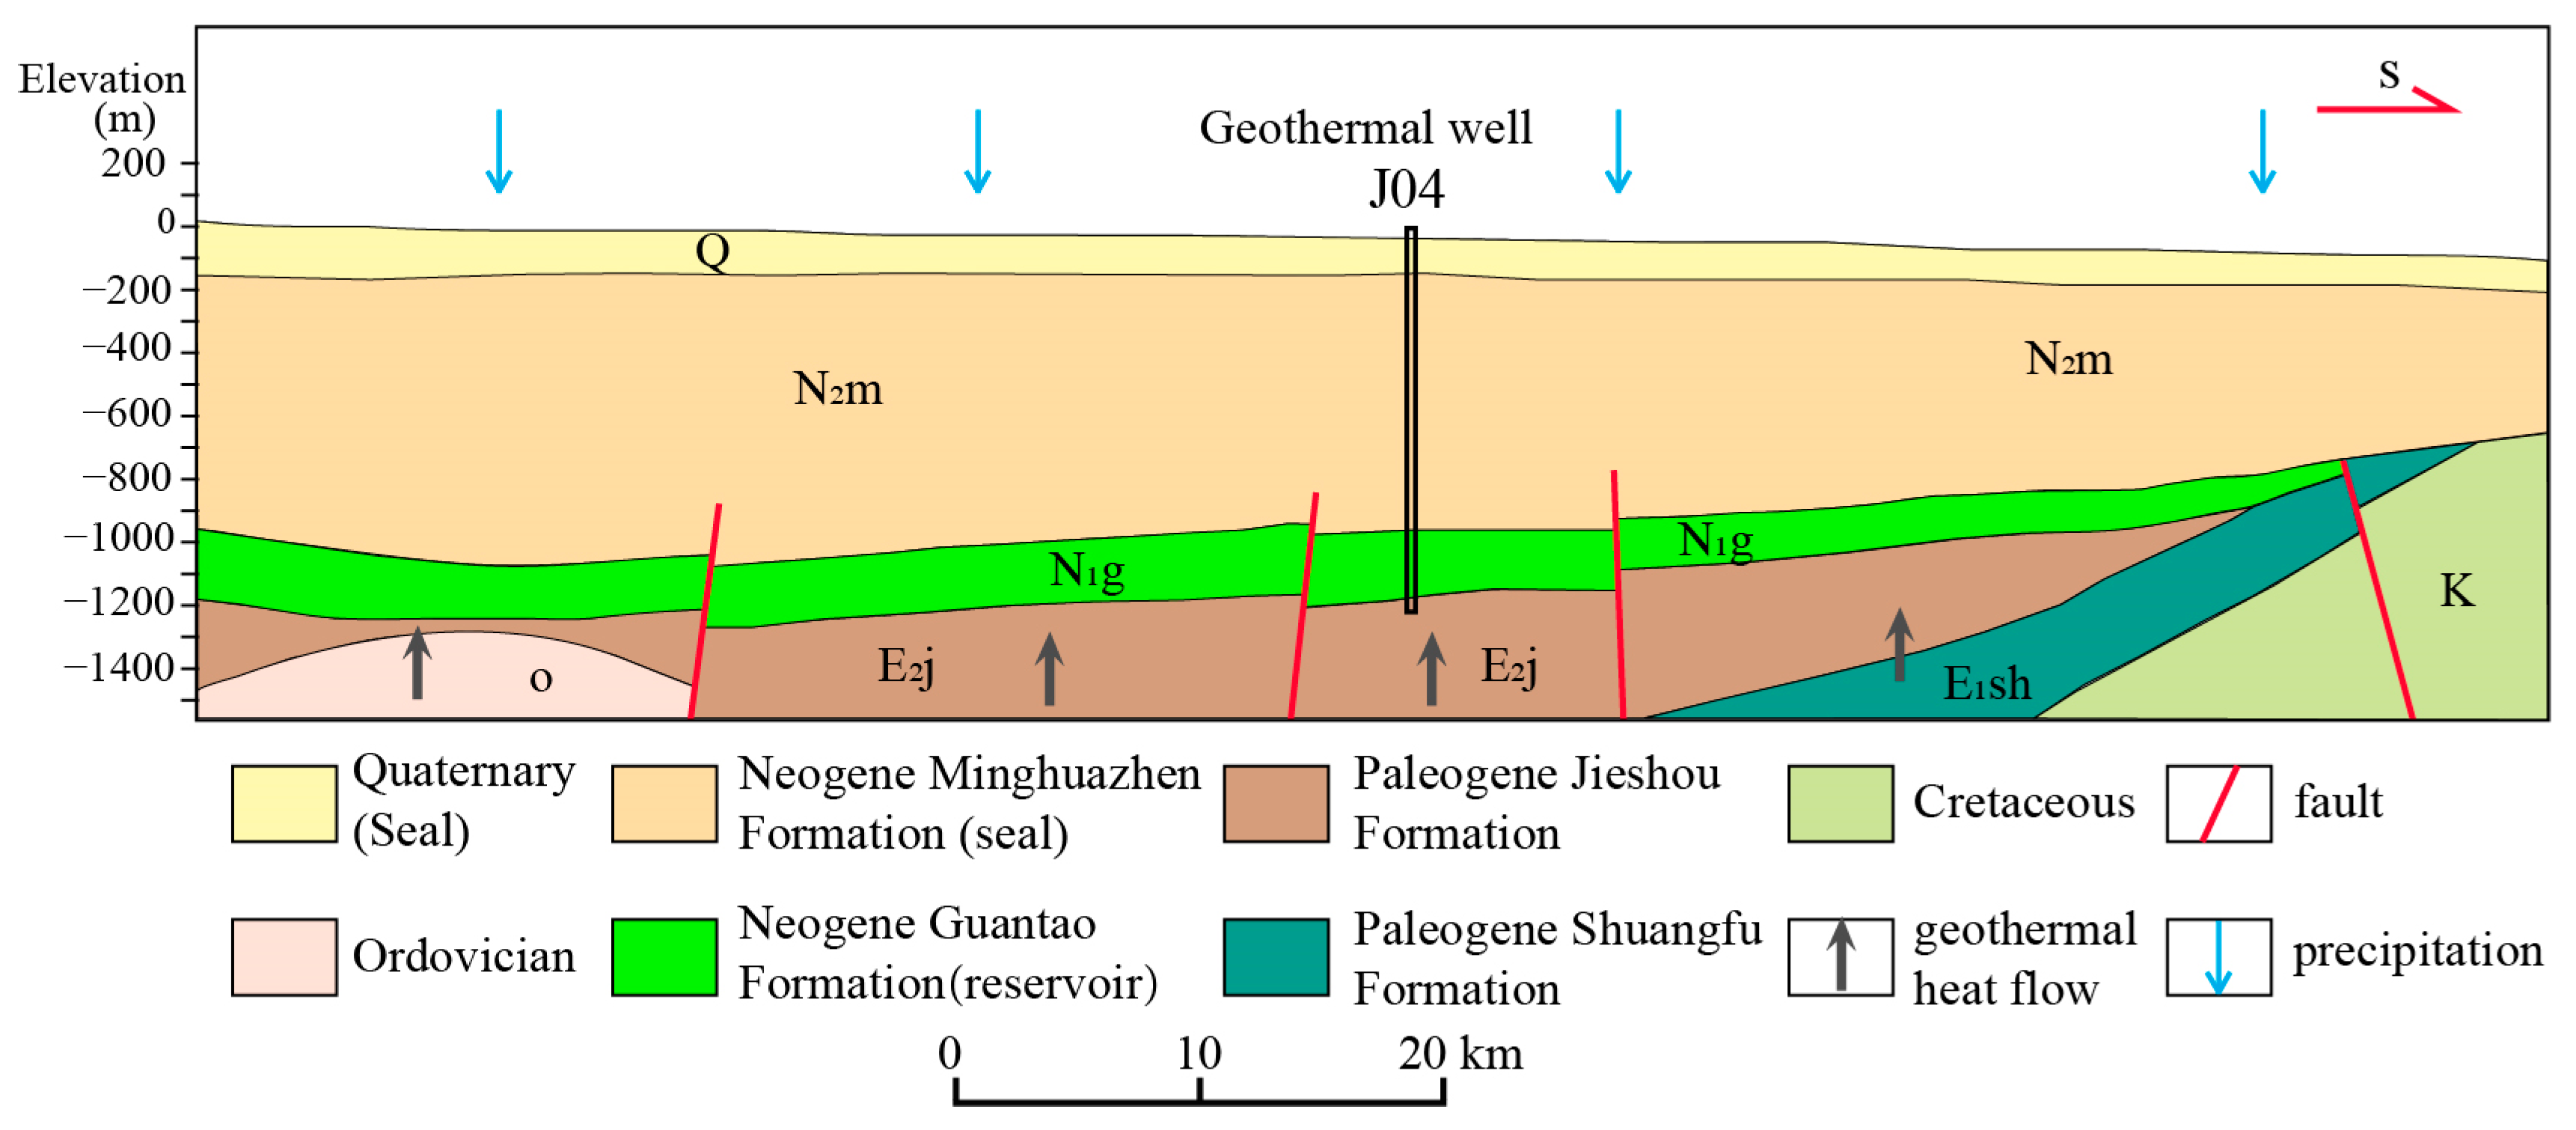
4. Genetic Models of Geothermal Systems

Based on a comprehensive analysis of the hydrogeochemical characteristics and hydrogen–oxygen isotopes of geothermal water in Anhui Province, combined with the geological conditions of the study area, two primary genetic models of geothermal systems are summarized (Figure 7 and Figure 8).
The geothermal reservoirs in basin–type systems are typically stratiform and exhibit high stability. These reservoirs are heated from below by terrestrial heat conduction and capped by thick, impermeable layers, with basin margins controlled by faults. Due to the gentle dip of the reservoirs, groundwater flow within the reservoirs is slow. The impermeable cap layer significantly restricts atmospheric precipitation recharge and surface water infiltration, resulting in extremely weak water circulation and replacement, leaving the system in an almost closed state. Water–rock interactions in basin–type systems are dominated by processes such as halite dissolution, gypsum dissolution, dedolomitization, silicate hydrolysis, and ion exchange. The primary hydrochemical type is Cl–Na.
In mountainous-type systems, geothermal reservoirs are often banded and closely associated with water-controlling faults and fractured zones, which facilitate substantial recharge from atmospheric precipitation. Precipitation infiltrates through deep faults or fracture zones into the geothermal reservoir. After absorbing heat from deep heat sources, the water emerges as hot springs or geothermal wells along heat-controlling structures. The presence of fractures and karst fissures significantly enhances the infiltration capacity of atmospheric precipitation and surface water, improving water circulation and replacement conditions. Water–rock interactions in these systems are dominated by halite dissolution, gypsum dissolution, calcite dissolution, dolomite dissolution, dedolomitization, silicate hydrolysis, and ion exchange. The primary hydrochemical types are HCO3–Na·Ca, SO4–Na·Ca, and SO4–Na.

5. Conclusions

This study systematically analyzed the hydrochemical characteristics and hydrogen–oxygen isotopes of different types of geothermal water in Anhui Province, revealing the formation mechanisms and genetic models of two categories of geothermal water. The main conclusions are as follows:
(1)
Basin–type geothermal water is primarily of the Cl–Na type, characterized by a closed system with slow groundwater flow. Dominant water–rock interactions include halite dissolution, gypsum dissolution, dedolomitization, and silicate hydrolysis.
(2)
Mountainous-type geothermal water predominantly exhibits HCO3–Na·Ca, SO4–Na·Ca, and SO4–Na hydrochemical types. It is characterized by an open system with fast groundwater flow. The major chemical components result from calcite dissolution, dolomite dissolution, gypsum dissolution, halite dissolution, dedolomitization, and silicate hydrolysis.
(3)
Isotope analysis indicates that both types of geothermal water receive mixed recharge from sub-modern and modern waters. However, the basin-type system is more closed off, with limited recharge and renewal capacity, whereas the mountainous-type system benefits from fault-induced fractures, allowing for sufficient recharge.
(4)
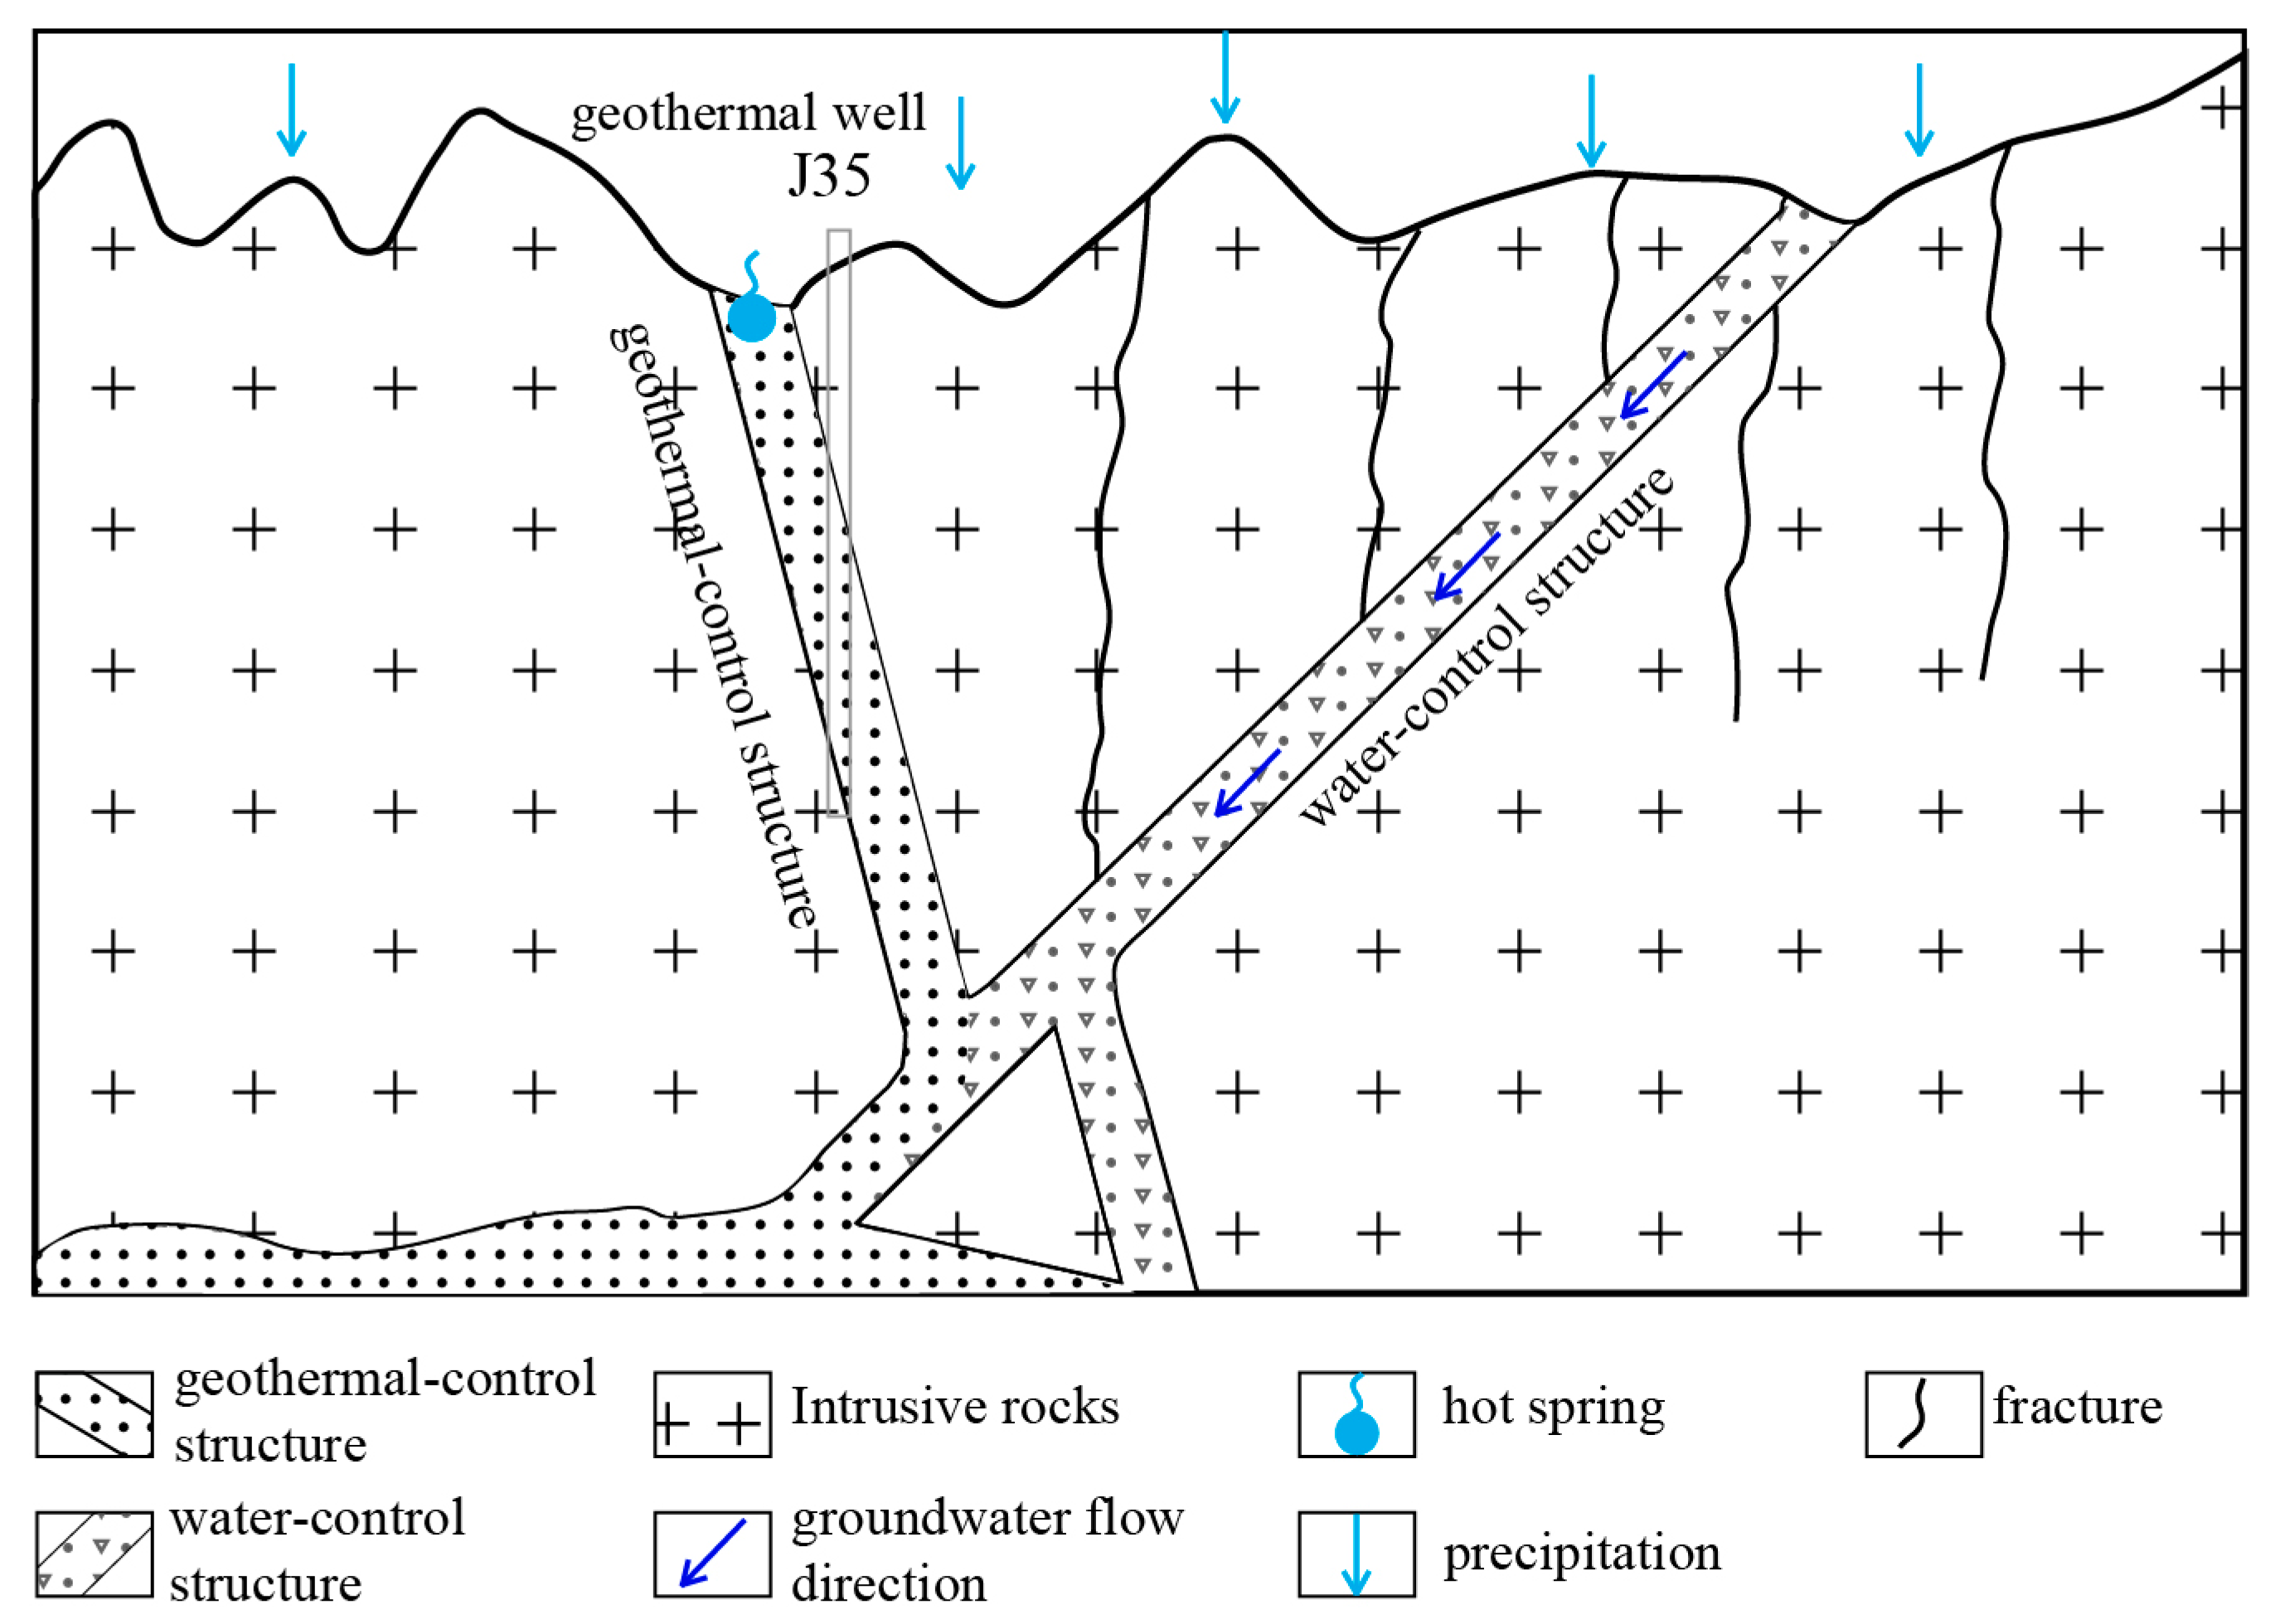
Geothermal resources in Anhui Province exhibit two primary genetic models: Basin-type geothermal resources are formed in closed reservoirs with restricted recharge. Mountainous-type geothermal resources are controlled by fault structures, with efficient precipitation recharge and faster groundwater flow.

Author Contributions

Conceptualization, X.Z.; methodology, X.Z. and Y.P.; software, X.Z.; validation, X.Z. and H.S.; formal analysis, Y.P. and Y.L.; investigation, X.Z. and Y.L.; data curation, Y.P. and Y.L.; writing—original draft preparation, X.Z., Y.P. and Y.L.; writing—review and editing, X.Z., Y.P., Y.L. and H.S.; visualization, X.Z. and Y.L.; supervision, Y.L. and H.S.; project administration, X.Z. and Y.L.; funding acquisition, Y.L. All authors have read and agreed to the published version of the manuscript.

Funding

This research was funded by China Geological Survey (grant No. DD20221732, DD20230116), and by the Science and Technology Project of Jiangxi Provincial Water Resources Department, China (grant No. 202425YBKT19), and by Nanchang Institute of Technology Student Innovation and Entrepreneurship Training Program Projects (grant No. S202311319006, 202411319004).

Data Availability Statement

The data used to support the findings of this study are available from the corresponding author upon reasonable request.

Conflicts of Interest

The authors declare no conflicts of interest.

References

  1. Jiang, Y.; Lei, Y.; Liu, J. Economic impacts of the geothermal industry in Beijing, China: An input–output approach. Math. Geosci. 2019, 51, 353–372. [Google Scholar] [CrossRef]
  2. Subić, J.; Nastić, L.; Bekić, B. Economic effects of using geothermal waters in the production of flowers and vegetables in glasshouses. Proc. Econ. Financ. 2015, 22, 131–140. [Google Scholar] [CrossRef]
  3. Gomes, L.M.F.; Guedes, J.F.; Da Costa, T.C.G.; Ferreira, P.J.C.; Trota, A.P.N. Geothermal potential of Portuguese granitic rock masses: Lessons learned from deep boreholes. Environ. Earth Sci. 2014, 73, 2963–2979. [Google Scholar] [CrossRef]
  4. Begy, R.C.; Savin, C.F.; Suele, D.K.; Giagias, E. Radiological survey of geothermal water resources in Romania and dose estimation from their use in balneotherapy. Eur. Phys. J. Spec. Top. 2023, 232, 1595–1605. [Google Scholar] [CrossRef]
  5. Hussein, M.T.; Lashin, A.; Bassam, A.A.; Arifi, N.A.; Zahrani, I.A. Geothermal power potential at the western coastal part of Saudi Arabia. Renew. Sustain. Energy Rev. 2013, 26, 668–684. [Google Scholar] [CrossRef]
  6. Mishra, G.S.; Glassley, W.E.; Yeh, S. Realizing the geothermal electricity potential–water use and consequences. Environ. Res. Lett. 2011, 6, 034023. [Google Scholar] [CrossRef]
  7. Kaczmarczyk, M.; Tomaszewska, B.; Operacz, A. Sustainable utilization of low enthalpy geothermal resources to electricity generation through a cascade system. Energies 2020, 13, 2495. [Google Scholar] [CrossRef]
  8. Banks, D. Thermogeological assessment of open–loop well–doublet schemes: A review and synthesis of analytical approaches. Hydrogeol. J. 2009, 17, 1149–1155. [Google Scholar] [CrossRef]
  9. Halilovic, S.; Bttcher, F.; Zosseder, K.; Hamacher, T. Spatial analysis of thermal groundwater use based on optimal sizing and placement of well doublets. Energy 2024, 304, 132058. [Google Scholar] [CrossRef]
  10. Zhang, L.; Gao, C.; Ji, B.; Zhang, R.; Niu, J. A simplified assessment method for estimating recoverable geothermal resources. Geothermics 2019, 79, 145–151. [Google Scholar] [CrossRef]
  11. Ciurba, A.P.; Haidu, I.; Ianc, D. Administrative Aspects Regarding the Valorisation of Geothermal Waters for Balneological Purposes in Bihor County, Romania. Sustainability 2023, 15, 10320. [Google Scholar] [CrossRef]
  12. Yousefi, H.; Roumi, S.; Armannsson, H.; Noorollahi, Y. Cascading uses of geothermal energy for a sustainable energy supply for Meshkinshahr city, northwest, Iran. Geothermics 2019, 79, 152–163. [Google Scholar] [CrossRef]
  13. Zhou, X.; Zhuo, L.; Wu, Y.; Tao, G.; Ma, J.; Jiang, Z.; Sui, L.; Wang, Y.; Wang, C.; Cui, J. Origin of some hot springs as conceptual geothermal models. J. Hydrol. 2023, 624, 129927. [Google Scholar] [CrossRef]
  14. Li, J.; Yang, G.; Sagoe, G.; Li, Y. Major hydrogeochemical processes controlling the composition of geothermal waters in the Kangding geothermal field, western Sichuan Province. Geothermics 2018, 75, 154–163. [Google Scholar] [CrossRef]
  15. Duan, R.; Li, P.; Wang, L.; He, X.; Zhang, L. Hydrochemical characteristics, hydrochemical processes and recharge sources of the geothermal systems in Lanzhou city, northwestern China. Urban Clim. 2022, 43, 101152. [Google Scholar] [CrossRef]
  16. Zhang, X.; Liu, H.; Chen, K. Geothermal geology characteristic and origin analysis of Shilin basin in Yunnan province. Adv. Mater. Res. 2013, 779, 1449–1452. [Google Scholar] [CrossRef]
  17. Yan, B.; Qiu, S.; Liu, Z.; Xiao, C. Characteristics of the geothermal water in changbai mountain volcanic region, northeast of China. Arab. J. Geosci. 2017, 10, 261. [Google Scholar] [CrossRef]
  18. Chen, L.; Ma, T.; Du, Y.; Xiao, C.; Chen, X.; Liu, C.; Wang, Y. Hydrochemical and isotopic (2H, 18O and 37Cl) constraints on evolution of geothermal water in coastal plain of southwestern Guangdong province, China. J. Volcanol. Geotherm. Res. 2016, 318, 45–54. [Google Scholar] [CrossRef]
  19. Ma, Z.; Li, X.; Zheng, H.; Li, J.; Pei, B.; Guo, S.; Zhang, X. Origin and classification of geothermal water from Guanzhong basin, NW China: Geochemical and isotopic approach. J. Earth Sci. 2017, 28, 719–728. [Google Scholar] [CrossRef]
  20. Hao, Y.; Pang, Z.; Kong, Y.; Tian, J.; Wang, Y.; Liao, D.; Fan, Y. Chemical and isotopic constraints on the origin of saline waters from a hot spring in the eastern coastal area of China. Hydrogeol. J. 2020, 28, 2457–2475. [Google Scholar] [CrossRef]
  21. Vengosh, A.; Helvacı, C.; Karamanderesi, I.H. Geochemical constraints for the origin of thermal waters from western turkey. Appl. Geochem. 2002, 17, 163–183. [Google Scholar] [CrossRef]
  22. Levet, S.; Toutain, J.P.; Munoz, M.; Berger, G.; Negrel, P.; Jendrzejewski, N.; Agrinier, P.; Sortino, F. Geochemistry of the Bagneres-de-Bigorre thermal waters from the North Pyrenean Zone (France). Geofluids 2002, 2, 25–40. [Google Scholar] [CrossRef]
  23. Liu, Z.; Zhang, M.; Li, Q.; You, S. Hydrochemical and isotope characteristics of spring water and travertine in the Baishuitai area (SW China) and their meaning for paleoenvironmental reconstruction. Environ. Geol. 2003, 44, 698–704. [Google Scholar] [CrossRef]
  24. Bianchini, G.; Pennisi, M.; Cioni, R.; Muti, A.; Cerbai, N.; Kloppmann, W. Hydrochemistry of the high–boron groundwaters of the Cornia aquifer (Tuscany, Italy). Geothermics 2005, 34, 297–319. [Google Scholar] [CrossRef]
  25. Petrini, R.; Italiano, F.; Ponton, M.; Slejko, F.; Aviani, U.; Zini, L. Geochemistry and isotope geochemistry of the Monfalcone thermal waters (northern Italy): Inference on the deep geothermal reservoir. Hydrogeol. J. 2013, 21, 1275–1287. [Google Scholar] [CrossRef]
  26. Lambrakis, N.; Zagana, E.; Katsanou, K. Geochemical patterns and origin of alkaline thermal waters in Central Greece (Platystomo and Smokovo areas). Environ. Earth Sci. 2013, 69, 2475–2486. [Google Scholar] [CrossRef]
  27. Haklidir, F.T. Hydrogeochemical evaluation of thermal, mineral and cold waters between Bursa city and Mount Uludağ in the South Marmara region of Turkey. Geothermics 2013, 48, 132–145. [Google Scholar] [CrossRef]
  28. Zhang, W.; Wang, G.; Xing, L.; Li, T.; Zhao, J. Geochemical response of deep geothermal processes in the Litang region, western Sichuan. Energy Explor. Exploit. 2019, 37, 626–645. [Google Scholar] [CrossRef]
  29. Shoedarto, R.M.; Tada, Y.; Kashiwaya, K.; Koike, K.; Iskandar, I. Specifying recharge zones and mechanisms of the transitional geothermal field through hydrogen and oxygen isotope analyses with consideration of water–rock interaction. Geothermics 2020, 86, 101797. [Google Scholar] [CrossRef]
  30. Li, Y.; Dor, J.; Zhang, C.; Wang, G.; Zhang, B.; Zhang, F.; Xing, Y. Genesis of the Xifeng Low-Temperature Geothermal Field, Guizhou, SW China: Constrains From Geology, Element Geochemistry, and D-O Isotopes. Front. Earth Sci. 2021, 9, 782943. [Google Scholar] [CrossRef]
  31. Bao, Y.; Pang, Z.; Li, Y.; Tian, J.; Luo, J.; Fan, Y.; Yang, F.; Qian, T.; Chen, F.; Sun, C.; et al. Gas isotope geochemistry of Tangquan hot spring system in Nanjing (China). Appl. Geochem. 2024, 173, 106118. [Google Scholar] [CrossRef]
  32. Wang, Y.; Li, B.; Chen, A. The Geochemical Characteristics and Genesis Mechanisms of the Zaozigou Geothermal Field. Sustainability 2024, 16, 6790. [Google Scholar] [CrossRef]
  33. Yang, H.; Yuan, X.; Chen, Y.; Liu, J.; Zhan, C.; Lv, G.; Hu, J.; Sun, M.; Zhang, Y. Geochemical Evidence Constraining Genesis and Mineral Scaling of the Yangbajing Geothermal Field, Southwestern China. Water 2024, 16, 24. [Google Scholar] [CrossRef]
  34. Yin, H.Y.; Zhou, W.; Dong, F.; Liu, Y.; Shi, C.; Meng, M.; Cheng, W. Hydrochemical characteristics and genetic mechanism of porous sandstone geothermal water in northern Jinan, Shandong, China. Environ. Sci. Pollut. Res. 2024, 31, 24180–24196. [Google Scholar] [CrossRef] [PubMed]
  35. Liu, H.; Wu, D.; Wei, W.; Fang, T.; Cheng, C.; Cheng, P.; Gao, X.; Song, Y.; Huang, J. Study on hydrochemical characteristics of underground hot water in typical granite thermal storage and hot water development model in Dabie mountain, Anhui province. Environ. Earth Sci. 2024, 83, 138. [Google Scholar] [CrossRef]
  36. Xu, J.; Gui, H.; Chen, J.; Chen, L.; Li, Y.; Zhao, C.; Guo, Y. Hydrogeochemical characteristics and formation mechanisms of the geothermal water in the Qingdong coal mine, northern Anhui province, China. Mine Water Environ. 2022, 41, 1015–1026. [Google Scholar] [CrossRef]
  37. Wang, L.; Wei, Y.; Cheng, H.; Kang, J.; Liao, A. Characteristics and potential evaluation of geothermal resources in Anhui of Yangtze River Economic Zone. Geol. China 2022, 49, 1765–1777. (In Chinese) [Google Scholar]
  38. Fang, Z.; Huang, X.; Wang, X.; Yang, Y.; Ni, H.; Zhang, B. The post seismic effect of far-field strong earthquakes of water radon and its mechanism analysis for L01 well of Lujiang geothermal hot spring. Acta Seismol. Sin. 2020, 42, 732–744. (In Chinese) [Google Scholar]
  39. Su, L.; Zhou, X.; Li, Z.; Xu, Y.; Jiang, Z. Hydrochemical and isotopic characteristics and genesis of hot springs in the Chuhe fault zone, Anhui. Geol. Rev. 2022, 68, 2022030009. (In Chinese) [Google Scholar]
  40. Armannsson, H. The fluid geochemistry of Icelandic high temperature geothermal areas. Appl. Geochem. 2016, 66, 14–64. [Google Scholar] [CrossRef]
  41. Lu, L.; Pang, Z.; Kong, Y.; Guo, Q.; Wang, Y. Geochemical and Isotopic Evidence on the recharge and circulation of geothermal water in the Tangshan geothermal system near Nanjing, China: Implications for sustainable development. Hydrogeol. J. 2018, 26, 1705–1719. [Google Scholar] [CrossRef]
  42. Piper, A.M. A graphic procedure in the geochemical interpretation of water–analyses. Trans. Am. Geophys. Union 1944, 25, 914–928. [Google Scholar]
  43. Hanshaw, B.B.; Back, W.; Deike, R.G. A geochemical hypothesis for dolomitization by ground water. Econ. Geol. 1971, 66, 710–724. [Google Scholar] [CrossRef]
  44. Back, W.; Hanshaw, B.B. Comparison of chemical hydrogeology of the carbonate peninsulas of Florida and Yucatan. J. Hydrol. 1970, 10, 330–368. [Google Scholar] [CrossRef]
  45. Hanshaw, B.B.; Back, W. Major geochemical processes in the evolution of carbonate–aquifer systems. J. Hydrol. 1979, 43, 287–312. [Google Scholar] [CrossRef]
  46. Gastmans, D.; Chang, H.K.; Hutcheon, I. Groundwater geochemical evolution in the northern portion of the Guarani Aquifer System (Brazil) and its relationship to diagenetic features. Appl. Geochem. 2010, 25, 16–33. [Google Scholar] [CrossRef]
  47. Toth, J. A theoretical analysis of groundwater flow in small drainage basins. J. Geophys. Res. 1963, 68, 4795–4812. [Google Scholar] [CrossRef]
  48. Yin, G.; Ni, S. Deuterium excess parameter and geohydrology significance. Bull. Mineral. Petrol. Geochem. 2001, 20, 409–411. [Google Scholar]
  49. Dansgaard, W.; Johnson, S.J.; Clausen, H.B.; Dahl-Jensen, D.; Gundestrup, N.; Hammer, C.U.; Oeschger, H. North Atlantic climatic oscillations revealed by deep Greenland ice cores, Climate Processes and Climate Sensitivity, Geophys. Clim. Process. Clim. Sensit. 1984, 29, 288–298. [Google Scholar]
  50. Wang, X.; Qiao, W.; Chen, J.; Liu, X.; Yang, F. Understanding the Burial and Migration Characteristics of Deep Geothermal Water Using Hydrogen, Oxygen, and Inorganic Carbon Isotopes. Water 2018, 10, 7. [Google Scholar] [CrossRef]
  51. Clark, I.D.; Fritz, P. Environmengtal Isotopes in Hydrogeology; Lewis Publishers: Boca Raton, FL, USA, 1997; pp. 27–271. [Google Scholar]
  52. Cook, P.G. Introduction to Isotopes and Environmengtal Tracers as Indicators of Groundwater Flow; The Groundwater Project: Guelph, ON, Canada, 2020. [Google Scholar]
Figure 1. Hydrogeological map and distribution of geothermal water samples in the study area (In the figure, J represents geothermal wells, and Q represents hot springs).
Water 17 00236 g001
Figure 2. Boxplot of major ions in geothermal water: (a) boxplot of Ca+, Mg2+ and HCO3; (b) boxplot of Na2+, Cl and SO42−.
Water 17 00236 g002
Figure 3. Piper diagram of geothermal water.
Water 17 00236 g003
Figure 4. Ion proportion diagram of geothermal water: (a) scatter plot of Na+ and Cl; (b) scatter plot of Ca2+ and SO42−; (c) scatter plot of Ca2+ and HCO3; (d) scatter plot of Ca2+ + Mg2+ and HCO3; (e) scatter plot of Ca2+ + Mg2+ and SO42−; (f) scatter plot of Ca2+ + Mg2+–SO42−–HCO3, and Na+–Cl.
Water 17 00236 g004
Figure 5. Saturation indices of mineral dissolution in geothermal water: (a) scatter plot of SI_calcite and HCO3; (b) scatter plot of SI_dolomite and HCO3; (c) scatter plot of SI_gypsum and SO42−; (d) scatter plot of SI_halite and Na+.
Water 17 00236 g005
Figure 6. Hydrogen and oxygen isotopic composition of geothermal water: (a) scatter plot of δD and δ18O; (b) scatter plot of 3H and d.
Water 17 00236 g006
Figure 7. Genetic model of basin-type geothermal systems.
Water 17 00236 g007
Figure 8. Genetic model of mountainous-type geothermal systems.
Water 17 00236 g008
Table 1. Overview of water chemistry indicators for geothermal water.
CategoryParameterNo. of SamplesMinMaxMeanMedianStd.Skewness
Basin-type
geothermal water
T (°C)1425.50 53.00 36.66 32.19.12 0.55
pH147.10 8.68 7.93 7.980.52 −0.22
K (mg/L)141.26 44.00 7.63 4.8611.25 3.00
Na (mg/L)1413.27 4686.00 795.34 299.231227.10 2.78
Ca (mg/L)144.01 512.24 111.23 44.28162.35 2.06
Mg (mg/L)141.59 123.83 28.50 12.5238.50 1.90
Cl (mg/L)145.27 7068.74 1005.87 73.231884.67 2.92
SO4 (mg/L)143.10 1810.00 426.50 286.16526.83 1.88
HCO3 (mg/L)14105.59 504.00 326.10 371.38118.53 −0.71
TDS (mg/L)14353.70 14,817.21 2607.85 1602.463766.78 2.98
18O‰11−10.04 −7.47 −8.98 −8.940.78 0.44
D‰11−74.80 −52.80 −65.93 −677.51 0.79
3H (TU)100.48 3.11 1.99 1.970.77 −0.47
d‰11−3.80 21.10 5.94 5.526.77 0.75
Mountainous-type
geothermal water
ParameterNo. of SamplesMinMaxMeanMedianStd.Skewness
T (°C)2528.50 66.00 46.76 4710.45 0.19
pH256.90 8.86 7.95 8.220.57 −0.31
K (mg/L)250.05 16.76 5.35 4.584.21 0.93
Na (mg/L)257.70 310.00 94.58 59.397.37 1.01
Ca (mg/L)255.50 387.70 93.37 39.01113.02 1.59
Mg (mg/L)250.10 114.02 16.39 1.232.22 2.36
Cl (mg/L)250.1 56.39 13.99 6.3816.97 1.69
SO4 (mg/L)250.50 1175.77 370.51 199.7367.39 0.81
HCO3 (mg/L)2532.17 292.26 119.72 96.581.84 1.09
TDS (mg/L)2597.00 1929.00 724.96 457569.51 0.68
18O‰23−9.53 −6.98 −8.53 −8.670.59 0.64
D‰23−63.40 −42.90 −56.55 −57.45.16 0.88
3H (TU)231.19 2.04 1.46 1.450.20 1.02
d‰237.22 16.04 11.66 12.082.48 0.09
Disclaimer/Publisher’s Note: The statements, opinions and data contained in all publications are solely those of the individual author(s) and contributor(s) and not of MDPI and/or the editor(s). MDPI and/or the editor(s) disclaim responsibility for any injury to people or property resulting from any ideas, methods, instructions or products referred to in the content.

