Article

Experimental Study on the Behavior of Gas–Water Two-Phase Fluid Flow Through Rock Fractures Under Different Confining Pressures and Shear Displacements

1
School of Architectural Engineering, Kaili University, Kaili 556011, China
2
State Key Laboratory of Intelligent Construction and Healthy Operation & Maintenance of Deep Underground Engineering, China University of Mining and Technology, Xuzhou 221116, China
3
Flexible Research Center, Shenhua XinJie Energy Co., Ltd., Ordos 017200, China
*
Author to whom correspondence should be addressed.
Water 2025, 17(3), 296; https://doi.org/10.3390/w17030296
Submission received: 29 October 2024 / Revised: 24 December 2024 / Accepted: 14 January 2025 / Published: 22 January 2025
(This article belongs to the Section Hydraulics and Hydrodynamics)

Abstract

:
Understanding the flow behaviors of two-phase fluids in rock mass fractures holds significant importance for the exploitation of oil and gas resources. This paper takes rock fractures with different surface roughness characteristics as its research object and conducts experiments on the gas–water seepage laws of fractures under various confining pressures and shear displacements. The results indicate that the higher the fracture surface roughness, the larger the equivalent fracture width and the higher the single-phase permeability of gas/water in the fractures. During gas–water two-phase flow, when the water phase split flow rate is high, the influence of the confining pressure and fracture surface morphology on the water phase is significantly higher than that on the gas phase. The relative permeability at the isosmotic point of the fractures increases with the increase in confining pressure and decreases with the increase in roughness. After the dislocation of shale fractures, the interphase resistance within the fractures reduces. The relative permeability of the water phase increases more significantly compared to that of the gas phase. The water phase split flow rate at the isosmotic point does not change significantly, and the relative permeability at the isosmotic point increases. This research is helpful for guiding the protection based on the conductivity capacity of the rock mass fracture network.

1. Introduction

In order to actively address the environmental issues caused by greenhouse gases such as global warming, the utilization of clean energy as a substitute for coal, oil, and other fossil fuels has emerged as a prominent research focus in the current energy sector [1,2]. The shale gas revolution in the United States has transformed it from an energy importer to an exporter, leading countries worldwide to pay increased attention to shale gas extraction. Shale reservoirs typically exhibit low matrix permeability and pose challenges in forming effective pathways for gas production through natural fractures [3]. To enable the large-scale exploitation of shale gas resources, hydraulic fracturing and other technologies are extensively employed for reservoir transformation, aimed at enhancing gas recovery efficiency [4]. During shale hydraulic fracturing operations, self-supported fractures are created within the shale formation. Preserving the seepage capacity of this fracture network is crucial for optimizing production systems [5,6]. In this context, multiphase fluid flow involving both gas and water becomes common during shale gas exploitation due to “one thousand sands and ten thousand liquids” entering into the formation. Different flow patterns emerge depending on component proportions and flow conditions; however, compressibility effects make two-phase flow involving gas–liquid interactions particularly complex [7]. As individual fractures constitute fundamental components of rock mass fracture networks, understanding how geometric characteristics of self-supported fractures influence two-phase flow behavior can provide valuable insights into supporting optimization efforts aimed at safeguarding well productivity via seepage capacity preservation within these fracture networks [8,9,10,11].
To accurately characterize seepage flow in rock fractures, scholars have conducted extensive research through indoor experiments and numerical simulations. The cubic law is the fundamental equation describing low-velocity single-phase fluid flow in fracture. To verify its validity, Hasanain [12] conducted an experimental study of fluid flow in parallel plate fracture. However, there is a significant difference between idealized models of parallel plate fracture and actual rock fractures. In order to apply the cubic law to natural rough-surfaced fracture, Bartonns et al. [13] proposed a correction method for the roughness correction coefficient of fracture surfaces and carried out seepage tests imitating natural fractures. They found that the correction coefficient was related to the distribution of bump heights on fracture surfaces. Based on standard profile curves of joint roughness (JRC) and using reverse digital modeling methods, Jaeger et al. [14] investigated seepage patterns in different JRC fractures. These studies have deepened our understanding of fluid flow laws in fractures; however, actual production processes for natural gas resources involve fluid–solid interaction processes where fracture aperture and surface roughness are subject to localized contact, shear slip, and structural surface damage during fracturing processes [15,16], resulting in various complex fractures such as infill fractures, shear-slip seams, and closure seams formed in situ [17,18,19]. Studies on single-phase fluid flow laws show that permeability weakens under peri-compression but strengthens under shear stress with this tendency becoming more pronounced with larger surface roughness [20,21,22,23]. However, it remains unclear how two-phase fluid flows evolve with different levels of stressed fracture.
Self-supported fractures play a crucial role as conduits for natural gas flow, making it imperative to investigate the flow conductivity and two-phase fluid flow behavior of these fractures. Such studies are essential in guiding the development and modification of unconventional natural gas reservoirs. While Xu et al. [24] established a mathematical model for gas–water two-phase seepage in shale gas reservoirs, they did not consider the distribution of reservoir saturation after fracturing fluid returns. Building upon this research, Duncan [25] developed a numerical model for gas–water two-phase seepage in dual media during the hydraulic fracturing of horizontal wells in shale gas reservoirs, which accounts for desorption/adsorption, diffusion, slip, and stress sensitivity. Huang [26] conducted an extensive investigation into the laws governing gas–water two-phase fluid flow at multiple micro-scales and discovered that the impact of microfracture aperture and water film on relative permeability depends on the relative size occupied by each phase within the flow space. Furthermore, several scholars have constructed theoretical models to establish relative permeability curves for gas–water two-phase flows. For instance, Li [27] combined Poiseuille’s law with considerations of interfacial effects to develop analytical equations representing phase permeability curves specific to shale formations. Shad et al. [28] examined the two-phase fluid flow behavior within smooth parallel-plate fractures and found that relative permeability is influenced not only by fluid saturation and flow structure but also by fracture orientation. Fourar et al. [29] based on their study of two-phase flows in smooth parallel plates proposed a relative permeability model incorporating viscous coupling between phases.
The primary focus of this study is to investigate the gas–water two-phase fluid flow in rock fractures under pressure and shear, with an emphasis on utilizing three-dimensional morphology scanning to characterize the cross-section morphology of artificially cleaved rock fractures. Furthermore, a systematic investigation is conducted to explore the influence of fracture surface roughness, confining pressure, shear, and other factors on the seepage characteristics of gas–water two-phase fluid flow in rock fractures. The ultimate goal is to provide theoretical guidance for optimizing production systems and parameter extraction in shale gas resource exploitation.

2. Test Samples and Test Methods

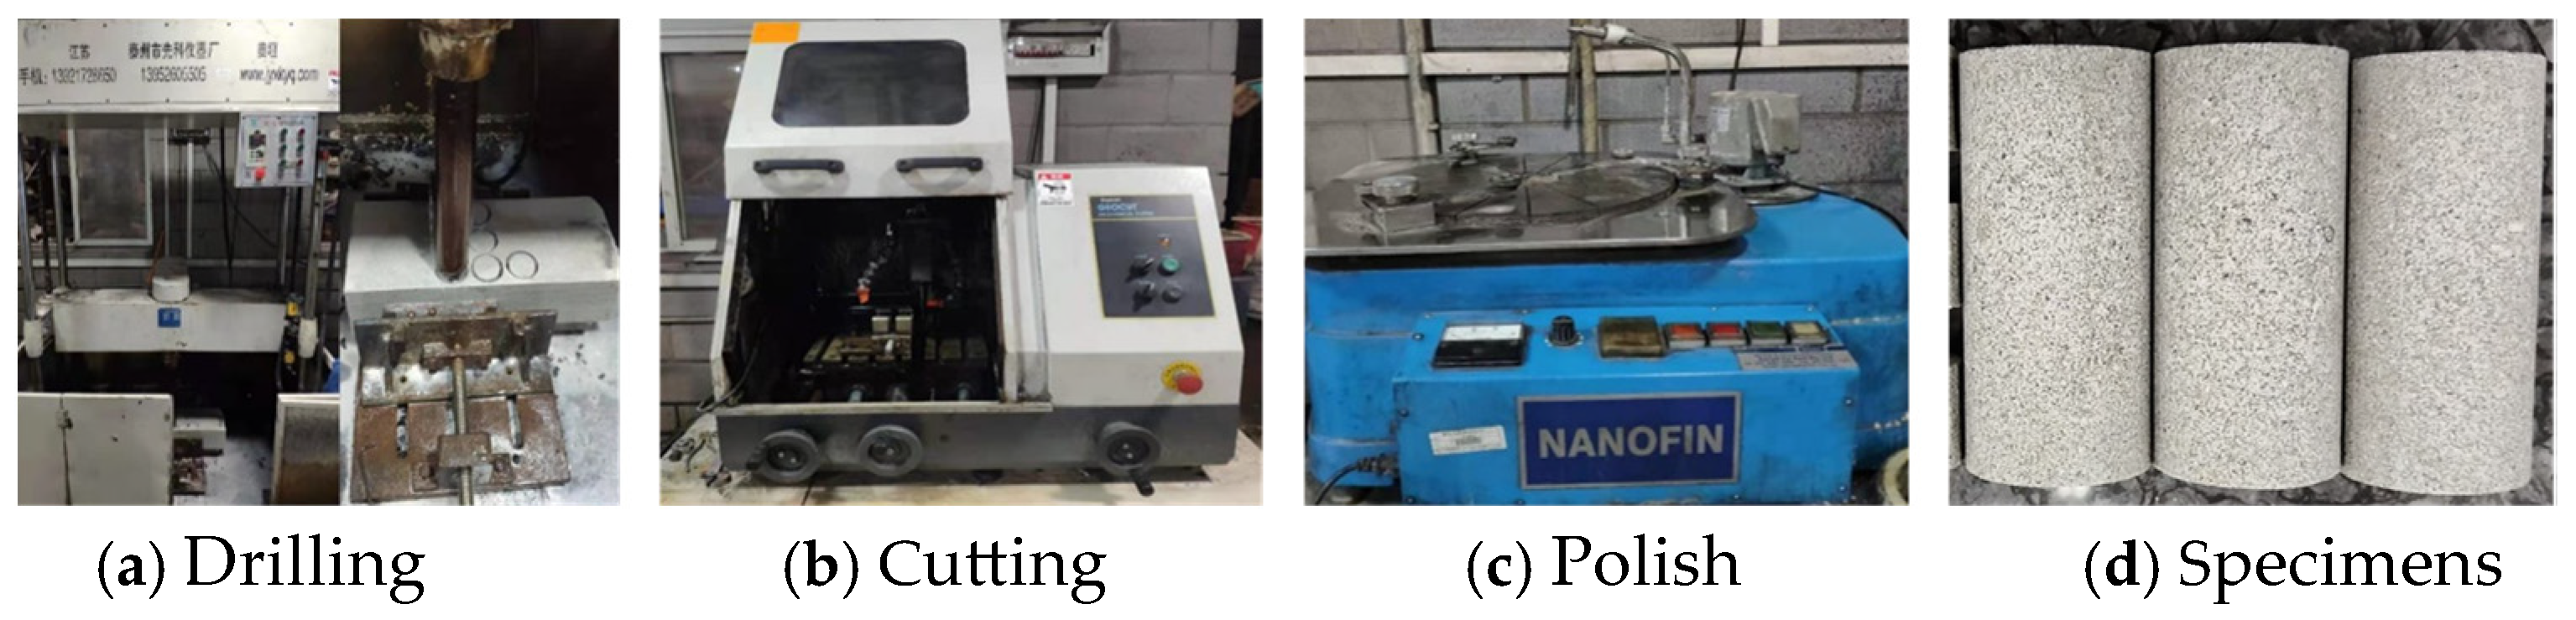
2.1. Rock Fractured Specimen Preparation

The sandstone utilized in this study was subjected to drilling, resulting in cylindrical cores measuring 50 mm in diameter and 100 mm in height. These cores were subsequently transformed into standard cylindrical specimens through cutting and grinding procedures (Figure 1). To obtain fracture specimens with varying surface morphology, a range of auxiliary splitting devices with joint roughness coefficient (JRC) values ranging from 0 to 20 were employed on the sandstone specimens using a uniaxial compression tester. When there is no shear displacement, the upper and lower sections of the fracture are in correspondence with each other and do not produce relative dislocation, and this is referred to as in situ closed fracture. This allows for the generation of in situ closed fracture specimens exhibiting different roughness characteristics. From these, five fracture specimens with roughness values of 4.52, 7.24, 44.53, 15.85, and 18.75 were selected for conducting seepage tests (Figure 2).

2.2. Characterization of the Rough Morphology of Rock Fracture

The surface morphology of the rock fracture following splitting was quantified using Cronos Dual, a high-precision non-contact 3D optical digitizing topographer. The acquired data were exported in two formats: point cloud and triangle mesh. Since the fracture surface may not have been leveled during the 3D topographic scanning process, resulting in skewed coordinates of the topographic scans, a least squares-based algorithm was used in this study to flatten the coordinate files after the topographic scans. The obtained measurements were processed in MATLAB 2022 software for coordinate conversion based on the principle illustrated below [30].
X i Y i Z i = R α , β , γ x i y i z i + x 0 y 0 z 0
The coordinates of the converted points Xi, Yi, and Zi are determined by the original point coordinates xi, yi, and zi through a scale parameter R and rotation matrix [α, β, γ]. Here α, β, and γ represent unit vectors in 3 × 1 dimensions. Additionally, [x0, y0, z0]T denotes the conversion vector between coordinate systems. The process of coordinate conversion in Equation (1) is as follows: first, the normal vector of the fitted plane is obtained via the least squares method; second, the angle between the normal vector of the fitted plane and the unit vector of the initial coordinate system is obtained; then, the rotation matrix [α, β, γ] is obtained; after the leveling, the fitted plane is used as the reference plane for translation, and the translation vector is [x0,y0,z0]T. The leveled fracture surface is obtained after the above operation. The surface morphology data of the leveled fracture surface were imported into Surfer 15.0 drawing software for 3D reconstruction. Figure 2 illustrates the resulting 3D morphology cloud map of the fracture surface, with all measurements presented in millimeters. In this representation, red indicates elevated areas, while blue represents depressions on the surface. To quantify the roughness of this fracture’s surface morphology accurately along its seepage direction, it was divided into ten equally spaced regions from which nine 2D rough fracture profiles were extracted (Figure 2). These profiles facilitated the calculation of both the two-dimensional morphological parameters and the overall surface roughness for each group of sandstones fractures by averaging their values.
To quantitatively characterize the topographic roughness of the fracture surface, Tse and Cruden introduced and widely adopted the concept of Joint roughness coefficient (JRC), which is determined using the following equation [31]:
J R C = 32.2 + 32.47 lg Z 2
where Z2 is the root mean square of the first-order derivative of the absolute height of the fracture surface, calculated as follows:
Z 2 = 1 n 1 i = 1 n 1 y i + 1 y i x i + 1 x i 2 1 2
Table 1 lists the roughness of each profile of the fractured surface calculated using Equation (3) and the roughness of the fractured surface obtained by averaging the roughness of each profile.

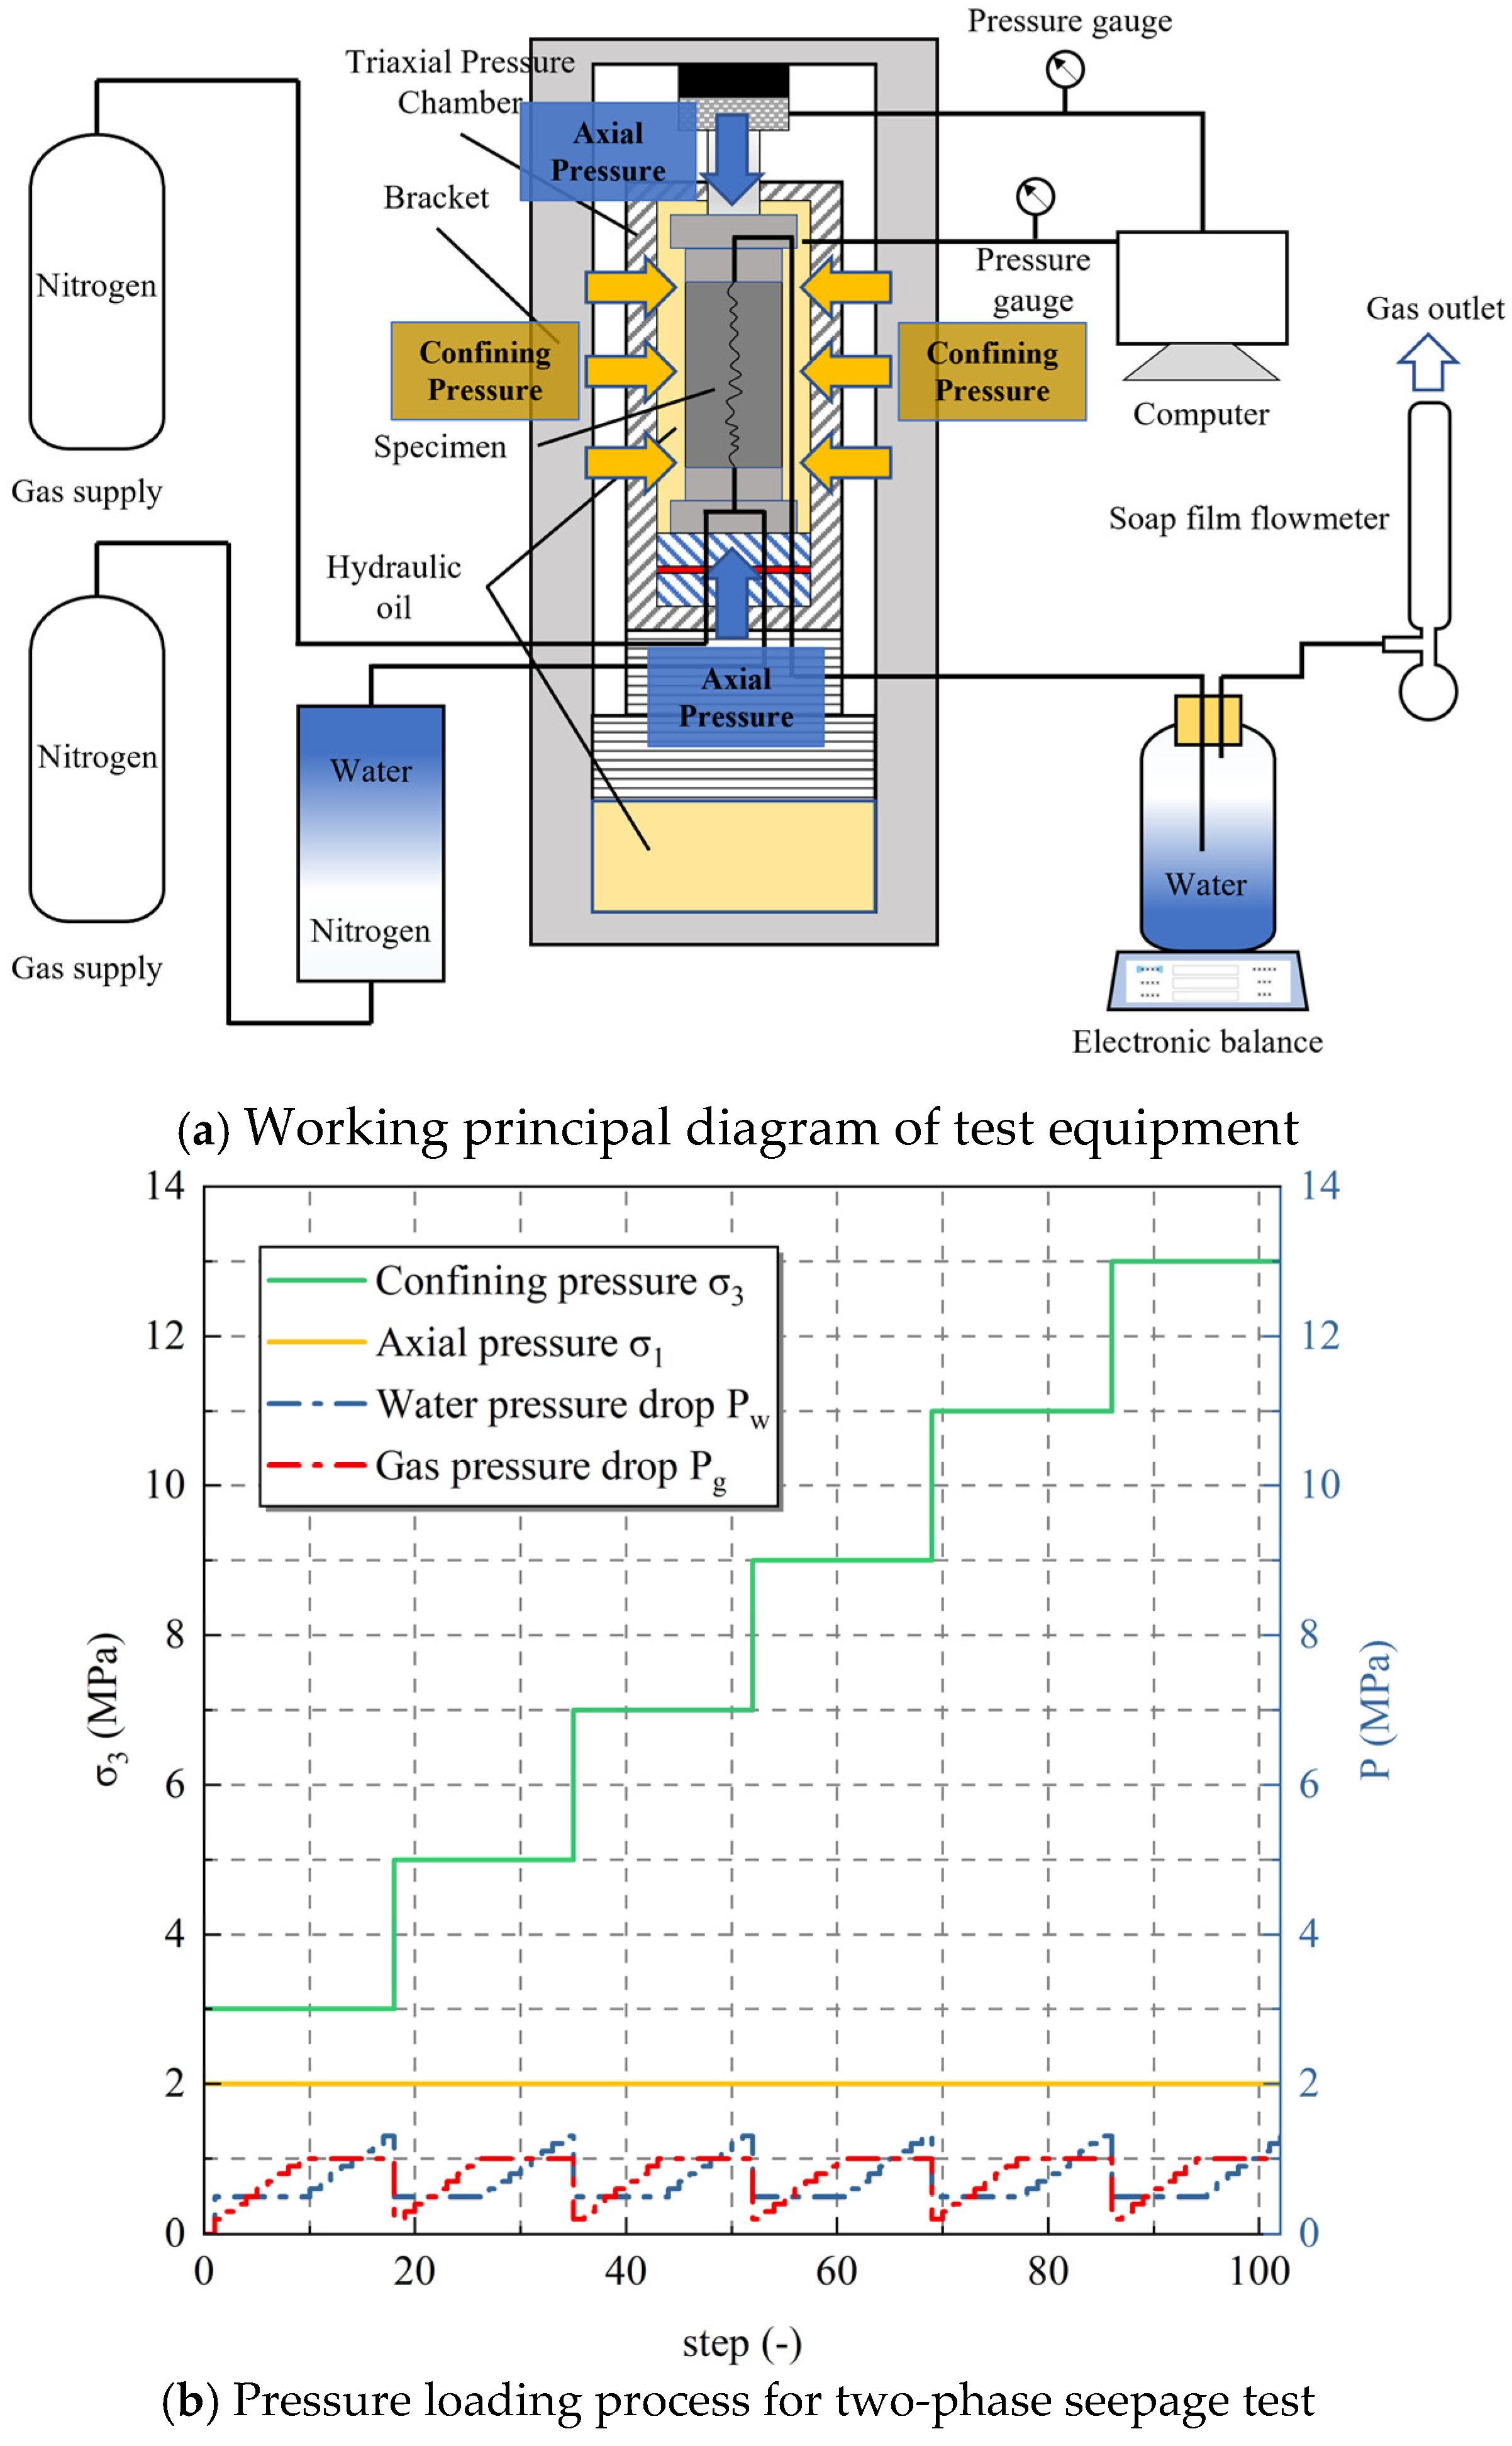
2.3. Gas–Water Two-Phase Fluid Flow Test Method

The gas–water two-phase seepage test in rock fractures was conducted using a triaxial stress–multiphase fluid coupling test system (Figure 3a). The system comprises a pressure loading pump, a triaxial pressure chamber, a fluid control cabinet, a system control cabinet, a data acquisition unit, a high-pressure water tank, and pipelines. It enables axial loading up to 2000 kN and confining pressure loading up to 60 MPa to meet the requirements of this test. The specific experimental steps are as follows:
(1)
Securely connect the water-saturated rock fracture specimen with the indenter using heat-shrink tubing and place it into the sealed triaxial pressure chamber.
(2)
Connect and seal the base with the triaxial pressure chamber using a fixture. Inject hydraulic oil into the sealed chamber until oil pressure stabilizes inside and steady flow is observed from the outlet.
(3)
Apply an axial load of 3 MPa at a rate of 0.05 MPa/s and maintain it constant. After confining pressure stabilizes, open the valves for water and nitrogen separately. Increase fluid pressure to set value while measuring and recording flow rate after stabilization for complete seepage measurement.
(4)
Gradually increase fluid pressure until all desired points are tested under this level of pressurization before unloading fluid pressure to complete fixed-pressure two-phase seepage testing.
(5)
Incrementally increase confining pressures step by step (5 MPa, 7 MPa, 9 MPa, 11 MPa, and 13 MPa), repeating the operations described in (3) and (4), to conduct two-phase seepage tests under different confining pressures along with varying fluid pressures on each specimen (refer to Figure 3b for the detailed process).
(6)
Repeat the operations in (3), (4), and (5) to complete the two-phase seepage test for all rock fracture specimens.
Figure 3. Test equipment and loading method.
Water 17 00296 g003
The main sources of experimental error include instrumental error and human error. The absolute uncertainty of the pressure head was 0.05 MPa. After the two-phase fluid flow was stabilized, the mass of water was recorded at a fixed time using a sensitive electronic balance scale with an accuracy of 0.05 g, and the flow rate of nitrogen was recorded using a soap-film air flow meter with an accuracy of 0.1 mL/min. The uncertainty in the human error time was approximately 0.3 s.

3. Gas–Water Relative Permeability in Rock Fracture Under Pressure and Shear Effect

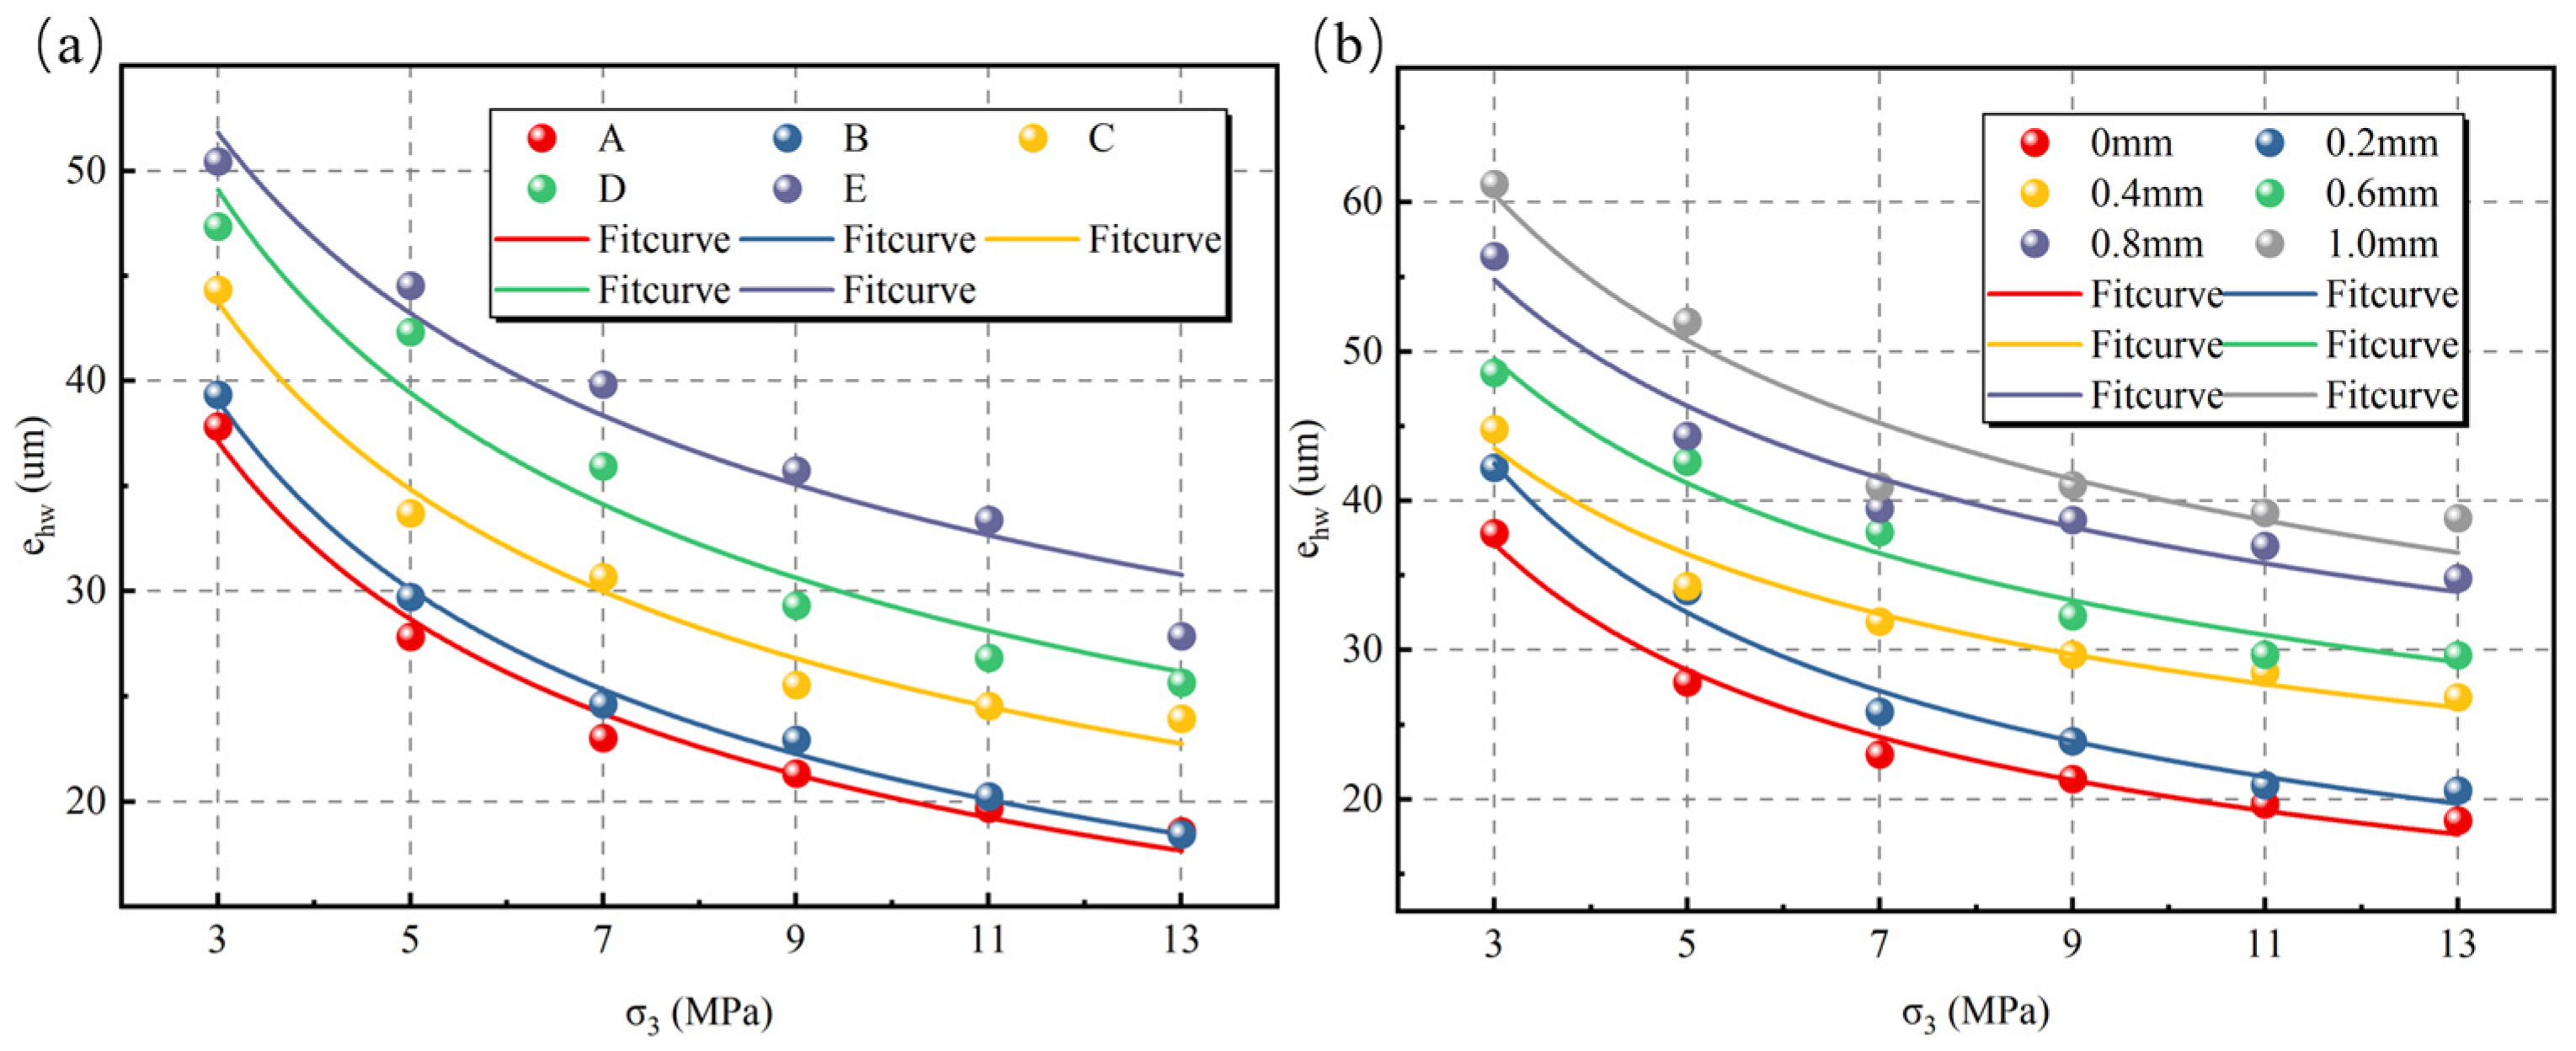
3.1. Evolution of Equivalent Hydraulic Aperture of Rock Fracture

Figure 4 demonstrates the evolution of the hydraulic aperture of the fissure under different confining pressures and shear displacements. The equivalent hydraulic openness can be calculated as follows [21]:
e h w = 12 μ Q w P 3
where e h w is the equivalent hydraulic aperture, μ is the viscosity of water, w is the width of the fracture, and P is the pressure gradient along the flow direction.
The equivalent hydraulic aperture of specimen E is the largest at the same confining pressure, which is due to the fact that the surface of specimen E is rougher, which indicates that rock fractures with large surface roughness may be more likely to have large fracture apertures, providing more wide flow paths. The equivalent hydraulic aperture of the fracture decreases with the increase in the confining pressure, but the equivalent hydraulic aperture of the fracture with large roughness is always the largest. Figure 4b shows that the equivalent hydraulic aperture of the fracture increases with increasing shear displacement and is largest for the surface roughness fracture. This is because as the shear displacement increases, contact occurs between the protrusions on the upper and lower surfaces of the fracture, which acts as a support for the upper and lower surfaces in the fracture, and this support does not disappear completely under the effect of the confining pressure, resulting in higher equivalent hydraulic aperture in the fracture under shear effect compared to an in situ closed fracture, and the greater the roughness, the higher the surface fracture surface bulge, and the greater the infiltration capacity of the fracture.

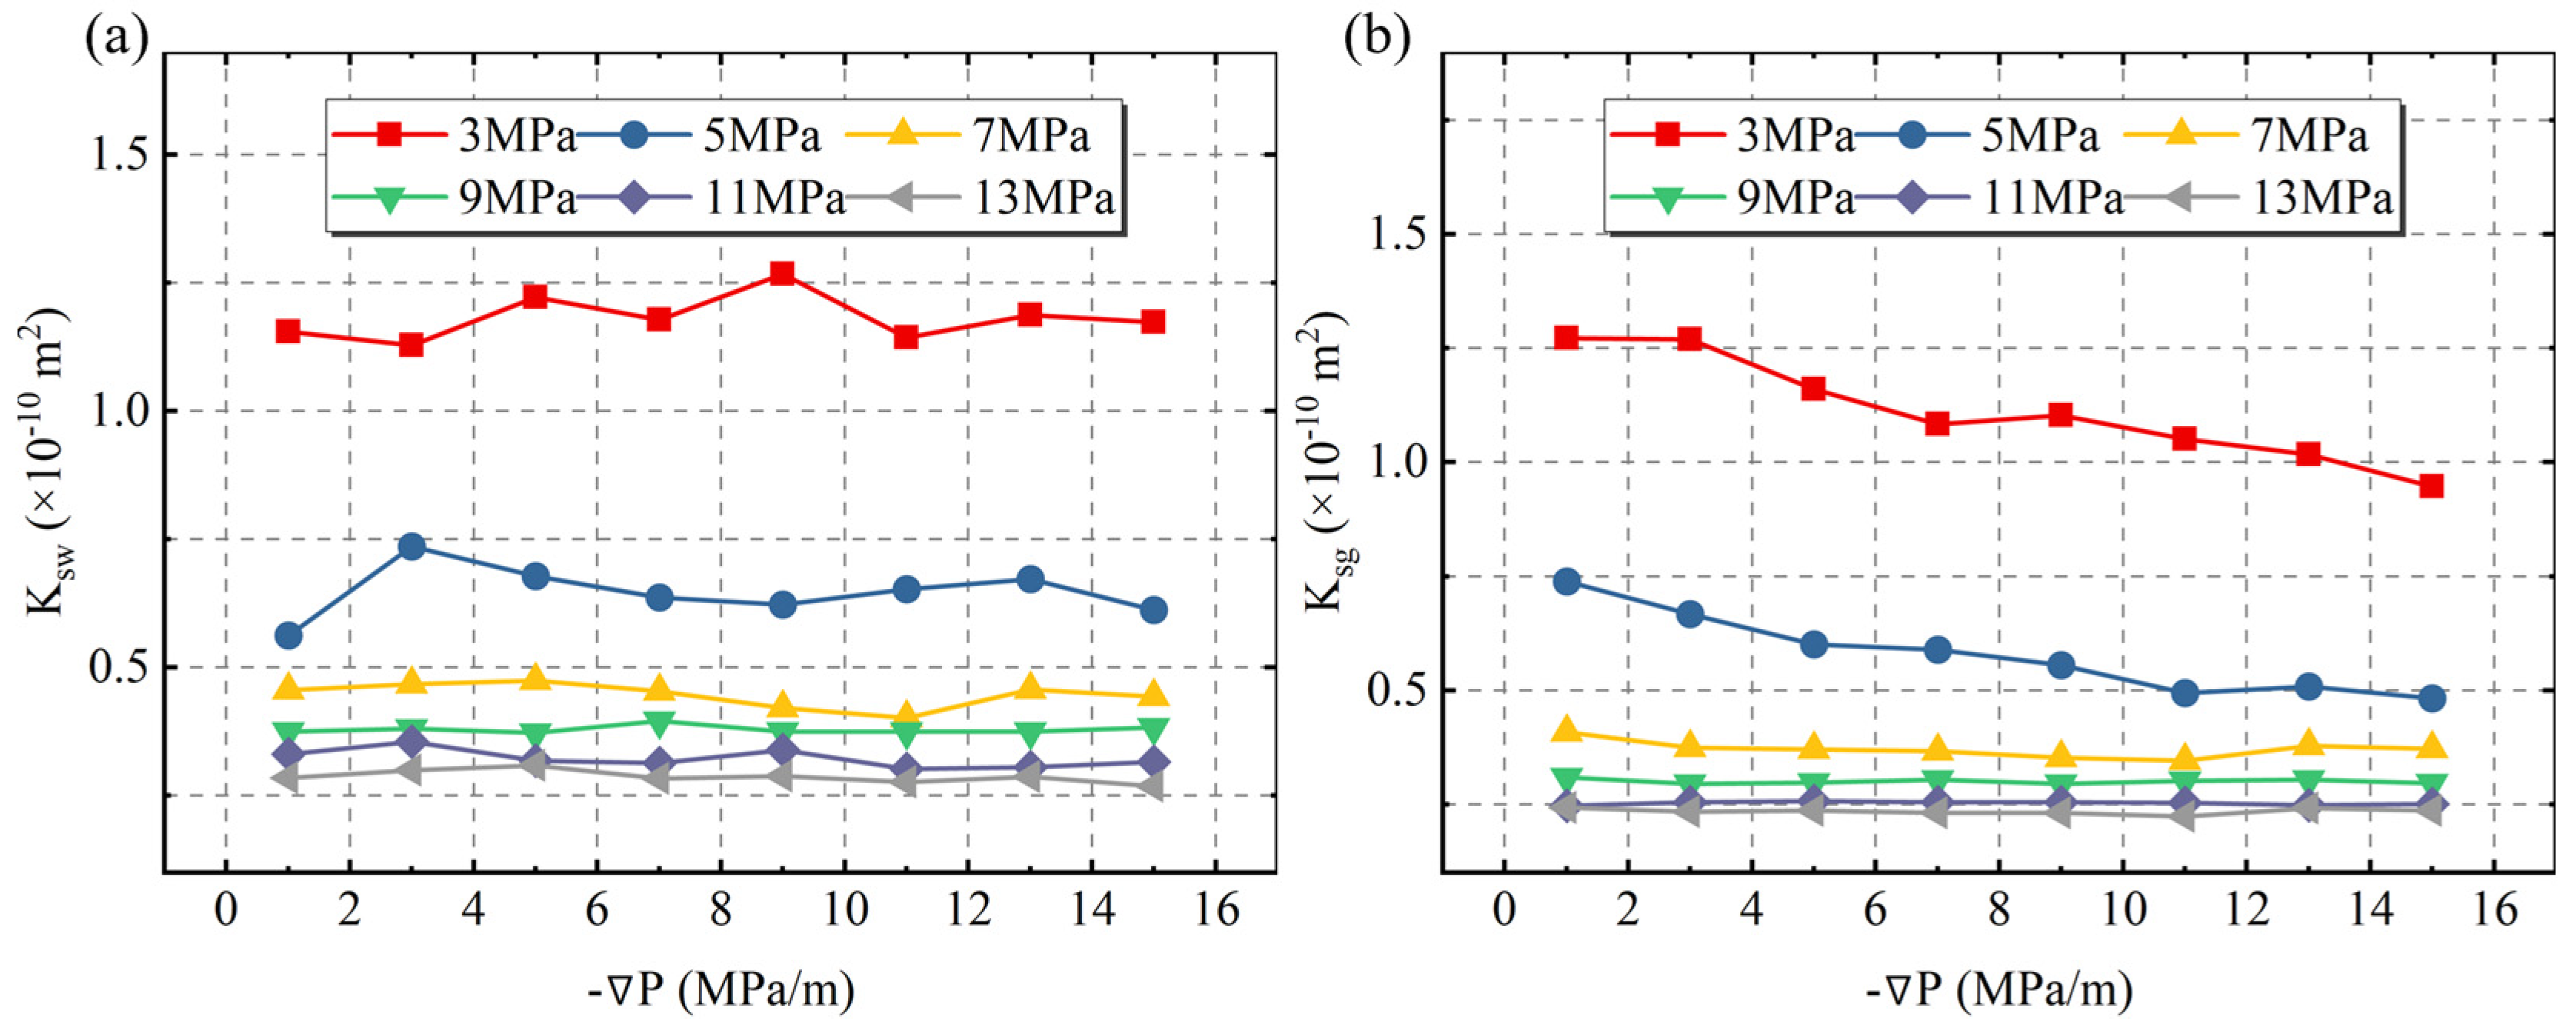
3.2. Evolution of Relative Permeability of Gas–Water Two-Phase Fluid in In Situ Closed Fractures Under Different Confining Pressures

In order to investigate the characteristics of gas–water two-phase flow in stressed rock fractures, it is essential to subject the specimen to triaxial loading within a pressure chamber, enabling control over both confining and axial pressures. The generalized multiphase Darcy’s law has been widely used to calculate steady laminar two-phase fluid flow in rock fractures. The absolute permeability can be expressed by Equations (5) and (6) [32]:
K s w = Q s w μ w L A ( P i n P o u t )
K s g = 2 Q s g μ g L P o u t A ( P i n 2 P o u t 2 )
where Ksw and Ksg are the absolute permeabilities of water and gas, respectively; Q s w and Q s g are the volume flow rates of water and nitrogen through the fracture, respectively; μ w and μ g are the dynamic viscosities of water and nitrogen, respectively; L is the fracture length along the main flow direction; A is the cross-section area perpendicular to the flow direction; Pin is the inlet pressure; and Pout is the outlet pressure.
Figure 5 shows the relationship between the fluid pressure gradient and absolute permeability during single-phase flow of fracture specimen A. The absolute permeability measured by gas and water in the same fracture has a certain deviation; the main reason may be the compressibility of the gas, which leads to a lower result than that measured by water. In this case, accuracy can be better guaranteed when substituting the absolute permeability obtained by water single-phase seepage into the calculation of fracture relative permeability.
The relative permeability can be expressed as follows:
K r w = Q m w μ w L A K s ( P i n P o u t )
K r g = 2 Q m g μ g L P o u t A K s ( P i n 2 P o u t 2 )
where subscript m stands for the multi-phase fluid flow; and Ks is the absolute permeability.
Unlike artificially created fractures where water saturation can be visually observed, obtaining water saturation during gas–water flow in triaxial pressure chambers poses challenges. The fractional flow of water fw, which serves as a crucial parameter reflecting fracture water saturation, can be determined using the following equation:
f w = Q m w Q m w + Q m g
where Q m w is the volume flow rate of water in two phase flow through the fracture; and Q m g is the volume flow rate of nitrogen in two phase flow through the fracture.
In this study, we analyze the evolution of the relative permeability of rock fractures with water saturation by introducing the fractional flow of water.
The relationship between the relative permeability and fractional flow of water in an in situ closed fracture in a rock at different confining pressures is illustrated in Figure 6. In gas–water two-phase fluid flow tests conducted on rock fractures, the relative permeability of water increases with increasing fractional flow of water, while the relative permeability of nitrogen decreases with increasing fractional flow of water. This phenomenon indicates that as the water phase flow rate increases, it gradually dominates the two-phase flow process within the fracture. Due to surface tension and liquid pressure effects, it becomes difficult for gas to form a separate and continuous flow channel; instead, it flows inside the fracture in dispersed bubble form, leading to a gradual reduction in nitrogen’s relative permeability to lower levels. Conversely, when the fractional flow of water is low, nitrogen dominates as gas inside the fracture forms a separate and continuous flow channel. This results in relative sliding between the water phase and gas phase characteristic of typical laminar gas–water flows. At this stage, nitrogen’s relative permeability rapidly increases with decreasing fractional flow of water. The changes in relative permeability during two-phase fluid flows within the rock fracture depicted in Figure 6 show that under identical water-phase flow rates but different pressures within the same fracture, there are variations in the relative permeability, suggesting that factors other than just water-flow rates influence the characteristics of two-phase flows within the rock fracture; specifically, confining pressure impedes fluid two-phase flows within these fractures. When the fractional flow of water is higher, both gas-phase and water-phase relative permeabilities decrease with increasing confining pressure, but the gas-phase relative permeability decreases more compared to the water-phase relative permeability; conversely, when the fractional flow of water is higher, the water-phase relative permeability decreases more compared to the gas-phase relative permeability as the confining pressure increases. Combined with the aforementioned relationship between the fractional flow of water and the relative permeability, it can be concluded that this hindering effect primarily manifests as a restriction on gas-phase flow at low fractional water flow and as an impediment to water flow under high water-phase partial flow.
The flow behavior of two-phase flow is similar to that of single-phase fluid flow when one phase of the fluid in the fracture exhibits significantly higher relative permeability than the other phase. Specifically, as confining pressure increases, the fracture space gradually closes, leading to a gradual decrease in the absolute permeability of the rock fracture. Furthermore, variations in the spatial structure distribution of the rock fracture under different pressures and changes in the interphase resistance of the two-phase fluids resulting from these structural differences also influence the evolution of relative permeability.
The increase in fracture roughness results in a tortuous fluid flow path within the fracture, which persists during two-phase flow [33,34]. Figure 7 illustrates the evolution of relative permeability for both phases of the fracture under varying levels of fracture surface roughness at constant confining pressure. It is evident that an elevation in fracture surface roughness significantly reduces the relative permeability of the two-phase fluid within the fracture. Overall, fractures with larger surface roughness exhibit lower relative permeability compared to relatively smooth fractures. This suggests that as fracture surface roughness increases, inter-phase resistance within the fracture gradually intensifies and consequently decreases the relative permeability inside rock fractures due to inter-phase interference. By comparing the relative permeabilities of nitrogen and water in rock fractures with different degrees of roughness, it can be observed that fracture surface roughness has a lesser impact on nitrogen’s relative permeability compared to that of water phase. This disparity may be attributed to the hydrophilic nature of the rock samples used in this study; thus, water phase more frequently resides closer to fracture surfaces during seepage processes involving two-phase fluids and is therefore more susceptible to reduced permeability caused by changes in surface morphology.

3.3. Evolution of Relative Permeability of Gas–Water Two-Phase in Rock Fracture Under Shearing Effect

Figure 8 illustrates the evolution of the relative permeability of two-phase fluids in rock fractures with the fractional flow of water under different shear displacements. It can be seen that in the fracture two-phase flow test, the change of the two-phase fluid relative permeability with the aqueous-phase partial flow rate presents a similar evolution to that in the in situ closed fracture, which indicates that the dislocation does not have an obvious effect on the growth trend of the two-phase relative permeability of the rock fracture, and that the effect of the dislocation on the relative permeability is mainly manifested in the magnitude. From the figure, it can be seen that under shear effect, the relative permeabilities of the two-phase fluids in the rock fracture have risen to different degrees. Comparing the characteristics of the relative permeability rise of water phase and gas phase under shear effect, the relative permeability of water phase shows a significant increase after shear displacement compared with the relative permeability of nitrogen gas, which shows that water-phase relative permeability is more sensitive to dislocation effects than gas-phase relative permeability.

4. Analysis and Discussion

4.1. Analysis of Inter Phase Resistance of Gas–Water Two-Phase Fluids in Rock Fractures

In the gas–water two-phase flow process, due to the influence of flow structure, fracture roughness, and fracture aperture [34,35], the interphase resistance generated between the gas–water phases will impede the fluid flow, which is manifested in the reduction in the relative permeability of the two phases, which is not conducive to efficient and stable gas extraction. Studies have shown that the interphase resistance of two-phase fluids is smaller when the sum of relative permeability is closer to 1, and the loss of permeability due to the interphase interaction between two-phase fluids is lower [36]. In order to accurately describe the interphase resistance of the two-phase fluid in the two-phase flow through a rock fracture, the sum of relative permeabilities is used in this study. Figure 9 illustrates the relationship between the peritectic pressure σ3, JRC, and dislocation δ and the sum of the relative permeabilities of the fracture at fw = 0.2, which were fitted with the fitting functions shown in Table 2.
From the evolution of the equivalent hydraulic aperture present in Figure 9, it can be found that the decrease in perimeter pressure σ3, the decrease in JRC, and the increase in the dislocation δ all cause an increase in the equivalent hydraulic aperture of the fracture, and with the increase in the equivalent hydraulic aperture of the fracture, the sum of the relative permeability of the fracture gradually increases; i.e., the two-phase fluid inter-phase resistance in the fracture decreases. This is due to the effective flow channel of fluid in the fracture increasing with the increase in equivalent hydraulic aperture, as well as to the roughness-induced interphase interference between gas and water decreasing, which leads to the decrease in interphase resistance. Relevant researchers have also obtained consistent conclusions in two-phase fluid flow studies: Gong [37] and Wang [38] et al. showed that there is a significant positive correlation between roughness and two-phase fluid interphase resistance, while Zhang [39] et al. showed that the effect of roughness on the fluid flow in the fracture decreases with the increase in the fracture aperture.
For in situ closed fractures, the gas–water two-phase flow in the rock fractures exhibits more serious interphase interference under the influence of roughness. After the shear dislocation, the effective flow channels of fluid in the fracture increase, the interference effect of fluid flow in the fracture is weakened, and the fracture conductivity is enhanced, which is more favorable for gas extraction.

4.2. Characterization of the Equal-Permeability Point in Rock Fracture

As a critical point for representing the conversion of the dominant flow of two-phase fluid flow in rock fractures, the equal-permeability point plays an important role in grasping the two-phase fluid flow law in rock fractures and promoting the optimization of the production system of rock gas extraction. In Figure 6 and Figure 8, it is found that the fractional flow of water at the gas–water equal-permeability point of the rock fracture is located between 0.02 and 0.04, and the roughness and confining pressure do not have a significant effect on the fractional flow of water at the equal-permeability point. Based on the evolution curve of the gas–water relative permeability of the sheared rock fracture in Figure 10, it can be determined that although the relative permeability of the sheared fracture increased significantly, the corresponding gas–water relative permeability intersection did not shift significantly, which indicates that it did not have a significant impact on the water-phase flow at the equal-permeability point.
Figure 10 demonstrates the relationship between the perimeter pressure σ3, JRC, and dislocation δ and the relative permeability of the equal-permeability point Kreq. From the evolution of the relative permeability of the equal-permeability point Kreq with confining pressure for different fractures in Figure 10a, it can be seen that the relative permeability of their equal-permeability point decreases with the increase in the confining pressure. From the evolution of the relative permeability of the in situ closed fractures of different rocks with a joint roughness coefficient in Figure 10b, it can be seen that fractures with lower roughness have higher equal-permeability point relative permeability; i.e., the equal-permeability point relative permeability shows a negative correlation with JRC as a whole. In order to investigate the effect of shear on the relative permeability of the equal-permeability point of two-phase flow in the fractures, Figure 10c demonstrates the relationship between the relative permeability of the equal-permeability point Kreq at a confining pressure of 3MPa under shear in sample A. It can be seen from the figure that with the increase in the confining pressure, the relative permeability of the equal-permeability point decreases, and the relative permeability of the equal-permeability point of the rock after the shear is increased; the relative permeability of the equal-permeability point the shear displacement displays a quadratic function relationship. Before and after the shear, the water-phase partition flow rate of the equal-permeability point of the rock fracture did not produce obvious changes, and its influence on the equal-permeability point is more manifest in the increase in the relative permeability of the equal-permeability point, which promotes the gas–water flow in the co-seepage area and promotes the elevation of the gas production and water production of the rock wells, which plays an important role in the reasonable prediction of gas and water production.

5. Conclusions

In this study, gas–water two-phase percolation tests were conducted through rock fracturing to investigate the two-phase fluid flow characteristics of in situ closed and shear self-supported fractures, and the test results obtained can provide guidance for related projects, with specific conclusions as follows:
(1)
With the increase in roughness, the equivalent hydraulic aperture of the fractures increased when compared with the in situ closed fractures, and the equivalent hydraulic aperture of the fractures after shear appeared to be significantly increased.
(2)
When the fractional flow of water is high, the water phase is affected by the confining pressure, and the surface topography of the fracture is significantly higher than that of the gas phase; and when the fractional flow of water is low, the water phase is affected by the confining pressure, and the surface topography of the fracture is significantly lower than that of the gas phase. The influence of confining pressure and fracture surface morphology on the water phase is lower than that on the gas phase.
(3)
The influence of dislocation on relative permeability results in a decrease in the inter-phase resistance of the fracture, which causes the relative permeability of the water phase to rise obviously after the dislocation. The relative permeability of the water phase increased significantly after the dislocation, contrasting with a smaller increase in the relative permeability of the gas phase.
(4)
Under the effect of roughness, confining pressure, and shear, the fractional flow of water at the equal-permeability point did not change significantly; the relative permeability at the equal-permeability point increased with the decrease in confining pressure and roughness; and the relative permeability at the equal-permeability point increased after shear, which indicates that shear has an important role in promoting gas–water flow in rock fractures.

Author Contributions

Methodology, Y.W. and K.X.; investigation, C.L. and X.L.; resources, Y.W. and B.L.; data curation, C.L. and X.L.; writing—original draft preparation, Y.W. and K.X.; writing—review and editing, C.L. and B.L.; supervision, K.X. All authors have read and agreed to the published version of the manuscript.

Funding

This research was funded by the Kaili University Integrated Research Project (2024YB006, YTH-TD20253I, YTH-XM2024011, YTH-XM2025010); the Natural Science Research Project of Guizhou Provincial Department of Education ([Qianjiaoji, [2024] 348, [2022] 367]; the Qiandongnan Prefecture Science and Technology Plan Project (No. [2022] 51), the Kaili University PhD Project (BS20230101).

Data Availability Statement

Data available on request due to privacy restrictions.

Conflicts of Interest

Xiaobo Liu and Boyang Li were employed by the company Flexible Research Center, Shenhua XinJie Energy Co., Ltd. The remaining authors declare that the research was conducted in the absence of any commercial or financial relationships that could be construed as a potential conflict of interest.

Nomenclature

XiX-coordinates of the converted points
YiY-coordinates of the converted points
ZiZ-coordinates of the converted points
xiX-coordinates of the original points
yiY-coordinates of the original points
ziZ-coordinates of the original points
RScale parameter of rotation matrix
[α, β, γ] Rotation matrix
[x0, y0, z0]TConversion vector between coordinate systems
JRCJoint roughness coefficient
Z2Root mean square of the first-order derivative of the absolute height of the fracture surface
σ1Axial pressure
σ3Confining pressure
PwWater pressure drop
PgGas pressure drop
ehwEquivalent hydraulic aperture
μFluid viscosity
μwFluid viscosity of water
μgFluid viscosity of gas
QMean flow rate
QswWater flow rate
QsgGas flow rate
QmwWater flow rate in two phase flow
QmgGas flow rate in two phase flow
wWidth of the fracture
P Pressure gradient along the flow direction
KswAbsolute permeability of water
KsgAbsolute permeability of gas
KsAbsolute permeability
KrwRelative permeability of water
KrgRelative permeability of gas
KreqRelative permeability of equal-permeability point
LFracture length
ACross-section area perpendicular to the flow direction
PinInlet pressure
PoutOutlet pressure
fwFractional flow of water

References

  1. Li, P.; Zhang, J.C.; Tang, X.; Huo, Z.P.; Li, Z.; Luo, K.Y.; Li, Z.M. Assessment of shale gas potential of the Lower Permian transitional Shanxi–Taiyuan shales in the southern North China Basin. Aust. J. Earth Sci. 2020, 68, 262–284. [Google Scholar] [CrossRef]
  2. Li, S.; Zhou, Z.; Nie, H.; Liu, M.; Meng, F.; Shen, B.; Zhang, X.; Wei, S.; Xi, Z.; Zhang, S. Organic matter accumulation mechanisms in the Wufeng–Longmaxi shales in western Hubei Province, China and paleogeographic implications for the uplift of the Hunan-Hubei Submarine high. Int. J. Coal Geol. 2023, 270, 104223. [Google Scholar] [CrossRef]
  3. Rahman, M.K.; Suarez, Y.A.; Chen, Z.; Rahman, S.S. Unsuccessful hydraulic fracturing cases in Australia: Investigation into causes of failures and their remedies. J. Pet. Sci. Eng. 2007, 57, 70–81. [Google Scholar] [CrossRef]
  4. Kang, Y.; Xu, C.; You, L.; Yu, H.; Zhang, B. Comprehensive evaluation of formation damage induced by working fluid loss in fractured tight gas reservoir. J. Nat. Gas Sci. Eng. 2014, 18, 353–359. [Google Scholar] [CrossRef]
  5. Zolfaghari, A.; Dehghanpour, H.; Noel, M.; Bearinger, D. Laboratory and field analysis of flowback water from gas shales. J. Unconv. Oil Gas Resour. 2016, 14, 113–127. [Google Scholar] [CrossRef]
  6. Bin, Y.; Hao, Z.; Yili, K. In situ sequestration of a hydraulic fracturing fluid in Longmaxi shale gas formation in the Sichuan Basin. Energy Fuels 2019, 33, 6983–6994. [Google Scholar]
  7. Bai, J.; Kang, Y.; Chen, Z.; You, L.; Chen, M.; Li, X. Changes in retained fracturing fluid properties and their effect on shale mechanical properties. J. Nat. Gas Sci. Eng. 2020, 75, 103163. [Google Scholar] [CrossRef]
  8. Zhang, J.; Ouyang, L.; Zhu, D.; Hill, A.D. Experimental and numerical studies of reduced fracture conductivity due to proppant embedment in the shale reservoirs. J. Pet. Sci. Eng. 2015, 130, 37–45. [Google Scholar] [CrossRef]
  9. Baungartner, R.; Goncalves, G.F.N.; Loureiro, J.B.R.; Freire, A.P.S. Slug flows of gas and shear-thinning fluids in horizontal pipes. Int. J. Multiph. Flow 2023, 165, 104473. [Google Scholar] [CrossRef]
  10. Luo, Y.; Zhang, Z.; Zhang, L.; Xue, K.; Long, K. Influence of fracture roughness and void space morphology on nonlinear fluid flow through rock fractures. Eur. Phys. J. Plus 2022, 137, 1288. [Google Scholar] [CrossRef]
  11. Shekhar, S.; Kelkar, M.; Hearn, W.J.; Hain, L.L. Improved prediction of liquid loading in gas wells. SPE Prod. Oper. 2017, 32, 539–550. [Google Scholar] [CrossRef]
  12. Kareem, H.J.; Hasini, H.; Abdulwahid, M.A. Investigation of flow regimes, pressure drop, void fraction, film thickness, friction factor and production of two phase flow in a perforated horizontal wellbore. Geoenergy Sci. Eng. 2023, 229, 212099. [Google Scholar] [CrossRef]
  13. Barton, N.; Bandis, S.; Bakhtar, K. Strength deformation and conductivity coupling of rock joints. Int. J. Rock Mech. Geomech. Abstr. 1979, 16, 303–307. [Google Scholar] [CrossRef]
  14. Jaeger, J.; Santos, C.M.; Rosa, L.M.; Meier, H.F.; Noriler, D. Experimental and numerical evaluation of slugs in a vertical air-water flow. Int. J. Multiph. Flow 2018, 101, 152–166. [Google Scholar] [CrossRef]
  15. Muralha, J.; Grasselli, G.; Tatone, B.; Blümel, M.; Chryssanthakis, P.; Yujing, J. ISRM suggested method for laboratory determination of the shear strength of rock joints: Revised version. Rock Mech. Rock Eng. 2014, 47, 291–302. [Google Scholar] [CrossRef]
  16. Tenthorey, E.; Fitz Gerald, J.D. Feedbacks between deformation, hydrothermal reaction and permeability evolution in the crust: Experimental insights. Earth Planet. Sci. Lett. 2006, 247, 117–129. [Google Scholar] [CrossRef]
  17. Bing, H.O.U.; Mian, C.H.E.N.; Zhimeng, L.I.; Yonghui, W.A.N.G.; Ce, D.I.A.O. Propagation area evaluation of hydraulic fracture networks in shale gas reservoirs. Pet. Explor. Dev. 2014, 41, 833–838. [Google Scholar]
  18. Gu, H.; Weng, X.; Lund, J.; Mack, M.; Ganguly, U.; Suarez-Rivera, R. Hydraulic fracture crossing natural fracture at nonorthogonal angles: A criterion and its validation. SPE Prod. Oper. 2012, 27, 20–26. [Google Scholar] [CrossRef]
  19. Gan, Q.; Elsworth, D.; Alpern, J.S.; Marone, C.; Connolly, P. Breakdown pressures due to infiltration and exclusion in finite length boreholes. J. Pet. Sci. Eng. 2015, 127, 329–337. [Google Scholar] [CrossRef]
  20. Zou, L.; Jing, L.; Cvetkovic, V. Shear-enhanced nonlinear flow in rough-walled rock fractures. Int. J. Rock Mech. Min. Sci. 2017, 97, 33–45. [Google Scholar] [CrossRef]
  21. Xie, L.Z.; Gao, C.; Ren, L.; Li, C.B. Numerical investigation of geometrical and hydraulic properties in a single rock fracture during shear displacement with the Navier–Stokes equations. Environ. Earth Sci. 2015, 73, 7061–7074. [Google Scholar] [CrossRef]
  22. Xiong, X.; Li, B.; Jiang, Y.; Koyama, T.; Zhang, C. Experimental and numerical study of the geometrical and hydraulic characteristics of a single rock fracture during shear. Int. J. Rock Mech. Min. Sci. 2011, 48, 92–1302. [Google Scholar] [CrossRef]
  23. Wang, M.; Chen, Y.-F.; Ma, G.-W.; Zhou, J.-Q.; Zhou, C.-B. Influence of surface roughness on nonlinear flow behaviors in 3D self-affine rough fractures: Lattice Boltzmann simulations. Adv. Water Resour. 2016, 96, 373–388. [Google Scholar] [CrossRef]
  24. Xu, B.; Haghighi, M.; Li, X.; Cooke, D. Development of new type curves for production analysis in naturally fractured shale gas/tight gas reservoirs. J. Pet. Sci. Eng. 2013, 105, 107–115. [Google Scholar] [CrossRef]
  25. Duncan, P.M.; Eisner, L. Reservoir characterization using surface microseismic monitoring. Geophysics 2010, 75, 139–146. [Google Scholar] [CrossRef]
  26. Huang, S.; Zhang, J.; Fang, S.; Wang, X. An analytical method for parameter interpretation of fracture networks in shale gas reservoirs considering uneven support of fractures. Geofluids 2021, 3800525, 1–15. [Google Scholar] [CrossRef]
  27. Li, T.; Song, H.; Wang, J.; Wang, Y.; Killough, J. Ananalytical method for modeling and analysis gas-water relative permeability in nano scale pores with interfacial effects. Int. J. Coal Geol. 2016, 159, 71–81. [Google Scholar] [CrossRef]
  28. Shad, S.; Maini, B.B.; Gates, I.D. Effect of gap and flow orientation on two-phase flow in an oil-wet gap: Relative permeability curves and flow structures. Int. J. Multiph. Flow 2013, 57, 78–87. [Google Scholar] [CrossRef]
  29. Fourar, M.; Lenormand, R. A new model for two-phase flows at high velocities through porous media and fractures. J. Pet. Sci. Eng. 2001, 30, 121–127. [Google Scholar] [CrossRef]
  30. Luo, Y.; Wang, Y.; Guo, H.; Liu, X.; Luo, Y.; Liu, Y. Relationship between joint roughness coefficient and statistical roughness parameters and its sensitivity to sampling interval. Sustainability 2022, 14, 13597. [Google Scholar] [CrossRef]
  31. Tse, R.; Cruden, D.M. Estimating joint roughness coefficients. Int. J. Rock Mech. Min. Sci. 1979, 16, 303–307. [Google Scholar] [CrossRef]
  32. Wang, Y.; Zhang, Z.; Ranjith, P.G.; Luo, Y. Water-gas flow in rough rock fractures: Insights from coupled triaxial compression experiments. Hydrogeol. J. 2022, 30, 1569–1581. [Google Scholar] [CrossRef]
  33. Xue, K.; Zhang, Z.; Jiang, Y.; Luo, Y. Estimating the permeability of fractured rocks using topological characteristics of fracture network. Comput. Geotech. 2023, 157, 105337. [Google Scholar] [CrossRef]
  34. Liu, X.-J.; Xiong, J.; Liang, L.-X.; Luo, C.; Zhang, A.-D. Analysis of the Wettability of Longmaxi Formation Shale in the South Region of Sichuan Basin and Its Influence. Nat. Gas Geosci. 2014, 25, 1644–1652. [Google Scholar]
  35. Ye, Z.; Liu, H.-H.; Jiang, Q.; Zhou, C. Two-phase flow properties of a horizontal fracture: The effect of aperture distribution. Adv. Water Resour. 2015, 76, 43–54. [Google Scholar] [CrossRef]
  36. Zeidan, D.; Bähr, P.; Farber, P. Numerical investigation of a mixture two-phase flow model in two-dimensional space. Comput. Fluids 2019, 181, 90–106. [Google Scholar] [CrossRef]
  37. Gong, Y.B.; Sedghi, M.; Piri, M. Two-Phase Relative Permeability of Rough-Walled Fractures: A Dynamic Pore-Scale Modeling of the Effects of Aperture Geometry. Water Resour. Res. 2021, 57, e2021WR030104. [Google Scholar] [CrossRef]
  38. Wang, Y.; Zhang, Z.; Liu, X.; Xue, K. Relative permeability of two-phase fluid flow through rough fractures: The roles of fracture roughness and confining pressure. Adv. Water Resour. 2023, 175, 104426. [Google Scholar] [CrossRef]
  39. Zhang, Z.; Nemcik, J. Friction Factor of Water Flow Through Rough Rock Fractures. Rock Mech. Rock Eng. 2013, 46, 1125–1134. [Google Scholar] [CrossRef]
Figure 1. Preparation process of shale standard specimens: (a) drilling; (b) cutting; (c) polish; (d) specimens.
Water 17 00296 g001
Figure 2. Schematic diagram of rough fracture morphology and profiles extraction.
Water 17 00296 g002
Figure 4. Evolution of equivalent hydraulic aperture e with confining pressure σ3 for different influencing factors: (a) JRC; (b) displacement.
Water 17 00296 g004
Figure 5. Relationship between the fluid pressure and the absolute permeability of a rough fracture during single-phase flow in specimen A: (a) absolute permeability Ksw of the fracture under water-phase pressure; (b) absolute permeability Ksg of the fracture under gas-phase pressure.
Water 17 00296 g005
Figure 6. Evolution of relative permeability of in situ closed rock fractures in terms of fractional flow of water under different pressures: (a) specimen 1; (b) specimen 2; (c) specimen 3; (d) specimen 4; (e) specimen 5.
Water 17 00296 g006
Figure 7. Evolution of relative permeability of in situ closed fractures in terms of the fractional flow of water (3 MPa confining pressure).
Water 17 00296 g007
Figure 8. Evolution of relative permeability of in situ closed fractures in terms of the fractional flow of water under different shear displacements (3 MPa confining pressure).
Water 17 00296 g008
Figure 9. Evolution of the sum of relative permeabilities of rock fractures under different influencing factors (fw = 0.2): (a) confining pressure σ3; (b) JRC; (c) displacement δ.
Water 17 00296 g009
Figure 10. Relative permeability evolution of the equal-permeability point of the rock fracture under different factors: (a) confining pressure σ3; (b) JRC; (c) displacement δ.
Water 17 00296 g010
Table 1. Roughness parameters of rough surface profiles and average JRC.
SampleWidth (mm)Height (mm)123456789Mean
S150.3098.705.523.875.935.242.995.925.893.222.114.52
S250.3098.605.229.506.418.244.529.804.927.419.147.24
S350.3298.9015.458.757.858.1614.215.9317.0912.8613.4811.53
S450.3098.6213.2718.9819.168.7911.3918.8718.6417.6315.9215.85
S550.1699.2416.4520.5323.2613.2818.7122.1418.0721.4614.8418.75
Table 2. Best-fit equations for the data in Figure 9.
Figure 9aFigure 9bFigure 9c
Specimens
Number
Fitted Equation
K rw + K rg =
R2Confinement
MPa
Fitted Equation
K rw + K rg =
R2Confinement
MPa
Fitted Equation
K rw + K rg =
R2
A 1.16 × σ 3 0.99 0.993 0.007 × J R C + 0.43 0.763 139.35 δ + 0.40 0.90
B 1.10 × σ 3 0.99 0.995 0.004 × J R C + 0.26 0.835 110.64 δ + 0.25 0.98
C 1.07 × σ 3 1.00 0.997 0.003 × J R C + 0.18 0.887 98.30 δ + 0.18 0.99
D 1.14 × σ 3 1.00 0.999 0.002 × J R C + 0.14 0.919 73.1 δ + 0.14 0.98
E 0.67 × σ 3 0.87 0.9911 0.002 × J R C + 0.11 0.9311 69.4 δ + 0.11 0.98
13 0.001 × J R C + 0.09 0.9413 55.9 δ + 0.09 0.96
Disclaimer/Publisher’s Note: The statements, opinions and data contained in all publications are solely those of the individual author(s) and contributor(s) and not of MDPI and/or the editor(s). MDPI and/or the editor(s) disclaim responsibility for any injury to people or property resulting from any ideas, methods, instructions or products referred to in the content.

