Abstract
By analyzing a comprehensive dataset of marine economic activity in China’s 11 coastal provincial administrative regions from 2006 to 2021, we constructed productivity indices to identify regional differences, spatial distribution patterns, and evolutionary trends at the national level, with particular focus on the three major maritime economic circles. The results indicate that China’s marine economy is generally growing, and development of marine new quality productivity (MNQP) in the eastern maritime economic circle is better than that in the northern and southern maritime economic circles. This regional gap in coastal areas at low, high, and higher levels gradually increases, while the regional gap decreases in coastal areas at lower levels. The gaps in the degree of openness to the outside world (X4) and in the level of financial development (X7) are the main factors contributing to regional differences in China’s marine new quality productivity. The overall center of gravity of marine new quality productivity is in the south, indicating the rapid growth momentum of the southern maritime economic circle; China’s marine new quality productivity shows a northeast–southwest distribution pattern; and the degree of agglomeration of China’s marine new quality productivity has increased. In the process of moving towards balanced and coordinated regional development of China’s marine industry, there are both opportunities and challenges. Breaking the self-locking tendencies of the lower-level state and preventing its downgrading are the biggest challenges for achieving this goal. However, China’s marine new quality productivity will be stabilized in states at high and higher levels.
1. Introduction
Over the past two decades, China’s maritime economy has grown [1]. In the past few years, especially since 2012, it has moved towards a stage of unprecedented high quality under the watchful eye and with the support of the Chinese government. In fact, the remarkable marine economic achievements in China have attracted considerable attention from all over the world [2,3]. However, China is under pressure in terms of both economic growth and environmental protection [4]. On the one hand, China urgently needs to accelerate the transformation and upgrading of the marine industry, seize the wave of a new round of global development of emerging marine industries, and establish cutting-edge technologies related to marine energy, biology, and digital information. In order to galvanize marine economic development, China must create new forms of business to maintain momentum. On the other hand, China has a long and narrow coastline, excellent deep-water harbors and bays, abundant oceanic and spatial resources, a huge amount of energy to be developed, and diverse marine biological resources. There is an urgent need to move on from the traditional ways of the past, improve efficiency, utilize marine resources wisely, and protect the environment [5] to achieve a balance of both economic and ecological benefits [6]. From a horizontal perspective, China’s achievements in terms of the marine economy are sufficient to categorize the country as a major marine power, but compared to the world’s major marine powers, China still has a long way to go. In this study, we argue that China’s marine economic development urgently needs to be guided by marine new quality productivity, which entails sustainable development of the oceans and responsible development of the marine economy.
Marine new quality productivity, as proposed by Chinese leaders in recent years, is a concept representing China’s advances in productivity, with three core features: high technology, high efficiency, and high quality. This productivity is based on a modern industrial system empowered by scientific and technological innovation to realize significant increases in total factor productivity and enable firms to reap a double harvest of economic and ecological benefits. In addition, many practical improvements in people’s living standards have been achieved.
Unlike the extensive discussions in political circles and the media, exploration of marine new quality productivity in academic circles has focused on the following three aspects: qualitative exploration of marine new quality productivity, basic requirements, and development paths. Hao and Wu [7] believed that the discussion of marine productivity marked another major theoretical innovation in China, which is an important byproduct of the Chineseization of Marxism. Development of marine new quality productivity involves independent innovation, new strategic industries, and an unimpeded benign cycle of educated talent and technology. Xie et al. [8] reported that the core element of marine new quality productivity is technological innovation, especially disruptive digital technology. According to that study, the core element of new marine productivity is technological innovation, especially subversive innovation and creative destruction. Firms in the marine industry must optimize the allocation of resources, pursue digitalization to achieve new heights of production, and strive for significant increases in total factor productivity.
Several quantitative analyses of marine new quality productivity have been conducted. Measurement of marine new quality productivity involves various tools and methods [9]. Researchers have studied its spatial and temporal characteristics [10], regional disparities, and dynamic evolution [11]. Productivity has been measured at the enterprise [12] and regional levels [13]. In addition, research on industrial aspects of marine new quality productivity is gradually emerging [14]. Some research has examined causality in the context of marine new quality productivity, delving into all aspects of national economic development. Other research has investigated cross-border effects, the influence of the news media, enterprise performance, industrial development, environmental and ecological factors, and labor distribution [15,16,17]. The study of Dai [18] showed that marine new quality productivity can revitalize the countryside by accelerating scientific and technological innovation, improving the efficiency of agricultural production, and ensuring the quality of agricultural products. Zhang et al. [19] found that China’s new energy demonstration city initiative promoted development of marine new quality productivity through improving innovative capacity, government financial support, industrial structure, and the quality of human capital. So, it is worth noting: what are the trends in China’s marine new quality productivity? What are the changing dynamics of its regional disparities? What are the factors affecting its regional disparities? What are the trends in the dynamic evolution of China’s marine new quality productivity? The solution and response to this series of questions are of great practical significance for China to become a maritime power and achieve high-quality development.
Although the existing literature has provided some empirical references and theoretical basis for the development of this study, there are still the following areas for expansion: first, the existing literature is often based on the national economy as a whole when discussing new quality productivity, and there are few studies that analyze marine new quality productivity individually; secondly, there are already studies on the regional disparities in new quality productivity, but there is a lack of research analyzing the causes of the regional disparities in new quality productivity, and there is an urgent need to further analyze the factors influencing the new productivity; and thirdly, there is a lack of research on the spatial distribution pattern of new quality productivity in the current literature on the topic. To summarize, the existing literature has provided the theoretical basis for this study. Compared with existing studies, the marginal contributions of this study are as follows: ① we develop a comprehensive index for evaluation of marine new quality productivity, including inputs and outputs. We also use the likelihood-weighted method (LWM) to measure development of China’s marine new quality productivity, as this method reflects the overall and regional development of the marine industry in China. ② We identify factors influencing regional gaps in China’s marine industry, visualizing trends in recent years using the quadratic assignment procedure (QAP) regression. ③ We also use economic geography tools to analyze spatial distribution patterns of China’s marine new quality productivity, comparing the relative advantages of different regions, tracking the agglomeration and diffusion of economic development, and identifying trends in each maritime economic circle. ④ We utilize the Markov chain method to describe the evolution of China’s marine new quality productivity, determine the self-locking, downward shifting, and upward shifting probability of different states of China’s various regions, and predict the achievement of a stable state in China’s marine industry. In order to cultivate marine new quality productivity and support the construction of China’s marine power, this study comprehensively adopts the LWM combination allocation method to measure the development level of China’s marine new quality productivity; comprehensively applies three-dimensional kernel density estimation, GINI, Theil and MLD indices to analyze the regional gaps in China’s marine new quality productivity, and further adopts the QAP method to analyze the factors influencing the regional gaps in China’s marine new quality productivity; to analyze the spatial distribution pattern of China’s marine new quality productivity using standard deviation ellipse, and to analyze its dynamic development trend using Markov chain.
The rest of this paper is organized as follows. Section 2 presents our research methods and data. In Section 3, we first construct a comprehensive index system for evaluating China’s marine new quality productivity, after which we describe its spatial and temporal characteristics. Section 4 analyzes regional differences in marine new quality productivity and the factors influencing those differences. Section 5 outlines the spatial distribution pattern of and changes in marine new quality productivity in China. Section 6 discusses trends in the evolution of China’s marine new quality productivity. Finally, in Section 7, we draw conclusions and suggest countermeasures. See the technology roadmap (Figure 1).

Figure 1.
Technology roadmap.
2. Research Methodology and Data
2.1. Research Methodology
2.1.1. LWM Combination Empowerment Approach
In this study, we adopt the LWM combined weighting method to measure development of China’s marine new quality productivity. Unlike the single assignment method, which favors either subjectivity or objectivity, the LWM combined assignment method balances the subjective experience and objective reality well. Thus, the results of our study, which used this method scientifically and reasonably, reflect actual changes in marine new quality productivity in China.
The LWM combined weighting method is a combination of the ordinal relationship method (G1 method) and the entropy weighting method (EWM), which assigns weights to indicators from both subjective and objective perspectives. In the present study, we value subjective and objective assignments equally; therefore, the indicators derived from the two methods are assigned the same weights in the weighting process (i.e., the final weight of the individual indicators is the weighted average of the weights obtained by the two methods). Calculation of G1 and EWM is described in Jiskani et al. [20] and Ma et al. [21]. After determining the final weights of the indicators, we use a linear weighting method to find the level of development of marine new quality productivity. The value of the MNQP is in the range of [0, 1], and the higher the value, the higher the level of development of marine new quality productivity in the region.
2.1.2. Three-Dimensional Kernel Density Estimation
For specific 3D kernel density formulae, see the results of Wang et al. [22]. With three-dimensional kernel density estimation, a time dimension is added; therefore, compared with two-dimensional kernel density estimation, this method more clearly and intuitively shows time-ordered trends in the kernel density curve. In this paper, we use three-dimensional kernel density estimation based on a Gaussian kernel function with the following formula:
In Equations (1) and (2), f(x) is the development level of marine new quality productivity of the nth coastal provincial administrative region, N is the number of provinces, xi is the probability density function, k(x) is the Gaussian kernel function, is the mean value of , and h is the bandwidth (the lower the value of the bandwidth, the higher the precision of the estimation).
2.1.3. GINI, Theil, and MLD
The GINI, Theil, and MLD (mean logarithmic deviation) indices are commonly used to measure inequality; the three indices are somewhat complementary. The GINI is more sensitive to changes in coastal areas with intermediate (low- and high-level) marine new quality productivity, while the Theil and MLD indices are more sensitive to changes in coastal areas with upper (higher level) and lower (lower level) new marine productivity, respectively. The formulas for the three indices are shown below:
In Equations (3)–(5), i is the coastal provincial administrative region that takes a value of [0, 1]; is the average value of new marine productivity; and ui is the level of development of new marine productivity of the ith coastal region in descending order. The larger the values of the GINI, Theil, and MLD, the larger the regional disparity in marine new quality productivity. Specifically, the larger the value of the GINI coefficient, the larger the regional gap in marine new quality productivity between low level and high level coastal areas; the larger the value of the Theil index, the larger the regional gap in marine new quality productivity between high level coastal areas; and the larger the value of the MLD index, the larger the regional gap in marine new quality productivity between low level and high level coastal areas. The larger the value of MLD index, the larger the regional gap in marine new quality productivity between coastal areas with lower level of marine new quality productivity.
2.1.4. Quadratic Assignment Procedure (QAP)
After identifying regional gaps in China’s marine new quality productivity using the three indices (GINI, Theil, and MLD), we use the QAP to analyze possible factors affecting these regional gaps. Traditional regression models lack consideration of these variables and often produce problems related to multiple covariance and autocorrelation, which affect the objectivity of the regression results [23]. The QAP model requires no independence and makes no normal distribution assumptions. Instead, we start with the data form, construct a difference matrix, and bring it into the regression operation. Using this process, we can better deal with the problem of relational data covariance. In addition, the results are more robust than those obtained using the traditional regression model [24,25]. Therefore, in this study, we use the QAP to identify the factors influencing marine new quality productivity in China. We use the difference matrix as the explanatory variable, constructing a relationship model including marine economic development, the structure of the marine industry, progress of marine green technology, degree of opening up to the outside world, and levels of financial support, environmental regulation, and financial development as the explanatory variables. The model is as follows:
In Equation (6), Y is the explanatory variable (i.e., the difference matrix of marine new quality productivity), β0 and β1 are the parameters to be estimated, X is the explanatory variable including seven difference matrices, namely, the development of the marine economy (X1), structure of the marine industry (X2), advancement of marine green technology (X3), degree of opening up to the outside world (X4), level of financial support (X5), extent of environmental regulation (X6), and level of financial development (X7). is a random disturbance term. Unlike the traditional econometric model, the data for the difference matrix variables are in the form of an n-order square matrix, and the specific formula is as follows:
In Equation (7), Gij is the difference in the explained variables between two coastal provincial administrative regions, and Gq,i,j is the difference in the explanatory variables between two coastal provincial administrative regions. q ∈ [1,7] is based on Gi − Gj and Gq,i − Gq,j. The main diagonal is the difference between variables of the same coastal provincial administrative regions, for which all values are zero.
2.1.5. Standard Deviation Ellipse
For the specific formula of the standard deviation ellipse, refer to Wang et al. [26]. We analyze the spatial distribution pattern of marine new quality productivity in China at the geographic level using the standard deviation ellipse and including the center of gravity, angle of rotation, long semi-axis, and short semi-axis. We also use the Albers projection coordinate system (central longitude 105°N, standard latitude 25°N, 47°N). The specific formulas are as follows:
① Center of gravity:
② Angle of rotation:
③ Standard deviation of the X and Y axes:
where the coordinates deviate from , :
④ Ellipse area:
In Equations (8)–(12), ( ) are the latitude and longitude coordinates of each coastal area; is the marine new quality productivity of each coastal area; is the angle of gyre of the ellipse, based on the x-axis, with positive north (12 o’clock direction) being 0 degrees; and are the coordinate deviations from the center of gravity of the marine new quality productivity of each coastal area; and denote the standard deviations of the main axis and the auxiliary axes of the ellipse, respectively; (, ) denote the coordinates of the center of gravity of marine new quality productivity; and S is the area of the standard deviation ellipse.
2.1.6. Markov Chain Method
For the specific Markov chain formula, please refer to the research by Wang et al. [26]. In this paper, we use the Markov chain method to analyze trends in the dynamic evolution of marine new quality productivity in China. To do so, we construct a Markov chain transfer matrix. Markov chain satisfies a certain stochastic process of {u(t), t ∈ T}, where u(t) is any finite-state value of the space Q, which possesses no first-order posteriority, and T is the observation window of the study sample. The variables u are states j and i in periods t and t − 1, respectively, and the states in other periods are represented as ik (k = 0, 1, …, t − 2). pij is the state transfer probability, and the no posteriority property implies that the state of the variable x in period t is only related to its state in the previous period t − 1, and is not related to its state in earlier periods. The specific formula is as follows:
In Equations (13) and (14), development of China’s marine new quality productivity is divided into n states, which can be obtained using n×n transfer matrix pij, which characterizes the probability of China’s marine new quality productivity in the current period of state j in the next period of state i. All state transfer probabilities are composed of the state transfer probability matrix P. Then, state transfer probability is estimated using the method of great likelihood, the specific formula of which is as follows:
In Equations (15) and (16), ni is the number of times state i occurs; nij is the number of times state i transitions to state j; Ft is the initial distribution vector; and Ft+r is the state vector after r periods. If r keeps increasing, state transfer matrix Pr will converge to the limit matrix of rank 1, which means that the space in general enters into a state of convergence, and the steady state distribution of China’s marine new quality productivity can be obtained.
2.2. Data Sources
Our analysis is based on balanced panel data during the period 2006–2021 from 11 coastal provinces, municipalities, and autonomous regions. Due to missing data, Taiwan Province, Hong Kong Special Administrative Region, and Macao Special Administrative Region are excluded. The 11 coastal provincial administrative regions are then categorized into the northern maritime economic circle, which includes Liaoning, Hebei, Tianjin, and Shandong; the eastern maritime economic circle, which includes Jiangsu, Shanghai, and Zhejiang; and the southern maritime economic circle, which includes Fujian, Guangdong, Guangxi, and Hainan. The data in this study are derived from the China Marine Economy Statistical Yearbook, China Environment Statistical Yearbook, China Statistical Yearbook, provincial statistical yearbooks, and EPS database. Missing data are supplemented by linear interpolation and the moving average method, and the years 2006, 2011, 2016, and 2021 are set as typical years. The division of China’s 11 coastal provincial administrations (excluding Hong Kong, Macau and Taiwan) and the three maritime economic zones is shown at Figure 2.

Figure 2.
China’s three major maritime economic zones.
3. Comprehensive Evaluation of Marine New Quality Productivity in China
3.1. Index System for Evaluation of China’s Marine New Quality Productivity
The first step in the comprehensive evaluation of China’s marine new quality productivity is construction of a scientific and reasonable index system that fully reflects the actual situation of the marine industry in China. New workers, objectives, and relevant materials, the continuous upgrading of human capital, optimization of equipment and processes, and updating of technology and materials have contributed greatly to the development of the marine industry in China [27]. The benefits of marine output are economic, technological, and environmental. The potential for economic achievement is considerable; through innovation, development, and wise utilization of resources, these benefits can be realized. However, conservation of the environment is also important. Sustainable development must be pursued on a path of harmonious coexistence between man and nature [28].
We now describe the three aforementioned elements of marine new quality productivity, workers, objectives, and materials. Cultivation of marine scientific research and technology is only possible with the right talent [8]. The knowledge of marine workers is a valuable asset to any firm as is advanced management experience. Professional skills training can profoundly improve the professional capacity of marine workers and quality of their work. As digital information and artificial intelligence empower firms in the marine industry, workers are increasingly needed who have mastered these technologies. Therefore, vigorously recruiting marine workers with digital information skills can accelerate the development of marine new quality productivity in China. Innovation in terms of material and intangible means of production greatly affects marine new quality productivity. Updating traditional infrastructure, developing new digital information facilities, promoting integration of advanced technologies such as big data, cloud computing, artificial intelligence, the Internet of Things, satellite remote sensing, and other advanced technologies is essential to the success of the marine industry. Attention must be paid to green energy consumption to accelerate the marine industry’s transition to environmental sustainability, cost reduction, and efficiency. Front-end digital technologies can be integrated by increasing R&D (Research and Development)-related digital information technology. Major technological research will enhance the capacity of high-end equipment manufacturing. With the transformation and upgrading of traditional marine industries and scientific and technological innovation, marine production has increased, and new areas have opened up, such as deep-sea energy ore extraction, marine bioengineering, pharmaceuticals, and digital information infrastructure. Development of these new areas has greatly enriched the marine industry in China. In addition, utilization of natural resources has become more efficient, especially with the development of digital information technologies that have gradually penetrated into marine production, distribution, circulation, and consumption. Continuous integration of marine laborers, equipment, and materials will improve the efficiency of the use of biological and non-biological resources. It is an exciting time to explore green and digital development of the Chinese marine economy and its new industries, kinetic energies, and forms of business.
Developers of the Chinese marine economy are focusing on high tech, high efficiency, and high quality [7]. Technical efficiency is measured in terms of innovation performance, that is, marine scientific and technological achievements, especially the results of digitalization, intelligentization, and development of informatization technologies. High performance is manifested in the economic results achieved under tight resource and environmental constraints, especially the improvement of national living standards. The marine industry is required to achieve good developmental performance and enhance the total factor productivity of the marine economy. High quality involves realizing a win–win balance between economic and environmental benefits, focusing on biodiversity protection and conservation of marine life. Feasible paths for sustainable development and utilization of marine resources must be identified; digital information technology may be useful for safety monitoring of the marine ecological environment, which will help prevent natural disasters, preserve natural resources, and improve the country’s capacity for environmental protection and risk prevention. The theoretical lineage of China’s marine new quality productivity is shown in Figure 3.

Figure 3.
Theoretical lineage of China’s marine new quality productivity.
In this study, together with the relevant literature [10,17,19], we construct a comprehensive index system for evaluation of China’s marine new quality productivity including two dimensions: input and output. The input dimension contains three major criteria: laborers, related materials, and industry objectives. We elaborate on each of these below.
(1) In the marine laborer category, we focus on labor productivity, labor awareness, and labor skills. Labor productivity is calculated using the following formula: GOP (Gross ocean product) divided by the number of people employed in coastal areas. Labor awareness is related to employment. The specific formula is as follows: the number of employees of marine research and development institutions divided by the number of employed people in a given coastal area. Labor skills are related to education and human capital. Education is measured by determining the number of higher education institutions specializing in marine subjects, while human capital is calculated as the number of students enrolled in general higher education specializing in marine subjects.
(2) The material means of production and intangible means of production are important to development of the marine industry in China. Material means of production include traditional facilities, digital facilities, and energy consumption. Traditional facilities are characterized by four indicators: the turnover of marine goods, the area of marine culture, the total area of salt fields, and the number of travel agencies in the coastal area. Digital facilities include data provided by fiber optic cables and Internet broadband. The formula to determine distribution of fiber optic cables is as follows: length of long-distance fiber optic cables divided by the number of people in a given coastal area. The formula for measurement of Internet broadband is the number of ports of broadband access to the Internet divided by the number of people in a given coastal area. Energy consumption is measured as total energy consumption and electricity consumption. The formula for total energy consumption is: total energy consumption in a given coastal region divided by GDP (Gross Domestic Product) of that coastal region, and the formula for electricity consumption is: electricity consumption in a given coastal region divided by population of that coastal region.
Intangible means of production include innovation support and scientific and technological issues. The formula for innovation support is as follows: R&D expenditure of marine scientific research institutions divided by coastal GDP. The formula for scientific and technological issues is calculated as follows: the number of scientific and technological issues experienced by marine scientific research institutions divided by the number of practitioners working in marine R&D institutions.
(3) New objectives in China’s marine industry include new industries and protection of the environment. The former includes increasing the scale of related and strategic industries, the formula for which is: added value of marine-related industries divided by added value of marine industries. The formula for calculating the scale of strategic industries is: added value of marine scientific research, education, and management services divided by added value of the marine industry.
The ecological environment includes two indicators of pollutant emissions and environmental protection efforts. The formula for calculating pollutant emissions is as follows: total industrial wastewater discharge divided by gross coastal area product. The value for environmental protection efforts is calculated as: environmental protection expenditures divided by government public financial expenditures.
The output dimension is based on three major criteria: economic, technical, and environmental benefits. We elaborate on each of these below.
(1) Economic benefits are related to residential life and industrial development. Residential life is measured according to GDP per capita, calculated as: GDP of a given coastal area divided by population of that coastal area. Industrial development includes three aspects: industrial structure, related industry development, and strategic industry development. First, structure is measured by dividing GDP by gross coastal area product, while related industry development is the added value of marine-related industries. Finally, strategic industry development is characterized by the added value of marine scientific research, education, and management services.
(2) Technological benefits include scientific and technological patents and achievements.
We measure scientific and technological patents by counting the number of patent applications received by marine scientific research institutions; we determine the variable representing patent authorizations by counting the number of patents granted by marine scientific research institutions. Scientific and technological achievements include scientific and technical papers and related writings, including those papers published by marine scientific research institutions. To measure this variable, we determine the number of scientific and technological writings published by marine scientific research institutions in a given year.
(3) Environmental benefits are those derived from nature reserves and observatories. In China, there are many national and local nature reserves. In this study, we measure nature reserves by counting the number of national and local marine-type nature reserves. Observation stations, or observatories, include marine stations and meteorological stations. We count the number of marine stations and meteorological stations for the purposes of our analysis.
3.2. Development of Marine New Quality Productivity in China
Overall, China’s marine new quality productivity showed an increasing growth trend year by year during the period of 2006–2021, with an average value of 0.193. In terms of the timeline of change, the growth rate was highest in 2008 at 13.393% and slowest in 2018 at 0.627%, which was related to the fact that the corresponding year’s coastal area’s marine new quality productivity showed different degrees of decline; China’s marine new quality productivity in 2021 was 0.264, which is 1.207 times higher than the value in 2006. This information implies that China’s marine new quality productivity improved significantly during the sample observation period, but there is still much room for improvement.
The spatial and temporal characteristics of China’s marine new quality productivity are plotted for the three major maritime economic circles (Figure 4).
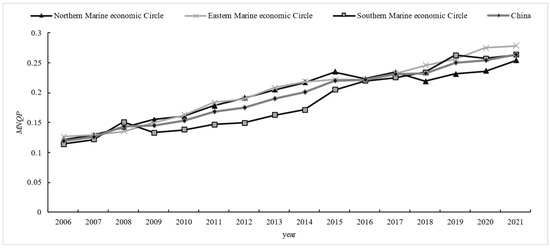
Figure 4.
Trends in marine new quality productivity at the national level and in the three major ocean economic zones (2006–2021).
As can be seen in Figure 4, in the three major maritime economic circles, the mean values for marine new quality productivity in the northern and eastern maritime economic circles are 0.195 and 0.202, respectively, which is higher than the mean value at the national level (0.193), whereas the mean value for marine new quality productivity in the southern maritime economic circle is 0.184, which is lower than the mean value at the national level (0.193). Thus, compared with the northern and eastern maritime economic circles, the southern maritime economic circle lags behind and has considerable room for improvement. The average value for the growth rate of marine new quality productivity in the northern maritime economic circle is 1.106, in the eastern maritime economic circle 1.207, and in the southern maritime economic circle 1.314. This latter value is much higher than that at the national level and those in the northern and eastern maritime economic circles. This implies that the southern maritime economic circle is developing rapidly.
3.3. Spatial and Temporal Characteristics of China’s Marine New Quality Productivity
3.3.1. Classification System
Drawing on the approach of Wang et al. [22,26], we categorize the level of marine new quality productivity as follows: lower, low, high, and higher levels using the quartile method. Based on these categories, we create a state grading map (Figure 5).
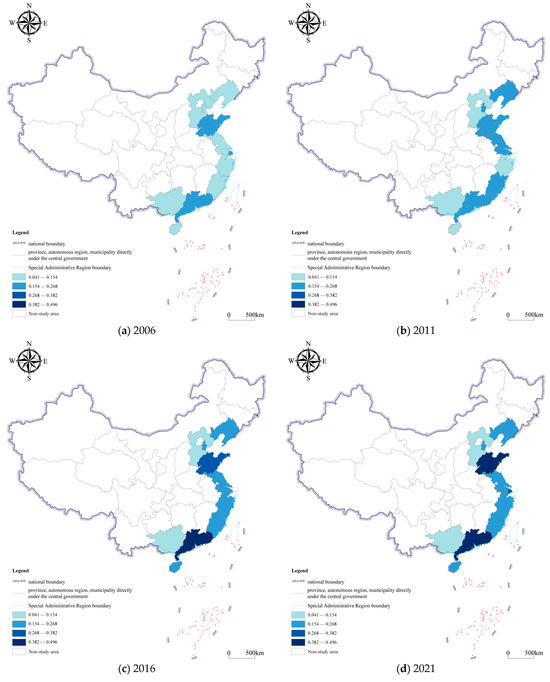
Figure 5.
Spatial and temporal evolution of China’s marine new quality productivity (2006–2021).
Figure 5 shows that development of marine new quality productivity in China varied among coastal regions during the sample observation period. As of 2021, Guangdong, Shanghai, and Shandong were at a higher level of development, and all three coastal regions were at the core of their respective maritime economic circles. Productivity has improved in most of the remaining coastal regions, except Guangxi and Hebei, which have remained stagnant at a lower level. This reflects that there are differences in the development of marine new quality productivity among coastal regions, and over time, coastal regions with better initial status (2006), such as Guangdong, Shandong, and Shanghai, have made great progress, while in coastal regions with weaker initial status (2006), such as Guangxi and Hebei, stagnation has occurred. This is reminiscent of the Matthew effect, in which the strongest always become stronger. We now explore further the regional disparities in China’s marine new quality productivity using various tools.
3.3.2. Three-Dimensional Kernel Density Estimation
To analyze trends in the evolution of China’s marine new quality productivity further, we adopt the Gaussian kernel function to obtain three-dimensional kernel density values. Equations (1) and (2) allow us to obtain these values at the national level and in the three major maritime economic circles. The results are plotted in Figure 6.
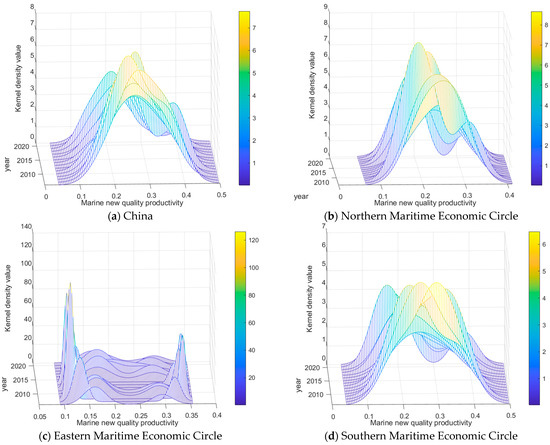
Figure 6.
Three-dimensional kernel density map of marine new quality productivity in China (2006–2021).
Shifts in trends, distribution patterns, extensibility of distribution, and polarization status of the kernel density curves are the same in all regions.
Figure 6 reveals that the three-dimensional kernel density curves of both the nation as a whole and the northern, eastern, and southern maritime economic circles show a rightward shifting trend, which indicates that marine new quality productivity has improved over time. Unlike the national situation and that in the northern and southern maritime economic circles, the eastern maritime economic circle experienced numerous changes. The data at the national level and for the northern maritime economic circle have a tendency to be left-biased at first, and then to become right-biased and trailing over time. In addition, in the coastal areas with below average marine new quality productivity, that is, the northern and southern maritime economic circles, marine new quality productivity is increasing. By contrast, the pattern for marine new quality productivity in the eastern maritime economic circle is always skewed to the right. In terms of polarization, at both the national level and in the three major maritime economic circles, a single-peak distribution is evident in 2021, with no obvious bifurcation or multifurcation.
4. Regional Disparities in Marine New Quality Productivity in China
4.1. Regional Gap Analysis
In order to elucidate regional gaps in China’s marine new quality productivity, we utilize the GINI, Theil, and MLD methods to analyze data from coastal areas of different statuses. We use the GINI to measure regional gaps in coastal areas with marine new quality productivity in the middle range (low level and high level), MLD to measure regional gaps in coastal areas with marine new quality productivity in the lower range (lower level), and Theil to measure it in the upper range (higher level). The results are shown in Table 1.

Table 1.
Changes in GINI, Theil, and MLD of marine new quality productivity in China.
As shown in Table 1, both the GINI and Theil values for marine new quality productivity in China increased during the observation period, which implies that those coastal areas with marine new quality productivity at the low, high, and higher levels have seen a gradual increase in regional disparity in recent years. By contrast, a decrease in MLD implies that in those coastal areas at lower levels, the regional gap has decreased. In addition, in order to further observe the changes of GINI, Theil and MLD in China’s marine new quality productivity, based on the visualization of the results of Table 1 with bar charts and line graphs, the growth rate indicators of GINI, Theil and MLD were added, and the results are shown in Figure 7.
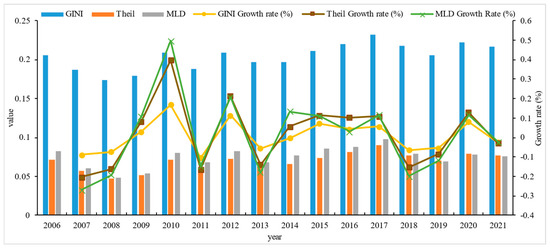
Figure 7.
Trends in GINI, Theil, and MLD of marine new quality productivity in China (2006–2021).
Figure 7 reveals that the values for GINI, Theil, and MLD show roughly the same increasing and decreasing trends from 2006 to 2021. In 2010, the increase of GINI amounted to 16.964%, that for Theil was 39.806%, and that for MLD 49.721%. The magnitude of the change in this year was the largest ever, indicating that the variance of coastal areas with marine new quality productivity at the Lower level showed the largest change in 2013, while the variance of coastal areas with marine new quality productivity at the low level and high level showed the smallest change. In 2011, the GINI coefficient decreased by 10.353%, that for Theil by 16.389%, and that for MLD by 14.552%, indicating that the difference in marine new quality productivity among coastal areas decreased in 2011. The difference in marine new quality productivity was the largest in 2013 and smallest for the coastal zones at the low and high levels. Comparing changes in the values of GINI, Theil, and MLD horizontally, we find that the GINI coefficient is always higher than Theil and MLD; for example, their mean values are 0.204, 0.069, and 0.075, respectively, which indicates that differences in marine new quality productivity among coastal areas with low and high status are larger, as are differences among coastal areas with lower and higher status. The mean values of the growth rates for the GINI, Theil, and MLD are 105.386%, 108.006%, and 92.448%, respectively, which shows that variations in marine new quality productivity among coastal areas of high status are large, while those among coastal areas of low and high status are largest. Variations among coastal areas at high levels are great, those among coastal areas at low and high levels are moderate, and those among coastal areas at higher levels are smallest.
4.2. Factors Influencing Regional Disparities in Marine New Quality Productivity in China
The previous section revealed that there are obvious regional gaps in China’s marine new quality productivity. We now identify factors affecting the regional gaps and use QAP regression to determine the influence of each variable on China’s marine new quality productivity. The results of the QAP regression analysis are obtained by calculating Equations (6) and (7) and are shown in Table 2.
Table 2.
QAP regression results.
Table 2 reveals that, compared with other variables, the gap in the degree of openness to the outside world (X4) and the gap in the level of financial development (X7) are more significant. These are the main factors contributing to the regional disparities in China’s marine new quality productivity. Therefore, promotion of an externally-oriented economy to increase the degree of openness to the outside world and support for the financial industry to accelerate inter-regional capital flow will assist in the synergistic development of China’s marine new quality productivity. The openness gap (X4) in any given year contributes significantly to the regional gap in marine new quality productivity.
To ensure the robustness of the results, we conduct a robustness test using the sample mean; the signs of the coefficients are consistent with those of the main analysis. This suggests that the wider the gap in the degree of openness to the outside world, the more pronounced will be the regional gap in China’s marine new quality productivity, possibly because differences in the degree of openness to the outside world not only reflect differences in import and export trade and the level of foreign investment [29], but also reflect the international flow of human resources, capital, and technology. Thus, numerous sea-related factors and import and export trade greatly affect the development of the marine economy [30,31], which in turn affects marine new quality productivity.
Except for 2006, gaps in the financial development level (X7) have a significant negative effect on regional gaps in marine new quality productivity. Results of the regression analysis constructing the difference matrix with the sample mean are consistent with the results for most years, thereby confirming their robustness. With the development of inclusive finance and digital information technology, each coastal region has been expanding its coverage and improving its financial services [32,33], thus closing any gaps in service between them, which is conducive to meeting the investment and financing needs of real sea-related enterprises [34] in the form of comprehensive financial services for marine practitioners, fishermen, and farmers, thereby accelerating the synergistic development of marine new quality productivity.
5. Spatial Distribution Pattern and Evolution of Marine New Quality Productivity in China
To outline the spatial distribution pattern and evolution of China’s marine new quality productivity, we now analyze changes in productivity using the center of gravity-standard deviation ellipse method, calculate Equations (8)–(12), and plot the center of gravity of marine new quality productivity at the national level. We also determine the standard deviation ellipse at the national level (Figure 8) and the center of gravity and standard deviation ellipse of marine new quality productivity in the three major maritime economic circles (Figure 9). The relevant parameters are summarized in Table 3.
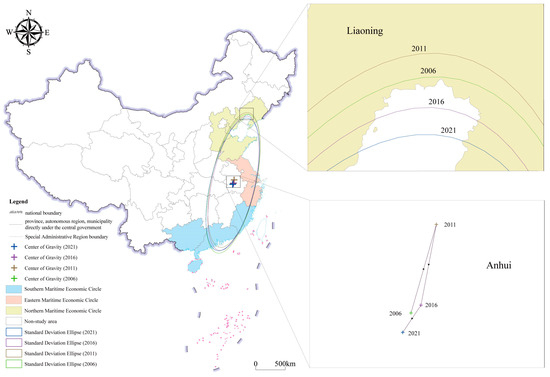
Figure 8.
Center of gravity and standard deviation ellipse plots of marine new quality productivity at the national level.
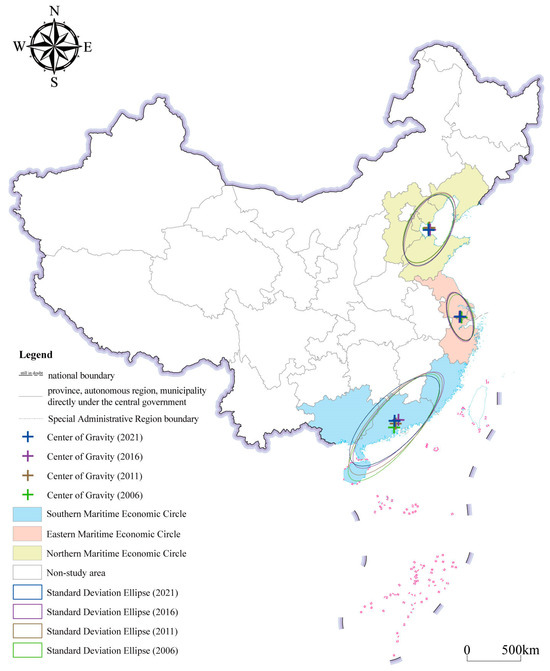
Figure 9.
Center of gravity and standard deviation ellipse plots of marine new quality productivity in three major maritime economic circles.
Table 3.
Center of gravity and standard deviation ellipse parameters of marine new quality productivity in China.
Combining Table 3 and Figure 8, we see from the ellipse plot of the center of gravity and standard deviation of marine new quality productivity at the national level that the center of gravity fell outside the coastal administrative regions due to the north–south distribution of China’s 11 provincial coastal administrative regions. Although the distribution extended to the east–west, the center of gravity was located in the central part of the region close to the coastal provincial administrative regions (within Anhui Province), which indicates a minimal north–south difference in marine new quality productivity. From the plot of the center of gravity, we see that in 2011, the center of gravity moved in a northeast direction a distance of 62.794 km, indicating more enhanced marine new quality productivity in the northeast coastal areas of China (e.g., Tianjin and Liaoning). In 2016, however, the center of gravity moved in a southeast direction a distance of 57.290 km, indicating more enhanced marine new quality productivity in the southeast coastal areas of China (e.g., Guangdong and Fujian). In 2021, the center of gravity moved in a northeast direction a distance of 57.290 km; later in 2021, however, the center of gravity moved in a southwest direction a distance of 24.712 km, indicating greater enhancement of marine new quality productivity in the southwestern coastal areas of China (e.g., Guangxi).
The standard deviation ellipse during the sample observation period was located in the eastern coastal area of China, showing a northeast–southwest distribution pattern. The value of the turning angle θ increased from 13.216° in 2006 to 13.639° in 2021, indicating that the spatial pattern of China’s marine new quality productivity changed from northeast–southwest to due east–west. Southwest by 0.423° to due east–west, with a tendency to shift clockwise. Overall, the standard deviation ellipse moved eastward and the coverage area of the ellipse decreased from 1,404,360,000 km2 in 2006 to 1,335,272,700 km2 in 2021. Changes in the long and short semi-axes suggest that the degree of agglomeration of marine new quality productivity in China increased during the study period. In addition, the long semi-axis is much longer than the short semi-axis, suggesting an increase in concentration, indicating changes in the distribution space of marine new quality productivity in China.
Combining Table 3 and Figure 9, we can examine the center of gravity of marine new quality productivity in the three major maritime economic circles. The center of gravity of the northern maritime economic circle as a whole moved to the southeast a total distance of 17.778 km during the sample observation period, which indicates that new marine productivity was greater in the southeast coastal area of the northern maritime economic circle (e.g., Shandong). The center of gravity of the eastern maritime economic circle as a whole moved in a northwest direction a distance of 16.025 km, indicating greater enhancement of marine new quality productivity in the southeast coastal area of the eastern maritime economic circle (e.g., Jiangsu). The center of gravity of the southern maritime economic circle as a whole moved in a northeast direction a distance of 60.654 km, indicating greater enhancement in the southeast coastal area of the southern maritime economic circle (e.g., Fujian).
The standard deviation ellipse of the northern maritime economic circle shows a northeast–southwest distribution pattern during the observation period. The value of the angle of rotation θ shows that the standard deviation ellipse of the northern maritime economic circle had a tendency to shift in a counterclockwise direction, and its coverage area increased. Changes in the long and short semi-axes indicated that the diffusion tendency in the northern maritime economic circle was enhanced. In addition, the long semi-axis was much longer than the short semi-axis, indicating that the distribution of marine new quality productivity in the northern maritime economic circle was narrow and long.
The standard deviation ellipse of the eastern maritime economic circle shows a northwest–southeast distribution pattern. From the angle of rotation θ, we see that the standard deviation ellipse of this circle had a tendency to shift counterclockwise, and its coverage area increased during the observation period. The standard deviation ellipse of the eastern maritime economic circle grew along the long semi-axis and shrink along the short semi-axis.
The standard deviation ellipse of the southern maritime economic circle shows a northeast–southwest distribution pattern. From the angle of rotation θ, we see that the standard deviation ellipse of this circle had a tendency to shift in the clockwise direction continuously, and its coverage area was reduced. The long semi-axis of the standard deviation ellipse of the southern maritime economic circle was reduced while the short semi-axis grew, indicating a clustering tendency of the standard deviation ellipse of the southern maritime economic circle.
6. Dynamic Evolutionary Trends in Marine New Quality Productivity in China
In this study, we analyze dynamic evolutionary trends in China’s marine new quality productivity using Markov chains, assuming that this variable obeys a finite first-order Markov process and that the state transfer probability remains stable. We predict its steady state based on the initial state and trend of the Markov chain. Using this approach, we categorize development of China’s marine new quality productivity into four categories using the quartile method, computing Equations (13)–(16) to obtain the Markov chain transfer matrix. The results are shown in Table 4, and the initial and steady states are presented in Table 5.
Table 4.
Markov chain transfer matrix.
Table 5.
Markov chain initial state and steady state.
As can be seen in Table 4, the probability values on the diagonal of the Markov chain analysis transfer matrix are significantly high than those on the non-diagonal, which indicates that the degree of self-locking between the various states of China’s marine new quality productivity is relatively higher, and that club convergence is obvious. The off-diagonal values are distributed on the left and right sides of the diagonal, which suggests not only the possibility of upward transfer, but also the possibility of downward transfer. Specifically, the probability that a coastal area with current marine new quality productivity at a lower level will shift to a low level in the next period is 0.205, while the probability that it will shift to a high level is 0.023. The probability that a coastal area with current marine new quality productivity at a low level will shift to a lower level in the next period is 0.049. The probability of transferring to a high status is 0.220, and the probability of transferring to a higher status is 0.024. The probability that a coastal area with current marine new quality productivity at a high level will transfer to a lower level in the next period is 0.024; the probability of it transferring to a low level is 0.025; and the probability of transferring to a high level is 0.023. The probability that a coastal area with marine new quality productivity at a higher level will transfer to a high level in the next period is 0.105. The probability that a coastal area with marine new quality productivity at a low level will transfer to a lower level in the next period is 0.024. Thus, except for coastal areas with higher levels of marine new quality productivity, there is a leapfrog phenomenon (i.e., skipping the neighboring states and directly entering a high or low state). Almost all coastal areas are at risk of downgrading.
In summary, in the process of shifting from spatial non-equilibrium to spatial equilibrium (that is, balanced development), China’s marine new quality productivity has both opportunities and challenges, such as breaking the self-locking of lower-level statuses and preventing the downgrading of high and higher statuses.
Table 5 shows that China’s marine new quality productivity will remain at high and higher levels for a long time, and that the probability values of the lower-, low-, high-, and higher-level states are 0.046, 0.078, 0.282, and 0.593, respectively, in the steady state. Comparing the initial and stable states, we see a significant decrease in the probability values of the lower- and low-level states, while values for both the high and higher levels in the initial state are 0, and there is a significant increase in both the high and higher levels in the stable state.
In summary, in the long term, China’s marine new quality productivity will shift from the lower- and low-level states to the high- and higher-level states, eventually stabilizing there.
7. Conclusions and Recommendations
7.1. Conclusions
In this study on the development of marine new quality productivity in 11 coastal provincial administrative regions of China from 2006 to 2021, we analyzed the spatial and temporal characteristics of China’s marine new quality productivity using three-dimensional kernel density estimation (the LWM combination assignment method); we analyzed regional disparities using three indices, namely, the GINI, Theil, and MLD indices; we analyzed factors affecting China’s marine new quality productivity using the QAP; we analyzed its spatial distribution pattern based on the standard deviation ellipse method; and finally, we explored trends in the dynamic evolution of China’s marine new quality productivity using the Markov chain method. The main conclusions of the study are as follows:
① Measuring the development of China’s marine new quality productivity, we identified a rising trend year by year, comparing mean values of the southern, northern, and eastern maritime economic circles. Although the development of marine new quality productivity in the southern maritime economic circle is lagging behind, as indicated by the growth rate, and there is considerable room for improvement, it has a strong latecomer’s advantage, as the data show a clear catch-up effect.
② We categorized development of China’s marine new quality productivity into four states using the quartile method and found that development in the core areas of the three major maritime economic circles has been increasing over time, while the peripheral areas have not seen a large improvement. Thus, the Matthew effect of the strongest being always the strongest is evident.
We then used the three-dimensional kernel density estimation to analyze the spatial and temporal characteristics of China’s marine new quality productivity and found declines in the peaks of the three-dimensional kernel density curves at both the national level and in the three major maritime economic circles, indicating differences in marine new quality productivity in the various coastal areas.
③ We then used the three indices, GINI, Theil, and MLD, to identify regional disparities in marine new quality productivity in China. Values for the GINI and Theil increased, while those for MLD decreased, over the study period. We observed gradual increases in the regional gaps of those coastal areas with marine new quality productivity at low, high, and higher levels, while the regional gaps of those coastal areas at lower levels decreased.
Finally, using QAP to analyze the factors influencing regional gaps in China’s marine new quality productivity, we found that the gap in the degree of openness to the outside world (X4) and the gap in the level of financial development (X7) were the main factors contributing to these regional gaps. Clearly, an externally-oriented economy will increase the degree of openness to the outside world, promote the prosperity of the financial industry, and accelerate the flow of capital between regions, which is conducive to the synergistic development of marine new quality productivity in the various coastal regions in China.
④ Development of China’s marine new quality productivity showed a northeast–southwest distribution pattern during the study period. Over time, the standard deviation ellipse coverage area was reduced, and a clustering trend became evident. Examining the center of gravity, we saw greater increases in the marine new quality productivity of the southeastern coastal area of the northern maritime economic circle (e.g., Shandong), the southeastern coastal area of the eastern maritime economic circle (e.g., Jiangsu), and the southeastern coastal area of the southern maritime economic circle (e.g., Fujian). Changes in the standard deviation ellipse indicated increases in the diffusion of marine new quality productivity in the northern maritime economic circle and increases in the standard deviation ellipse in the eastern and southern maritime economic circles in the long half-axis, but not the short half-axis.
⑤ There is a higher degree of self-locking between various states of marine new quality productivity in China, and club convergence is obvious. The non-diagonal values are distributed on the left and right sides of the diagonal, indicating not only the possibility of upward transfer, but also the possibility of downward transfer. Breaking the self-locking of the lower-level state and being aware of state downgrading are the biggest challenges to realizing the balanced development of China’s marine new quality productivity, which will eventually stabilize at the higher and high levels.
7.2. Recommendations for Countermeasures
Based on the above conclusions, we now put forward the following suggestions as countermeasures:
① Synergistic co-creation of a high-quality plan for development of the marine economy, linking the government, enterprises, universities, and cooperative organizations, is necessary. First, the government should coordinate all efforts, formulate targeted policies based on the current state of development of the national marine economy, meet the demand for factor inputs for its development, optimize the efficiency of resource allocation, and accelerate the process of marketization of sea-related products. Secondly, sea-related enterprises should continuously improve their awareness of scientific research and innovation, hire experts in marine R&D and technology, adopt clean production technology, enhance their total factor productivity and scientific research performance, and promote sustainable development. Several enterprises must play a leading role in continuously improving the awareness of marine environmental protection, reduce pollution caused by marine production and business operations, and actively take responsibility for rational development and utilization of marine resources and ecological conservation. Thirdly, universities and research institutes should conduct research on major marine scientific research technologies, provide favorable remuneration and conditions for marine research workers, optimize the existing scientific research management system, and improve the efficiency of technological R&D so as to promote marine economic development. Fourth, to strengthen the collective economy of marine fisheries, professional cooperatives should gradually implement production cooperation schemes with attention to application of marine production technology, implementation of standardized production, and unified production standards. Brand strategy and ecological aquaculture are other considerations. Finally, to accelerate production, large-scale operations must strive to steadily increase the efficiency of the fishery industry and improve the income of fishermen.
② Vigorous development of marine new quality productivity will promote the upgrading of traditional marine industries. Strong support is needed for development of the shipping industry, high-end marine equipment manufacturing industry, marine energy and chemical industry, marine biological medicine, desalination, and other new industries. Green transformation of the marine industry must be a priority, that is, full development and utilization of marine natural resources while also improving the green total factor productivity of the marine economy. Integration of digital information technology, such as artificial intelligence, Internet of Things, 5G communication, cloud computing, big data, and others, is necessary within the marine industry. Such technology will reshape the chains of innovation, capital, supply, and industry in the Chinese marine economy. Support for digital intelligence must be strengthened in the modern marine industry to enhance overall quality and efficiency.
③ Exchange and cooperation among coastal regions in terms of technology, talent, and capital must be promoted. Then, taking the center region of the maritime economic circle as the base, development should radiate to the surrounding areas to bring a trickle-down effect to areas that are weaker in terms of maritime economic development. In addition, regions with higher levels of development should accelerate the spillover of technology, promote advanced management and operations, and offer demonstrations of their experiences to provide knowledge about the development of the marine economy in coastal regions. Coastal areas with weak economic development should take the initiative to commit themselves to exploring new marine industries and promote coordinated development of marine new quality productivity across regions.
Author Contributions
Conceptualization, R.W. and L.Y.; Methodology, W.W. and Y.W.; Data curation, W.W. and Y.W.; Writing—original draft, R.W., W.W. and Y.W.; Writing—review & editing, L.Y. and R.W.; Visualization, R.W. and L.Y. All authors have read and agreed to the published version of the manuscript.
Funding
Guangdong Province Philosophy and Social Sciences “13th Five-Year Plan” project (GD20YDXZYJ15); Guangdong Ocean University National Social Science Foundation Cultivation Project (C21812); Guangdong Ocean University “Double Hundred Action” Project (C24011).
Data Availability Statement
The data presented in this study are available from the authors upon request.
Conflicts of Interest
The authors declare no conflict of interest.
References
- Sun, C.; Yang, Z.; Yang, Y. Navigating the Tides of Change: The Local Dynamics of China’s Marine Economic Policy. Mar. Policy 2024, 165, 106207. [Google Scholar] [CrossRef]
- Wu, J.; Li, B.; Zhang, L.; Qu, Y. Spatio-Temporal Evolution and Adaptive Cycle of Marine Economy Resilience in Bohai Rim Region. Reg. Stud. Mar. Sci. 2024, 80, 103893. [Google Scholar] [CrossRef]
- Sun, C.; Liang, Z.; Zhai, X.; Wang, L. Obstacles to the Development of China’s Marine Economy: Total Factor Productivity Loss from Resource Mismatch. Ocean Coast. Manag. 2024, 249, 107009. [Google Scholar] [CrossRef]
- Xu, J.; Tian, J.; Liu, Y. The Study of Coevolution Relationship among Coastal Marine Economy, Innovation, and Ecology Based on Chinese Complex Systems. Financ. Res. Lett. 2024, 65, 105549. [Google Scholar] [CrossRef]
- Quan, Y.; Jin, J. A Bibliometric Review on Marine Ecological Environment Governance: Development and Prospects (1990–2022). Environ. Sustain. Indic. 2024, 22, 100406. [Google Scholar] [CrossRef]
- Pan, L.; Meng, Q.; Wang, Z.; Wu, J.; Yu, J. Coordinated Measurement of Marine Economy: High-Quality and Low-Carbon Development in China. Ocean Coast. Manag. 2024, 257, 107342. [Google Scholar] [CrossRef]
- Hao, Y.; Wu, J. An Analysis of Innovative Contributions to the Important Discourse on the Development of New Quality Productivity. J. Contemp. Educ. Res. 2024, 8, 135–141. [Google Scholar] [CrossRef]
- Xie, F.; Jiang, N.; Kuang, X. Towards an Accurate Understanding of ‘New Quality Productive Forces. Econ. Political Stud. 2024, 1–15. [Google Scholar] [CrossRef]
- Wang, J.; Qiao, L.; Zhu, G.; Di, K.; Zhang, X. Research on the Driving Factors and Impact Mechanisms of Green New Quality Productive Forces in High-Tech Retail Enterprises under China’s Dual Carbon Goals. J. Retail. Consum. Serv. 2025, 82, 104092. [Google Scholar] [CrossRef]
- Shao, C.; Dong, H.; Gao, Y. New Quality Productivity and Industrial Structure in China: The Moderating Effect of Environmental Regulation. Sustainability 2024, 16, 6796. [Google Scholar] [CrossRef]
- Yu, L.; Zhang, Q. Measurement of New Qualitative Productivity Kinetic Energy from the Perspective of Digital and Green Collaboration--Comparative Study Based on European Countries. J. Clean. Prod. 2024, 476, 143787. [Google Scholar] [CrossRef]
- Li, J.; Noorliza, K.; Zhang, X. Enhancing Environmental, Social, and Governance Performance through New Quality Productivity and Green Innovation. Sustainability 2024, 16, 4843. [Google Scholar] [CrossRef]
- Zhang, J.; Shan, Y.; Jiang, S.; Xin, B.; Miao, Y.; Zhang, Y. Study on the Coordinated Development Degree of New Quality Productivity and Manufacturing Carbon Emission Efficiency in Provincial Regions of China. Environ. Dev. Sustain. 2024, 1–35. [Google Scholar] [CrossRef]
- Lin, L.; Gu, T.; Shi, Y. The Influence of New Quality Productive Forces on High-Quality Agricultural Development in China: Mechanisms and Empirical Testing. Agriculture 2024, 14, 1022. [Google Scholar] [CrossRef]
- Liu, Y.; He, Z. Synergistic Industrial Agglomeration, New Quality Productive Forces and High-Quality Development of the Manufacturing Industry. Int. Rev. Econ. Financ. 2024, 94, 103373. [Google Scholar] [CrossRef]
- Sun, J.; Hou, S.; Deng, Y.; Li, H. New Media Environment, Green Technological Innovation and Corporate Productivity: Evidence from Listed Companies in China. Energy Econ. 2024, 131, 107395. [Google Scholar] [CrossRef]
- Li, S.; Wang, X. New Quality Productivity: An Empirical Study of Service Design as a New Driving Force for Rural Revitalization. J. Rural. Revital. Cty. Econ. 2024, 6, 11–19. [Google Scholar] [CrossRef]
- Dai, Y. An Empirical Study on the Influence of New Quality Productivity Development on the Degree of Rural Revitalization. Acad. J. Humanit. Soc. Sci. 2024, 7. [Google Scholar] [CrossRef]
- Zhang, Z.; Li, P.; Wang, X.; Ran, R.; Wu, W. New Energy Policy and New Quality Productive Forces: A Quasi-Natural Experiment Based on Demonstration Cities. Econ. Anal. Policy 2024, 84, 1670–1688. [Google Scholar] [CrossRef]
- Jiskani, I.M.; Han, S.; Rehman, A.U.; Shahani, N.M.; Tariq, M.; Brohi, M.A. An Integrated Entropy Weight and Grey Clustering Method–Based Evaluation to Improve Safety in Mines. Min. Metall. Explor. 2021, 38, 1773–1787. [Google Scholar] [CrossRef]
- Ma, W.; Xiao, C.; Ahmed, S.F.; Feng, T.; Liu, G. Multi-Objective Carbon Neutrality Optimization and G1-EW-TOPSIS Assessment for Renewable Energy Transition. J. Clean. Prod. 2023, 415, 137808. [Google Scholar] [CrossRef]
- Wang, W.; Mao, W.; Wu, R.; Zhu, J.; Yang, Z. Study on the Spatial Imbalance and Polarization of Marine Green Aquaculture Efficiency in China. Water 2024, 16, 273. [Google Scholar] [CrossRef]
- Gao, Y.; Gao, M. Spatial Correlation Network of Municipal Solid Waste Carbon Emissions and Its Influencing Factors in China. Environ. Impact Assess. Rev. 2024, 106, 107490. [Google Scholar] [CrossRef]
- Xu, G.; Wang, Y.; Wang, L.; Zhou, Y. How Do Competition and Collaboration Promote Green Technology Diffusion? Evidence from the Global Hydropower Industry. J. Clean. Prod. 2024, 478, 143890. [Google Scholar] [CrossRef]
- Tan, T.; Chen, Z.; Zha, J.; He, L.; Li, X. Tourism Productivity: Is There Any Spatial Correlation among Various Regions? The Case of China from a Network Analysis Perspective. J. Hosp. Tour. Manag. 2024, 58, 256–268. [Google Scholar] [CrossRef]
- Wang, W.; Mao, W.; Zhu, J.; Wu, R.; Yang, Z. Research on Efficiency of Marine Green Aquaculture in China: Regional Disparity, Driving Factors, and Dynamic Evolution. Fishes 2024, 9, 11. [Google Scholar] [CrossRef]
- Li, L.; Liu, L. New Quality Productivity and Chinese Modernization: Analysis Based on the Perspective of Scientific and Technological Innovation. Int. J. Soc. Sci. Public Adm. 2024, 2, 192–196. [Google Scholar] [CrossRef]
- Qu, X. Research and Prospect of New Quality Productivity: A Literature Review. World Econ. Res. 2024, 13, 201–206. [Google Scholar] [CrossRef]
- Li, R.; Wang, Q.; Ge, Y. Does Trade Protection Undercut the Green Efficiency of the Marine Economy? A Case Study. Mar. Policy 2023, 157, 105864. [Google Scholar] [CrossRef]
- Zheng, H.; Zhang, L.; Zhao, X. How Does Environmental Regulation Moderate the Relationship between Foreign Direct Investment and Marine Green Economy Efficiency: An Empirical Evidence from China’s Coastal Areas. Ocean Coast. Manag. 2022, 219, 106077. [Google Scholar] [CrossRef]
- Liu, F.; Huang, Y.; Zhang, L.; Li, G. Marine Environmental Pollution, Aquatic Products Trade and Marine Fishery Economy——An Empirical Analysis Based on Simultaneous Equation Model. Ocean Coast. Manag. 2022, 222, 106096. [Google Scholar] [CrossRef]
- Nham, N.T.H.; Ha, L.T. The Role of Financial Development in Improving Marine Living Resources towards Sustainable Blue Economy. J. Sea Res. 2023, 195, 102417. [Google Scholar] [CrossRef]
- Wang, S.; Lu, B.; Yin, K. Financial Development, Productivity, and High-Quality Development of the Marine Economy. Mar. Policy 2021, 130, 104553. [Google Scholar] [CrossRef]
- Sun, Y.; Chen, D.; Geng, Z. The Coordination of Technological and Financial Innovation Concepts on the Marine Economy and Its Ecological Development. J. Sea Res. 2024, 197, 102468. [Google Scholar] [CrossRef]
Disclaimer/Publisher’s Note: The statements, opinions and data contained in all publications are solely those of the individual author(s) and contributor(s) and not of MDPI and/or the editor(s). MDPI and/or the editor(s) disclaim responsibility for any injury to people or property resulting from any ideas, methods, instructions or products referred to in the content. |
© 2025 by the authors. Licensee MDPI, Basel, Switzerland. This article is an open access article distributed under the terms and conditions of the Creative Commons Attribution (CC BY) license (https://creativecommons.org/licenses/by/4.0/).