Article

Fouling Community Characteristics in Sea Cage Farms in Leizhou Bay, China

1
Fishery College, Guangdong Ocean University, Zhanjiang 524088, China
2
Key Laboratory of Aquaculture in the South China Sea for Aquatic Economic Animal of Guangdong Higher Education Institutes, College of Fishery, Guangdong Ocean University, Zhanjiang 524088, China
*
Author to whom correspondence should be addressed.
Water 2025, 17(4), 495; https://doi.org/10.3390/w17040495
Submission received: 4 January 2025 / Revised: 4 February 2025 / Accepted: 5 February 2025 / Published: 10 February 2025

Abstract

:
From January to December 2022, a study on biofouling was conducted in the southeast wharf of Leizhou Bay. Over a year, a total of 44 species were recorded, belonging to 10 phyla. The dominant species in the community were coastal warm-water organisms typical of subtropical inner bay environments. The peak settlement period occurred between April and September, with the highest adhesion strength observed in summer. Among the dominant and representative species, Perna viridis stood out, followed by Podocerus brasiliensis, Crassostrea ariakensis, Musculus senhousei, Dreissena polymorphia, Caprella equilibra, Gammaropsis digitata, Stenothoe gallensis, Parhyale hawaiensis, Amphibalanus reticulatus, EnteromorpHa prolifera, Gracilaria bailinae, and Pennaria disticha. Due to competition for settlement space and food, individuals in the biofouling community exhibited mutual dependence or restraint and displayed a specific spatiotemporal distribution pattern adapted to environmental factors. Temperature was the most crucial environmental factor determining the geographic distribution of biofouling species, reflecting the differences in community composition across various climate zones. The number of species, settlement stage, and settlement rate of biofouling organisms were closely tied to water temperature. Additionally, local natural conditions such as salinity, dissolved oxygen, and light, as well as human activities such as aquaculture production, played significant roles in the settlement of biofouling organisms.

1. Introduction

Fouling organisms in aquaculture nets, also known as attached organisms, refer to the collective term for all marine organisms that attach themselves to or inhabit the surfaces of aquaculture nets and adversely affect human economic activities [1]. China has ranked first in global aquaculture production for many years [2], providing the public with high-quality animal protein. In 1998, China began to introduce foreign deep-water cage technology, and currently, cage aquaculture has been implemented in many places. However, due to their numerous gaps and large surface area, aquaculture nets serve as ideal substrates for fouling organisms, and the resulting issues of aquaculture environmental pollution and animal diseases warrant widespread attention [3]. Furthermore, the abundant nutrients from feed losses during feeding and biological excretion in the aquaculture process further promote the growth of fouling organisms in the waters near aquaculture nets [4]. Over time, fouling organisms attach to the nets in large numbers and clog the mesh, not only affecting the exchange of aquaculture water and the healthy growth of aquaculture species but also reducing the service life of the nets [5]. The complex species composition and difficulty in the prevention and control of fouling organisms pose significant challenges in ecological research and healthy aquaculture [6].
Although a series of studies have investigated the impact of biofouling on ships [7], oil and gas drilling platforms [8,9], buoys [10,11], simulated concrete panel tests [12,13,14], and other facilities [15,16], there are relatively few reports on fouling organisms in aquaculture cages, with Greene and Grizzle [17] focusing on fouling organisms in farming cages in the United States. Sliskovic [18] investigated fouling assemblages growing on the netting of fish farm cages in the Adriatic Sea, and there were differences in the fouling organisms between the two sites investigated. Moreover, Ba-Akdah [19] assessed the biofouling community recruitment patterns in commercial cage nets in the Red Sea. In contrast, domestic reports on fouling organisms in aquaculture areas are mostly based on panel suspension experiments, where the material of the test panels differs significantly from that of the aquaculture cages. Greene [17] and Yan [20] have found that the succession patterns on suspended fish cages may differ substantially from the described communities on hard substrates or those attached to the seabed. Moreover, previous studies focused mainly on the perspectives of species compositions, attachment mechanisms, control technologies, the ecological effects of bio-fouling, and alien species [21,22,23,24,25], while the correlation between environmental factors and fouling organisms is less discussed.
Leizhou Bay belongs to the South China Sea, which is located in the coastal waters of west Guangdong, Leizhou Bay, and is a typical nearshore habitat [26]. The marine biological community in this area is diverse, making it a typical sea area for ecological investigations of fouling organisms in China. Although scholars have conducted systematic surveys on fouling organisms on artificial facilities or buoys around this sea area [7,8,9,10,11,12,13,14,15,16], there has been no long-term investigation and study on the fouling organism communities attached to the net materials used in cage aquaculture. In this study, we conducted a 1-year test in Leizhou Bay to systematically understand the community composition of fouling organisms and the larval attachment, in addition to the spatial distribution of the key fouling organism populations in this sea area; evaluated the current status and impact of bio-fouling; clarified the relationship between the distribution of fouling organisms and various environmental factors; and provided theoretical support for developing economical and efficient treatment programs.

2. Materials and Methods
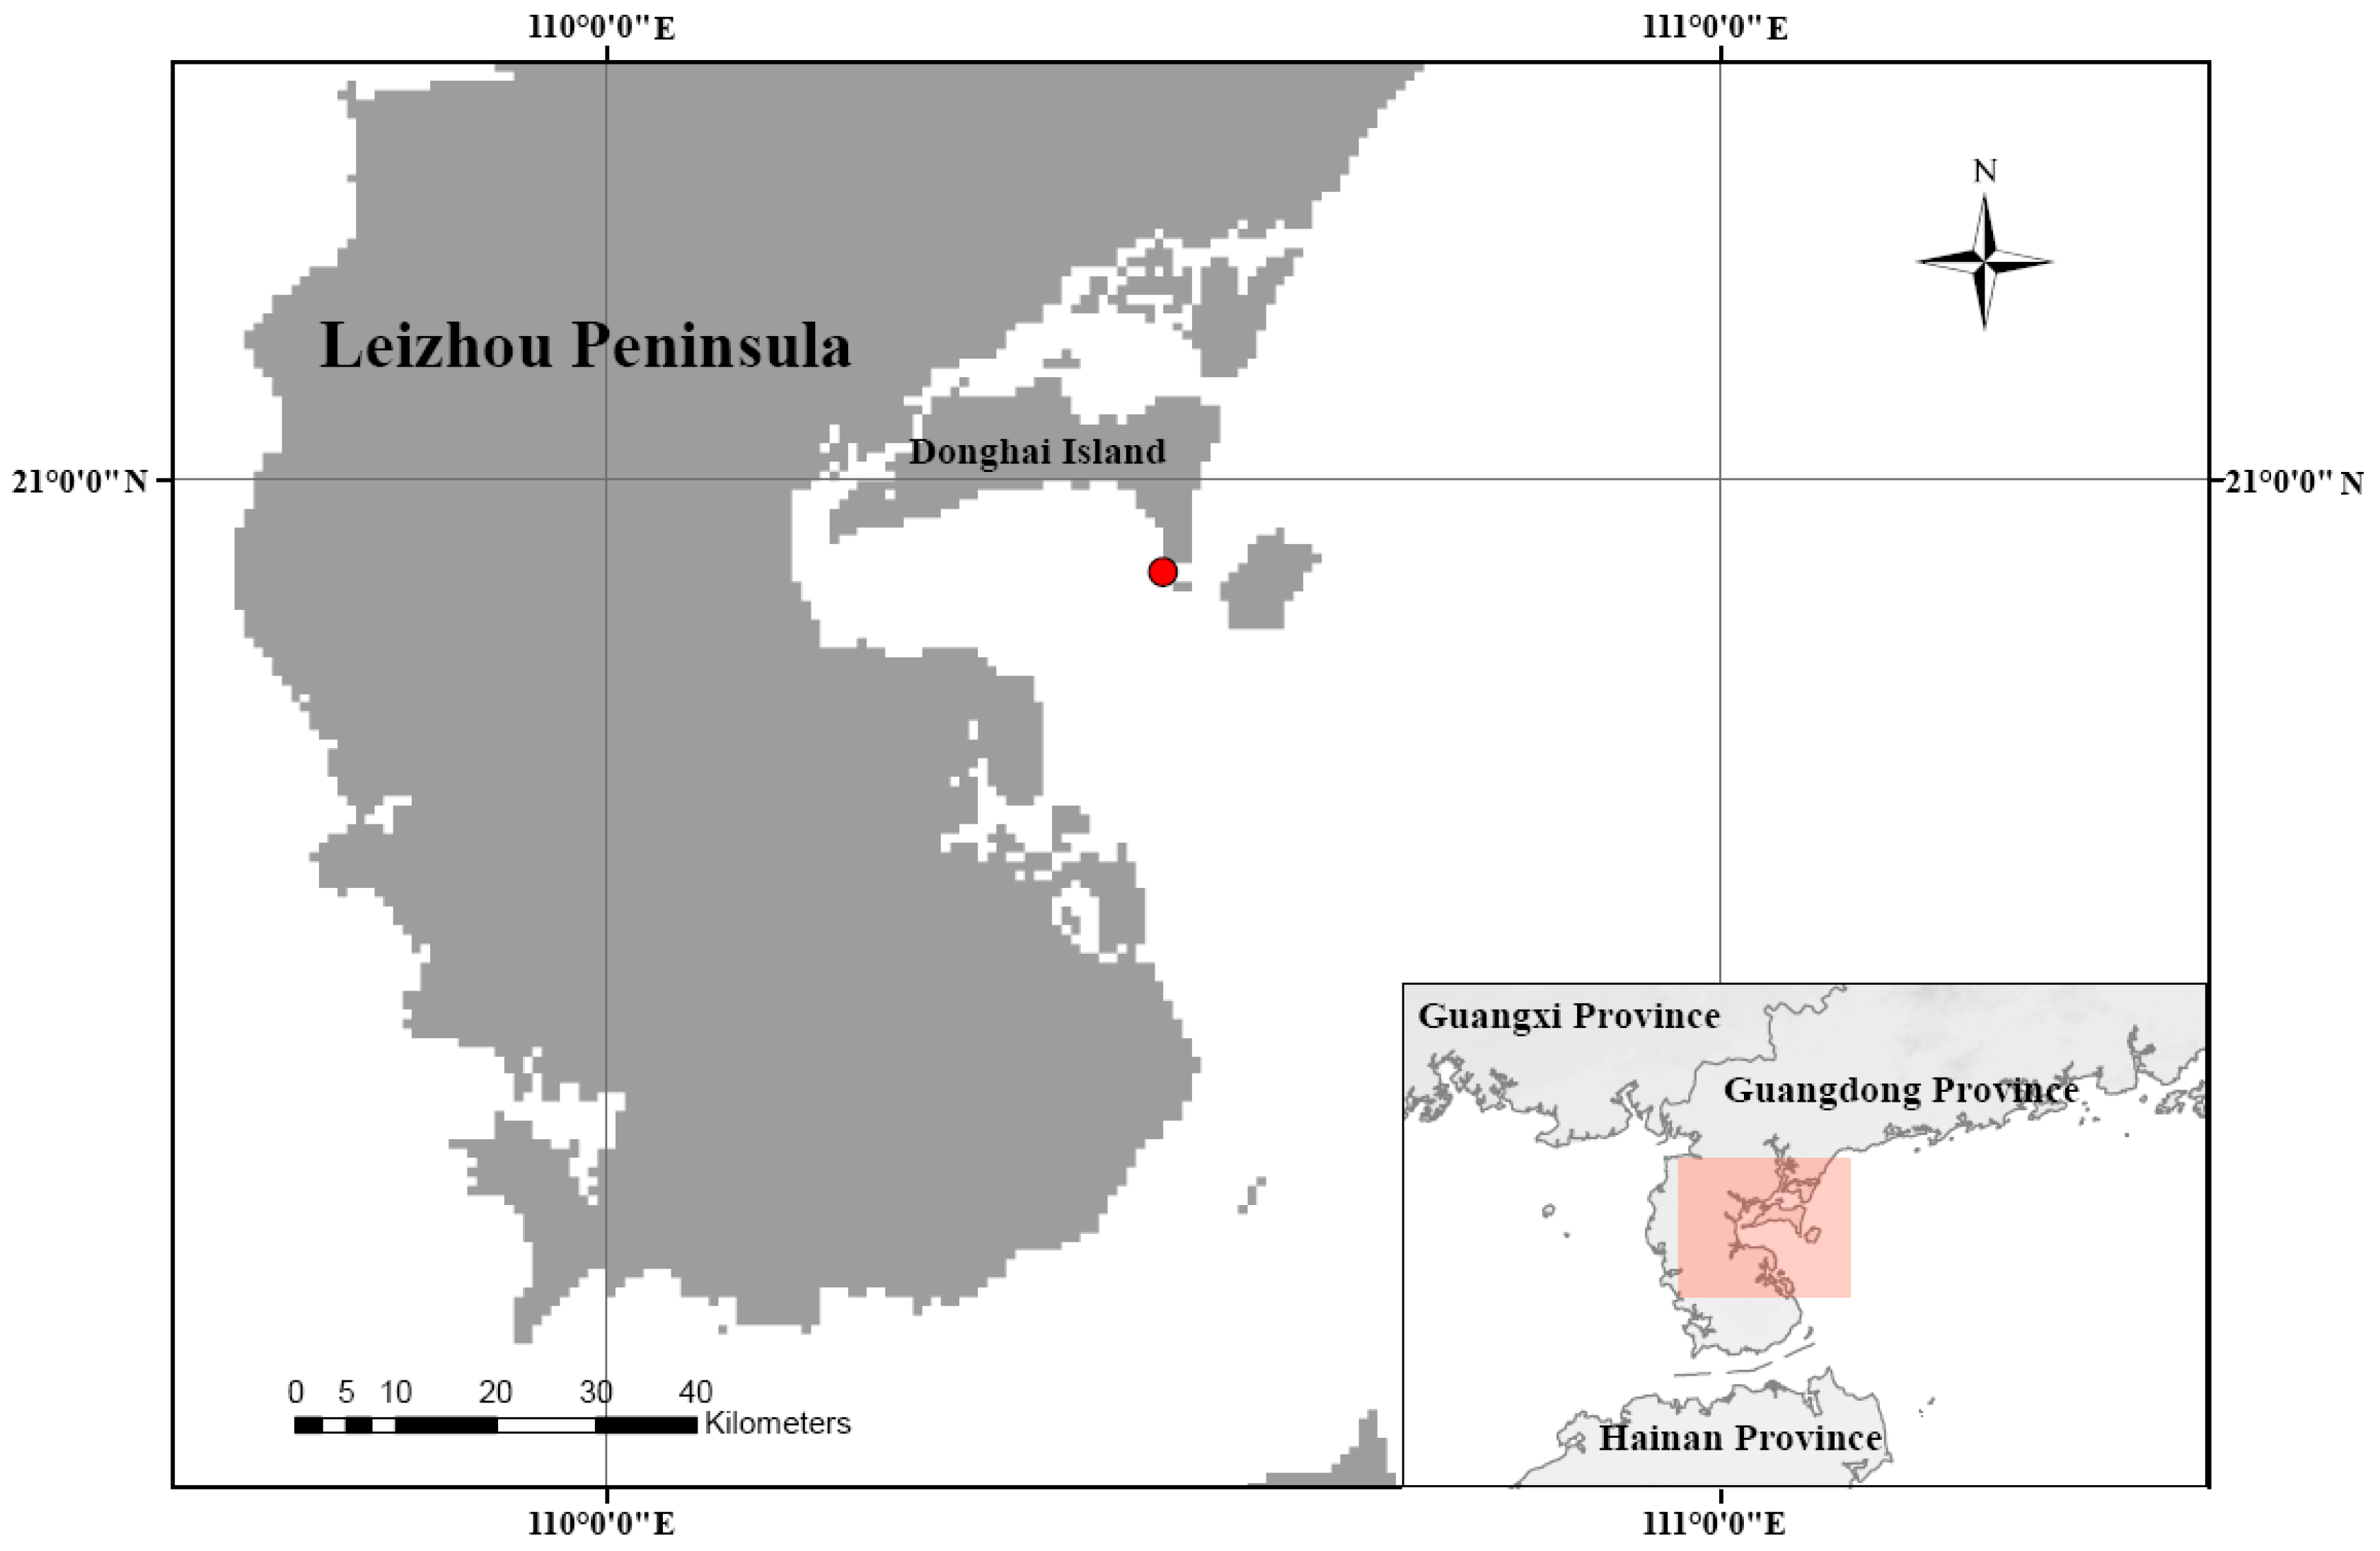
2.1. Survey Area

An annual net test of fouling organisms was conducted in the cage culture area of Leizhou Bay (N 20°55′, E 110°30′) from January to December of 2022. The location of the test net is shown in Figure 1. All operations were carried out in accordance with the relevant provisions of 12763.6-2007 The Specification for Marine Monitoring—Part 6: Marine Biological Survey [27]. The water depth of the survey area is within the range of 8–10 m.

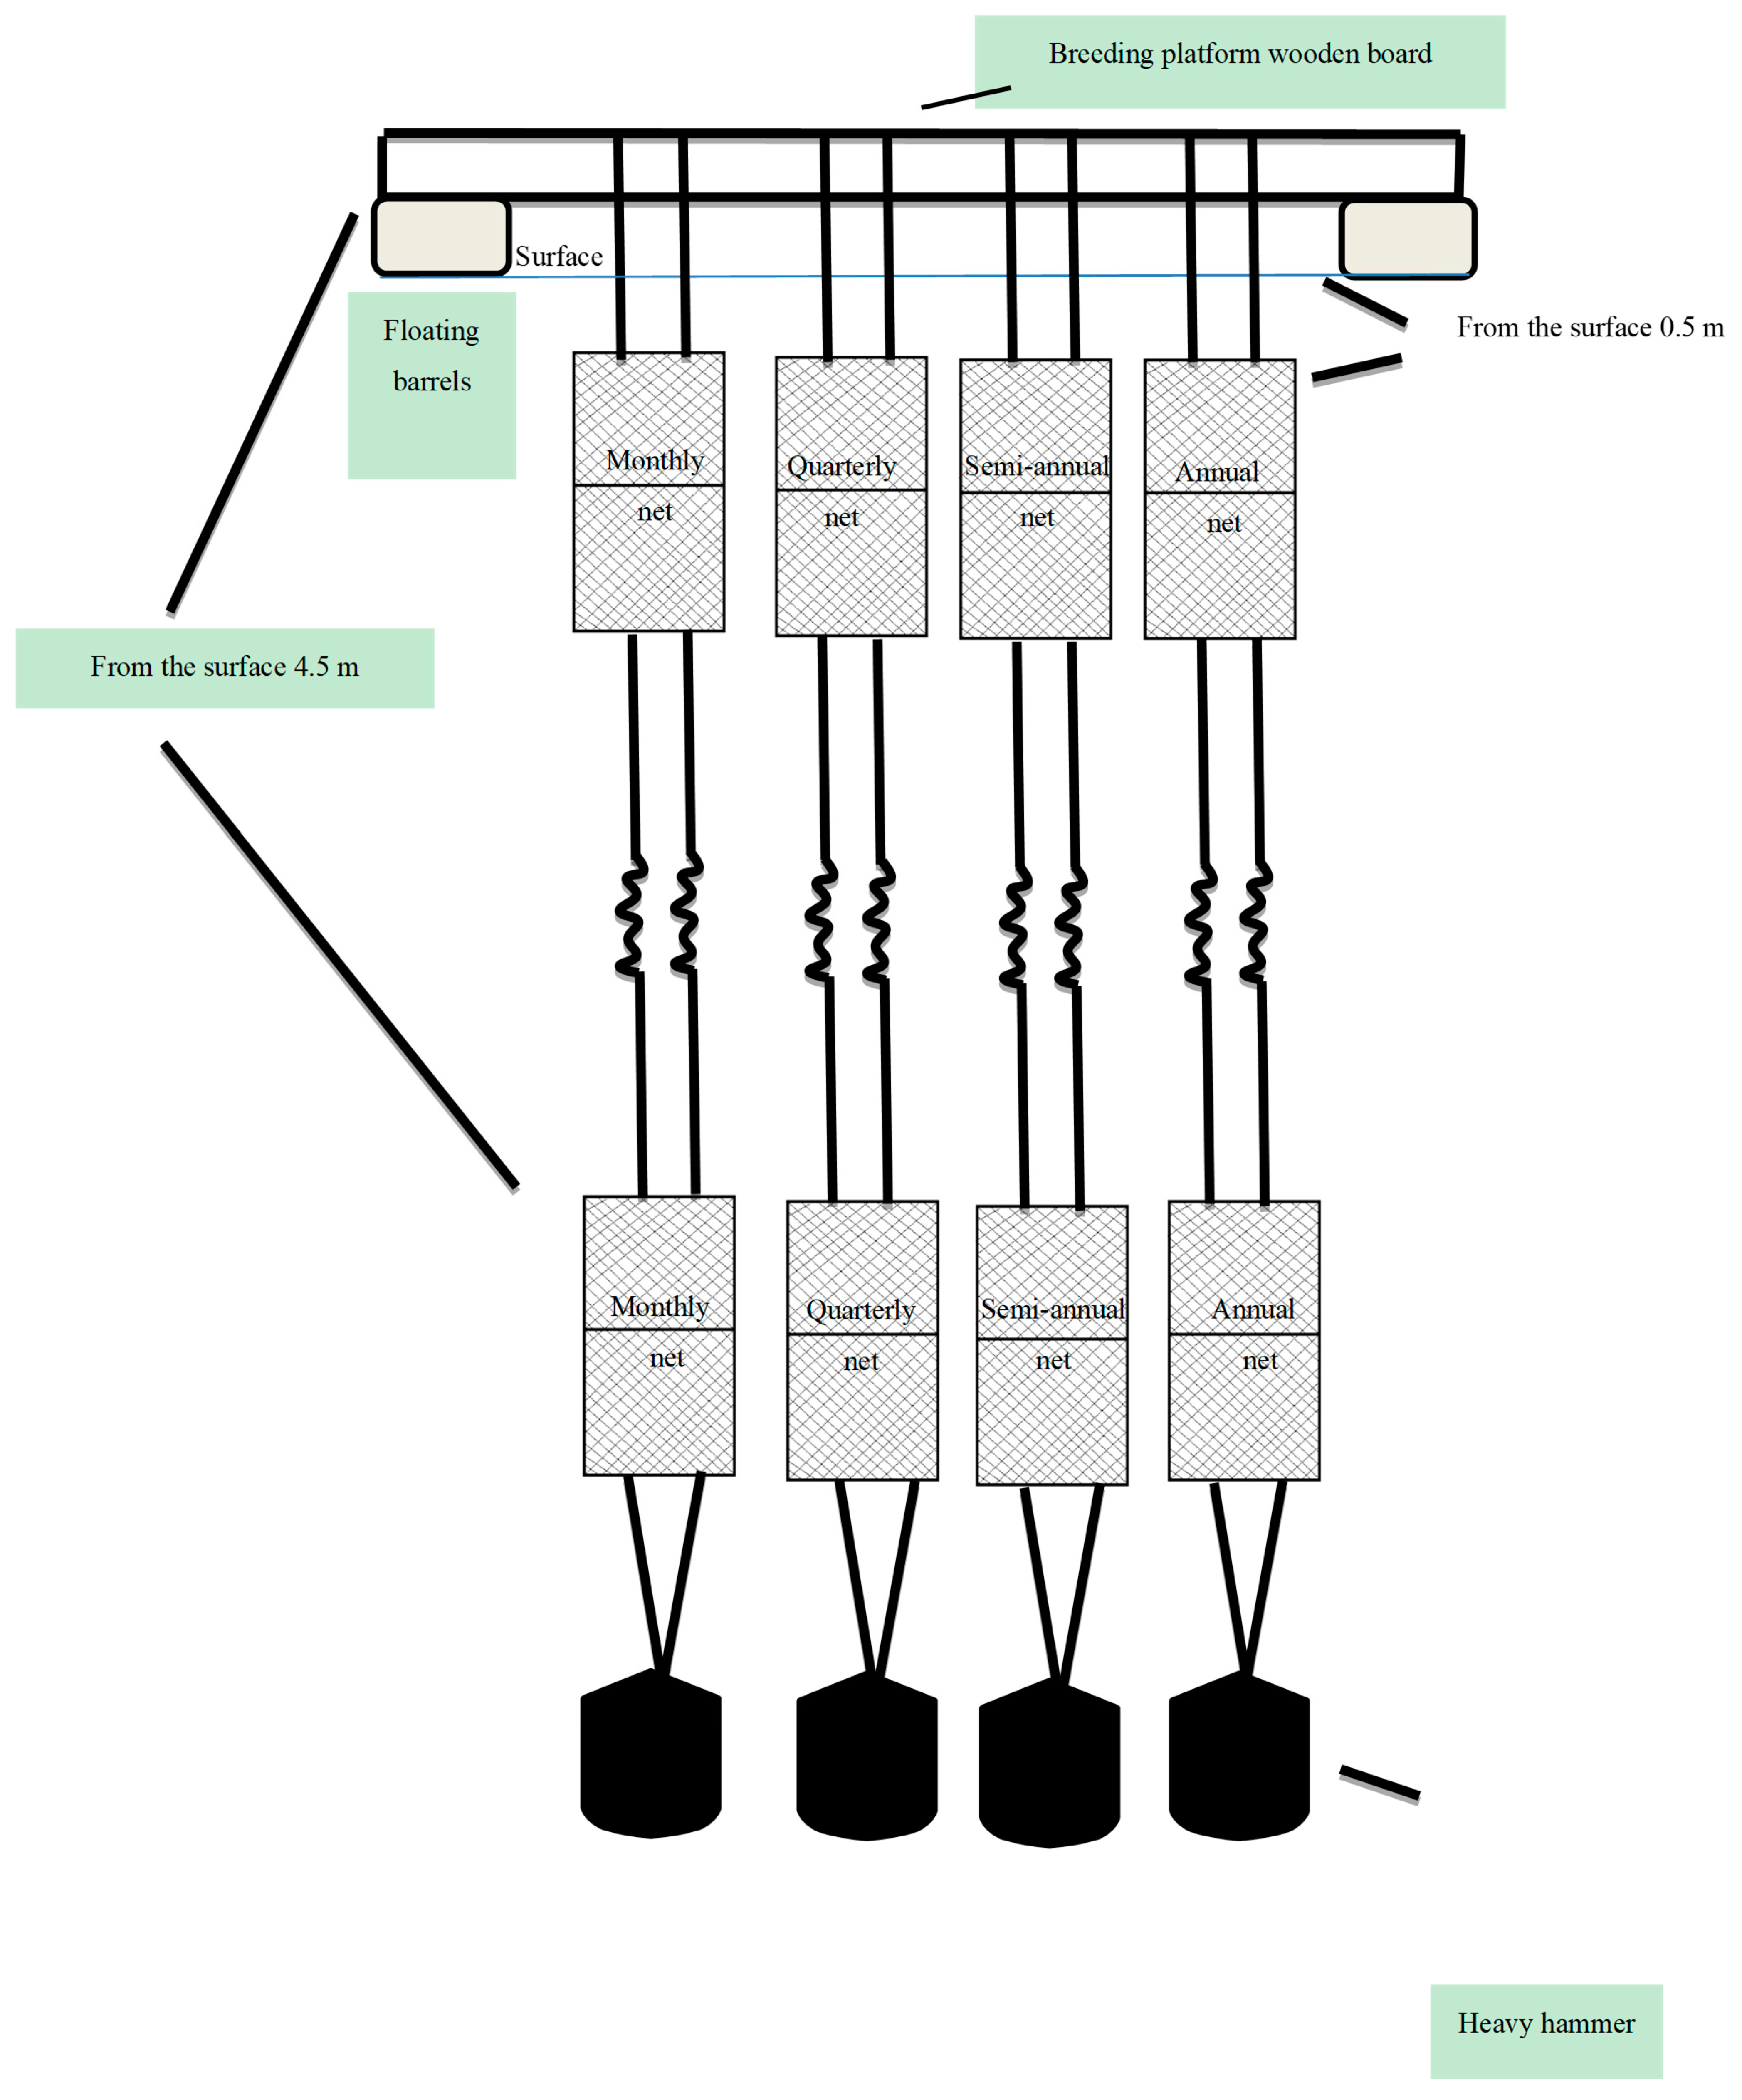
2.2. Sampling Methodology

The tested nets were made of polyethylene (PE) and were 25 cm (length) × 25 cm (width) each. Each net sample was placed and retrieved at regular cycles. The intervals between the placement and the retrieval of the monthly, quarterly, semiannual, and annual nets were one month, one quarter, half of a year, and one year, respectively. Each group of test nets was set up in the top and bottom layers with four parallel groups, and there were 76 net samples in total. The top test nets were placed 0.5 m below the water surface, and the bottom test nets were approximately 4.5 m below the water surface. The top of the net was fixed on the floating row of the breeding platform, and the bottom was tied with a heavy hammer to keep the net body perpendicular to the sea floor (as shown in Figure 2). The recovered test nets and samples were preserved in absolute ethyl alcohol. All individuals were identified to the species level or the lowest taxonomic level possible. Taxon names were cross-checked against the Zoogeography of China and the World Register of Marine Species (https://www.marinespecies.org/ (accessed on 5 October 2023)). All large individual organisms, such as mollusks, were analyzed, and small individual organisms, such as amphipods, were examined via microscopy using 1/10 of each sample. These were classified and counted under an optical microscope, and the water on the body surface of the organisms was absorbed using absorbent paper and weighed on an electronic balance. Biomass was recorded as the wet weight, and the number was recorded as density data. Biomass and density were adjusted to m−2 of the net’s surface area.

2.3. Environmental Variables

Net gathering and releasing were scheduled at the beginning of each month, and environmental factor measurements were carried out simultaneously. The time of each survey was between 13:00 and 17:00. The dissolved oxygen (DO), pH, salinity, and water temperature were measured using a YSI water quality detector. The suspended matter density was measured from a 100 mL seawater sample taken from the above site, and the measurement was completed within 24 h according to the GB 17378.4-2007 Specification for Marine Monitoring.

2.4. Data Analysis

The dominant species of the marine fouling community were analyzed using the index of relative importance (IRI) [28] as follows:
I R I = (   W + N   )   × 10 4
where W is the percentage of the biomass of a particular species within the total biomass, N is the percentage of the abundance of a particular species within the total abundance, and F is the frequency of a particular species.
One-way ANOVA was conducted with SPSS 19.0 to examine the difference in parameters (such as species number, density, biomass, etc.) with respect to the marine fouling community. Diagrams were produced using ArcMap 10.7. Analyses of community diversity and Bray–Curtis similarity were performed using Primer 8.0. CANOCO 4.5 software [29], which was further used to conduct detrended correspondence analysis (DCA) on fouling organisms and environmental water factors. When the maximum value of the ordination was greater than 4.0, canonical correspondence analysis (CCA) was selected for ordination analysis and plotting. If it was between 3.0 and 4.0, either CCA or redundancy analysis (RDA) was chosen. If it was less than 3.0, the results of the RDA were regarded as superior to those of CCA. The Spearman method was utilized to test the correlation between fouling organisms and environmental factors [30].

3. Results

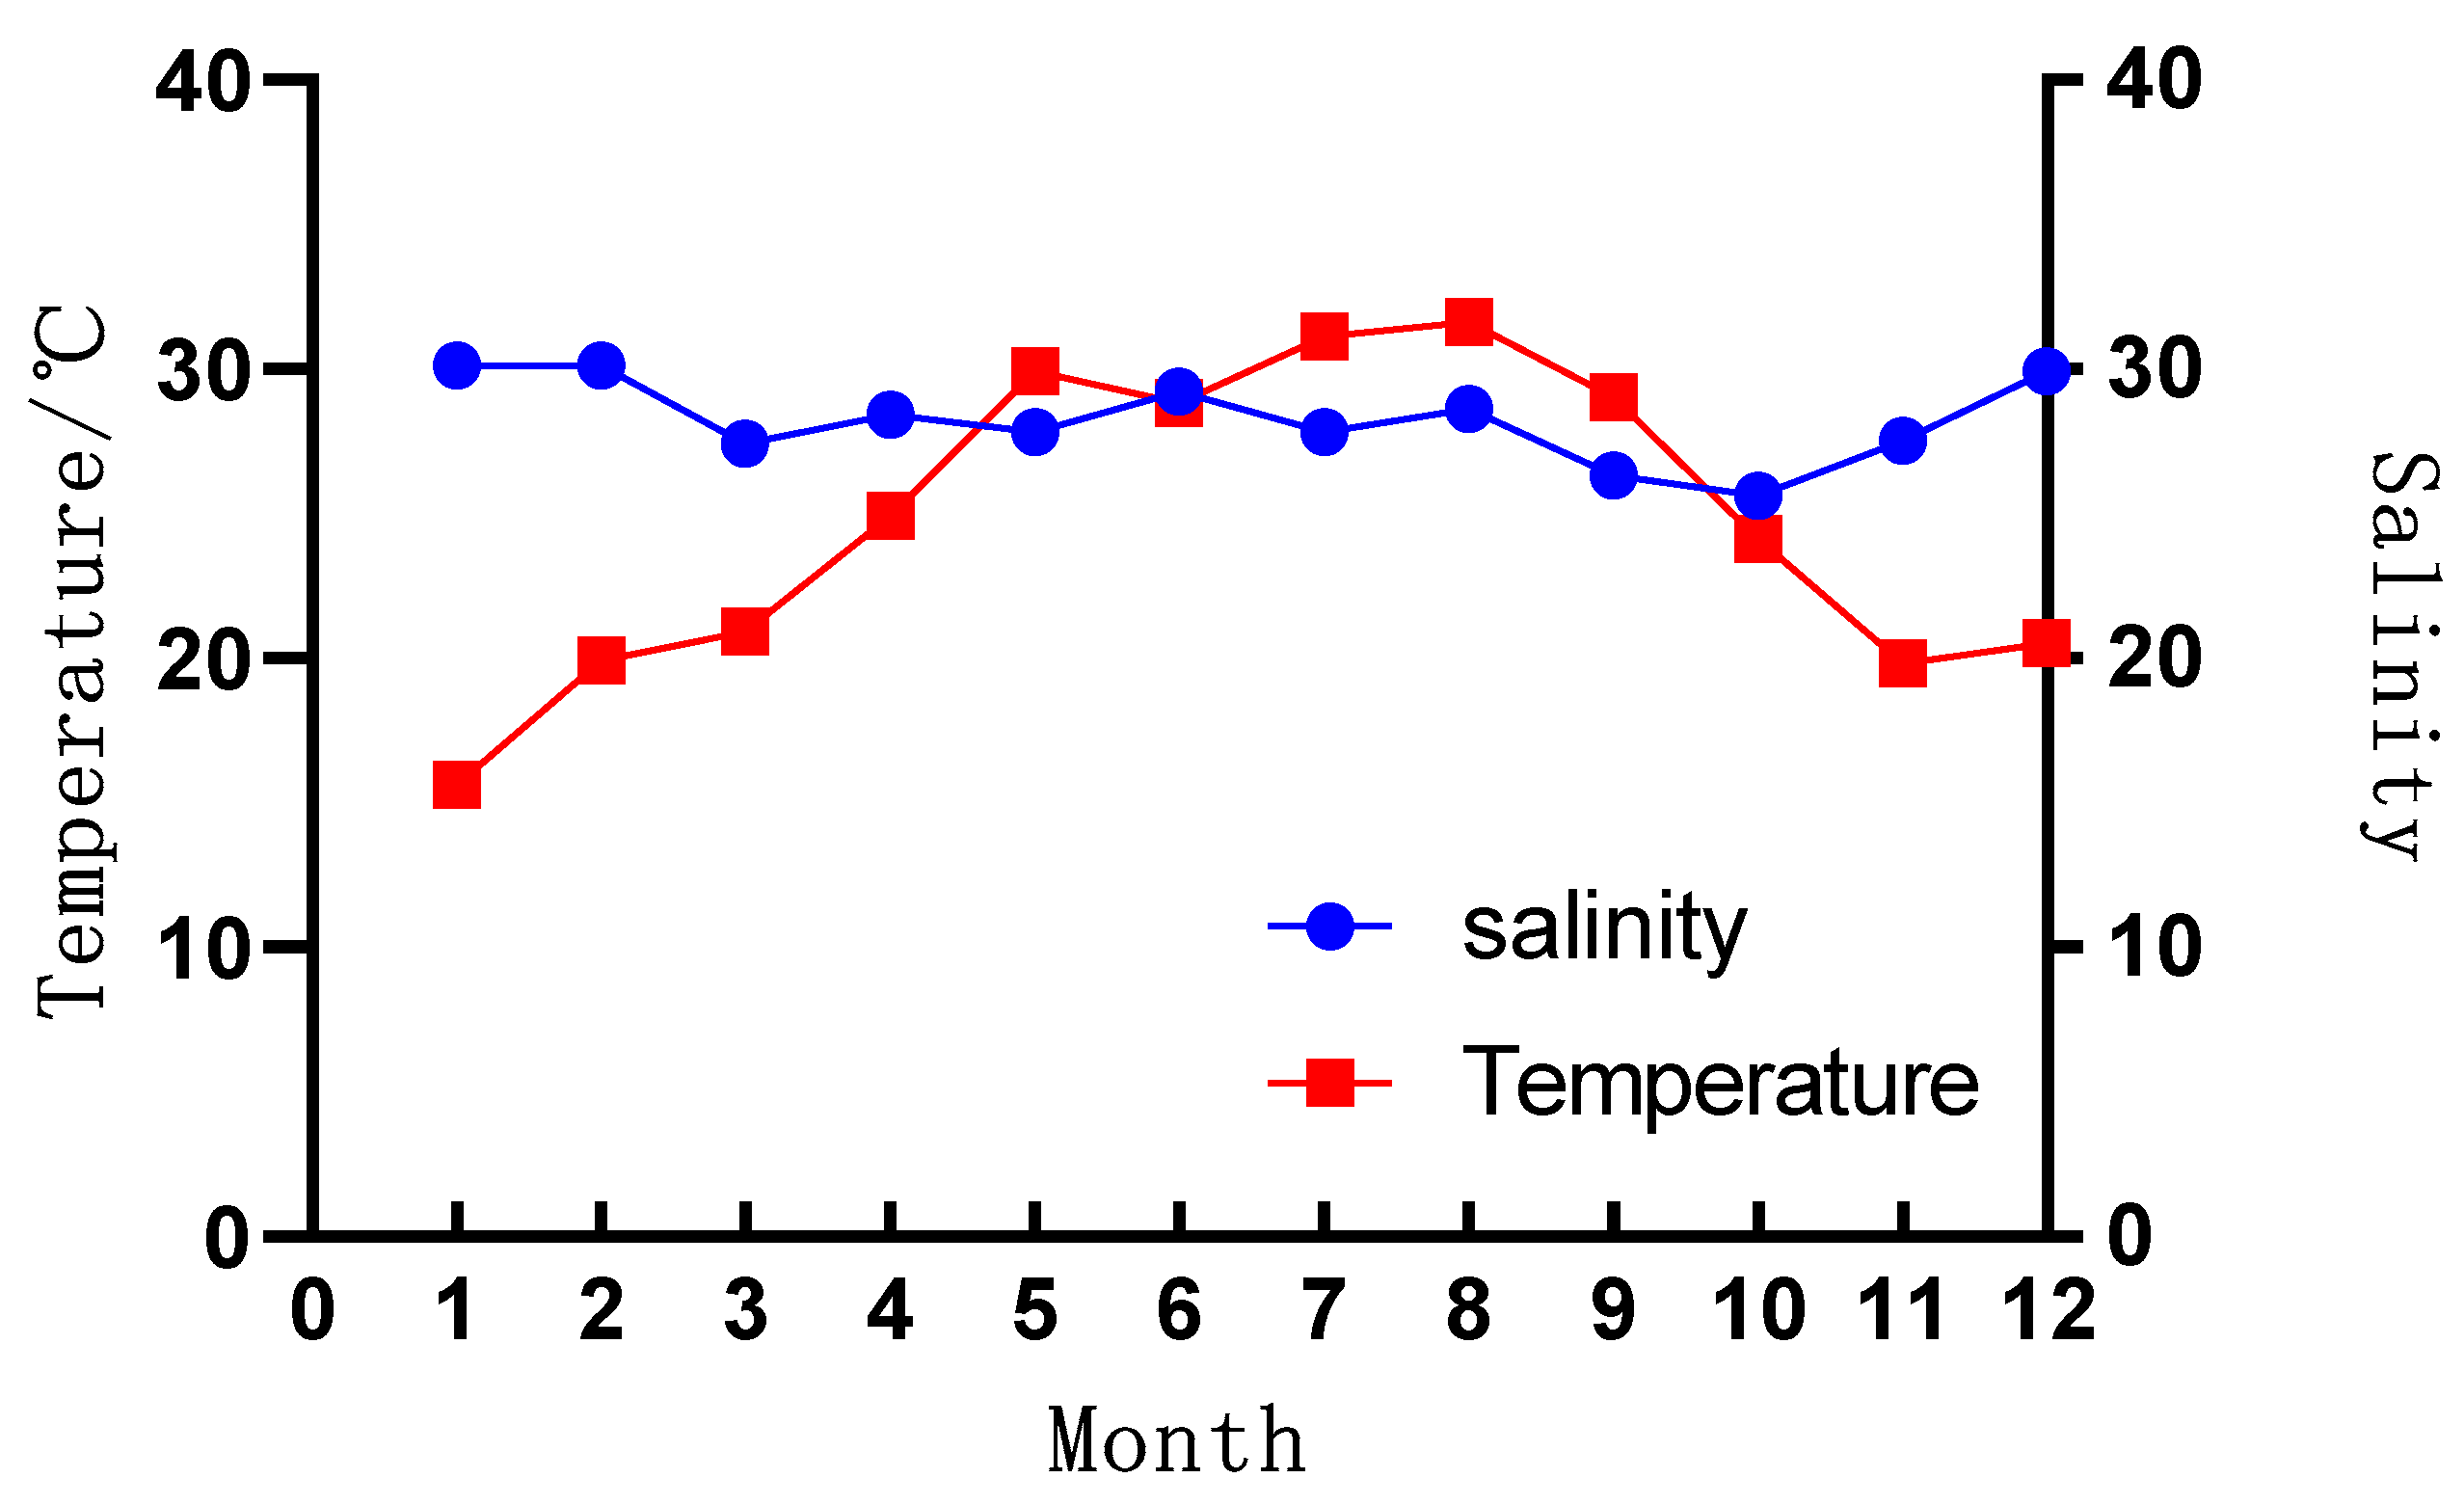
3.1. Environmental Characteristics

The temperature at the sampling station ranged from 15.57 to 31.70 °C, and salinity ranged from 26.30 to 30.08 (Figure 3). Water sediment contents ranged from 0.8 mg/L to 7.8 mg/L (Table 1).

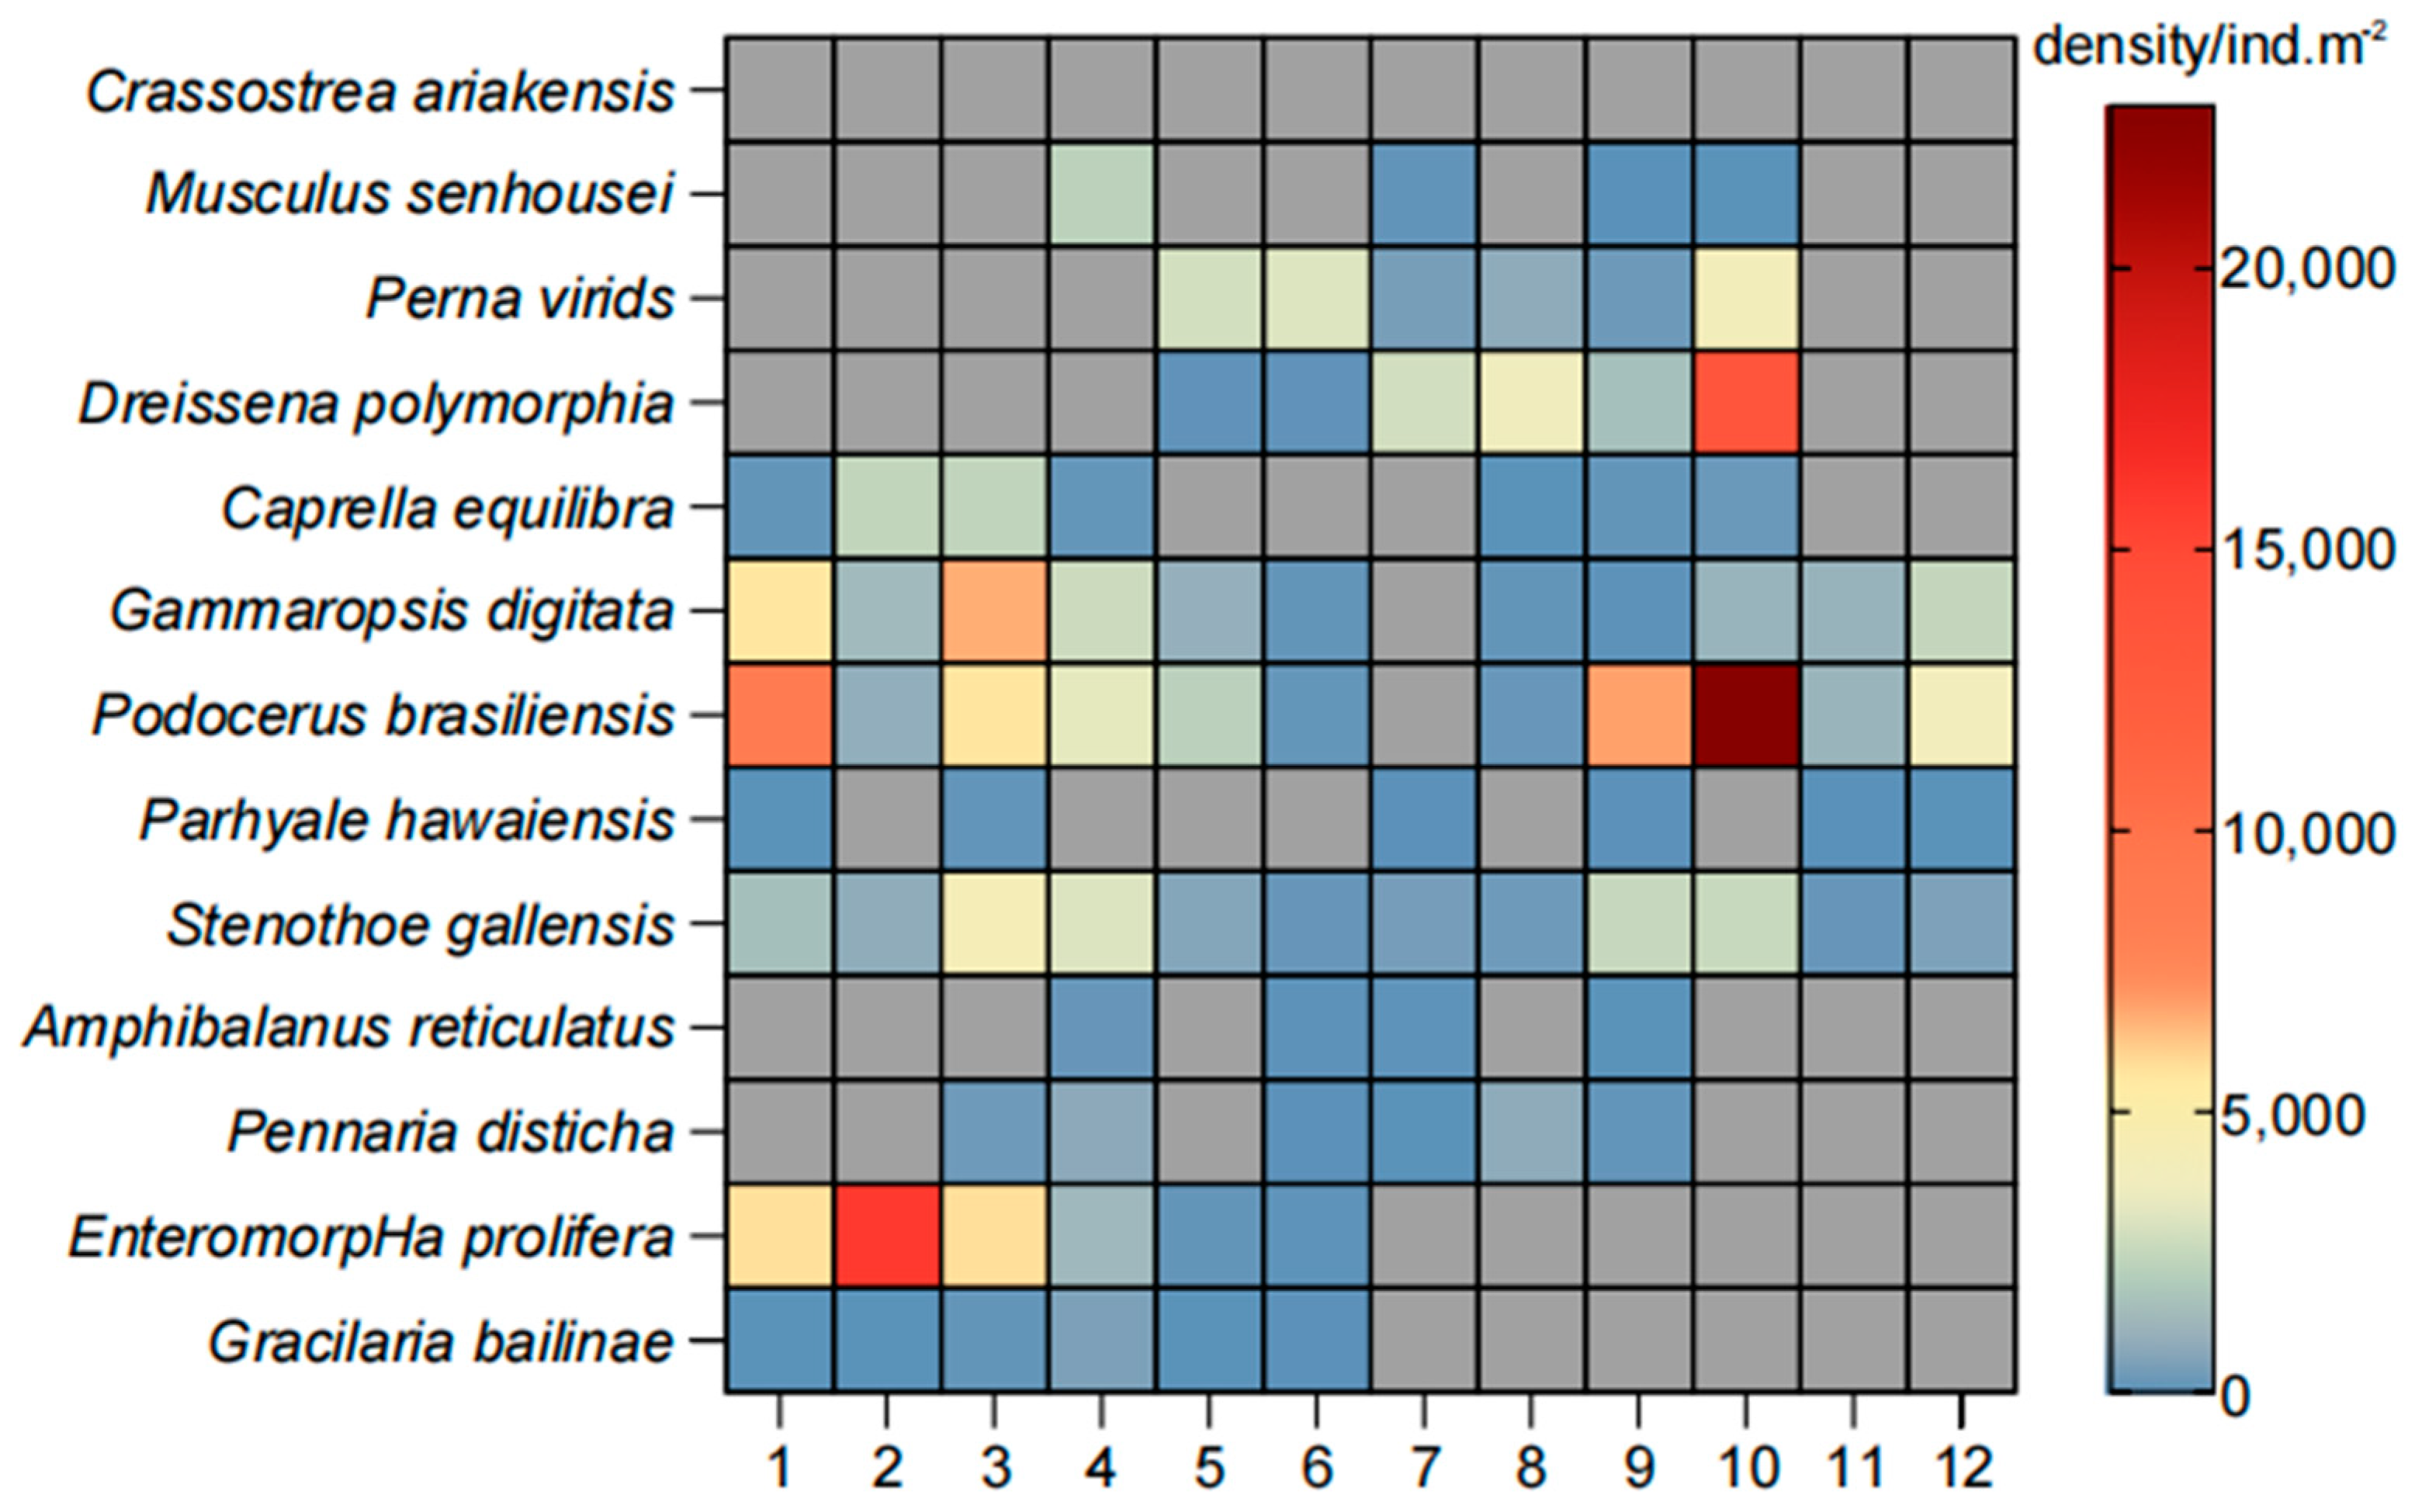
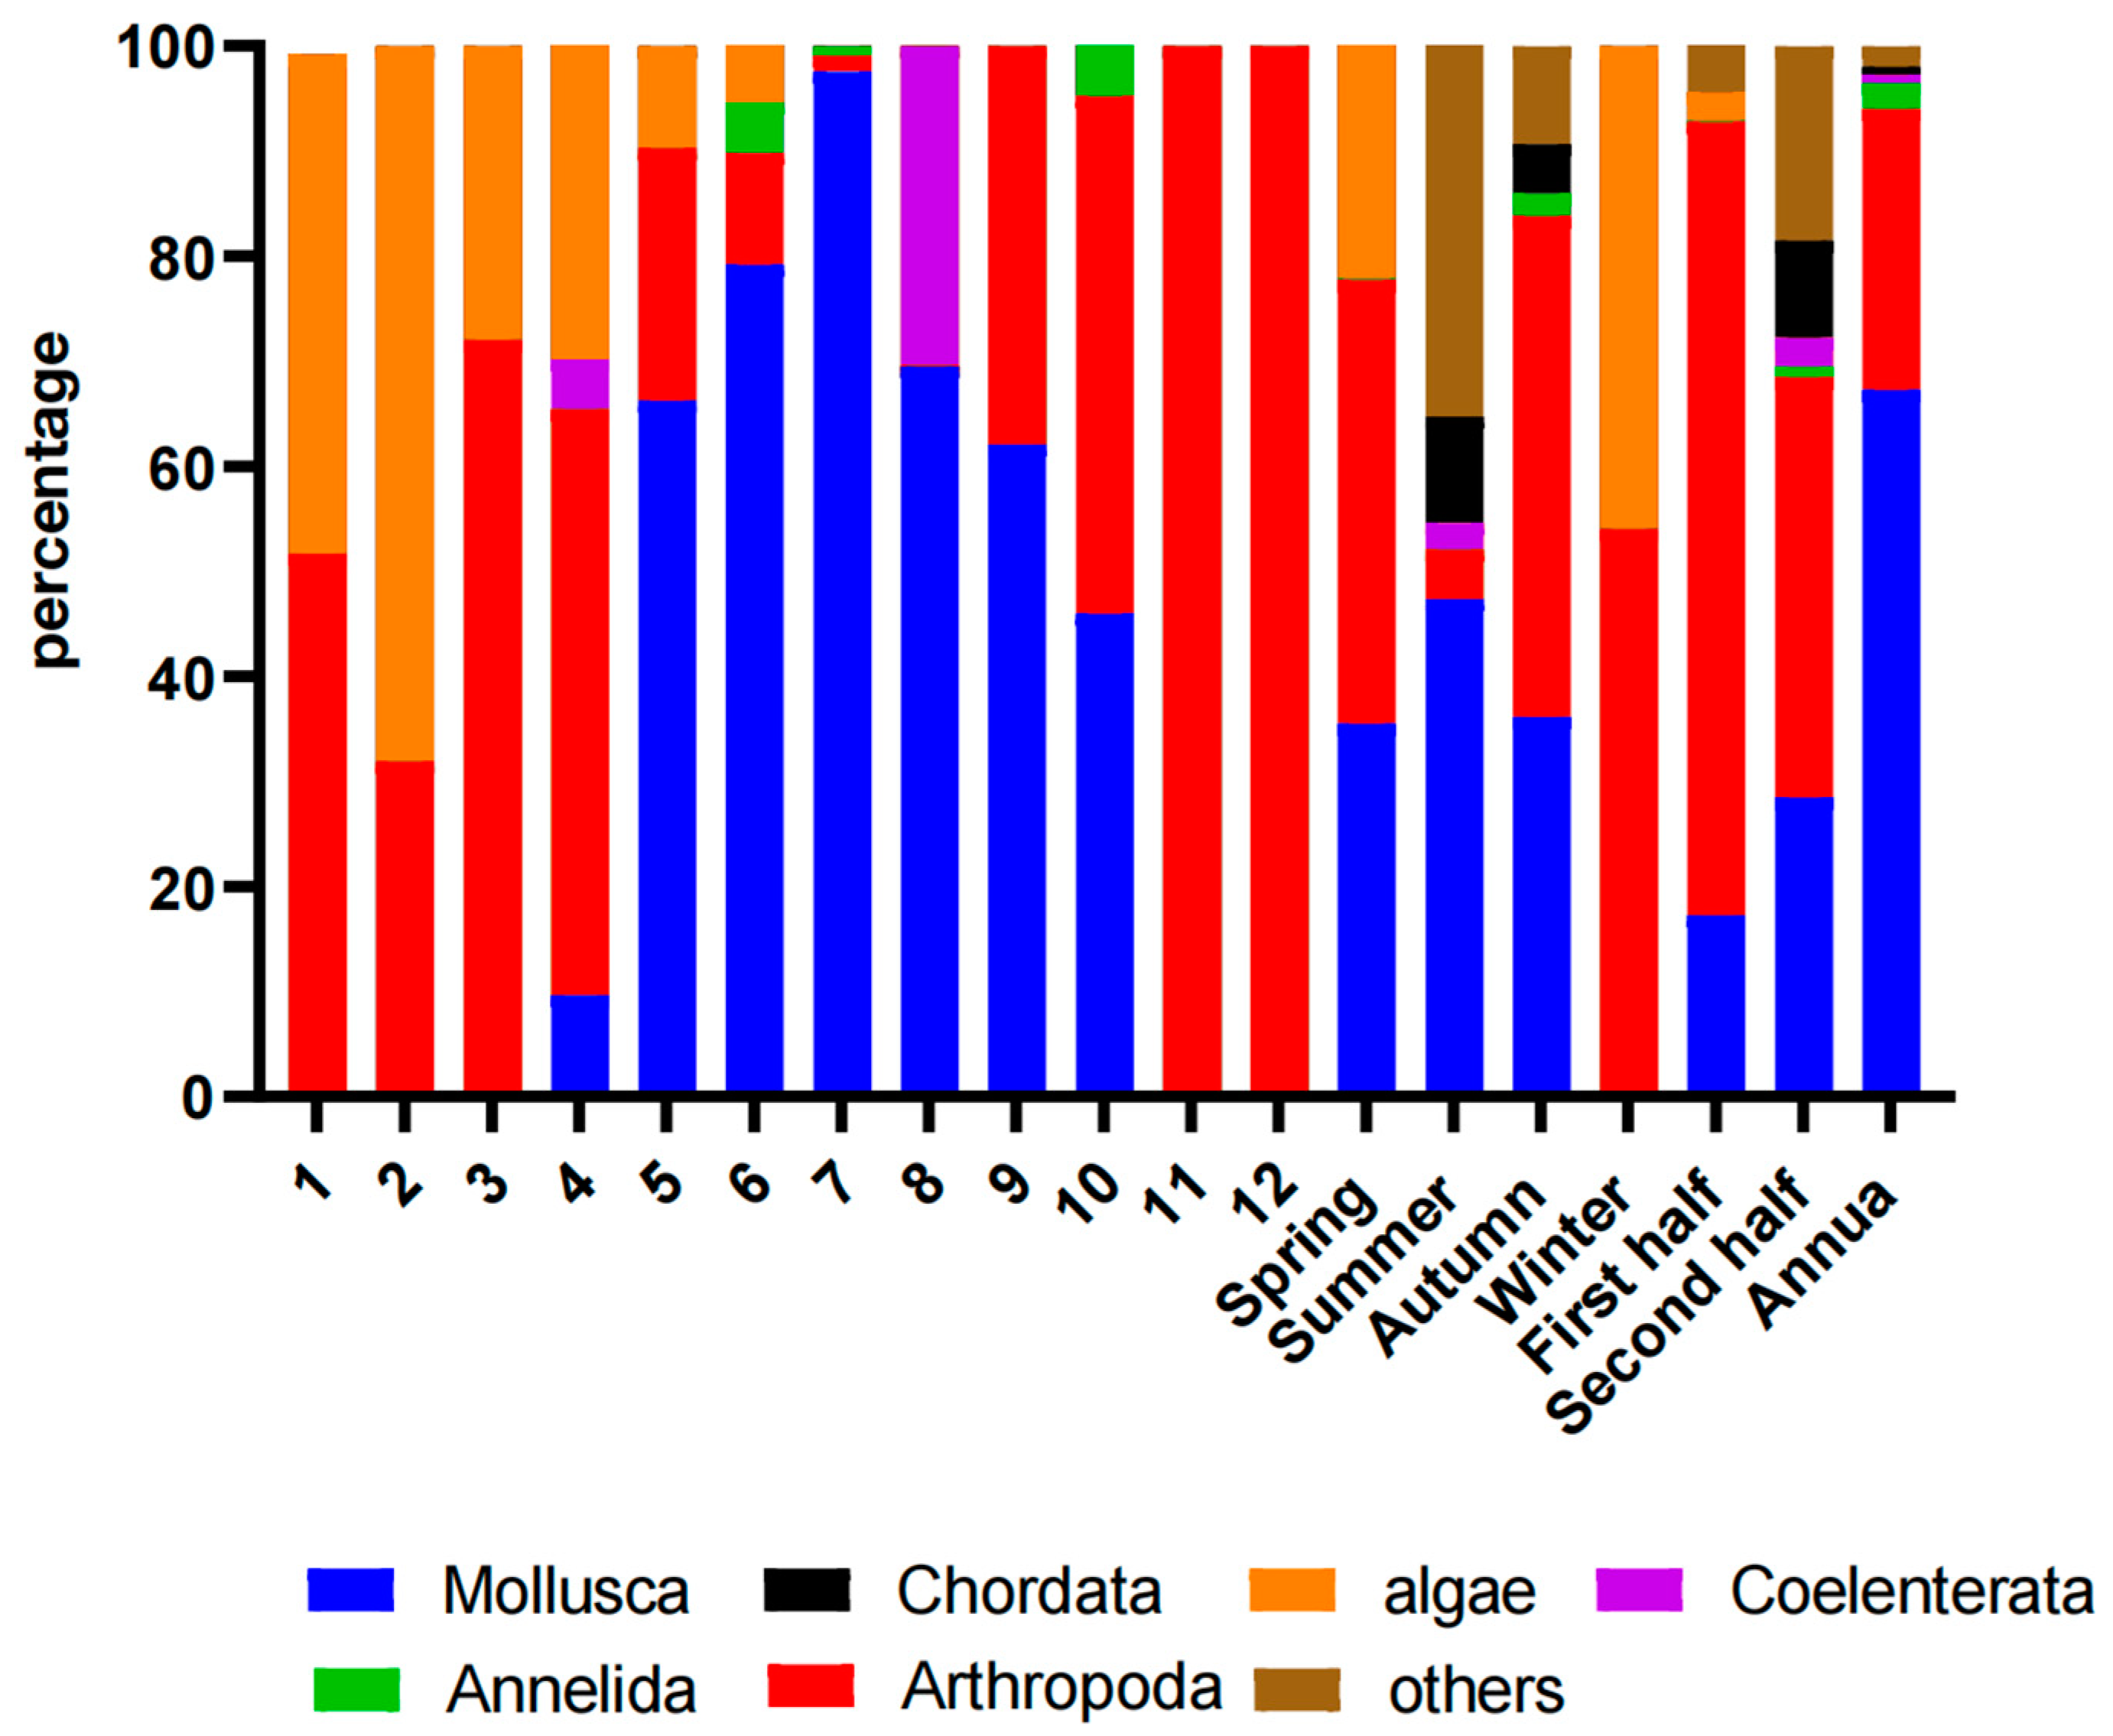
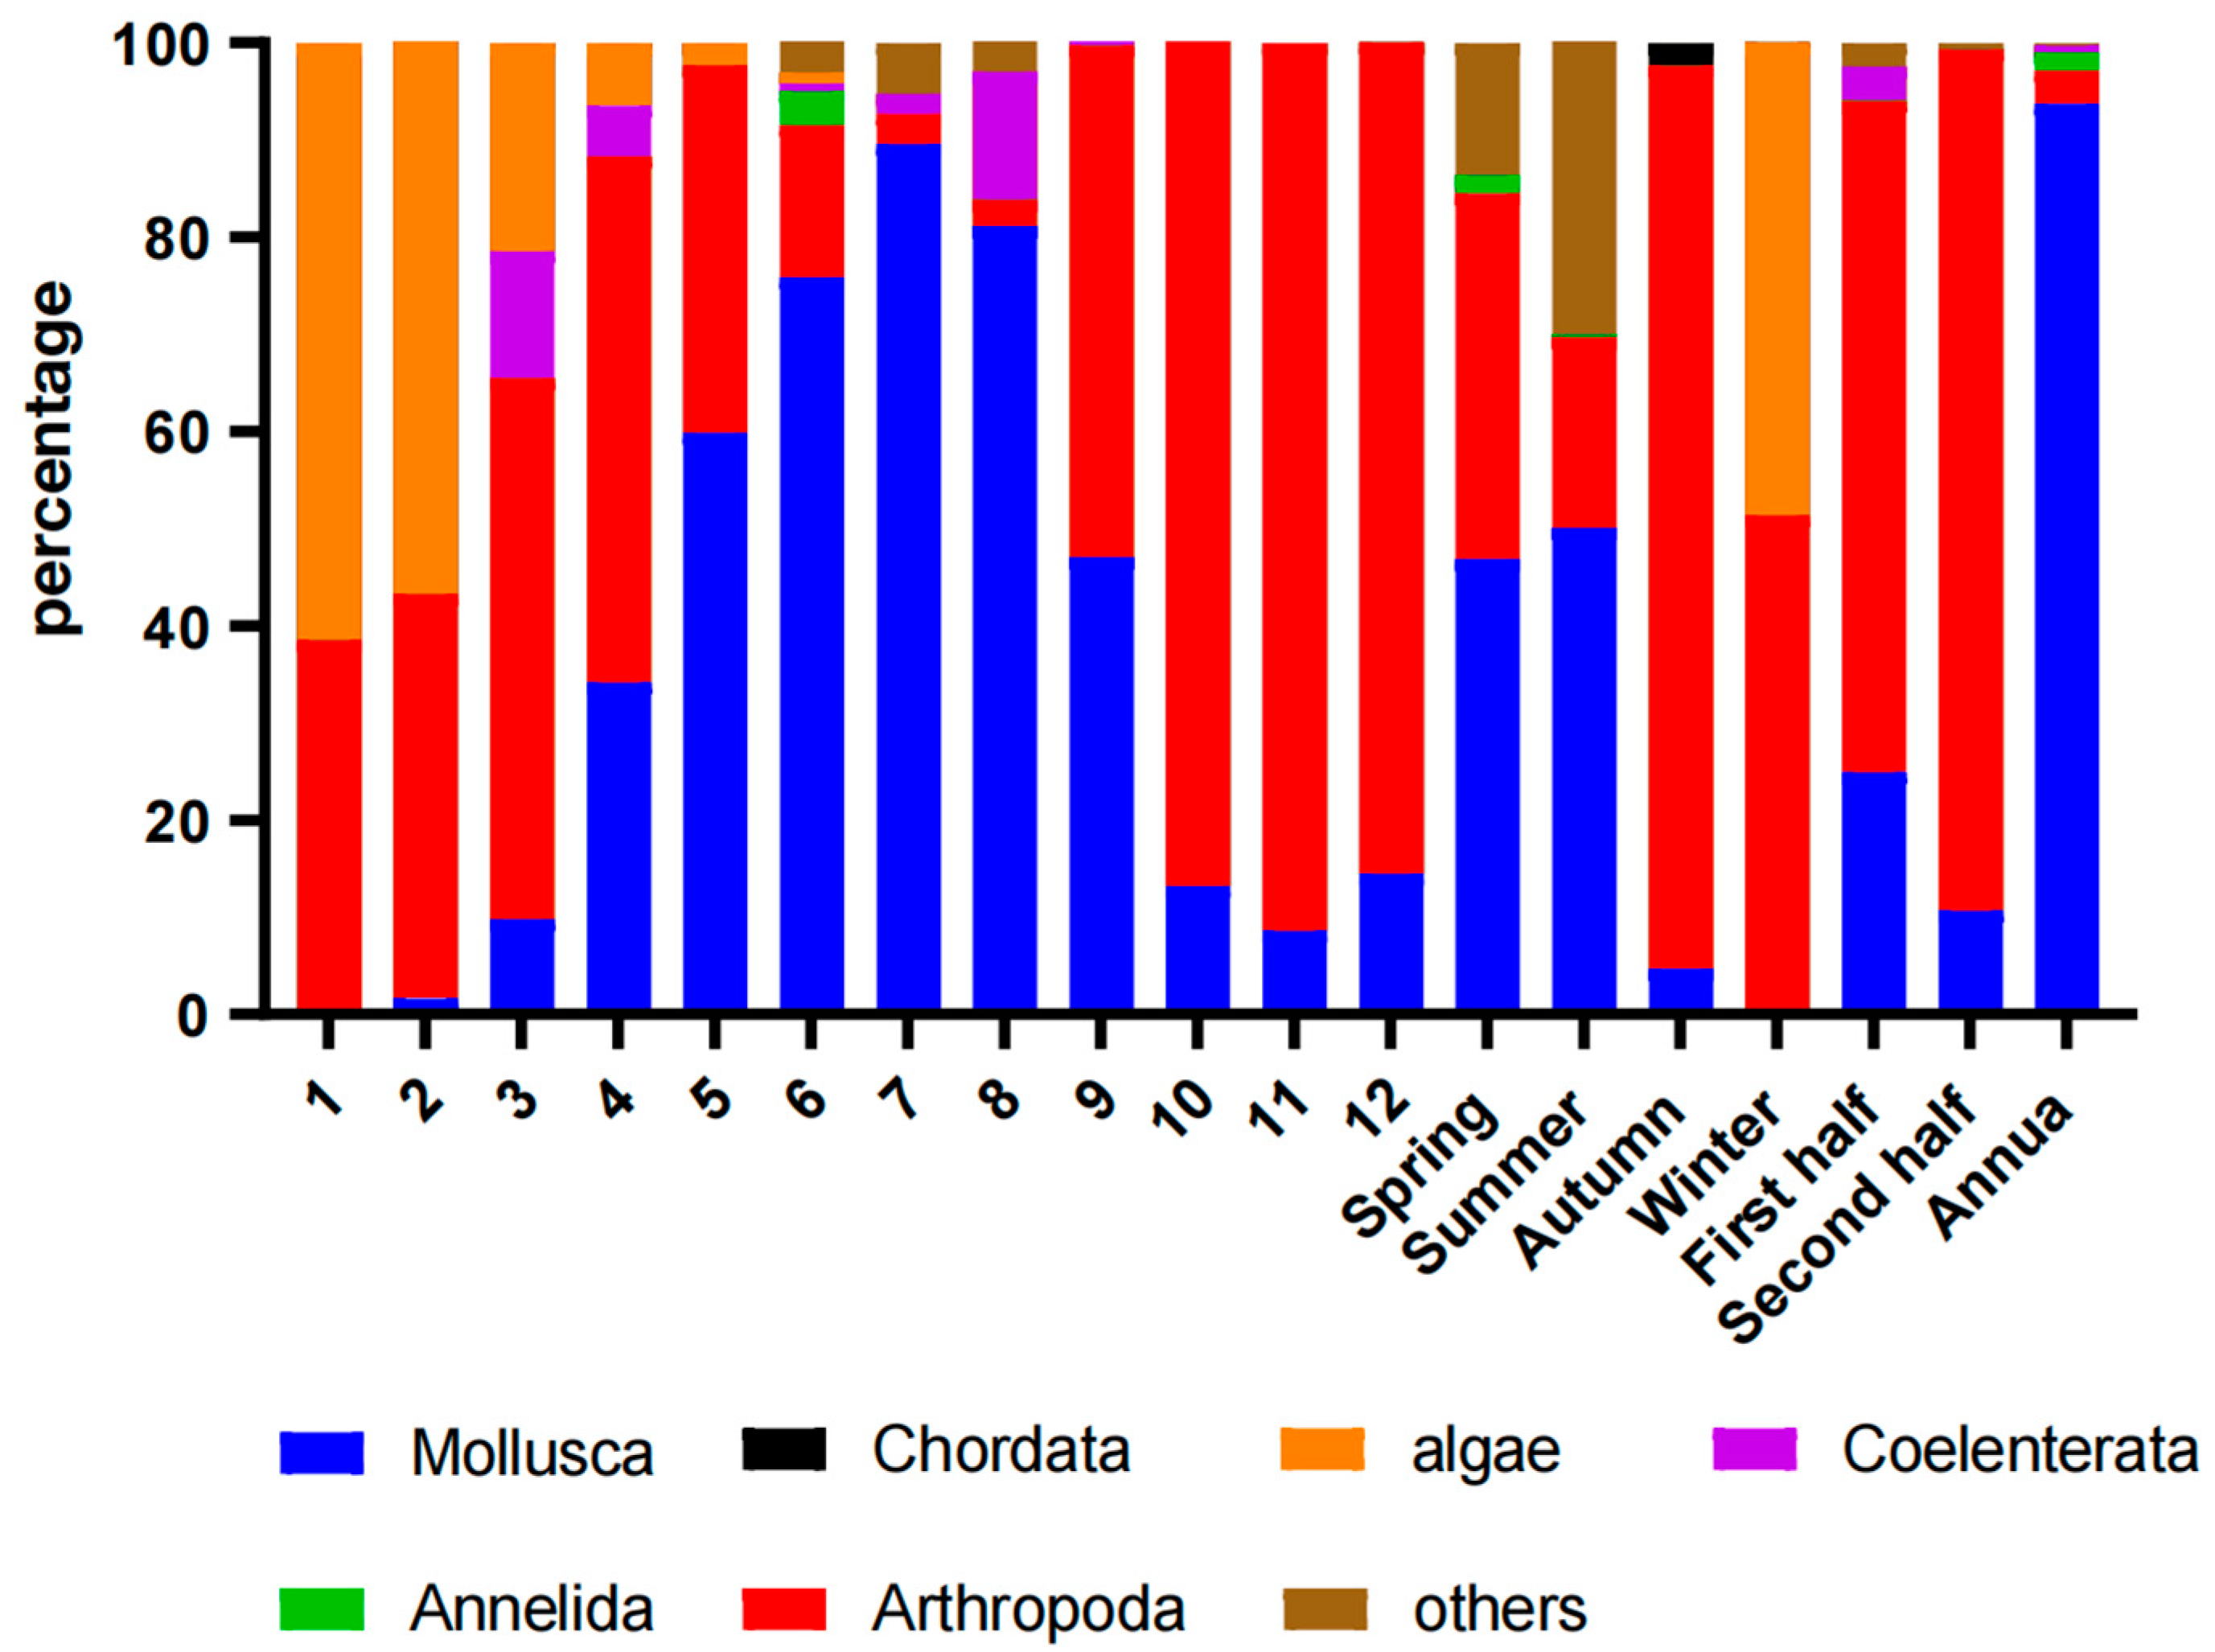
3.2. Species Composition

A total of 44 species (the list was shown in File S1) of fouling organismswere recognized from the 76 test nets over the year, which belong to 43 genera and 1 unknown genus, 37 families, and 10 phyla. There were 15 species of mollusca, 13 species of arthropoda, 7 species of annelida, 3 species of coelenterata, 4 species of chlorophyta, 2 species of rhodophyta, and 6 species of other animal groups. Perna viridis (Mollusca) (IRI = 2592) held a dominant position in the marine fouling community in the PE net, followed by Podocerus brasiliensis (Arthropoda) (IRI = 2580). Other dominant species (IRI > 25) include Crassostrea ariakensis, Musculus senhousei, and Dreissena polymorphia (Mollusca); Caprella equilibra, Gammaropsis digitata, Stenothoe gallensis, Parhyale hawaiensis, and Amphibalanus reticulatus (Arthropoda); EnteromorpHa prolifera (Chlorphyta); Gracilaria bailinae (Rhodophyta); and Pennaria disticha (Coelenterata) (Figure 4 and Table 2). There is no significant difference between the upper and lower nets in the species (Figure 5 and Figure 6).

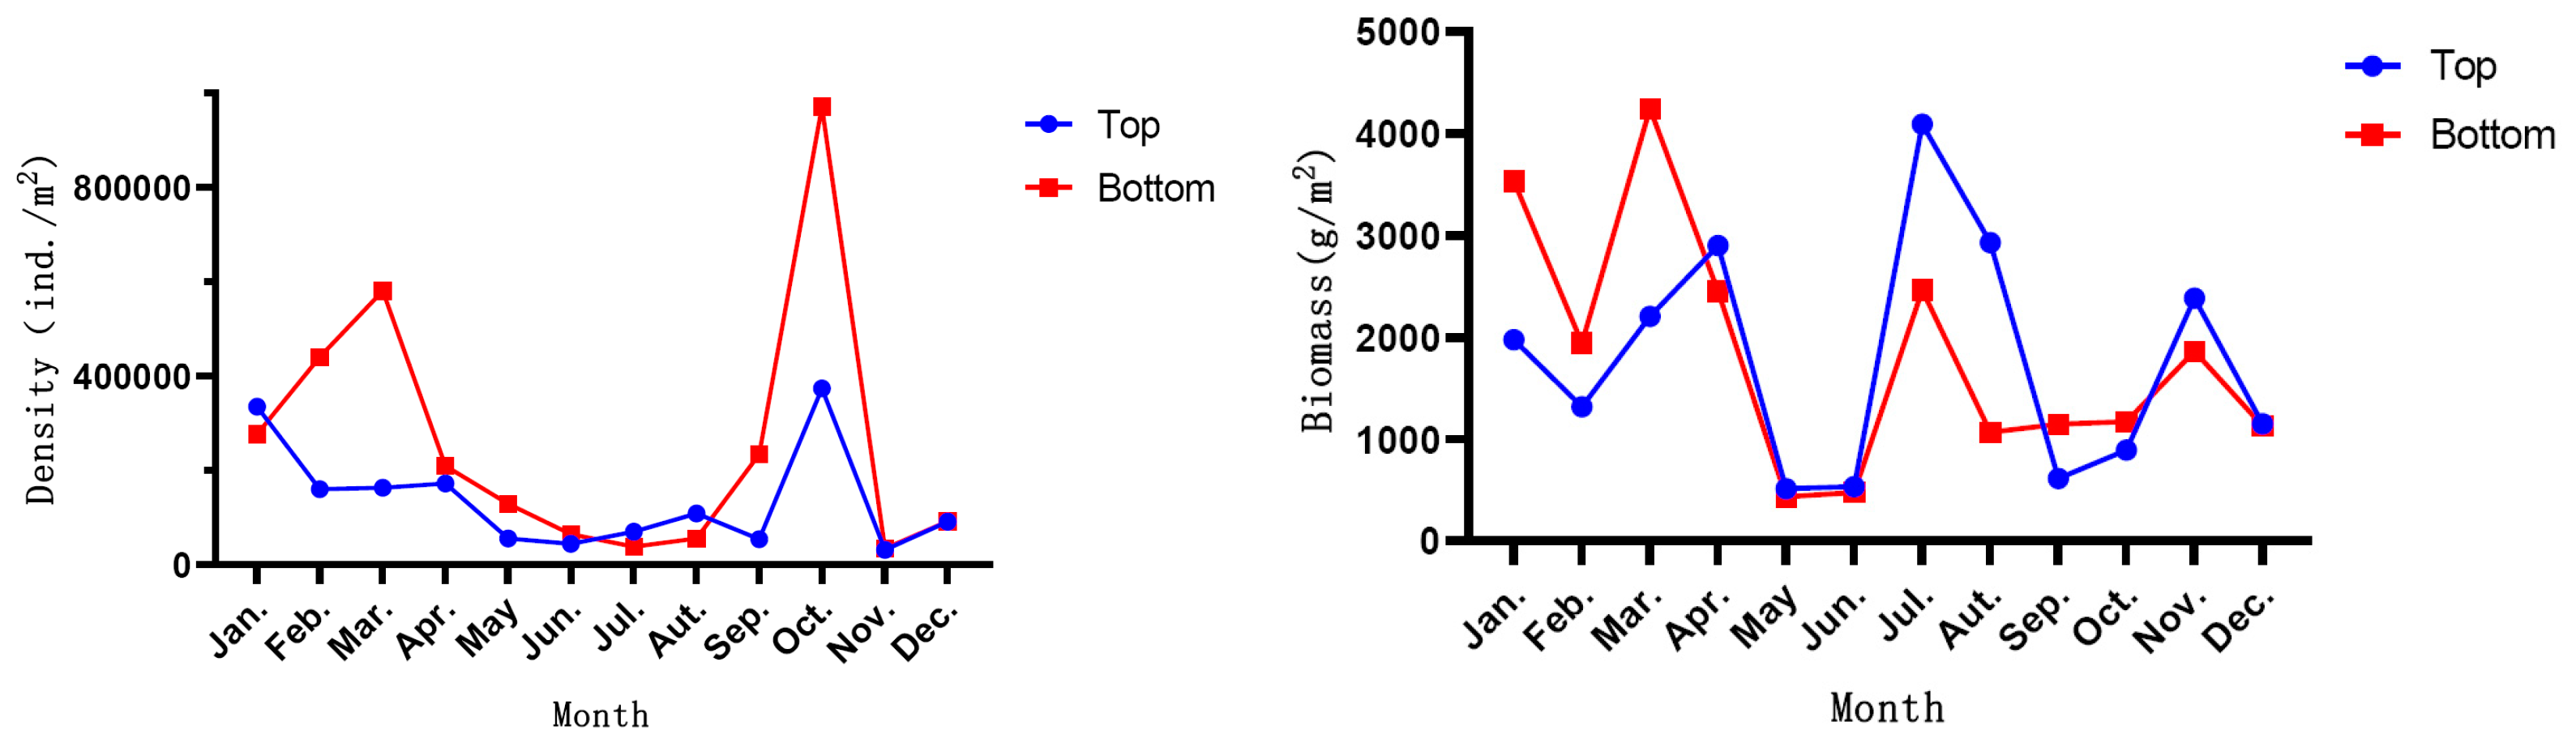
3.3. Settlement Rate and Its Spatiotemporal Variation

There are biological fouling attachments in every month of the year. In terms of density, the peak of attachment is in March and October (F = 142.6, p < 0.0001), while in terms of biomass (F = 54.42, p < 0.0001), the peak of attachment is in March and July, as shown in Figure 4. The adhesion strength of the fouling organism relative to the seasonal nets in terms of biomass is presented in the following order: summer > spring > fall > winter. Moreover, there were significant differences between the seasons (F = 62.73, p < 0.0001), while there was no significant difference in the number of attached organisms between the first and second halves of the year. In addition, the distribution of the density and biomass of the fouling organisms showed no significant difference between the top and bottom nets as well (Figure 7).
Perna viridis was the most dominant and representative species in the marine fouling community (Table 2). The settlement of P. virids occurred from May to October, and the prosperous settlement stage lasted from May to June. The density of P. virids was between 3510 and 7260 ind./m2 in the prosperous stage (Figure 8). The biomass in May within the monthly net is the highest, amounting to 101.94 g/m2 and accounting for 56.14% of the total biomass. The density showed highly significant differences between the months (F = 62.73, p < 0.0001) but not between the top and bottom layers.

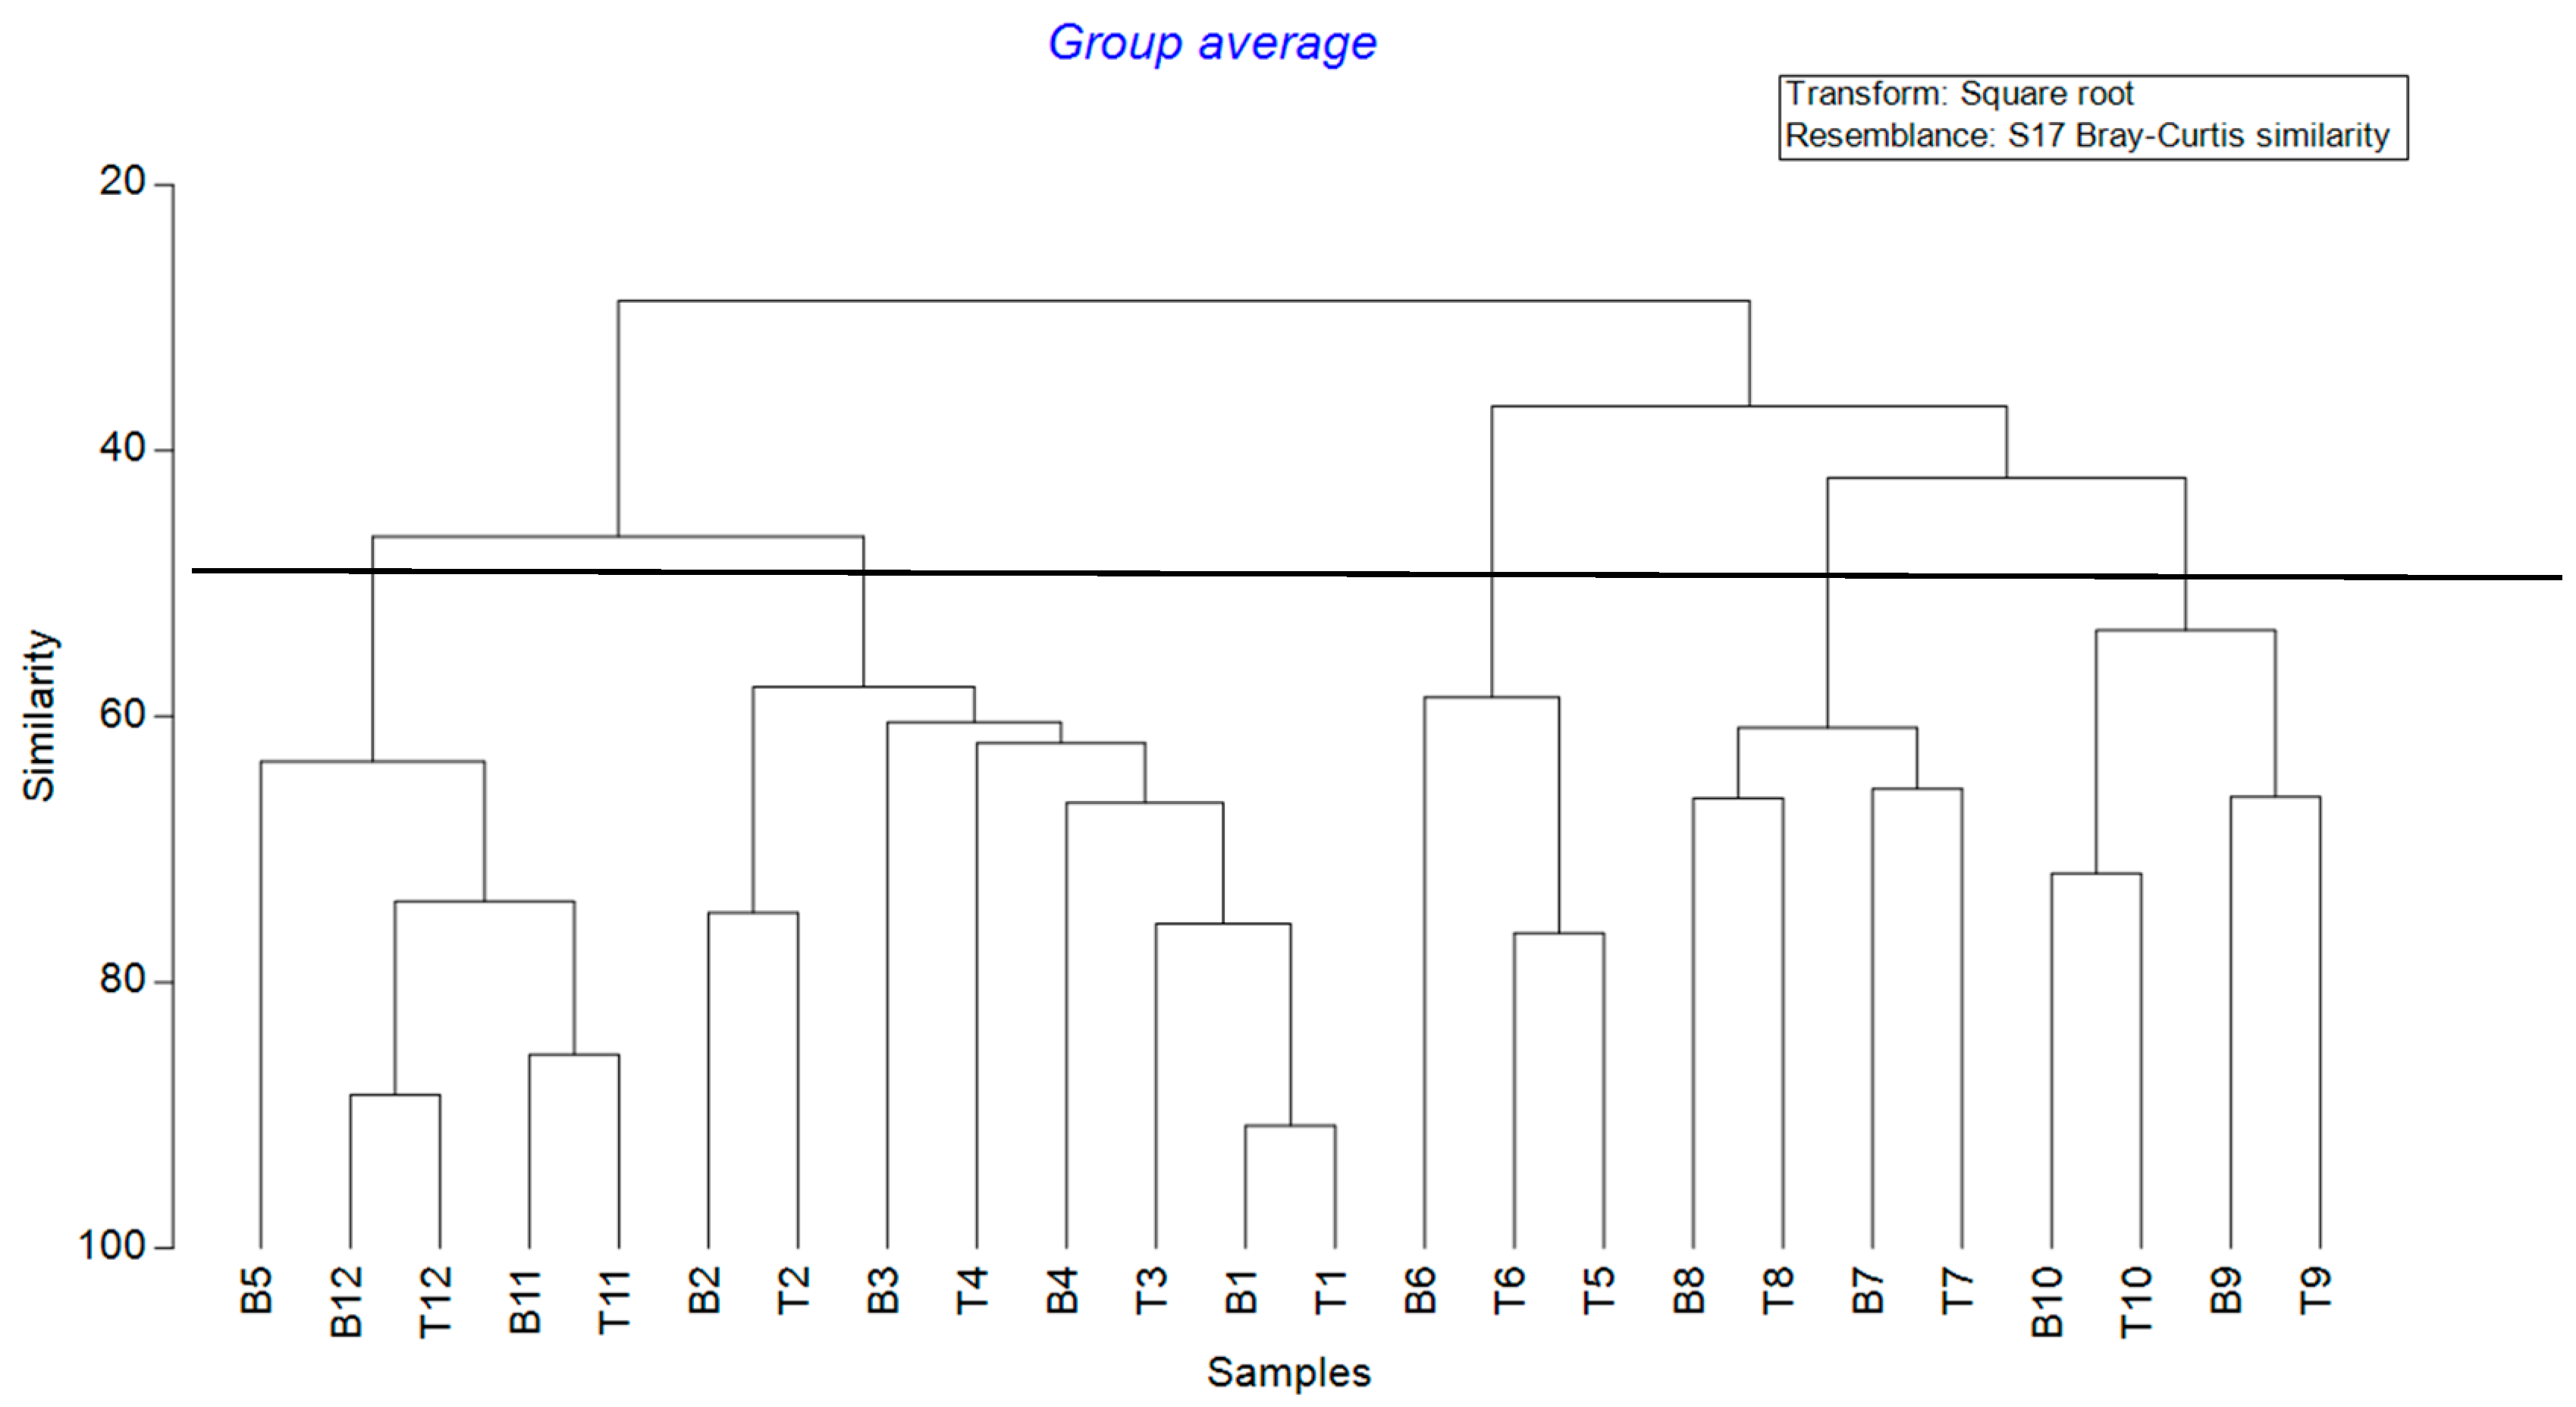
3.4. Seasonal Succession of Communities

The settlement stages of major species in the marine fouling community are shown in Figure 4. According to the clustering analysis of the Bray–Curtis similarity, we classified the fouling organism into five stages (Figure 9):
Stage I: From November to December, the community composition was relatively simple and primarily dominated by Amphipoda. The representative species were Gammaropsis digitata, Podocerus brasiliensis, Parhyale hawaiensis, and Stenothoe gallensis.
Stage II: From January to April, the community was characterized by considerable species diversity and a high settlement rate, with algae as the dominant species. The main populations included Caprella equilibra, Enteromorpha prolifera, Gracilaria bailinae, Pennaria disticha, Amphibalanus reticulatus, and Musculus senhousei. The representative species were Enteromorp Haprolifera and Gracilaria bailinae, and Enteromorp Haprolifera was mainly distributed on the top test nets.
Stage III: From May to June, the attachment density and biomass were low, and the community composition was simple. Moreover, the distribution showed no significant difference between the top and bottom test nets. Perna viridis held an absolute dominant position in this stage.
Stage IV: From July to August, the community was suited for the hot season, with a significant increase in community biomass. Biomass was significantly higher for Crassostrea ariakensis, Perna viridis, Dreissena polymorphia, and Pennaria disticha, with Dreissena polymorphia exhibiting an absolute advantage with respect to biomass.
Stage V: From September to October, community diversity was high while attachment density and biomass were also relatively low. Perna viridis, Dreissena polymorphia, Caprella equilibra, Podocerus brasiliensis, Stenothoe gallensis, and Corophium mortonii were all found in the nets during this period, and Dreissena polymorphia still occupied an absolute advantage in biomass in these communities.
In terms of attachment time, fouling organisms reproduced and attached throughout the year in the surveyed area, with different species and quantities appearing in different seasons. The main fouling season for fouling organisms is spring and summer, with February to September being the primary attachment months and July being the peak period. Specifically, for each species, mollusks such as oysters and mussels attached to the nets during the hotter months of the summer and autumn, with a peak in July and August. Arthropoda can reproduce and attach throughout the year, with a peak in the cooler months of winter and spring. The prosperity period for Gammarellus brasilianus and Gammaridae is March and April. Barnacles appeared less frequently on the net material used in this experimental survey, with only a small number appearing in July and August. Coelenterates attach from March to September, with the main species being the penicillate hydromedusa, which thrives in August. Annelids mainly appeared in the hotter months of July and August. Algae were also mainly distributed in the cooler months of winter and spring, with a peak in January when the temperature was lower (Figure 5 and Figure 6). These data indicated that the biomass of fouling organisms in Leizhou Bay showed a preference for both time and species. Among them, the crustacean amphipods have a significant advantage in spring, molluscan mussels have a significant advantage in summer, and green algae show a significant advantage in winter and spring.

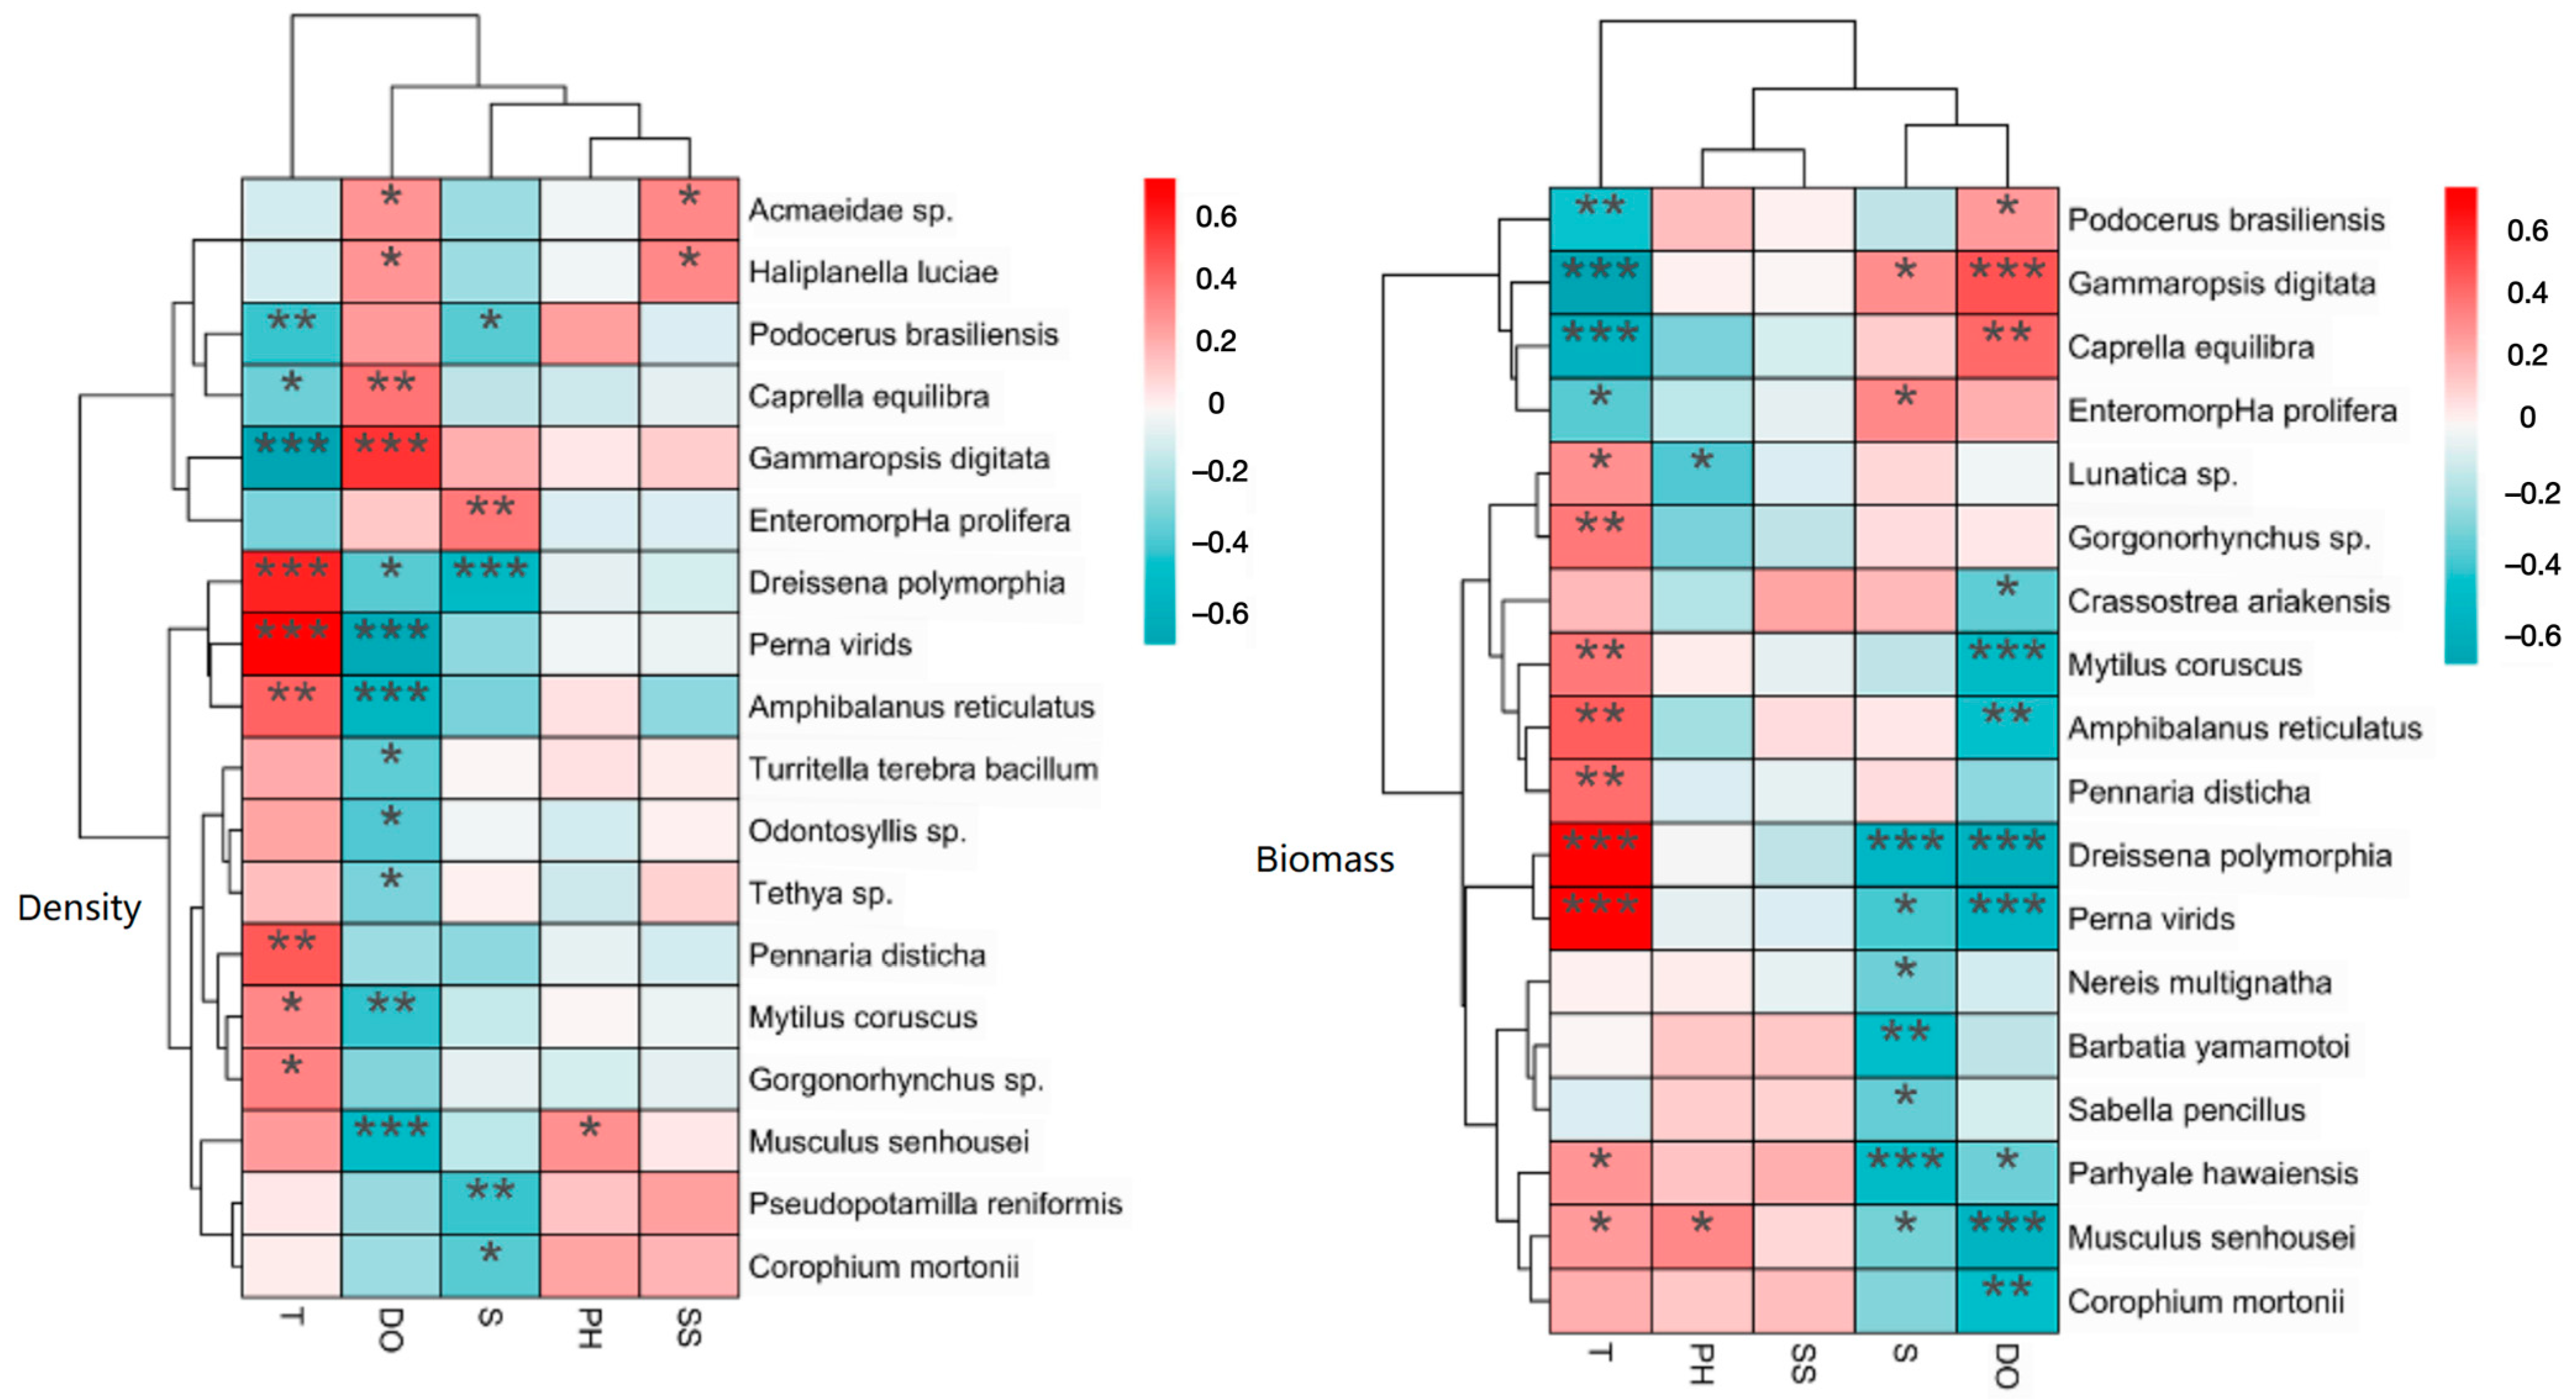
3.5. Correlation of Environmental Factors

The detrended correspondence analysis (DCA) ordination gradient indicated that the abundance and biomass had gradient lengths of 1.2 and 1.7, respectively. Therefore, redundancy analysis (RDA) was selected for both cases. The results showed that the fouling community’s composition on the nets was influenced by different environmental factors, with the primary factors including water temperature (T), salinity (S), and dissolved oxygen (DO). Among all environmental factors, water temperature was the most important regulatory factor (Figure 10). Both density and biomass data showed that the community had a more positive response to T compared to other environmental factors. Additionally, both the density and biomass of most species exhibited a strong negative correlation with DO, and the density and biomass of some species such as Dreissena polymorphia and Pseudopotamilla reniformis showed negative correlations with S, while Enteromorpha prolifera showed positive correlations with S.

4. Discussion

The Leizhou Bay area boasts a superior geographical location and is a typical sea area for the ecological investigation and research of fouling organisms in China, serving as an ideal ecosystem for studying community ecology. During a 12-month hanging net experiment in Leizhou Bay, a total of 44 species of fouling organisms belonging to 10 phyla were detected, with Perna viridis, Gammarellus brasilianus, and Balanus reticulatus as the dominant species. The number of species and the number of dominant species are basically consistent with previous survey results obtained from this area. Chen Tao [31] has found a total of 38 species in the outlet sea of Zhanjing Bay, among which Amphibalanus reticalatus, Stenothoe valida, Perna viridis, and Caprella penantis were the dominant species. Han Shuaishuai [32] conducted a survey of fouling organisms on buoys that had been suspended for 24 months off the east coast of the Leizhou Peninsula, and a total of 35 species of large sessile organisms was found, with perna viridis, Podocerus brasiliensis, and Gammaropsis digitata as the dominant species, while Lin Heshan [16] found that, in Fujian Xinghua Bay, a total of 78 species of fouling organisms appeared on the survey panels, with Amphilbalanus reticulatus and perna viridis as the dominant fouling organisms. Moreover, Lin Heshan [15] observed a total of 84 species of fouling organisms in the coastal waters southwest of the East China Sea, and Amphilbalanus reticulatus was also the most dominant and representative species of fouling organisms. In this experiment, the total number of fouling organism species was less than that in previous studies, but the main phyla were consistent. This experiment used net materials, while the aforementioned experiments mainly used hanging panels. Greene found that the succession patterns on suspended fish cages, however, may differ substantially from the described communities attached to hard substrates or the seabed [17]. The dominant species are basically the same in the different sea areas of China [16,20,21], as mussels can attach to any organic and inorganic surfaces in seawater through the mussel adhesive proteins secreted by their byssus, and the net material can provide them with attachment substrates for reproduction and growth [1,33].
From the community’s succession, we found that the fouling community in this area underwent approximately five stages. The attachment density was extremely low from November to December, while the biomass of this period was not the lowest, as Podocerus brasiliensis exhibited a high settlement rate in this period. Then, the density and biomass increased from January to April, and it reached the first high peak. In contrast, the dominant species on the nets in summer and during June, July, August, and September are mussels (Mollusca). The number of fouling species on the nets in winter is lower than that in other seasons. This temporal distribution pattern of species is generally consistent with the experimental results of nets hanging in Tongan Bay [34], which indicated that the peak period of fouling organism attachment occurred between April and September. During this period, Perna viridis and Balanus reticulatus were important dominant species, while large algae such as Enteromorpha and Ulva showed a clear advantage in spring. Sliskovic [18] also found seasonal changes in the biomass and community structure of fouling organisms on fish farm cage nets. Thus, according to the replacement characteristics of fouling organisms on the nets, we suggested that the key period of prevention for the fouling organisms is from April to September in Zhanjiang Bay.
Temperature is a crucial factor influencing the distribution of fouling organisms, as its level directly affects the attachment and growth of fouling organisms on net materials. The biomass and abundance of dominant species such as Gammarids and barnacles showed a significant advantage in spring and summer. The biomass of mollusks, such as Dreissena polymorphia and Perna viridis, was more prominent in summer and autumn. Species of algae such as Ulva, Enteromorpha, and Corallina were greater in proportion in the winter season, which is in accordance with the observation that the growth peak of macroalgae usually occurred in winter and spring in the southwestern East China Sea [32]. However, algae such as Monostroma and Ulva in the Yellow Sea and the Bohai Sea tended to thrive and attach more vigorously during months with higher water temperatures, which may be related to the latitudinal difference between the two regions [13,20]. Additionally, Dziubińska A [35] also pointed out that the succession of fouling organism communities is influenced by seasonal changes, indicating that higher temperatures are more conducive to the growth of fouling organisms.
Salinity is another significant factor influencing the distribution of fouling organisms [36]. This is because the osmotic pressure of seawater, determined by salinity, has a substantial impact on marine animal larvae, especially marine bivalves, which are osmoconforming animals. Studies have found that [37] the osmolarity within the bodies of shellfish is similar to that of their environment, and changes in seawater salinity can lead to corresponding changes in the osmolarity of shellfish. Therefore, even minor variations by a few tenths of a percent can influence the distribution of mollusks. The results of this net experiment revealed a high negative correlation between Mollusca and salinity, which is consistent with the findings of Ye Jieqiong [38]. This indicates that salinity is the primary environmental factor affecting mollusk growth among the annual environmental factors. Annual environmental factor measurements (Figure 2) showed a salinity range from 26.30 to 30.08 in Leizhou Bay. In contrast, a previous study observed that Perna viridis, which is the main mollusk species in this experiment, possessed an optimal salinity range of 20 to 25 for its larvae [39]. Simultaneously, there is a high positive correlation between Enteromorpha prolifera and salinity. Studies have pointed out that a moderate increase in salinity can promote the growth rate of Enteromorpha. As Enteromorpha is the most representative species of Chlorophyta in this experiment, it confirmed the correlation between Chlorophyta and salinity. This suggests that the main mollusk species in this sea area are more adapted to seasons with low to medium salinity, while the main Chlorophyta species are more adapted to seasons with medium to high salinity, which is also in accordance with the growth peak of macroalgae that usually occurs in winter and spring.
Dissolved oxygen (DO) is also one of the important factors affecting the distribution of fouling organisms. In our study, we found a positive correlation between Arthropoda and DO, which is consistent with the findings of Tan Yangcai [40] on the correlation between crayfish (belonging to Arthropoda) and DO. Annelida has a negative correlation with DO. Liu Zhiguo [41] also found that Annelida has a high tolerance for low-oxygen environments. Based on the minimum DO concentration required, low concentrations of DO actually promote their growth and reproduction. Mollusca exhibits a negative correlation with DO. Ye Jieqiong’s [38] study indicated that among the annual environmental factors affecting Mollusca growth, DO had a nonsignificant impact, as they exhibited weak tolerance for low DO. However, in this study, Mollusca had a negative correlation with DO. Moreover, RDA revealed a strong negative correlation between DO and water temperatures. Considering the combined influence of other environmental factors such as temperature, this resulted in a positive response from Mollusca in months with low DO, further showing that DO levels can produce different responses among different groups of fouling organisms.

5. Conclusions

In this study, we found that the fouling organism community in Leizhou Bay comprises 44 species, with the dominant species being Perna viridis, Podocerus brasiliensis, and Amphibalanus reticulatus. The peak attachment period of fouling organisms predominantly occurred from April to September, with the highest attachment intensity observed during summer. Temperature was identified as the most critical environmental factor influencing the distribution of fouling organisms, while salinity and dissolved oxygen also exerted significant effects on their attachment and growth. The results demonstrate that the spatiotemporal distribution of the fouling organism community is closely correlated with environmental factors, where variations in temperature, salinity, and dissolved oxygen substantially influenced the colonization and development of fouling organisms. These findings provide a scientific basis for fouling organism control in marine aquaculture cages within Leizhou Bay, offering insights to optimize aquaculture management strategies and mitigate the negative ecological impacts of fouling organisms on farming environments.

Supplementary Materials

The following supporting information can be downloaded at: https://www.mdpi.com/article/10.3390/w17040495/s1, File S1: List of fouling organisms in Leizhou Bay.

Author Contributions

Conceptualization and methodology, Y.Z. and L.L.; software, J.Z.; validation, Y.Z., L.L. and J.Z.; investigation, J.Z.; writing—original draft preparation, review and editing, Y.Z.; project administration, L.L.; funding acquisition, L.L. All authors have read and agreed to the published version of the manuscript.

Funding

This research was supported by Science and Technology Infrastructure Construction Project of Guangdong Provincial Science and Technology Department (2021B1212110005); the Funding Project of Guangdong Laboratory for Marine Science and Engineering (Zhanjiang) (ZJW-2019-06); and the Program for Scientific Research Strat-up Funds of Guangdong Ocean University (Grant No. 060302022401).

Data Availability Statement

Data are available upon reasonable request from the corresponding author (zjouliuli@163.com).

Conflicts of Interest

The authors declare no conflicts of interest.

References

  1. Zhang, K.; Cong, W.; Gui, T.; Xing, T.; Wu, L. Effect and Remediation of Biofouling on Marine Aquaculture. Mater. Rep. 2020, 34, 78–81. [Google Scholar]
  2. Xiao, Y. The State of World Fisheries and Aquaculture 2018 Report. Guide Fish. Wealth Creat. 2018, 21, 6–7. [Google Scholar]
  3. Song, X.; Sun, Y.; He, J.; Chu, Y.; Sun, Z. Research progress of deep-water cage cleaning technology and devices. Fish. Mod. 2021, 48, 472–485. [Google Scholar]
  4. Zheng, D.; Huang, Z. Fouling Organisms on Mariculture Cages in Daya Bay, China. J. Fish. Chin. 1990, 14, 15–24. [Google Scholar]
  5. Sen, K.; Erdogan, U.H.; Cavas, L. Prevention of biofouling on aquaculture nets with ecofriendly antifouling paint formulation. Color. Technol. 2020, 136, 120–129. [Google Scholar] [CrossRef]
  6. Chen, Z.; Liu, S.; Lu, L.; Zhang, J.; Zeng, J.; Wang, X. Community Structure of Macrobenthic Crustacean with the Relationship of Affected Factors in the East Coastal of Leizhou Peninsula. J. Guangdong Ocean. Univ. 2021, 41, 17–25. [Google Scholar]
  7. Callow, M. Ship fouling: Problems and solutions. Chem. Ind. Lond. 1990, 54, 123–127. [Google Scholar]
  8. Sammarco, P.W.; Atchison, A.D.; Boland, G.S. Expansion of coral communities within the northern gulf of Mexico via offshore oil and gas platforms. Mar. Ecol. Prog. Ser. 2004, 280, 129–143. [Google Scholar] [CrossRef]
  9. Yan, T.; Yan, W.; Dong, Y.; Wang, H.; Yan, Y.; Liang, G. Marine fouling of offshore installations in the northern beibu gulf of China. Int. Biodeterior. Biodegrad. 2006, 58, 99–105. [Google Scholar] [CrossRef]
  10. Yan, T.; Yan, W.X.; Dong, Y.; Wang, H.J.; Yan, Y.; Liang, G.H. Marine fouling on floating installations west of dongsha islands, the northern south China Sea. Int. Biodeterior. Biodegrad. 2009, 63, 1079–1087. [Google Scholar] [CrossRef]
  11. Zhang, H.; Cao, W.; Wu, Z.; Song, X.; Wang, J.; Yan, T. Biofouling on deep-sea submersible buoy systems off xisha and dongsha islands in the northern south China Sea. Int. Biodeterior. Biodegrad. 2015, 104, 92–96. [Google Scholar] [CrossRef]
  12. Wu, J.W.; Li, Z.; Lin, H.S.; Liu, K.; Huang, Y.Q.; Lin, J.H.; He, B.X.; Mou, J.F.; Zhang, S.Y.; Ma, L.; et al. Community structure and its spatio-temporal patterns of marine fouling organisms in xinghua bay, China. J. Appl. Oceanogr. 2019, 38, 578–584. [Google Scholar]
  13. Liu, K.; Lin, H.S.; Li, Z.; He, X.B.; Huang, Y.Q.; Lin, J.H.; Mou, J.F.; Zhang, S.Y.; Ma, L.; Quan, J.J.; et al. Community structure of macro-fouling organisms in the northeastern waters of the pingtan island, East China Sea. Haiyang Xuebao 2020, 42, 70–82. [Google Scholar]
  14. Qvarfordt, S.; Kautsky, H.; Malm, T. Development of fouling communities on vertical structures in the Baltic Sea. Estuar. Coast. Shelf Sci. 2006, 67, 618–628. [Google Scholar] [CrossRef]
  15. Lin, H.S.; Wang, J.J.; Liu, W.; Liu, K.; Zhang, S.Y.; He, X.B.; Huang, Y.Q.; Lin, J.H.; Mou, J.F.; Zheng, C.X.; et al. Fouling community characteristics in subtropical coastal waters of the southwestern East China Sea. Acta Oceanol. Sin. 2017, 36, 70–78. [Google Scholar] [CrossRef]
  16. Lin, H.; Huang, Y.; Lin, Y.; Zhang, S.; Yu, S.; Liu, K.; Mou, J.; Lin, J.; He, X.; Fu, S.; et al. Biofouling characteristics in Xinghua Bay of Fujian, China. Front. Mar. Sci. 2023, 9, 1107087. [Google Scholar] [CrossRef]
  17. Greene, J.K.; Grizzle, R.E. Successional development of fouling communities on open ocean aquaculture fish cages in the western gulf of Maine, USA. Aquaculture 2007, 262, 289–301. [Google Scholar] [CrossRef]
  18. Sliskovic, M.; Jelic-Mrcelic, G.; Antolic, B.; Anicic, I. The fouling of fish farm cage nets as bioindicator of aquaculture pollution in the Adriatic Sea (Croatia). Environ. Monit. Assess. 2011, 173, 519–532. [Google Scholar] [CrossRef] [PubMed]
  19. Ba-Akdah, M.A.; Satheesh, S.; El-Sherbiny, M.M.O. Biofouling Community Development on Commercial Cage Nets Submerged in a Cage Aquaculture Facility in the Red Sea. Thalassas 2020, 36, 667–675. [Google Scholar] [CrossRef]
  20. Yan, T.; Yan, W.X. Fouling of offshore structures in China—A review. Biofouling 2003, 19 (Suppl. S1), 133–138. [Google Scholar] [CrossRef]
  21. Maruzzo, D.; Conlan, S.; Aldred, N.; Clare, A.S.; Høeg, J.T. Video observation of surface exploration in cyprids of balanus amphitrite: The movements of antennular sensory setae. Biofouling 2011, 27, 225–239. [Google Scholar] [CrossRef] [PubMed]
  22. Pradhan, N.N.; Gohad, N.V.; Orihuela, B.; Burg, T.C.; Birchfield, S.T.; Rittschof, D.; Mount, A.S. Development of an automated algorithm for tracking and quantifying barnacle cyprid settlement behavior. J. Exp. Mar. Biol. Ecol. 2011, 410, 21–28. [Google Scholar] [CrossRef]
  23. Zhang, Y.F.; Wang, G.C.; Xu, Y.; Sougrat, R.; Qian, P.Y. The effect of butenolide on behavioural and morphological changes of marine fouling species balanus amphitrite and bugula neritina. Biofouling 2011, 27, 467–475. [Google Scholar] [CrossRef] [PubMed]
  24. Tasso, M.; Conlan, S.L.; Clare, A.S.; Werner, C. Active enzyme nanocoatings affect settlement of balanus amphitrite barnacle cyprids. Adv. Funct. Mater. 2012, 22, 39–47. [Google Scholar] [CrossRef]
  25. Cao, W.; Yan, T.; Li, Z.; Li, J.; Cheng, Z. Fouling acorn barnacles in China—A review. Chin. J. Oceanol. Limnol. 2013, 31, 699–711. [Google Scholar] [CrossRef]
  26. Liu, S.; Chen, M.; Wu, Q. Study for Developing Resources of Marine Culture and Propagation in Zhanjiang Harbor and Leizhou Bay. J. Zhanjiang Fish. Coll. 1993, 1, 1–9. [Google Scholar]
  27. GB/T 12763.6-2007; Specifications for Oceanographic Survey—Part 6: Exchange of Oceanographic Survey Data. General Administration of Quality Supervision, Inspection and Quarantine of the People’s Republic of China, Standardization Administration of the People’s Republic of China, Standards Press of China: Beijing, China, 2008.
  28. Pinkas, L. Food habits of albacore, bluefin tuna, and bonito in California waters. Fish. Bull. 1971, 152, 1–105. [Google Scholar]
  29. Wekemo Bioincloud, Correlation Analysis. Available online: https://bioincloud.tech (accessed on 8 January 2023).
  30. Hamilton, M.A.; Russo, R.C.; Thurston, R.V. Trimmed Spearman-Karber method for estimating median lethal concentrations in toxicity bioassays. Environ. Sci. Technol. 1977, 11, 714–719. [Google Scholar] [CrossRef]
  31. Chen, T.; Zhang, J.B.; Sun, X.L.; Chen, C.L. Trait fouling organism community in wastewater discharge area of desulfurized power plant in Zhanjiang Bay. J. Appl. Oceanogr. 2018, 37, 395–403. [Google Scholar]
  32. Han, S.S.; Cao, W.H.; Chen, D.; Xie, E.Y.; Yan, T. Review of fouling ascidians in the coastal waters of China. Ecol. Sci. 2018, 37, 186–191. [Google Scholar]
  33. Yan, T.; Li, Z.F.; Hu, Y.F.; Li, X.X.; Cao, W.H.; Luo, W.J.; Cheng, Z.Q. A review on the balanomorph barnacles in the coastal waters of China. Acta Ecol. Sin. 2012, 32, 5230–5241. [Google Scholar] [CrossRef]
  34. Zheng, Y.L. Study on Ecology of Marine Fouling Organisms in Cage-Acquaculture Areas, Tong’an Bay. Master’s Thesis, Xiamen University, Xiamen, China, 2006. [Google Scholar]
  35. Dziubińska, A.; Janas, U. Submerged objects-a nice place to live and develop. Succession of fouling communities in the Gulf of Gdańsk, Southern Baltic. Oceanol. Hydrobiol. Stud. 2007, 36, 65–78. [Google Scholar] [CrossRef]
  36. Nogata, Y.; Tokikuni, N.; Yoshimura, E.; Sato, K.; Endo, N.; Matsumura, K.; Sugita, H. Salinity limitations on larval settlement of four barnacle species. Sess. Org. 2011, 28, 47–54. [Google Scholar] [CrossRef]
  37. Cao, W.H.; Yan, J.; Feng, M.P.; Han, S.S.; Lin, M.Q. Effect of salinity on larval development of the two common barnacles from the southeast coast of China. J. Trop. Oceanogr. 2018, 37, 85–91. [Google Scholar]
  38. Ye, J.Q.; Cai, L.Z.; Huang, R.J.; Zhou, X.P.; Fu, S.J.; Lin, H.S.; Huang, K. Species composition of trawling mollusk in Beibu Gulf and its environmental effect. Mar. Sci. Bull. 2010, 29, 617–622. [Google Scholar]
  39. Yang, P.; Yan, X.W.; Han, H.; Sang, S.T.; Zhai, Z.M.; Liu, Z.; Liang, J.; Chi, J.X.; Yang, F.; Zhang, G.F. The influence of salinity on hatching, growth and survival of larvae and juveniles in green mussel Perna viridis. J. Dalian Ocean Univ. 2013, 28, 549–552. [Google Scholar] [CrossRef]
  40. Tan, Y.C.; Luo, Q.; Yuan, S.; Li, N.; Qin, T.T.; Liu, L.G.; Cheng, L.G. Water quality of shrimp ditch and its effects on crayfish yield in shrimp and rice co-cropping fields. Chin. Rural Water Hydropower 2022, 10, 158–162. [Google Scholar]
  41. Liu, Z.G.; Xu, R.; Liu, C.C.; Qin, Y.T.; Cai, P. Characters of hypoxia area off the Yangtze River Estuary and its influence. Mar. Sci. Bull. 2012, 31, 588–593. [Google Scholar]
Figure 1. Location for the net hanging of the marine fouling study in Leizhou Bay. Red circle showed the location for the net hanging; the left image is the red area in the bottom right image.
Water 17 00495 g001
Figure 2. Schematic diagram of the hanging net.
Water 17 00495 g002
Figure 3. The temperature and salinity trends in Leizhou Bay.
Water 17 00495 g003
Figure 4. The dominant species in the marine fouling community in the Sea Cage Farm in Leizhou Bay.
Water 17 00495 g004
Figure 5. Biomass composition of the top test nets.
Water 17 00495 g005
Figure 6. Biomass composition of the bottom test nets.
Water 17 00495 g006
Figure 7. The attachment density and biomass of the monthly test nets.
Water 17 00495 g007
Figure 8. Spatiotemporal changes in the average density value of Perna viridis.
Water 17 00495 g008
Figure 9. Clustering of the Bray–Curtis similarity of the marine fouling communities in monthly test nets (T, top test nets; B, bottom test nets).
Water 17 00495 g009
Figure 10. RDA between the composition of fouling organisms in different months with environmental factors in Leizhou Bay (T, temperature; DO, dissolved oxygen; S, salinity; PH; SS, surface sediment; red color for positive correlations; green color for negative correlations). The square with * indicated p value < 0.05, the square with ** indicated p value < 0.01, and the square with *** indicated p value < 0.001.
Water 17 00495 g010
Table 1. The sediment content in surface and bottom waters.
Jan.Feb.Mar.Apr.MayJun.Jul.Aug.Sep.Oct.Nov.Dec.
mg/LTop55.40.811.677.844.322.855.633.633.011.655.955.8
Bottom44.522.533.855.745.622.966.822.633.011.655.155.7
Table 2. The dominant species in the marine fouling community in the coastal waters of Leizhou Bay.
Species Name Mean Density/ind.·m−2Mean Biomass/g·m−2IRILifestyle Functional Group
Perna viridis12,904.689.42592AS
Podocerus brasiliensis68,832.2341.32580MD
Gammaropsis digitata24,896.0264.12256MD
Stenothoe gallensis19,056.3140.91706MD
Amphibalanus reticulatus322.58.9939SES
Enteromorpha prolifera33,264.3289.2287APP
Dreissena polymorphia25,412.1397.8272AS
Parhyale hawaiensis225.26.292MD
Caprella equilibra6055.058.385MD
Pennaria disticha2343.565.348SES
Gracilaria bailinae819.227.246APP
Musculus senhousei2603.346.137AS
Crassostrea ariakensis07.929SES
Disclaimer/Publisher’s Note: The statements, opinions and data contained in all publications are solely those of the individual author(s) and contributor(s) and not of MDPI and/or the editor(s). MDPI and/or the editor(s) disclaim responsibility for any injury to people or property resulting from any ideas, methods, instructions or products referred to in the content.

