Abstract
The city of Jackson, Mississippi, has experienced frequent, devastating floods, with flooding along tributaries of the Pearl River that cross the city being widespread and disproportionately affecting low-income neighborhoods. We reviewed the history of flood management and public access along the Pearl River, conducted community meetings with flood-affected residents, visited tributaries affected by frequent flooding, assessed options to reduce flood risks for Town Creek (a tributary traversing the city center), and reviewed the 2024 Draft Environmental Impact Statement (DEIS) by the US Army Corps, which proposed a flood risk management project. Our community meetings, site visits, and interviews with residents highlighted the frequent flooding of low-income neighborhoods along Pearl River tributaries. Thus, a flood risk reduction program should effectively address tributary flooding. In our review of the DEIS, we applied criteria from the National Environmental Protection Act indicating that environmental impact statements should provide a complete identification and description of environmental impact, and found that the DEIS failed to do this. We found that the alternative selected as the likely ‘National Economic Development’ plan would expand real-estate development opportunities while exacerbating flooding in low-income neighborhoods and increasing inequalities in Jackson.
1. Introduction
Floods have proven to be the costliest natural disasters in the US and globally [1], with hurricane-induced flooding becoming increasingly severe and frequent, as illustrated by recent floods, of which Hurricane Helene in 2024 is a notable example [2]. The US federal government plays multiple roles in attempting to manage the flood risk cycle, through the National Flood Insurance Program (NFIP), flood mitigation, and post-disaster assistance. Under the 1936 Flood Control Act and the Stafford Disaster Relief and Emergency Assistance Act, the US federal government provides local communities with assistance for flood damage mitigation and recovery. “Flood control” projects (now termed “flood risk reduction” projects in recognition of the futility of “controlling” floods) are usually built by the US Army Corps of Engineers (USACE), with a local sponsor paying a cost-share, usually a small percentage of the total planning and construction costs (ca 25–50%). The local sponsor is typically responsible for the costs of land purchase and easements and for negotiating with local government agencies and private landowners. The National Flood Insurance Program (NFIP) was created by Congress to reduce the risk of flooding by regulating floodplains and to provide financial support to people after a flood. Many developed areas across the United States depend on levees for flood protection, but building levees can lead to the “Levee Effect”, which describes the false sense of security that can follow levee construction. Residents feel “protected,” which leads to further development in the floodplain, thus increasing exposure in the case of a levee failure, as reported by researchers in Yuba County and Stockton, California [3,4].
Federal policy requires that flood risk reduction investments be cost effective. Under the Principles and Guidelines of 1983, USACE feasibility studies for flood risk reduction are required to identify multiple alternatives and encouraged to select the plan that offers the greatest economic development benefit, designated the National Economic Development (NED) plan. The benefits of flood risk reduction are estimated and compared to the costs for each alternative using a cost–benefit analysis. While the idea of obtaining the best value from investments made with taxpayer funds is appealing, an insidious result has been that poor neighborhoods with lower property values will exhibit lower benefits from flood risk reduction measures than wealthier neighborhoods. Thus, a project that might have a positive cost–benefit ratio for a wealthy community will show lower benefits for a poor community. As a result, the project may not be “justified” for the poor community, would not receive federal funds, and would not be built. Thus, there is a tendency for federal funding for flood risk reduction to go disproportionately to wealthier communities [5].
While flood disasters have impacted areas across the country, recent research has demonstrated that the impacts are not evenly distributed across economic groups. Rather, flood damages tend to be concentrated in areas occupied by low-income and minority communities [6,7]. Ironically, however, the same dynamics manifest in the cost–benefit analyses for flood risk reduction funding are at play in federal recovery assistance after flood disasters: wealthier communities receive more resources because the value of property damaged is greater, exacerbating income and wealth disparities [8]. As a result, wealthy communities tend to gain wealth after disasters while poor communities lose wealth [8]. Ironically, many aspects of existing federal mitigation and recovery policy inadvertently discriminate against low-income communities because they rely on current housing values, which incorporate the legacy effects of historically discriminatory government housing policies and practices [5].
Yet another factor can exacerbate inequities. Many low-income and minority communities are located on low-lying lands that frequently experience “nuisance” stormwater or “pluvial” flooding in addition to inundation from larger floods. Pluvial flooding refers to flooding that results from the accumulation of local rainwater that has not drained off, and it is distinguished from “fluvial” or riverine flooding that results from a river overflowing its banks. Pluvial flooding falls into a regulatory gap, and “The Federal Emergency Management Agency (FEMA) and the U.S. Army Corps of Engineers… limit their attention almost exclusively to riverine and coastal flooding” [9]. Unless a USACE project exacerbates stormwater flooding as a by-product of its flood risk reduction measures, the USACE is not authorized to include stormwater reduction as a goal of its projects. Moreover, FEMA flood insurance rate maps commonly do not depict stormwater flooding. Stormwater management is, in effect, an orphan, left primarily to local governments to address. Many local governments, especially for low-income minority communities, do not have the capacity to reduce stormwater flooding, creating a policy gap that exposes many low-income communities to flood damages.
We examined the case study of Jackson, Mississippi, USA, where flooding of the Pearl River and its tributaries illustrate these issues. Looking at Jackson is timely, because the USACE is currently considering alternative proposals for a flood risk reduction project.
2. Materials and Methods
This research resulted from a collaboration between Jackson State University and the University of California Berkeley called Reconnecting with Big Rivers, which began in 2022 and for which a major focus became flooding in the city of Jackson. We conducted community meetings with flood-affected residents, visited tributaries affected by frequent flooding, made detailed observations of conditions along Town Creek (a tributary traversing the city center), assessed options to reduce flood risk along this stream, and observed conditions at various points along the mainstem Pearl River [10]. Under our supervision, the UC Berkeley Environmental Planning Studio class (LA205) analyzed various aspects of the flooding problem and proposed solutions in early 2023 [11].
As part of our work in the class and subsequent research, we analyzed the distribution of flood exposure and damages as a function of social factors by mapping Flood Damage Probability (FDP) data from Collins et al. (2022) [12] against the 2022 CDC Social Vulnerability Index, which ranks each census tract on 16 social factors divided into four sub themes: Theme 1, socioeconomic status (below 150% poverty, unemployed, housing cost burden, no high school diploma, no health insurance); Theme 2, household characteristics (aged 65 and older, aged 17 and younger, civilian with a disability, single-parent households, English language proficiency); Theme 3, racial and ethnic minority status (Hispanic or Latino of any race, Black or African American, Asian, American Indian or Alaska Native, Native Hawaiian or Pacific Islander, two or more races, other races); and Theme 4 housing type and transportation (multi-unit structures, mobile homes, crowding, no vehicle, group quarters) [13]. We clipped the Flood Damage Probability (FDP) dataset created by Collins et al. (2022) [12] for the conterminous United States and the 2022 CDC Census tract-level Social Vulnerability data [13] to the municipal boundaries of Jackson, Mississippi, in ArcGIS Pro 3.1.0. Then, we used the “Summarize Within” tool in ArcGIS Pro to identify the mean FDP within each census tract in order to compare census tract-level data with the average FDP for that census tract. We used Excel to run a bivariate linear regression analysis of the relationship between the average FDP in a census tract, the dependent variable, and the CDC’s Social Vulnerability Index [13] along with its four sub themes. We performed this to see if Flood Damage Probability was correlated with any of these individual themes more than others.
We also reviewed the Draft Environmental Impact Statement (DEIS) released by the USACE in June 2024 for a proposed flood risk management project, assessing the document against the standard of the National Environmental Protection Act (NEPA) that environmental impact statements should provide a complete identification and description of environmental impacts.
3. Results
3.1. History of Flooding and Water Infrastructure in Jackson
The city of Jackson is sited in central Mississippi along the Pearl River, a major river draining to the Gulf of Mexico (Figure 1). In Jackson, the Pearl River drains 8242 km 2 (as measured by the US Geological Survey stream gauge 02486000, located on US Highway 80). The river provides drinking water to hundreds of thousands of residents in metropolitan Jackson. There are multiple stakeholders involved in governing the Pearl River’s floodplain, including the cities of Jackson, Flowood, Pearl, and Richland, the counties of Rankin and Hinds, and two special districts: the Pearl River Valley Water Supply District and the Rankin Hinds Pearl River Flood and Drainage Control District.
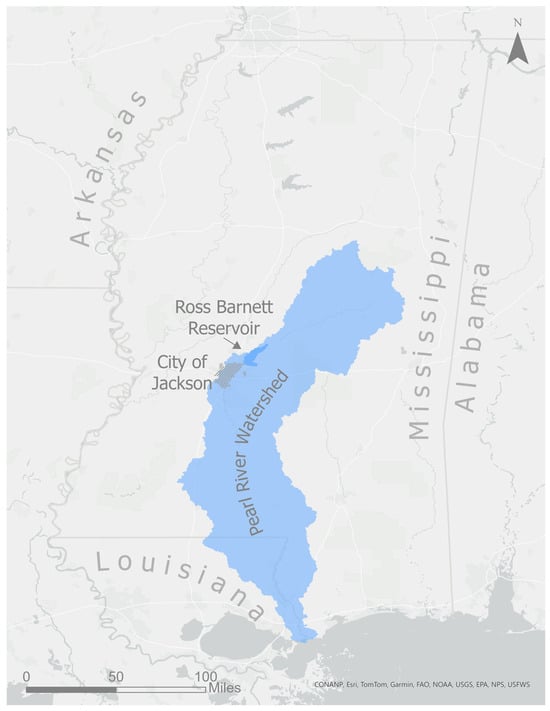
Figure 1.
The Pearl River watershed in the context of the state of Mississippi, the city of Jackson, and the Ross Barnett Reservoir.
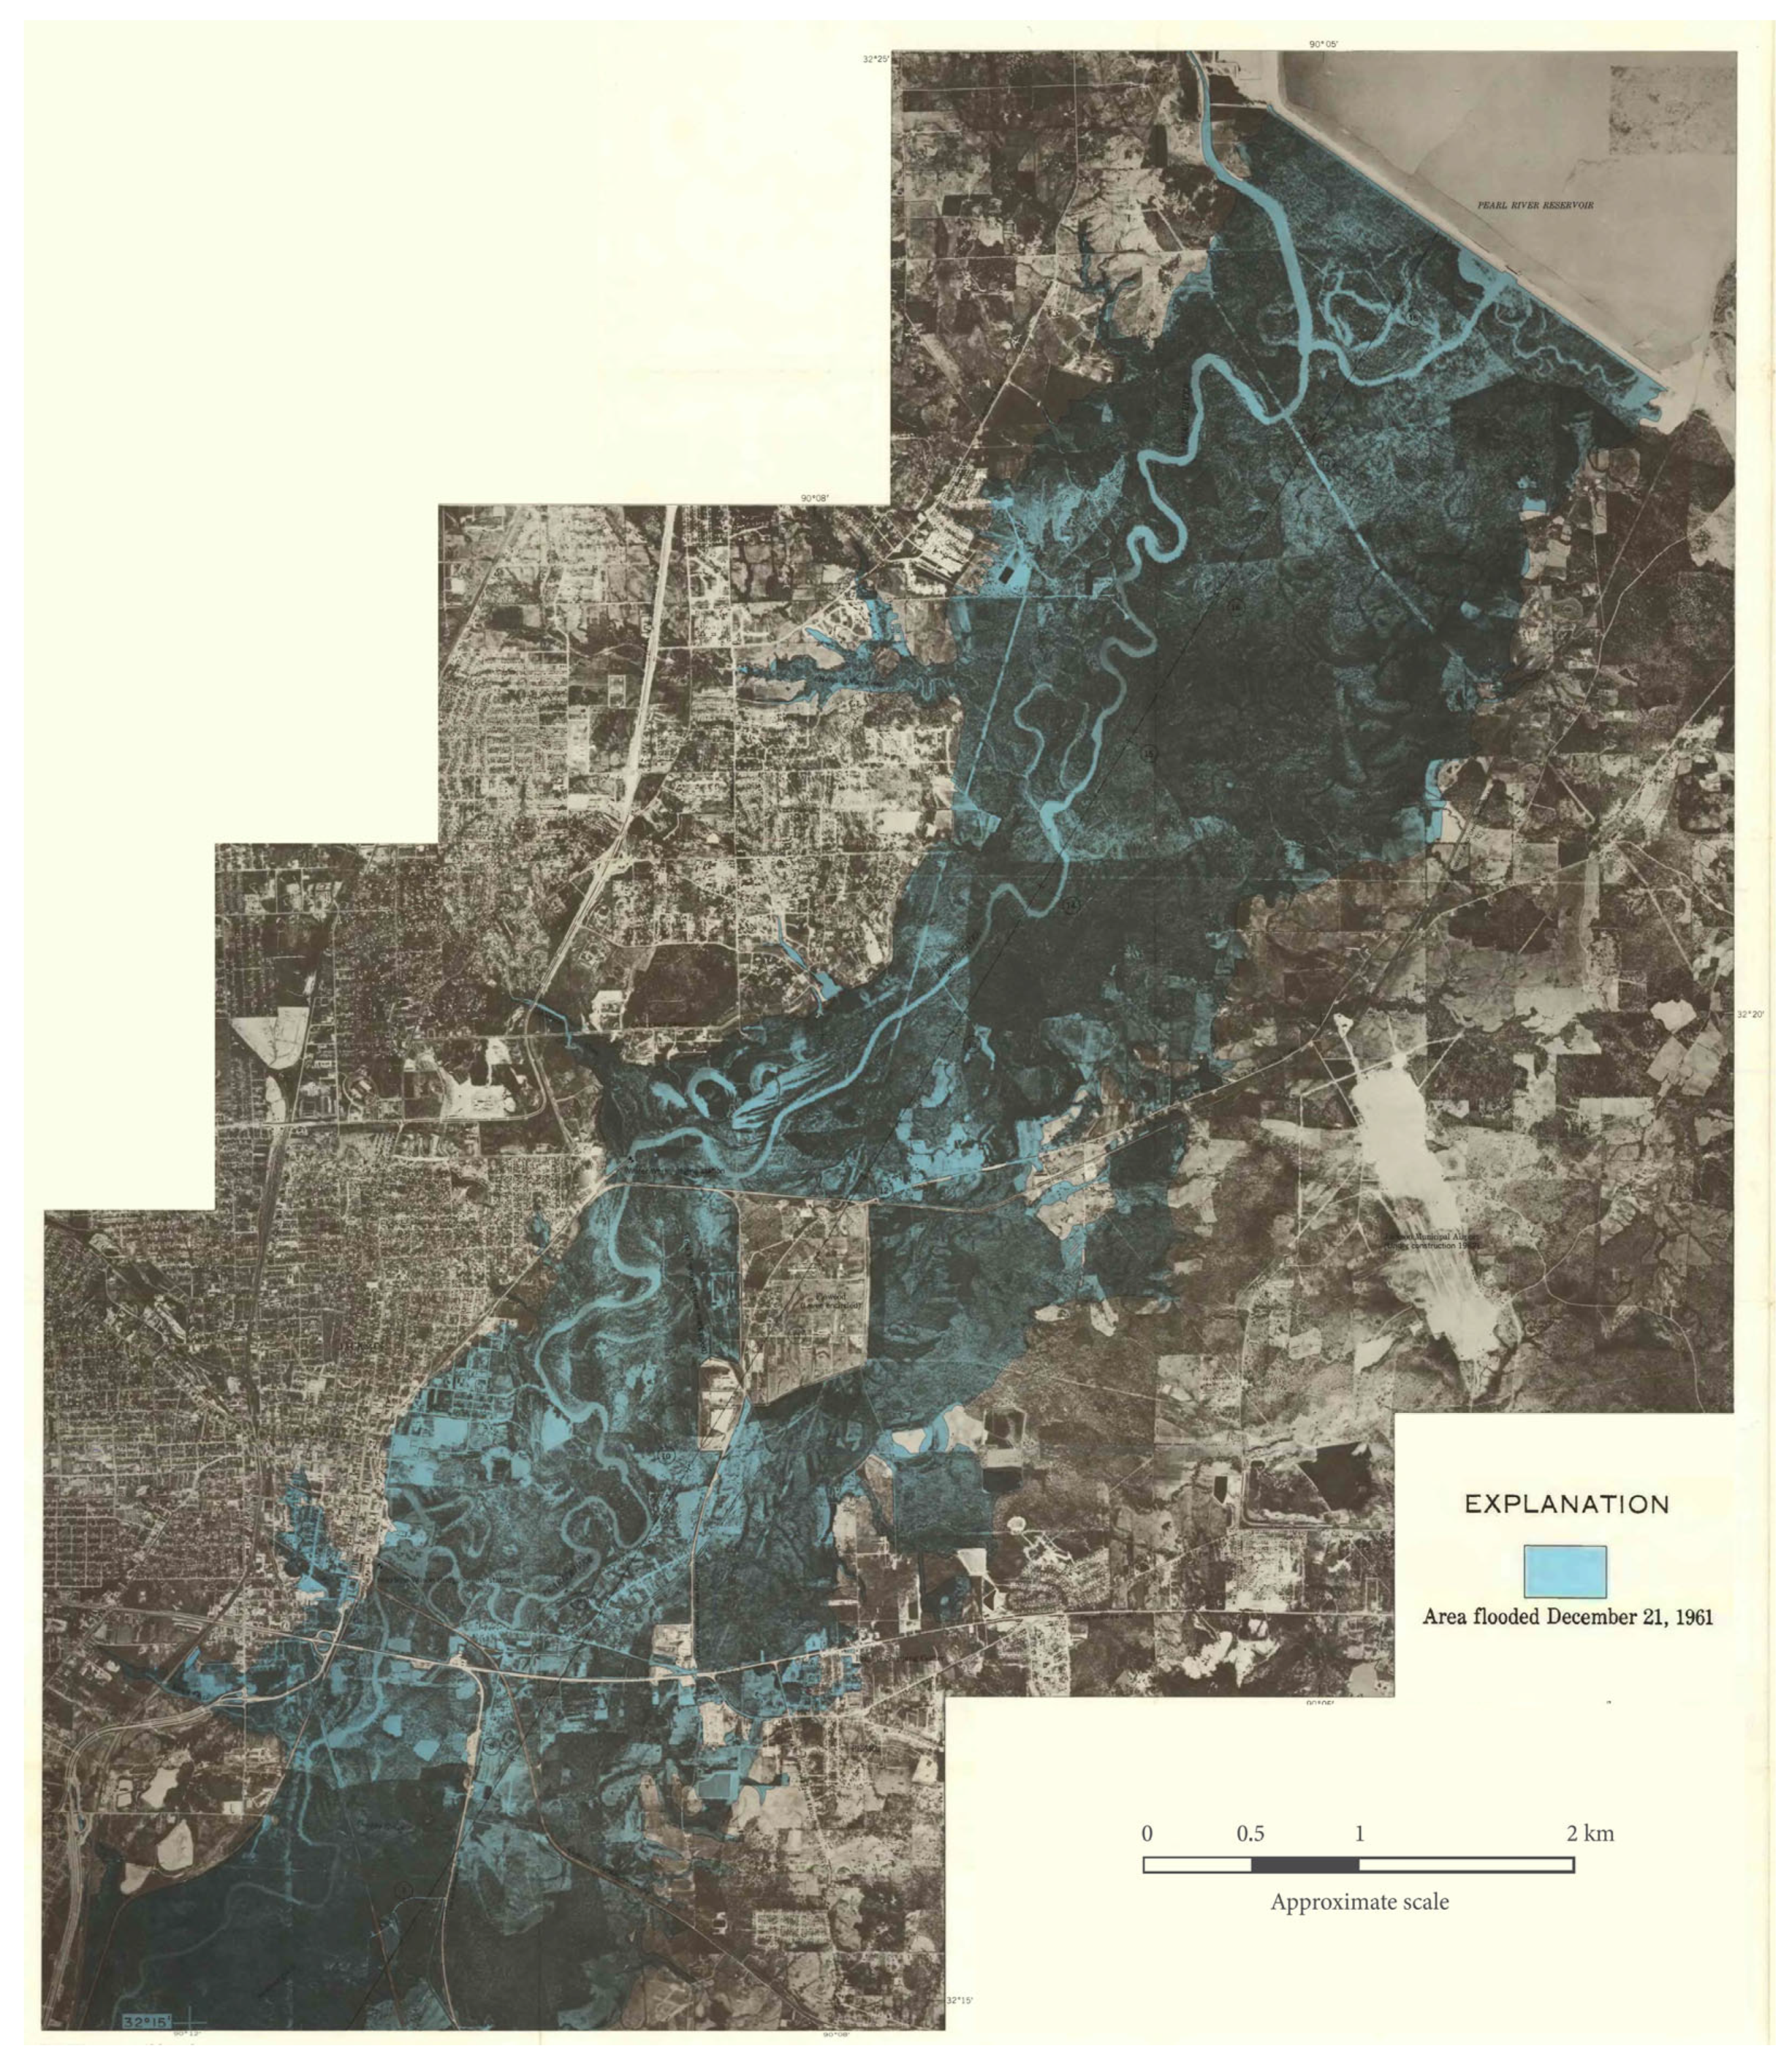
Jackson has experienced frequent, devastating floods, notably in 1961 (Figure 2), 1979, 1983, and, more recently, in 2020 and 2022. The most widespread flooding occurs along tributaries of the Pearl that cross the city, disproportionately affecting low-income neighborhoods.
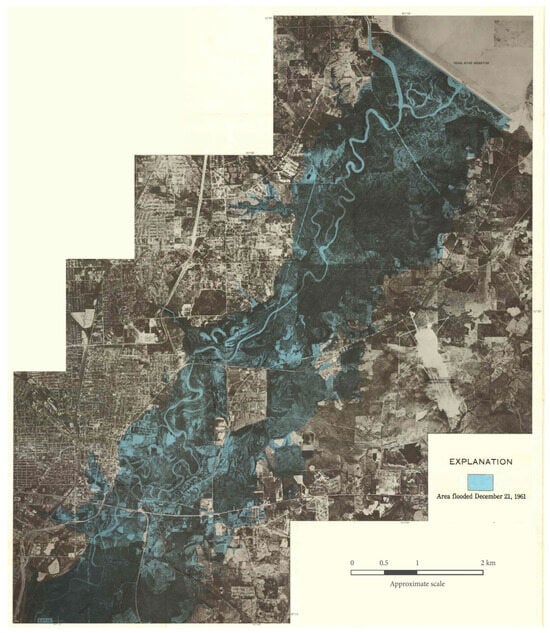
Figure 2.
Inundation map of the 1961 flood, which displaced 1200 people. The Ross Barnett Reservoir is visible in the upper right of the image, and the highly sinuous channel of the Pearl River is visible along the eastern edge of the city of Jackson. (Source: Shell 1964) [14].
In 1960, the Pearl River Valley Water Supply District constructed the Ross Barnett Reservoir on the Pearl River just northeast of Jackson, situated between Madison and Rankin counties. The reservoir was constructed to secure a reliable water supply for a growing population and to provide recreational opportunities and new lakefront property for real-estate development. The Ross Barnett dam created 14,000 ha of reservoir and 6870 ha of lakeside land, on which housing for 12,900 people was constructed. The Pearl River Valley Water Supply District continues to manage the reservoir for water supply to support boating, fishing, and water sports, maintaining a water level of 90.7 m in the summer and 90.0 m in the winter, without much variance.
In response to the flood of 1961 (Figure 2), the United States Army Corps of Engineers (USACE) initiated the construction of a series of levees. Notably, a 16.5 km levee was constructed on the Rankin County side of the river, protecting 2400 ha, much of which was not yet developed, and a shorter 2.4 km levee was constructed along the west bank of the river, protecting 170 ha in urbanized Jackson (Figure 3 and Figure 4). The Rankin Hinds Pearl River Flood and Drainage Control District (the District) was established to maintain the levees and to act as a local sponsor for federal projects. The District is required to provide land and easements for flood management projects and has been responsible for maintaining the levees since 1967. The costs for the system of levees reached USD 8 million for the federal government and USD 1 million for the local governments. At the time, Major General Thomas H. Hayes of the USACE claimed that “there is no reason why the project should not give indefinite protection from flooding to the area” [15]. However, a decade later, the levees proved ineffective in managing the floodwaters.
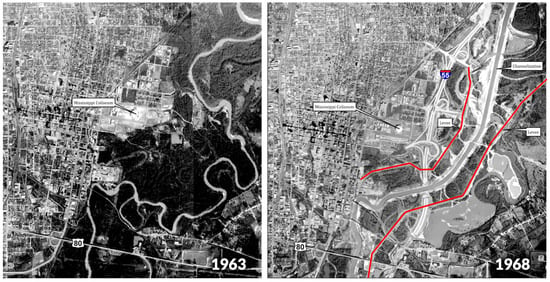
Figure 3.
Aerial imagery of the Pearl River near Jackson, Mississippi, in 1963 (left) and in 1968, after the levees were built (right) [16]. Authors highlighted the levees in red.
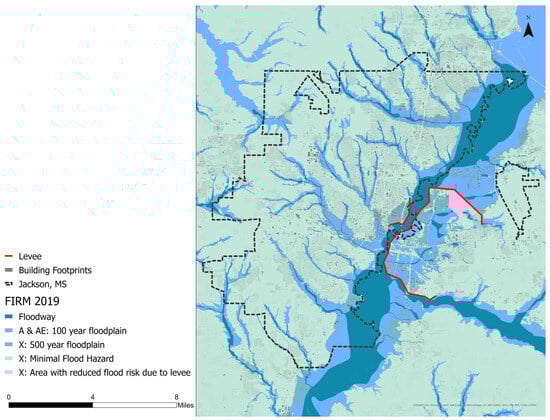
Figure 4.
A Federal Emergency Management Agency (FEMA) Flood Insurance Rate Map (FIRM) indicating a 100-year flood zone (AE), levees, floodways, and building footprints.
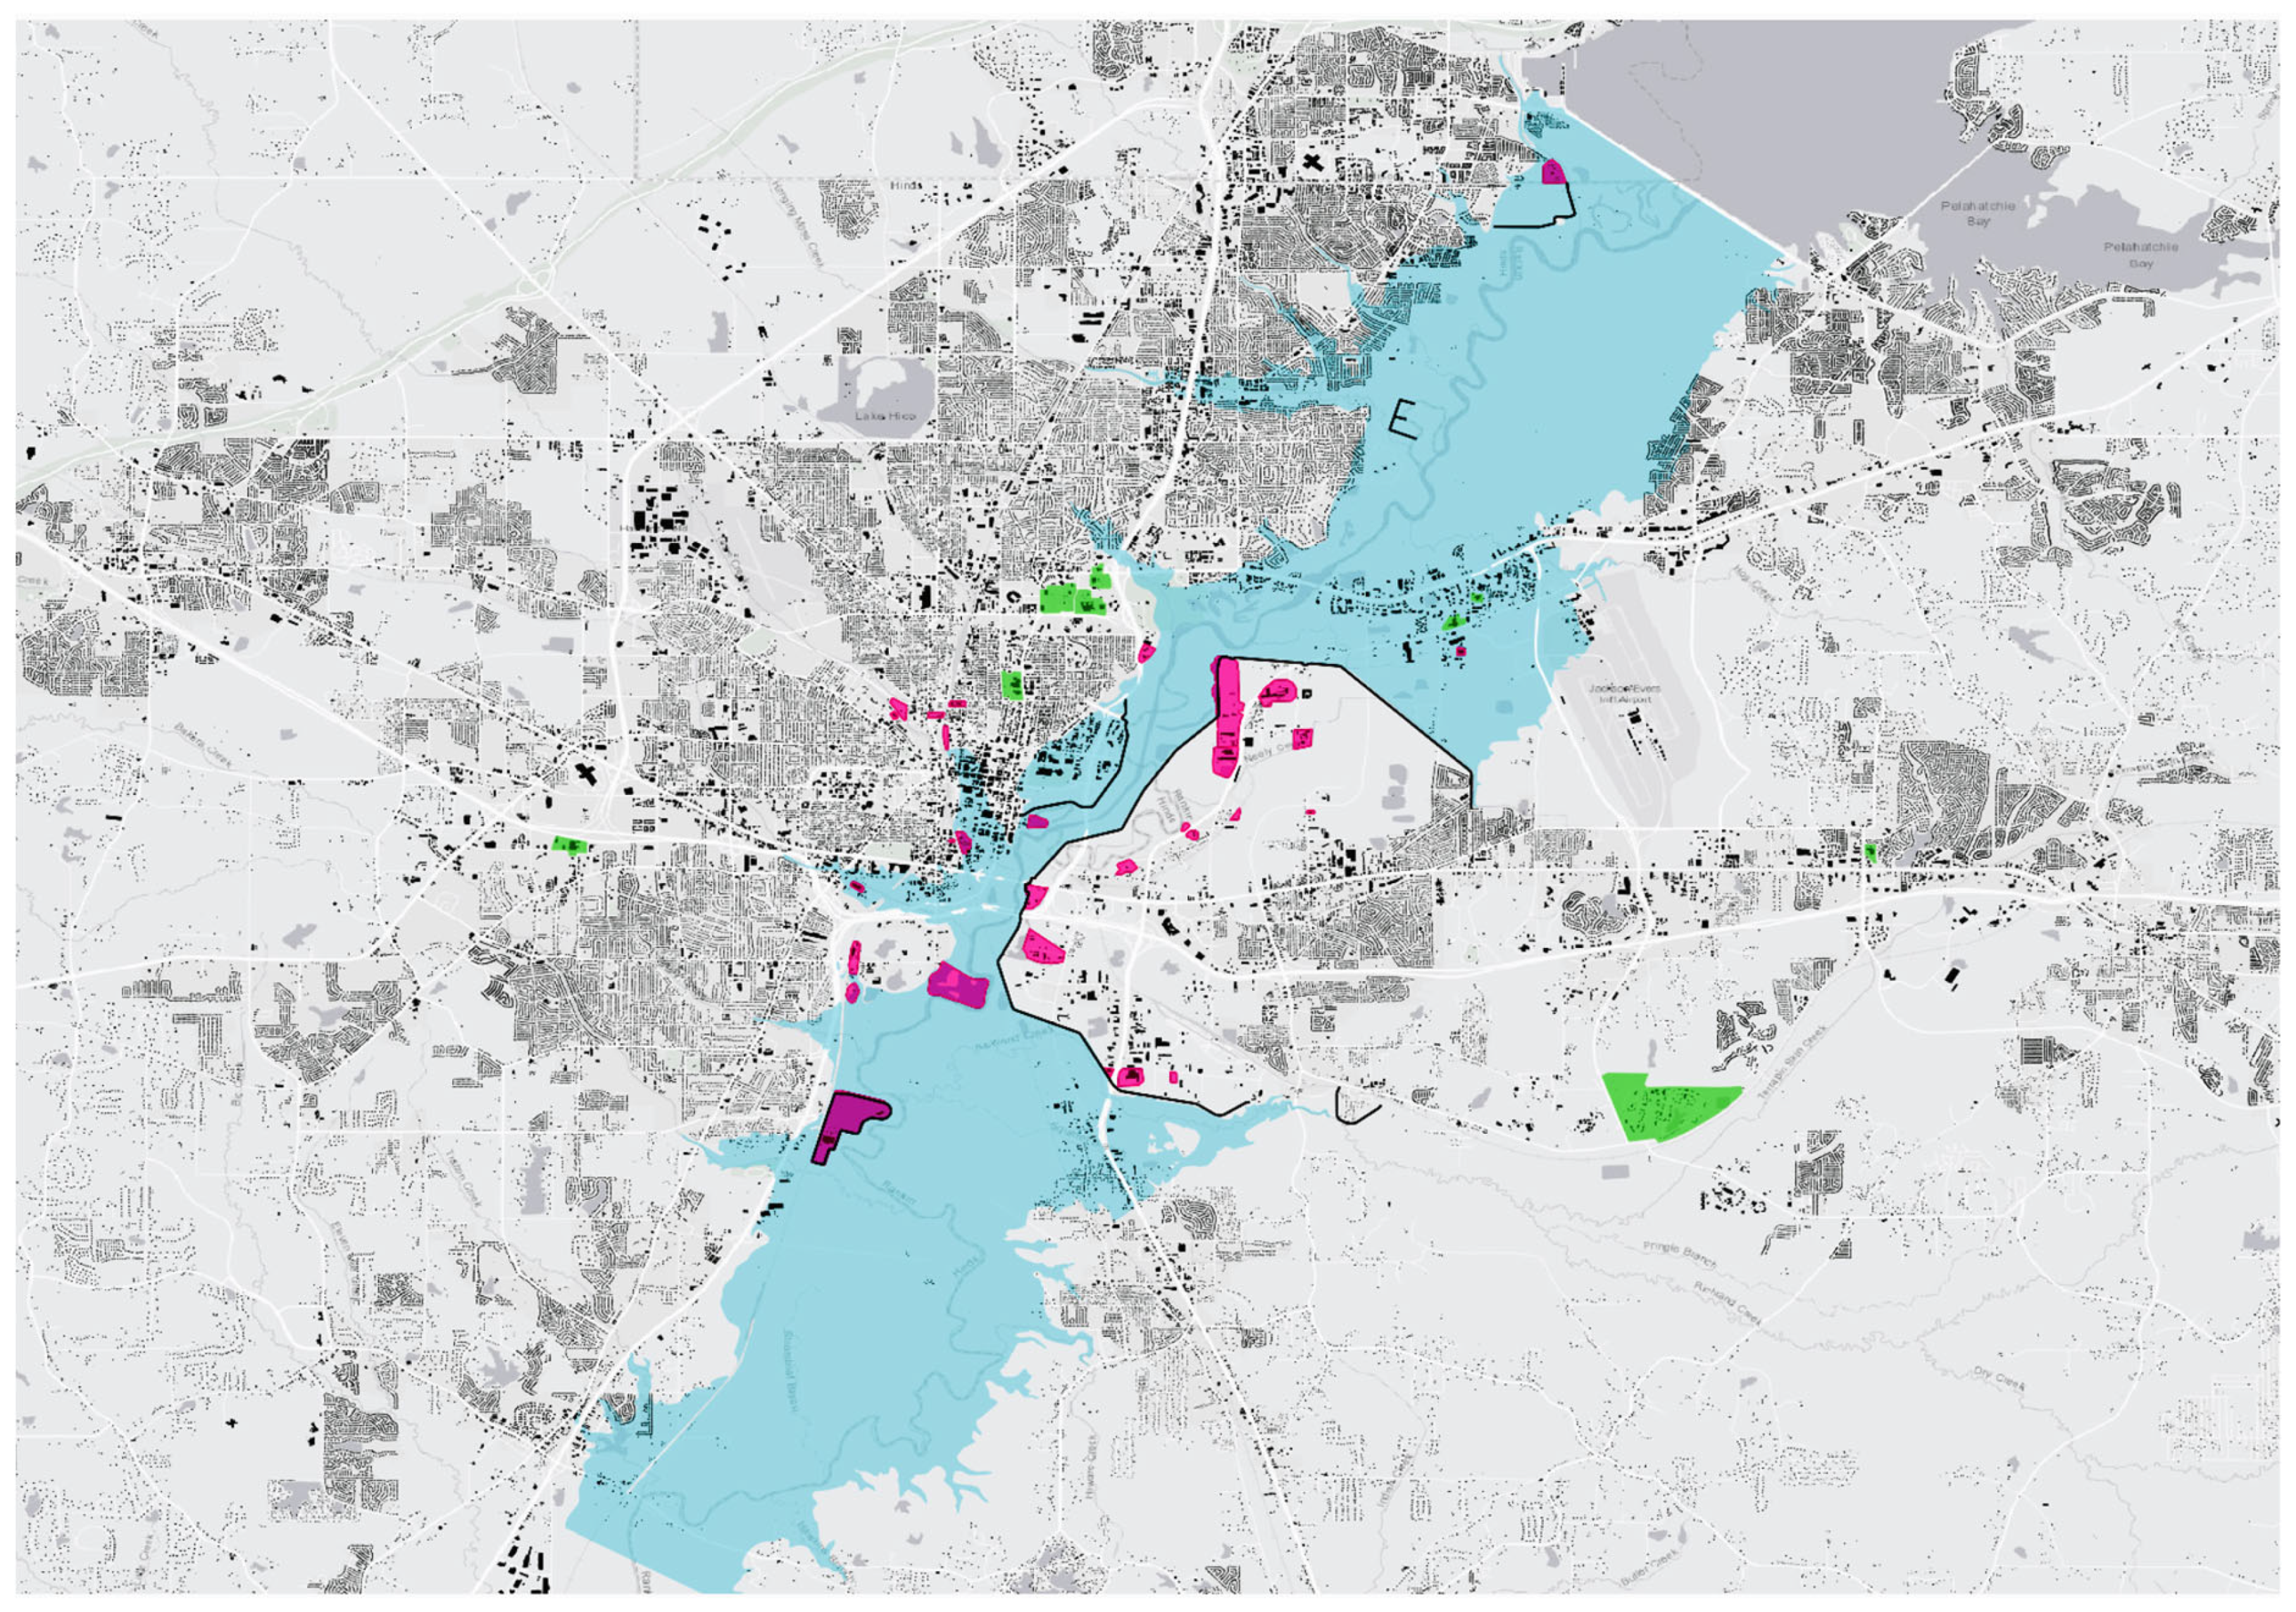
In 1979, floodwaters on the Pearl River reached a height of 13.1 m, displacing 6400 people in comparison to the 1200 people who were displaced in the flood of 1961 (Figure 5). Thus, despite—or perhaps because of—the construction of the levees, impacts from the 1979 flood were significantly greater than those from the 1961 flood. As documented by Platt (1982), “most of the structures damaged [in the 1979 flood] …did not exist in 1961”, but were apparently the result of the “levee effect,” leading Platt to characterize the floodplain management in this period a “public policy disaster” [15].
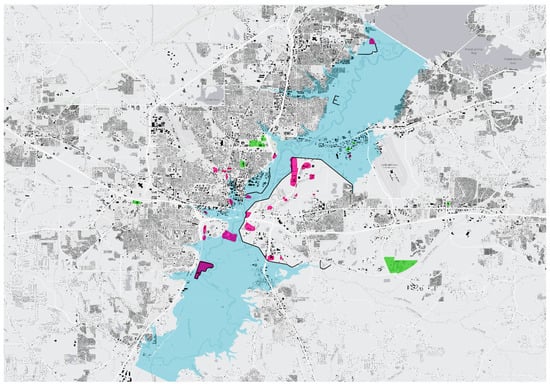
Figure 5.
An inundation map of the 1979 flood documenting hazardous sites (highlighted in pink) and critical facilities (highlighted in green) (map by Emmalina Glinskis, for the UC Berkeley Environmental Planning Studio class, LA205, Spring 2023).
After the levees were built between 1964 and 1967, land in the floodplain was rezoned for residential, commercial, and industrial development [15]. After Jackson joined the National Flood Insurance Program (NFIP), areas within the floodway were required to have National Flood Insurance (Figure 4). The AE zone shows areas that are predicted to flood during a 100-year storm, e.g., a storm determined by historical data to have a 1 percent chance of occurring in any given year (Figure 4). However, since the area joined the NFIP, development in the floodplain has continued to expand, thereby increasing exposure and the risk of flooding.
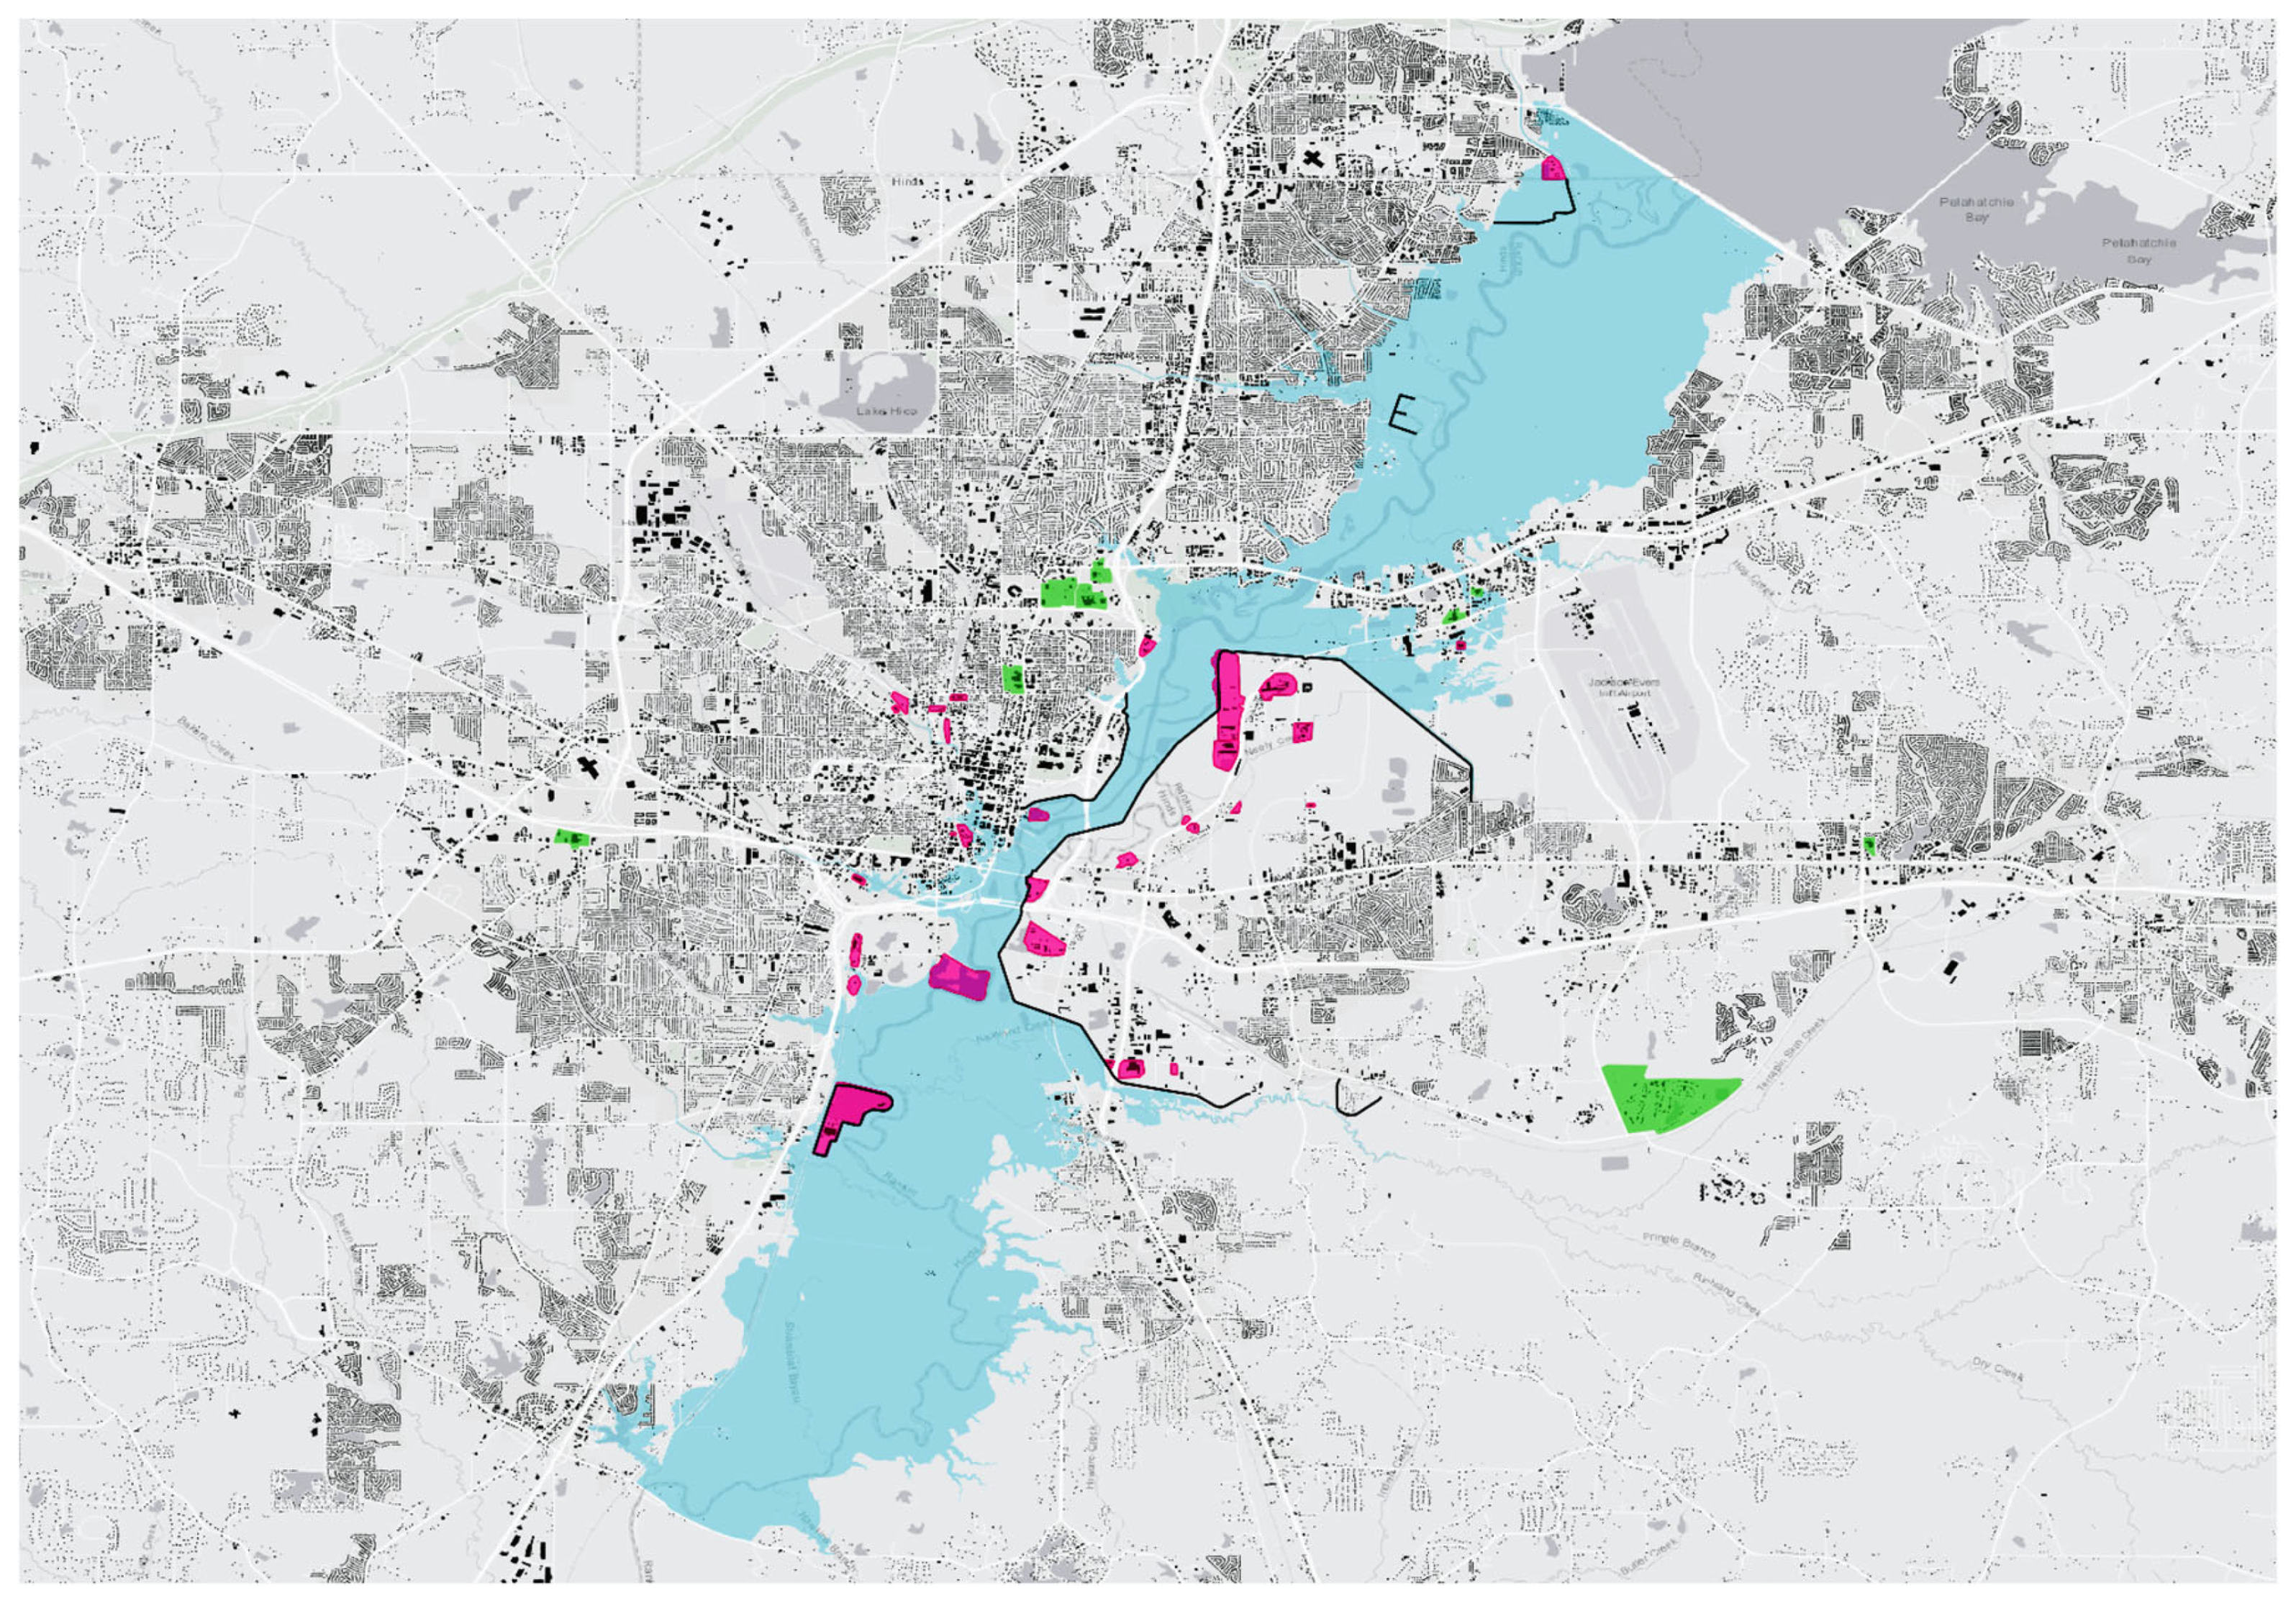
More recently, the February 2020 flood crested at 11.2 m, the third highest stage height recorded (Figure 6). This flood had nearly the same discharge as the 1983 flood but reached a stage height 0.9 m lower. Serendipitously, the Pearl River Valley Water Supply District had reduced water levels at the Ross Barnett Reservoir from 90.7 m to 89.9 m beginning in December 2019 in an attempt to control an invasive species, the Giant Salvinia (Salvinia molesta) [17,18]. The pre-flood drawdown of the reservoir served to provide flood storage and thereby lower flood peaks downstream (by 0.9 m). While the drawdown was not carried out deliberately for flood management, the 2020 flood experience provides a compelling demonstration of the potential of the Barnett Reservoir to reduce downstream flooding.
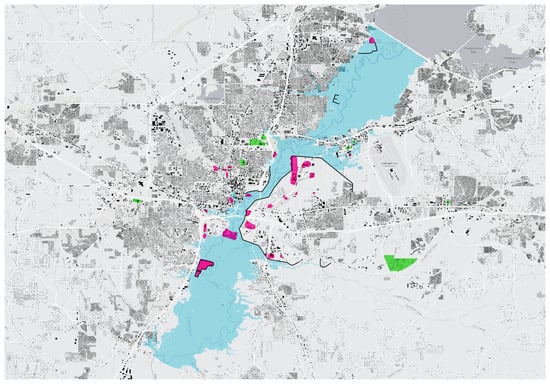
Figure 6.
Inundation map of the 2020 flood documenting hazardous sites (highlighted in pink) and critical facilities (highlighted in green) (map by Emmalina Glinskis, for the UC Berkeley Environmental Planning Studio class, LA205, Spring 2023).
In 2022, the Pearl River flooded again. During this flood, a pump failure at the O.B. Curtis water treatment plant–which provides Jackson with most of its drinking water—left approximately 150,000 residents without safe drinking water [19]. Flooding of the Pearl’s tributaries, like Lynch Creek, resulted in large piles of trash and debris being left behind when the floodwaters receded, especially at sites such as the former Gallatin Street landfill, where known Polycyclic Aromatic Hydrocarbons (PAHs) and heavy metals are present and repeat flooding poses unknown environmental and health risks.
3.2. Inequitable Distribution of Flood Damage Probability
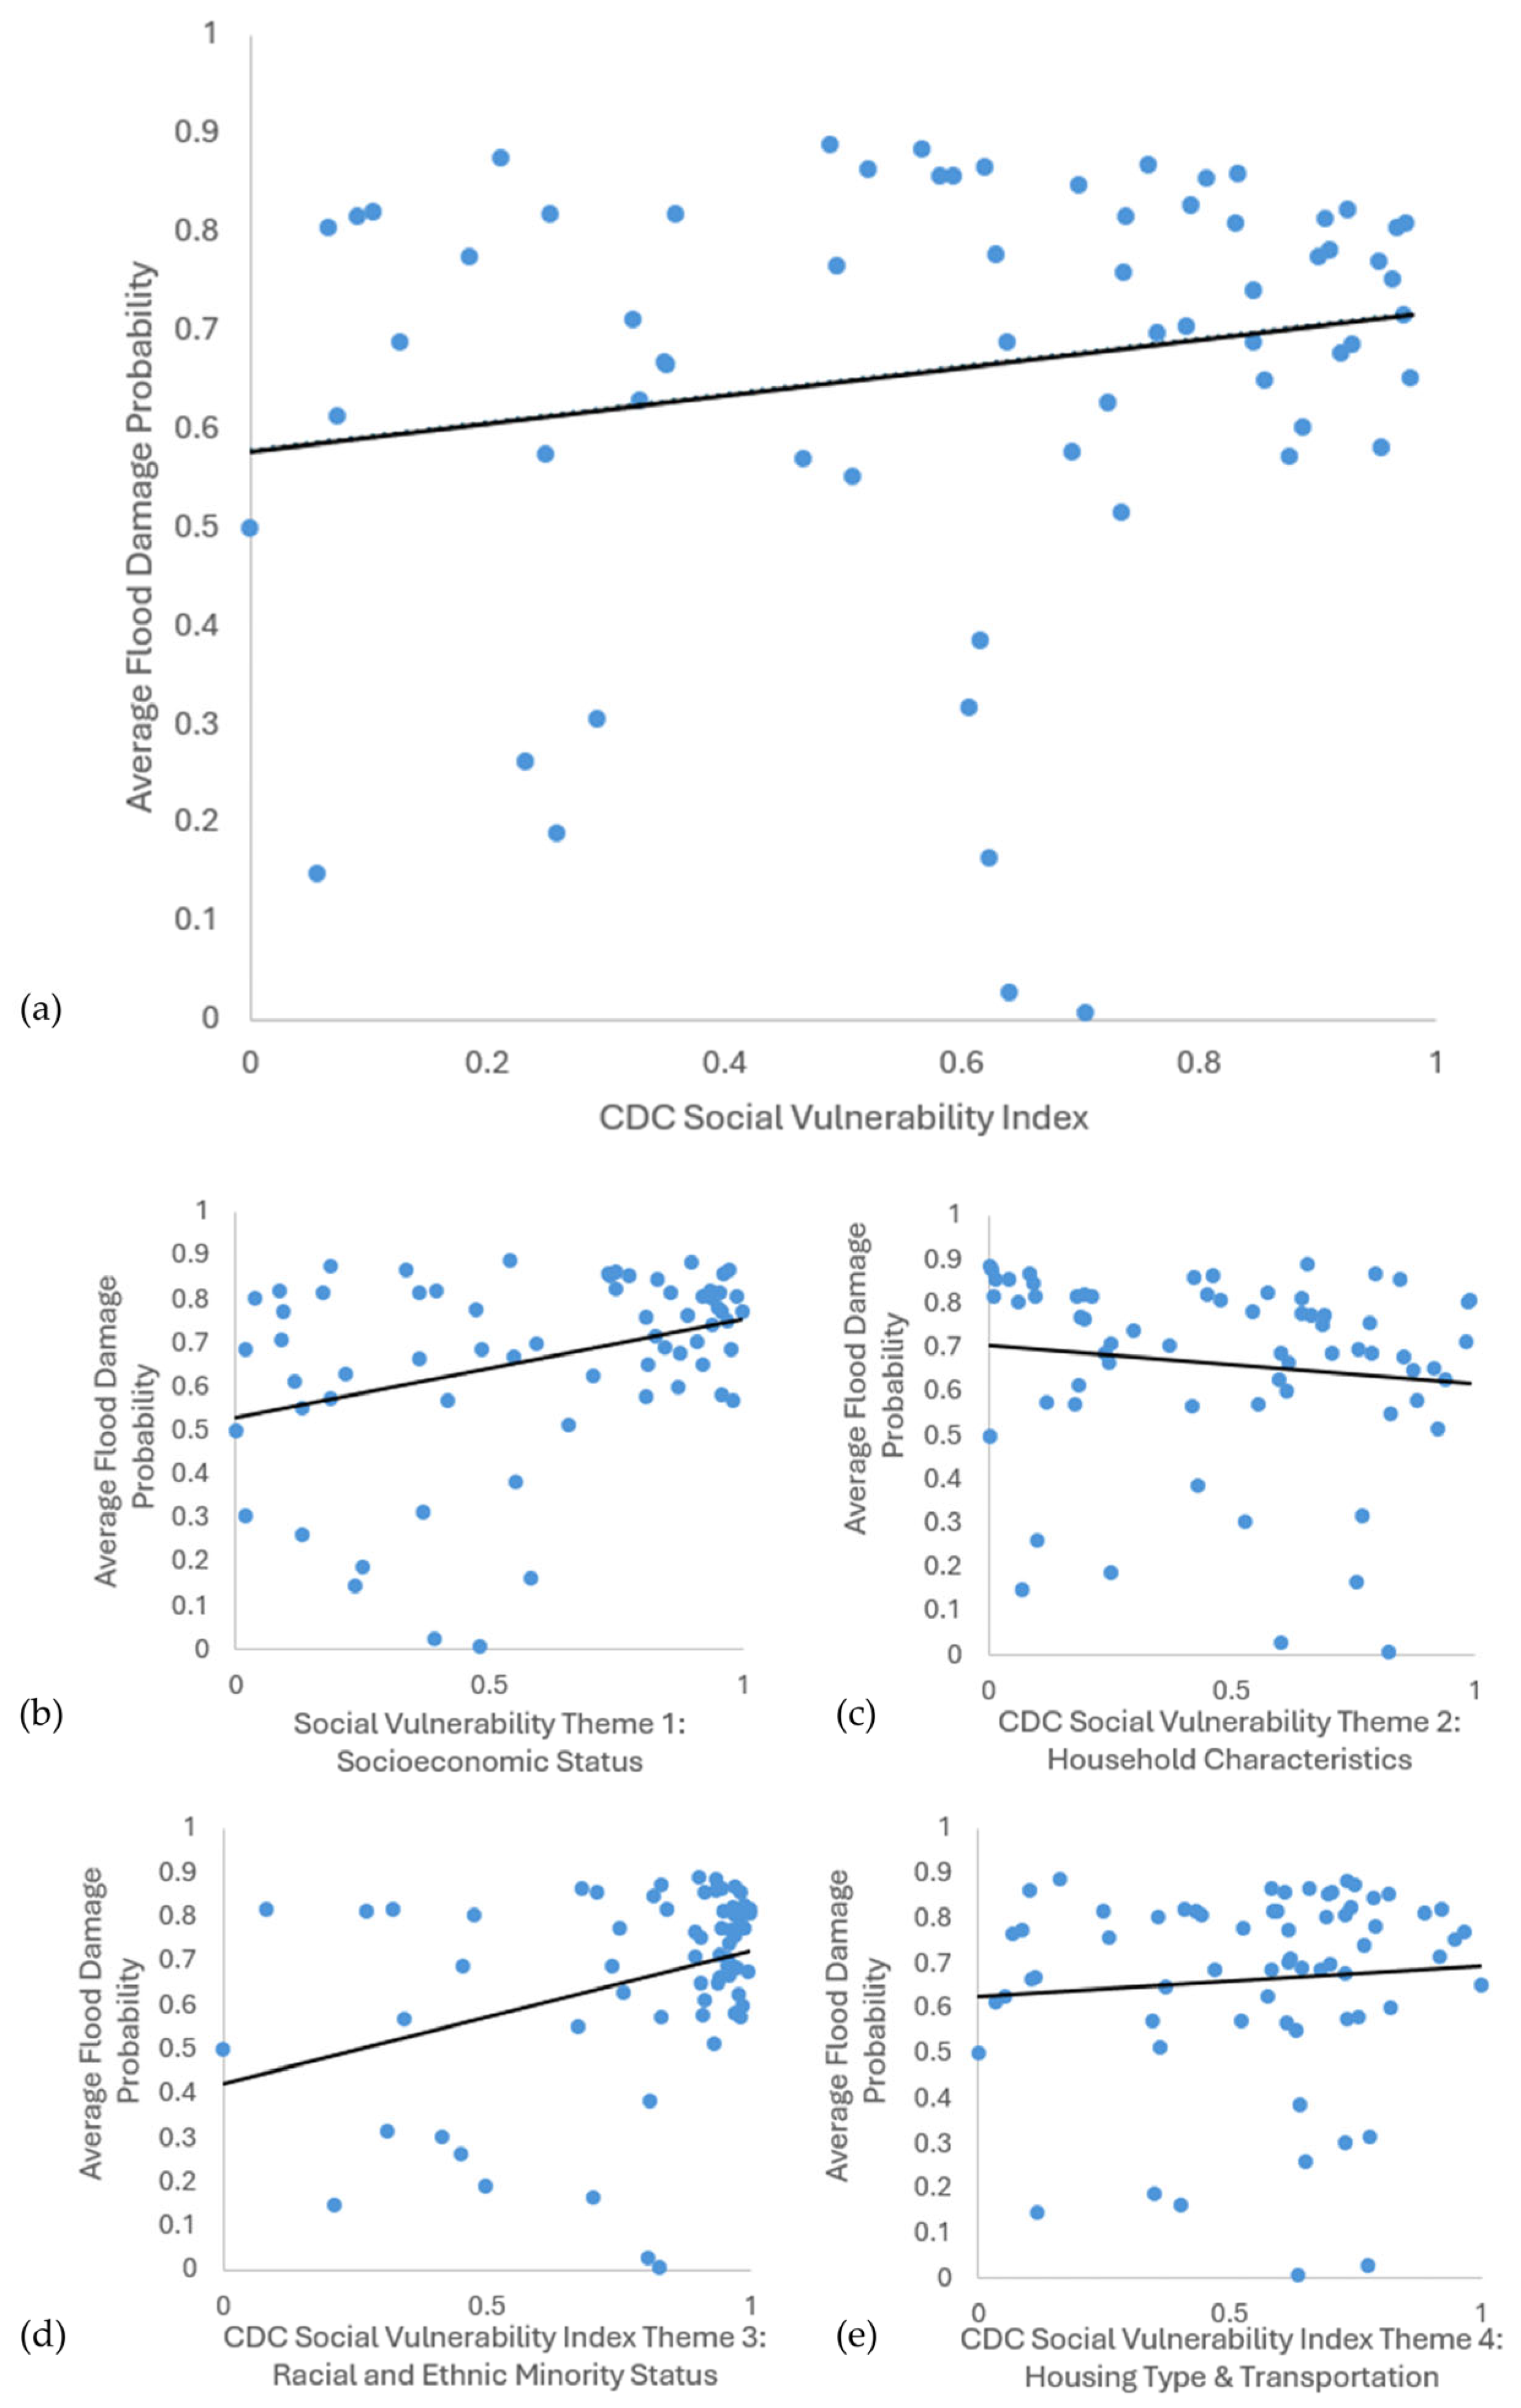
The results of the five bivariate linear regressions of the Flood Damage Probability data against the CDC Social Vulnerability Index [13] final score and four sub themes are presented in Table 1 and Figure 7. The results indicate that racial and ethnic minority status (Theme 3) and socioeconomic status (Theme 1) were both highly significant predictors of flood damage, with p-values of 0.00417 and 0.00447, respectively, both lower than a p-value of 0.01, which indicates high significance [20]. These results show that the average Flood Damage Probability increases with increasing percentages of non-white minority populations and low-income populations. The final SVI score had a positive correlation, but it was not statistically significant, with a p-value of 0.12217. Household characteristics (Theme 2) had a negative correlation with FDP, but it was not statistically significant, with a p-value of 0.32676. The theme of housing type and transportation (Theme 4) was positively correlated but was also not statistically significant, with a p-value of 0.50831.

Table 1.
Regression analysis results for the correlation of the average Flood Damage Probability in a census tract with each of the four CDC Social Vulnerability Index sub themes, as well as the final Social Vulnerability Score. (* designates significant correlation).
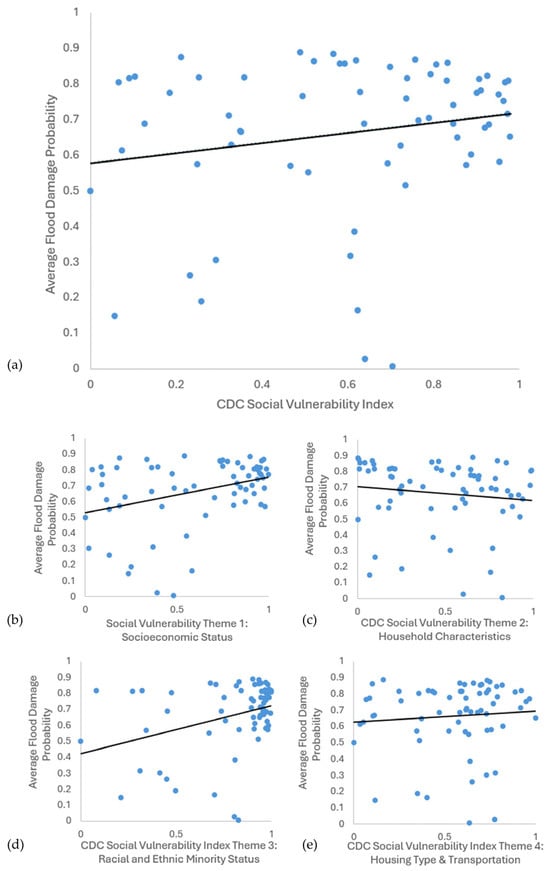
Figure 7.
Scatter plots with the lines of best fit for the correlation of the average Flood Damage Probability in a census tract to the CDC Social Vulnerability Index: (a) overall Social Vulnerability Index, (b) SVI Theme 1, (c) SVI Theme 2, (d) SVI Theme 3, and (e) SVI Theme 4.
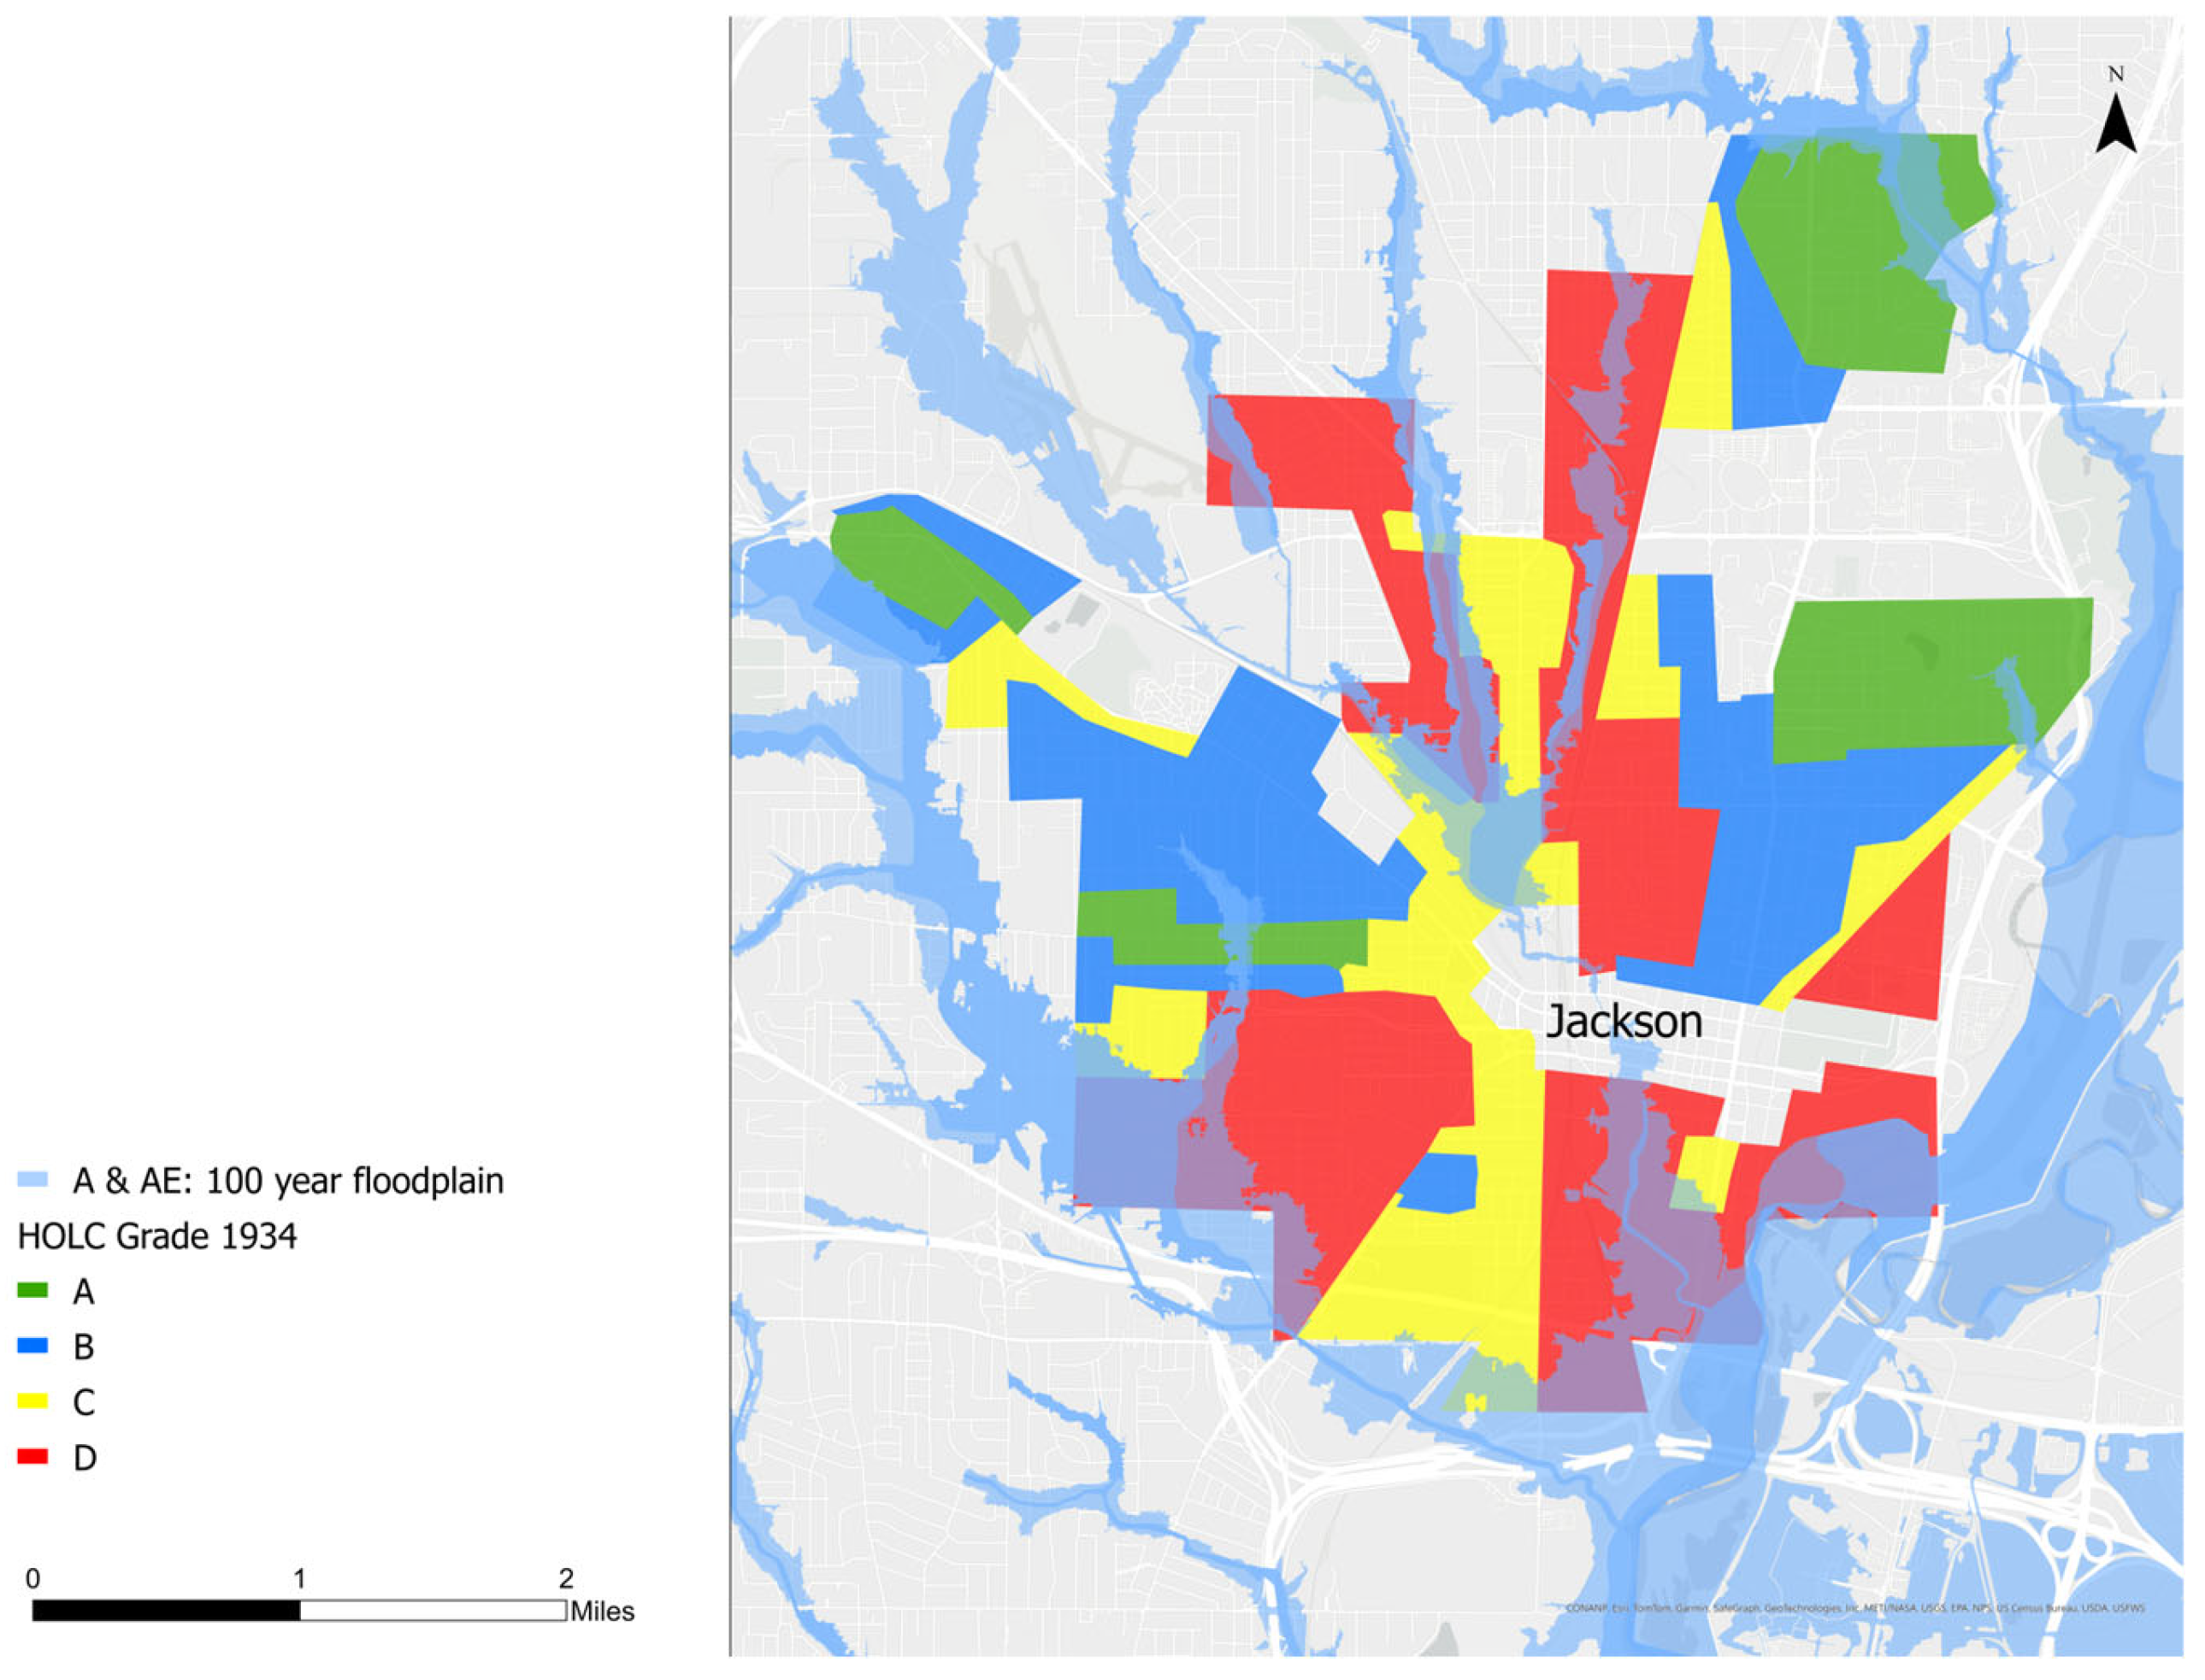
The history of ‘redlining’ provides insights into the current distribution of flood risk in Jackson. In response to the Great Depression, the Home Owners Loan Corporation (HOLC) was created to refinance existing homeownership loans that were struggling between 1933 and 1936. The Federal Housing Authority (FHA), established in 1935, helped insure new loans written by private lenders for mortgages with lower interest rates. Both the HOLC and FHA were explicitly racist in deciding whom to assist, identifying any neighborhoods with people of color as unsafe to lend to. They conducted assessments of “neighborhood quality” which had a large focus on racial composition, perpetuating the existing segregationist and discriminatory views of the time. The maps in Figure 8 reflect the origin of the term “redlining”, as the lowest ranked neighborhoods were shaded red and included essentially all Black neighborhoods [21,22]. Figure 8 shows that these redlined, Black neighborhoods are largely clustered in low-lying areas in the floodplains of the Pearl River’s tributaries, placing them at the highest risk of flood damage.
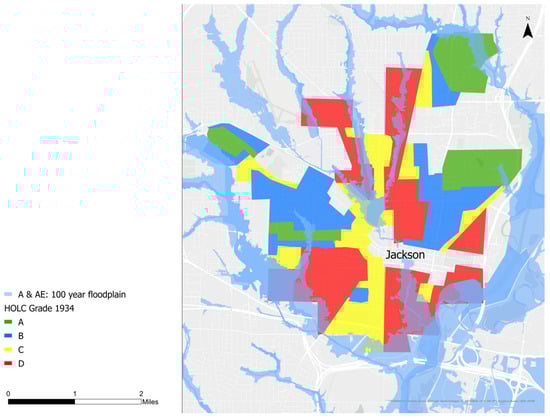
Figure 8.
The 1934 HOLC zones overlain with the 2019 100 year floodplain.
Much of the exposed infrastructure in the FEMA floodplain exists along the tributaries of the Pearl River. Flooding along the tributaries can occur multiple times in a year, causing a buildup of damage, financial burdens, and health concerns. Even when the Pearl River itself has not flooded, the tributaries can back up, overflowing onto their floodplains and inundating neighborhoods. When the Pearl River water level rises, it can exacerbate creek flooding by backing the creeks up further. Thus, to solve the flooding problems in and around Jackson, any flood control proposal should address the tributaries, both west-side tributaries, such as Cany, Hardy, Lynch, Town, Eubanks, Hanging Moss, White Oak, Purple, and Brasher Creeks, and east-side tributaries, such as Hog Creek. These tributaries are the source of recurrent flooding problems, and they should a be principal focus of any proposal that seeks to reduce flood damages in the community.
3.3. Pearl River Basin Mississippi Federal Flood Risk Management Project
In June 2024, the USACE released its DEIS for the Pearl River Basin Mississippi Federal Flood Risk Management Project [23]. This document followed an earlier draft document prepared by the Rankin Hinds Drainage District (the local sponsor), which proposed extensive dredging of the floodplain and building a low-head dam on the river downstream of the city center to impound a reservoir in order to create real-estate development opportunities along the shore of the new “lake” (designated the “one-lake” plan). The 2024 DEIS prepared by the USACE jointly with the local sponsor identified a set of alternatives, including the “one-lake” plan (Alternative C), which the DEIS dismissed as “not feasible”. However, the DEIS selected a “combination thereof” alternative (CTO) that included a dam and a somewhat smaller lake (Alternative D) as the “likely NED plan” [24].
As described further below, Alternative D comes with many issues. The proposed dam downstream of Jackson provides no flood control benefits [23] but creates real-estate development opportunities. Even though it is predicted to reduce the flooding of 316 structures, this alternative would cause the flooding of 52 structures that currently do not flood, including many structures in federally designated “disadvantaged communities”. The “lake” would raise the river’s base-flow water level by nearly 2 m, backing water up into tributaries during floods. The cost–benefit ratio was estimated to be 1.4–1.1, based on projected costs of USD 487–655 million, but these costs did not include costs for many unknowns, such as the costs of mitigating ecosystem damage and hazardous and toxic waste sites, costs that normally would need to be quantified before calculating cost–benefit ratios but in this case were deferred to the Pre-Construction, Engineering, and Design (PED) stage.
The DEIS included a “nonstructural” alternative, “A1”, which would elevate and flood-proof 143 structures at a cost of USD 50 million, for a cost–benefit ratio of 2.2. This was reduced from a nonstructural alternative proposed in 2023 (also designated “A1”) that would have flood-proofed 600 structures, including structures along tributaries, at a cost of USD 198 million. This discarded alternative had a cost–benefit ration of 2.7, the most favorable cost–benefit ratio of all the alternatives proposed, and included some relief for residents along tributaries. In addition, there is a potentially stand-alone project of a 1.5-mile 2.4 km long levee to protect 165 structures in the Canton Club neighborhood at a cost of USD 10 million.
Many of the issues with the DEIS and its “likely NED” alternative D have been critiqued in detail by Braman (2024), Whitehurst (2024), and others [25,26]. Comments on the DEIS were compiled and posted by the Pearl Riverkeeper, a local non-governmental organization, at https://www.pearlriverkeeper.com/2024-deis-comments.html, accessed 30 December 2024. Our critical analysis focused on the tributary flooding because of its disproportionate impact on low-income communities of color. At the time of writing, the DEIS and the report from the Commander of the USACE Vicksburg District [23,24] lie in the hands of the Assistant Secretary of the Army for their decision on an alternative.
3.4. Tributary Flooding and Critique of the USACE DEIS
3.4.1. Tributaries Are the Big Problem, but They Are Not Modeled and No Solutions Are Proposed
Although hydraulic modeling is usually considered to be a strong capability of the Corps, in this project the Corps defined the problem in a way that excluded substantive analysis of tributary flooding. It appears that the Corps did not model the hydraulics of flows through tributaries, with the possible exception of the Town Creek tunnel [23]. Given the significant flooding risks posed by Town Creek and other tributaries, it is baffling that the Corps did not model flow through these tributaries assuming existing tributary conditions (with constrictions and blockages) nor test the potential effects of channel clearing and removing bottlenecks.
Moreover, there are multiple places within the tributary watersheds where upstream detention may be possible. While the lower reaches of tributaries such as Town Creek pass through densely urbanized Jackson, their upper reaches drain more rural landscapes, such as pasture land where detention basins could plausibly be sited [10], but the DEIS did not consider potential detention sites upstream. Upstream detention could offer multiple benefits, including flood peak reduction for both the tributaries and the mainstem downstream. In App E (p.50–51), the DEIS acknowledged tributary storage as an “Item not included within Alternative CTO”, saying, “These options could have limited benefit due to the downstream channel constraints, which are already restricting flow and lack of available land for side channel storage, as the tributaries are urban drainages” [23]. The “downstream channel constraints” are bottlenecks and blockages that should be improved as part of a systematic flood risk reduction project encompassing the tributaries.
In some cases, structures occupy low-lying lands where flooding would be difficult to prevent, and, in these cases, elements of the nonstructural alternative could be utilized, such as the elevation of structures, flood-proofing, and managed retreat (voluntary buyouts).
A systematic approach to flood risk management should logically include tributary flooding and interior drainage, as well as flooding due to elevated flows in the mainstem of the Pearl River. Without such a systematic approach, the DEIS and the underlying flood risk reduction project fall short of sound engineering.
3.4.2. A Laundry List of Projects but No Analysis
The DEIS Section 1.5.2. “Ongoing Projects” states, “Various local government entities are conducting work within the Pearl River Tributaries. In addition, the City of Jackson has committed funding for channel cleanout work, and coordination is ongoing to determine the scope of those efforts. Table 1-1 [of the DEIS] provides a listing of on-going projects by others and the status.”
However, the list of projects contradicts descriptions presented in the text, and there is no assessment of the effectiveness of the projects nor an analysis of how the projects would work together. The lists of “ongoing projects by others” are simply unorganized, non-prioritized laundry lists. The current status of the projects and the likelihood of being funded is not given. The DEIS does not analyze the potential flood control benefits of these individual projects nor their cumulative effects. The obvious need is for the cumulative effects of all the projects to be modeled in order to determine what could be the actual benefits of different combinations of tributary projects. What are key interventions needed to better manage flood risk in the impacted neighborhoods? What would be optimal sets of projects that would yield the most cost-efficient solutions to the real problems of tributary flooding in disadvantaged neighborhoods? These are questions for which the Corps’ modeling expertise is ideally suited. As always, the Corps professional staff are constrained to the scope of analysis set by the political entities that provide its funding and authorization. Nonetheless, it is a missed opportunity that the Corps did not perform this sort of analysis.
3.4.3. Tributaries Will Require a Multi-Prong Approach
To solve the overriding problem of flooding poor and vulnerable communities along the tributaries, a combination of measures will be needed. These likely include upstream detention (taking advantage of open space in headwaters and thereby reducing flood peaks downstream in urban reaches), the cleaning out and removing of bottlenecks from channels (allowing floodwaters to pass), localized levee construction (similar to that proposed for the Canton Club), limited flood-proofing of structures, and managing retreat from low-lying sites whose flood risk cannot practically be reduced through other measures. No single measure will solve the problem, but a combination of approaches probably can. The individual and combined effects of these measures can all be reliably modeled by the skilled modeling team of the Corps, but the scope of the hydrology and hydraulics modeling must include the tributary channels and floodplains, not only the mainstem river. This is not an obscure art form. The Corps has the expertise and experience to undertake such an analysis. However, it must proactively model the tributaries and propose alternatives that include multiple approaches to reduce flooding of disadvantaged communities along tributaries.
3.4.4. Mainstem Impoundment Will Exacerbate Flooding in Tributaries
Building a weir that raises the level of the Pearl River will exacerbate tributary flooding under certain combinations of tributary and mainstem discharge. The DEIS acknowledges that the permanently raised level of the Pearl River will induce backwater flooding on tributaries draining to the Pearl. However, because flow hydraulics are not modeled in the tributaries, this effect is poorly quantified. Descriptions of the ongoing projects in Hanging Moss Creek and Lynch Creek on the Hinds County Watershed Plan website (Hinds County Watershed Plan undated) both acknowledge the problem of backwater flooding: “Tailwater is introduced by the Pearl River during large flood events, and this negatively affects the discharge of flood waters. This has become a perpetual condition… as reflected by past catastrophic floods, particularly the 1979 Easter flood” [27].
4. Discussion
Recent studies have demonstrated that poor communities suffer greater losses from floods than wealthy communities [6,7]. Because federal policies rely on cost–benefit ratios tied to the value of the properties affected, less wealthy communities receive less investment in flood risk reduction and post-disaster assistance, such that disasters tend to increase inequities [8]. Tributaries of the Pearl River flowing through Jackson frequently overflow, causing flooding, especially in disadvantaged neighborhoods. Their channels are poorly maintained for flood conveyance, with multiple points of blockage that induce backwater flooding upstream. Solving this problem is not ‘rocket science’, but requires solid on-the-ground studies and modeling of the benefits of building upstream detention, removing bottlenecks and clearing channels of debris. Tributaries could become amenities for surrounding communities by restoring channels and banks, setting aside areas of floodplains that can flood frequently to safely accommodate floodwaters, providing recreation and open spaces for urban areas, and supporting biodiverse floodplain habitats. Restoring human access and ecological function can be accomplished in conjunction with improvements to channel conveyance, upstream detention, levee setbacks, and managing the retreat of structures now subject to repetitive flooding.
Chronic tributary flooding is a major water management issue in Jackson. A project that does not solve tributary flooding is not genuinely responsive to the flooding problem and its environmental justice dimensions. The “one lake” project (Alternatives C/D) will provide economic returns from land development, which will benefit the local tax base and provide profits for local investors and landowners. However, this will not benefit the underserved communities that now suffer the burden of tributary flooding; in fact, the backwater from the proposed new impoundment will cause induced flooding on tributaries [23]. When judged against the standard of the NEPA, which indicates that environmental impact statements should provide a complete identification and description of environmental impact, the DEIS fails. The DEIS fails to adequately identify and evaluate the full range of impacts for each alternative, instead deferring the analysis of many impacts to the Pre-Construction, Engineering, and Design (PED) stage. Moreover, the DEIS arbitrarily dismisses some alternatives and measures (such as those addressing the tributary flooding) without scientifically sound justification.
5. Conclusions
The flooding of tributaries to the Pearl River is a major water management issue in Jackson and its environs. As is clear from socioeconomic data, this tributary flooding disproportionately affects poor, disadvantaged neighborhoods. Addressing the tributary flooding will require some combination of upstream storage, channel clearing, and managed retreat (e.g., buyouts of properties on low-lying land which are difficult or impossible to protect). The current flooding problem and potential benefits of measures to reduce tributary flood risk can be analyzed by a hydraulic model encompassing the tributary channels and floodplains at a suitable scale. However, the DEIS did not analyze tributary flooding and potential solutions to it, instead presenting an unconvincing argument that other agencies will take care of this problem via channel clearing. This is a flood risk management project, and flood risk management is a core competency of the Corps. The real problem of flooding on the tributaries merits analysis, especially in light of the profound environmental justice issues. Unfortunately, the DEIS evaded responsibility for solving this problem and instead proposed an alternative (D) which will make tributary flooding worse by raising the level of the Pearl River, thereby inducing backwater flooding.
Author Contributions
Conceptualization, G.M.K. and B.H.; methodology, G.M.K., B.H., A.D. and A.S.-L.; software, A.D.; formal analysis, G.M.K. and A.D.; investigation, G.M.K., B.H., A.D. and A.S.-L.; resources, B.H. and G.M.K.; data curation, A.D.; writing—original draft preparation, G.M.K.; writing—review and editing, B.H., A.S.-L., A.D. and G.M.K.; visualization, A.D.; supervision, B.H. and G.M.K.; project administration, B.H. and G.M.K.; funding acquisition, G.M.K., B.H. All authors have read and agreed to the published version of the manuscript.
Funding
Funding for the Berkeley–Jackson–State collaboration and research support for the Environmental Planning Studio class was provided by the Beatrix Farrand Endowment, Riverlab, and Global Metropolitan Studies (UCB), as well as the American Association of Geographers Bridging the Digital Divide and Maritime Transportation Research and Education Center (MarTREC) grants (JSU).
Data Availability Statement
Supporting data are available from the authors upon request.
Acknowledgments
The manuscript was substantially improved thanks to comments from Douglas Shields, peer reviewer Lorenzo Borselli, and an anonymous peer reviewer. We thank Juan Fernandez, Andrew Whitehurst (Healthy Gulf), and Abby Braman (Pearl Riverkeeper) for providing valuable background information. District Flood Risk Program Manager Jessica Ludy provided subject matter expertise and background information to students on current USACE policy guidance on comprehensive benefits, Engineering with Nature, and the Army Corps planning process, and served as a studio reviewer of student projects. This manuscript is based in part on analyses conducted under our supervision in the class Environmental Planning Studio (Landscape Architecture 205) in Spring 2023 (instructors: G. Mathias Kondolf, Matthew Smeltzer, Anna Serra Llobet, Adrienne Dodd, Berneece Herbert; students: Alicia Arrington, Lucille Bennett, Eleanor Beshlian, Kim Deniz, Emmlina Glinskis, Hozefa Haidery, Casey Jones, Minho Kim, LuLu Liu, Dongni Ma, Brandon Pundamiera, Aibhe ‘Yasmin’ Wallis, Zhiqing Xie, Zhiyu Zhao) and on analyses conducted in two workshops held under the auspices of the Jackson State University—UC Berkeley collaboration Reconnecting Big Rivers (workshop coordinators: Berneece Herbert, Talya Thomas, Jae-Young Ko, G. Mathias “Matt” Kondolf, Anna Serra-Llobet, Adrienne Dodd; student participants in both workshops: Ras Cannady, Briana Baber, Tanisha Hinton, Lakesha Stewart, Jon-Vincent Holden, Hannah Hansen, MaFe Gonzalez, Wendy Millan, Xihan Yao).
Conflicts of Interest
The authors declare no conflicts of interest. The funders had no role in the design of the study; in the collection, analyses, or interpretation of data; in the writing of the manuscript; or in the decision to publish the results.
Abbreviations
The following abbreviations are used in this manuscript:
| ATSDR | Agency for Toxic Substances and Disease Registry |
| CDC | Center for Disease Control |
| CTO | Combination thereof |
| DEIS | Draft Environmental Impact Statement |
| FEMA | Federal Emergency Management Agency |
| FHA | Federal Housing Authority |
| HOLC | Home Owners Loan Corporation |
| NED | National Economic Development |
| NEPA | National Environmental Policy Act |
| NFIP | National Flood Insurance Program |
| PED | Pre-Construction, Engineering, and Design |
| USACE | US Army Corps of Engineers |
References
- Gourevitch, J.D.; Singh, N.K.; Minot, J.; Raub, K.B.; Rizzo, D.M.; Wemple, B.C.; Ricketts, T.H. Spatial Targeting of Floodplain Restoration to Equitably Mitigate Flood Risk. Glob. Environ. Change 2020, 61, 102050. [Google Scholar] [CrossRef]
- Flitter, E. Hurricanes Amplify Insurance Crisis in Riskiest Areas. The New York Times. 12 October 2024. Available online: https://www.nytimes.com/2024/10/12/business/insurance-hurricane-milton-helene.html (accessed on 24 January 2025).
- Hutton, N.S.; Tobin, G.A.; Montz, B.E. The Levee Effect Revisited: Processes and Policies Enabling Development in Yuba County, California. J. Flood Risk Manag. 2019, 12, e12469. [Google Scholar] [CrossRef]
- Ludy, J.; Kondolf, G.M. Flood Risk Perception in Lands “Protected” by 100-Year Levees. Nat. Hazards 2012, 61, 829–842. [Google Scholar] [CrossRef]
- US Army Corps of Engineers Strategic Plan to Advance Environmental Justice: A Civil Works Program for All; USACE (US Army Corps of Engineers): Washington, DC, USA, 2024; Available online: https://berkeleyriverlab.org/2025/01/u-s-army-corps-of-engineers-strategic-plan-to-advance-environmental-justice/ (accessed on 20 January 2025).
- De Herve, M.d.G. Fair Strategies to Tackle Unfair Risks? Justice Considerations within Flood Risk Management. Int. J. Disaster Risk Reduct. 2022, 69, 102745. [Google Scholar] [CrossRef]
- Tate, E.; Rahman, M.A.; Emrich, C.T.; Sampson, C.C. Flood Exposure and Social Vulnerability in the United States. Nat. Hazards 2021, 106, 435–457. [Google Scholar] [CrossRef]
- Howell, J.; Elliott, J.R. Damages Done: The Longitudinal Impacts of Natural Hazards on Wealth Inequality in the United States. Soc. Probl. 2019, 66, 448–467. [Google Scholar] [CrossRef]
- Netusil, N.R.; Kousky, C. The Coming Storm: How US Cities Are Managing Stormwater from Increasingly Extreme Rainfall Events; Wharton Risk Management and Decision Processes Center: Philadelphia, PA, USA, 2021. [Google Scholar]
- Deniz, E.K. The Suitability of Flow: A Proposed Flood Control Program for Town Creek, A Tributary to The Pearl River; University of California: Berkeley, CA, USA, 2024. [Google Scholar]
- Kondolf, G.; Serra-Llobet, A.; Smeltzer, M.; Dodd, A.; Hansen, H.; Arrington, A.; Jones, C.; Deniz, K.; Liu, L.; Pundamiera, B.; et al. The Green Heart of the Pearl River Plan: A Flood Mitigation Proposal for the Pearl River at Jackson, Mississippi; Report from the Spring 2023 LA205 Environmental Planning Studio and the Reconnecting with Big Rivers initiative; University of California Berkeley and Jackson State University: Berkeley, CA, USA, 2023; Available online: http://berkeleyriverlab.org/wp-content/uploads/Green_Heart_of_the_Pearl_River-July2023.pdf (accessed on 28 December 2024).
- Collins, E.L.; Sanchez, G.M.; Terando, A.; Stillwell, C.C.; Mitasova, H.; Sebastian, A.; Meentemeyer, R.K. Predicting Flood Damage Probability across the Conterminous United States. Environ. Res. Lett. 2022, 17, 034006. [Google Scholar] [CrossRef]
- CDC/ATSDR Social Vulnerability Index (SVI). 2022. Available online: https://www.atsdr.cdc.gov/place-health/php/svi/svi-data-documentation-download.html (accessed on 16 January 2025).
- Shell, J.D. Flood on Pearl River at Jackson, Mississippi in 1961; US Geological Survey: Washington, DC, USA, 1964. [Google Scholar]
- Platt, R.H. The Jackson Flood of 1979 a Public Policy Disaster. J. Am. Plan. Assoc. 1982, 48, 219–231. [Google Scholar]
- History of Pearl River Flooding and Attempts to Mitigate It. Rankin Hinds Pearl River Flood & Drainage Control District. Available online: https://rankinhindsflooddistrict.ms.gov/projects/history/ (accessed on 27 January 2025).
- Broom, B. Battling Giant Salvinia: Barnett Reservoir to be Lowered, But Not as Much as Proposed. The Clarion-Ledger. Available online: https://www.clarionledger.com/story/sports/outdoors/2019/11/21/barnett-reservoir-lowered-kill-invasive-giant-salvinia/4261882002/ (accessed on 23 January 2025).
- Broom, B. Too Much Rain: Reservoir Officials ATTEMPT to Mitigate flooding from Pearl River. The Clarion-Ledger. Available online: https://www.clarionledger.com/story/news/2020/01/16/barnett-reservoir-officials-mitigate-pearl-river-flooding/4487496002/ (accessed on 23 January 2025).
- Neuman, S. The Crisis in Jackson Shows How Climate Change Is Threatening Water Supplies. NPR. 7 September 2022. Available online: https://www.npr.org/2022/09/07/1121178780/jackson-mississippi-water-crisis-climate-change (accessed on 24 January 2025).
- Dhungana, B.; Liu, W. Urban–Rural Exposure to Flood Hazard and Social Vulnerability in the Conterminous United States. ISPRS Int. J. Geo-Inf. 2024, 13, 339. [Google Scholar] [CrossRef]
- Fishback, P.; Rose, J.; Snowden, K.A.; Storrs, T. New Evidence on Redlining by Federal Housing Programs in the 1930s. J. Urban Econ. 2024, 141, 103462. [Google Scholar] [CrossRef]
- Marsico, R. The Harms of Race-Neutrality in Obama-Era Affordable Housing Policy. Geo. JL Mod. Critical Race Persp. 2017, 9, 175. [Google Scholar]
- Pearl River Basin, Mississippi Federal Flood Risk Management Project; Draft; USACE (US Army Corps of Engineers). 2024. Available online: https://www.pearlriverkeeper.com/2024-deis.html (accessed on 28 December 2024).
- Klein, C.C.D. Pearl River Basin, Mississippi, Federal Flood Risk Management Project—Commander’s Report and Environmental Impact Statement; USACE (US Army Corps of Engineers): Vicksburg, MS, USA, 2024. [Google Scholar]
- Braman, A. USACE Pearl River FRM DEIS Public Comment. Pearl Riverkeeper. Available online: https://www.pearlriverkeeper.com/uploads/1/6/3/4/16348482/prkusacecomments2024final.pdf (accessed on 23 January 2025).
- Whitehurst, A. June 2024 Draft EIS, Pearl River FRM Project, Rankin and Hinds Counties Mississippi. 2024. Available online: https://www.pearlriverkeeper.com/uploads/1/6/3/4/16348482/healthy_gulf_2024_pearl_river_frm_project_comments__august_6_2024__final.pdf (accessed on 28 December 2024).
- Lynch Creek—Pearl River. Hinds County Watershed Plan. Available online: https://hindscountyws-waggoner.hub.arcgis.com/pages/lynchcreek (accessed on 24 January 2025).


Disclaimer/Publisher’s Note: The statements, opinions and data contained in all publications are solely those of the individual author(s) and contributor(s) and not of MDPI and/or the editor(s). MDPI and/or the editor(s) disclaim responsibility for any injury to people or property resulting from any ideas, methods, instructions or products referred to in the content. |
© 2025 by the authors. Licensee MDPI, Basel, Switzerland. This article is an open access article distributed under the terms and conditions of the Creative Commons Attribution (CC BY) license (https://creativecommons.org/licenses/by/4.0/).