Abstract
In this study, statistical analysis was conducted to categorize a large number of actual typical cases and analyze the formation conditions of toppling deformation in bedding rock slopes. Based on geological prototypes and similarity theory, a bottom friction test was conducted on the toppling deformable body while considering the excavation process. Based on the deformation and failure phenomena observed in the bottom friction test model, along with the displacement curves at key points, the deformation process in steep bedding rock slopes can be divided into the following five distinct stages: the initial phase, the unloading–rebound phase, the tensile failure phase, the bending creep phase, and the bending–toppling damage phase. To evaluate the stability, a new constitutive model of the nonlinear viscoelastic–plastic rheology of rock masses was developed. This model is based on a nonlinear function derived from analyzing the creep test data of rock masses under fractional loading. Furthermore, a mechanical equilibrium differential equation for rock slabs was formulated to quantitatively describe the aging deformation and failure processes of slopes with delayed instability. Finally, a stability criterion and a quantitative evaluation model for toppling deformation slopes that considered time-varying factors were established. The stability of the model was calculated using a hydropower station slope case, and the results were found to be in good agreement with the actual situation.
1. Introduction
Several hydropower projects have been constructed in the high mountains and steep valleys of Southwest China. Because of the region’s active tectonic activities and rapid valley downcutting, toppling deformable bodies commonly develop in engineering hubs and reservoir areas, posing serious threats to the safe operation of these hydropower projects. Based on the relationship between the slope and rock dip, toppling deformable bodies can be classified into counter-tilt and bedding toppling deformable bodies. A statistical analysis of typical toppling slopes cases in China indicates that counter-tilt toppling deformable bodies are the predominant form, accounting for 68% of cases. This aligns with the general understanding that counter-tilt slopes are more prone to toppling deformation and failure. Because the relevant research is still relatively limited and the formation mechanism is more complex, further research is needed to understand it in greater depth.
Extensive studies have been performed on the deformation and failure mechanisms of rock slopes, largely driven by large-scale hydropower and infrastructure projects. In a theoretical analysis, Goodman and Bray identified the following three modes of toppling slope instability, which have gained widespread recognition: bending–toppling, block toppling, and block–bending compound toppling [1]. Domestic scholars have identified various failure modes of bedding rock slopes through engineering practice, which can be summarized as slip–tensile fractures, slip–compressive tensile fractures, and slip–bending [2,3,4,5,6,7,8,9]. The deformation characteristics of steep slopes include slip–toppling deformation in the middle and upper rock masses, and the overall deformation evolution process can be summarized in the following three stages: unloading–rebound, slip–toppling, and creep slip. Currently, research on the toppling deformation process of steep bedding rock slopes remains limited. There are few studies on deformation and failure phenomena in steep bedding rock slopes, and they predominantly focus on macroscopic engineering geological analyses to explain the deformation mechanism. Additionally, corresponding physical tests have scarcely been performed. Existing explanations of failure mechanisms and processes in steep rock slopes along bedding planes have not been widely accepted by the academic community.
Quantitative methods for evaluating slope stability primarily include the limit equilibrium method and numerical analysis methods. In the 1970s, the concept of a toppling deformable body was gradually accepted, and scholars began evaluating its stability. Using numerical analysis methods, scholars have applied numerical software to static slope analysis and examined the influence of various factors on slope stability [10,11,12,13]. Liu et al. used pseudo-static methods, dynamic time history analysis, and dynamic strength reduction methods to evaluate the stability of model slopes under load [14,15]. However, the results and precision of this method vary due to the different forms of structure discretization. Using a theoretical model, Amini et al. employed the limit equilibrium method, treating the rock slab as a cantilever beam structure and integrating structural mechanics to establish a stability calculation method for the toppling rock [16,17,18,19,20]. However, this method does not consider the interaction between the rock strips and the sliding surface, and its simplified boundary conditions often result in significant errors. Xia introduced abrupt change theory and elastic plate theory into the evaluation of the stability of steeply dipping stratified rock slopes [21]. Jiang analyzed the critical conditions for the elastic buckling and bending failure of rock slabs, verifying the applicability of both instability models in practical engineering projects [22]. Feng Jun considered the elastic–plastic yield problem of rock slabs and applied elastic–plastic mechanics to the analysis of slope stability [23]. Each of these theoretical methods poses its own limitations, in addition to constraints on applicability. In reality, bedding slopes often lack a clear slip boundary and sufficient space for deformation, implying that the boundaries of instability typically form over a long geological period. During this prolonged creep period, rock masses can undergo significant epigenetic reformation and aging deformation. Therefore, it is crucial to consider the viscoelastic effect of the slope as it changes over time.
2. Statistical Analysis of the Characteristics of Large Bedding Toppling Slopes
In this study, 23 cases of large bedding toppling slopes in China were collected (Table 1), and their development characteristics were statistically analyzed. These characteristics included the elevation, slope angle, lithological conditions, and rock dip angle. Figure 1 shows the topographic maps of each slope region.

Table 1.
Statistical list of developmental characteristics of large bedding toppling mutants.
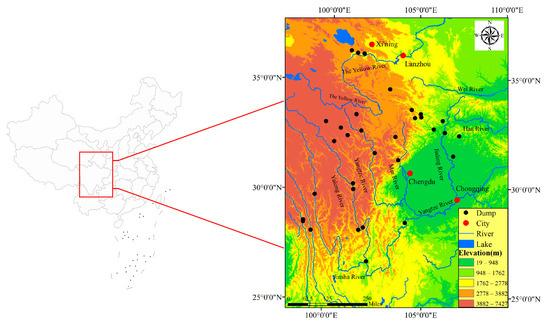
Figure 1.
Development distribution map of large bedding toppling mutants.
- (1)
- Slope elevation
The toppling slopes are primarily distributed along the river basins in deep canyon areas of Western China. Because the bank slope is cut down by the valley, a strong unloading effect occurs, and the slope has the air condition and deformation power for the formation of toppling deformation. The elevation of slopes where toppling often occurs generally ranges from 2000 to 3000 m. These mountains typically have poor integrity of rock mass and intense tectonic activity, making them prone to instability and failure.
- (2)
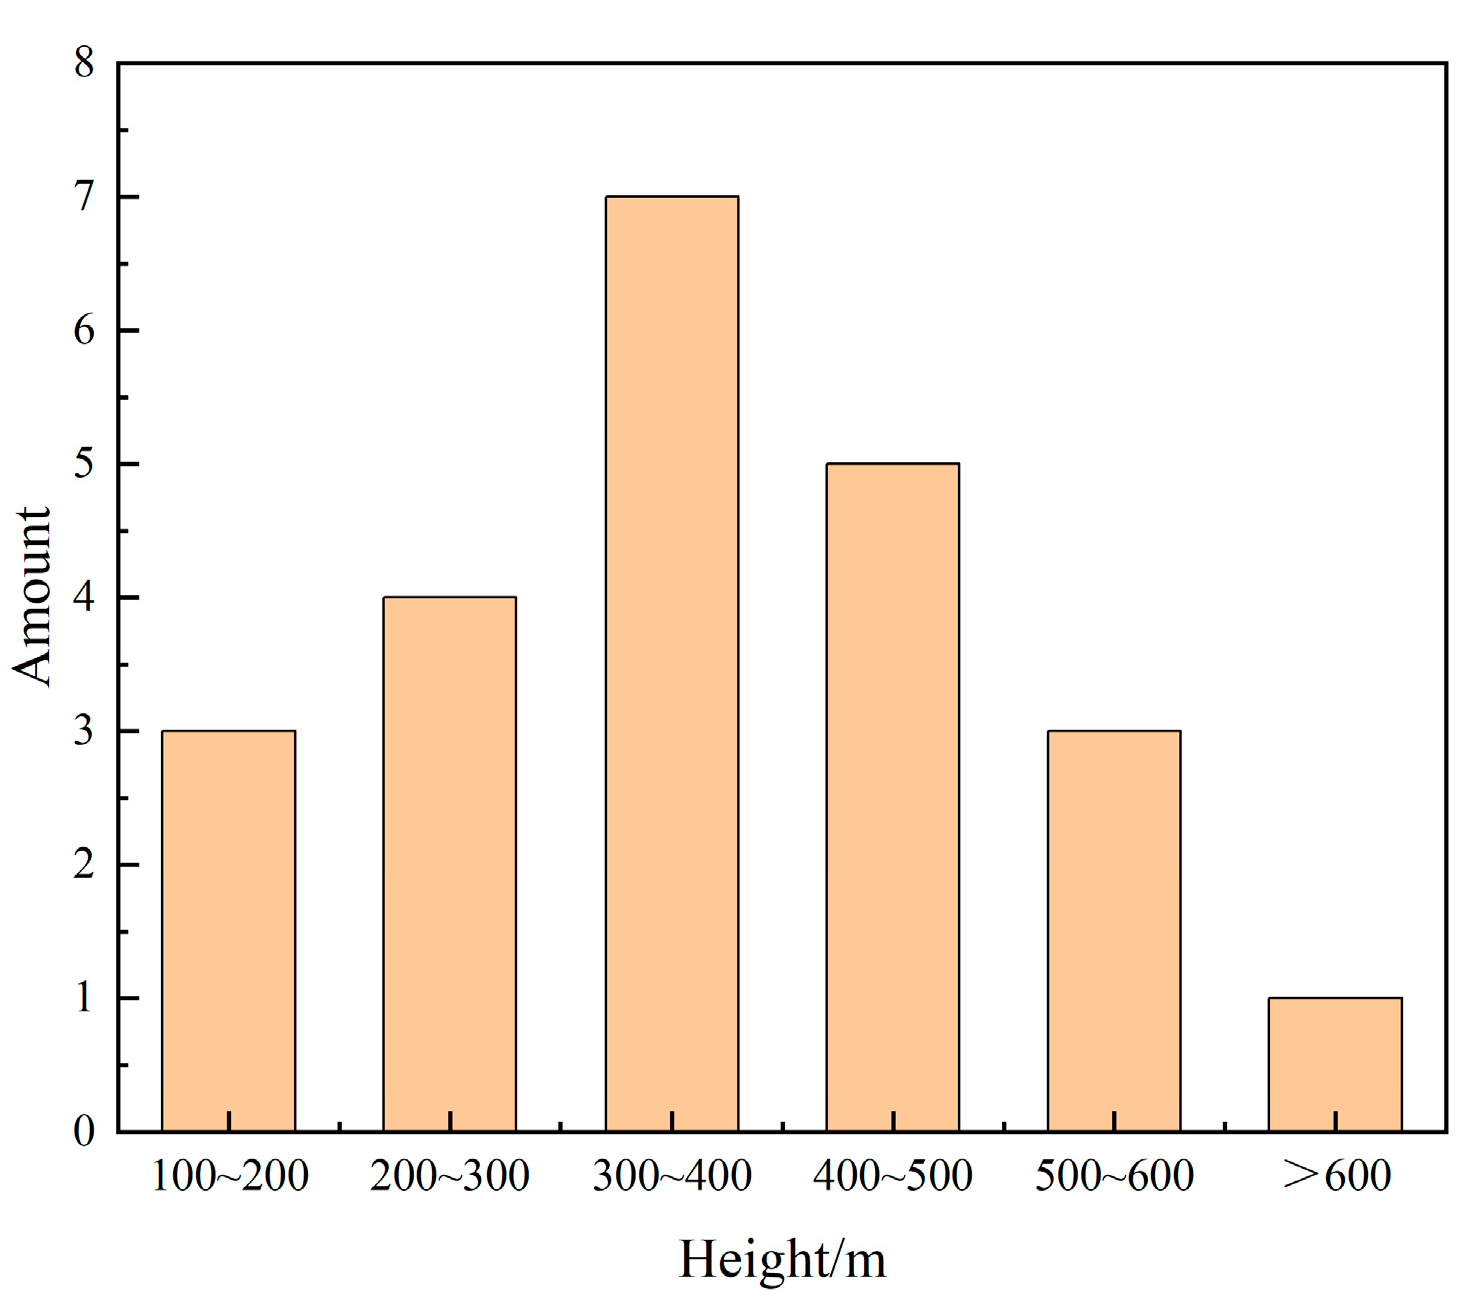
- Slope heigh
The height of the slope reflects the degree of valley downcutting. The deeper the downcutting, the more pronounced the stress differentiation and unloading effects on the slope. Both the “secondary stress” during slope formation and the “unloading stress” caused by valley downcutting contribute to the toppling deformation of the slope. As shown in Figure 2, statistical analysis of typical cases indicates that 70% of bedding toppling deformation slopes exceed 300 m in height. Therefore, toppling deformation and failure of steep bedding slopes primarily occur in high and steep slopes, especially along rapidly downcutting river valley banks.
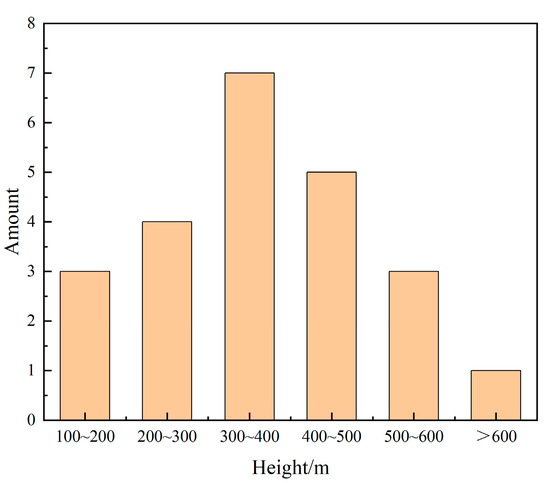
Figure 2.
Distribution characteristics of bedding toppling slope height.
- (3)
- Rock dip β and slope angle α
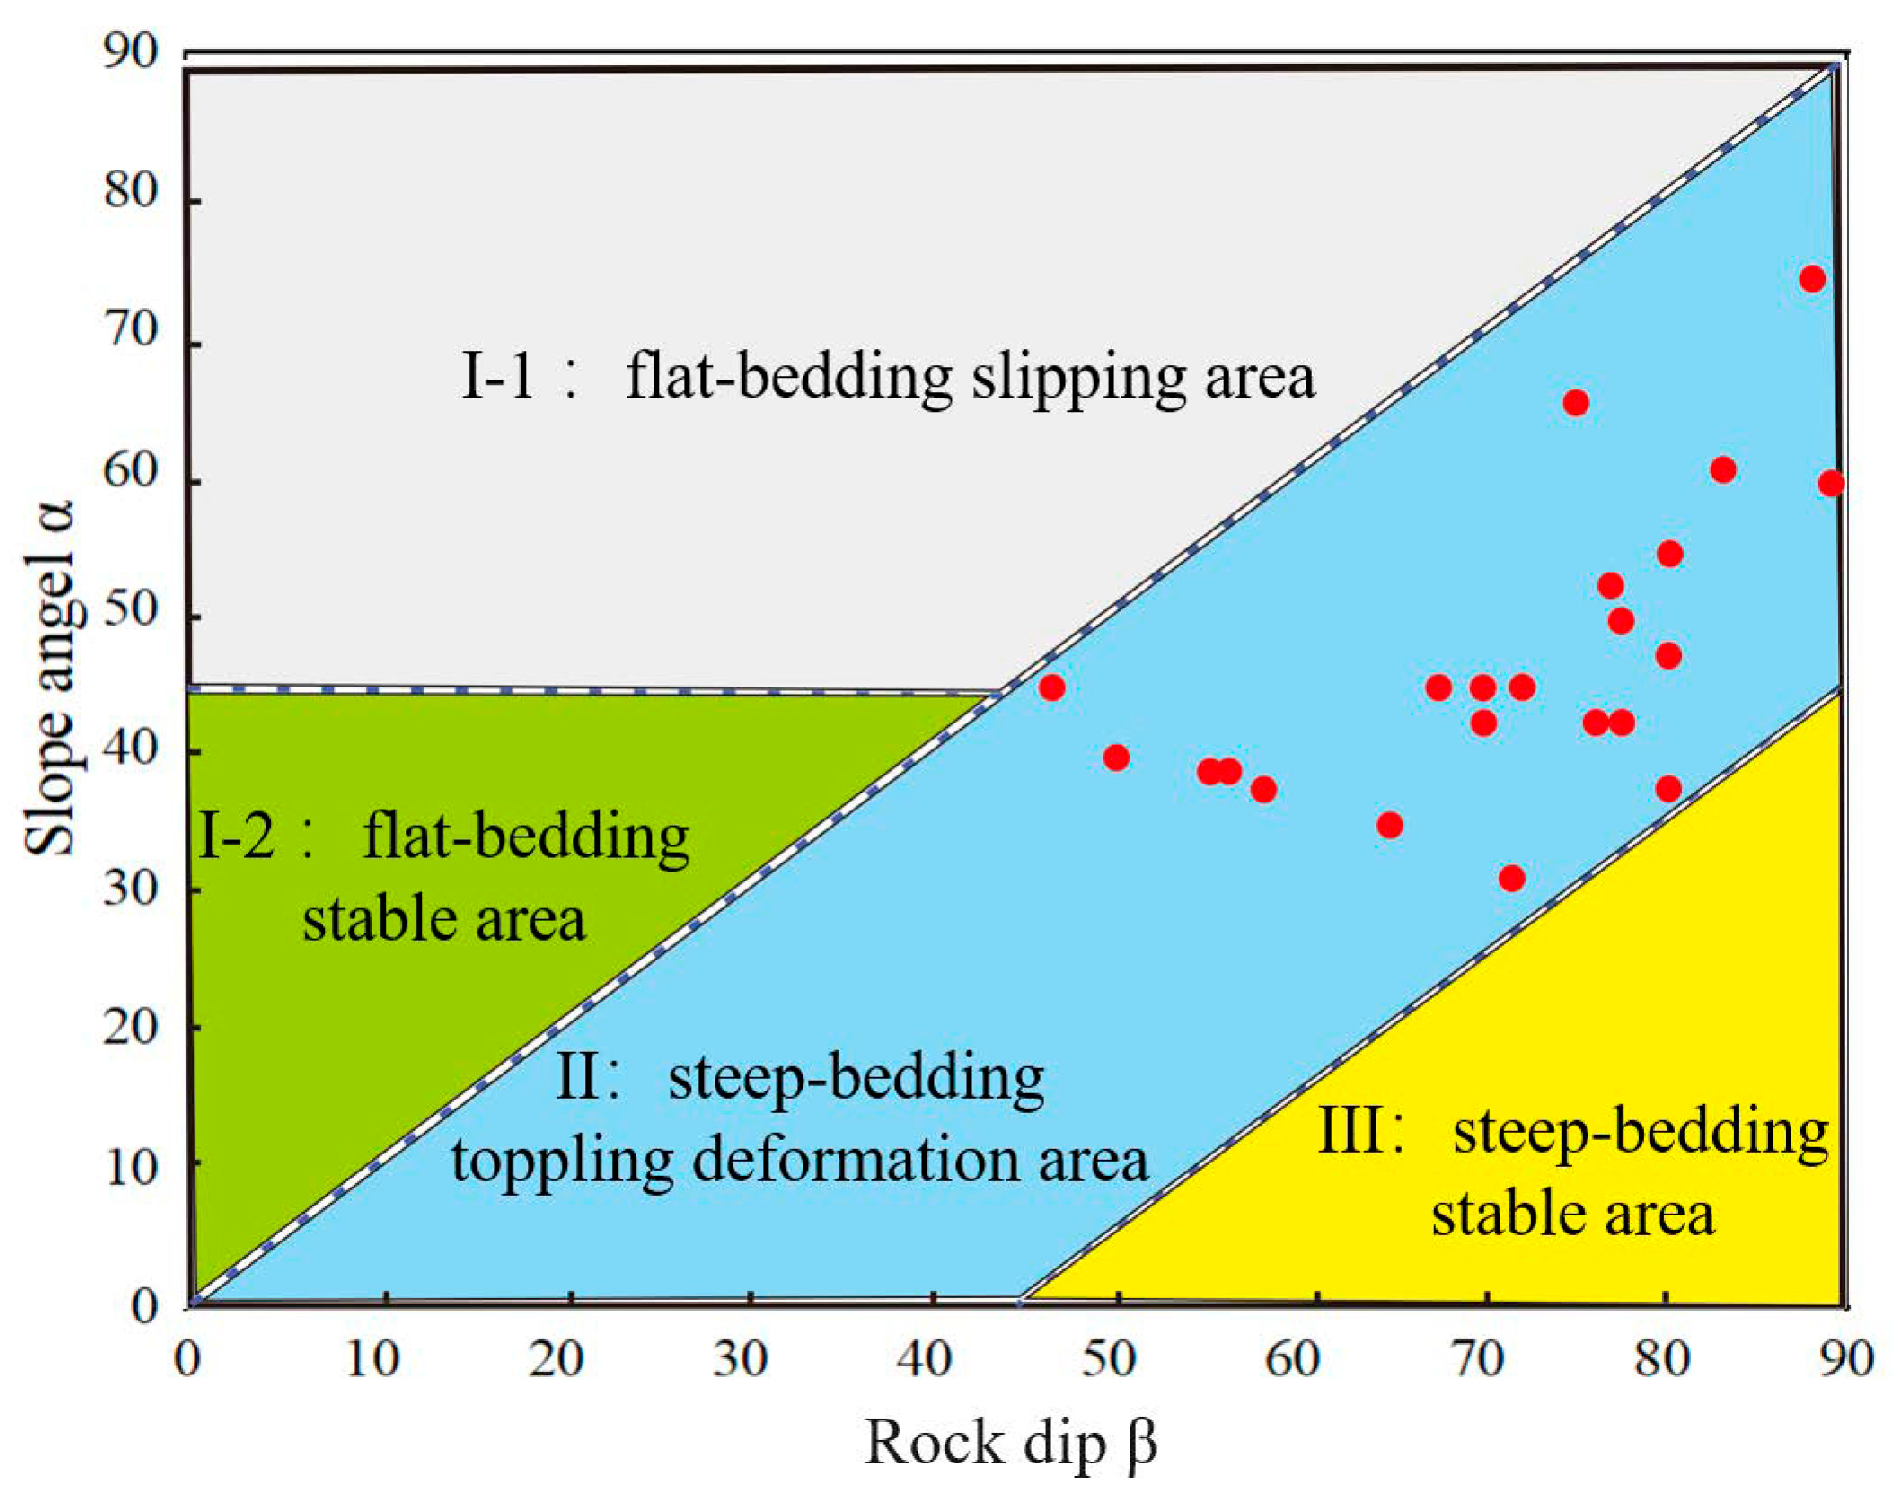
In this paper, for any rock mass strip in the bedding toppling slope, the cohesion c and the internal friction angle φ of the rock mass are replaced by an equivalent internal friction angle φm (where φm > φ), such that
When and , the slope is unstable. At this time, for α, β, and φm, from the statistical results of the case (Figure 3), we obtain
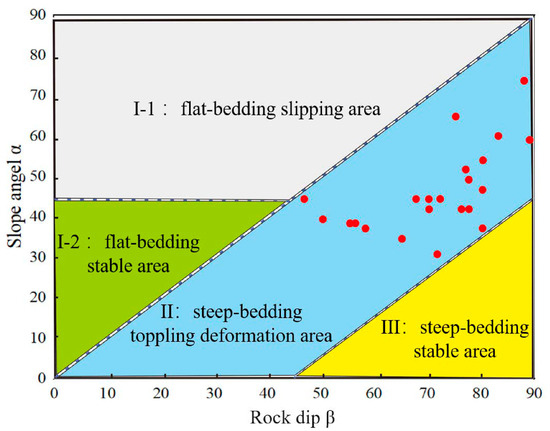
Figure 3.
Case statistics of rock dip angle and slope angle by bedding toppling slope.
According to the 23 typical cases of bedding toppling deformation selected herein, slopes under unstable conditions are divided into three categories, as shown in Figure 3. The bedding toppling slope has the following typical characteristics: the toppling instability of the bedding slope occurs in the case of steep rock dip angles, which are generally concentrated in the range of 70° to 80°. The side slope angle typically ranges from 30° to 50°.
- (4)
- Lithology
Based on the 23 typical cases of bedding toppling deformation analyzed herein, it is evident that 15 of the slopes consist of “soft and hard interbedded rock”, indicating that bedding toppling slopes primarily occur in such interbedded formations. Bedding rock slopes can be classified into three types: “soft rock controlled”, “hard rock controlled”, and “soft and hard interphase”. Different lithological conditions have distinct effects on the deformation of bedding slopes. The characteristics of the toppling slope and failure mechanisms under these three lithological conditions are analyzed.
For the “soft rock controlled” slope, deformation in the rock mass primarily occurs in the vertical direction, initiating relative slip between the layered rock masses. As “slippling-bending” deformation intensifies, the lower rock strata undergo secondary toppling, gradually forming reverse toppling, which is exacerbated by extrusion forces. When the rock strata in the middle and lower parts of the slope begin to bend and fracture, the upper strata undergo shear failure, leading to overall slope instability.
For the “hard rock controlled” slope, the rock mass gradually unloads outward, with internal stress relaxing and shear strength decreasing as the valley is cut deeper. Under maximum principal stress, the slope deforms, with the rear edge cracking and bending outward, and the rock mass gradually forms a “cantilever beam” bending phenomenon. This results in brittle deformation and tensile fractures, forming discontinuous tension fracture surfaces. Ultimately, the maximum bending points in each layer link together.
For the “soft and hard interphase” slope, differences in the elastic modulus between soft and hard rock cause varying degrees of rebound and bending deformation as the valley deepens. As deformation intensifies, the rock strata press against each other and undergo differential movement, forming a combined compression–shear deformation. Shear forces create fracture surfaces deep within the slope. Over time, uncoordinated deformation between the soft and hard rock layers leads to expansion, with deformation extending from the interior to the slope surface, accompanied by rear edge stretching. The tension-driven bending and toppling of rock masses intensify, and the fracture surface expands and connects.
3. Slope Toppling Deformation Process Simulation
3.1. Experimental Summary
- (1)
- Slope prototype
The prototype is based on a typical toppling deformation slope—the Donuo Hydropower Station slope. The dam site of Duonuo Hydropower Station is situated in the upper reaches of the Heihe River, approximately 50 km from the estuary and 74 km from Jiuzhaigou County. The reservoir’s normal water level is 2370 m, and the dead water level is 2320 m. Toppling deformation is evident near the right bank of the dam. The geological prototype of this area can be summarized as follows: toppling deformation occurs on a cross-slope composed of alternating hard and soft rock layers within steeply dipping bedding. The slope surface displays cracks caused by unloading, water storage, and seismic activity. The slope is divided into three zones: a toppling loose zone, a toppling weak loose zone, and a toppling zone. The geological model of the toppling deformation slope is shown in Figure 4.
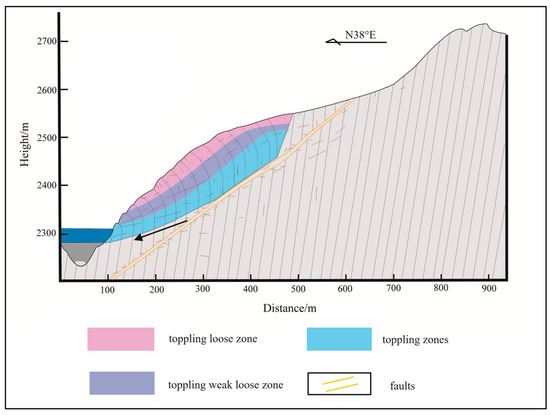
Figure 4.
Geological model of toppled deformable slope.
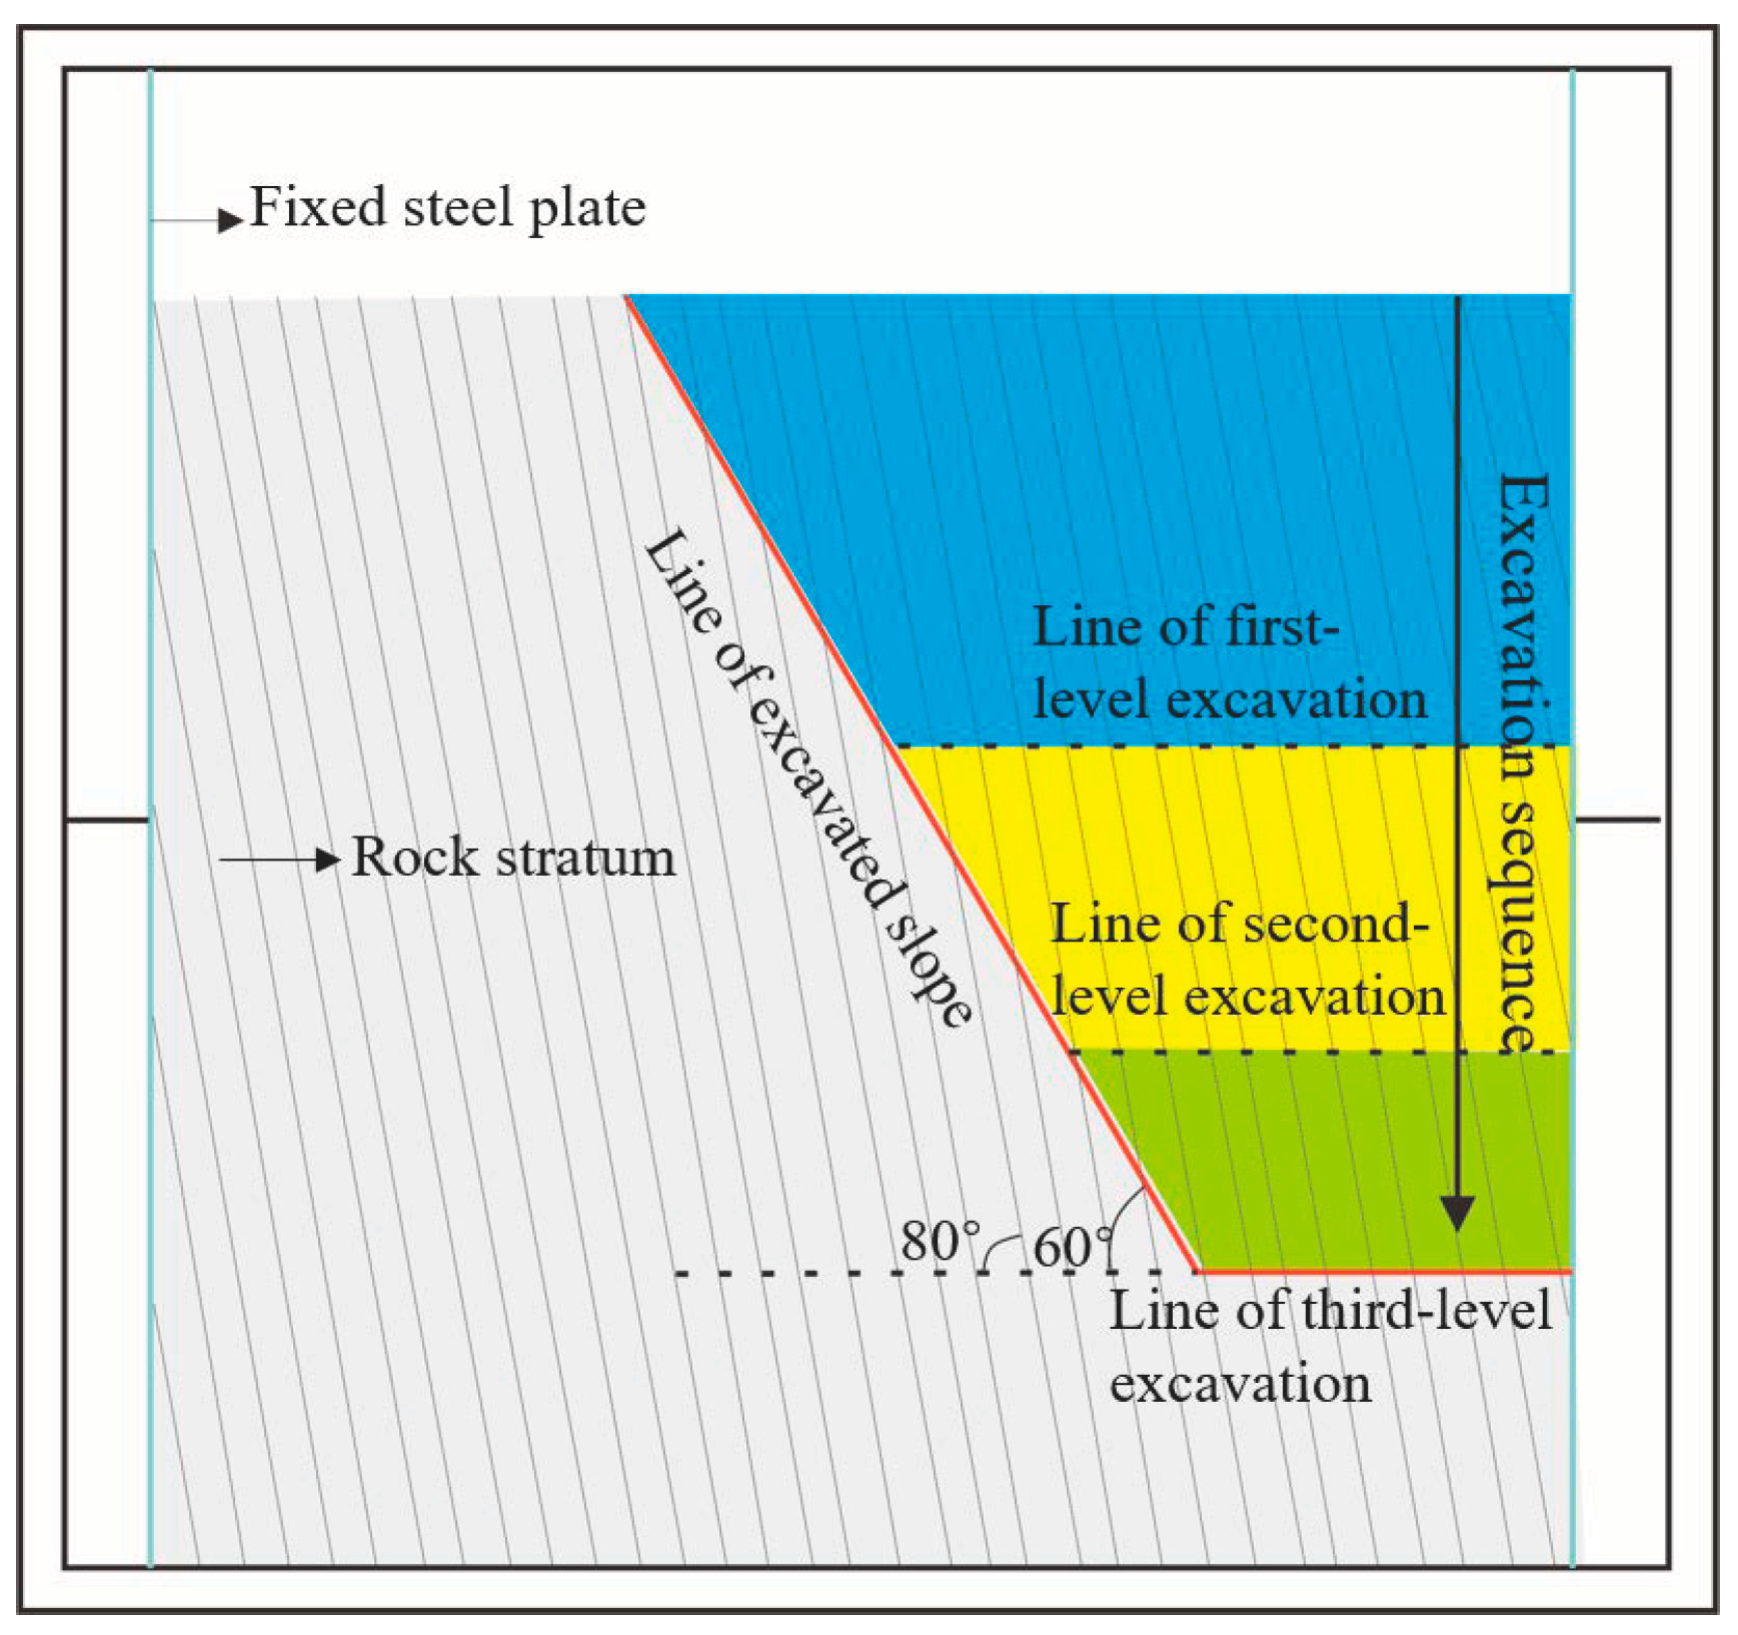
The physical simulation test model is rectangular, measuring 800 mm in length, 600 mm in height, and 8 mm in thickness. The rock formation inclination is 80°, while the simulated excavation slope angle is 60°, with the excavation point located 350 mm from the left boundary. The first-level excavation line (representing river downcutting) has a depth of 200 mm, followed by the second-level excavation line of 200 mm and the third-level excavation line of 100 mm, as shown in Figure 5.

Figure 5.
Schematic of test model.
- (2)
- Test principle
The bottom friction simulation test is a two-dimensional physical simulation and must adhere to the fundamental similarity principle of physical modeling. The model is designed to closely resemble the research object. To ensure accuracy, the bottom friction model must satisfy specific relationships in terms of geometry, force conditions, and friction coefficient.
- ➀
- Geometric similarity constant:
- ➁
- Force condition similarity constant: or
- ➂
- Coefficient of friction similarity constant: .
where the subscript with H represents the prototype, and the subscript with M represents the model. The relationship between the similar constants mentioned above is determined using Equation (2):
- (3)
- Instrument and equipment
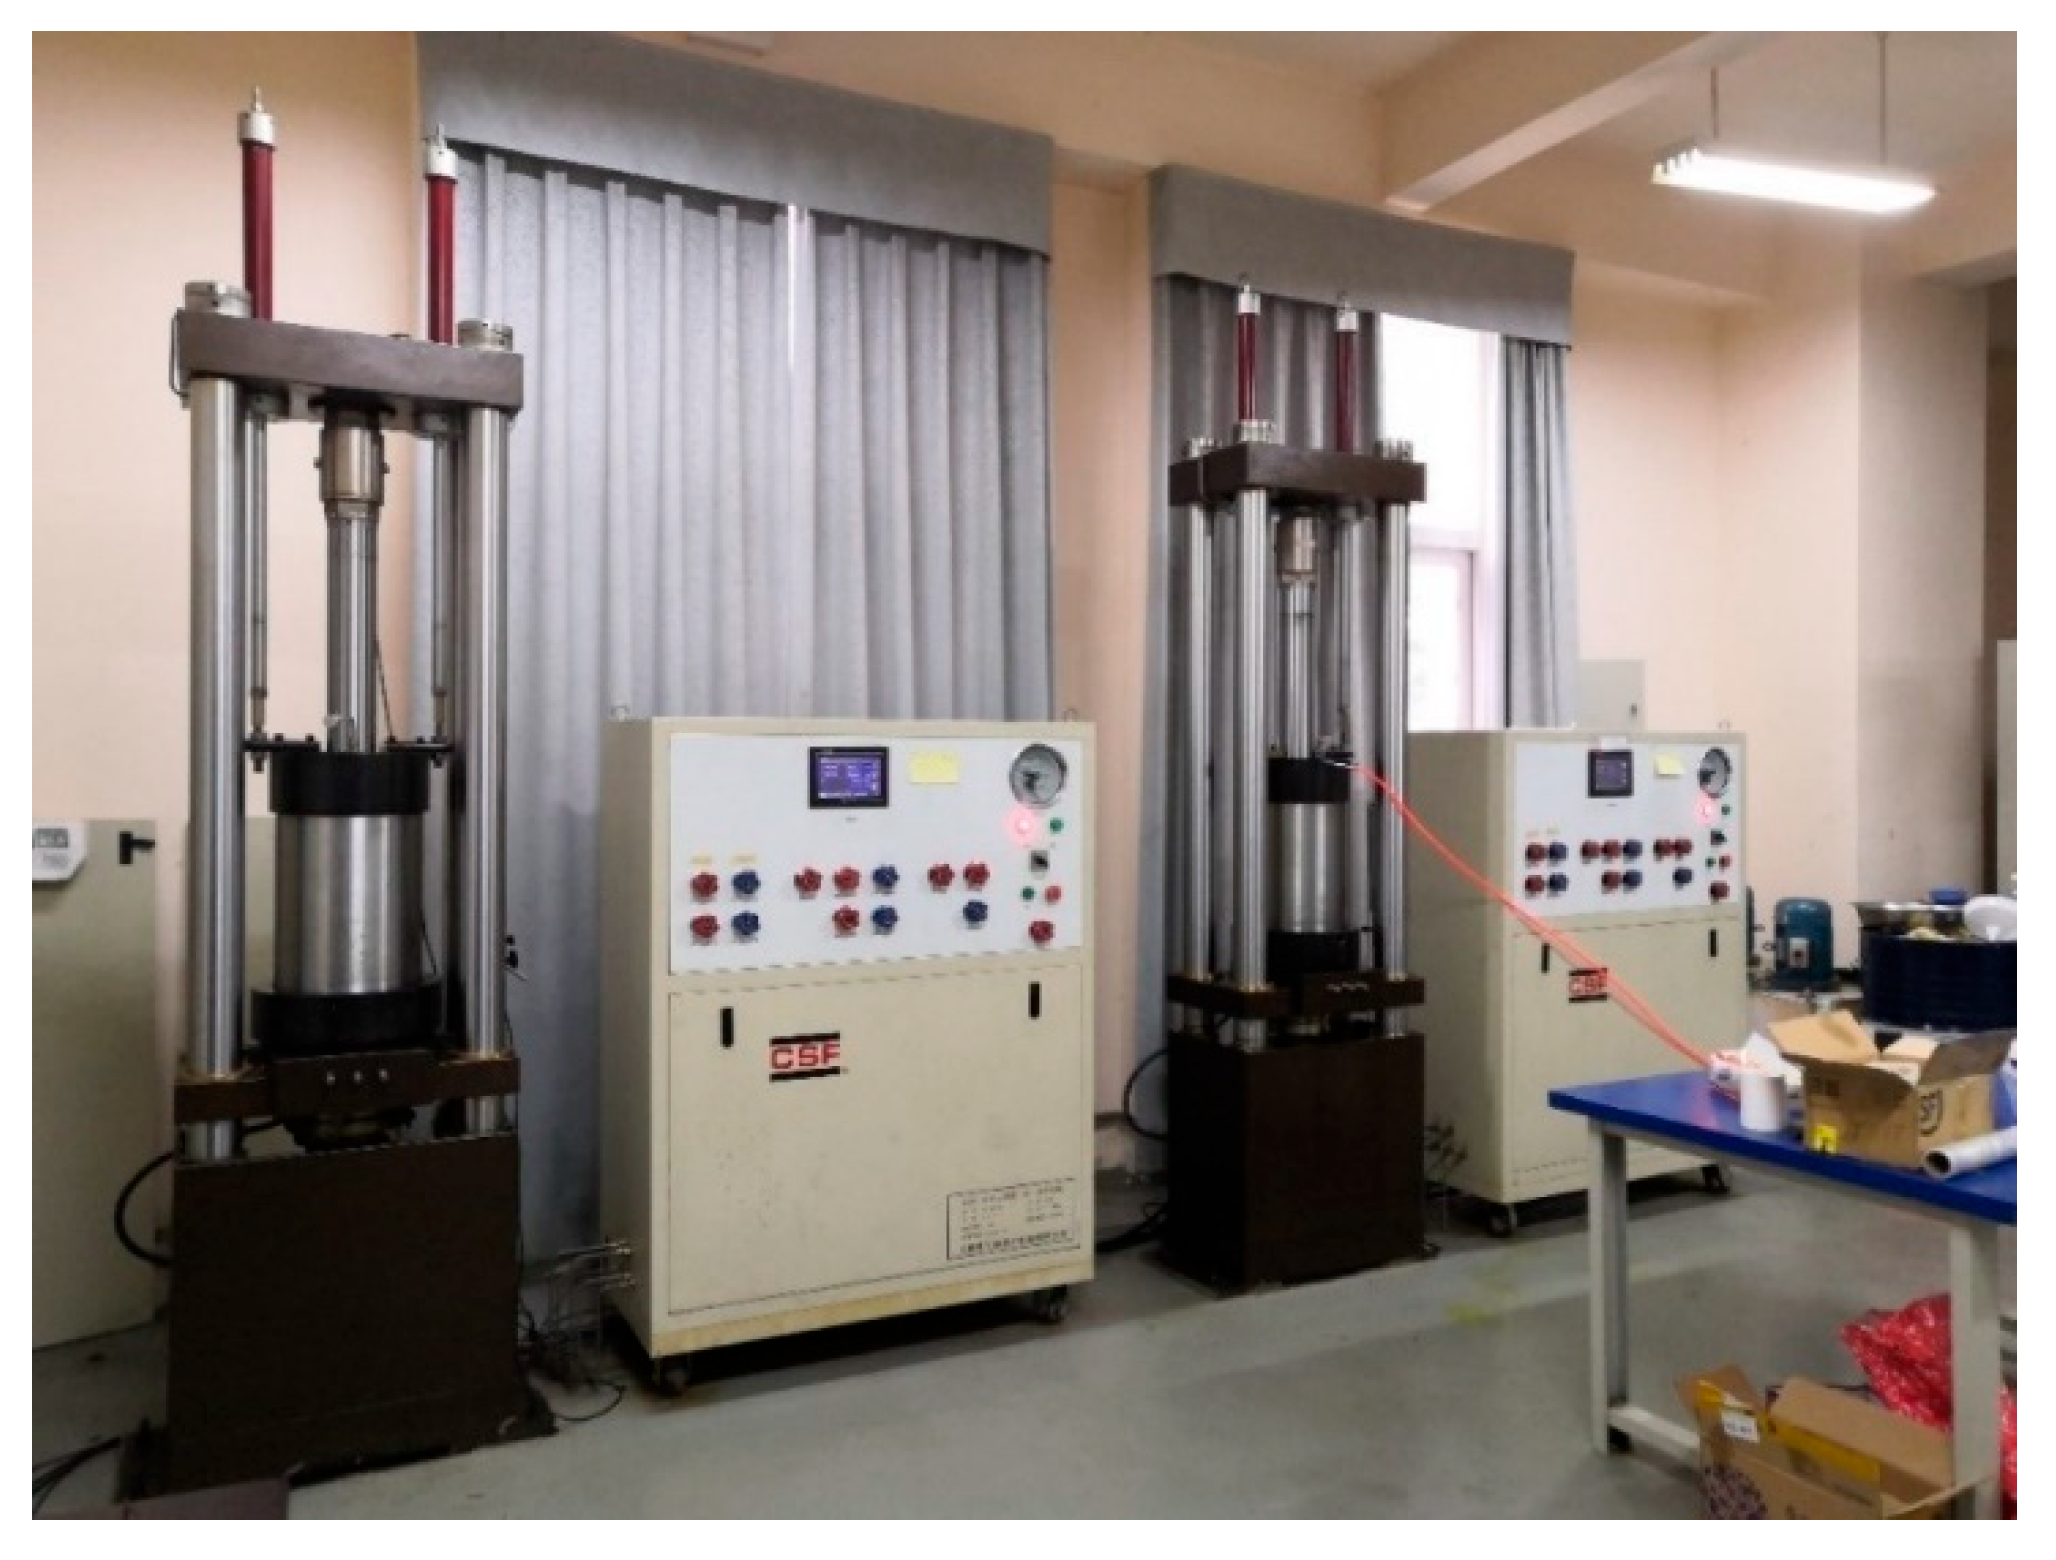
As shown in Figure 6, the bottom friction simulation tester in the State Key Laboratory of the Chengdu University of Technology and the high-speed camera were used to record the relevant phenomena.

Figure 6.
Bottom friction simulation tester and monitoring system.
3.2. Model Material and Test Process
- (1)
- Experimental material
The materials used in the bottom friction test mainly include barium sulfate (BaSO4), quartz sand (SiO2), and paraffin oil. The mixing ratio's corresponding mechanical parameters are shown in Table 2.
Table 2.
Strength parameters of similar materials.
- (2)
- Experimental process
The test was conducted in three excavation stages to simulate the valley-cutting process as follows.
First-level excavation: The complete model was initiated, and the instrument was activated. After pre-consolidation was completed, excavation was carried out along the designated excavation line. The system then accelerated steadily and uniformly to a specific speed range. The tape running speed was 0–30 r/min, and deformation and damage were recorded throughout the test.
Second-level excavation: Following the first-stage excavation, the test continued at a constant speed until slope deformation stabilized and no further movement was observed. The second-stage excavation was then performed using the excavation acceleration instrument, with deformation characteristics and damage recorded.
Third-level excavation: Once deformation from the second-stage excavation stabilized, the third-stage excavation was carried out. The test proceeded until slope failure occurred, with the test phenomena and failure characteristics recorded.
3.3. Experimental Result
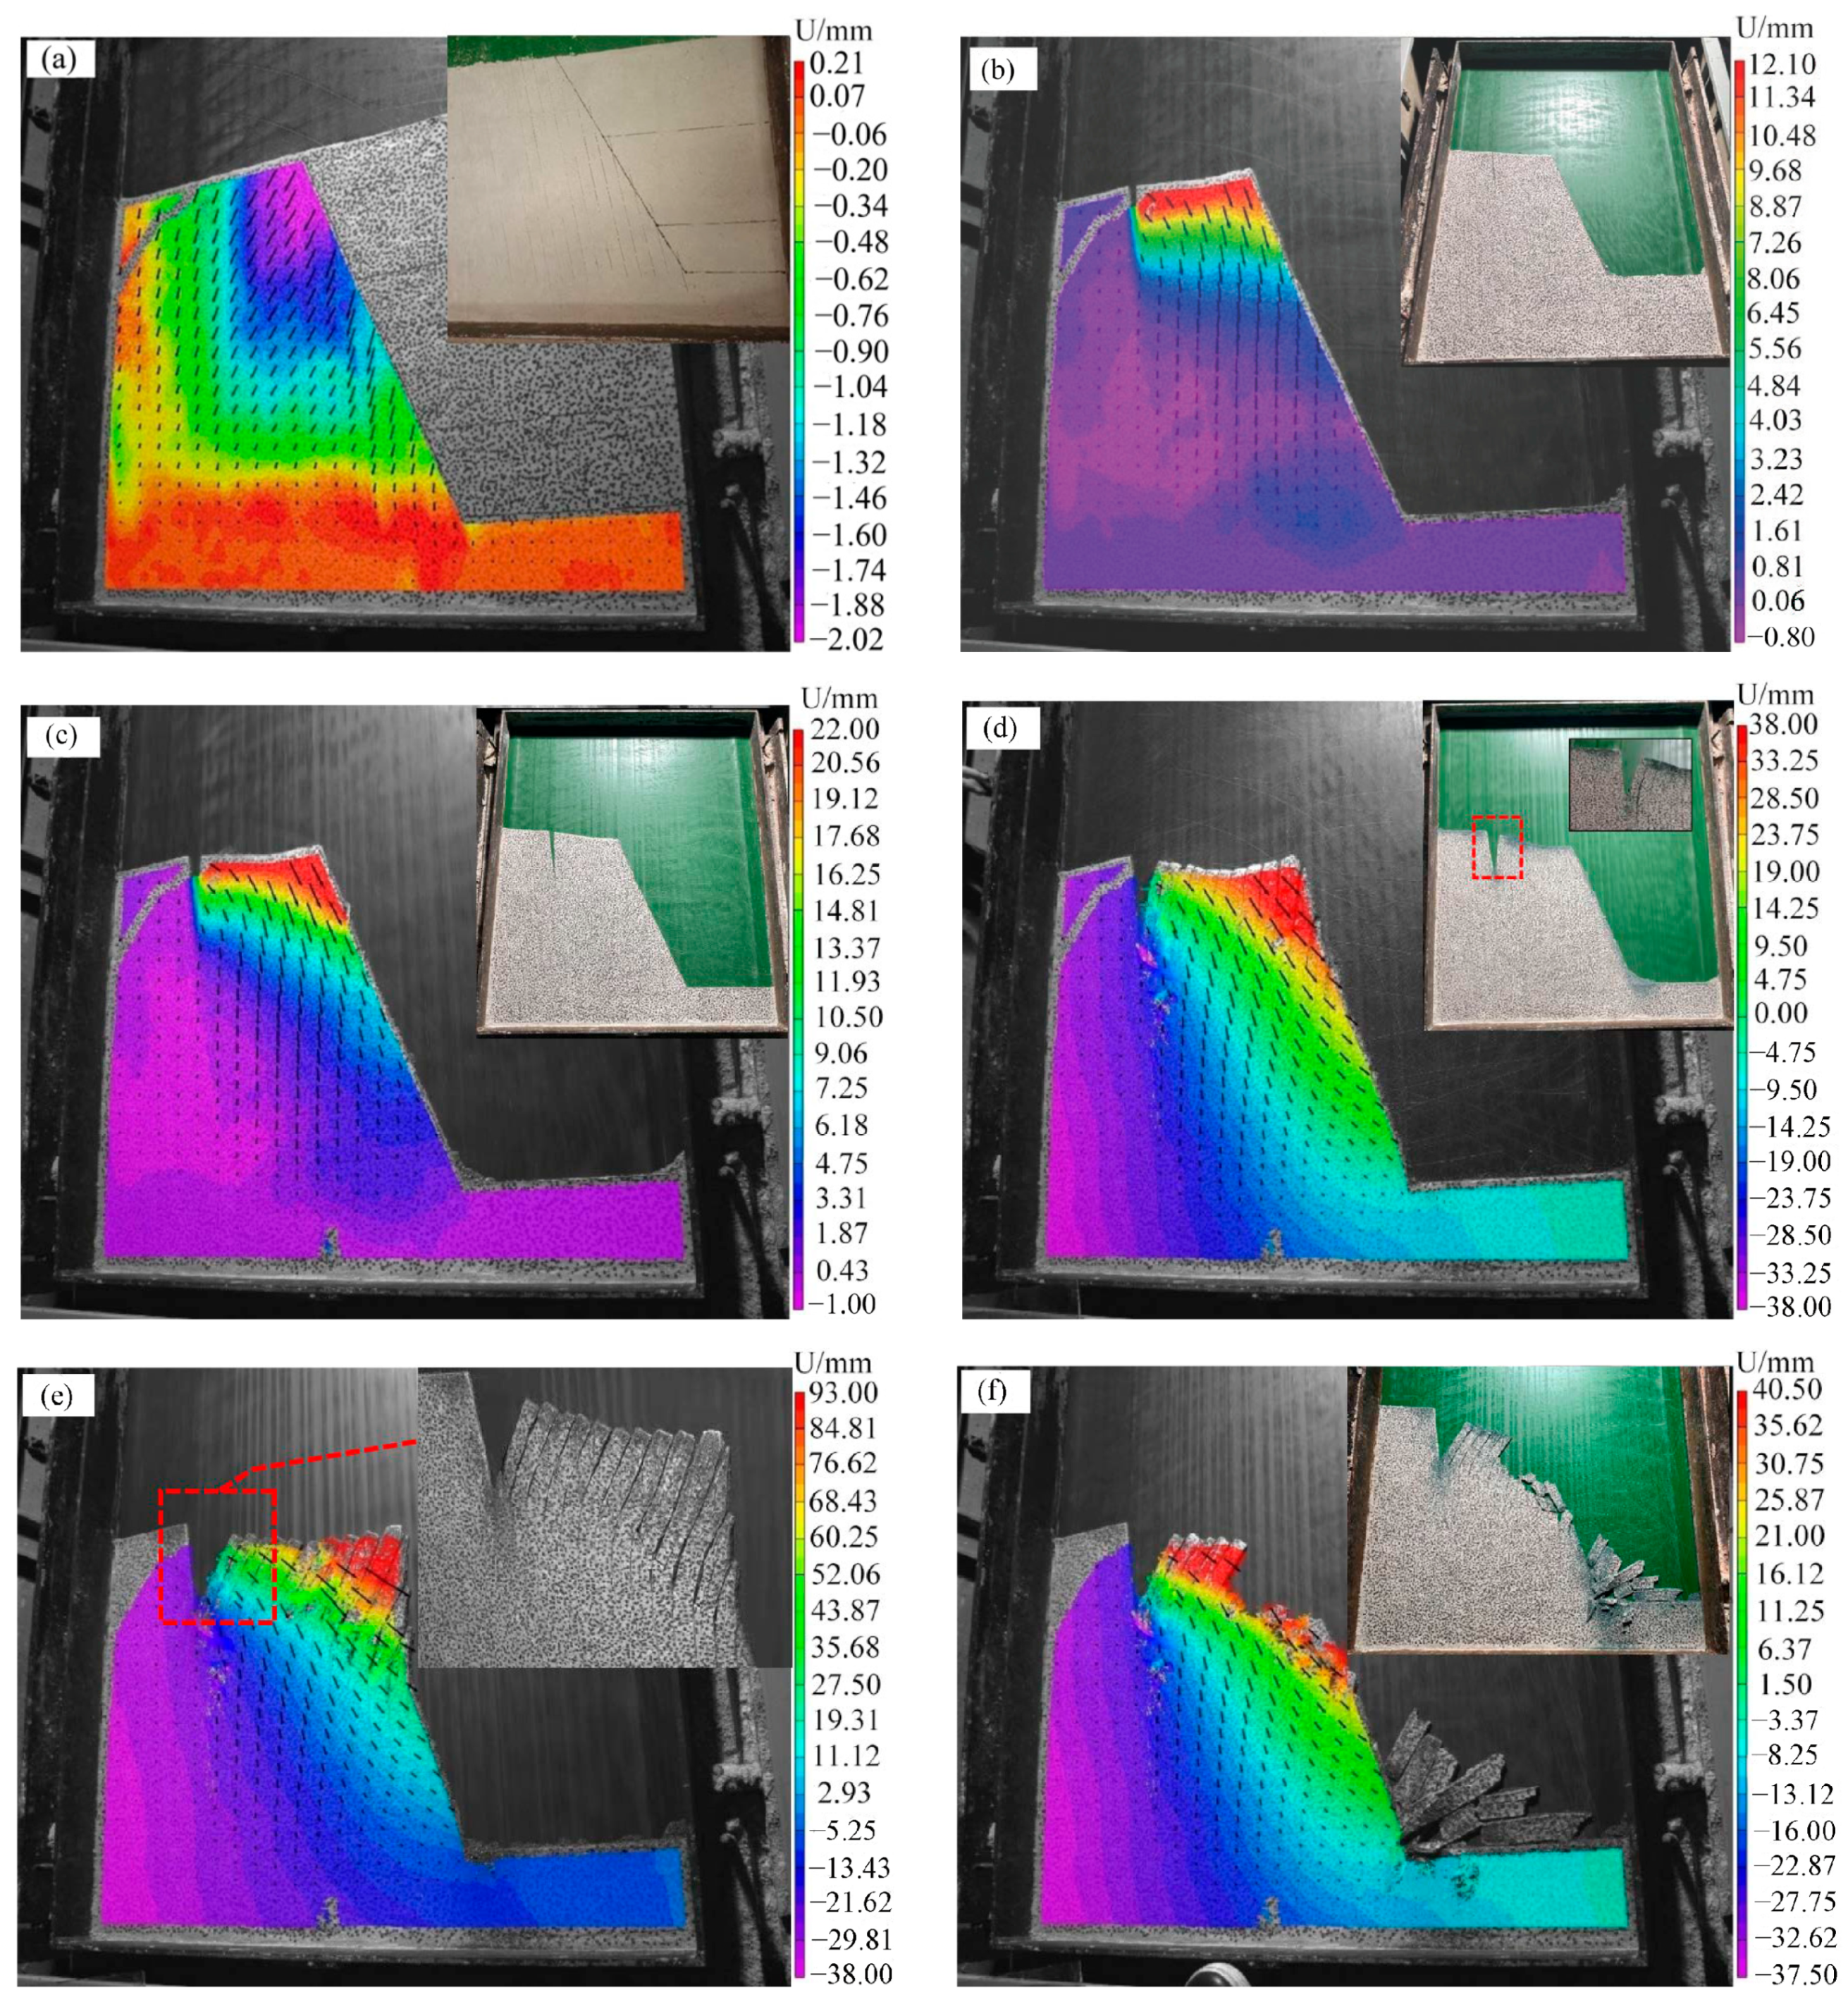
No significant deformation or damage was observed in the model within 0 min, as shown in Figure 7a. After excavation was completed and the instrument was operated for 30 min, deformation began under the influence of model friction. The displacement reached its maximum value of 12.1 mm at the slope shoulder, as shown in Figure 7b. Tensile cracks appeared at the back edge of the slope, indicating the presence of a tensile stress zone between the rock layers. After the deformation phenomena, such as cracks, stabilized, the tensile cracks at the back edge of the model gradually extended toward the middle of the slope as the machine continued to operate. The bars at the front of the slope exhibited bending deformation, with the degree of bending increasing over time, as shown in Figure 7c,d. At this point, the maximum displacement at the slope shoulder reached 38 mm.

Figure 7.
Toppling deformation and displacement field process of steep bedding rock slope model: (a) 0 min (complete and undeformed); (b) experiment carried out for 30 min, (c) 70 min, (d) 120 min, (e) 210 min, and (f) 360 min.
After running the machine for 2 h, under the influence of the simulated gravity field, the rock mass near the slope foot progressively collapsed toward the exposed surface. Under the bending moment generated by the initial disturbance, the stratified tensile fracture developed, and the stratified rock mass bent due to obstruction at the lower part. After bending to a certain extent, the rock layer gradually fell onto the exposed surface. After 3.5 h of operation of the deformation of the model, the displacement peak at this point reached 93 mm, as shown in Figure 7e. Transverse cracks appeared in the rock at the location of the largest bend, and the slope body began to creep along the fracture surface, eventually resulting in creep slip–tensile failure, as shown in Figure 7f.
3.4. Geological Evolution Process of Slope Instability
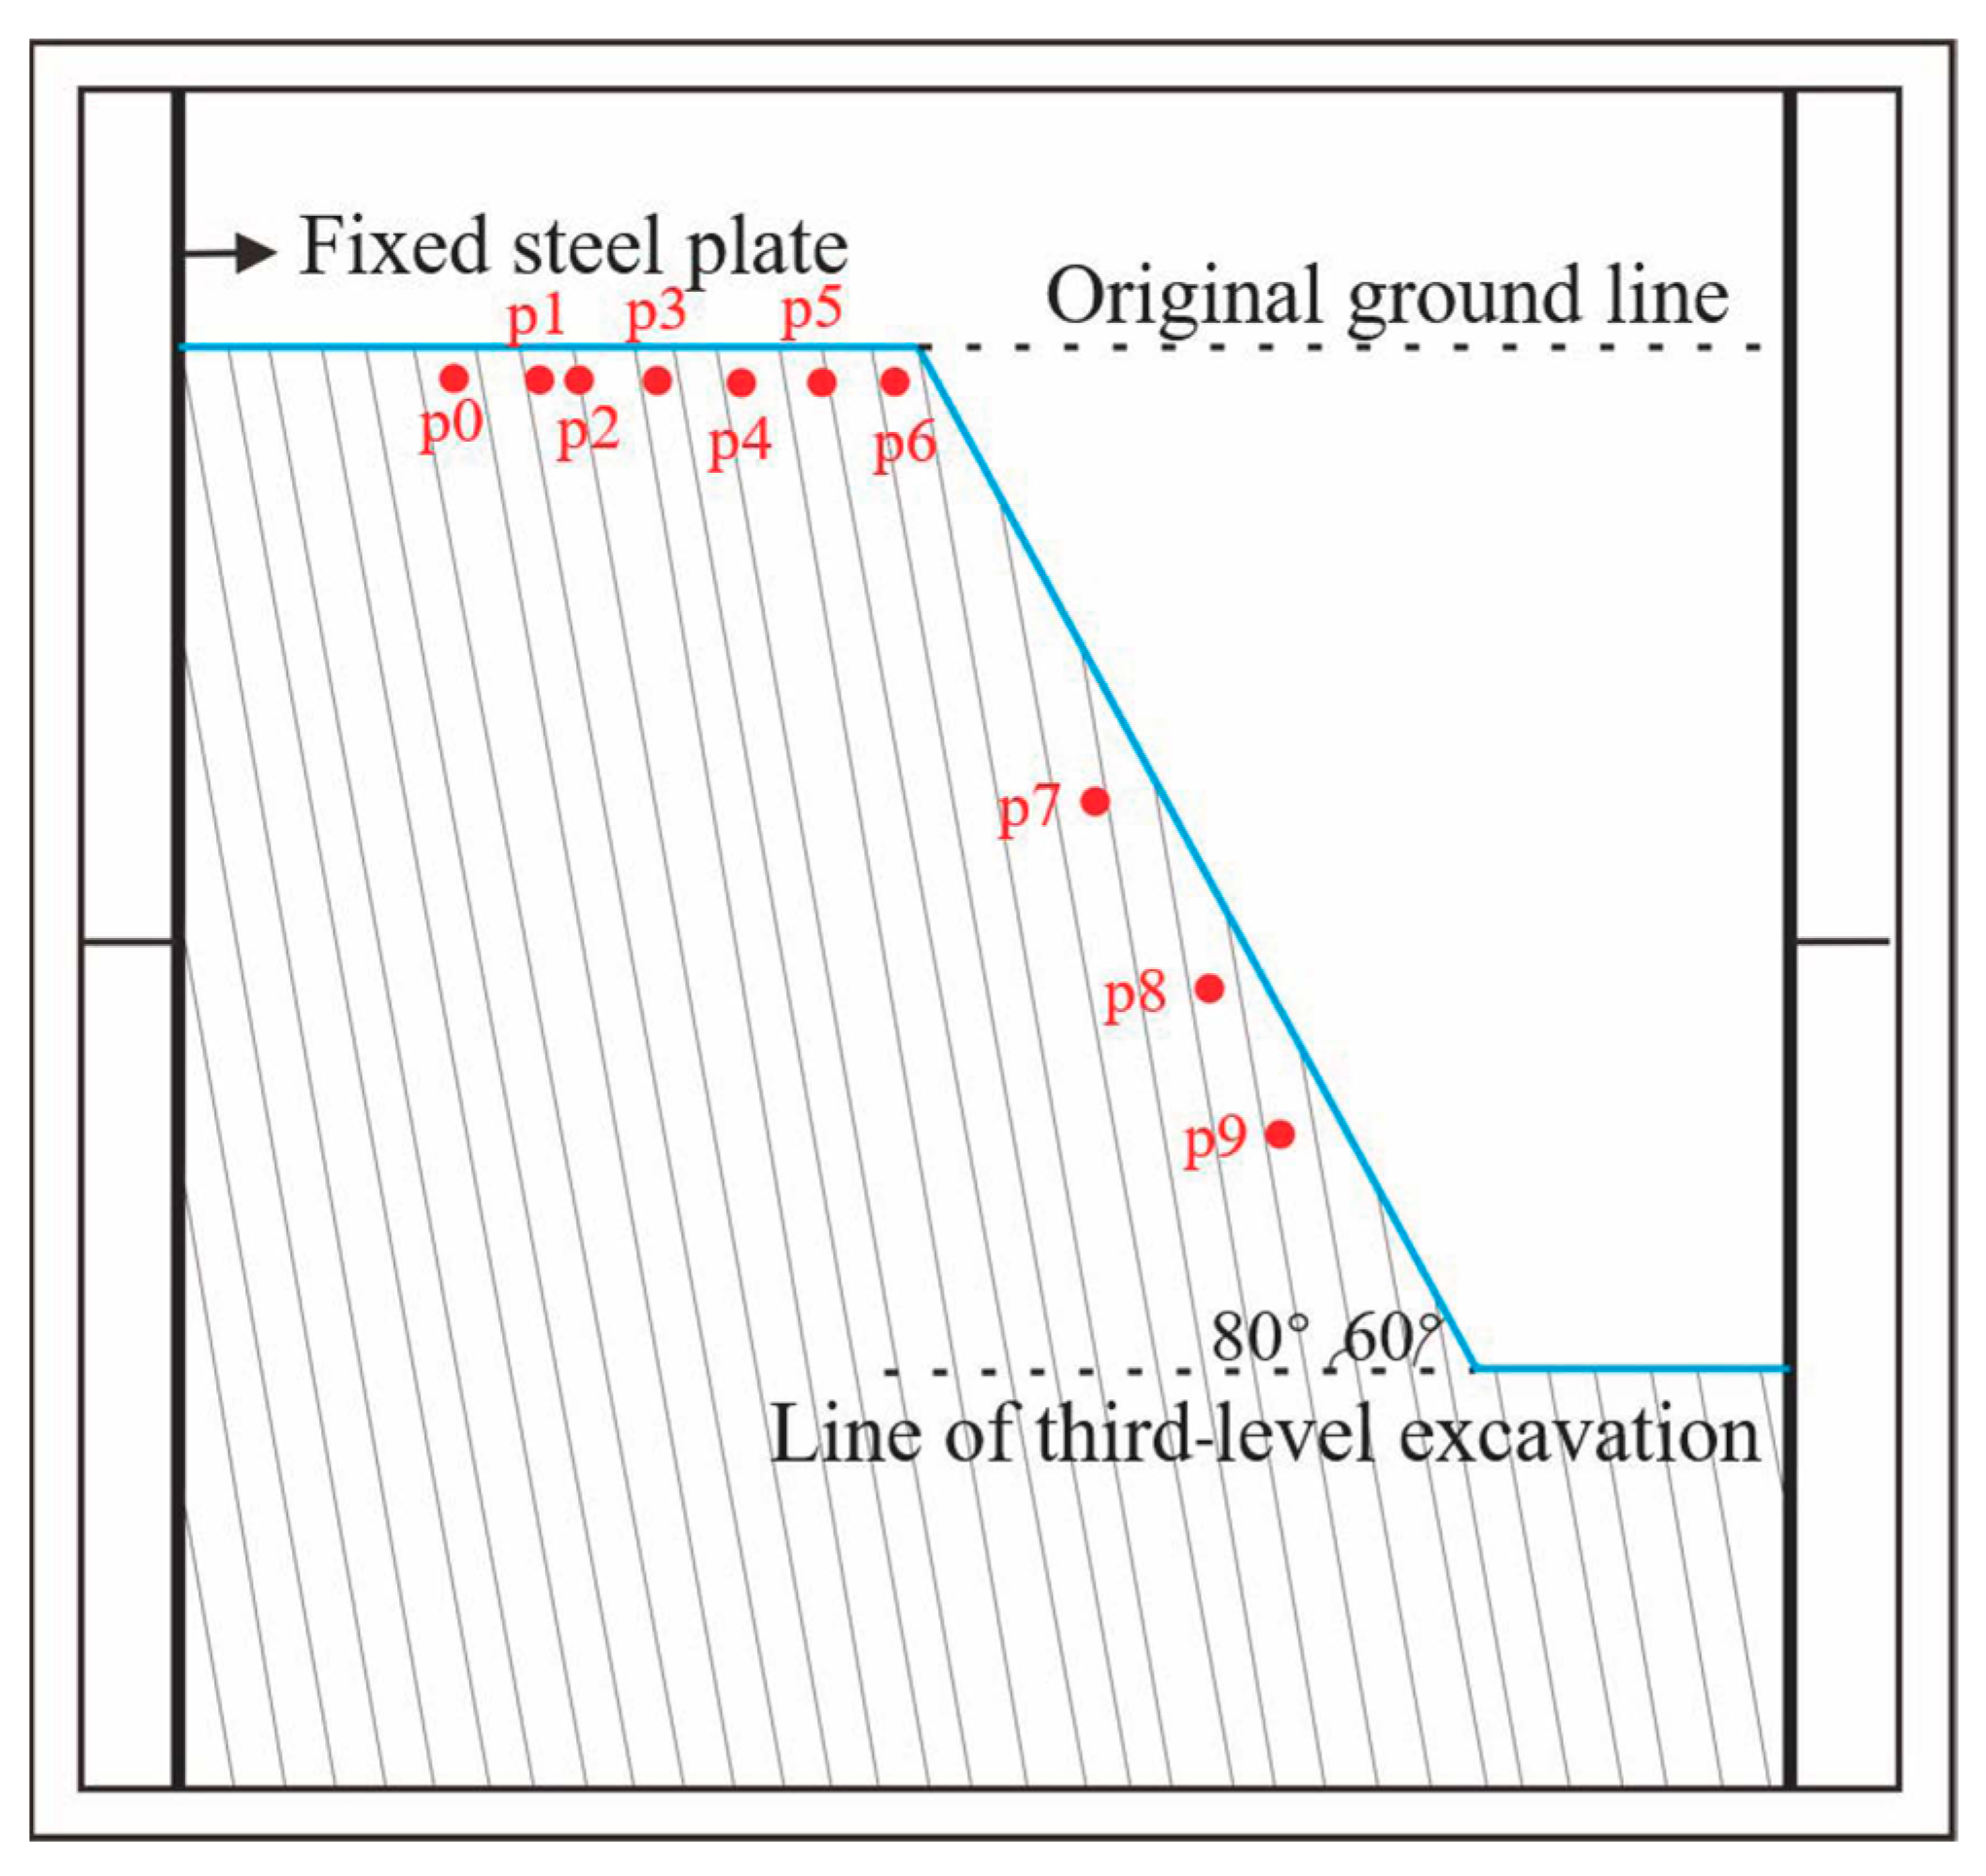
Based on the macroscopic deformation and failure results of the model test, 10 monitoring points were selected from different parts of the test model to analyze the overall deformation process. The monitoring points were distributed across the top and slope surface, as shown in Figure 8.
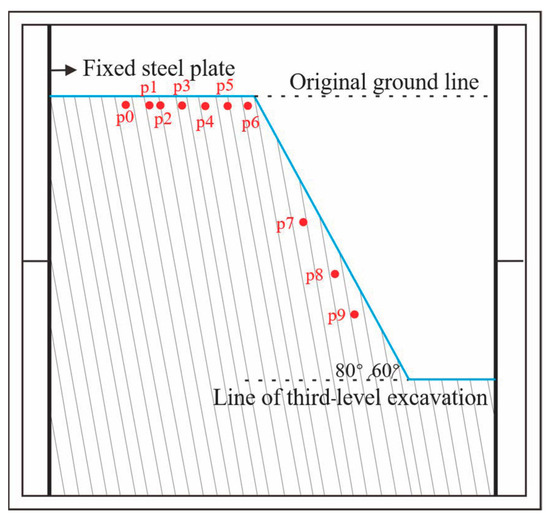
Figure 8.
Location distribution of monitoring points.
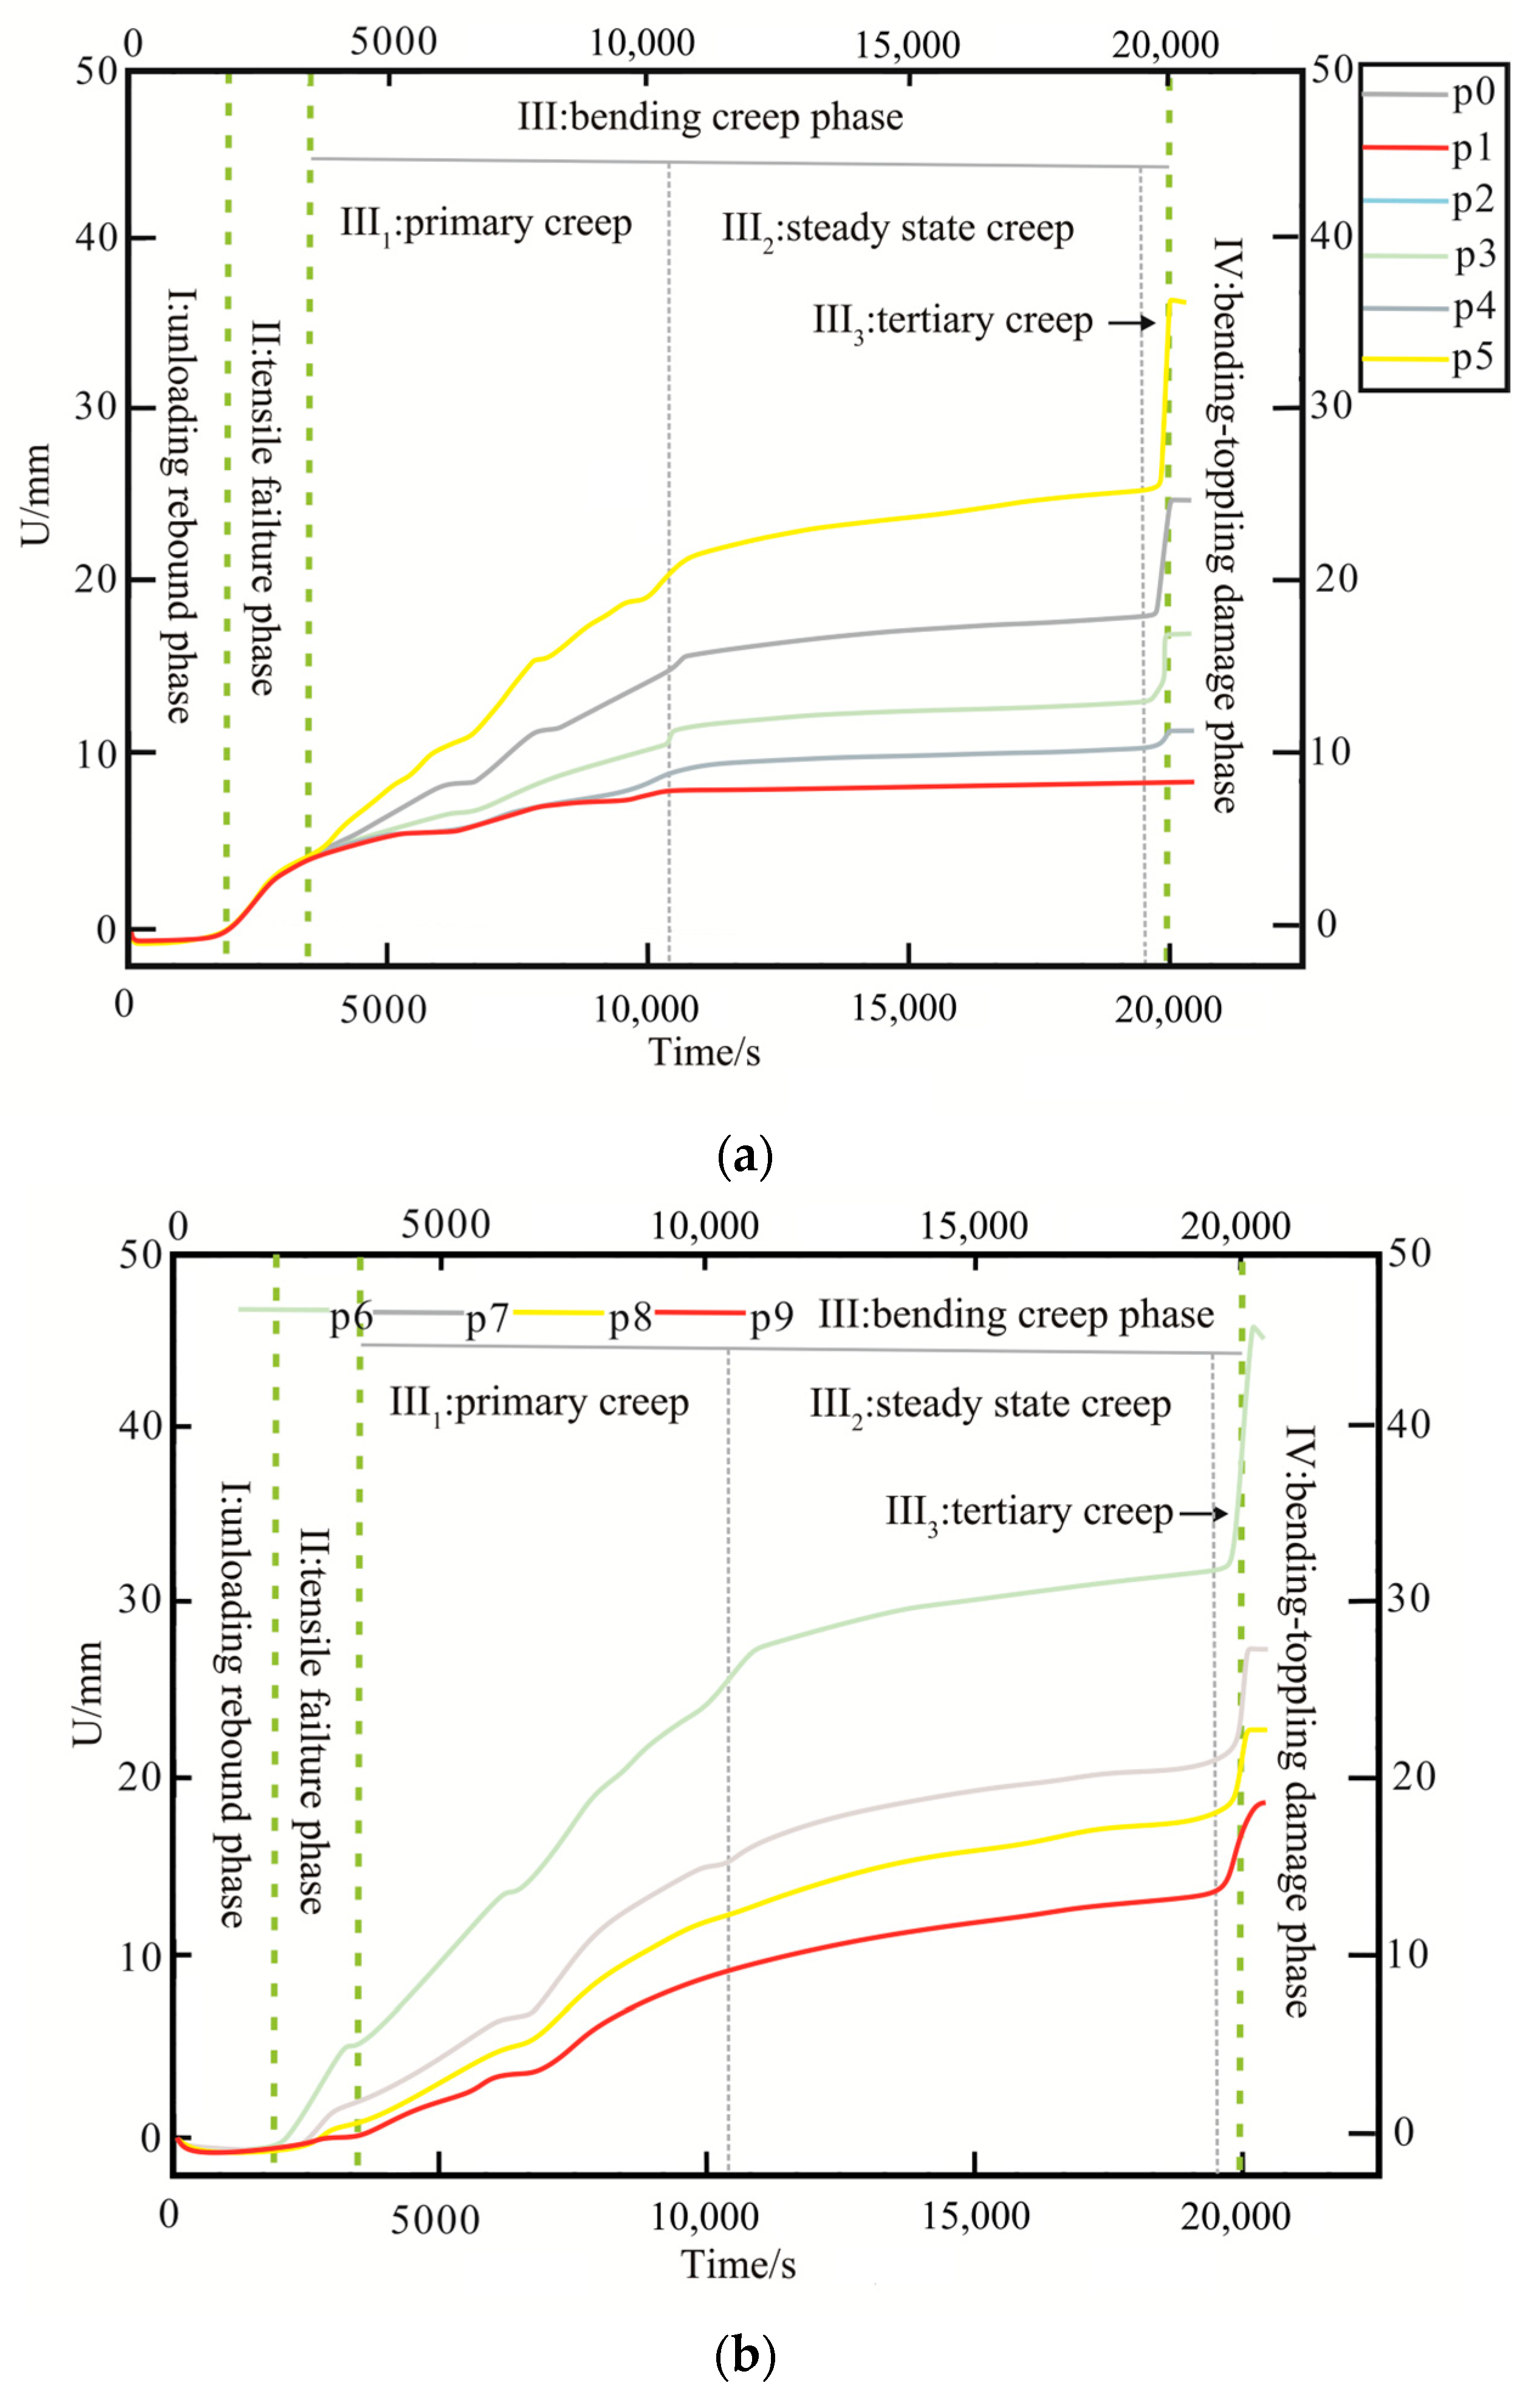
Based on the instability geological model, the deformation characteristics of test points, and the bottom friction test process, the evolution mechanism of deformation failure and the instability model can be summarized into the following five phases, as shown in Figure 9.
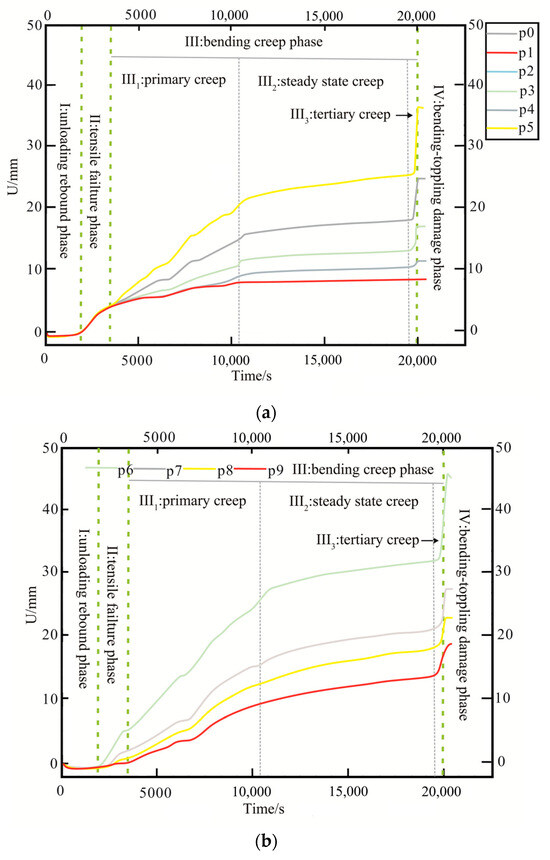
Figure 9.
Lateral displacement–time curve of the monitoring point: (a) point at top of slope; (b) point at slope surface.
- (1)
- Initial phase
When the rock mass remained unexcavated or was excavated to a shallow depth, the unloading–rebound effect was not pronounced, and the rock mass was stratified under the influence of gravity (friction force). During this stage, significant deformation was absent. Observation points P0 and P1 exhibited leftward displacement (negative direction), indicating that the slope was in a compacted state. The displacement of the two points was around 0.5 mm.
- (2)
- Unloading–rebound phase (I):
During this phase, the rate of leftward deformation (displacement) gradually decreased to zero, with a potential trend of movement toward the free face. The transverse displacement of the detection point showed slight fluctuations.
- (3)
- Tensile failure phase (II):
During this phase, the deformation curve was generally convex, with displacement shifting to the right, and the rate of movement decreased over time. This occurs because, after the unloading–rebound was completed, the free face enlarged, the gravitational force component changed direction, and differential deformation occurred in the rock layers, causing the cracks at the rear edge to continue developing. At this point, the displacements of several monitoring points located at the top of the slope was roughly the same, around 2 mm.
- (4)
- Bending creep phase (III):
This phase is divided into three processes:
Primary phase (III1): The deformation rate of the slope rock gradually decreased. After the initial stress was relieved, plastic residual strain formed, which was independent of time. At this point, the displacement increase rate and amplitude at monitoring point P6 were the largest, rising from 4 mm to around 24 mm.
Steady phase (III2): Displacement increased linearly and gradually over time.
Tertiary phase (III3): As stress continued to increase, deformation surpassed the stable value and the creep rate rapidly accelerated. The bending creep phase (III) corresponded to a nonlinear viscoelastic–plastic creep process, particularly as macro fractures in the rock mass developed. At this point, the displacement at monitoring point P6 reached 38 mm.
- (5)
- Bending–toppling damage phase (IV):
During this phase, the displacement at the monitoring point increased sharply upward. When the rock layer bent beyond a certain limit, transverse cracks formed at the most curved section of the strip. As further deformation occurred, the root of the bend broke off, forming a tension fracture surface inclined outward from the slope. The slope body failed along this fracture surface.
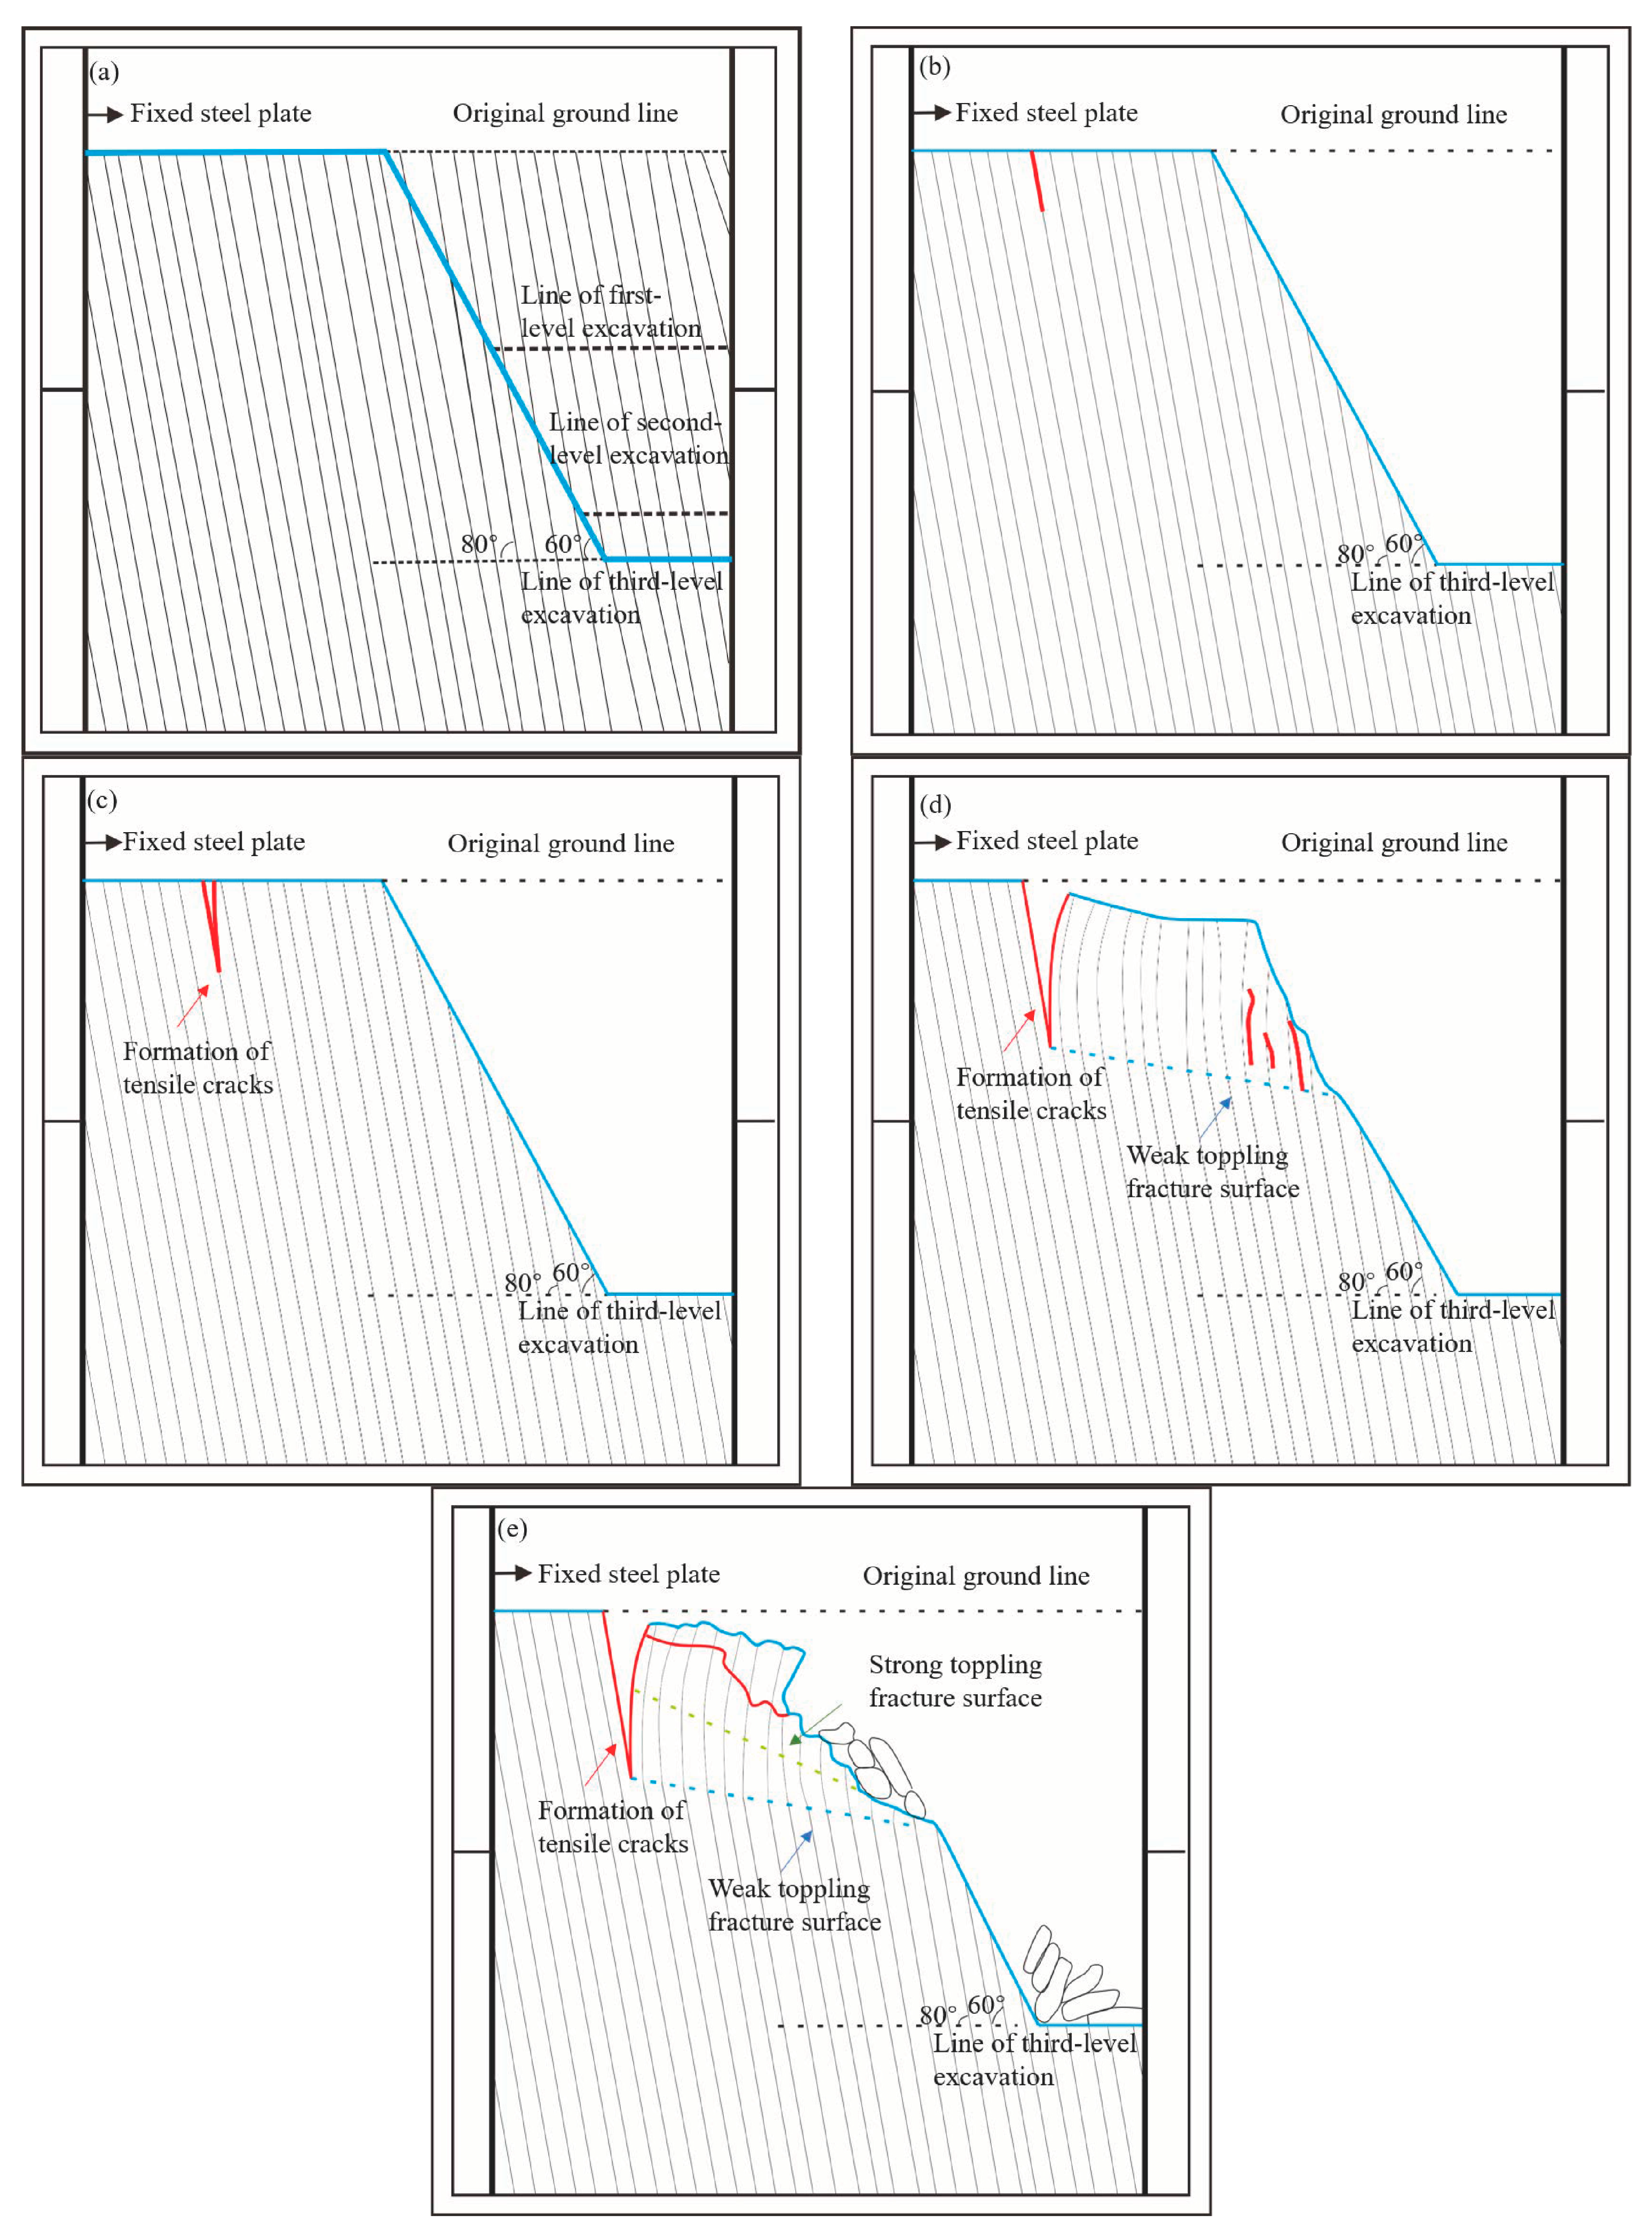
Therefore, this study generalizes the geological evolution model of the bedding toppling slope into the following process (Figure 10): under the action of external forces, the rock at the rear edge of slope slips and bends after tensile fracture, pushing the front rock mass to topple toward the free face. If the self-weight load exceeds the long-term stable load at this time, the rock mass exhibits a creep effect overtime. After undergoing deceleration, stability, and acceleration creep, the whole slope experiences overall instability failure and accumulates at the foot of the slope.
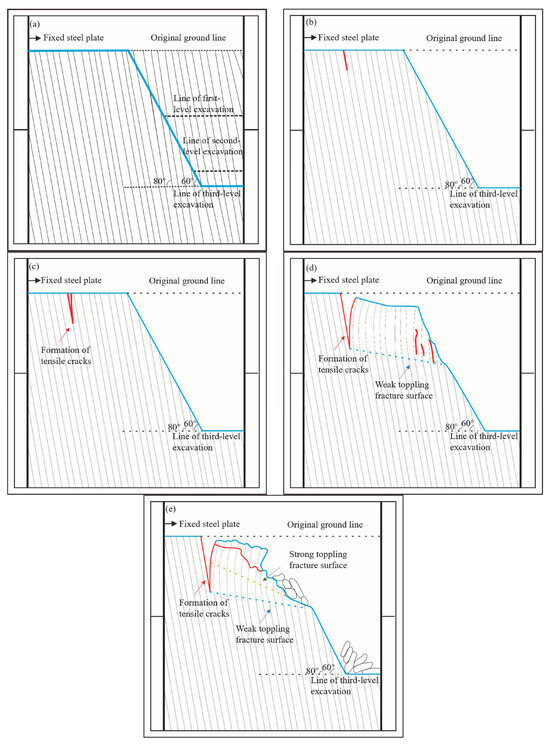
Figure 10.
Development and evolution of slope toppling failure (a) initial phase; (b) unloading–rebound phase; (c) tensile failure phase; (d) bending creep phase; (e) bending–toppling damage phase.
4. Bendingoppling Stability Evaluation Method Based on Viscoelastic Mechanics
4.1. Creep Constitutive Model Based on Nonlinear Rheological Mechanism
4.1.1. Design of Creep Test Scheme
The creep test equipment of CSF rock mass was selected, as shown in Figure 11. Chen’s loading method [24] was adopted in this test. The stress loading scheme adopted the graded loading creep test. The specific loading path of the creep test is shown in Table 3.
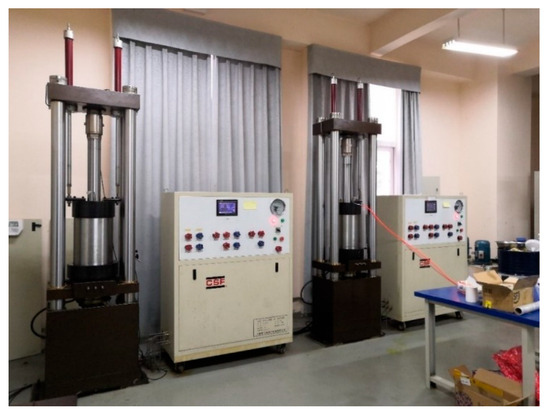
Figure 11.
Rock mass creep test equipment.
Table 3.
Loading grade of uniaxial compression creep sample.
4.1.2. Analysis of Creep Test Results
As shown in Figure 12 and Figure 13, considering the influence of the nonlinear creep process on the creep curve, Chen’s loading method was used to treat the creep curve, which is widely employed in rheological tests of the rock mass.
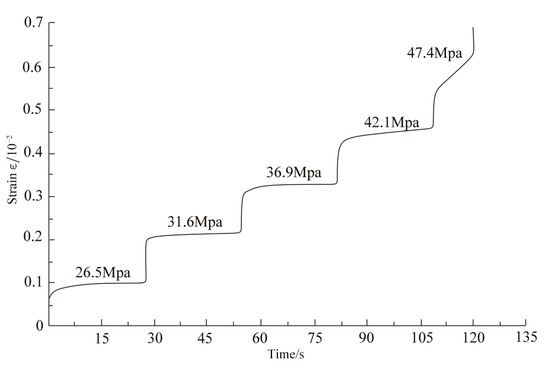
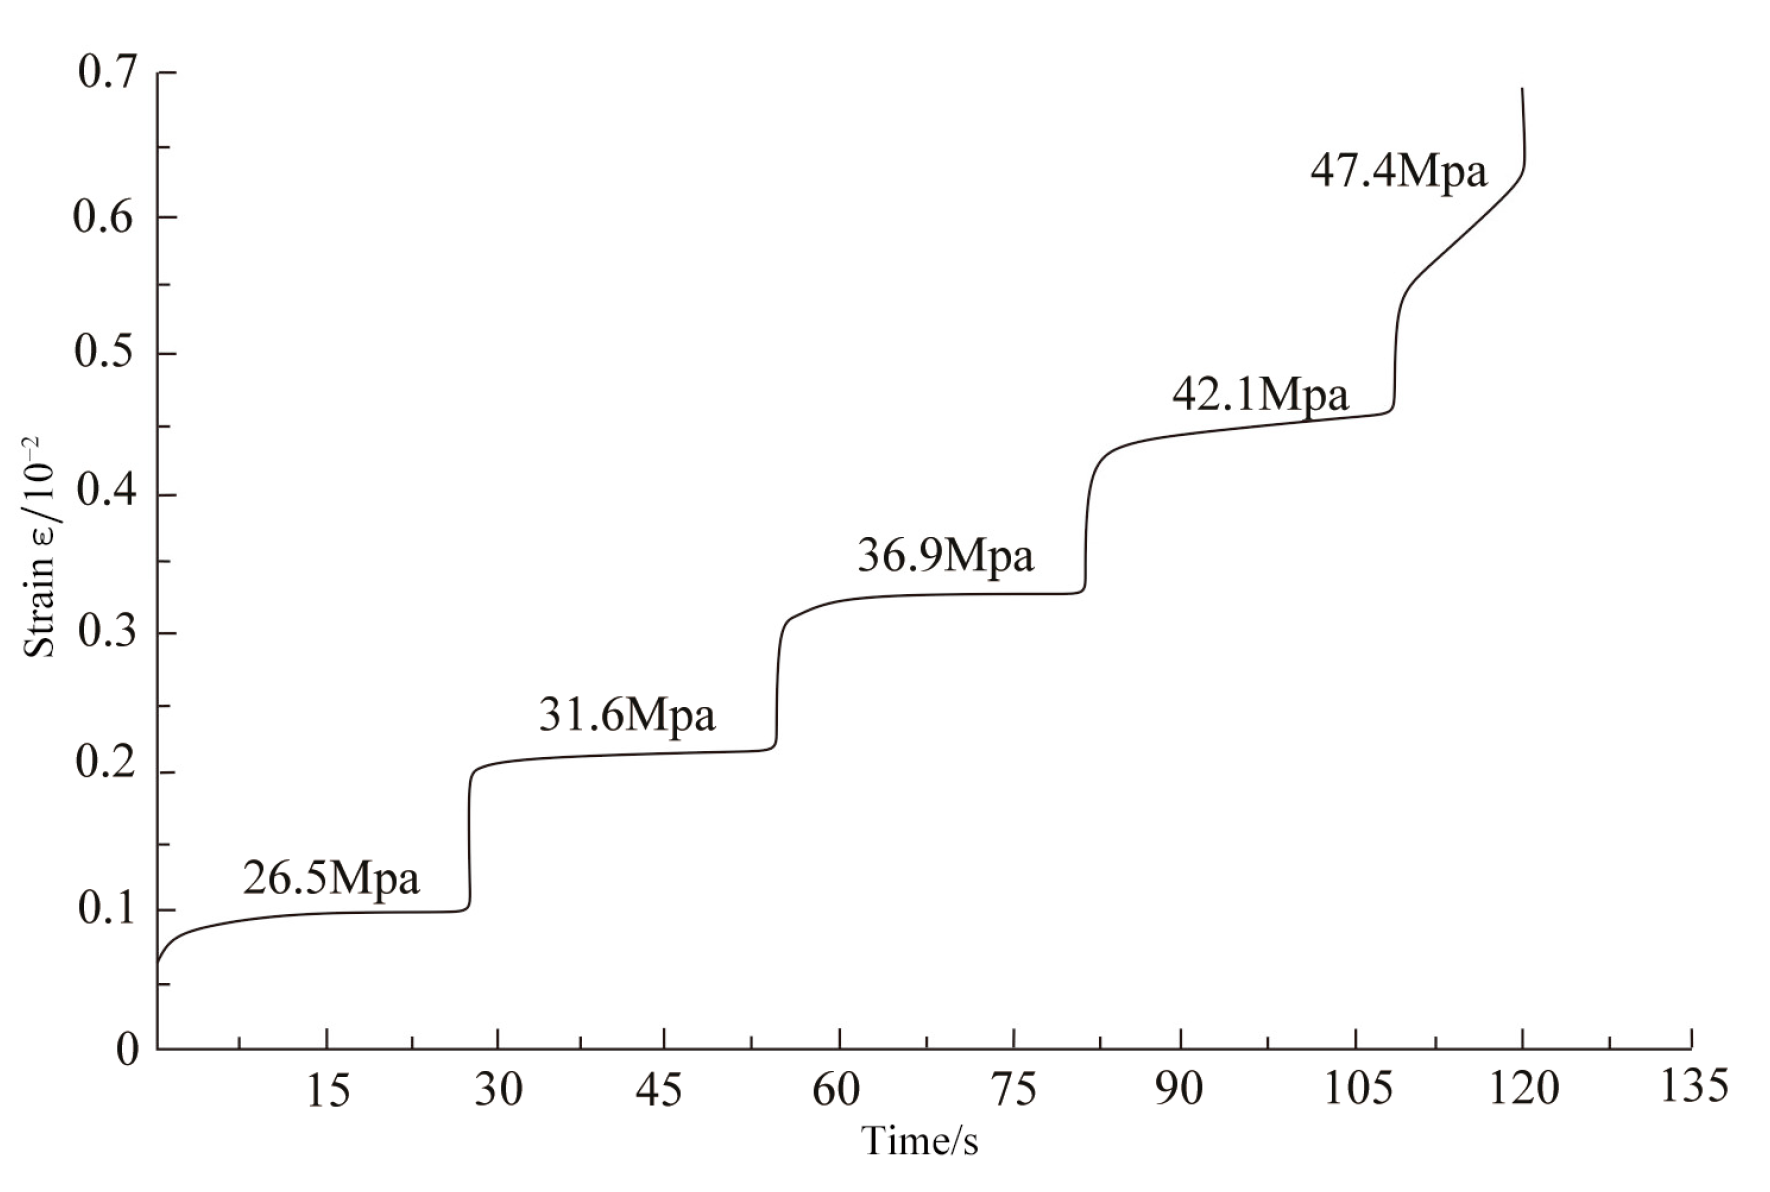
Figure 12.
Creep test curve under uniaxial loading.
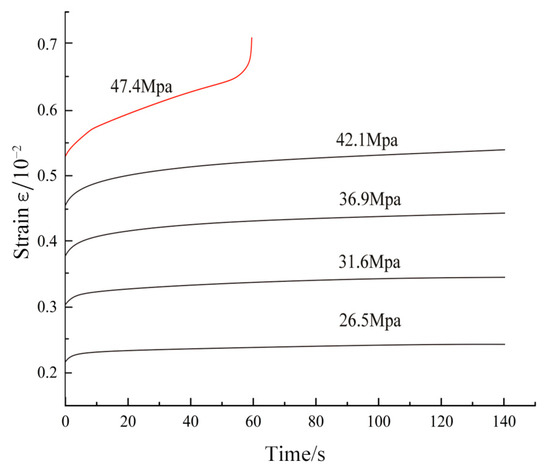
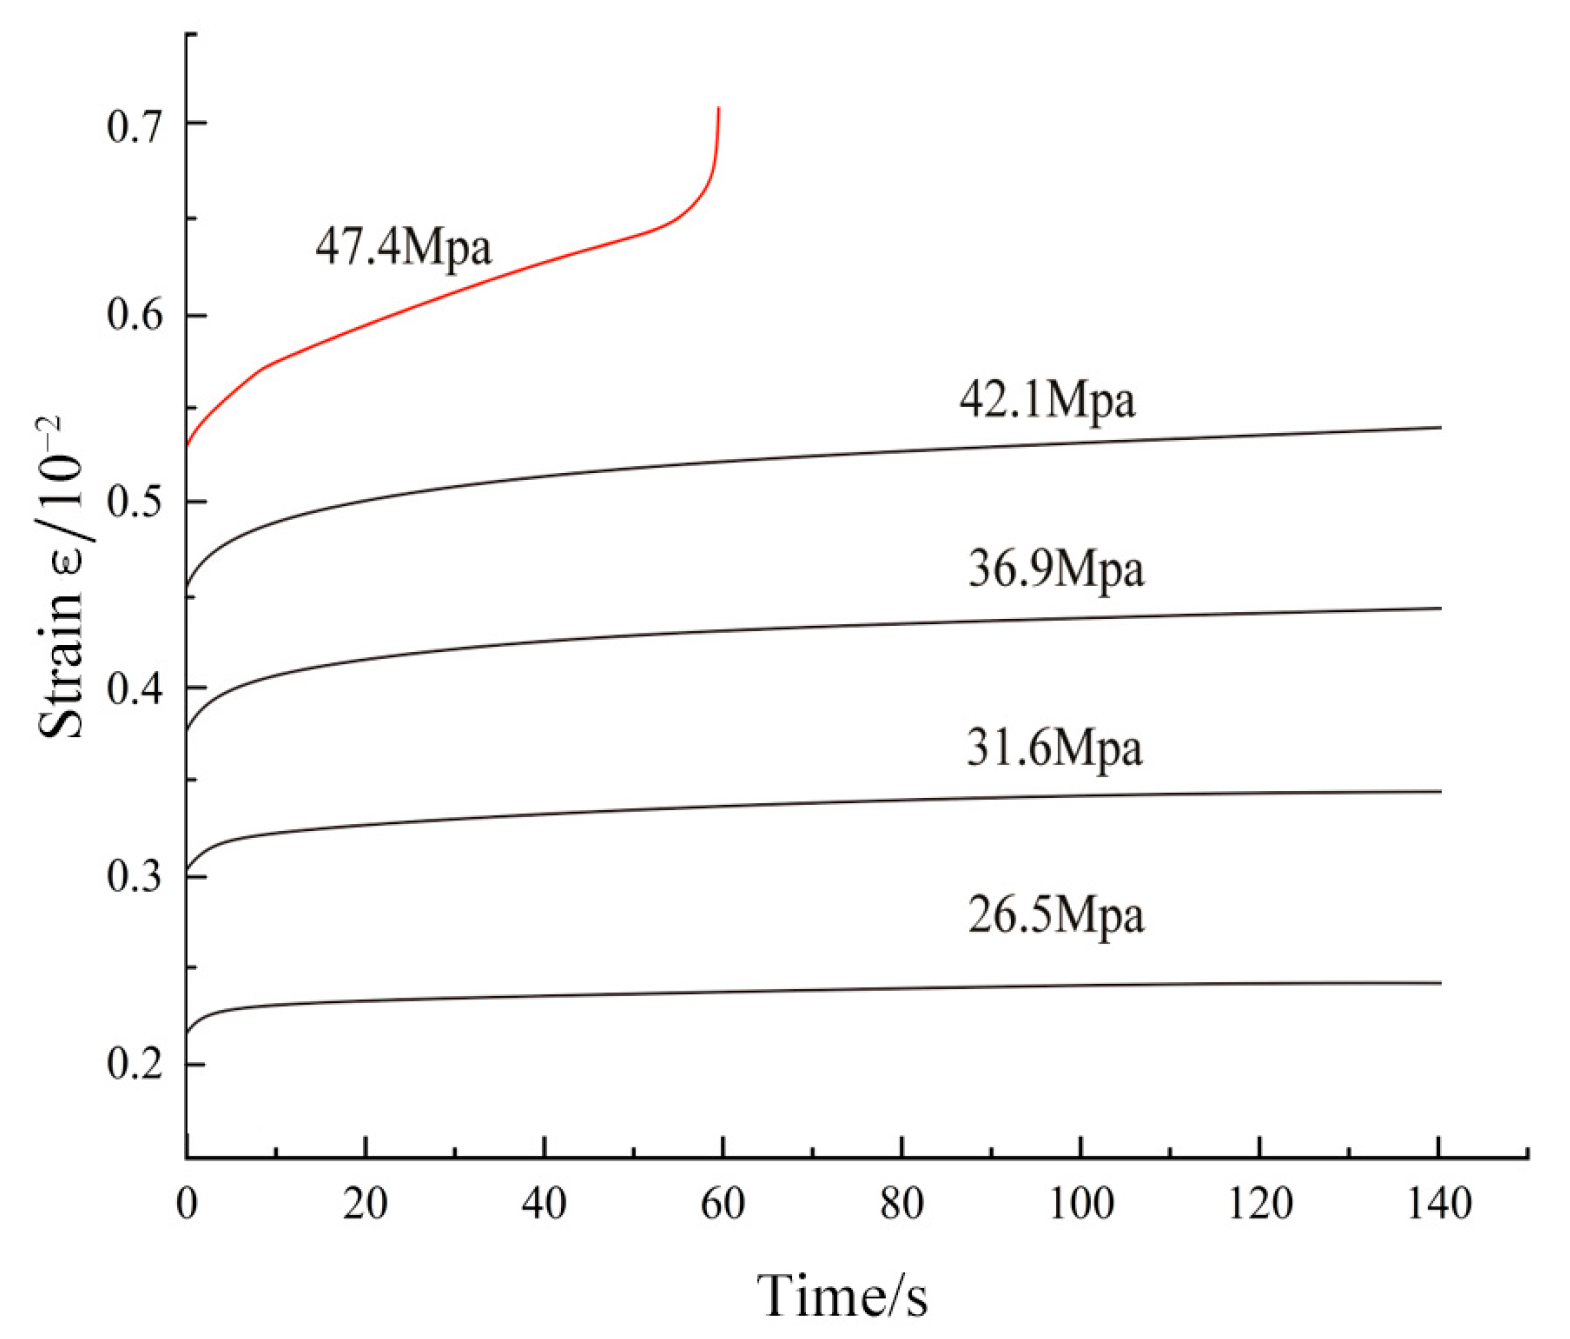
Figure 13.
Curve clusters processed using Chen’s loading method. Notes: the red line in the graph represents the fifth level of loading.
According to the test results, under various stress loads, the strain of the samples showed instantaneous elastic deformation, and it is evident that an accelerated creep stage without deformation occurred in the final loading stage. When the axial stress reached 47.4 MPa, the rock mass sample underwent four stages: instantaneous strain, primary creep, stable state creep, and tertiary creep, as shown in Figure 14. Segment AB is represented by a spring element; segments BC and CD consist of a spring element and a dashpot; and segment DE consists of a nonlinear viscoplastic model, a dashpot, and a new exponential element. The combination of segments AB and BC forms a three-parameter solid model, while segment CD represents a Kelvin model. Segment DE corresponds to a new nonlinear viscoplastic model.
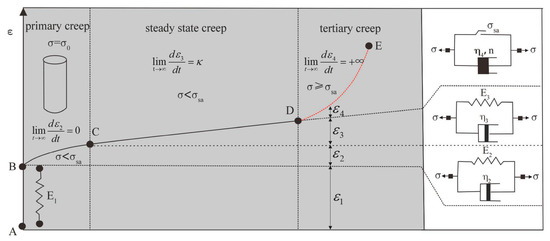
Figure 14.
Loading and unloading rheological test curve. Notes: is constant stress; is long-term stable stress; represents the strain of stage i (this is also applicable to other symbols); n and are constant.
4.1.3. Establishment of Slope Creep Constitutive Model
According to the results of the graded creep test, the stress level affects the creep characteristics of rock mass, and two different deformation conditions occur when the stress is lower than the long-term strength and exceeds the long-term strength.
When , the correspondence between stress and strain, as shown in Equation (3), is
where is the total stress; is the total strain; represents the strain of stage i; represents the stress of stage i; is the elastic parameter of rock mass of stage i; is the viscosity parameter of the rock mass of stage i; is the strain due to the time effect of stage i.
The Laplace transform of Equation (3) can be obtained, as shown in Equation (4):
where is Laplace transform; is Laplace transform; s is the transformation parameter.
Equation (4) is simplified after the inverse Laplace transformation, which can be obtained using Equation (5):
where ; ; ; , ; .
When , unsteady creep occurs in the rock mass, at which time, the viscoplastic body in the fourth part acts, and the corresponding stress and strain equation is shown in Equation (6):
where a is the rheological parameter, with the other parameters above maintained; the fourth line of Equation (6), which is the new nonlinear viscoplastic model in this paper, is transformed using the Laplace transform. Then, we can substitute into the transformed equation to obtain Equation (7):
After completing the Laplace transform of Equation (6) as a whole and an inverse Laplace transformation after simplification, the constitutive equation of the viscoelastic–plastic rheological model of seven elements can be obtained, as shown in Equation (8):
4.1.4. Nonlinear Viscoelastic–Plastic Relaxation Properties
When , the Laplace transform on both sides of , which is substituted into Equation (4), and Equation (9), can be obtained:
Equation transposition and simplification can be obtained, as shown in Equation (10):
where ; ; ; .
The relaxation equation (Equation (11)) is obtained by applying the Laplace transform to both sides of Equation (10):
The stress response equation (Equation (12)) after applying constant strain can be expressed as
By combining Equations (11) and (12), Equation (13) can be obtained:
When , according to study [25], when , the relaxation equation (Equation (14)) of the seven-element nonlinear viscoelastic–plastic rheological model can be obtained:
4.2. Aging Deformation Characteristics of Delayed Instability Slope Based on Fractional-Order Bessel Function
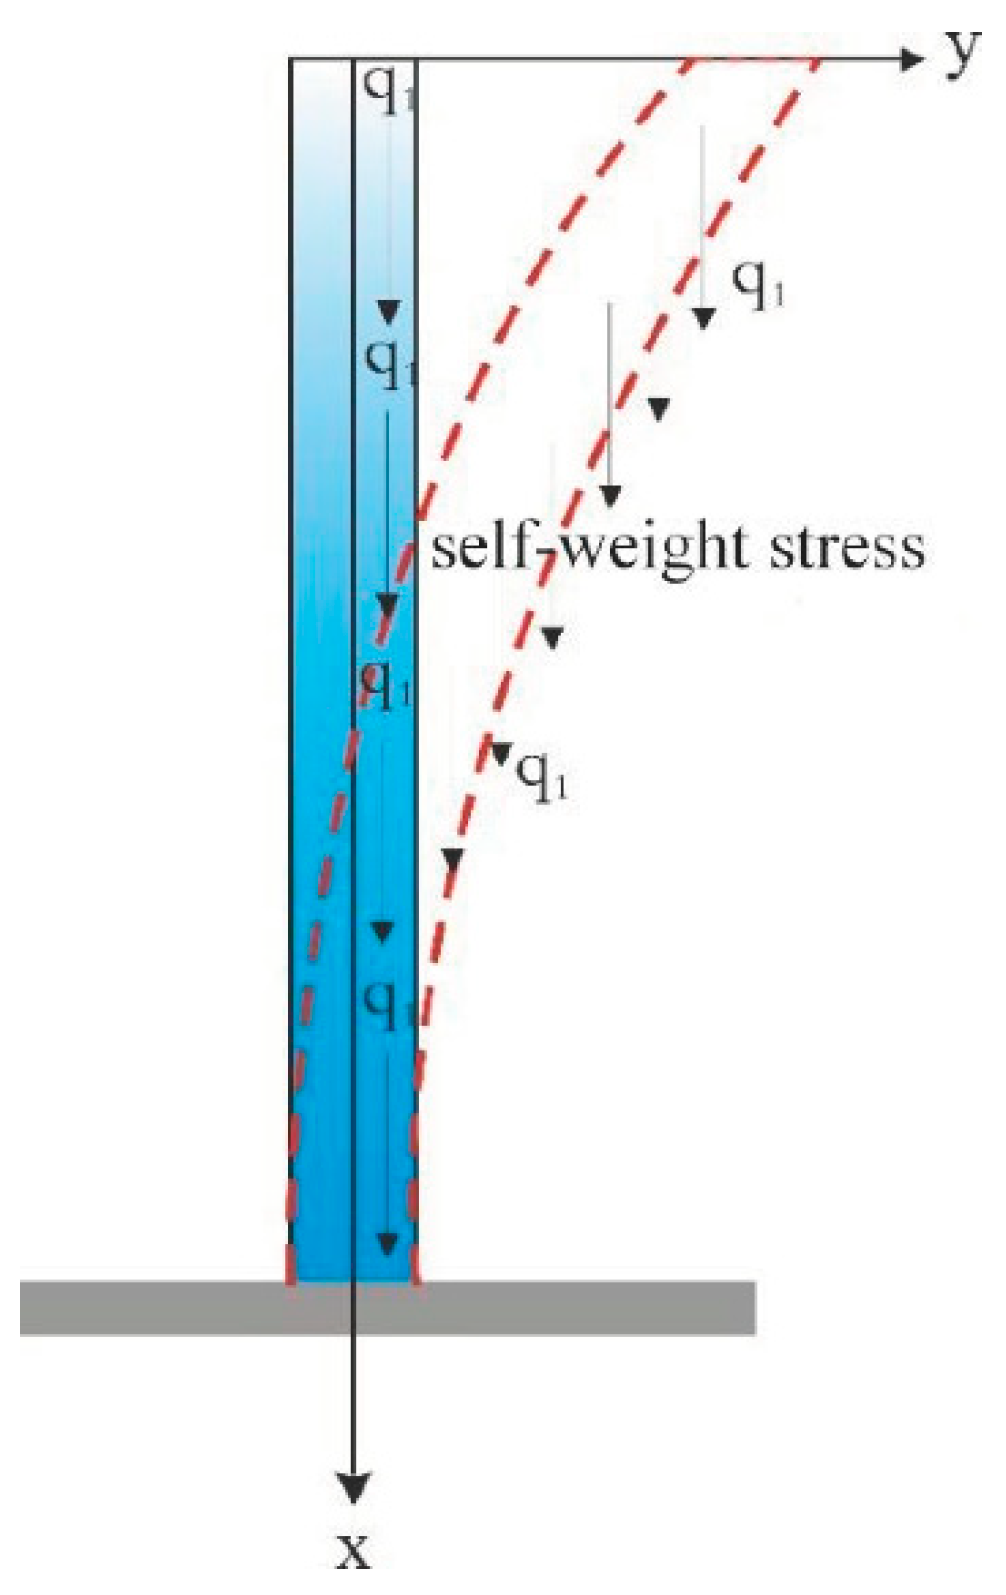
According to the plane hypothesis, the coordinate system, as shown in Figure 15, is established, and the differential equation of mechanical equilibrium of rock strata is established based on Equation (15):
where is the bending moment on the section x of the beam at time t; is the deflection on the section of the beam at x at time t; is the weight of the rock mass per unit length.
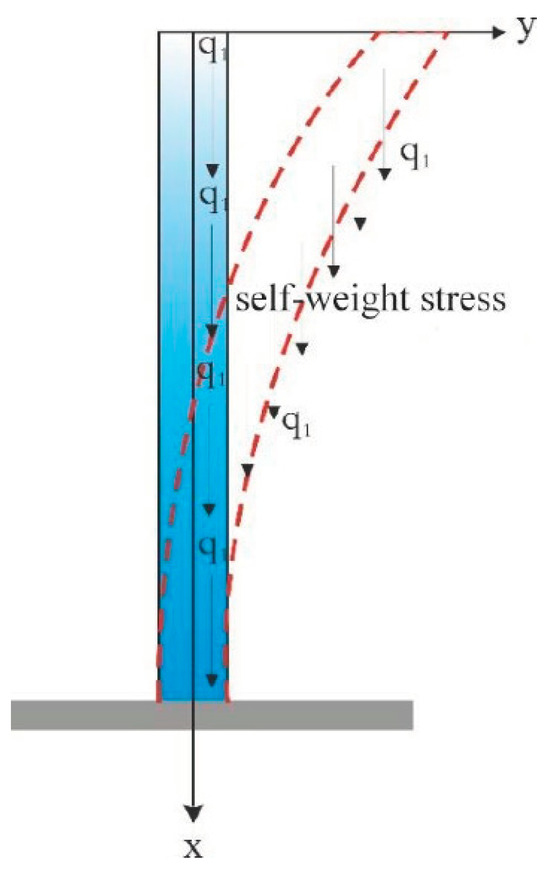
Figure 15.
Rock mass flexural load mechanical model based on fractional-order Bessel function.
The bending moment on the section of the beam at x at time t can be obtained using Equation (16):
By substituting Equation (16) and applying the Laplace transform, we obtained Equation (17):
Ream and introduce a new argument z and . Equation (17) is converted into a standard Bessel differential equation and simplified as Equation (18):
Including , .
As the Bessel function obtained herein is a fractional Bessel function, considering that it cannot be calculated by conventional functions, this study uses Matlab 2020a to calculate its two linearly independent solutions and .
Finally, can be obtained, and the critical uniform load equation (Equation (19)) can be obtained:
By combining Equations (19) and (13), Equation (20) can be obtained:
The following conclusions can be drawn from Equation (20):
t = 0, the initial load value , ; long-term stable uniform load .
4.3. Establishment of Stability Evaluation Model and Instability Criterion for Tipping–Deformation Slope
For an elastomer, the deformation process changes linearly, and its elastic pressure buckling load has no correlation with time. However, considering the viscoelastic–plastic creep characteristics, the stability state of rock mass accounting for the time effect also varies under the action of different load levels according to the relationship between load level , long-term stable load , and instantaneous elastic critical load . The rock slope can be specifically divided into the following three cases:
- (1)
- Stable slope: Over a long period of time with only rheological phenomenon, no buckling—that is, without losing stability—and its longitudinal load is , that is long-term, stable uniform load. As long as its value is less than self-weight load, the slope will not experience instability.
- (2)
- Transient instability slope: Instability occurs instantaneously, and its longitudinal load is the instantaneous elastic critical load. As long as the initial stress satisfies , instantaneous instability occurs.
- (3)
- Delayed instability slope: In the load range of , the rock slab beam has delayed instability over a limited time. It is important to note that is the ratio of the deflection at the free end of the rock slab at any time to the maximum deflection value (the deflection risk value) when the rock mass fractures as the stability coefficient of the rock slab. Similarly, is the ratio of any time angle at the free end of the rock slab to the maximum angle (angle risk value) at the time of rock mass fracture as the stability coefficient of the rock slab. Then, and can be obtained using Equation (21):
So, the judgment basis of the stability of the toppled deformation slope is shown in Table 4.
Table 4.
Stability judgment basis of toppled deformation slope.
where is the ultimate uniform load of the cantilever beam under the condition of self-weight, which can be obtained using elastic mechanics, and the deflection of the cantilever beam (maximum value at x = l and q = qmax). The angle of the cantilever beam (maximum value at x = l and q = qmax) can be obtained using elastic mechanics, as shown in Equation (22):
According to the corresponding principle, the tension and compression modulus is , while is . Combining the first line of Equation (22), we can obtain Equation (23):
The inverse Laplace transformation of Equation (23) and the maximum deflection value is obtained at x = l. Similarly, the same is true for the maximum angle; then, and can be obtained using Equation (24).
including .
5. Stability Evaluation Method Verification
5.1. Bottom Friction Test Verification
This chapter is divided into two parts to verify the feasibility of the stability evaluation method using the bottom friction test model and a hydropower bedding slope as examples.
Considering the similarity relationship and viscoelastic creep characteristics, the rock beam of the model slope has delayed instability, which mainly depends on the relationship between the actual compressive load and the magnitude of and when the slope is loaded for 6 h. The long-term stable and uniformly distributed load , which is less than the weight of load q, and , which is less than the limit distribution load . According to the instability criterion in the previous chapter, this model slope is classified as a delayed slope. It shows that the slope will experience delayed instability under long-term loading, and Equation (21) can be used to solve for . It can be concluded that the bottom friction model in this paper belongs to the delayed instability slope category in the stability evaluation method described in this section; its stability coefficient is greater than 1, and it is in an unstable state. The relevant parameters are shown in Table 5.
Table 5.
Model parameters.
5.2. Verification of Slope of a Hydropower Station
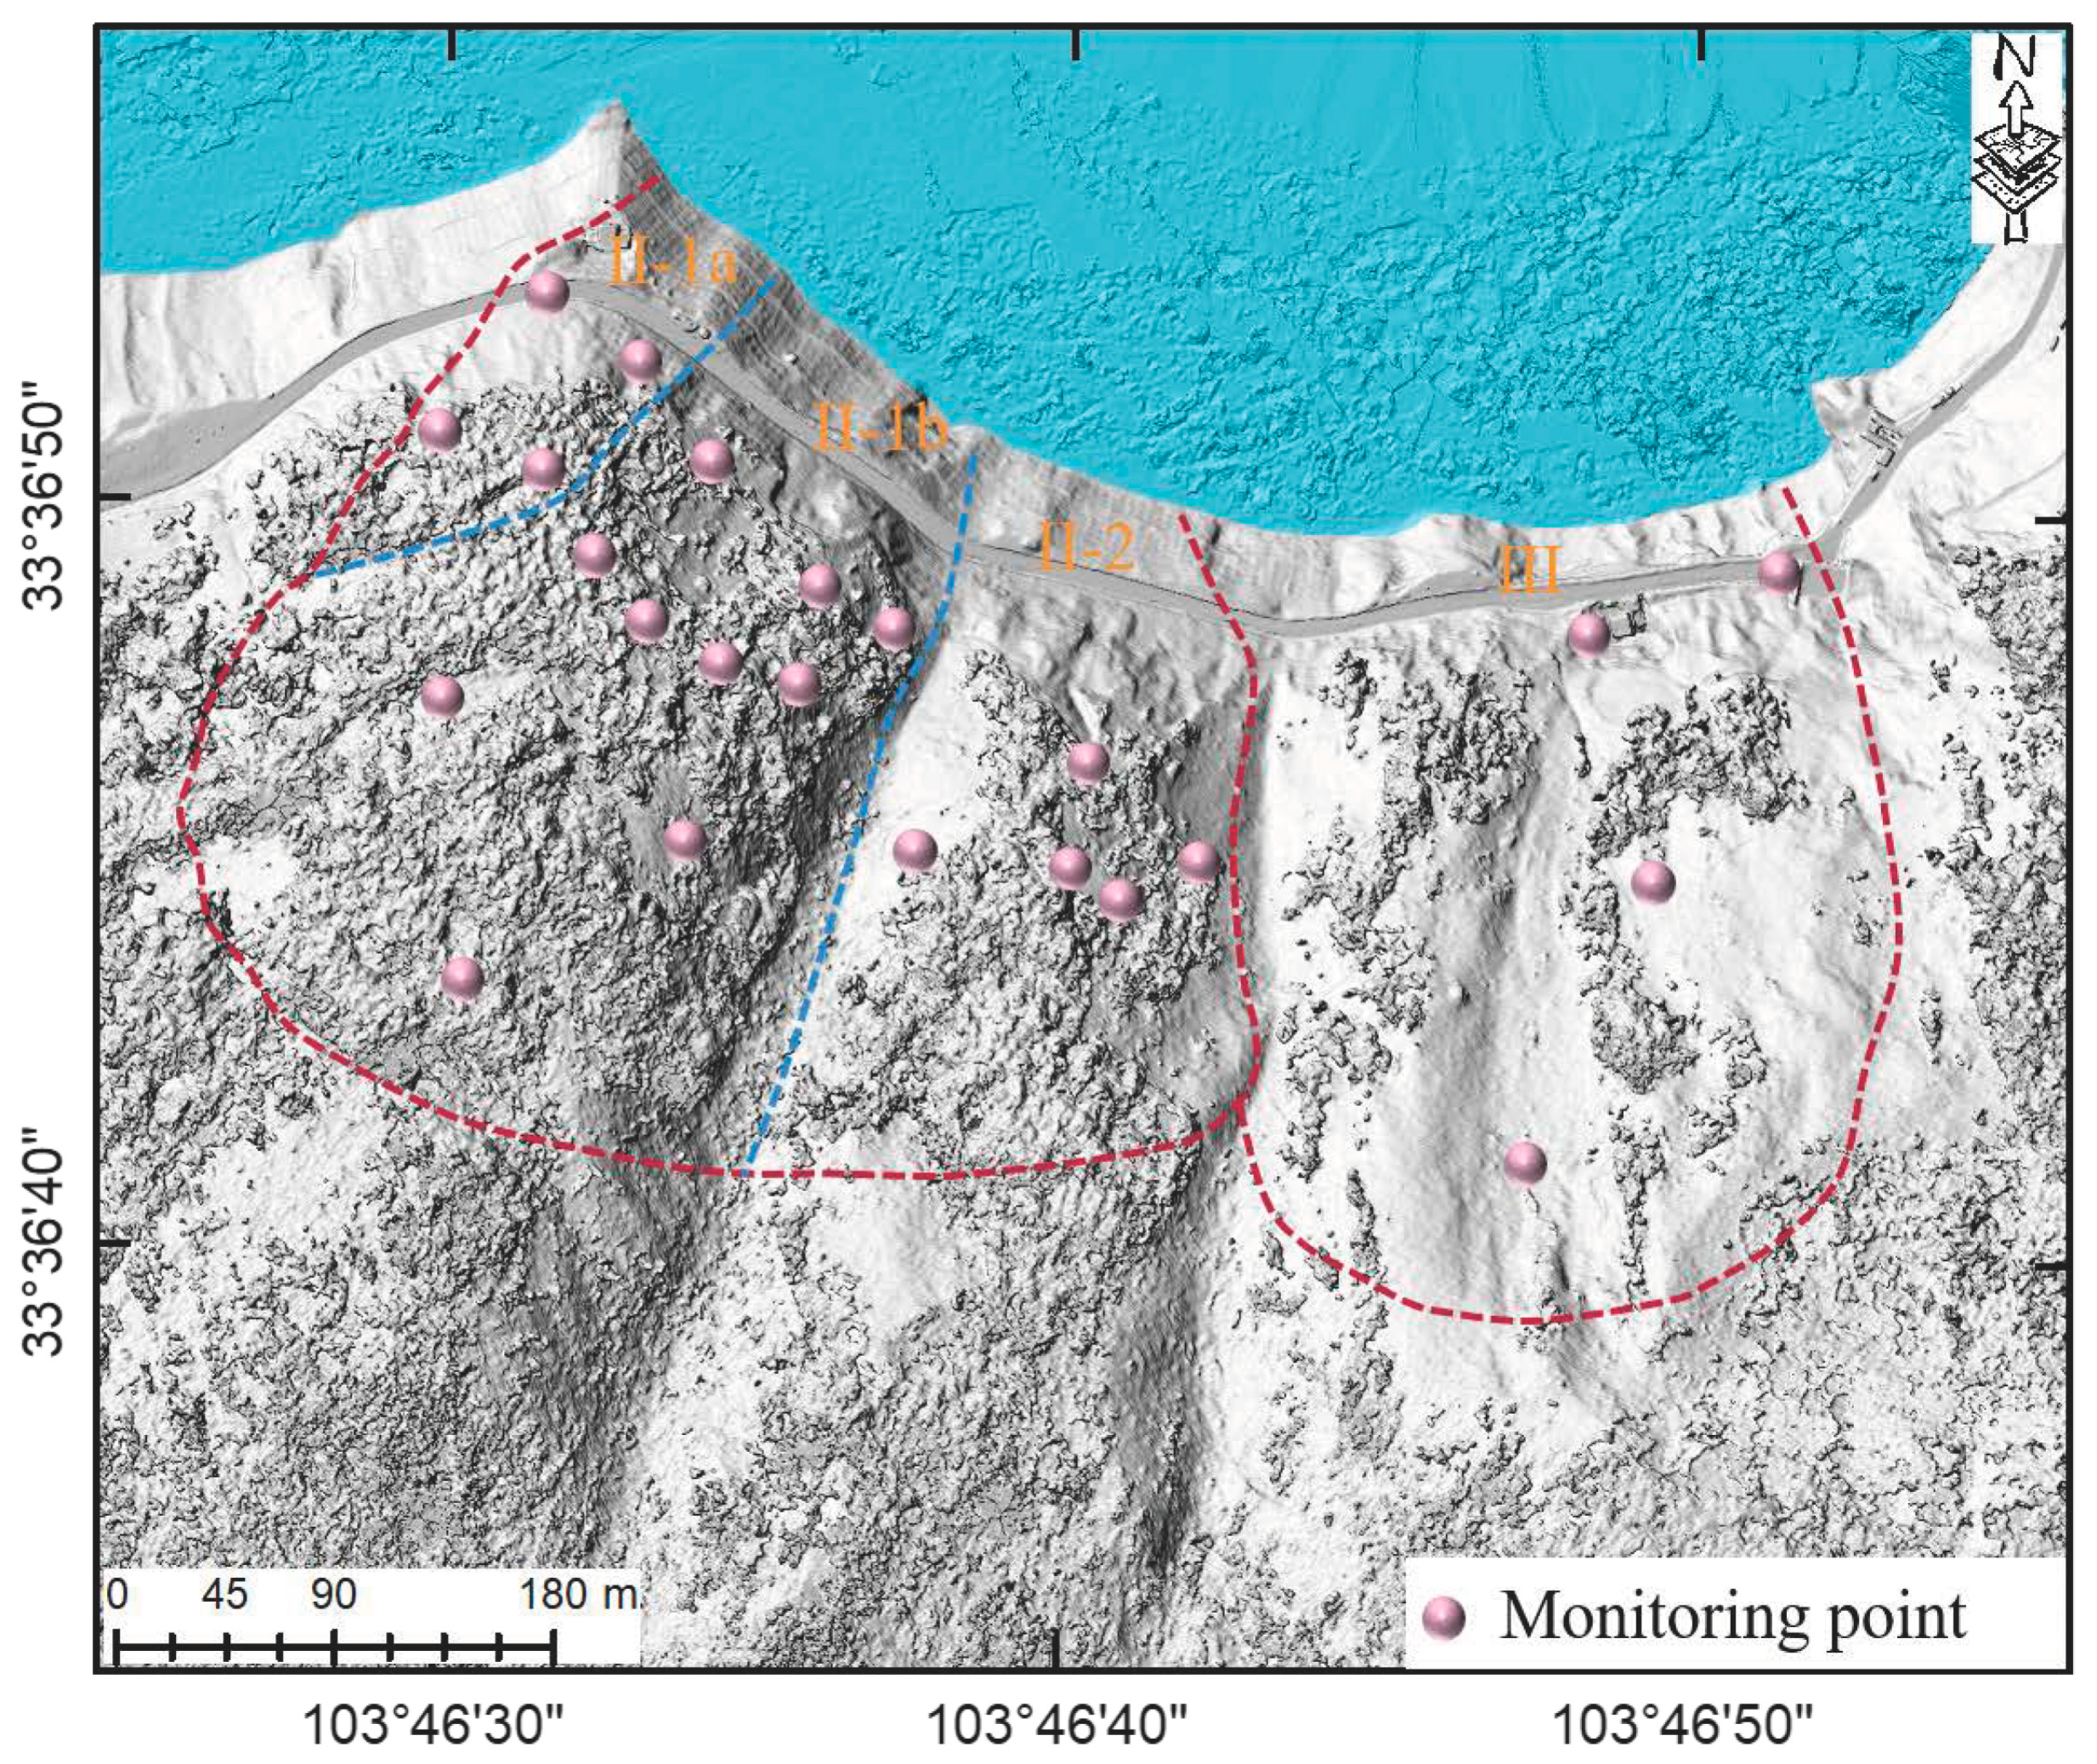
Since 2013, the reservoir has experienced two instances of water impoundment. The deformation of the right bank slope has not stabilized, and the slope continues to experience creep deformation. In order to detect slope deformation, we set up monitoring points, as shown in Figure 16.

Figure 16.
Monitoring point layout.
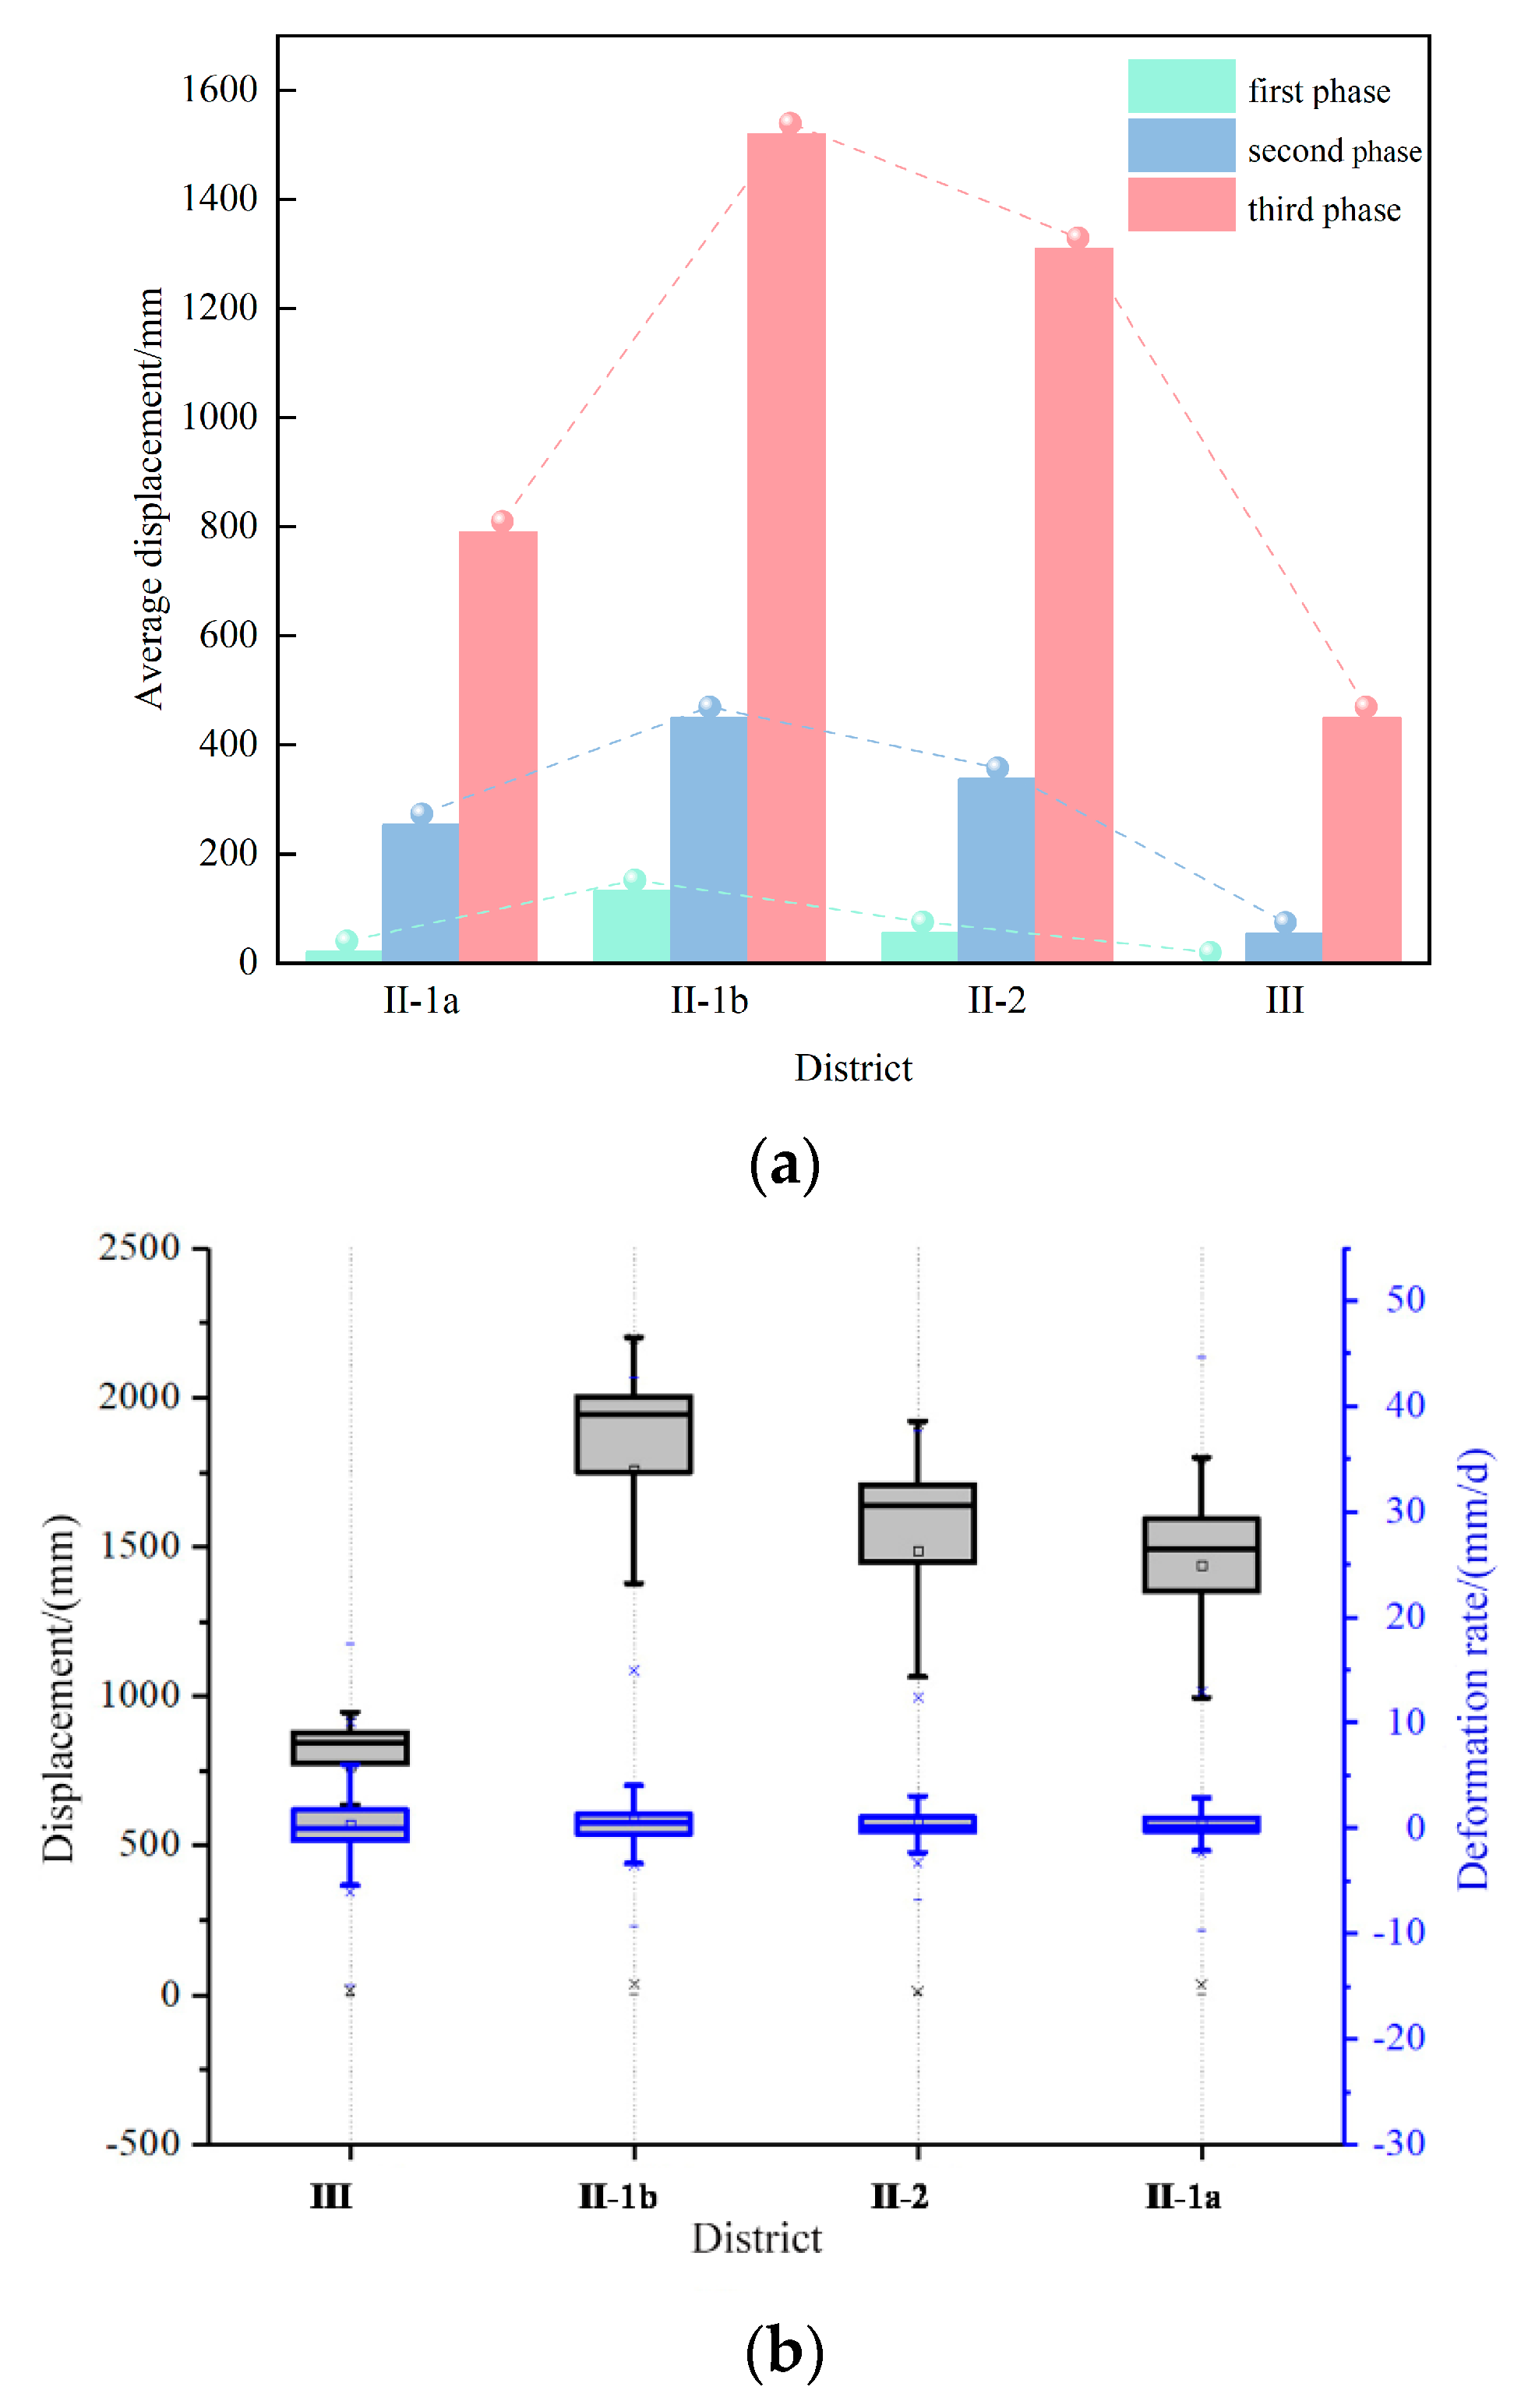
The monitoring data analysis shows that over a long time period, the deformation displacement and rate in each zone remains low (Figure 17). The maximum deformation rate in zone II-1b reaches 35 mm/d, with the current average rate at 0.37 mm/d (Figure 18).
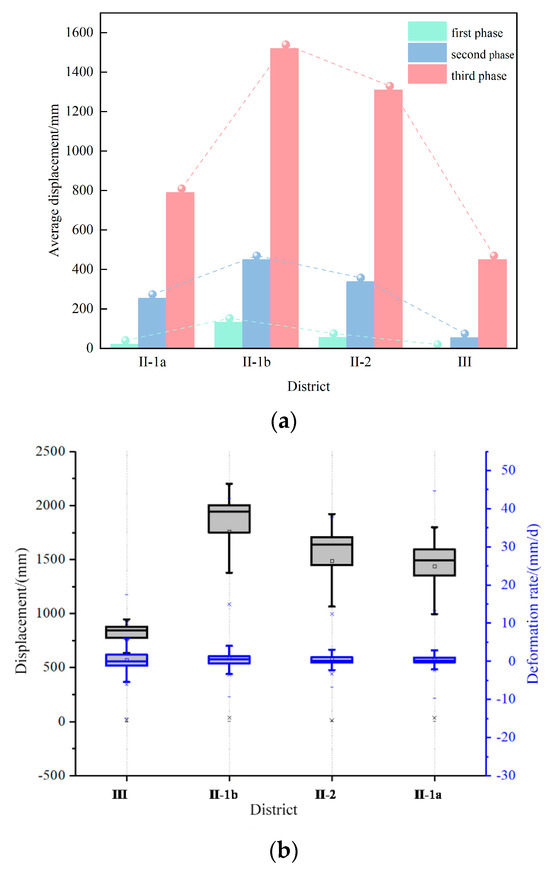
Figure 17.
Displacement variation for different regions. (a) Average increase in deformation for different regions; (b) average cumulative displacement and deformation rate of each region. In figure (a), the first phase represents the period before the first phase of water impoundment, the second phase represents the interval between the first and second phases of water impoundment, and the third phase represents the period after the second phase of water impoundment.
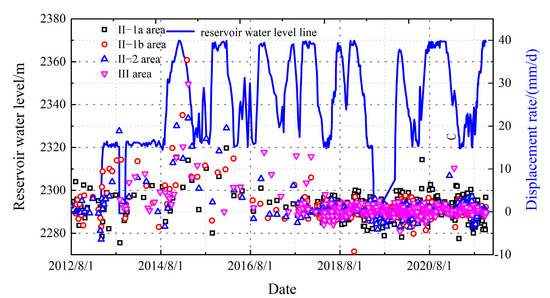
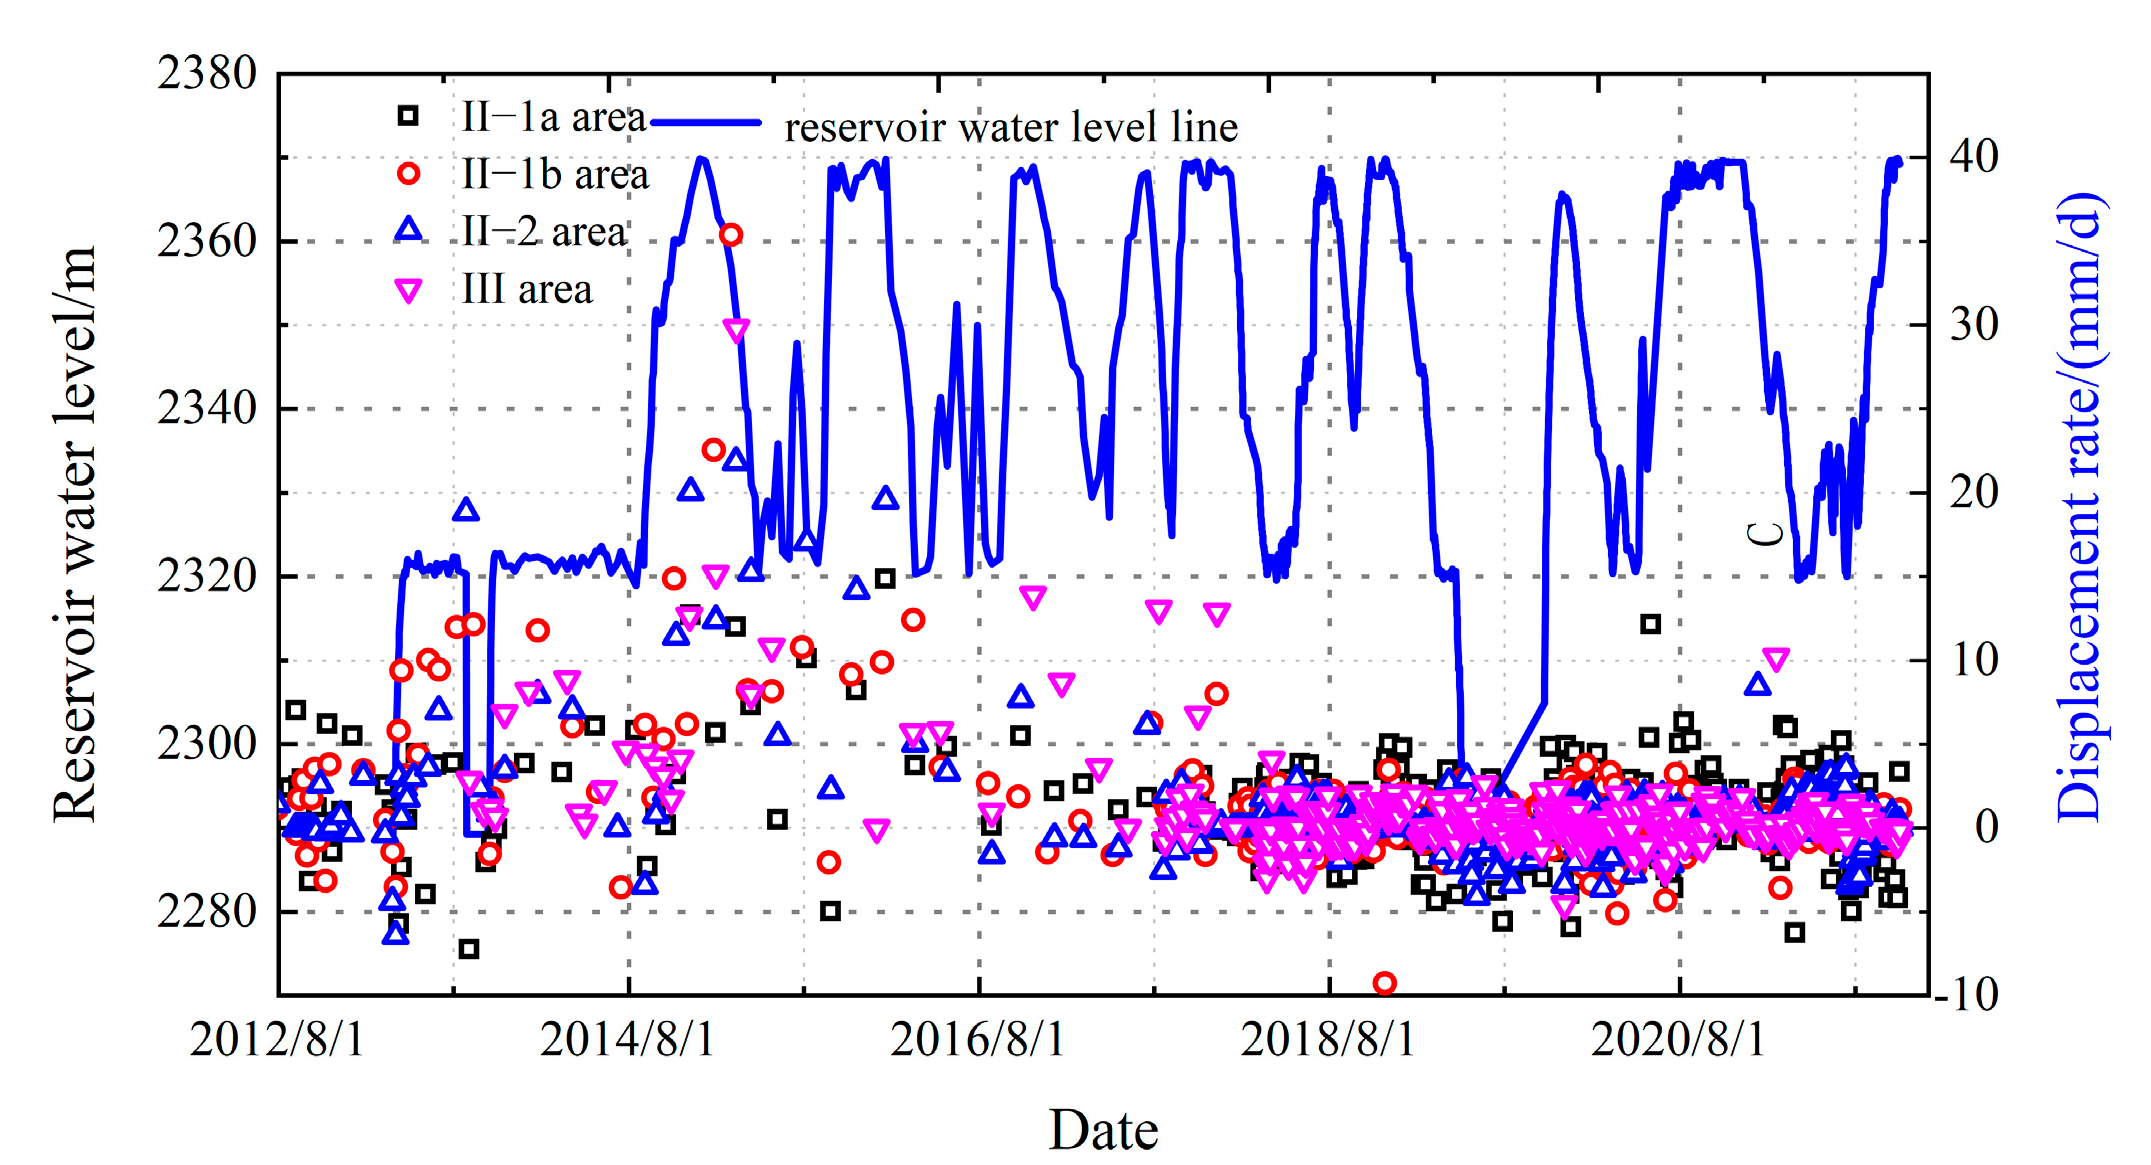
Figure 18.
Evolution of deformation rate in each region.
Considering the bedding slope of the hydropower station, based on the field investigation, monitoring, sampling, and the above-mentioned research results on the toppling deformation mechanism of the bedding slope, the stability evaluation method in the previous section is used to calculate and verify the slope. Sample JZ-01 in Section 4.1.1 is considered using the slope.
Therefore, using the creep model parameters obtained, combined with the calculation method of long-term stable compressive and flexural loads based on the nonlinear viscoelastic–plastic rheological model of rock mass in the previous section, of the hydropower slope is obtained.
It can be concluded that the rock body weight of the hydropower slope—that is, the pressure buckling load—is less than the long-term stable compressive and buckling load. According to Table 6, the slope is stable in the natural state and belongs to the category of stable slope.
Table 6.
Results of determining the stability of the hydropower slope based on compressive and flexural load.
Based on the results of the rock slab’s self-weight stress and current monitoring data, as well as the long-term stable compressive load calculated from the creep model and feedback from monitoring data analysis, it is concluded that the rock slab is stable in its natural state and classified as a stable slope.
In fact, based on the results of the field investigation, in Area I, except for minor slope failure on the outer side of the road embankment, no other significant signs of slope deformation were observed, and the overall condition is considered relatively stable. Although the accumulated deformation in Area II-1b is the largest, surface cracks in this area have not closed, and no continuous sliding surface has formed. Shallow rock masses on the slopes are undergoing creeping deformation due to the reservoir’s water level fluctuations. Therefore, it is preliminarily judged that the area is currently in a relatively stable state. In Area III, no obvious tension cracks or failure phenomena are observed on the slope surface at this stage, with only minor slope failure occurring. Hence, the overall condition is stable.
6. Discussion
It is well known that the steep bedding rock slopes undergo bending deformation to failure under the influence of factors such as slope structure, topographic conditions, and regional geological background. The driving forces for deformation are not exactly the same as those of reverse-dip slopes. Therefore, their deformation and failure characteristics also exhibit certain differences and uniqueness.
In such unstable slopes, since the rock layers lack sliding boundaries and space, the deformation and instability process is prolonged. During this slow and extended creep period, the rock mass can undergo sufficient aging deformation, which leads to the deterioration of the rock mass. This, in turn, causes the rock to experience bending creep, ultimately resulting in the complete formation of a fracture plane, leading to slope instability. Therefore, compared to the results found by Li et al. [26,27], this study, based on the consideration of aging effects, combines the example of the Dongnuo Hydropower Station slope and uses base friction tests to analyze the evolutionary patterns of different deformation stages in the deformation and failure of steep bedding rock slopes. Based on the experimental results, this paper quantitatively classifies slope instability types and establishes a stability evaluation model and instability fracture criterion for steep bedding rock slopes using a nonlinear viscoelastic–plastic rheological constitutive model of the rock mass. In addition, there are still some shortcomings and challenges in the research on the deformation and fracture evolution mechanism and stability evaluation of steep bedding rock slopes.
- (1)
- Under the determined geological prototype conditions, the instability criterion for steep bedding rock slope under the action of self-weight or additional fissure hydrostatic pressure has not yet been established;
- (2)
- The stability of steep bedding rock slopes is a dynamic issue that needs to consider aging effects, and traditional stability methods cannot predict the trend of slope stability changes over time.
- (3)
- Due to the limitations of experimental conditions and sample quantity, this study conducted only indoor uniaxial compression creep tests for rock mass grading loading creep experiments, lacking a certain degree of general applicability. Future research should consider and further explore the creep characteristics of rock masses under complex stress paths in triaxial stress conditions to better reflect the actual stress environment of rock masses in engineering practice.
- (4)
- The stability evaluation model for toppling deformation based on deflection and rotation angle timeliness established in this study may face applicability issues when applied and validated in typical engineering cases due to limitations in tracing the initial deformation time point. Therefore, future work will incorporate geochronological techniques for geotechnical materials and integrate dating data to provide objective and accurate parameters for the evaluation model.
7. Conclusions
This paper discusses the evolution process and mechanism of slope toppling deformation. A new nonlinear viscoelastic–plastic rheological constitutive model for rock mass is established to reveal the relationship between deflection and the angle of the rock mass beam at any position and time. Additionally, a set of aging deformation stability evaluation methods suitable for the toppling body is developed. The main conclusions are as follows:
- (1)
- Bedding–toppling deformation primarily occurs in areas with significant topographic slope changes, typically developing on mountain slopes at altitudes of 2000–3000 m, with slope angles ranging between 50° and 60°. Furthermore, bedding–toppling deformation predominantly occurs on mountain slopes with interbedded structures, followed by soft rock slopes, and is least developed on hard rock slopes.
- (2)
- Using a bottom friction physical simulation test, combined with the macroscopic deformation characteristics of the model slope, changes in point displacement, and mechanical characteristics, the entire evolution process of slope toppling deformation and failure during valley incision is reconstructed. The toppling deformation process of bedding rock slopes is divided into five stages: the initial phase of the slope, the unloading–rebound stage, the tensile failure phase, the bending creep phase, and the bending–toppling damage phase.
- (3)
- Based on the nonlinear viscoelastic–plastic rheological constitutive model for rock mass, considering time-dependent factors, a quantitative evaluation method for the stability of toppling slopes was developed. The types of rock slope instability were quantitatively classified into three types: stable slope, transient instability slope, and delayed instability slope. Additionally, a stability evaluation model for toppling deformation concerning deflection and angle overtime was established.
Author Contributions
Investigation, J.Y., W.R., J.G. and X.H.; methodology, T.L.; supervision, X.P.; writing—original draft, K.W.; writing—review and editing, T.L. and X.L. All authors have read and agreed to the published version of the manuscript.
Funding
This study was financially supported by the National Natural Science Foundation of China (grant number 42377194), the Sichuan Science and Technology Program (grant number 2023NSFSC0282), the Sichuan Province Central Government Guides Local Science and Technology Development Special Project (grant number 2023ZYD0151), and the State Key Laboratory of Geohazard Prevention and Geo-environment Protection Independent Research Project (SKLGP2021Z008).
Data Availability Statement
Raw data supporting the findings of this study are available from the corresponding author upon reasonable request.
Conflicts of Interest
Author Tiantao Li was employed by the company Sichuan Highway Planning, Survey, Design and Research Institute Ltd.; Author Kaihong Wei was employed by the company Chengdu Engineering Corporation Limited, Power China. The remaining authors declare that the research was conducted in the absence of any commercial or financial relationships that could be construed as a potential conflict of interest.
References
- Goodman, R.E.; Bray, J.W. Toppling of slopes. In Proceedings of the Specialty Conference on Rock Engineering for Foundations and Slopes ASCE/Boulder, Boulder, CO, USA, 15–18 August 1976; pp. 201–234. [Google Scholar]
- Cai, J.C.; Ju, N.P.; Huang, R.Q.; Zheng, D.; Zhao, W.H.; Li, L.Q.; Huang, J. Mechanism of toppling and deformation in hard rock slope: A case of bank slope of Hydropower Station, Qinghai Province, China. J. Mt. Sci. 2019, 16, 924–934. [Google Scholar] [CrossRef]
- Deng, T.X.; Ju, N.P.; Li, L.Q.; Jiang, Y.B.; Lu, X.T. Study on dynamic toppling deformation mechanism of inclined steep-dip bedding slope. Water Resour. Hydropower Eng. 2017, 5, 146–152, (In Chinese with English Abstract). [Google Scholar]
- Huang, R.Q.; Li, Y.S.; Yan, M. The implication and evaluation of toppling failure in engineering geology practice. J. Eng. Geol. 2017, 25, 1165–1181, (In Chinese with English Abstract). [Google Scholar]
- Jiang, L.; Zhang, Q.; Jia, C.J.; Yu, J.; Huang, Q.F. Investigating on deformation characteristics and failure mechanism of bedding rock slope: Field study, long-term monitoring, and reinforcement measures. Environ. Earth Sci. 2024, 83, 45. [Google Scholar] [CrossRef]
- Miao, S.S.; Su, L.J.; Zhang, C.L.; Liu, Z.L.; Wang, B.; Dong, Z.B. Dynamic response characteristics and damage failure process of bedding rock slope in shaking table test. Bull. Eng. Geol. Environ. 2024, 83, 358. [Google Scholar] [CrossRef]
- Tang, H.M.; Zou, Z.X.; Xiong, C.R.; Wu, Y.P.; Hu, X.P.; Wang, L.Q.; Lu, S.; Robert, E.C.; Li, C.D. An evolution model of large consequent bedding rockslides, with particular reference to the Jiweishan rockslide in Southwest China. Eng. Geol. 2015, 186, 17–27. [Google Scholar] [CrossRef]
- Zhang, S.L.; Zhu, Z.H.; Qi, S.C.; Hu, Y.X.; Du, Q.; Zhou, J.W. Deformation process and mechanism analyses for a planar sliding in the Mayanpo massive bedding rock slope at the Xiangjiaba Hydropower Station. Landslides 2018, 15, 2061–2073. [Google Scholar] [CrossRef]
- Zhao, L.H.; Li, D.J.; Tan, H.H.; Cheng, X.; Zuo, S. Characteristics of failure area and failure mechanism of a bedding rockslide in Libo County, Guizhou, China. Landslides 2019, 16, 1367–1374. [Google Scholar] [CrossRef]
- Mu, J.Q.; Li, T.T.; Pei, X.J.; Huang, R.Q.; Lan, F.A.; Zou, X.Q. Evolution mechanism and deformation stability analysis of rock slope block toppling for early warnings. Nat. Hazards 2022, 114, 1171–1195. [Google Scholar] [CrossRef]
- Zhang, H.; Xu, X.; Zheng, Y.; Li, H.; Guo, H. Experimental and numerical study of the mechanism of block–flexure toppling failure in rock slopes. Bull. Eng. Geol. Environ. 2022, 81, 63. [Google Scholar] [CrossRef]
- Zheng, Y.; Chen, C.X.; Liu, T.T. Study on the mechanisms of flexural toppling failure in anti-inclined rock slopes using numerical and limit equilibrium models. Eng Geol. 2018, 237, 116–128. [Google Scholar] [CrossRef]
- Zheng, Y.; Wang, R.Q.; Chen, C.X.; Meng, F. Analysis of flexural toppling failure in rock slopes using discrete element method. Front. Earth Sci. 2021, 9, 773088. [Google Scholar] [CrossRef]
- Liu, X.; Liu, Y.; Lu, Y.; Li, X.; Li, P. Numerical analysis of evaluation methods and influencing factors for dynamic stability of bedding rock slope. J. Vibroengineering 2017, 19, 1937–1961. [Google Scholar] [CrossRef]
- Wu, Y.; Liu, D.; Song, Q.; Ou, Y. Reliability analysis of slope dynamic stability based on strength reduction FEM. Rock Soil Mech. 2013, 34, 2084–2090, (In Chinese with English Abstract). [Google Scholar]
- Amini, M.; Ardestani, A.; Khosravi, M.H. Stability analysis of slide-toe-toppling failure. Eng. Geol. 2017, 228, 82–96. [Google Scholar] [CrossRef]
- Amini, M.; Majdi, A.; Aydan, Ö. Stability analysis and the stabilisation of flexural toppling failure. Rock Mech. Rock Eng. 2009, 42, 751–782. [Google Scholar] [CrossRef]
- Amini, M.; Majdi, A.; Veshadi, M.A. Stability analysis of rock slopes against block-flexure toppling failure. Rock Mech. Rock Eng. 2012, 45, 519–532. [Google Scholar] [CrossRef]
- Zheng, Y.; Chen, C.X.; Meng, F. Assessing the stability of rock slopes with respect to block-flexure toppling failure using a force-transfer model and genetic algorithm. Rock Mech. Rock Eng. 2020, 53, 3433–3445. [Google Scholar] [CrossRef]
- Zhou, W.J.; Xu, W.Y.; Ning, Y.; Xiao, H.B.; Xie, W.C. Analytical method of stability analyses of toppling rock slopes subjected to flexural toppling failure damage. Eur. J. Environ. Civ. Eng. 2023, 27, 2373–2387. [Google Scholar] [CrossRef]
- Xia, K.Z.; Liu, X.M.; Cheng, C.X. Analysis of mechanism of bedding rock slope instability with catastrophe theory. Rock Soil Mech. 2015, 36, 477–486, (In Chinese with English Abstract). [Google Scholar]
- Jiang, L.; Huang, R.Q. Studies on estimate of sliding-bending rupture of bedded rock slopes. J. Mt. Sci. 2006, 1, 88–94, (In Chinese with English Abstract). [Google Scholar]
- Feng, J.; Zhou, D.P.; Yang, T. Stability analysis of consequent rock slopes using elastic-plastic plate theory. Chin. J. Geotech. Eng. 2010, 32, 1184–1188, (In Chinese with English Abstract). [Google Scholar]
- Liu, X. Introduction to Rock Rheology; Geology Press: Beijing, China, 1994. [Google Scholar]
- Xu, W.Y.; Yang, S.Q.; Chu, W.J. Nonlinear viscoelasto-plastic rheological model (hohai model) of rock and its engineering application. Chin. J. Rock Mech. Eng. 2006, 3, 433–447, (In Chinese with English Abstract). [Google Scholar]
- Li, S.Y.; Chen, Y.; Zhang, L.; Jiao, X.; Cai, R.K.; Liu, Y.K. Stability Evaluation of Typical Rocky High Slope of Baihetan Hydropower Station. Water Resour. Power 2018, 36, 102–105, (In Chinese with English Abstract). [Google Scholar]
- Yan, S.; Du, H.T.; Yu, Q.L.; Yan, H. Static Stability Safety Evaluation of High Bedding Rock Slope. J. Disaster Prev. Mitig. Eng. 2014, 34, 407–414, (In Chinese with English Abstract). [Google Scholar]


Disclaimer/Publisher’s Note: The statements, opinions and data contained in all publications are solely those of the individual author(s) and contributor(s) and not of MDPI and/or the editor(s). MDPI and/or the editor(s) disclaim responsibility for any injury to people or property resulting from any ideas, methods, instructions or products referred to in the content. |
© 2025 by the authors. Licensee MDPI, Basel, Switzerland. This article is an open access article distributed under the terms and conditions of the Creative Commons Attribution (CC BY) license (https://creativecommons.org/licenses/by/4.0/).