Article

Rainwater Treatment Using Ecological Buffer Zones: Influence of Plant and Filler Collocation

1
College of Life and Environmental Science, Wenzhou University, Wenzhou 325000, China
2
Institute for Eco-Environmental Research of Sanyang Wetland, Wenzhou 325014, China
3
Tianjin Shiprepairing Technology Research Institute, Tianjin 300450, China
4
School of Smarts Energy and Environment, Zhongyuan University of Technology, Zhengzhou 450007, China
*
Authors to whom correspondence should be addressed.
Water 2025, 17(5), 741; https://doi.org/10.3390/w17050741
Submission received: 31 December 2024 / Revised: 20 February 2025 / Accepted: 1 March 2025 / Published: 3 March 2025

Abstract

:
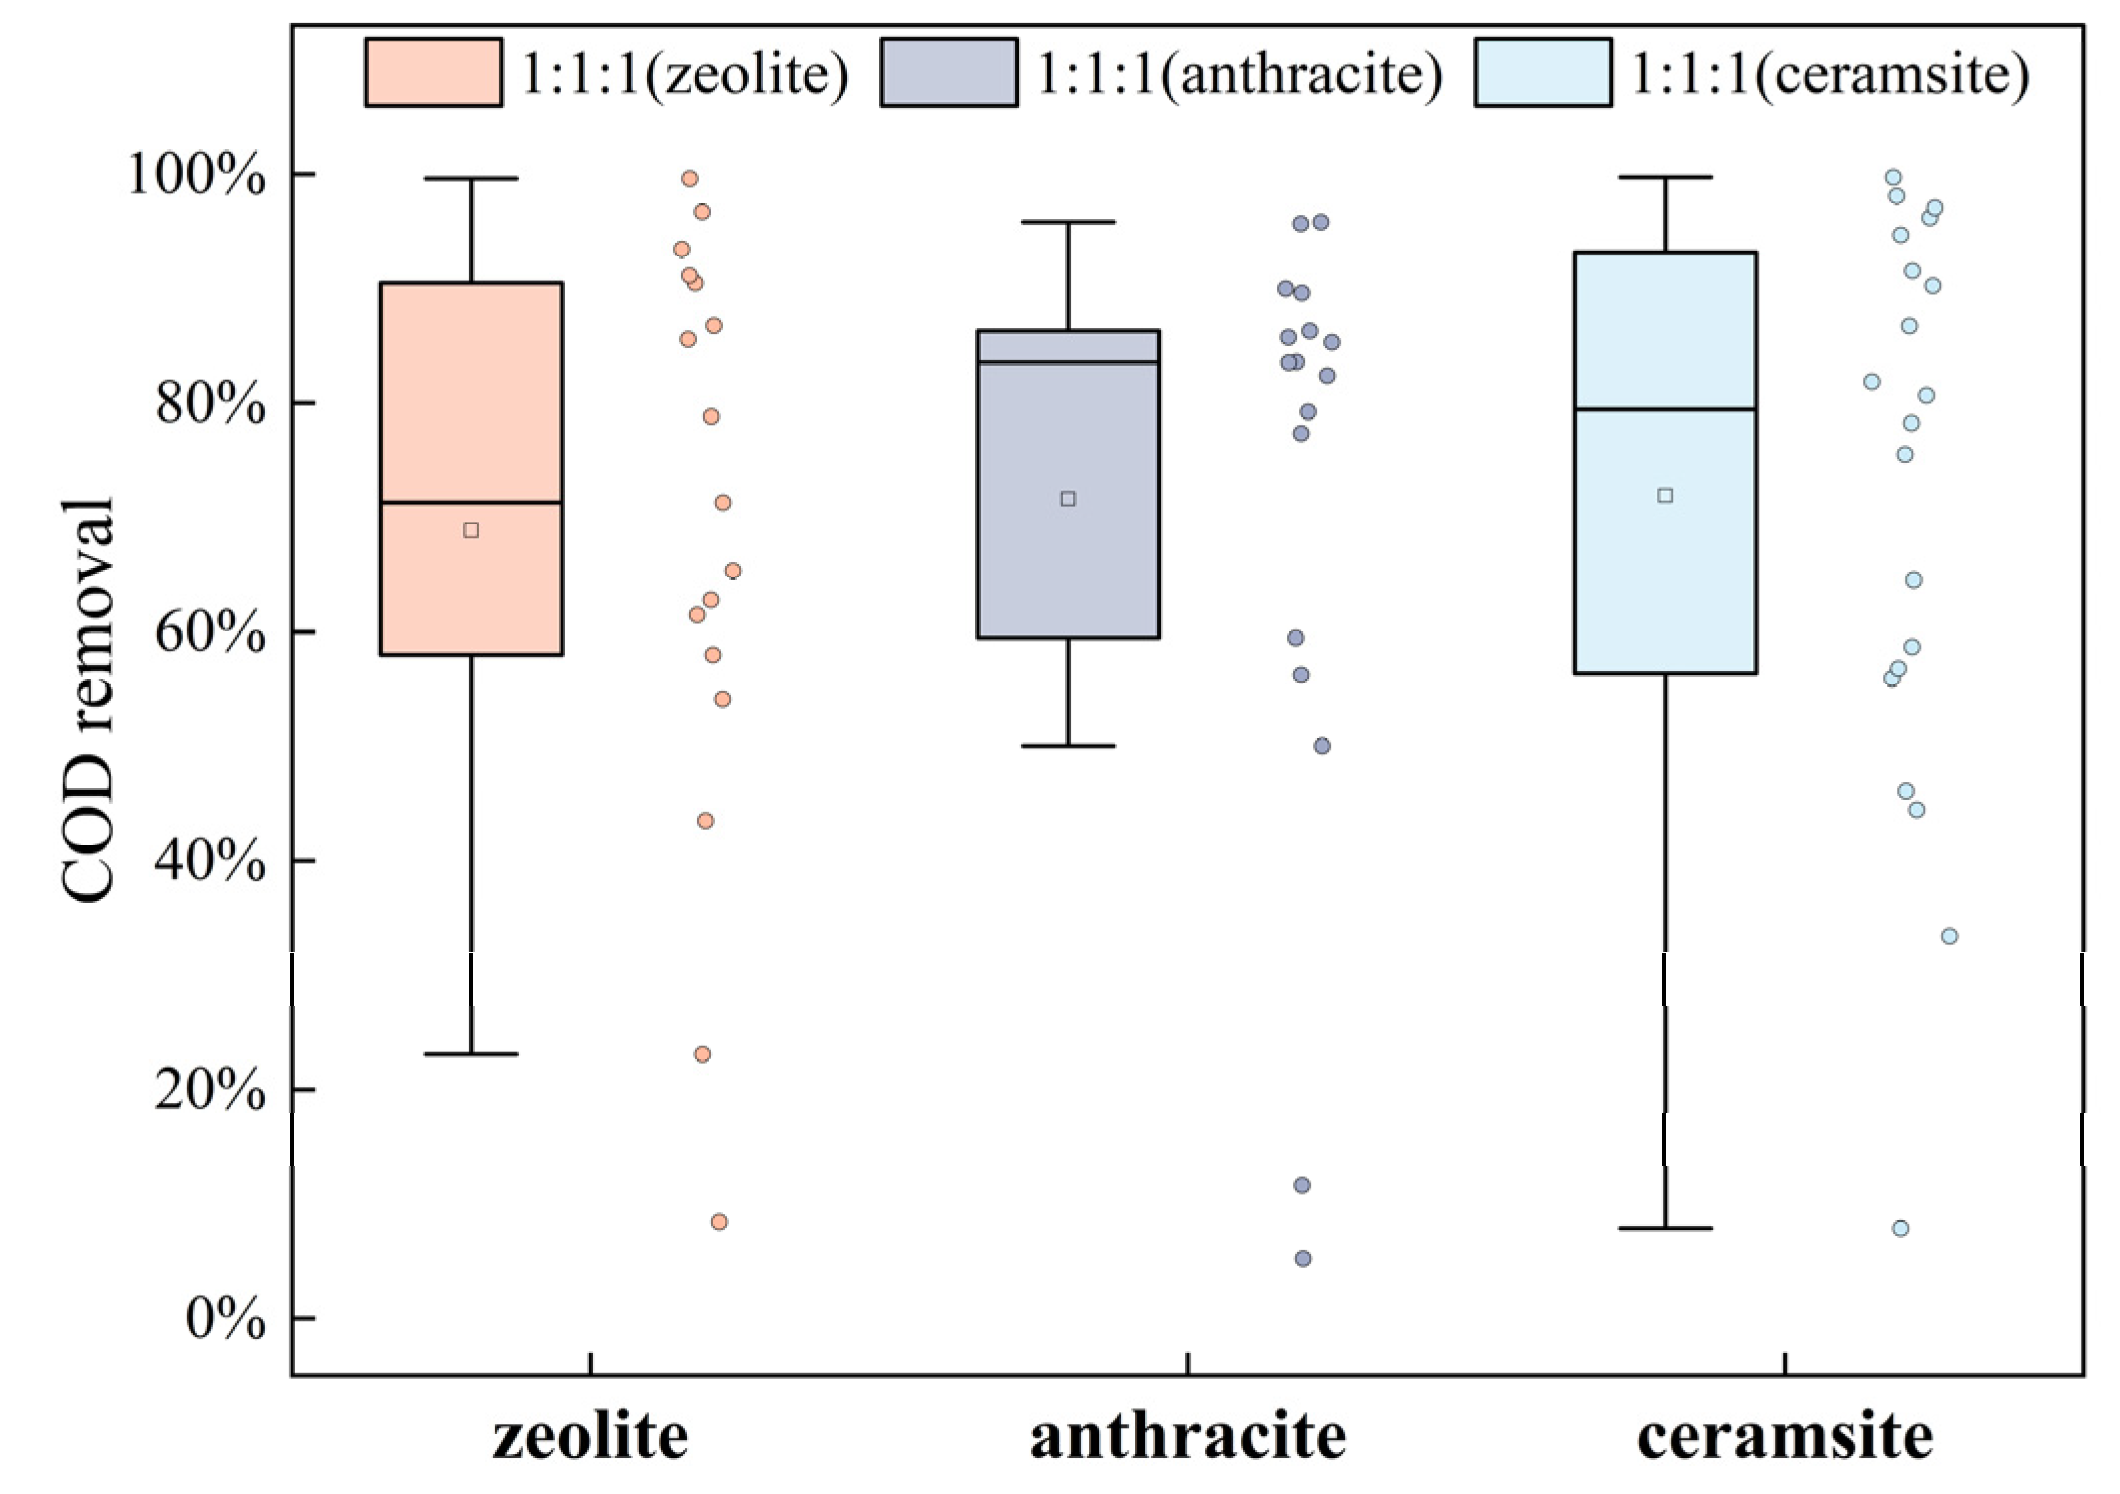
An ecological buffer zone system was designed using three different fillers (ceramsite, anthracite, and zeolite) and plants (Pennisetum hybridum, Canna, and Lythrum virgatum, 1:1:1) to explore the treatment efficiency and mechanisms for initial stormwater runoff. The effluent concentrations of COD, total nitrogen, ammonia nitrogen, and total phosphorus were tested. The removal efficiencies of various pollutants and an analysis of the microbial community on the surface of the fillers were used to determine the optimal combination of fillers and explore their influence mechanisms on the treatment of initial stormwater runoff by the ecological buffer zone. The results showed that when using the plant combination of Pennisetum hybridum, Canna, and Lythrum virgatum (1:1:1), zeolite and ceramsite performed better in nitrogen removal. The removal rates of total nitrogen and ammonium nitrogen using zeolite were 96.79% and 92.77%, respectively, while the removal rates for ceramsite were 93.76% and 91.49%. On the other hand, ceramsite was more effective in removing total phosphorus and COD, with removal rates of 83.64% and 71.67%, respectively. Based on the comprehensive research findings, the recommended filler combination for the ecological buffer zone was a mixture of zeolite and ceramsite.

1. Introduction

In recent years, due to the accelerated process of urbanization and the increase in impervious surfaces, the impact of initial stormwater runoff on water pollution became increasingly apparent, making it one of the major sources of non-point source pollution in cities [1,2,3]. Initial stormwater was the primary source of runoff pollution during the entire rainfall process, with the first 20% of the initial stormwater containing the total pollutant load of the rainfall runoff [4,5]; the urban initial rainwater contains contaminants such as organic matter, suspended solids (SSs), nitrogen, phosphorus, and heavy metals washed from air and soil [6]. Initial stormwater refers to the runoff that occurs during a specific period after surface water flow is formed during a rainfall event. The exact definition of this period may vary by region. Compared to runoff from the middle and later stages of the rainfall, the water quality of initial stormwater is more complex, often approaching or even exceeding the level of domestic wastewater [7,8]. If initial stormwater was discharged untreated into bodies of water such as lakes or urban rivers, it could negatively impact water quality and exacerbate urban non-point source pollution [9,10,11]. As a result, the treatment of initial stormwater and the control of surface pollution sources have increasingly gained attention.
Vegetated buffer zones have been proven to prevent the migration and transport of pollutants through the synergistic effects of vegetation, microorganisms, and soil [12,13]. They could enhance dissolved oxygen, provide habitats for wildlife, loosen soil, delay runoff, and regulate microclimates [14,15,16]. For these reasons, vegetated buffer zones have been increasingly used to reduce non-point source pollution in water bodies [17,18]. Bu et al. confirmed that mixed vegetated buffer zones could intercept 54.5–68.1% of total nitrogen and 62.3–77.5% of total phosphorus [19]. Lee et al. found that under natural rainfall conditions, a 7.1 m buffer zone could intercept 80% of total nitrogen and 62% of nitrate nitrogen [20]. Dunn et al. studied the impact of different vegetation types on runoff. During the monitoring period, compared to the control, the reductions in total runoff were as follows: willow buffer zone (49%), deciduous forest buffer zone (46%), and grass buffer zone (33%) [21]. This research highlighted the varying effectiveness of different vegetative buffers in reducing surface runoff, with willow buffer zones being the most effective in the study. These studies demonstrated the effectiveness of vegetated buffers in reducing nutrient pollution in water bodies. Canna, also known as a phytoremediation plant, is widely used in many countries, including China and others, to establish wetland ecosystems due to its high biomass, rapid growth rate, and prolonged root lifespan [22]. Under salt stress, the roots of Lythrum virgatum enrich the microbial diversity in the soil, with microbial diversity in the rhizosphere significantly higher than in the non-rhizosphere environment [23]. Studies have shown that Pennisetum hybridum [24], a suitable plant for screening and optimizing configurations to better adapt to local water and soil conditions, promotes wetland ecosystem restoration and wetland ecological construction. Therefore, the three plants mentioned above were chosen as the buffer zone vegetation in this experiment.
The fillers were a key component in the design of buffer zones because they served as a medium for microbial growth and could influence the movement of surface runoff [25]. Fillers were widely recognized for promoting biofilm development, plant growth in wetlands, and the removal of pollutants in constructed wetlands. They were particularly effective in removing pollutants, such as organic compounds, nitrogen, and phosphorus, through processes like filtration, adsorption, and precipitation [26,27,28,29,30]. Fu et al. treated wastewater using high-porosity ceramsite, activated carbon, and low-porosity sand, and found that the combination of sand + activated carbon + ceramsite achieved the highest removal efficiency for ammonia nitrogen and total nitrogen, with removal rates of 97.4% and 96.2%, respectively [31]. Vispo et al. researched synthetic stormwater runoff using organic filtration media, activated carbon, and inorganic filtration media and found that activated carbon exhibited a high pollutant removal efficiency [32]. The removal efficiencies for chemical oxygen demand (COD), total nitrogen, and total phosphorus were 54%, 56%, and 44%, respectively. Anthracite, ceramsite, and zeolite, as fillers, can effectively remove pollutants from wastewater [33,34,35,36]. Considering the water quality characteristics and the economic feasibility of the filler and plant combinations, this experiment selected ceramsite, anthracite, and zeolite for the filling material in the ecological buffer zone.
Based on the findings of the above studies, most research on ecological buffer zones for treating rainwater and surface runoff pollution focused on individual factors such as plant selection, filler choice, and buffer zone width, with a limited comprehensive investigation of both plants and fillers. This was not conducive to the optimal functioning of the buffer zone in the treatment of initial stormwater. In this study, Canna, Lythrum virgatum, and Pennisetum hybridum were selected as plants, and three different fillers—ceramsite, anthracite, and zeolite—were used to design an ecological buffer zone system. The treatment efficiency and mechanisms for initial stormwater were explored.
The objectives of this study were (1) to construct an ecological buffer zone system using ceramsite, anthracite, and zeolite as filler layers, and analyze the removal efficiency of pollutants such as organic matter, nitrogen, and phosphorus from initial stormwater, (2) to identify the impact of different fillers on the treatment efficiency of the buffer zone and determine the optimal filler combination, and (3) to explore the mechanism of filler influence on the treatment capacity of the buffer zone by combining the treatment results with microbial community analysis of the filler surfaces. This study can provide valuable reference for researchers and engineers to conduct studies and real applications on ecological buffer zones in ecological restoration.

2. Materials and Methods

2.1. Laboratory-Scale Experimental Setup

The experimental device was rectangular, with a sealed bottom, and was made of 2 cm thick PVC hard plastic sheets. A ring of additional PVC hard plastic was added around the middle of the device to enhance its strength. A spillway was designed on the left side of the device, with a circular hole on the spillway to allow water intake and ensure uniform water distribution. The dimensions of the buffer zone were 100 cm in length, 50 cm in width, and 130 cm in height. Additionally, a drainage outlet was installed at the bottom of the device, allowing for the removal of accumulated water by opening a valve after the experiment. The device was structured with an 80 cm filler layer, a 20 cm soil layer, and a 20 cm plant layer from bottom to top, with a 10 cm space at the top reserved for planting. The plant coverage rate was 100%. A 1.5 mm thick permeable geotextile was placed between the soil and filler layers to prevent soil particles from being washed into the filler layer, which could cause clogging. A schematic diagram of the experimental setup is shown in Figure 1.
The entire experimental setup consisted of components such as a water distribution tank, inlet and outlet pipelines, a water pump, an ecological buffer zone unit, and an effluent sampling bottle. In the laboratory, artificial rainwater was initially prepared, and after passing through the ecological buffer zone unit, the treated effluent was collected for water quality analysis.

2.2. Experimental Materials

Due to the instantaneous and unpredictable nature of rainfall, and in order to eliminate the impact of variations in rainfall runoff and pollutant concentrations on removal performance, this study employed artificially prepared simulated rainwater for the experiments. The pollutant concentrations were based on the indicators of initial rainwater runoff in Wenzhou, ensuring that the experimental conditions closely reflect real conditions. The experimental water concentrations are as follows: total nitrogen (TN): 1.8 mg/L to 4.2 mg/L, total phosphorus (TP): 0.05 mg/L to 0.2 mg/L, ammonium nitrogen (NH4+-N): 0.2 mg/L to 1.8 mg/L, and chemical oxygen demand (COD): 50 mg/L to 150 mg/L.
The solution mentioned above was prepared using potassium dihydrogen phosphate (KH2PO4), ammonium chloride (NH4Cl), potassium nitrate (KNO3), and anhydrous sodium acetate (C2H3NaO2).

2.3. Experimental Design

The soil used in the experimental setup was sourced from Wenzhou University, with impurities removed. The soil particles were dried and sieved through a 2 mm mesh to obtain the experimental soil. The experimental fillers (the fillers were purchased from Henan Tiancheng Water Affairs Co., Ltd., Zhengzhou, China) selected were as follows: 1. anthracite, 2. ceramsite, and 3. zeolite. The plants (the plants were collected from the Sanyang Wetland in Wenzhou, Wenzhou, China) used in the experiment were a combination of Pennisetum hybridum, Canna, and Lythrum virgatum, planted in a 1:1:1 ratio. The experimental setup used artificially prepared initial rainwater for inflow. Each device received 0.125 m3 of water every 2 days. Before inflow, water samples were collected from the outlet using sampling bottles. At the end of the experiment, the collected water samples were analyzed in the laboratory. If all indicators could not be tested on the same day, the water samples were stored in a 4 °C refrigerator and were analyzed within 48 h. The experiment lasted for 60 days, during which the effluent’s chemical oxygen demand (COD), total nitrogen (TN), ammonia nitrogen (NH4-N), and total phosphorus (TP) concentrations were tested.
Following the microbial sampling method of the Megji Microbiology Platform, microbial samples were collected from the fillers at the mid-experiment (30 days) and late-experiment (60 days) stages for subsequent analysis of the microbial communities on the filler surfaces. Simultaneously, samples were collected for the analysis of the microstructural properties of the fillers at both the mid- and late-experiment stages.
This study analyzed the removal efficiency of pollutants and the microbial community on the surface of the fillers, investigating the mechanisms by which different fillers affected the treatment of initial rainwater in buffer zones. The goal was to identify the optimal combination of fillers for the treatment system.
The removal efficiency of pollutants by the ecological buffer zone for initial rainwater was calculated using the following equation [37]:
η = C 0 C 1 C 1 × 100 % ,
where η is the removal efficiency of the pollutant concentration in the filter zone at a given time, and C 0 and C 1 are the concentrations of the pollutant in the inflow and effluent water (mg/L).

2.4. Methods and Measurement

The specific methods for measuring the water quality indicators of the experimental effluent are provided in Table 1.
The fillers were dried and ground into a powdered sample for microscopic property analysis. The instruments and equipment models used for the filler microscopic property analysis, along with the test contents, are shown in Table 2.
Microbial sampling of the filler was performed according to the microbial sampling method of Megji Microbiology Platform, with microbial analysis conducted by Shanghai Megji Microbiology Company (Shanghai, China). Total genomic DNA of the microbial community was extracted using the E.Z.N.A.® soil DNA kit (Omega Bio-tek, Norcross, GA, USA) following the manufacturer’s protocol. The quality of the extracted genomic DNA was assessed by 1% agarose gel electrophoresis, and DNA concentration and purity were measured using a NanoDrop2000 (Thermo Scientific, Waltham, MA, USA).
The DNA extracted above was used as a template for subsequent analyses. The bacterial 16S rRNA gene V3-V4 variable region was amplified using the upstream primers 338F (5′-ACTCCTACGGGAGGCAGCAG-3′) and 806R (5′-GGACTACHVGGGTWTCTAAT-3′) carrying Barcode sequences [38]. The PCR reaction system was as follows: 4 μL of 5 × FastPfu Buffer, 2 μL of 2.5 mM dNTPs, 0.8 μL of upstream primer (5 µM), 0.8 μL of downstream primer (5 µM), 0.4 μL of FastPfu polymerase, 0.2 μL of BSA, and 10 ng of template DNA; ddH2O was added to a final volume of 20 μL. The amplification program was as follows: 95 °C for 3 min (pre-denaturation), followed by 30 cycles of 95 °C for 30 s (denaturation), 55 °C for 30 s (annealing), and 72 °C for 45 s (extension). After the 30 cycles, a final extension was performed at 72 °C for 10 min, and the reaction was stored at 10 °C (PCR instrument: ABI GeneAmp® 9700, BIO-RAD Company, Hercules, CA, USA). The PCR products were detected by 2% agarose gel electrophoresis, and the products were purified using a DNA gel recovery kit (PCR Clean-Up Kit, Yuhua, China). The purified products were then quantified using Qubit 4.0 (Thermo Fisher Scientific, USA).
Library Construction Using the NEXTFLEX Rapid DNA-Seq Kit (Bioo Scientific, Austin, TX, USA) for Purified PCR products involved the following steps: (1) adapter ligation, (2) removal of adapter-dimer fragments using magnetic bead selection, (3) enrichment of the library template via PCR amplification, and (4) recovery of PCR products using magnetic beads to obtain the final library. Sequencing was performed using the Illumina Nextseq2000 platform (Illumina, San Diego, CA, USA) according to the standard protocols by Majorbio Bio-Pharm Technology Co., Ltd. (Shanghai, China).

3. Results and Discussion

3.1. Removal Efficiency of Different Fillers for Initial Rainwater Pollutants Subsection

3.1.1. Effect of Different Fillers on the Removal of Total Nitrogen (TN) and Ammonium Nitrogen (NH4+-N)

The removal of TN in the ecological buffer zone was influenced not only by the absorption of fillers and plants but also by factors such as ammonia volatilization, filler adsorption, filtration, nitrification, and denitrification processes. Studies have confirmed that the removal of TN mainly relies on microbial nitrification and denitrification [39,40]. Furthermore, when the TN concentration in the initial rainwater runoff was too low, leading to insufficient nitrogen nutrients for biological growth and reproduction, or when it became excessively high and exceeded the needs of microorganisms and plants, the TN removal efficiency was reduced [41]. Therefore, the removal efficiency of total nitrogen in the ecological buffer zone was also related to the TN concentration in the initial rainwater runoff. The total nitrogen (TN) removal efficiency is shown in Figure 2. For the total nitrogen removal rate in initial rainwater, the order was zeolite (96.78%) > ceramsite (93.89%) > anthracite (91.04%), with zeolite and ceramsite showing better removal effects for total nitrogen.
Studies found a significant relationship between the treatment efficiency of ecological buffer systems and wetland fillers [42,43]. Research indicates that zeolite is a microporous material with ultra-micropores smaller than 2 nm, and it has an anion exchange capacity [44,45]. It can also aggregate nitrifying and denitrifying bacteria and remove ammonia nitrogen from solution [46].
However, the efficiency of ammonia nitrogen removal was also influenced by other factors, leading to instability in the ammonia nitrogen removal efficiency of the buffer zone filler system [47]. The ammonium nitrogen (NH4+-N) removal efficiency is shown in Figure 3. For the ammonia nitrogen removal rate in initial rainwater, the order was zeolite (85.89%) > ceramsite (82.83%) > anthracite (80.16%).
Overall, zeolite exhibited better nitrogen removal performance when used as a filler. To understand the nitrogen removal mechanism of zeolite, its microscopic properties were further studied in conjunction with the relevant microbial communities.
XRD results showed that the experimental zeolite was composed of calcium aluminate decahydrate (CaAl2O4·10H2O), sodium bisulfate (NaHSO4), and calcium ferrite compounds (Ca2Fe9O13), among others. As a commonly used nitrogen adsorbent, zeolite has a unique surface structure and better adsorption, ion exchange, and catalytic functions [48]. Research has shown that zeolite has ion exchange capacity in wastewater treatment but requires biological and chemical regeneration methods [49]. According to the SEM results, it can be observed that zeolite had a rich and rough surface, as well as a unique lattice structure. These particulate surfaces provided a large surface area with numerous ion exchange sites. These ion exchange sites could interact with NH₄+ ions in ammonia nitrogen, thereby adsorbing ammonia nitrogen from water [50].

3.1.2. Effect of Different Fillers on Total Phosphorus (TP) and Chemical Oxygen Demand (COD) Removal

The removal of total phosphorus (TP) in the ecological buffer zone mainly depended on the fillers in the filler layer, the planted vegetation, and the microorganisms, as well as the combined effects of these three components. Among these factors, the filler played the most important role in TP removal, while the combined effect of planted vegetation and microorganisms was secondary. The stability of the buffer zone filler enhanced the adsorption of TP and the absorption by microorganisms [51]. Ceramsite demonstrated stronger phosphorus removal efficiency than zeolite and anthracite. For the removal rate of total phosphorus in initial rainwater, the order was ceramsite (72.43%) > anthracite (69.47%) > zeolite (37.80%). The total phosphorus (TP) removal efficiency is shown in Figure 4.
Research showed that different fillers had a certain effect on COD removal. The reason was that the fillers themselves could not only adsorb some pollutants but also provide a larger specific surface area, which created favorable conditions for microbial growth and activity. This allowed microorganisms to more efficiently adsorb and promote the degradation of water pollutants in wastewater.
For the COD removal rate in initial rainwater, the order was ceramsite (71.92%) > anthracite (71.60%) > zeolite (68.87%). The chemical oxygen demand (COD) removal efficiency is shown in Figure 5.
Overall, ceramsite exhibited significantly better removal performance for both TP and COD compared to the other two fillers, with anthracite following in second place.
When treating phosphorus-containing initial rainwater runoff, during the biological adsorption phase, the phosphates in the runoff were adsorbed and chemically reacted with the surface and internal microorganisms of the ceramsite. The XRD results of ceramsite showed that its main components included silica (SiO2), as well as layered calcium aluminate hydrates (Ca2Al(OH)7.3H2O) [52], alumina (Al2O3), and others. Upon contact between ceramsite and initial rainwater, Fe3+, Al3+, and Ca2+ ions in the ceramsite were retained [53]. These ions could convert PO43−-P in the runoff into phosphorus precipitates [54], thus achieving phosphorus removal. Additionally, the Fe3+ and Al3+ on the ceramsite surface could adsorb NO3-N, resulting in a certain level of nitrogen removal efficiency [55].
According to SEM and BET analysis, the high porosity and large specific surface area of ceramsite significantly enhanced its adsorption capacity [52], providing a basis for its ability to remove nitrogen (N) and chemical oxygen demand (COD) [56,57].

3.2. Microscopic Properties of the Fillers

3.2.1. Scanning Electron Microscope (SEM)

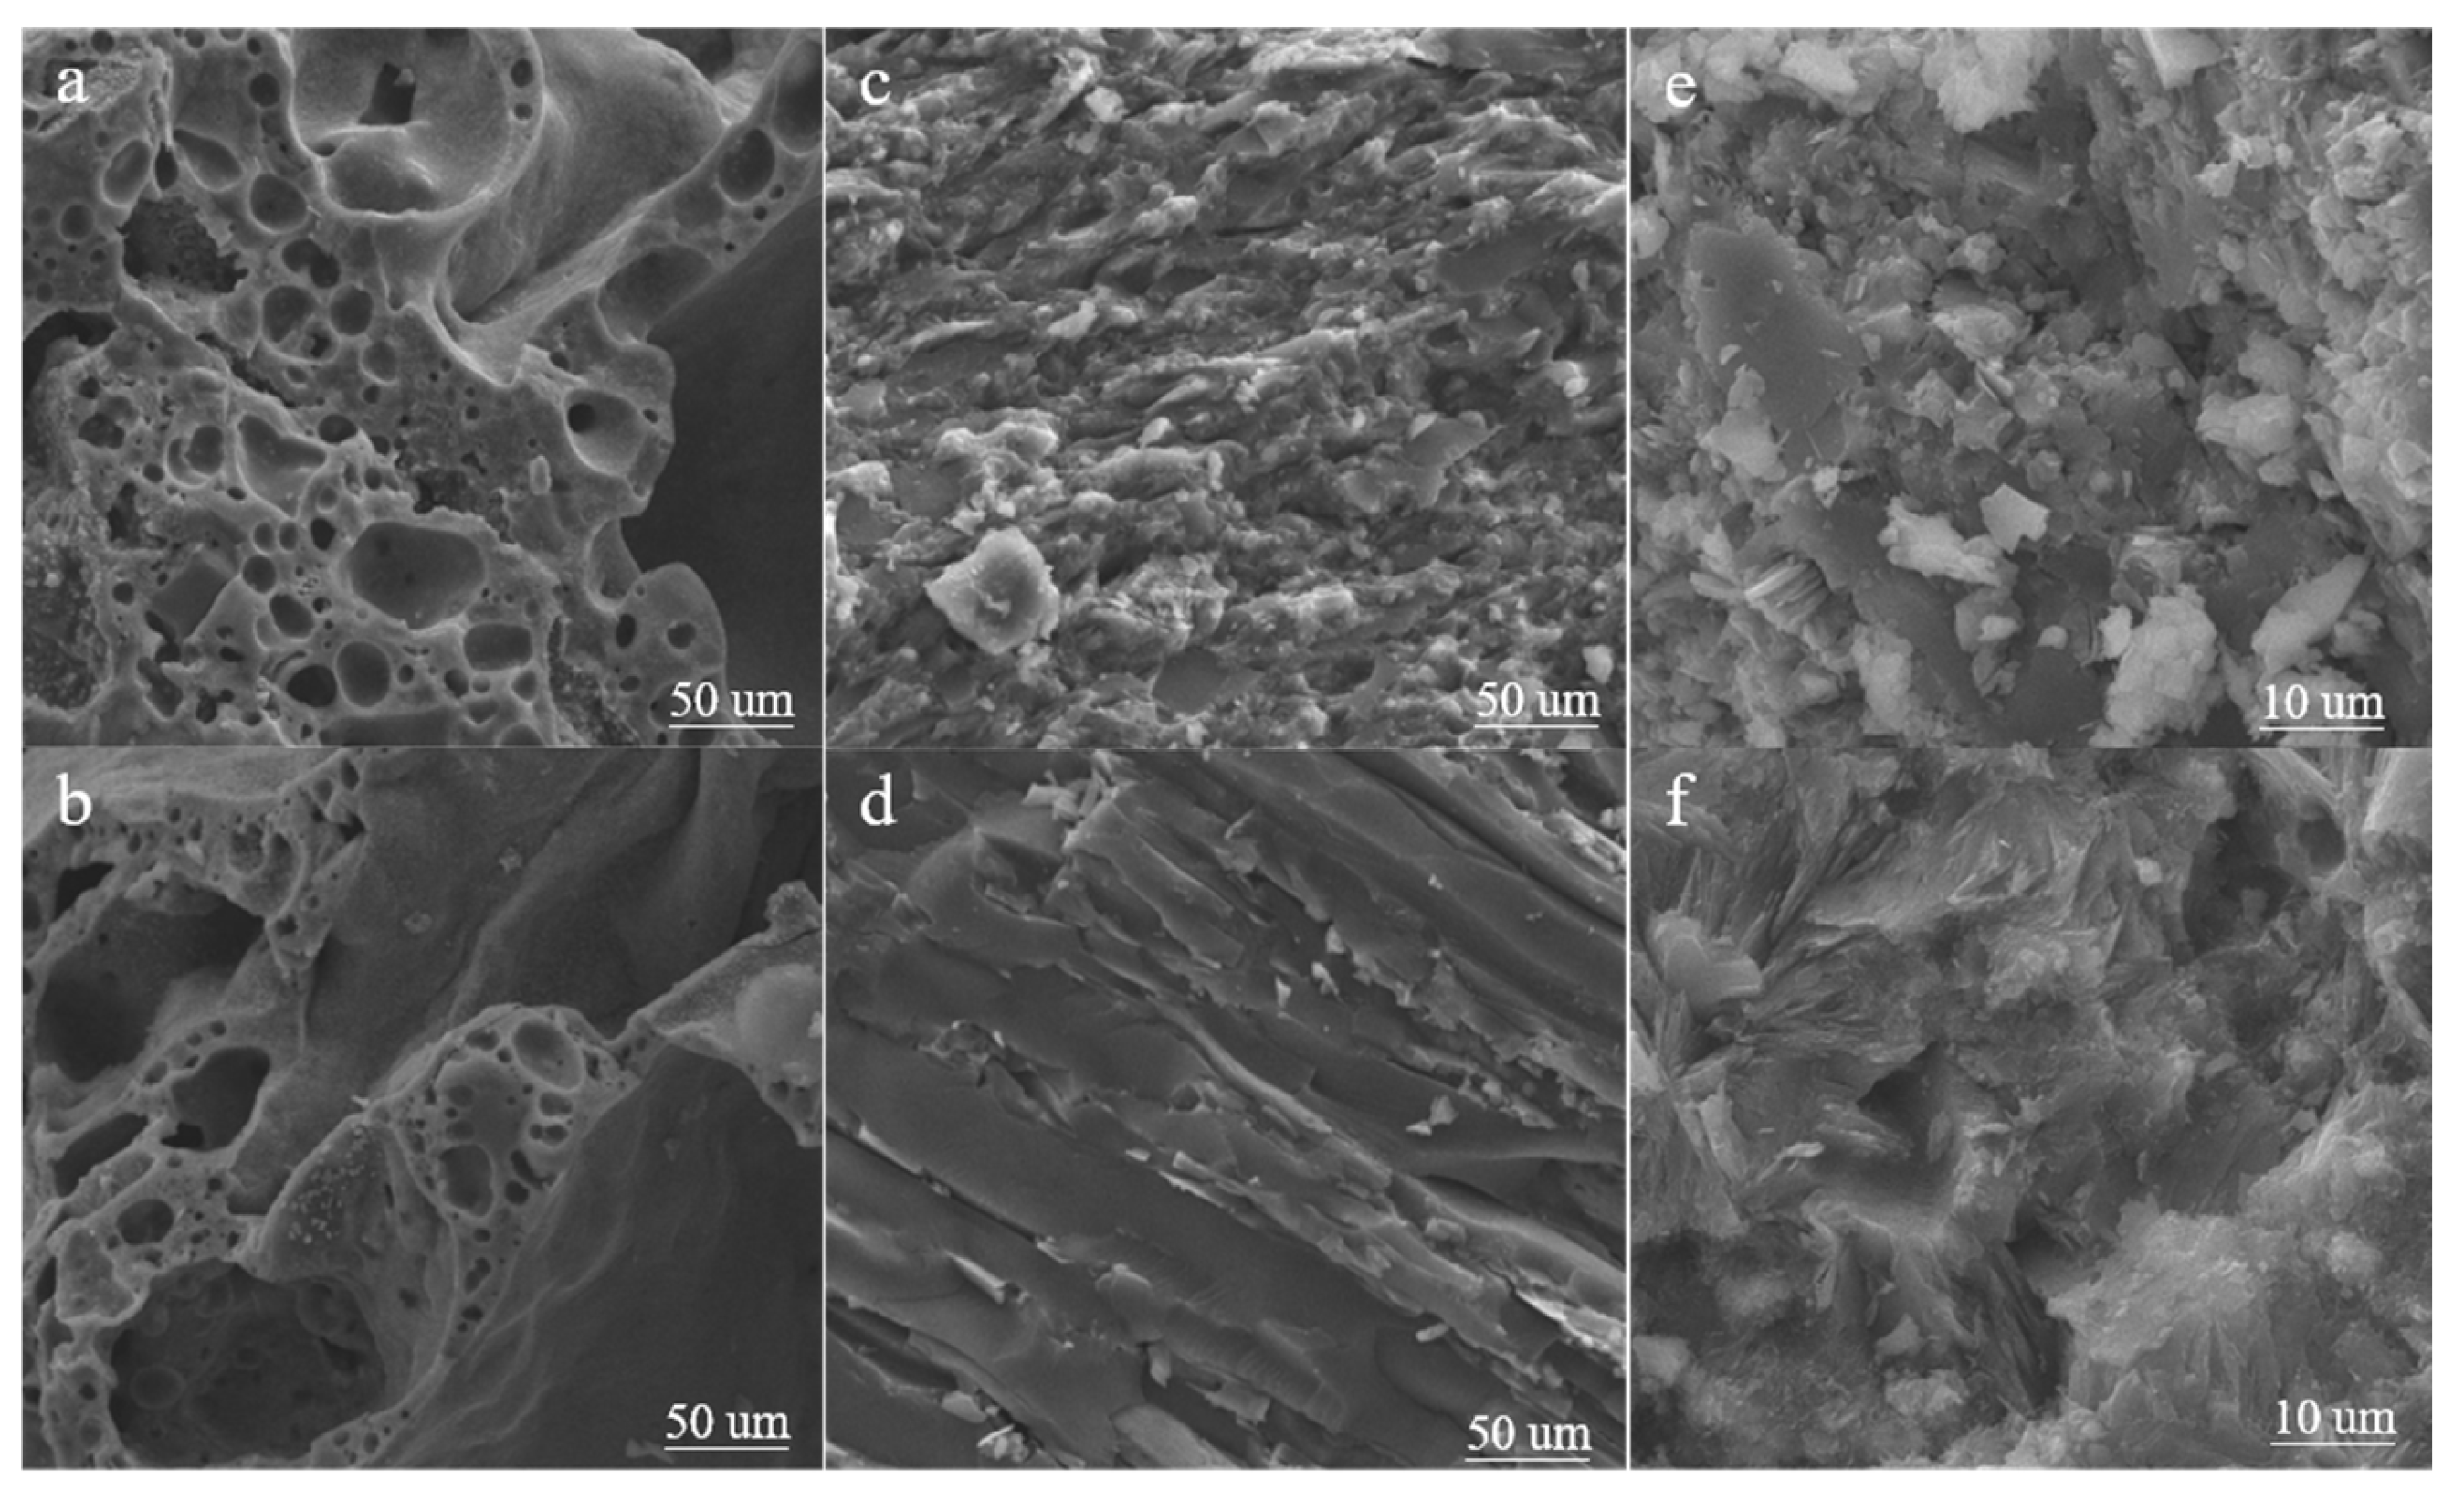
In order to further understand the surface morphology and microstructure of the three fillers, scanning electron microscopy (FEI Quanta 650, USA) was used to analyze the cross-sections of the samples. The scanning electron microscope images of ceramsite, anthracite, and zeolite are shown in Figure 6.
From Figure 6a,b, it can be seen that the changes in the medium and small pore sizes of the expanded clay aggregate (ECA) were not significant during the middle and later stages of the experiment, and the surface pores remained relatively stable. However, as the experiment progressed, a few larger pore sizes appeared on the surface of the ECA. These larger pores exhibited an irregular, porous cross-sectional characteristic. This change in pore structure likely increased the specific surface area of the ECA, providing more adsorption sites. The higher surface area not only enhanced the contact opportunities between the ECA and organic compounds in the water, but also likely improved its adsorption efficiency for nitrogen, phosphorus, and other organic compounds. During the pollutant removal process, the porous structure of the ECA helped to adsorb soluble pollutants in water, particularly improving the removal efficiency of nitrogen and phosphorus compounds.
Figure 6c,d shows the surface changes of anthracite coal during the experiment. In the middle of the experiment, the anthracite coal exhibited a relatively dense surface structure with fewer pores, and the pore sizes were smaller. As the experiment progressed, the surface of the anthracite coal gradually changed from a rough, granular texture to a smooth, band-like state. This change suggests that the anthracite coal may have undergone surface refinement or some form of particle rearrangement during the experiment, resulting in a smoother surface. Due to the fewer pores and relatively smaller surface area, its adsorption capacity for pollutants may have been somewhat limited. Nevertheless, with the change in surface roughness, its adsorption effectiveness for certain types of pollutants, particularly for larger particles or macromolecular pollutants, may have improved.
Figure 6e,f depicts the surface changes of zeolite during the experiment. In the middle stage of the experiment, the zeolite exhibited a relatively uniform cluster-like particle structure. These clustered structures facilitated the efficient adsorption of pollutants, especially when their pore network provided a larger specific surface area. As the experiment advanced, the zeolite’s particle structure changed, with the denser cluster-like structure transforming into fewer particles with a rough and uneven surface. This change may have indicated that the zeolite’s surface underwent physical or chemical processes, leading to clogging or partial modification of its pore structure, which, in turn, affected its adsorption performance. Although the number of particles decreased, its irregular and rough surface may have still helped maintain a certain level of adsorption, particularly for the selective adsorption of certain specific pollutants.
Overall, all three materials underwent varying degrees of surface morphological changes during the experiment, which directly influenced their adsorption properties and pollutant removal capabilities. The porous structure of the expanded clay aggregate may have helped improve its adsorption of soluble organic compounds such as nitrogen and phosphorus. The surface changes of anthracite coal may have affected its adsorption of larger particle pollutants, while the changes in the pore structure of zeolite may have led to varying degrees of changes in its adsorption performance.

3.2.2. X-Ray Diffraction (XRD)

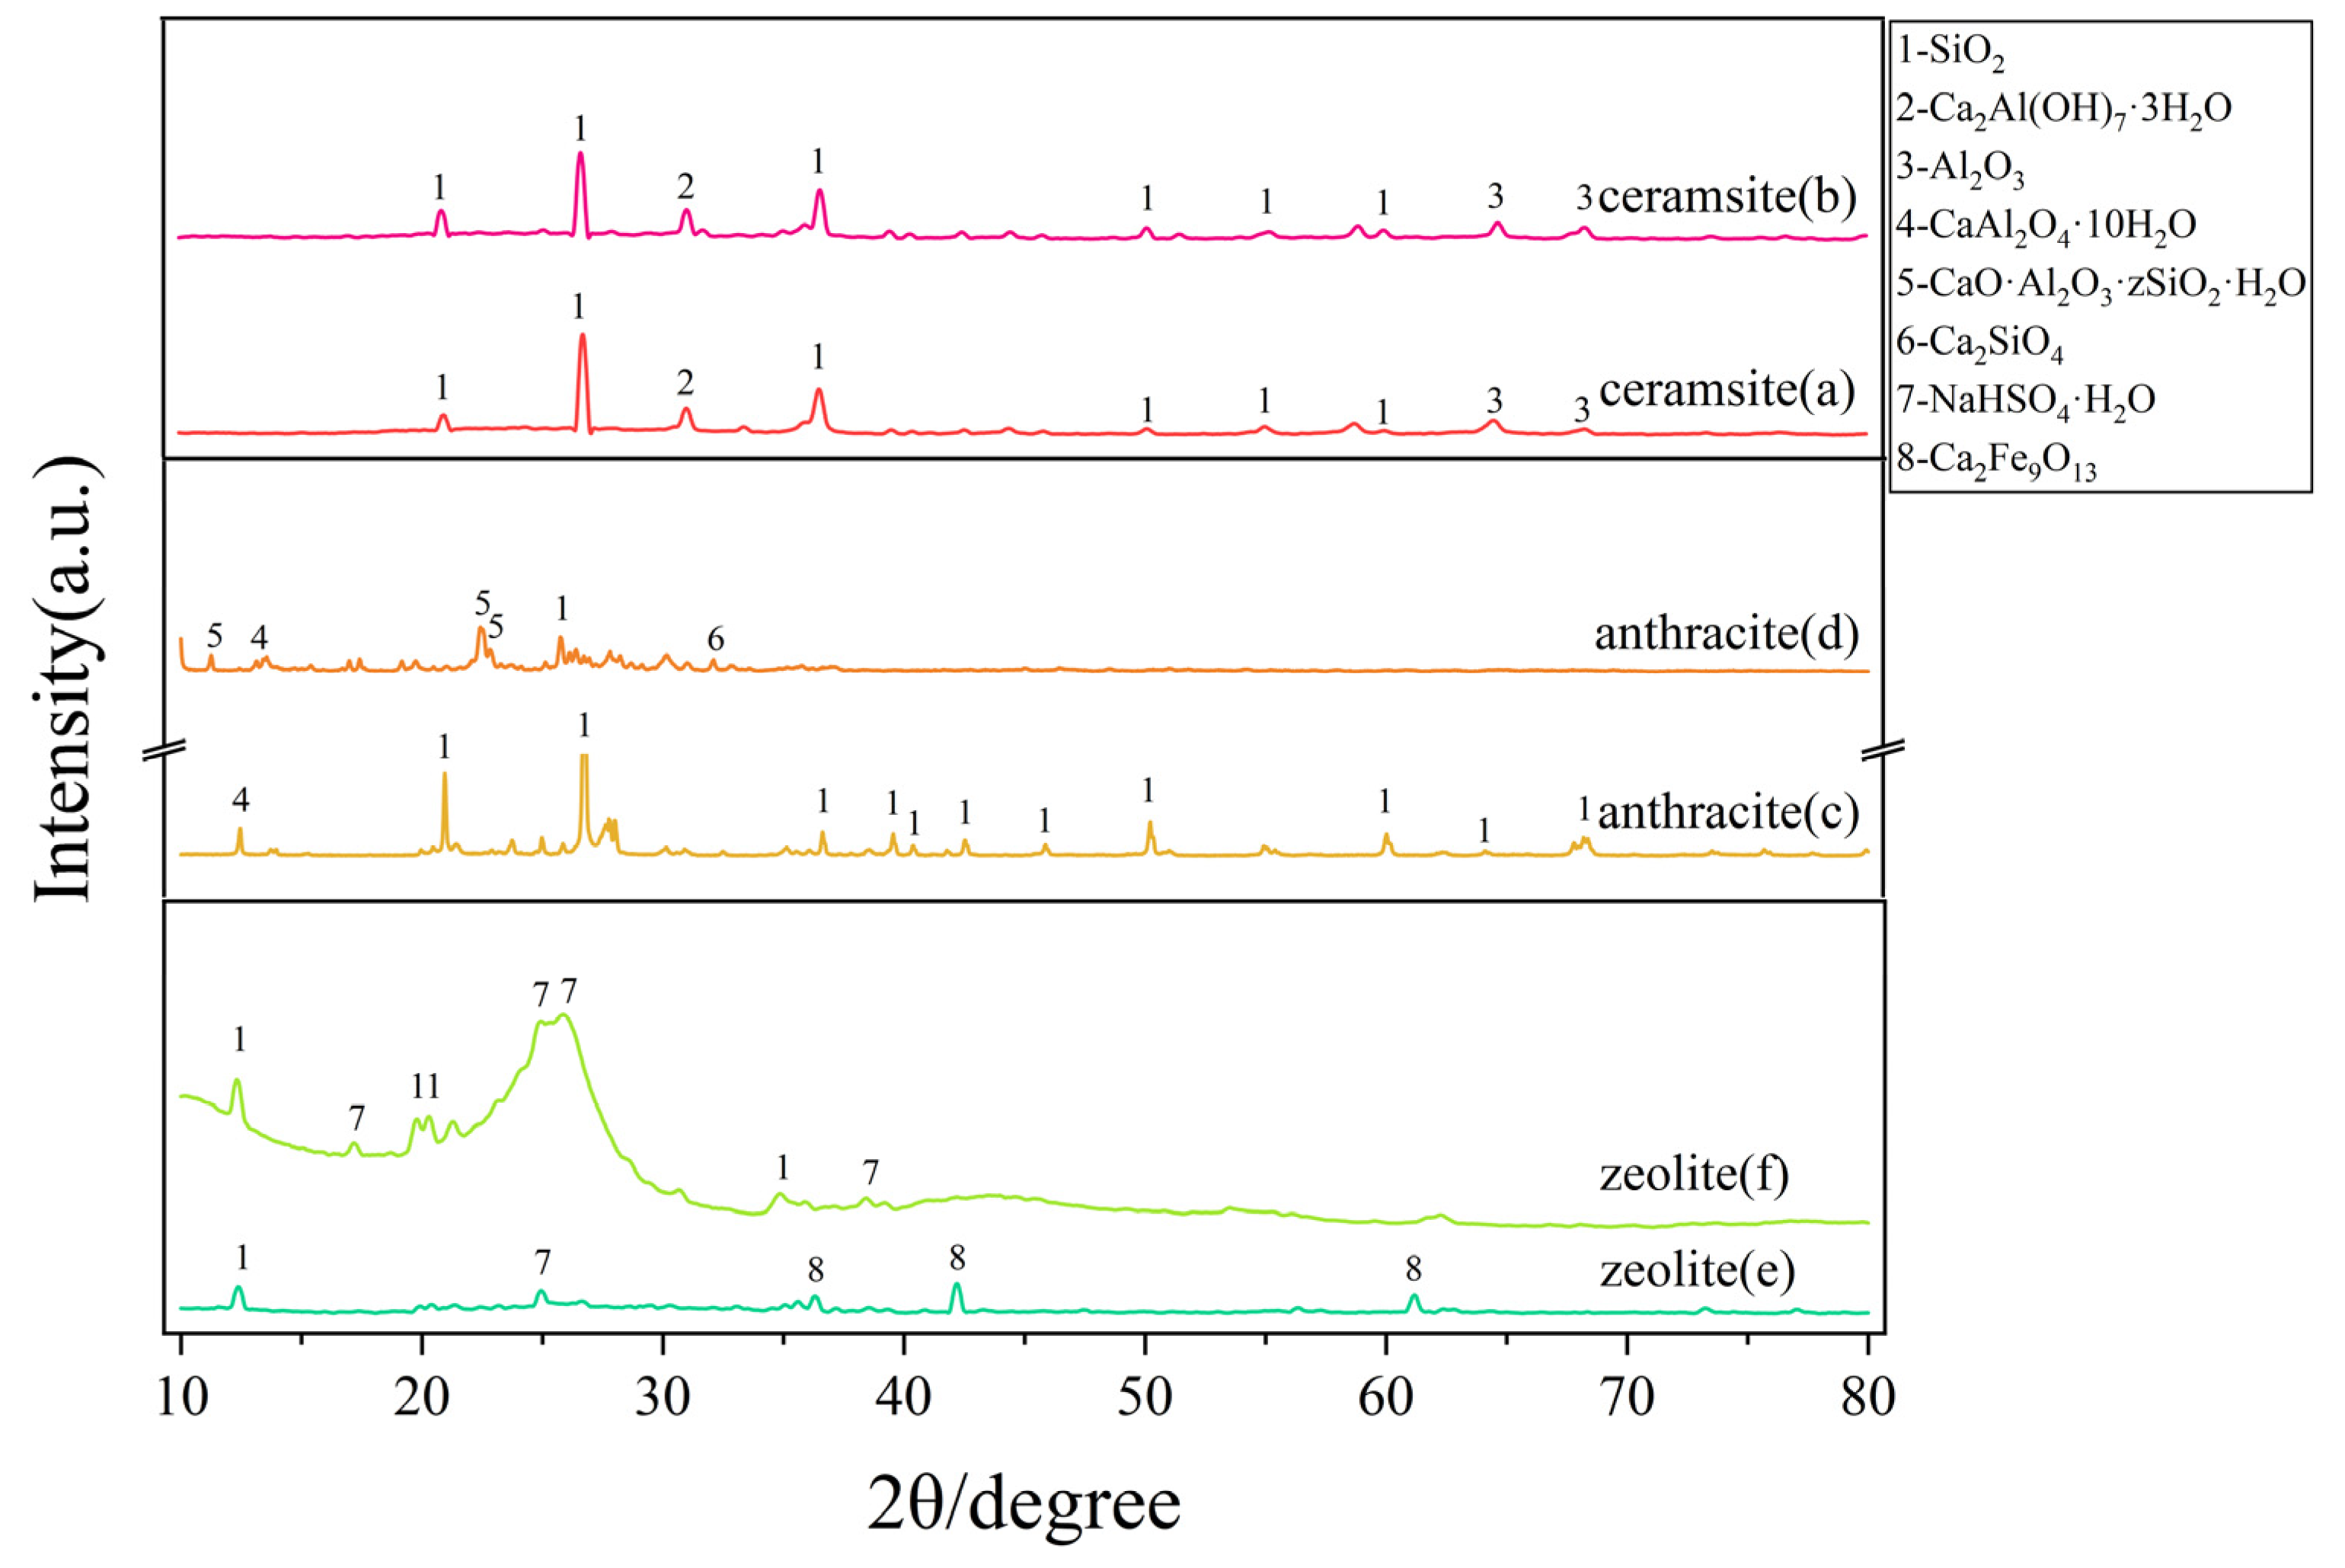
In this study, the mineral composition of the three types of fillers was determined using an X-ray diffractometer (Bruker D2 Phaser, Germany). The samples were scanned in the 2θ range from 10° to 80°. The X-ray diffraction patterns were compared with the database (Powder Diffraction File—International Centre for Diffraction Data, ICDD) to identify the minerals present in the samples [58] (Figure 7).
The XRD patterns showed that the main components of the experimental ceramsite were silica (SiO2), along with layered calcium aluminate hydrate (Ca2Al(OH)7·3H2O) [59], alumina (Al2O3), and other compounds. These components suggested that ceramsite had a high content of silicate minerals and might have exhibited certain physical adsorption properties, enabling it to remove ammonia nitrogen to some extent. However, the ammonia nitrogen removal efficiency of ceramsite was lower than that of zeolite, likely due to its relatively weaker adsorption capacity.
Ceramsite performed best in removing total phosphorus (TP) and chemical oxygen demand (COD). This was attributed to the calcium aluminate hydrate present in ceramsite and its relatively large specific surface area, both of which contributed to phosphorus adsorption and precipitation. The surface and pore structure of ceramsite may have facilitated the adsorption of organic matter, reducing the concentration of organic pollutants in water. Additionally, ceramsite might have contained trace elements or chemical components that could have promoted the degradation or transformation of certain organic substances, further lowering COD. SiO2 exhibits high chemical stability and strong surface adsorption capacity. In water treatment, SiO2, as an important component of ceramsite, can remove dissolved substances in water through its surface adsorption, especially demonstrating effective removal of non-polar pollutants, such as COD. The hexagonal crystal structure of quartz provides a strong surface chemical adsorption ability, which is one of the reasons for ceramsite’s excellent performance in COD removal. Al2O3 has a strong ion exchange capacity, particularly effective in removing ammonium nitrogen (NH4+) and total nitrogen. The ion exchange properties of Al2O3 allow it to adsorb ammonium ions and other cations in water. Due to its trigonal crystal structure with a well-ordered lattice arrangement, the surface of Al2O3 can react effectively with ammonium nitrogen, which contributes to ceramsite’s superior performance in removing ammonium nitrogen and total nitrogen.
The main components of the experimental anthracite are silica (SiO2), along with calcium aluminate decahydrate (CaAl2O4·10H2O) [60], CaO-Al2O3-SiO2-H2O [61,62], dicalcium silicate (Ca2SiO4), and others. In the later stages of the experiment, SiO2 in the anthracite reacts with CaAl2O4·10H₂O, leading to the formation of more CaO-Al2O3- SiO2-H₂O and Ca2SiO4 compared to the mid-experiment stage. This suggests that during the experiment, the mineral components of the anthracite underwent partial transformation. SiO2 has a typical crystalline structure, and it shows clear diffraction peaks in the XRD pattern. Calcium aluminate hydrate (CaAl2O4·10H2O), CaO-Al2O3-SiO2-H2O, and dicalcium silicate (Ca2SiO4) also have certain crystalline structures, especially Ca2SiO4, which is commonly found in cement and ceramic materials and has a stable crystalline structure. In terms of total phosphorus (TP) and chemical oxygen demand (COD) removal, anthracite performs worse than ceramsite. The active sites on its surface may provide some adsorption capacity for TP and COD, but its effectiveness is not as significant as that of ceramsite.
The main components of the experimental zeolite are calcium aluminate decahydrate (CaAl2O4·10H2O) [60], along with sodium bisulfate (NaHSO4) and calcium ferrite compounds (Ca2Fe9O13) [63]. In the later stages of the experiment, the calcium ferrite compound (Ca2Fe9O13) decreased compared to the mid-experiment stage. This change may be due to some structural transformation of the zeolite during the reaction process, leading to the decomposition or transformation of this calcium ferrite compound. Calcium aluminate hydrate (CaAl2O4·10H2O) itself is a crystalline compound, and calcium ferrite (Fe2Ca9O13) and other mineral components (such as NaHSO4) may also form crystalline structures. Therefore, zeolite is likely a material with a mixed crystalline structure. In the later stages of the experiment, some components (such as Fe2Ca9O13) decreased, and the XRD pattern exhibited broad diffraction bands without distinct sharp peaks, indicating that part of the material is amorphous.
Zeolite performs best in ammonia nitrogen (NH3-N) removal. Zeolite has a strong ion exchange capacity, especially in the removal of ammonia nitrogen, where it can effectively adsorb ammonia molecules and promote their conversion, resulting in a high ammonia nitrogen removal rate. However, its adsorption capacity for phosphorus (P) and chemical oxygen demand (COD) is relatively weak. This may be because the interaction between the negative charge of phosphorus and the negative charge on the zeolite surface is not as strong as the ion exchange effect with ammonia nitrogen.
The mineral components and their changes in these materials reflect the stability and reactivity of the three materials during the experiment, providing a mineralogical foundation for their subsequent application performance.

3.2.3. Specific Surface Area Measurement (BET)

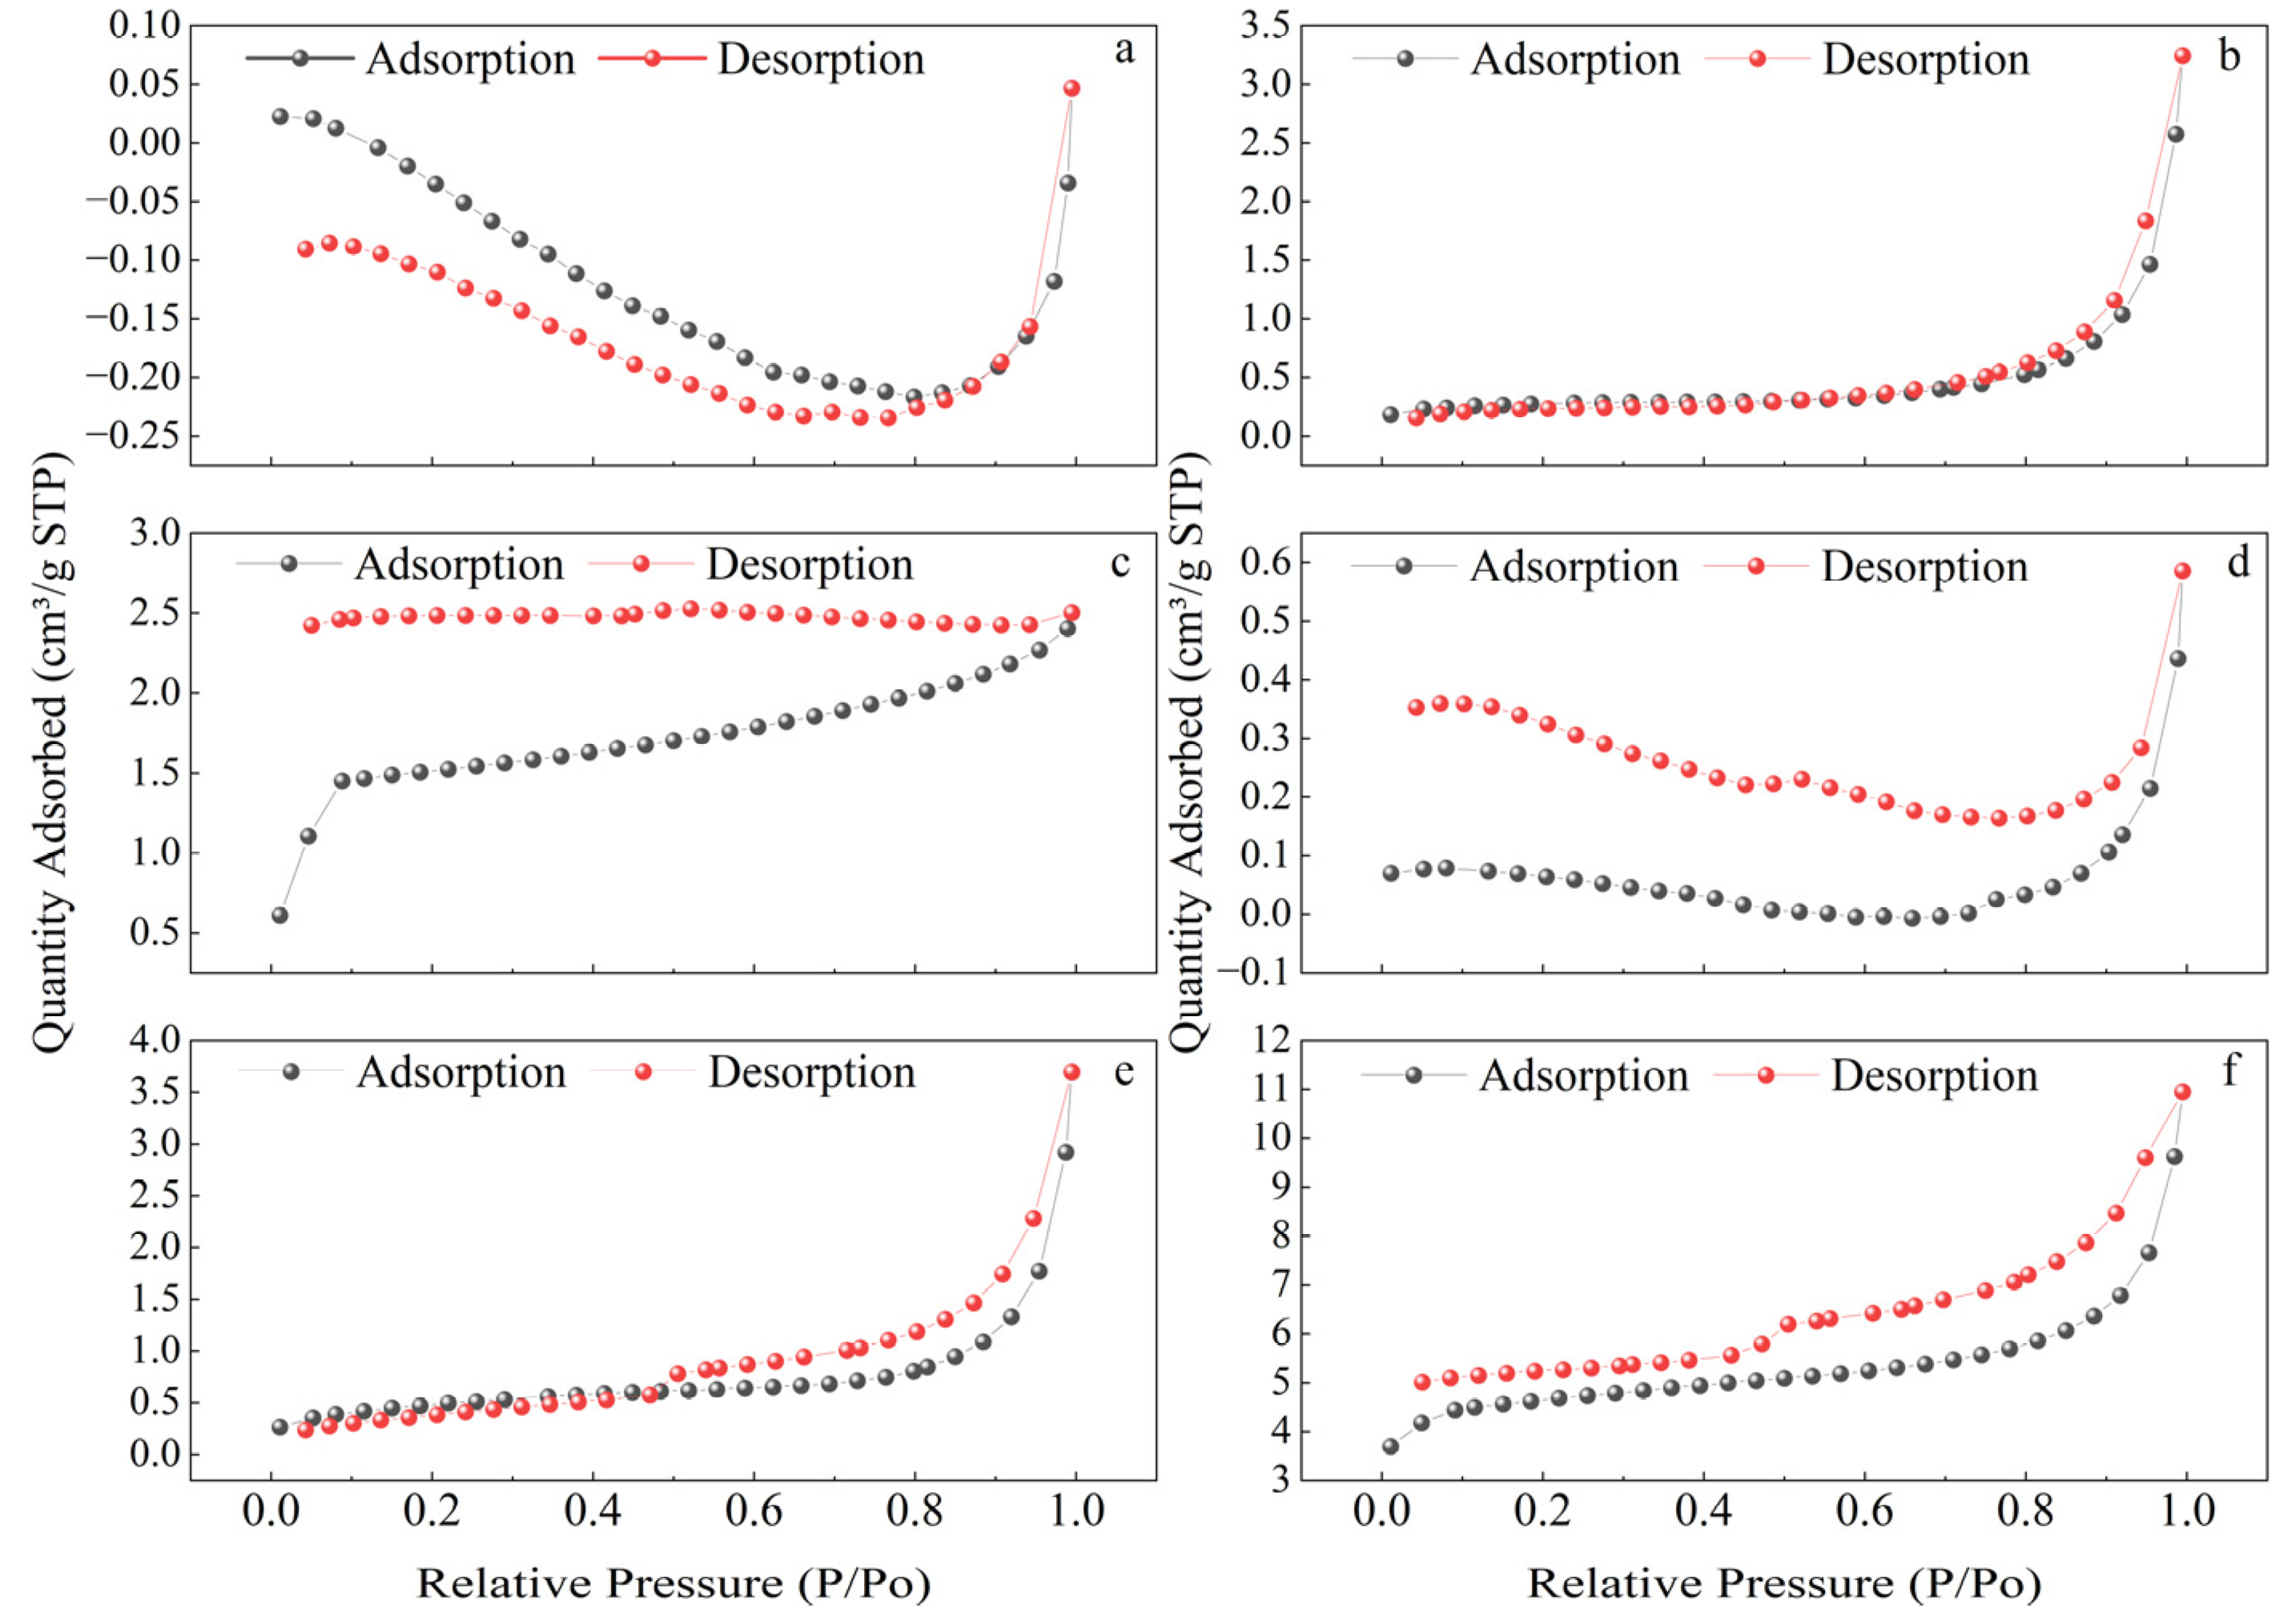
In order to further investigate the differences in porous structures between the two stages, the N2 adsorption and desorption curves of the filler before and after the two stages were analyzed, as shown in Figure 8.
The specific surface area of ceramsite increased from 0.0482 m2/g to 1.0042 m2/g, and the porosity increased from 0.0111 cm3/g to 0.2307 cm3/g. The significant increase in both the specific surface area and porosity indicates that the pore structure of ceramsite underwent substantial changes during the reaction process, possibly due to the expansion of pores or modification of the surface structure. The increase in specific surface area enables ceramsite to provide more surface-active sites, enhancing its adsorption capacity for pollutants, especially in the removal of total phosphorus and COD. This suggests that ceramsite is more suitable for adsorbing larger molecules or pollutants with higher adsorption requirements.
The specific surface area of anthracite decreased from 6.8283 m2/g to 0.3188 m2/g, and the porosity decreased from 1.5688 cm3/g to 0.0732 cm3/g. The significant reduction in both the specific surface area and porosity may be due to certain physical or chemical changes occurring on the coal’s surface during the experiment, such as pore blockage or the loss of surface materials. This led to a significant decrease in its adsorption capacity. Therefore, although anthracite may have exhibited higher adsorption capacity at the beginning of the experiment, its performance could be inhibited as the reaction progressed, especially in the removal of ammonia nitrogen and total nitrogen, where its performance was inferior to that of other adsorbents.
The specific surface area of zeolite increased from 1.7733 m2/g to 17.8204 m2/g, and the porosity increased from 0.4074 cm3/g to 4.0942 cm3/g. This change indicates a significant improvement in the pore structure of the zeolite, likely due to some physical or chemical alterations on its surface during the experiment, such as pore expansion or surface chemical modification. The increase in both specific surface area and porosity greatly enhanced the zeolite’s adsorption capacity for ammonia nitrogen and total nitrogen, which is consistent with its higher removal efficiency. The negative surface charge of zeolite and its strong ion-exchange capability allows it to effectively adsorb ammonia molecules and facilitate the transformation of ammonia nitrogen, making it the most effective in removing ammonia nitrogen.
Overall, the larger the specific surface area, the stronger the adsorption capacity of the material. In this experiment, zeolite’s specific surface area (increased from 1.7733 m2/g to 17.8204 m2/g) was significantly higher than that of ceramsite and anthracite, indicating that zeolite can provide more adsorption sites, leading to higher removal efficiency for ammonium nitrogen and total nitrogen. Accordingly, zeolite exhibited superior removal rates for ammonium nitrogen (92.77%) and total nitrogen (96.79%) compared to the other two materials. Although ceramsite’s increase in specific surface area and porosity was smaller, its removal rates for COD and total phosphorus were higher (71.67% and 83.64%, respectively). This suggests that ceramsite’s adsorption process is more efficient in removing organic pollutants. The relatively larger pore structure of ceramsite also allows it to better adsorb larger molecular pollutants. Both ceramsite and zeolite experienced significant increases in specific surface area and porosity during the experiment. These changes directly enhanced the adsorption capacity of both materials for various pollutants in water treatment.

3.2.4. Fourier Transform Infrared Spectrometer (FTIR)

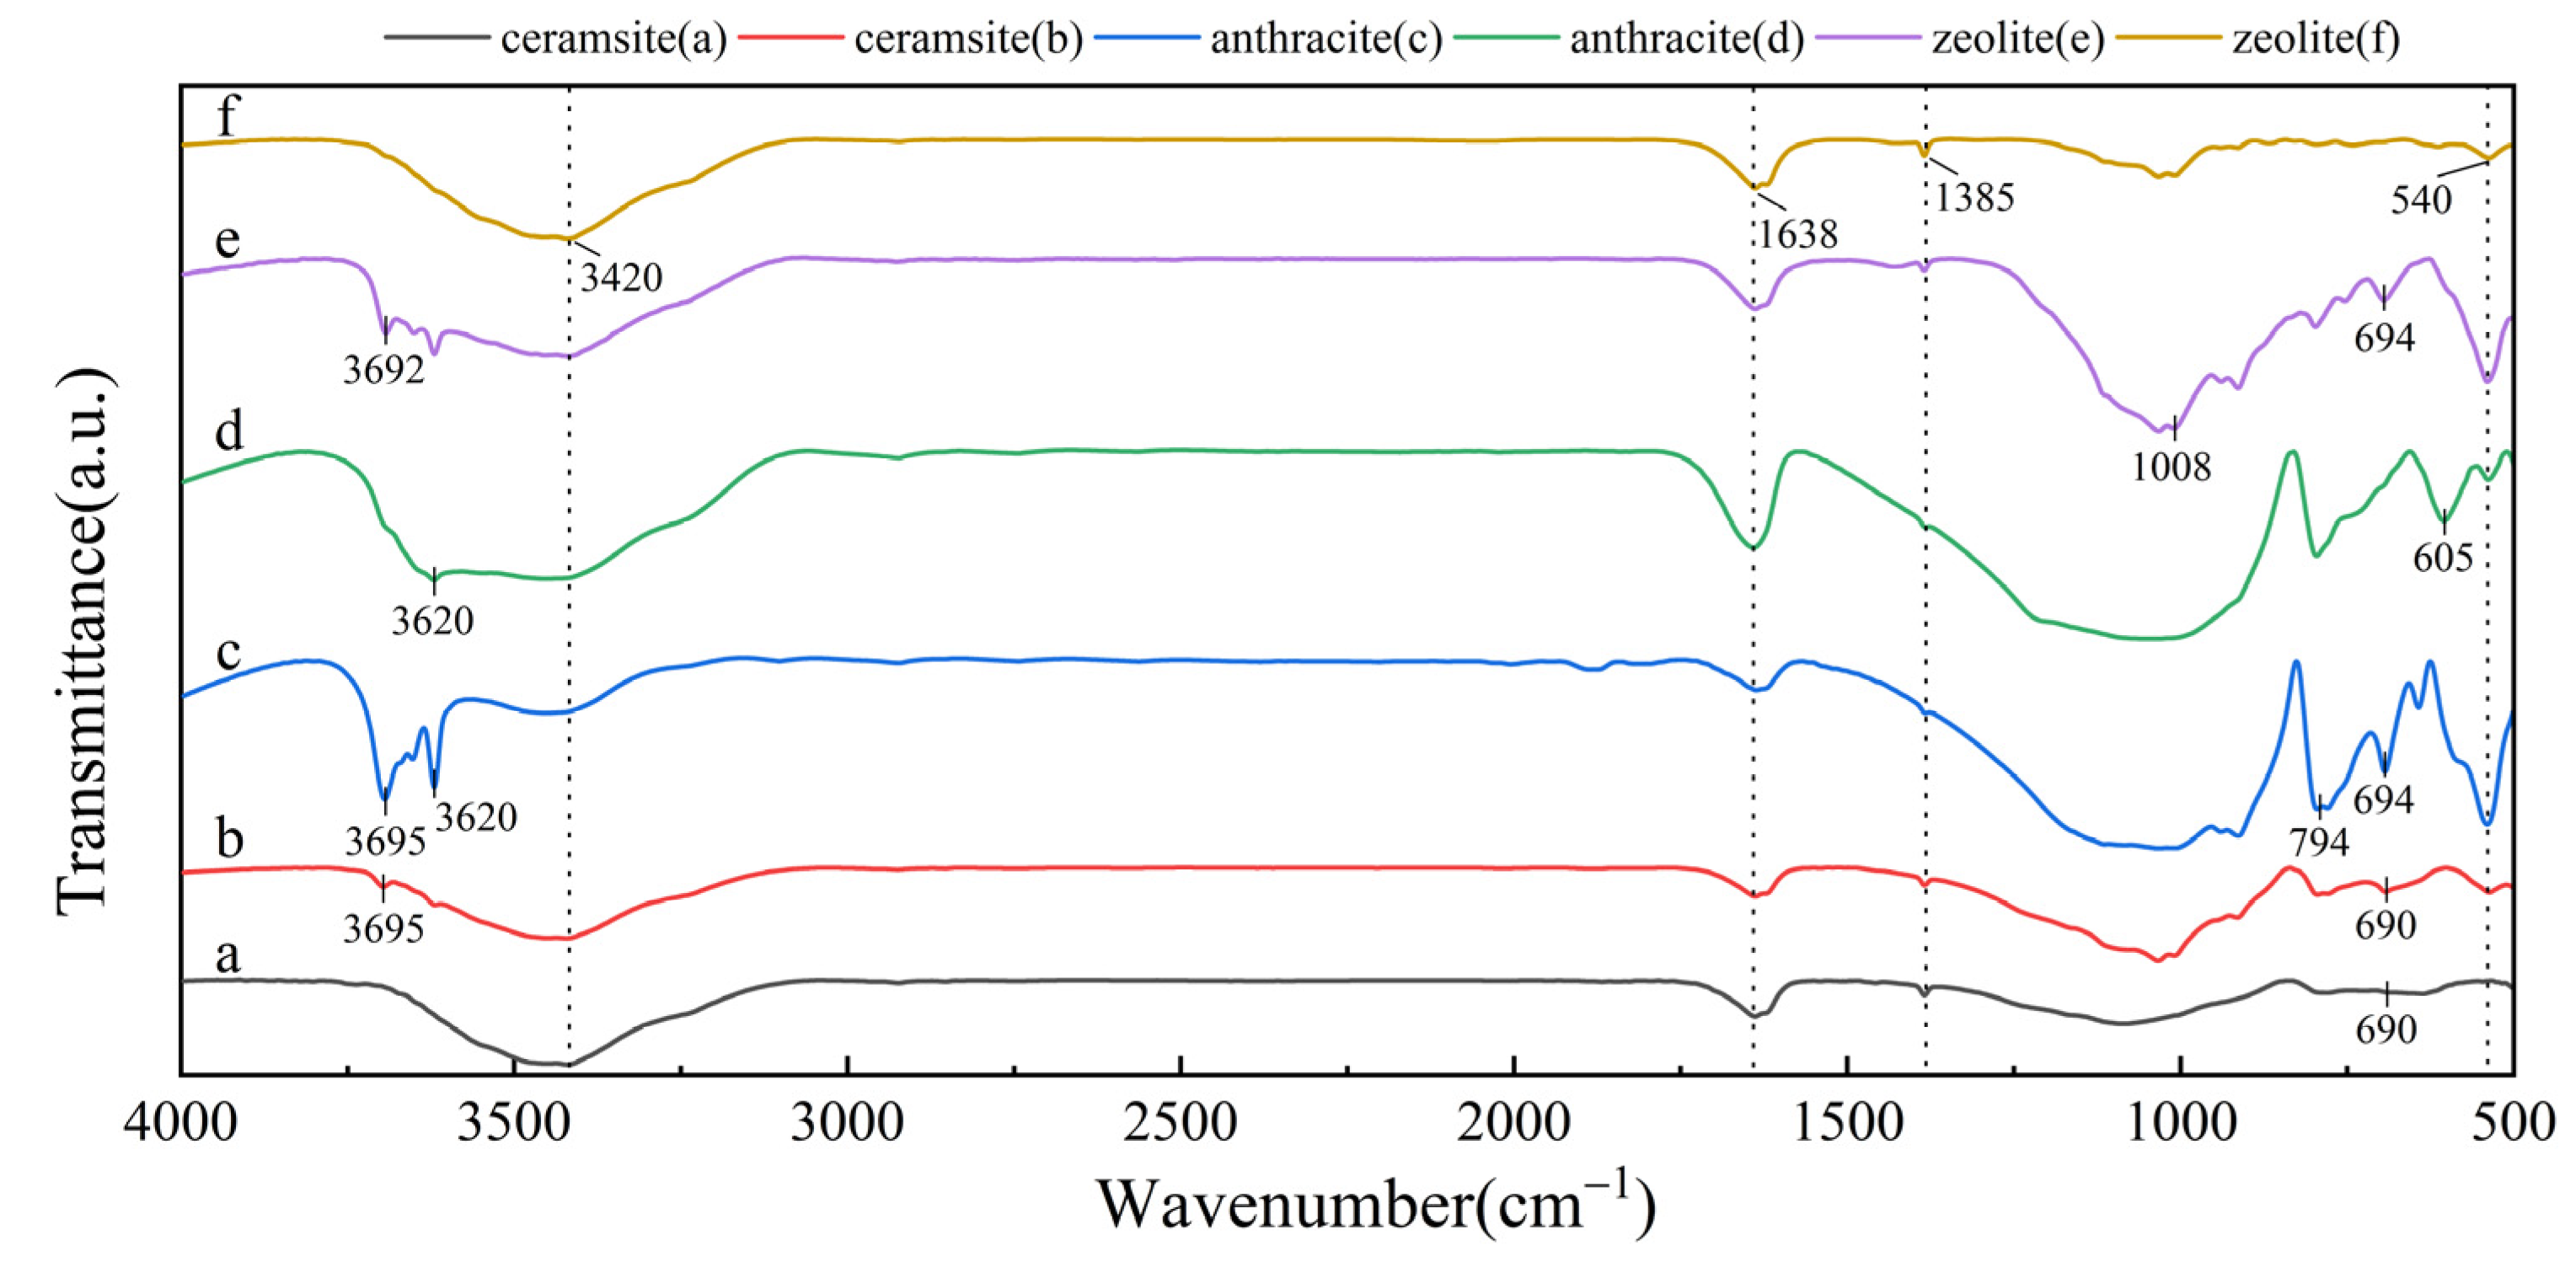
FTIR spectroscopy is one of the commonly used physical methods for identifying the functional groups of materials under study. Figure 9 presents the FTIR spectra of ceramsite, anthracite, and zeolite at the mid and later stages of rainwater treatment.
For carboxylate groups (COO), Amir et al. reported a characteristic absorption band at 1650 cm−1 for carboxylate groups, which is typically associated with the stretching vibration of the C=O bond in carboxylate groups [64]. Xu et al. mentioned another possible absorption band around 1400 cm−1 [65]. However, it is important to note that the absorption near 1384 cm−1 could also be attributed to the vibrations of other functional groups, such as phenolic hydroxyl, alcohol hydroxyl, or C=C bonds in aromatic rings. For phenolic hydroxyl groups (OH), Fan et al. reported a characteristic absorption band at 3400 cm−1 for phenolic hydroxyl groups [66]. This wavenumber is generally associated with the stretching vibration of the O–H bond in phenolic hydroxyl groups and appears as a strong absorption peak. Amir et al. also mentioned that phenolic hydroxyl groups might exhibit an absorption band near 1384 cm−1, but this wavenumber region may overlap with the vibrations of other functional groups [64].
From Figure 9a,b, it can be seen that the shape and position of the infrared absorption peaks for ceramsite remained almost unchanged. Combined with the XRD patterns of ceramsite in Figure 7a,b, this indicates that there was no significant change in the chemical composition of ceramsite during the experiment. Therefore, the removal of total nitrogen, total phosphorus, COD, and ammonium nitrogen by ceramsite mainly relied on microorganisms and the physical structure of ceramsite itself (such as its large specific surface area and porosity).
From Figure 9c,d as well as Figure 9e,f, it can be observed that anthracite and zeolite exhibited strong O–H stretching vibrations near 3695 cm−1 and C–H out-of-plane bending vibrations near 694 cm−1, along with disubstitution in the benzene ring. The absorption peak height of zeolite decreased in the later stages of the experiment compared to the mid-stage, indicating an increase in the absorption intensity of infrared radiation. Combined with the XRD patterns of zeolite in Figure 7e,f, the reduction of calcium ferrite compounds (Ca2Fe9O13) in the later stage suggests that a large number of ions were generated during the experiment, which enhanced the ability of zeolite to remove total nitrogen and ammonium nitrogen. Research has shown that zeolite has ion-exchange capabilities in wastewater treatment [49].

3.3. Microbial Community Diversity

The distribution of bacterial communities at the phylum level in the mid and later stages of the fillers in the ecological buffer zone during the initial rainwater treatment process is shown in Figure 10.
In the mid-experiment stage, the top five bacterial phyla by proportion were as follows: Proteobacteria (58.41%), Actinobacteriota (9.27%), Chloroflexi (6.22%), Acidobacteriota (5.72%), and Bacteroidota (4.98%). In the late-experiment stage, the top five bacterial phyla by proportion were as follows: Proteobacteria (59.25%), Bacteroidota (7.86%), Actinobacteriota (6.49%), Acidobacteriota (5.40%), and Verrucomicrobiota (2.46%).
In the late-experiment stage, the abundance of Proteobacteria, Bacteroidota, and Verrucomicrobiota increased. Due to the synergistic effects between bacterial communities, Bacteroidota plays an important role in wastewater remediation [67]. Bacteroidota, Proteobacteria, and Actinobacteriota have been identified as key microorganisms in the nitrogen and phosphorus cycles [68,69]. In Figure 10b, the total proportion of Bacteroidota, Proteobacteria, and Actinobacteriota in the ceramsite fillers was higher than in the zeolite and anthracite, which is consistent with the higher removal efficiency of nitrogen and phosphorus by ceramsite compared to zeolite and anthracite.
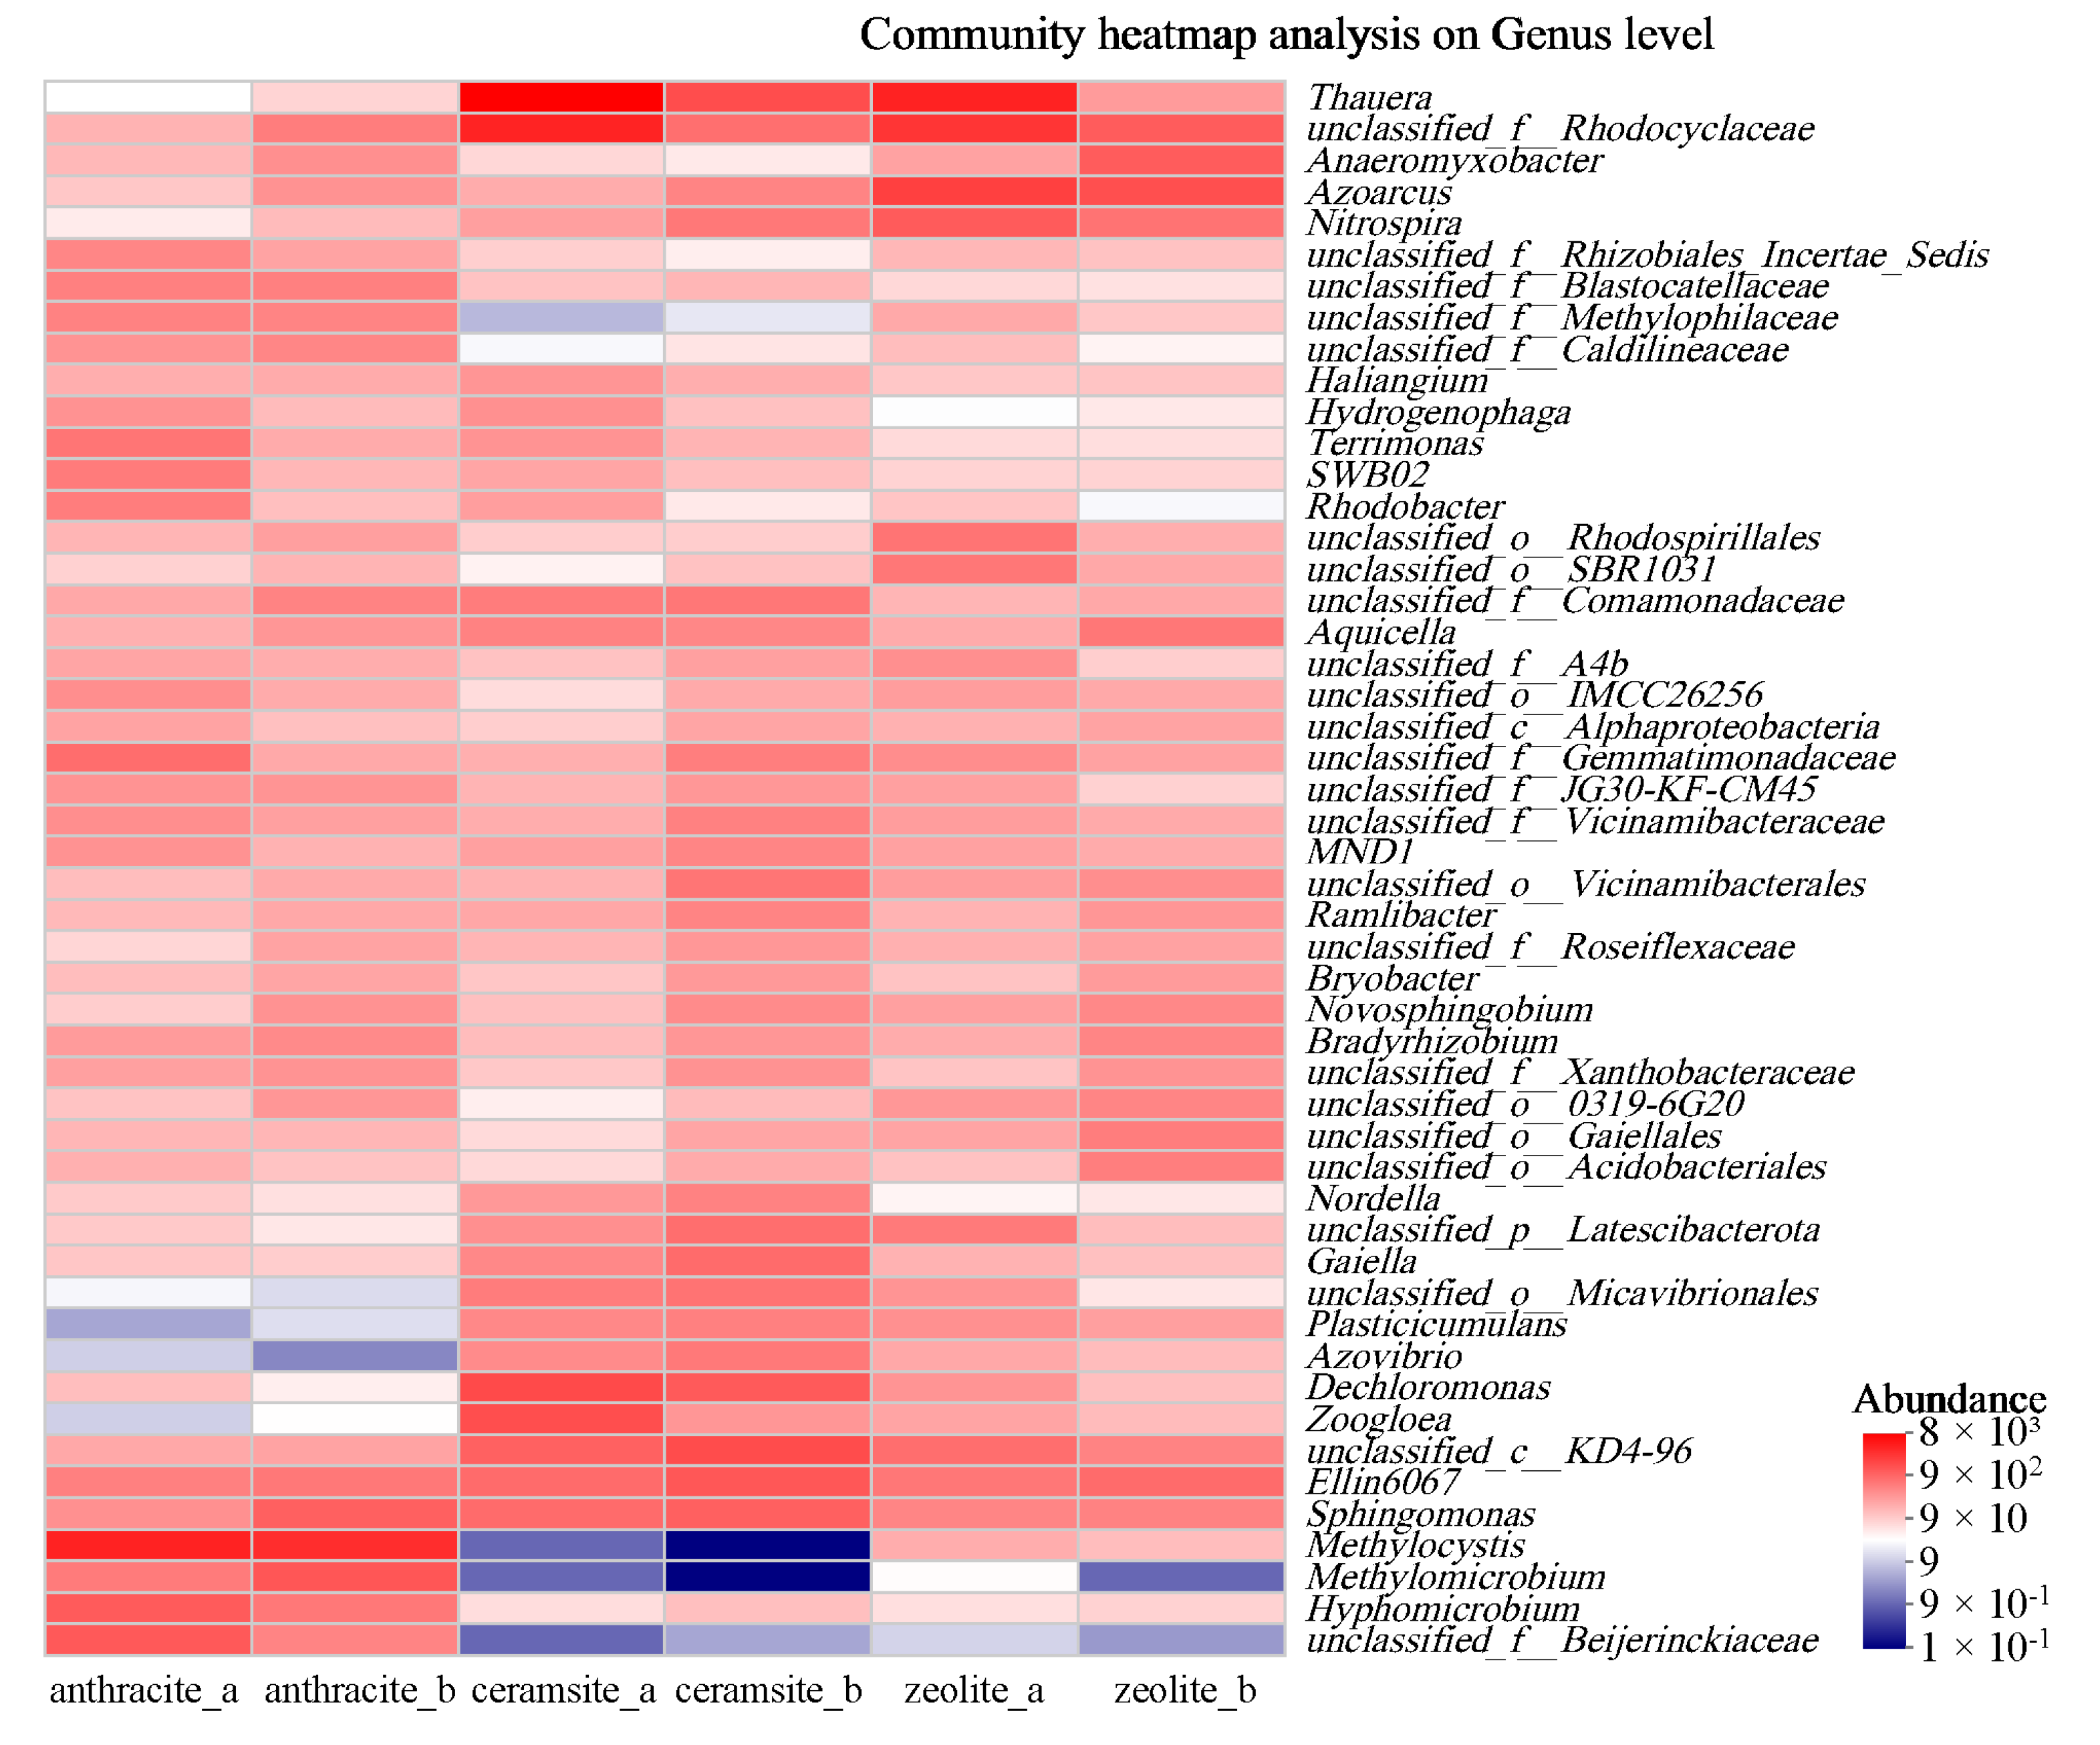
To further investigate the microbial removal effect on nitrogen, phosphorus, and organic matter, the microbial community in the fillers was analyzed at the genus level. A species richness heatmap was used to present the species composition of the microbial community. The top 50 species by abundance are shown in Figure 11. In the mid-experiment stage, the genera with abundance higher than 3% in the ceramsite group were as follows: Thauera (24.40%), unclassified_f__Rhodocyclaceae (11.31%), Dechloromonas (4.73%), and Zoogloea (4.34%). In the zeolite group, the genera with abundance higher than 3% were as follows: Thauera (11.34%), unclassified_f__Rhodocyclaceae (7.58%), Azoarcus (5.86%), and Nitrospira (3.22%). In the anthracite group, the genera with abundance higher than 3% were as follows: Methylocystis (11.33%), unclassified_f__Beijerinckiaceae (3.34%), and Hyphomicrobium (3.22%).
In the late-experiment stage, the genera with abundance higher than 3% in the ceramsite group were as follows: Thauera (4.36%), unclassified_c__KD4-96 (4.47%), Ellin6067 (3.51%), and Dechloromonas (3.27%). In the zeolite group, the genera with an abundance higher than 3% were as follows: Azoarcus (4.22%), unclassified_f__Rhodocyclaceae (3.12%), and Anaeromyxobacter (3.18%). In the anthracite group, the genera with abundance higher than 3% were as follows: Methylocystis (8.87%) and Methylomicrobium (3.62%).
Among these, the dominant genera in the ceramsite group were Thauera and Dechloromonas. Thauera has been confirmed to play an important role in the removal of carbon, nitrogen, and phosphorus from wastewater [70]. Both Dechloromonas and Thauera can metabolize nitrogen and aromatic compounds, which is commonly observed in wastewater treatment systems [71]. The abundance of these two genera was higher in the ceramsite group compared to the zeolite and anthracite groups, indicating that ceramsite was more effective in removing nitrogen, phosphorus, and organic matter than zeolite and anthracite. Notably, in the late-experiment stage, Ellin6067 had a high relative abundance, and functional microbes like Thauera and Ellin6067 played an important role in pollutant removal [72]. In the zeolite group, the dominant genera were unclassified_f__Rhodocyclaceae and Azoarcus. Unclassified_f__Rhodocyclaceae was identified as a heterotrophic denitrifying bacterium focused on the denitrification process [73], while Azoarcus is a key denitrifier influencing nitrate reduction [74], both contributing to the removal of organic matter from water. In the anthracite group, the dominant genera were Methylocystis and Methylomicrobium, which were less involved in the removal of organic matter, nitrogen, and phosphorus.
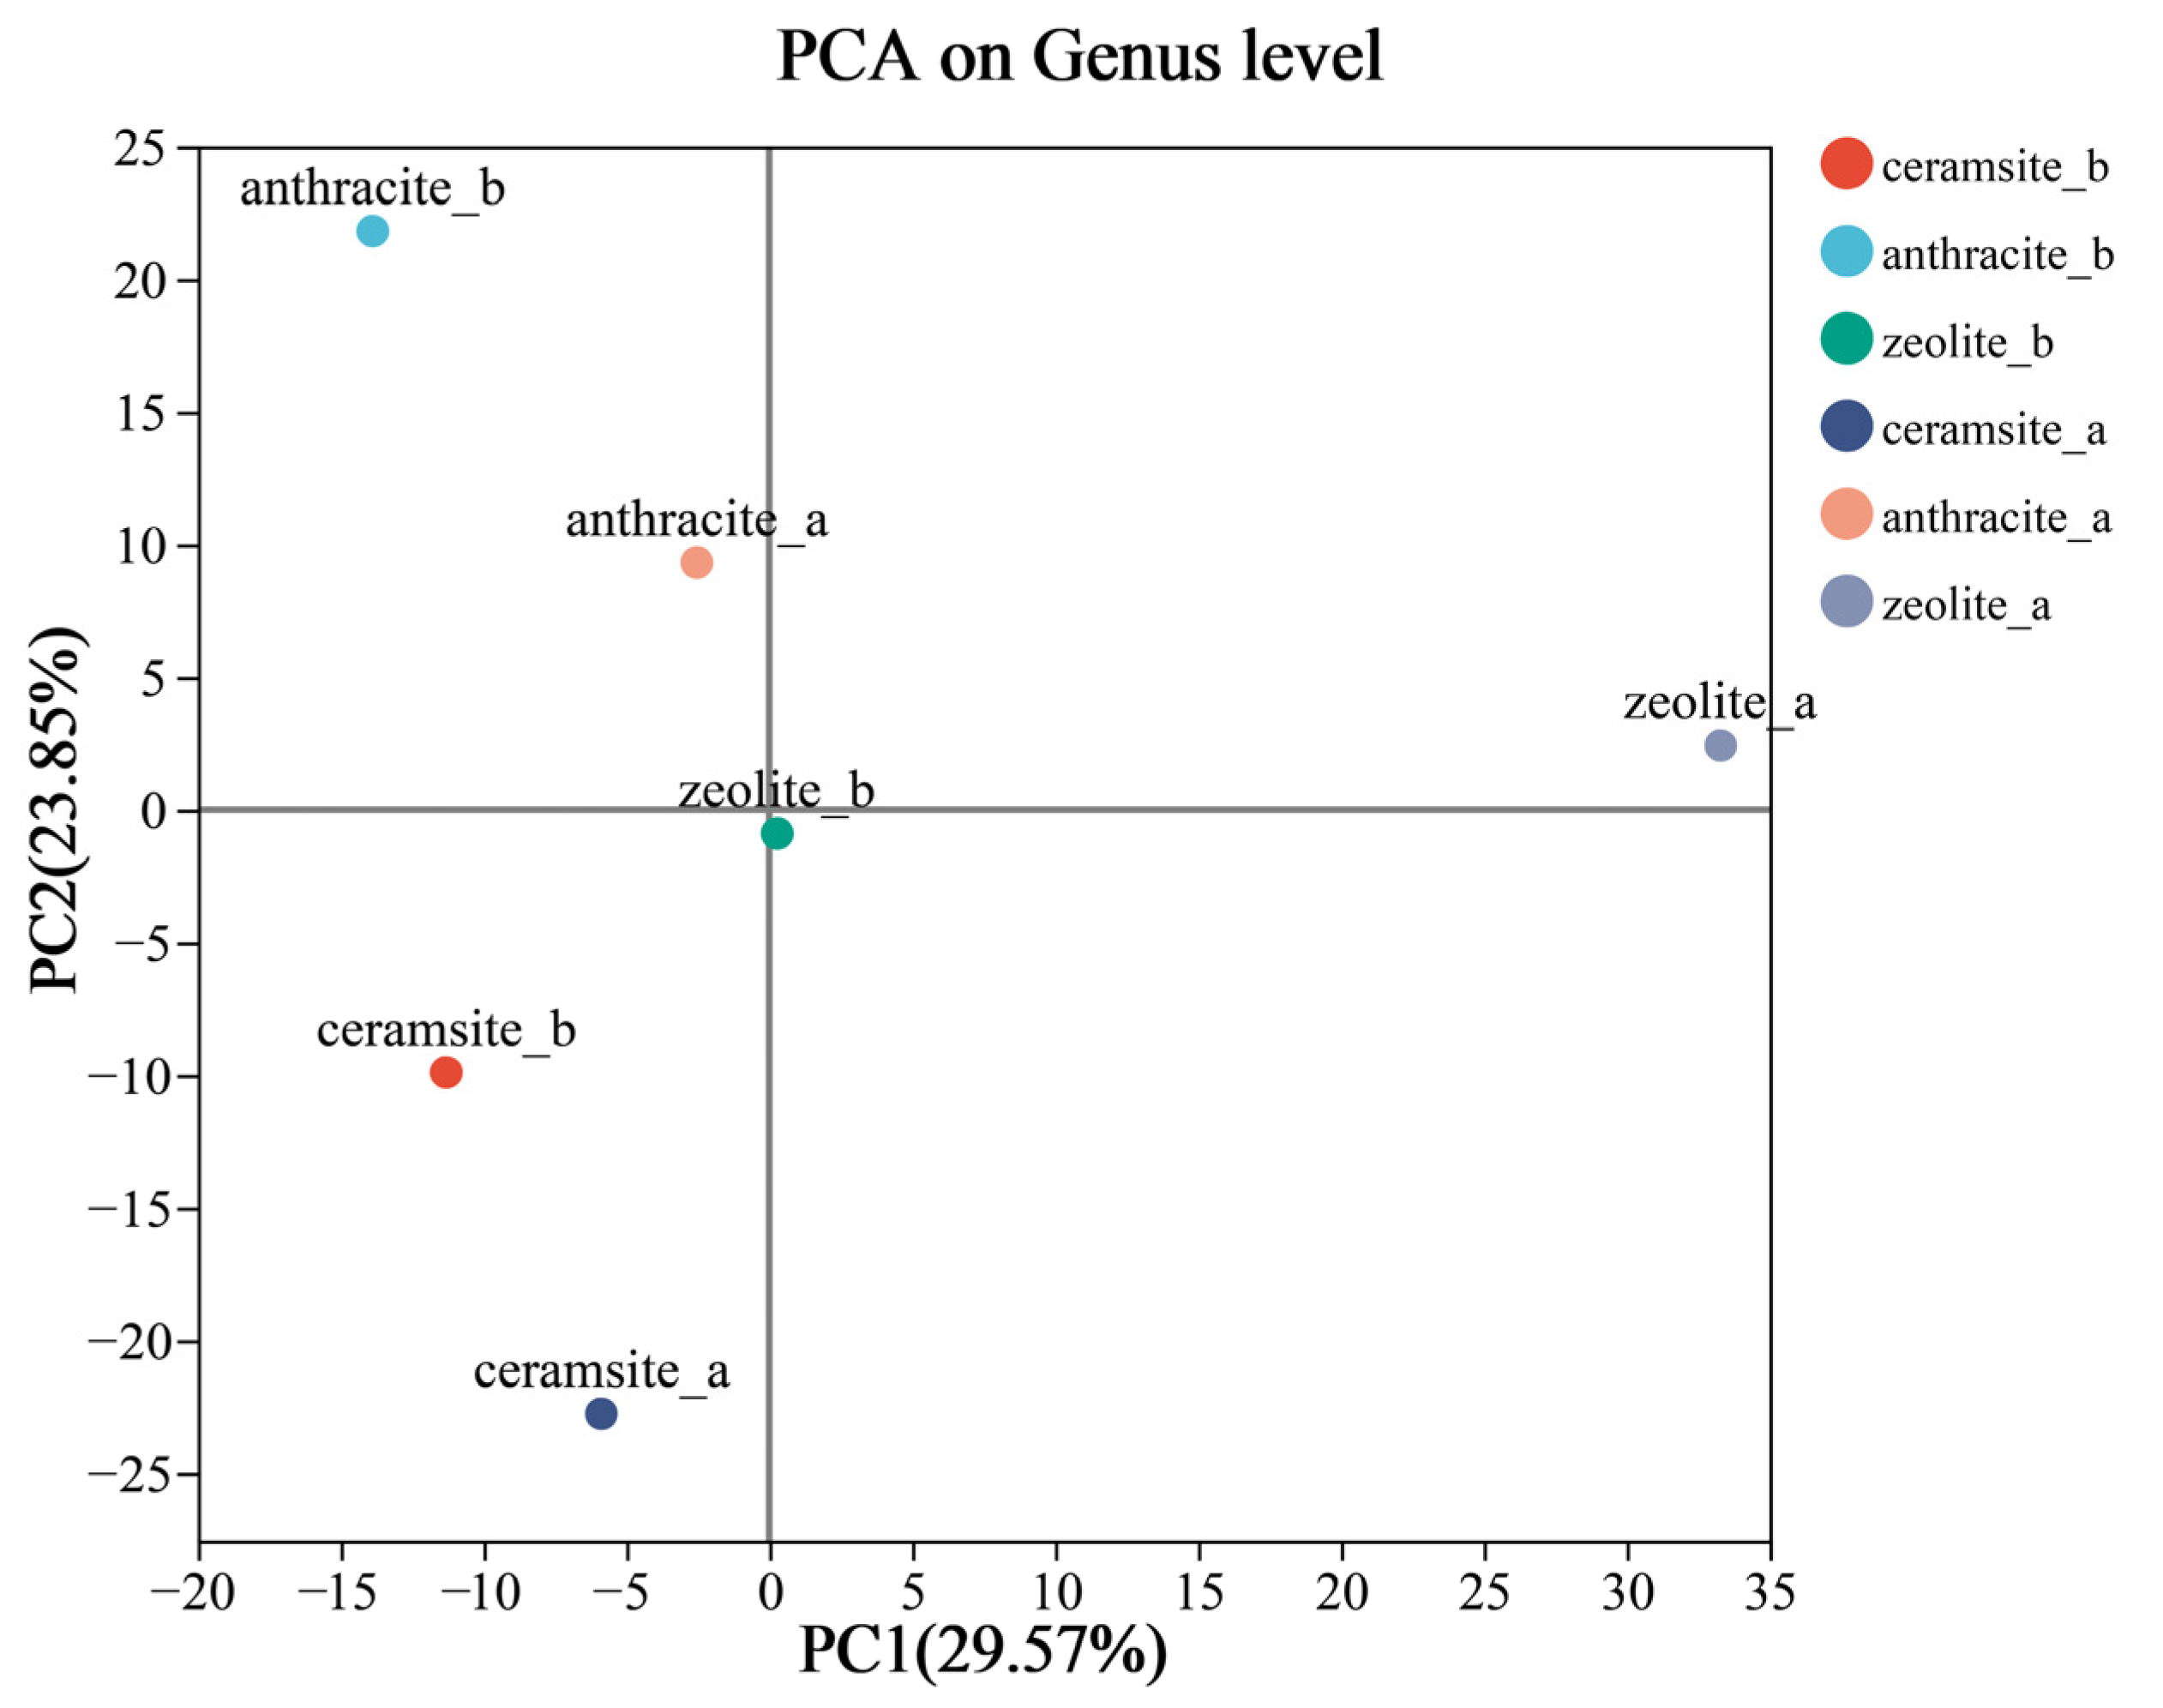
To further analyze the impact of different fillers on microbial communities, Principal Component Analysis (PCA) was conducted. As shown in Figure 12, the sample points of ceramsite (ceramsite_a) are located farther from those of anthracite (anthracite_a) and zeolite (zeolite_a), indicating a more significant difference in the microbial communities at the genus level on the surfaces of the three fillers during the mid-experiment. This suggests that at this stage, the microbial community structures supported by the surfaces of the three fillers are significantly different, possibly due to the variations in the physicochemical properties of the filler surfaces, leading to changes in microbial population distribution. In the later stages of the experiment, the sample points of ceramsite and zeolite are closer to each other, indicating that the microbial communities on the surfaces of these two fillers tend to become more similar. This may be due to the adaptation of microbial communities to the surface environment of the fillers as the experiment progresses, promoting the growth of similar microbial populations.
The dominant microorganisms on the surface of the ceramsite are Thauera and Dechloromonas, which have strong capabilities in nitrogen removal, phosphorus removal, and organic matter degradation. Ceramsite provides a good growth environment for denitrifying microorganisms, such as Thauera, thereby promoting the nitrogen removal process. Ceramsite supports microbial community diversity, especially by offering abundant ecological niches through its large specific surface area and porous structure. On the surface of the zeolite, the dominant microorganisms are Rhodocyclaceae and Azoarcus, which mainly participate in denitrification and organic matter removal. Zeolite, through its ion exchange and adsorption capabilities, supports the growth of microorganisms such as Thauera and Azoarcus, which are primarily involved in the nitrogen removal process. It also demonstrates dynamic changes in the microbial community and functional diversity in the later stages of the experiment. The anthracite group is primarily dominated by Methylocystis and Methylomicrobium, which exhibit weaker pollutant removal abilities. Anthracite primarily supports the growth of methane-oxidizing microorganisms, such as Methylocystis, which aid in the removal of organic pollutants, playing a key role, especially in the removal of methane and organic nitrogen contaminants. The impact of different fillers on microorganisms is reflected in their support for specific functional microorganisms, which in turn affects the composition, function, and pollutant removal efficiency of the microbial community. Fillers not only provide habitats for microorganisms but also influence microbial activity and metabolic pathways through their physical and chemical properties.
The results indicate that ceramsite and zeolite are more favorable for the attachment and growth of nitrogen-removing and organic matter-degrading microorganisms, which is consistent with the findings from SEM, BET, and FTIR analyses.

4. Conclusions

(1)
In the plant combination of Pennisetum hybridum, Canna, and Lythrum virgatum (1:1:1), zeolite and ceramsite performed well in nitrogen removal, with zeolite achieving a total nitrogen removal rate of 96.79% and ammonium nitrogen removal rate of 92.77%, and ceramsite achieving total nitrogen removal rate of 93.76% and ammonium nitrogen removal rate of 91.49%. Ceramsite was more effective in removing total phosphorus 83.64% and COD 71.67%. Based on these results, a mixture of zeolite and ceramsite is recommended as the filler combination for the ecological buffer zone;
(2)
In the treatment of nitrogen-containing wastewater, zeolite not only adsorbs ammonium nitrogen but also achieves total nitrogen removal through an adsorption-desorption mechanism combined with biological processes. The presence of quartz and calcium aluminate hydrates in ceramsite, along with its larger specific surface area, contributes to the adsorption and precipitation of phosphorus. Additionally, the strong surface chemical adsorption capacity of quartz in ceramsite is one of the key factors behind its superior performance in COD removal;
(3)
The dominant microbial phyla in all three fillers were Bacteroidetes, Proteobacteria, and Actinobacteria. The dominant genera in ceramsite were Thauera and Dechloromonas, while in zeolite, the dominant genera were unclassified Rhodocyclaceae and Azoarcus. These genera played a significant role in the removal of initial stormwater pollutants;
(4)
Although synthetic rainwater was used in this study, the presence of suspended solids and colloids in real-world conditions could significantly affect the adsorption process and may lead to the clogging of porous media. This aspect should be addressed in future studies for more realistic assessments.

Author Contributions

Conceptualization, J.X. and F.Z.; methodology, J.X. and F.Z.; software, J.X. and F.Z.; validation, W.W. and X.Z.; formal analysis, J.X. and F.Z.; investigation, J.X. and F.Z.; resources, J.X. and F.Z.; data curation, J.X. and F.Z.; writing—original draft preparation, J.X.; writing—review and editing, J.L. and C.F.; visualization, W.W. and X.Z.; supervision, J.L. and C.F.; project administration, J.X. and F.Z.; funding acquisition, J.L. and C.F. All authors have read and agreed to the published version of the manuscript.

Funding

This research was funded by the Wenzhou Ecological Park Research Project (grant number SY2022ZD-1002-07), National Natural Science Foundation of China (No. 22306211), Key Scientific Research Project of Colleges and Universities in Henan Province (No. 24A610012), and Young Backbone Teacher Project of Zhongyuan University of Technology (2023XQG06).

Data Availability Statement

The data presented in this study are available on request from the corresponding author. The data are not publicly available due to funder restrictions.

Acknowledgments

The authors express their sincere gratitude for the work of the editor and the anonymous reviewers.

Conflicts of Interest

The authors declare no conflicts of interest.

References

  1. Gorgoglione, A.; Bombardelli, F.A.; Pitton, B.J.L.; Oki, L.R.; Haver, D.L.; Young, T.M. Uncertainty in the parameterization of sediment build-up and wash-off processes in the simulation of sediment transport in urban areas. Environ. Model. Softw. 2019, 111, 170–181. [Google Scholar] [CrossRef]
  2. Rio, M.; Salles, C.; Cernesson, F.; Marchand, P.; Tournoud, M.-G. An original urban land cover representation and its effects on rain event-based runoff and TSS modelling. J. Hydrol. 2020, 586, 124865. [Google Scholar] [CrossRef]
  3. Naves, J.; Rieckermann, J.; Cea, L.; Puertas, J.; Anta, J. Global and local sensitivity analysis to improve the understanding of physically-based urban wash-off models from high-resolution laboratory experiments. Sci. Total Environ. 2020, 709, 136152. [Google Scholar] [CrossRef]
  4. Deletic, A. The first flush load of urban surface runoff. Water Res. 1998, 32, 2462–2470. [Google Scholar] [CrossRef]
  5. Sánchez, A.; Cohim, E.; Kalid, R. A review on physicochemical and microbiological contamination of roof-harvested rainwater in urban areas. Sustain. Water Qual. Ecol. 2015, 6, 119–137. [Google Scholar] [CrossRef]
  6. Li, A.; Ji, G.; Xu, C.; Lichtfouse, E.; Huang, J.; Liu, H. Elevated purification of urban rainwater runoff using a calamus constructed wetland with multi-layer carrier fillers. J. Water Process Eng. 2023, 56, 104273. [Google Scholar] [CrossRef]
  7. Zheng, Z.; Duan, X.; Lu, S. The application research of rainwater wetland based on the Sponge City. Sci. Total Environ. 2021, 771, 144475. [Google Scholar] [CrossRef] [PubMed]
  8. Zhang, Q.; Wang, X.; Hou, P.; Wan, W.; Ren, Y.; Ouyang, Z.; Yang, L. The temporal changes in road stormwater runoff quality and the implications to first flush control in Chongqing, China. Environ. Monit. Assess. 2013, 185, 9763–9775. [Google Scholar] [CrossRef] [PubMed]
  9. Lu, Y. Design Strategy of Emergency Pools at Source Water Protection Areas. J. Archit. Res. Dev. 2022, 6, 35–40. [Google Scholar] [CrossRef]
  10. Yang, L.; Li, J.; Zhou, K.; Feng, P.; Dong, L. The effects of surface pollution on urban river water quality under rainfall events in Wuqing district, Tianjin, China. J. Clean. Prod. 2021, 293, 126136. [Google Scholar] [CrossRef]
  11. Wang, Z.; Gao, J.; Du, Z.; Zhang, Y.; Lai, X. Simulation of interception capacity of Nanhe initial rain storage tanks. IOP Conf. Ser. Earth Environ. Sci. 2021, 787, 012138. [Google Scholar] [CrossRef]
  12. Carluer, N.; Lauvernet, C.; Noll, D.; Munoz-Carpena, R. Defining context-specific scenarios to design vegetated buffer zones that limit pesticide transfer via surface runoff. Sci. Total Environ. 2017, 575, 701–712. [Google Scholar] [CrossRef] [PubMed]
  13. Jin, B.; Liu, X.; Tan, J.; Shao, X.; Cheng, J. Effect of Plant Buffer Zone–Antifouling Curtain Wall on Reducing Non-Point Source Pollution in Paddy Fields, China. Sustainability 2022, 14, 6044. [Google Scholar] [CrossRef]
  14. Syversen, N. Effect and design of buffer zones in the Nordic climate: The influence of width, amount of surface runoff, seasonal variation and vegetation type on retention efficiency for nutrient and particle runoff. Ecol. Eng. 2005, 24, 483–490. [Google Scholar] [CrossRef]
  15. Ramião, J.P.; Carvalho-Santos, C.; Pinto, R.; Pascoal, C. Modeling the Effectiveness of Sustainable Agricultural Practices in Reducing Sediments and Nutrient Export from a River Basin. Water 2022, 14, 3962. [Google Scholar] [CrossRef]
  16. Hu, Y.; Gao, L.; Ma, C.; Wang, H.; Zhou, C. The Comprehensive Reduction Capacity of Five Riparian Vegetation Buffer Strips for Primary Pollutants in Surface Runoff. Appl. Sci. 2023, 13, 3898. [Google Scholar] [CrossRef]
  17. Hill, A.R. Groundwater nitrate removal in riparian buffer zones: A review of research progress in the past 20 years. Biogeochemistry 2019, 143, 347–369. [Google Scholar] [CrossRef]
  18. Piniewski, M.; Marcinkowski, P.; Kardel, I.; Giełczewski, M.; Izydorczyk, K.; Frątczak, W. Spatial Quantification of Non-Point Source Pollution in a Meso-Scale Catchment for an Assessment of Buffer Zones Efficiency. Water 2015, 7, 1889–1920. [Google Scholar] [CrossRef]
  19. Bu, X.; Xue, J.; Zhao, C.; Wu, Y.; Han, F.; Zhu, L. Sediment and nutrient removal by integrated tree-grass riparian buffers in Taihu Lake watershed, eastern China. J. Soil Water Conserv. 2016, 71, 129–136. [Google Scholar] [CrossRef]
  20. Lee, K.H.; Isenhart, T.M.; Schultz, R.C. Sediment and nutrient removal in an established multi-species riparian buffer. J. Soil Water Conserv. 2003, 58, 1–8. [Google Scholar]
  21. Dunn, R.M.; Hawkins, J.M.B.; Blackwell, M.S.A.; Zhang, Y.; Collins, A.L. Impacts of different vegetation in riparian buffer strips on runoff and sediment loss. Hydrol. Process. 2022, 36, e14733. [Google Scholar] [CrossRef] [PubMed]
  22. Calheiros, C.S.C.; Rangel, A.O.S.S.; Castro, P.M.L. Constructed wetland systems vegetated with different plants applied to the treatment of tannery wastewater. Water Res. 2007, 41, 1790–1798. [Google Scholar] [CrossRef] [PubMed]
  23. Kim, Y.; Park, K.; Bak, J.; Choi, S. Iris pseudacorus and Lythrum anceps as Plants Supporting the Process of Removing Microplastics from Aquatic Environments—Preliminary Research. Horticulturae 2024, 10, 631. [Google Scholar] [CrossRef]
  24. Thalla, A.K.; Devatha, C.P.; Anagh, K.; Sony, E. Performance evaluation of horizontal and vertical flow constructed wetlands as tertiary treatment option for secondary effluents. Appl. Water Sci. 2019, 9, 147. [Google Scholar] [CrossRef]
  25. Mander, Ü.; Tournebize, J.; Tonderski, K.; Verhoeven, J.T.A.; Mitsch, W.J. Planning and establishment principles for constructed wetlands and riparian buffer zones in agricultural catchments. Ecol. Eng. 2017, 103, 296–300. [Google Scholar] [CrossRef]
  26. Liu, M.; Wu, S.; Chen, L.; Dong, R. How substrate influences nitrogen transformations in tidal flow constructed wetlands treating high ammonium wastewater? Ecol. Eng. 2014, 73, 478–486. [Google Scholar] [CrossRef]
  27. Yang, Y.; Zhao, Y.; Liu, R.; Morgan, D. Global development of various emerged substrates utilized in constructed wetlands. Bioresour. Technol. 2018, 261, 441–452. [Google Scholar] [CrossRef]
  28. Lima, M.; Carvalho, K.; Passig, F.; Borges, A.; Filippe, T.; Azevedo, J.; Nagalli, A. Performance of different substrates in constructed wetlands planted with E. crassipes treating low-strength sewage under subtropical conditions. Sci. Total Environ. 2018, 630, 1365–1373. [Google Scholar] [CrossRef]
  29. Drizo, A.; Frost, C.; Smith, K.; Grace, J. Phosphate and ammonium removal by constructed wetlands with horizontal subsurface flow, using shale as a substrate. Water Sci. Technol. 1997, 35, 95–102. [Google Scholar] [CrossRef]
  30. Vohla, C.; Kõiv, M.; Bavor, H.J.; Chazarenc, F.; Mander, Ü. Filter materials for phosphorus removal from wastewater in treatment wetlands—A review. Ecol. Eng. 2011, 37, 70–89. [Google Scholar] [CrossRef]
  31. Fu, G.; Wu, J.; Han, J.; Zhao, L.; Chan, G.; Leong, K. Effects of substrate type on denitrification efficiency and microbial community structure in constructed wetlands. Bioresour. Technol. 2020, 307, 123222. [Google Scholar] [CrossRef] [PubMed]
  32. Vispo, C.; Geronimo, F.K.; Jeon, M.; Kim, L.-H. Performance Evaluation of Various Filter Media for Multi-Functional Purposes to Urban Constructed Wetlands. Sustainability 2024, 16, 287. [Google Scholar] [CrossRef]
  33. Long, Y.; Zhang, Z.; Pan, X.; Li, B.; Xie, S.; Guo, Q. Substrate influences on archaeal and bacterial assemblages in constructed wetland microcosms. Ecol. Eng. 2016, 94, 437–442. [Google Scholar] [CrossRef]
  34. Bowden, L.I.; Jarvis, A.P.; Younger, P.L.; Johnson, K.L. Phosphorus removal from waste waters using basic oxygen steel slag. Environ. Sci. Technol. 2009, 43, 2476–2481. [Google Scholar] [CrossRef] [PubMed]
  35. Abdelhakeem, S.G.; Aboulroos, S.A.; Kamel, M.M. Performance of a vertical subsurface flow constructed wetland under different operational conditions. J. Adv. Res. 2016, 7, 803–814. [Google Scholar] [CrossRef]
  36. Barca, C.; Meyer, D.; Liira, M.; Drissen, P.; Comeau, Y.; Andrès, Y.; Chazarenc, F. Steel slag filters to upgrade phosphorus removal in small wastewater treatment plants: Removal mechanisms and performance. Ecol. Eng. 2014, 68, 214–222. [Google Scholar] [CrossRef]
  37. Li, Y.; Wang, J.; Lin, X.; Wang, H.; Li, H.; Li, J. Purification effects of recycled aggregates from construction waste as constructed wetland filler. J. Water Process Eng. 2022, 50, 103335. [Google Scholar] [CrossRef]
  38. Liu, C.; Zhao, D.; Ma, W.; Guo, Y.; Wang, A.; Wang, Q.; Lee, D.-J. Denitrifying sulfide removal process on high-salinity wastewaters in the presence of Halomonas sp. Appl. Microbiol. Biotechnol. 2016, 100, 1421–1426. [Google Scholar] [CrossRef]
  39. Feng, C.; Huang, L.; Yu, H.; Yi, X.; Wei, C. Simultaneous phenol removal, nitrification and denitrification using microbial fuel cell technology. Water Res. 2015, 76, 160–170. [Google Scholar] [CrossRef]
  40. Mayo, A.W.; Hanai, E.; Kibazohi, O. Nitrification–denitrification in a coupled high rate–water hyacinth ponds. Phys. Chem. Earth Parts A/B/C 2014, 72, 88–95. [Google Scholar] [CrossRef]
  41. Wang, R.; Zhao, X.; Liu, H.; Wu, H. Elucidating the impact of influent pollutant loadings on pollutants removal in agricultural waste-based constructed wetlands treating low C/N wastewater. Bioresour. Technol. 2019, 273, 529–537. [Google Scholar] [CrossRef] [PubMed]
  42. Hua, G.; Li, L.; Zhao, Y.; Zhu, W.; Shen, J. An integrated model of substrate clogging in vertical flow constructed wetlands. J. Environ. Manag. 2013, 119, 67–75. [Google Scholar] [CrossRef]
  43. Xu, D.; Wang, L.; Li, H.; Li, Y.; Howard, A.; Guan, Y.; Li, J.; Xu, H. The forms and bioavailability of phosphorus in integrated vertical flow constructed wetland with earthworms and different substrates. Chemosphere 2015, 134, 492–498. [Google Scholar] [CrossRef] [PubMed]
  44. Stefanakis, A.I.; Tsihrintzis, V.A. Use of zeolite and bauxite as filter media treating the effluent of Vertical Flow Constructed Wetlands. Microporous Mesoporous Mater. 2012, 155, 106–116. [Google Scholar] [CrossRef]
  45. Pansini, M. Natural zeolites as cation exchangers for environmental protection. Miner. Depos. 1996, 31, 563–575. [Google Scholar] [CrossRef]
  46. Mumpton, F.A. La roca magica: Uses of natural zeolites in agriculture and industry. Proc. Natl. Acad. Sci. USA 1999, 96, 3463–3470. [Google Scholar] [CrossRef]
  47. Arunbabu, V.; Sruthy, S.; Antony, I.; Ramasamy, E. Sustainable greywater management with Axonopus compressus (broadleaf carpet grass) planted in sub surface flow constructed wetlands. J. Water Process Eng. 2015, 7, 153–160. [Google Scholar] [CrossRef]
  48. Sun, J.; Yang, M.; Zeng, L.; Wang, M.; He, S.; Cai, S.; Li, L.; Liu, X.; Zhang, H. Adsorption Performance on Sediment Nutrients by Different Proportions of Zeolite and Shale Ceramsite (ZSC). Pol. J. Environ. Stud. 2020, 29, 2365–2372. [Google Scholar] [CrossRef]
  49. Hedström, A. Ion Exchange of Ammonium in Zeolites: A Literature Review. J. Environ. Eng. 2001, 127, 673–681. [Google Scholar] [CrossRef]
  50. Ji, Z.-Y.; Yuan, J.-S.; Li, X.-G. Removal of ammonium from wastewater using calcium form clinoptilolite. J. Hazard. Mater. 2007, 141, 483–488. [Google Scholar] [CrossRef]
  51. Pang, S.; Masjuki, H.; Kalam, M.; Hazrat, M. Liquid absorption and solid adsorption system for household, industrial and automobile applications: A review. Renew. Sustain. Energy Rev. 2013, 28, 836–847. [Google Scholar] [CrossRef]
  52. Li, N.; Lai, B.; Ding, L.; Li, J.; Liu, C.; Wu, L. Synchronous algae and phosphorus removal by Ceramsite@Fe2O3 (FC) via taking the algae as crystal nuclei of hydroxylapatite. Chem. Eng. J. 2021, 426, 130748. [Google Scholar] [CrossRef]
  53. Li, X.; Wang, P.; Guo, Z.; Qin, J.; Liang, K. Effect of Fe2+/Fe3+ on high-strength ceramsite prepared by sintering geopolymers using iron ore tailings. Ceram. Int. 2022, 48, 5681–5688. [Google Scholar] [CrossRef]
  54. Monea, M.C.; Löhr, D.K.; Meyer, C.; Preyl, V.; Xiao, J.; Steinmetz, H.; Schönberger, H.; Drenkova-Tuhtan, A. Comparing the leaching behavior of phosphorus, aluminum and iron from post-precipitated tertiary sludge and anaerobically digested sewage sludge aiming at phosphorus recovery. J. Clean. Prod. 2020, 247, 119129. [Google Scholar] [CrossRef]
  55. Jiang, Z.; Wu, J.; Liu, X.; Yu, H.; Jiao, C.; Shen, J.-Y.; Pei, Y. Facile synthesis of MgAl layered double hydroxides by a co-precipitation method for efficient nitrate removal from water: Kinetics and mechanisms. New J. Chem. 2021, 45, 14580–14588. [Google Scholar] [CrossRef]
  56. Zhao, X.; Zhao, X.; Chen, C.; Zhang, H.; Wang, L. Ecological floating bed for decontamination of eutrophic water bodies: Using alum sludge ceramsite. J. Environ. Manag. 2022, 311, 114845. [Google Scholar] [CrossRef]
  57. Liu, C.; Huang, X.; Yu, J.; Si, W.; Fu, Y. Water supply sludge-based ceramsite denitrification filter: Pollutant removal and microbial community characteristics. J. Water Process Eng. 2023, 55, 104229. [Google Scholar] [CrossRef]
  58. Jiang, C.; Jia, L.; Zhang, B.; He, Y.; Kirumba, G. Comparison of quartz sand, anthracite, shale and biological ceramsite for adsorptive removal of phosphorus from aqueous solution. J. Environ. Sci. 2014, 26, 466–477. [Google Scholar] [CrossRef]
  59. Ahmed, S.J.; Taylor, H.F.W. Crystal Structures of the Lamellar Calcium Aluminate Hydrates. Nature 1967, 215, 622–623. [Google Scholar] [CrossRef]
  60. Christensen, A.N.; Jensen, T.R.; Lebech, B.; Hanson, J.C.; Jakobsen, H.J.; Skibsted, J. Thermal decomposition of monocalcium aluminate decahydrate (CaAl2O4·10H2O) investigated by in-situsynchrotron X-ray powder diffraction, thermal analysis and 27Al, 2H MAS NMR spectroscopy. Dalton Trans. 2008, 4, 455–462. [Google Scholar] [CrossRef]
  61. Chatterjee, N.D.; Johannes, W.; Leistner, H. The system CaO-Al2O3-SiO2-H2O: New phase equilibria data, some calculated phase relations, and their petrological applications. Contrib. Mineral. Petrol. 1984, 88, 1–13. [Google Scholar] [CrossRef]
  62. Meller, N.; Hall, C.; Kyritsis, K.; Giriat, G. Synthesis of cement based CaO–Al2O3–SiO2–H2O (CASH) hydroceramics at 200 and 250 °C: Ex-situ and in-situ diffraction. Cem. Concr. Res. 2007, 37, 823–833. [Google Scholar] [CrossRef]
  63. Saleh, H.I. Synthesis and formation mechanisms of calcium ferrite compounds. J. Mater. Sci. Technol. 2004, 20, 530–534. [Google Scholar]
  64. Amir, S.; Jouraiphy, A.; Meddich, A.; El Gharous, M.; Winterton, P.; Hafidi, M. Structural study of humic acids during composting of activated sludge-green waste: Elemental analysis, FTIR and 13C NMR. J. Hazard. Mater. 2010, 177, 524–529. [Google Scholar] [CrossRef]
  65. Xu, J.; Xu, X.; Liu, Y.; Li, H.; Liu, H. Effect of microbiological inoculants DN-1 on lignocellulose degradation during co-composting of cattle manure with rice straw monitored by FTIR and SEM. Environ. Prog. Sustain. Energy 2016, 35, 345–351. [Google Scholar] [CrossRef]
  66. Fan, Y.V.; Lee, C.-T.; Klemeš, J.J.; Chua, L.S.; Sarmidi, M.R.; Leow, C.W. Evaluation of Effective Microorganisms on home scale organic waste composting. J. Environ. Manag. 2017, 216, 41–48. [Google Scholar] [CrossRef]
  67. Lin, Y.; Ye, Y.; Hu, Y.; Shi, H. The variation in microbial community structure under different heavy metal contamination levels in paddy soils. Ecotoxicol. Environ. Saf. 2019, 180, 557–564. [Google Scholar] [CrossRef]
  68. Wang, H.; Liu, R.; Chen, Q.; Xia, H.; Zhang, Y. Novel Chitosan-FeS@ biochar-added constructed wetland microcosms for NH4+/NO3− and Pb removal: Performance and mechanism. J. Environ. Chem. Eng. 2023, 11, 110400. [Google Scholar] [CrossRef]
  69. Sha, H.; Song, X.; Abdullah Al-Dhabi, N.; Zeng, T.; Mao, Y.; Fu, Y.; Liu, Z.; Wang, G.; Tang, W. Effects of biochar layer position on treatment performance and microbial community in subsurface flow constructed wetlands for removal of cadmium and lead. Bioresour. Technol. 2024, 394, 130194. [Google Scholar] [CrossRef]
  70. Ren, T.; Chi, Y.; Wang, Y.; Shi, X.; Jin, X.; Jin, P. Diversified metabolism makes novel Thauera strain highly competitive in low carbon wastewater treatment. Water Res. 2021, 206, 117742. [Google Scholar] [CrossRef]
  71. Tian, M.; Zhao, F.; Shen, X.; Chu, K.; Wang, J.; Chen, S.; Guo, Y.; Liu, H. The first metagenome of activated sludge from full-scale anaerobic/anoxic/oxic (A2O) nitrogen and phosphorus removal reactor using Illumina sequencing. J. Environ. Sci. 2015, 35, 181–190. [Google Scholar] [CrossRef] [PubMed]
  72. Feng, J.; Zhang, Q.; Tan, B.; Li, M.; Peng, H.; He, J.; Zhang, Y.; Su, J. Microbial community and metabolic characteristics evaluation in start-up stage of electro-enhanced SBR for aniline wastewater treatment. J. Water Process Eng. 2022, 45, 102489. [Google Scholar] [CrossRef]
  73. Sun, H.; Zhou, Q.; Zhao, L.; Wu, W. Enhanced simultaneous removal of nitrate and phosphate using novel solid carbon source/zero-valent iron composite. J. Clean. Prod. 2021, 289, 125757. [Google Scholar] [CrossRef]
  74. Wang, L.; Pang, Q.; Zhou, Y.; Peng, F.; He, F.; Li, W.; Xu, B.; Cui, Y.; Zhu, X. Robust nitrate removal and bioenergy generation with elucidating functional microorganisms under carbon constraint in a novel multianode tidal constructed wetland coupled with microbial fuel cell. Bioresour. Technol. 2020, 314, 123744. [Google Scholar] [CrossRef]
Figure 1. Schematic diagram of the experimental device.
Water 17 00741 g001
Figure 2. The total nitrogen (TN) removal efficiency.
Water 17 00741 g002
Figure 3. The ammonium nitrogen (NH4+-N) removal efficiency.
Water 17 00741 g003
Figure 4. The total phosphorus (TP) removal efficiency.
Water 17 00741 g004
Figure 5. The chemical oxygen demand (COD) removal efficiency.
Water 17 00741 g005
Figure 6. SEM images of ceramsite, anthracite, and zeolite: (a) mid-term ceramsite; (b) late-term ceramsite; (c) mid-term anthracite; (d) late-term anthracite; (e) mid-term zeolite; (f) late-term zeolite.
Water 17 00741 g006
Figure 7. XRD patterns of ceramsite, anthracite, and zeolite: (a) mid-term ceramsite; (b) late-term ceramsite; (c) mid-term anthracite; (d) late-term anthracite; (e) mid-term zeolite; (f) late-term zeolite.
Water 17 00741 g007
Figure 8. BET patterns of ceramsite, anthracite, and zeolite: (a) mid-term ceramsite; (b) late-term ceramsite; (c) mid-term anthracite; (d) late-term anthracite; (e) mid-term zeolite; (f) late-term zeolite.
Water 17 00741 g008
Figure 9. FTIR patterns of ceramsite, anthracite, and zeolite: (a) mid-term ceramsite; (b) late-term ceramsite; (c) mid-term anthracite; (d) late-term anthracite; (e) mid-term zeolite; (f) late-term zeolite.
Water 17 00741 g009
Figure 10. Microbial community composition at the phylum level: (a) mid-stage fillers; (b) late-stage fillers.
Water 17 00741 g010
Figure 11. Heatmap of microbial abundance at the genus level: anthracite_a, ceramsite_a, and zeolite_a represent the mid-stage fillers; anthracite_b, ceramsite_b, and zeolite_b represent the late-stage fillers.
Water 17 00741 g011
Figure 12. PCA analysis of microbial communities on different materials: anthracite_a, ceramsite_a, and zeolite_a represent the mid-stage fillers; anthracite_b, ceramsite_b, and zeolite_b represent the late-stage fillers.
Water 17 00741 g012
Table 1. Water quality indicator measurement methods.
Analysis IndicatorMeasurement Method
TNAlkaline potassium persulfate digestion UV spectrophotometric method (HJ 636—2012)
TPAmmonium molybdate spectrophotometric method
(GB 11893-89)
NH4+-NNessler’s reagent spectrophotometric method
(HJ 535-2009)
CODRapid digestion spectrophotometric method
Table 2. Microscopic property analysis of the filler.
Instruments and EquipmentModelTest Content
Scanning Electron Microscope
(SEM)
FEI Quanta 650
(Hillsboro, OR, USA)
Microscopic Structure
X-ray Diffraction (XRD)Bruker D2 Phaser
(Karlsruhe, Germany)
Mineral Composition
Automatic Surface Area and Porosity Analyzer (BET)Micromeritics ASAP 2460 (Norcross, GA, USA)Specific Surface Area
Fourier Transform Infrared Spectrometer (FTIR)Thermo Scientific
(Waltham, MA, USA)
Functional Groups
Disclaimer/Publisher’s Note: The statements, opinions and data contained in all publications are solely those of the individual author(s) and contributor(s) and not of MDPI and/or the editor(s). MDPI and/or the editor(s) disclaim responsibility for any injury to people or property resulting from any ideas, methods, instructions or products referred to in the content.