Article

Research on the Method of Extracting Water Body Information in Central Asia Based on Google Earth Engine

1
College of Information and Control Engineering, Qingdao University of Technology, Qingdao 266101, China
2
Xinjiang Herun Technology Co., Ltd., Urumqi 831400, China
3
Key Laboratory for Semi-Arid Climate Change of the Ministry of Education, College of Atmospheric Sciences, Lanzhou University, Lanzhou 730000, China
*
Author to whom correspondence should be addressed.
Water 2025, 17(6), 804; https://doi.org/10.3390/w17060804
Submission received: 6 January 2025 / Revised: 26 February 2025 / Accepted: 5 March 2025 / Published: 11 March 2025

Abstract

:
This study evaluates water body changes in Central Asia (2000–2019) using Landsat 7 data on Google Earth Engine, comparing the Modified Normalized Difference Water Index (MNDWI), OTSU algorithm, and random forest (RF). The random forest algorithm demonstrated the best overall performance in water body extraction and was selected as the analysis tool. The results reveal a significant 11.25% decline in Central Asia’s total water area over two decades, with the Aral Sea shrinking by 72.13% (2000–2019) and southern Kyrgyzstan’s glaciers decreasing by 39.23%. Pearson correlations indicate strong links between water loss and rising temperatures (−0.5583) and declining precipitation (0.6872). Seasonal fluctuations and permanent degradation (e.g., dry riverbeds) highlight climate-driven vulnerabilities, exacerbated by anthropogenic impacts. These trends threaten regional water security and ecological stability, underscoring the urgent need for adaptive resource management. The RF-GEE framework proves effective for large-scale, long-term hydrological monitoring in arid regions, offering critical insights for climate resilience strategies.

1. Introduction

Central Asia, located at the heart of the expansive Eurasian landmass, is distinguished as the largest arid region on Earth, uniquely diverging from typical zonal climatic patterns. Encompassing a diverse range of landscapes and ecosystems, this region spans five countries, namely Kazakhstan, Kyrgyzstan, Turkmenistan, Tajikistan, and Uzbekistan, each contributing to its distinct environmental and cultural characteristics. As the main corridor of “One Belt, One Road”, Central Asia is also one of the focal points of international water resource conflicts, and water resources have emerged as a critical factor limiting the region’s development. With the acceleration of global climate warming, studying the fluctuations in water resources across the arid and semi-arid regions of Central Asia is crucial. This examination is not only vital for the efficient management of inland water resources and the achievement of sustainable development goals, but also serves as a key entry point for exploring the complex interactions between water resource variations, climate change, and human societal development. Additionally, it provides a foundation for further research into the impacts of water resource changes on climate dynamics and human activities. It also lays the groundwork for further investigations into the effects of water resource changes on climate change and human activities. At the same time, this region has an extremely uneven distribution of water resources due to its unique geographic location and climatic conditions, which presents a significant challenge to local socio-economic development as well as to ecological and environmental conservation [1,2,3,4,5]. And, with the emergence of these problems, there is a need for a suitable method for large-area, long time series extraction of water bodies in order to study the water resources situation in Central Asia.
Water resources in the arid zone of Central Asia are mainly dominated by rivers, lakes, and permanent glaciers, and their spatial and temporal variations are not only important parameters and indicators of climate change, but also have a very close relationship with the whole water cycle process in the arid zone. To investigate the distribution of water resources in Central Asia, Li Junli et al. conducted a systematic analysis of the primary factors driving changes in the lake levels of key Central Asian lakes between 2003 and 2009 [2]. Cheng Chen et al. identified the factors influencing lake changes by analyzing the spatial and temporal variations in lake area and water levels across Central Asia from 1992 to 2012 [6]. VU Kandekar et al. extracted surface water analysis from Sentinel-2A imagery using the Google Earth Engine (GEE) platform and a new technique of machine learning coding [7]. Yue Deng et al. analyzed the long-term changes in open-surface water bodies from 1984 to 2018 using the Google Earth Engine platform [8]. Wang Chao et al. applied the random forest classification method to the Google Earth Engine platform to determine the minimum and maximum surface water extent in the middle reaches of the Yangtze River Basin. The classification accuracy ranged from 86% to 93% [9]. To summarize, it is still necessary to use GEE to study water resources information in Central Asia.
Most of the previous research on Central Asia was based on lakes in Central Asia, ignoring water bodies such as rivers and glaciers, and most of the research methods were based on traditional high-resolution satellite image processing, which faced huge challenges such as acquisition of huge amounts of data, cumbersome pre-processing, and multi-dimensional analysis, etc. The Google Earth Engine platform [10] has changed the traditional way of storing, managing, and analyzing geospatial data, and has been widely used in geoscientific studies. The Google Earth Engine platform has changed the traditional way of storing, managing, and analyzing geospatial data, and has become widely adopted in Earth science research [11,12,13,14,15,16]. Since Central Asia is located in a typical arid/semi-arid region, and part of the region is located at high altitudes, the factors affecting changes in water extent may be greatly influenced by altitude, temperature, and precipitation [17]. Therefore, finding a fast and accurate method to extract water body information in the arid zone of Central Asia has become a hot issue in current research. Building on this, we first utilized the GEE platform to conduct large-scale, long-term water body extraction across Central Asia, using Landsat imagery spanning 20 years (2000–2019) as the data source. This analysis was based on three computational methods, including the Modified Normalized Difference Water Index (MNDWI) [18,19], the maximum interclass variance method (the OTSU algorithm) [20], and the random forest algorithm [21,22,23], and through the comparison of the accuracy of the three extraction methods in the region. The optimal extraction model was selected by comparing the accuracy, kappa coefficient, and extraction effect of the three extraction methods in the region and the Aral Sea area, and some high-altitude glacier areas were selected as special study areas to more precisely represent the distribution of water bodies in the region, and to comprehensively analyze the spatio-temporal pattern of water distribution and evolution trends in the region. Thus, the primary objective of this study is to develop a straightforward and user-friendly method for the rapid extraction of water body data over large spatial areas, applicable to Landsat remote sensing imagery on the GEE platform. The method aims to achieve high extraction accuracy across diverse surface environments and facilitate water body extraction in Central Asia.

2. Materials and Methods

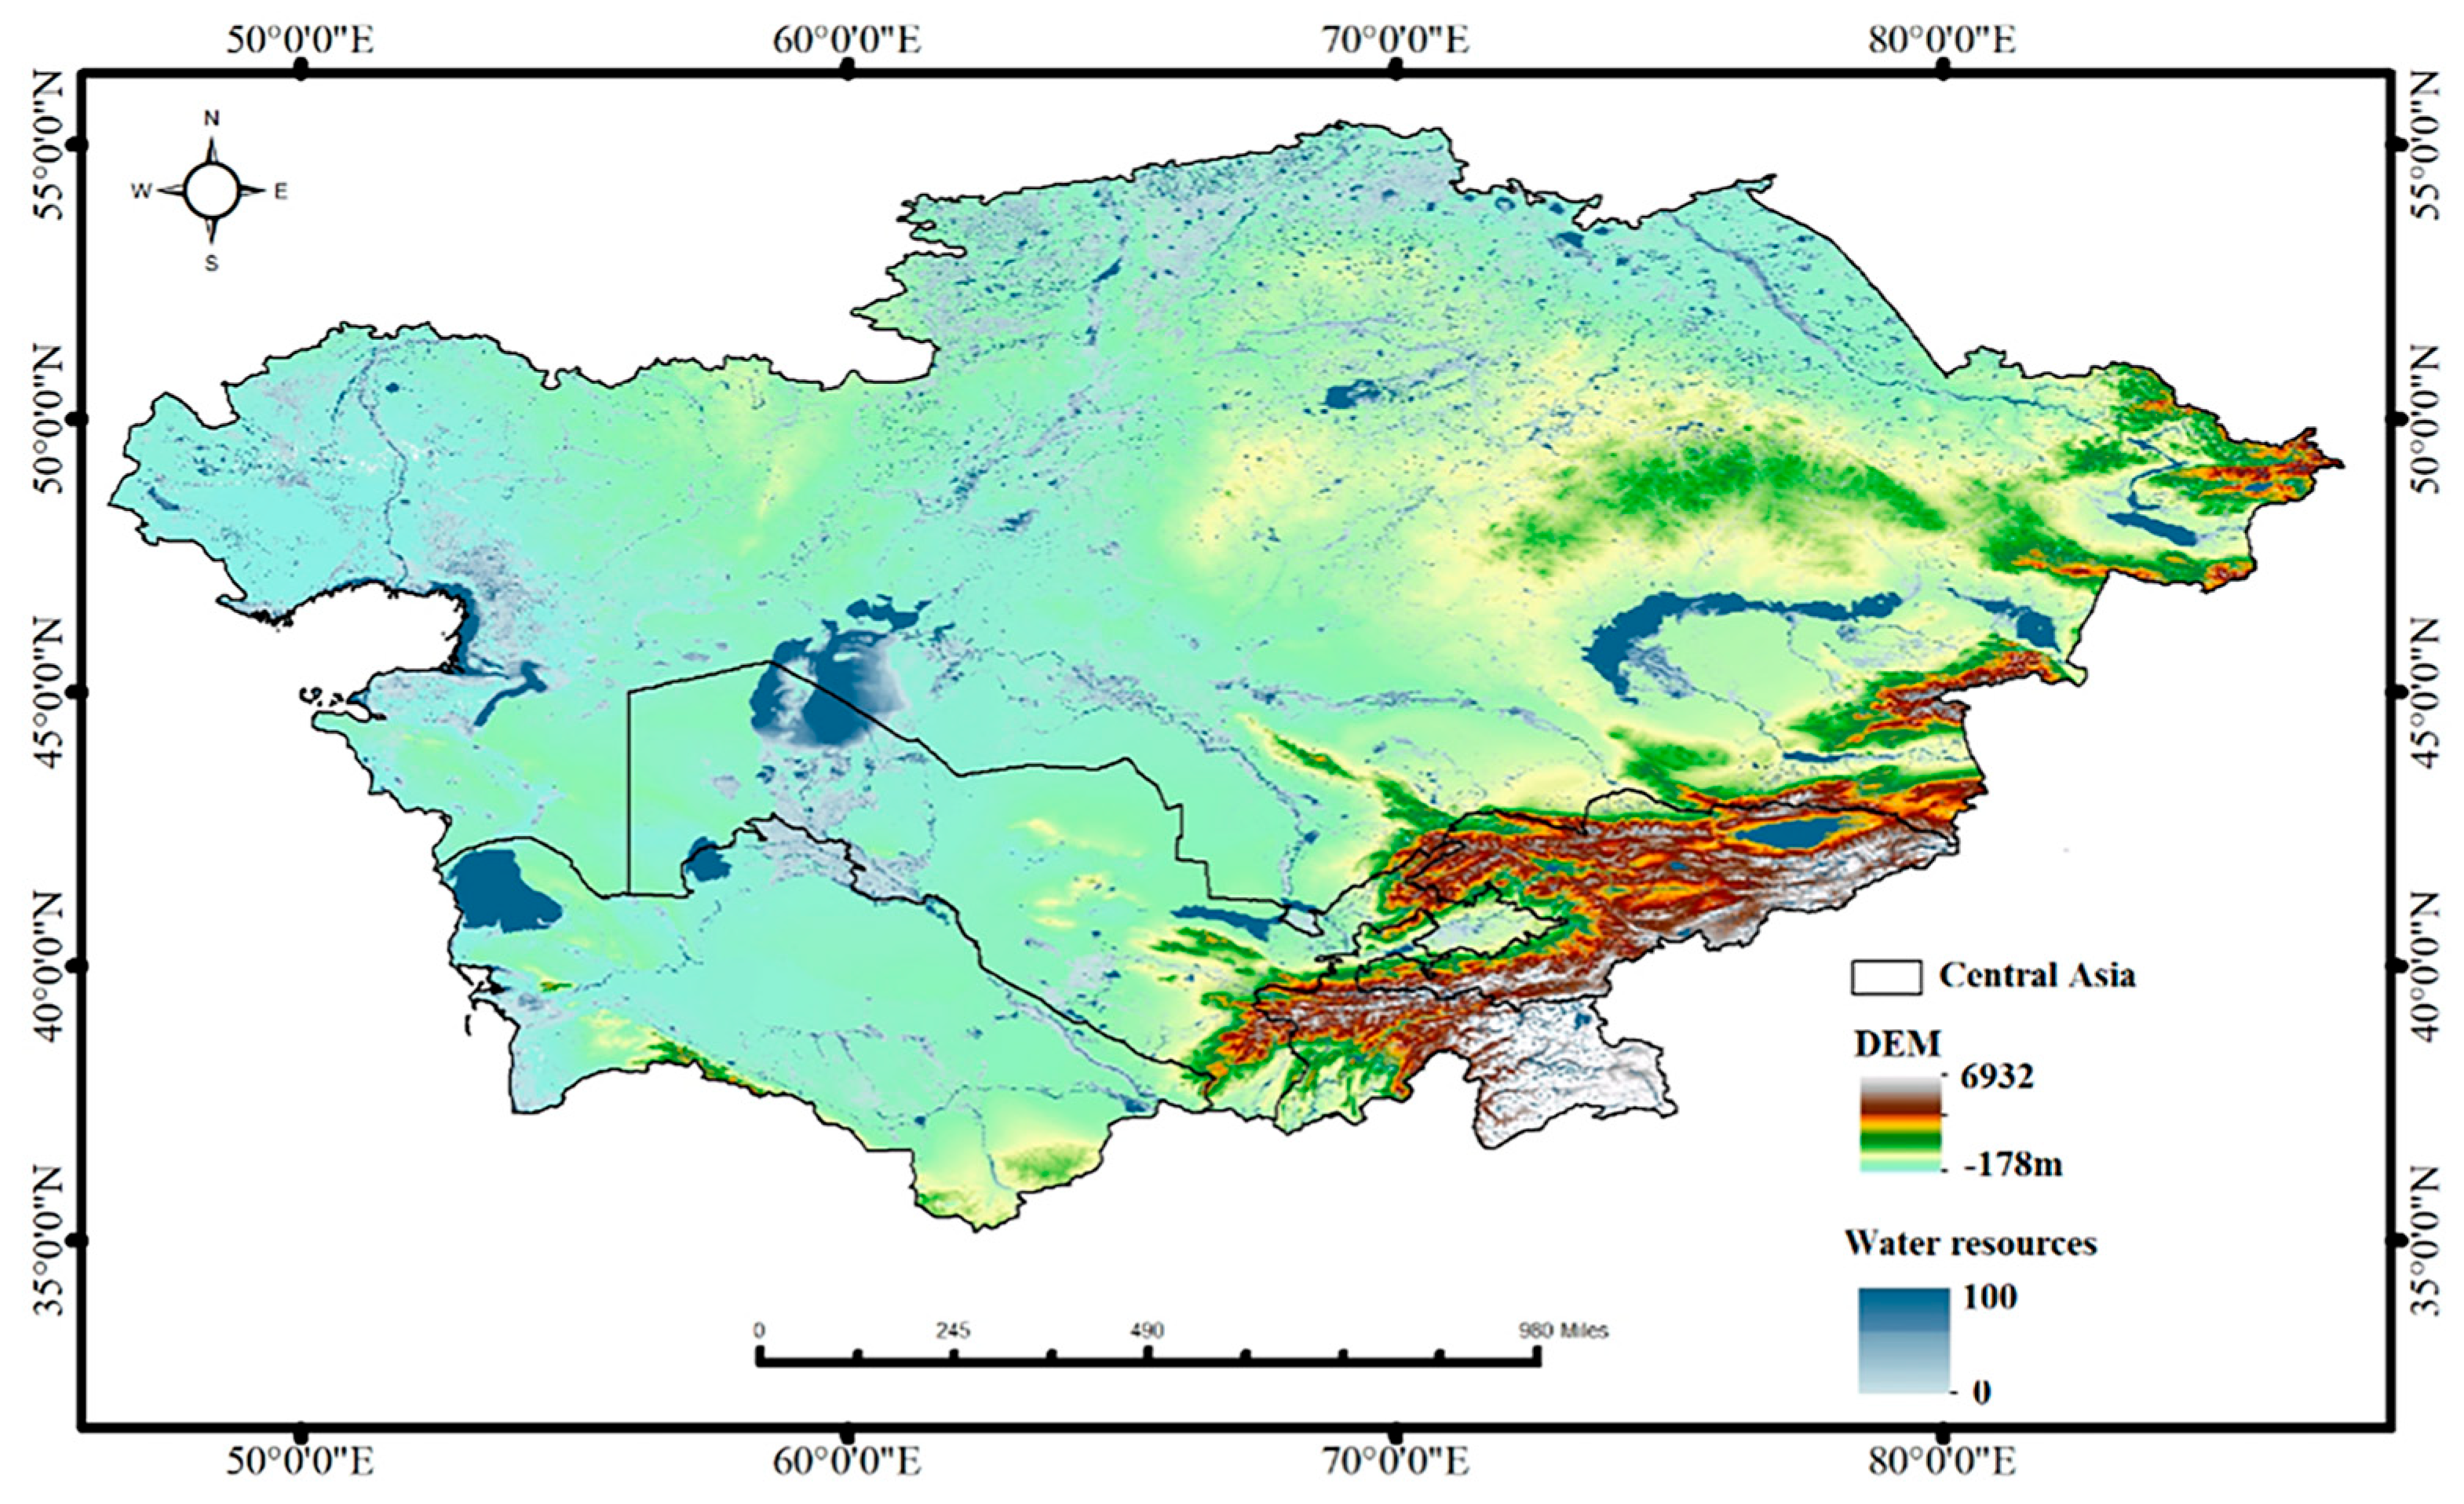
2.1. Study Area and Study Period

Central Asia, situated in the interior of the Eurasian continent, features a topography characterized by higher elevations in the southeast and lower terrain in the northwest. Central Asia is a typical arid/semi-arid climate zone, with large areas of deserts and grasslands, and part of the region is located at high altitudes, where changes in water extent are strongly influenced by altitude, temperature, and precipitation [17]. With the in-depth development of the “One Belt, One Road” program and to address the lack of information regarding the distribution of water resources in the region [24], we chose Central Asia as the study area and selected the Aral Sea area and high-altitude glacier areas as special study areas for water body analysis; their geographic location and topographic distribution are shown in the Figure 1.
We selected the period from 2000 to 2019 primarily because the Landsat 7 satellites have provided continuous imagery since 1999. During this period, our study area has undergone significant changes, particularly in terms of land use and vegetation cover. Moreover, the data quality for this timeframe is stable, and Landsat 7 offers a relatively complete time series for analysis.

2.1.1. Remote Sensing Image Data Sources

The remotely sensed image data used in this study consists of the surface reflectance product from Landsat 7 ETM+, available through the Google Earth Engine platform. The specific dataset, identified as LANDSAT/LE07/C02/T1_RT_TOA, has a spatial resolution of 30 m and a temporal resolution of 16 days. It has undergone radiometric, atmospheric, and geometric correction.

2.1.2. Other Auxiliary Data

To conduct a more comprehensive analysis of the spatial and temporal variations in water resources in Central Asia, auxiliary data were selected from the GLDAS (Global Land Data Assimilation System) temperature dataset [25] and the CHIRPS (Climate Hazards Group InfraRed Precipitation with Station data) precipitation dataset [26]. The precipitation dataset, provided by UCSB-CHG, consists of daily precipitation data on a global scale, fused from satellite remote sensing data and ground station data, with the unit of precipitation in millimeters (mm/day), which expresses the amount of precipitation in one day per square meter of surface area.
The temperature dataset is provided by NASA and includes temperature data on the surface of the earth on a global scale. The temperature data includes land surface temperature (LST) as well as soil temperature and other related metrics, and the data unit provides data at multiple time steps, including 3 h, days, months, etc., which can meet the data needs at different time scales. We choose to use a daily time scale and to use scaling factors to convert the daily time scale into the average temperature per year for analysis.

2.2. Research Methods

Firstly, we need to explain the reasons for choosing the MNDWI, OTSU, and random forest methods over other methods.
First, the Modified Normalized Difference Water Index (MNDWI) was selected because it outperforms traditional NDWI in water body extraction, particularly in mitigating background interference and delineating water body boundaries. By utilizing both the short-wave infrared and green bands, MNDWI enhances the visibility of water bodies and is particularly effective in urbanized areas, where water boundaries are often obscured by surrounding buildings and vegetation.
Second, the Otsu method (OTSU), an automatic thresholding technique, was chosen due to its strong adaptability and effectiveness in image segmentation. It performs particularly well in water body identification by optimizing the threshold based on the image histogram. This automatic thresholding capability allows the OTSU to adapt to temporal and spatial variations without manual adjustments, making it highly suitable for our study.
Regarding the random forest algorithm, it is a widely used machine learning classifier that has demonstrated superior accuracy and stability in remote sensing data analysis. Random forests excel in handling large numbers of input features and mitigating the risk of overfitting. Given that our study involves multiple remote sensing bands and complex spatial features, the random forest algorithm provides robust and accurate results.
While these methods have proven effective in our study, we also recognize their limitations. For instance, the MNDWI can be influenced by clouds, shadows, and other non-water features, as well as salt marshes and salt crusts, which may lead to misclassifications. The OTSU’s reliance on histogram distribution can result in suboptimal segmentation, particularly when image quality is poor or the water area is small. Although random forests can manage large datasets, the model training process is more complex and demands high-quality and extensive training data.

2.2.1. Modified Normalized Difference Water Index

The Modified Normalized Difference Water Index (MNDWI) is a remote sensing index used to extract water body information. It is derived from an enhanced version of the Normalized Difference Water Index (NDWI) [27] and is primarily employed to identify water bodies in remotely sensed imagery. The formula for the NDWI is as follows:
N D W I = ( G N I R ) ( G + N I R )
The calculation formula of the MNDWI is as follows:
M N D W I = ( G M I R ) ( G + M I R )
Here, G represents the reflectivity of the green band, NIR corresponds to the reflectivity of the near-infrared band, and MIR denotes the reflectivity of the mid-infrared band. The Modified Normalized Difference Water Index (MNDWI) exhibits a characteristic value range spanning from −1 to 1, where aquatic features are predominantly characterized by positive values (>0), whereas terrestrial surfaces—including vegetation, artificial structures, and exposed soil—are typically associated with negative or near-zero values.

2.2.2. The Maximum Inter-Class Variance Algorithm

The maximum inter-class variance algorithm (the OTSU algorithm) divides the image into two parts—background and target—based on the image’s grayscale characteristics. The goal is to maximize the inter-class variance between the background and target, as a larger variance indicates a clearer distinction between the two parts. If a target is mistakenly classified as background, or vice versa, the difference between the two parts becomes smaller, leading to reduced inter-class variance. Therefore, maximizing the inter-class variance minimizes the likelihood of misclassification, ensuring optimal extraction accuracy for the water column segmentation.
The computational procedure operates through three sequential phases: (1) the probability distribution analysis of grayscale histograms, (2) the determination of class probabilities accompanied by mean value computations, and (3) optimization through inter-class variance maximization.
In phase (1), first calculate the pixel frequency h i of each gray level i in the image, and then convert the frequency into a probability distribution The product of W × H represents the total pixel count within the image, while L denotes the number of distinct gray levels present in the image:
p ( i ) = h ( i ) W × H ( i = 0 , 1 , , L 1 )
In phase (2), calculate the statistics for two categories (foreground/background) separately for the candidate threshold t ( w 0 and w 1 represent the proportional distributions of the two pixel classes, while μ 0 and μ 1 denote the mean gray-level intensities for each respective class):
ω 0 t = i = 0 t   p i ,               ω 1 t = 1 ω 0 t
μ 0 t = i = 0 t   i p i ω 0 t ,               μ 1 ( t ) = i = t + 1 L 1   i p ( i ) ω 1 ( t )
In phase (3), maximize inter-class differences to achieve adaptive segmentation:
σ b 2 ( t ) = ω 0 ( t ) ω 1 ( t ) μ 1 ( t ) μ 0 ( t ) 2
Traverse all gray levels and select the threshold that maximizes the inter-class variance:
t = arg m a x t [ 0 , L 1 ]   σ b 2 ( t )
ω 0 ( t + 1 ) = ω 0 ( t ) + p ( t + 1 ) , μ 0 ( t + 1 ) = ω 0 ( t ) μ 0 ( t ) + ( t + 1 ) p ( t + 1 ) ω 0 ( t + 1 )

2.2.3. Random Forest Algorithm

The random forest algorithm is an ensemble learning method that combines multiple decision trees to perform classification or prediction tasks. It effectively handles high-dimensional data and large datasets without requiring dimensionality reduction. The features in the dataset are used by the decision trees for both classification and importance assessment, ultimately yielding unbiased results and accurate predictions [21,28]. The random forest algorithm mainly includes three parts: data sampling, training the decision tree, and integrating the decision tree, and the following is the specific implementation process:
y ^ = m o d e { T b ( x ) } b = 1 k
For the regression task, the prediction of the random forest algorithm is the average of the prediction of each decision tree:
y ^ = 1 k b = 1 k T b x

2.2.4. Pearson Correlation

The Pearson correlation coefficient, also known as p , is used to measure the linear correlation between two continuous variables, with a value range of [−1,1]. The calculation formula is as follows:
p = i = 1 n   ( x i x ¯ ) ( y i y ¯ ) i = 1 n   ( x i x ¯ ) 2 i = 1 n   ( y i y ¯ ) 2

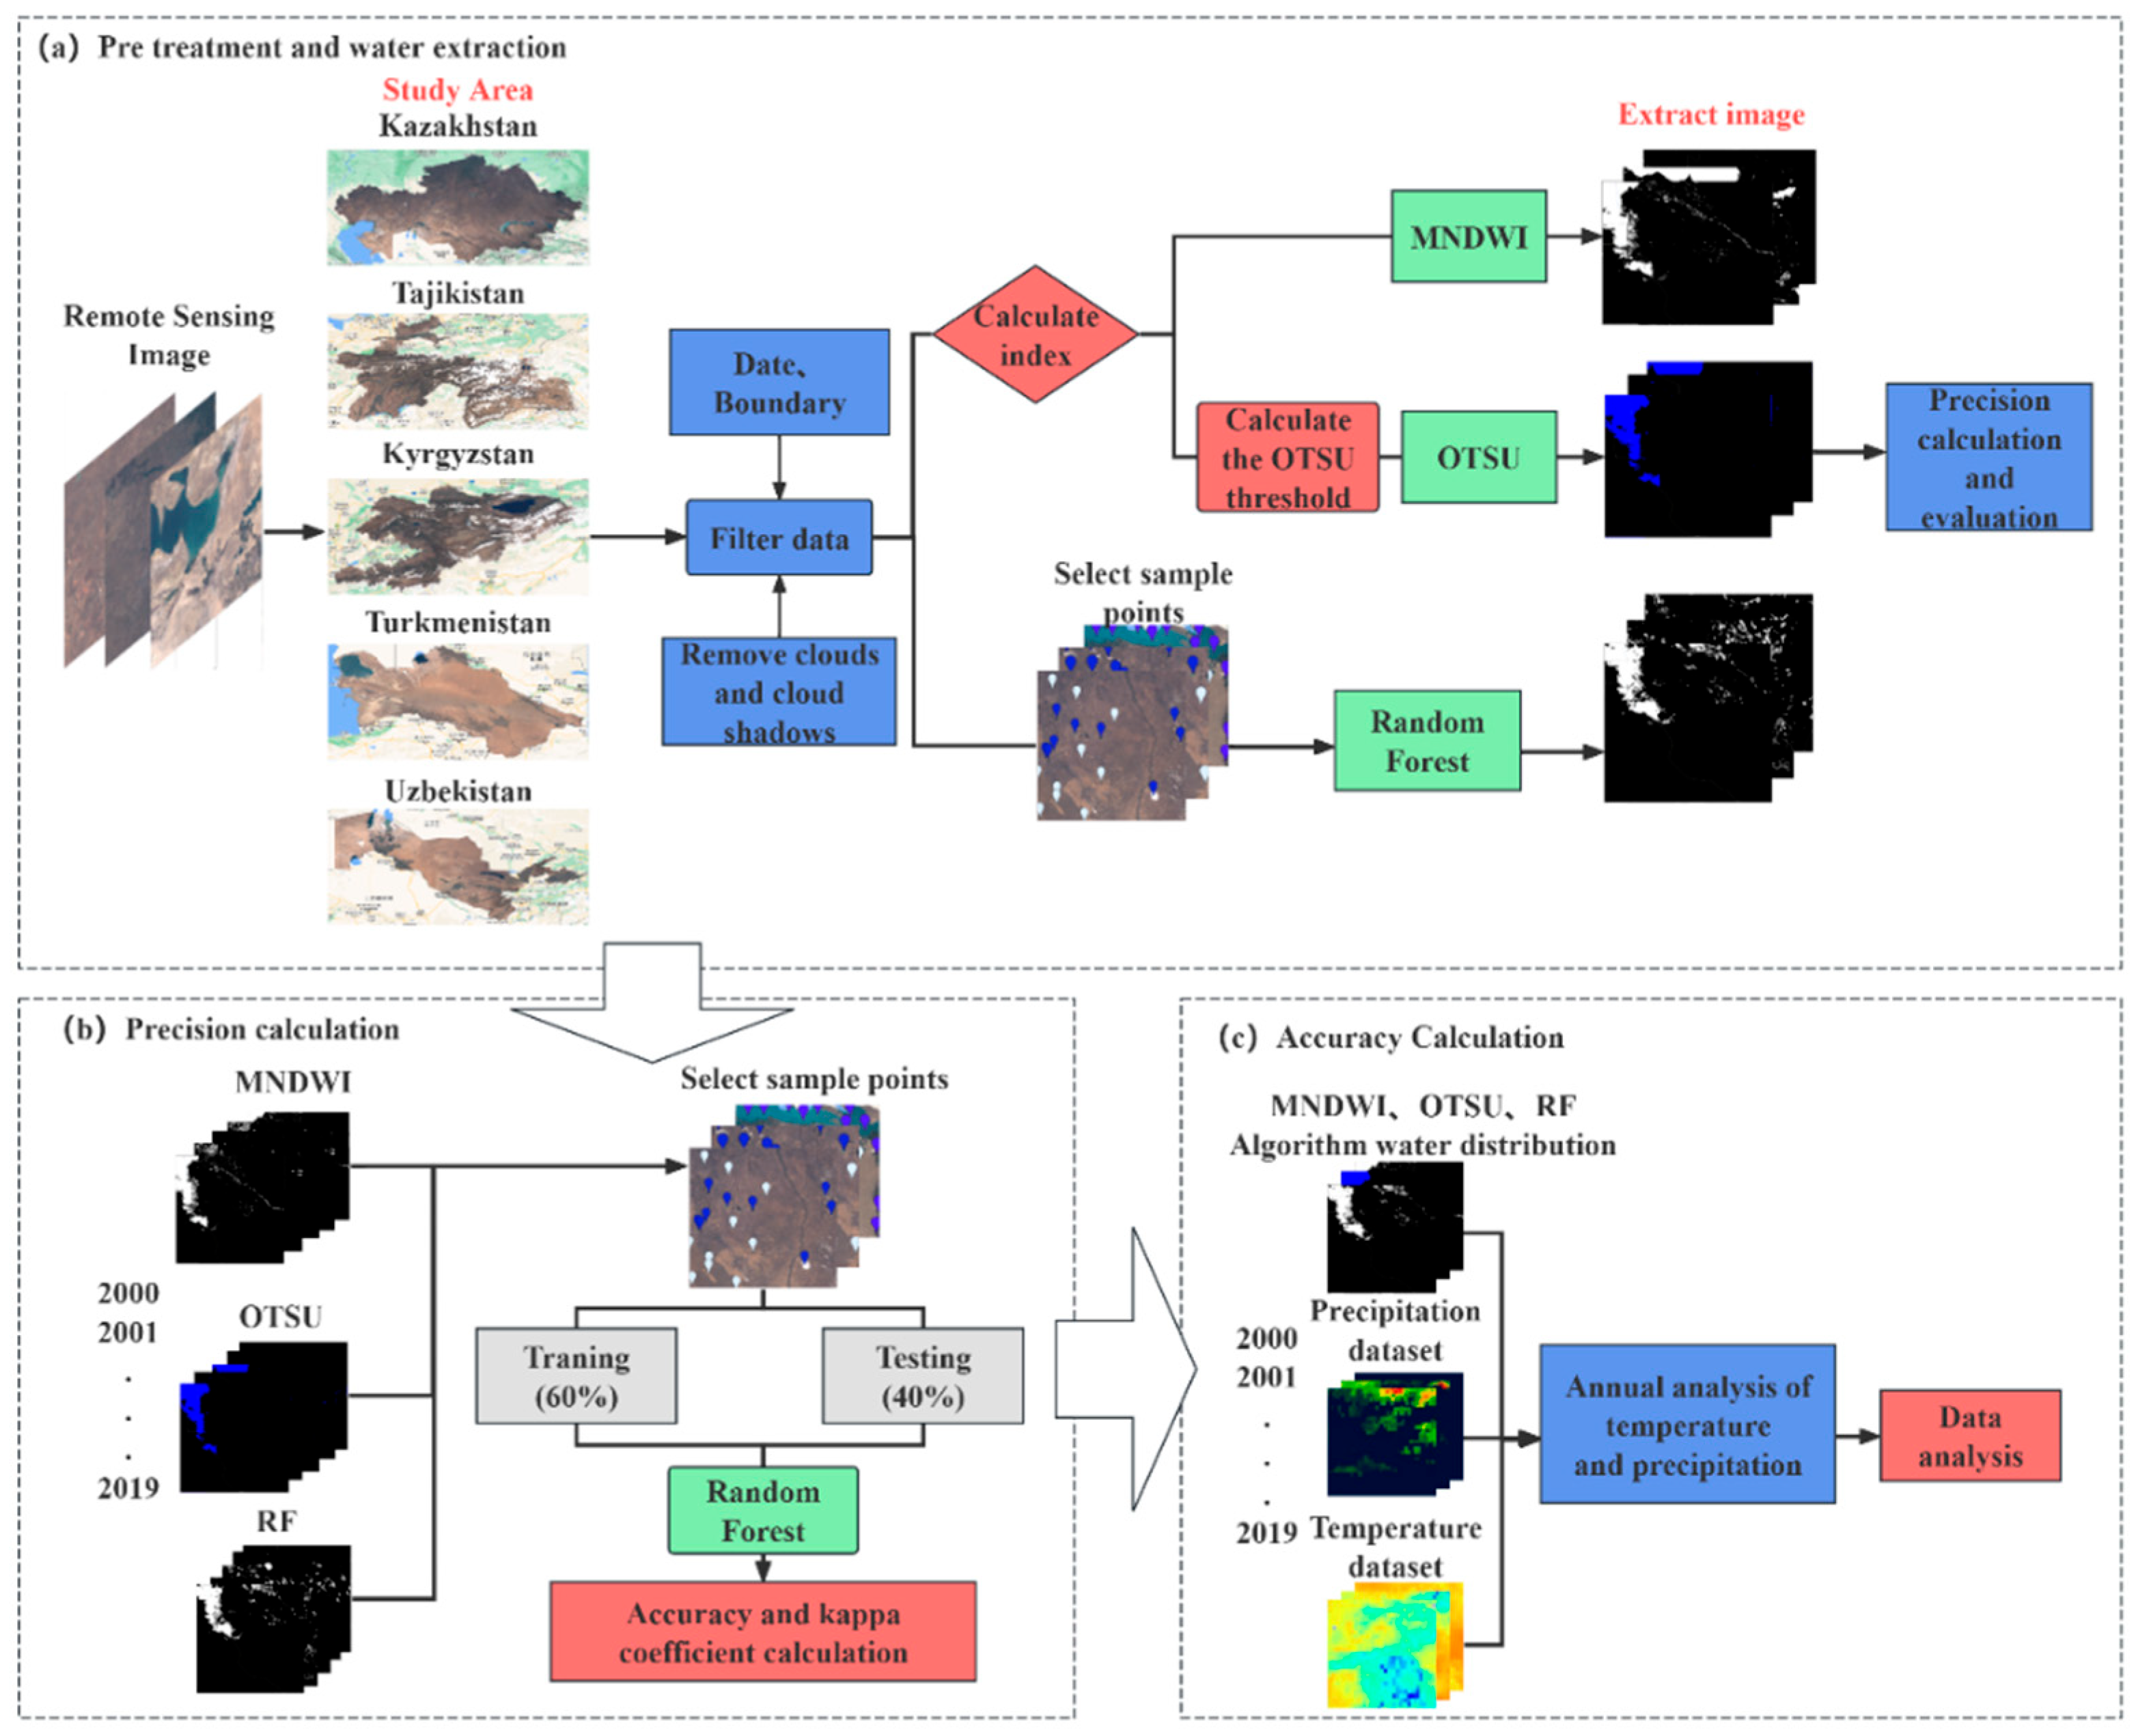
2.3. Research Process

In summary, the research method of tracking the spatio-temporal pattern of water bodies based on Landsat 7 remote sensing image data and the Google Earth Engine platform specifically used three comparison methods for analysis; namely, the MNDWI, OTSU, and random forest algorithm.
The image preprocessing workflow begins with the analysis of the LANDSAT/LE07/C02/T1_RT_TOA dataset on the Google Earth Engine platform, followed by partitioning the dataset into geographical zones, applying temporal filters based on the study’s timeframe, and performing cloud and shadow removal to obtain the desired imagery. Although the dataset has undergone radiometric correction, it lacks atmospheric correction for factors such as aerosols and water vapor, necessitating further processing through a cloud removal function. This function operates by defining cloud and cloud shadow bitmasks in the QA-PIXEL band, generating composite masks by combining these conditions, and applying the masks to the input images to retain only pixels free from cloud and shadow contamination, thereby producing cloud-free imagery.
The random forest methodology commences with the manual identification of sample points via visual interpretation. The spectral band characteristics of these hydrologically classified samples (water/non-water) serve as classification attributes for subsequent decision tree processing. To optimize model performance, the ensemble size was systematically calibrated through a parametric selection function, testing configurations from 10 to 100 constituent trees in 5-unit increments. Cross-temporal analysis of regional accuracy patterns spanning two decades revealed 60 decision trees as the optimal ensemble configuration, balancing computational efficiency with predictive stability. The partitioned dataset subsequently underwent stratified randomization, allocating 60% of observations for model training while reserving 40% for independent validation of classification outcomes. The specific research flow chart is shown in Figure 2:

2.4. Accuracy Verification

Accuracy validation typically involves evaluating metrics such as the confusion matrix, overall accuracy, and Kappa coefficient. In the case of water body extraction in Central Asia, errors primarily arise in regions where the distinction between water bodies and land is unclear, in areas with frequent inter-annual changes in the submerged extent of water bodies, and in high-altitude glacier regions of Kyrgyzstan and Tajikistan. Additionally, our analysis reveals that the extraction accuracy using the MNDWI method tends to be overestimated when delineating water body areas. We also found that the accuracy of extraction using the MNDWI method is “inflated” when extracting the area of water bodies.
A c c u r a c y = n c o r r e c t n t o t a l
Accuracy is operationally defined as the proportion of correctly classified instances within a predictive model’s output, calculated through systematic comparison with validated reference data. This metric quantifies congruence between model predictions and ground truth labels by measuring the percentage of samples where algorithmic outputs align precisely with original annotations.
During the manual visual interpretation process, sample points were systematically selected for each geographical zone based on land types from 2000 to 2019. Approximately 26,800 labeled points were identified in Kazakhstan, 4000 in Kyrgyzstan, 4000 in Tajikistan, 2600 in Turkmenistan, and 3200 in Uzbekistan. The chosen sample points were situated in distinct and easily identifiable water and non-water areas, ensuring even distribution across the region to enhance representativeness.

3. Results and Analysis

3.1. Extraction Results of Water Bodies in Five Central Asian Countries

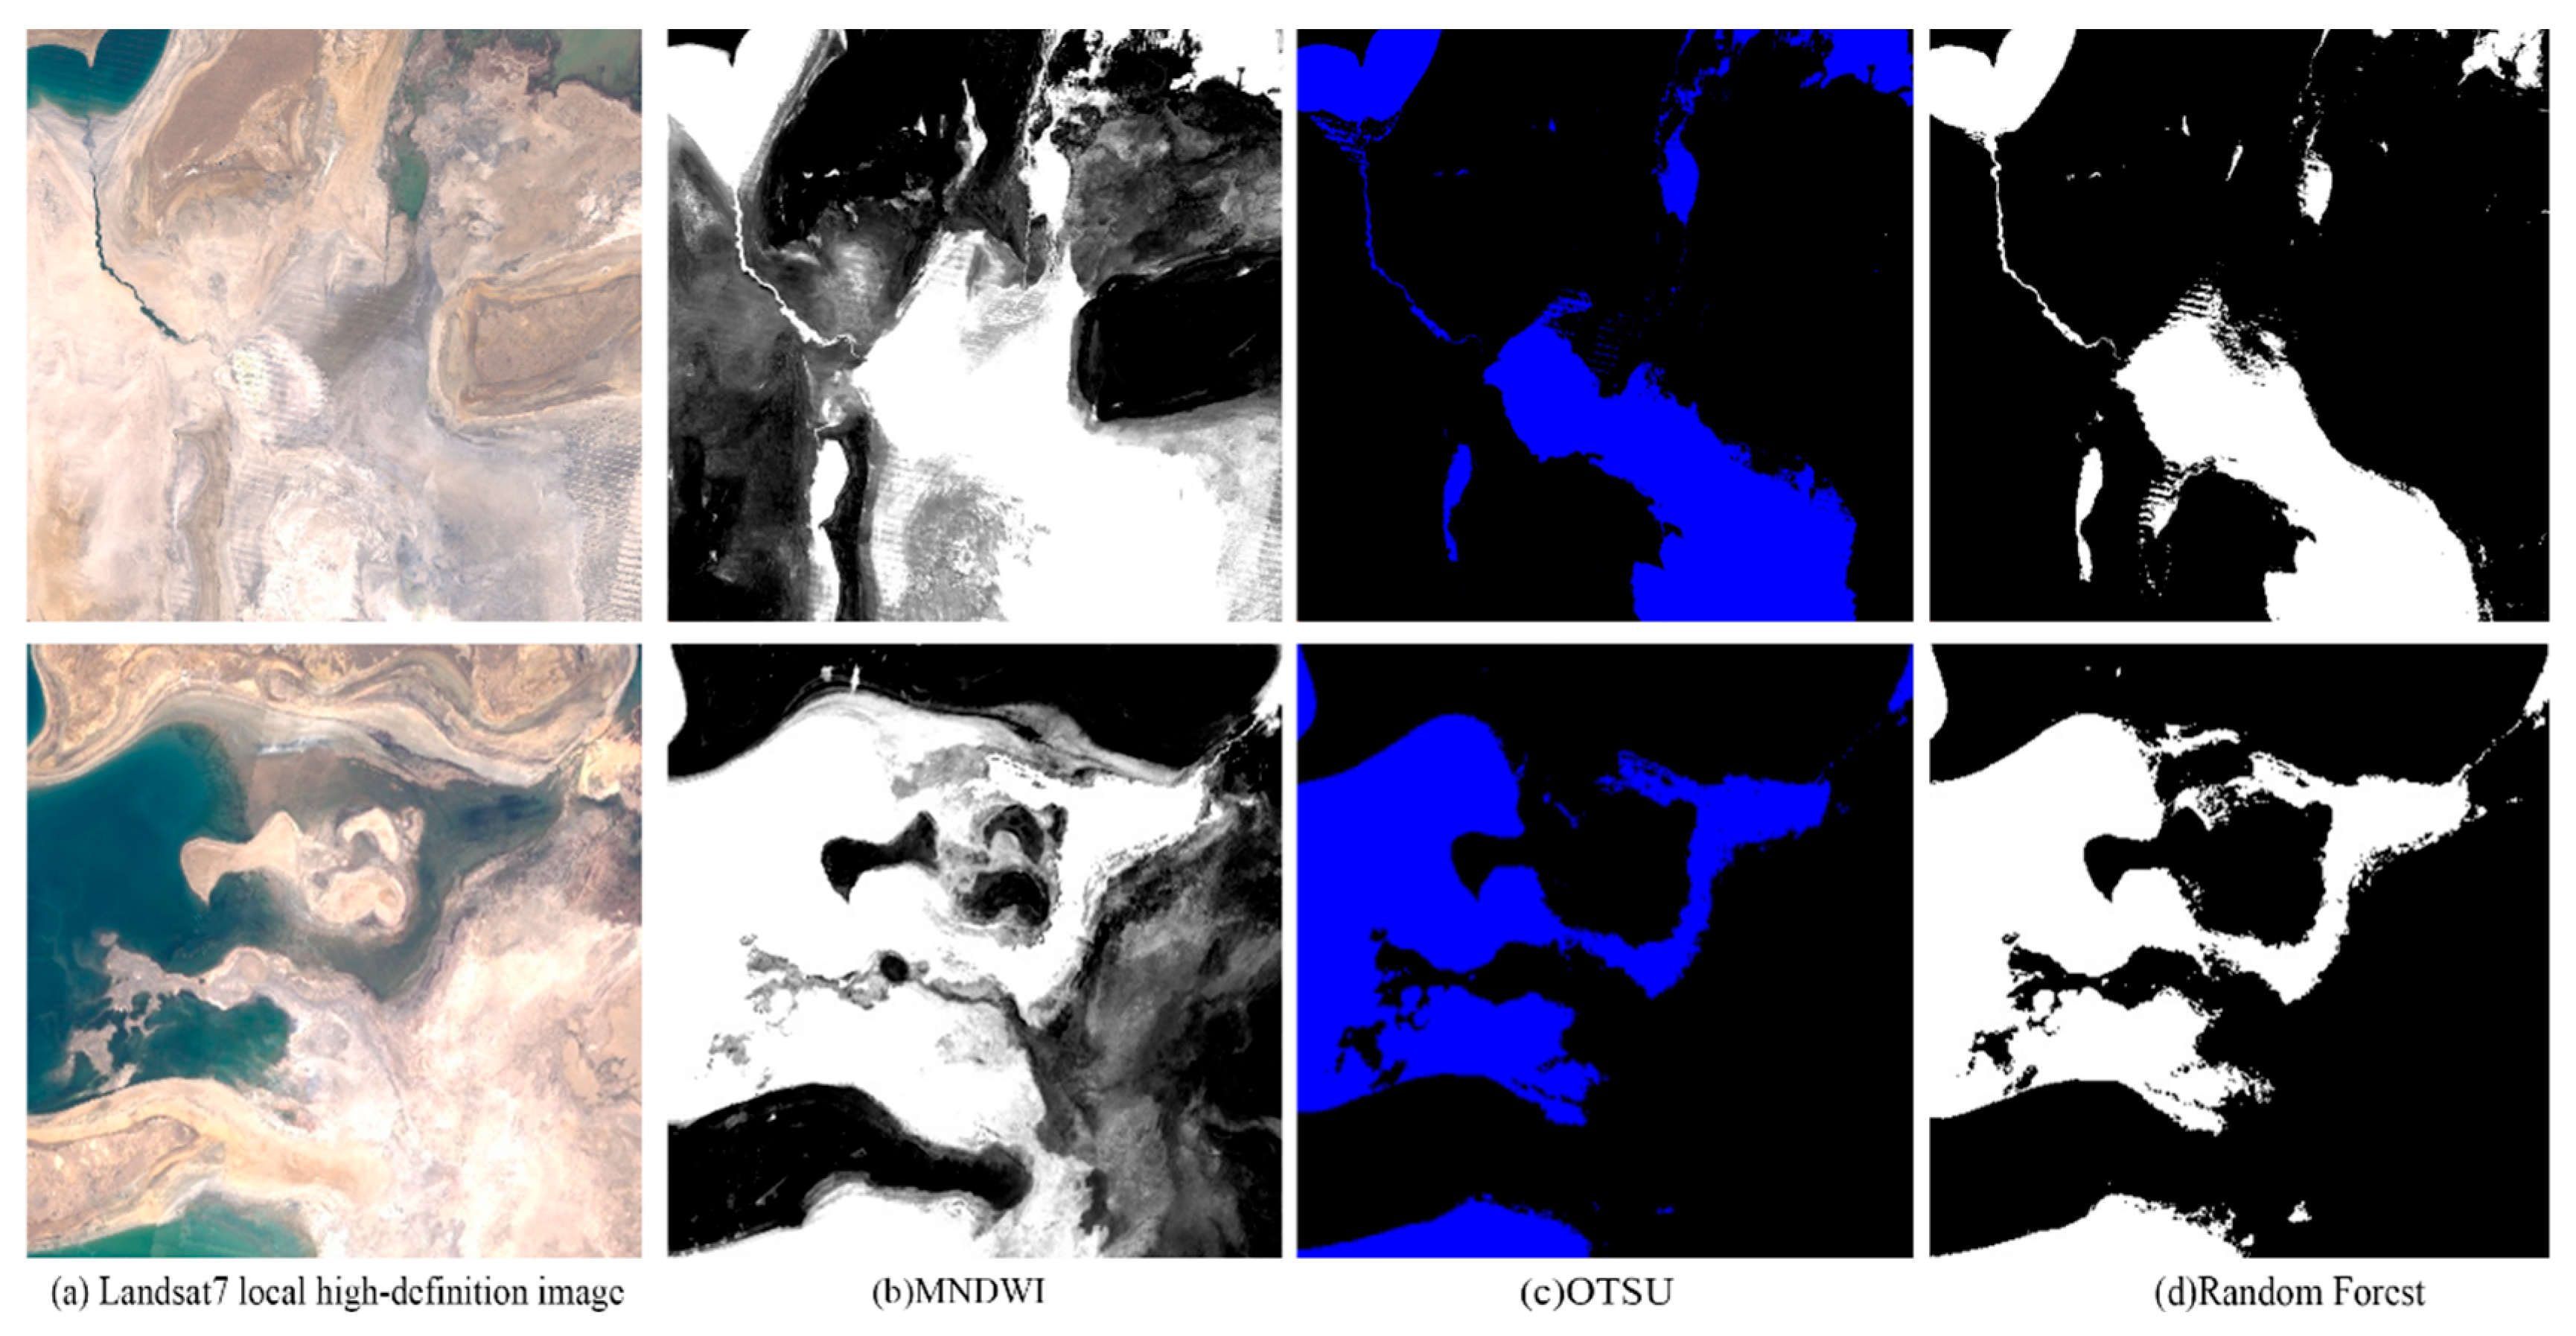
3.1.1. Algorithm Extraction Effect

The study selected water body classification maps using the Modified Normalized Difference Water Index method (MNDWI), The maximum inter-class variance algorithm (OTSU algorithm) and random forest algorithm were used for data from 2000 to 2019, and the results are shown in Figure 3, Figure 4 and Figure 5.
Based on the analysis of the three images, the following conclusions can be drawn:
The MNDWI method demonstrates strong continuity in water body extraction, particularly for large lakes and major river regions, where water boundaries are clearly delineated. However, this method is prone to misclassification in areas such as salt marshes or salt layers, where non-water areas may be incorrectly identified as water bodies. Furthermore, the algorithm’s capacity to detect small water bodies is limited, resulting in omissions in certain cases.
The OTSU algorithm achieves relatively high accuracy in delineating water body boundaries and effectively distinguishes between water and non-water areas. Nevertheless, in regions with complex spectral characteristics, especially those involving mixed pixels (e.g., salt marshes or shallow waters), this method exhibits notable limitations. These challenges may lead to discontinuous boundaries and occasional misclassifications.
The random forest algorithm leverages multiple spectral band features, significantly enhancing water classification accuracy. It performs particularly well in identifying small and medium-sized water bodies, as evidenced by its ability to capture fine details, such as small tributaries and scattered lakes. Additionally, this algorithm excels in complex terrain settings, such as mountainous regions or areas with diverse surface types, demonstrating broad applicability. Although its performance may be influenced by the quality of training data, the random forest algorithm surpasses both the MNDWI and OTSUs overall, owing to its robust classification capabilities and superior detail resolution.

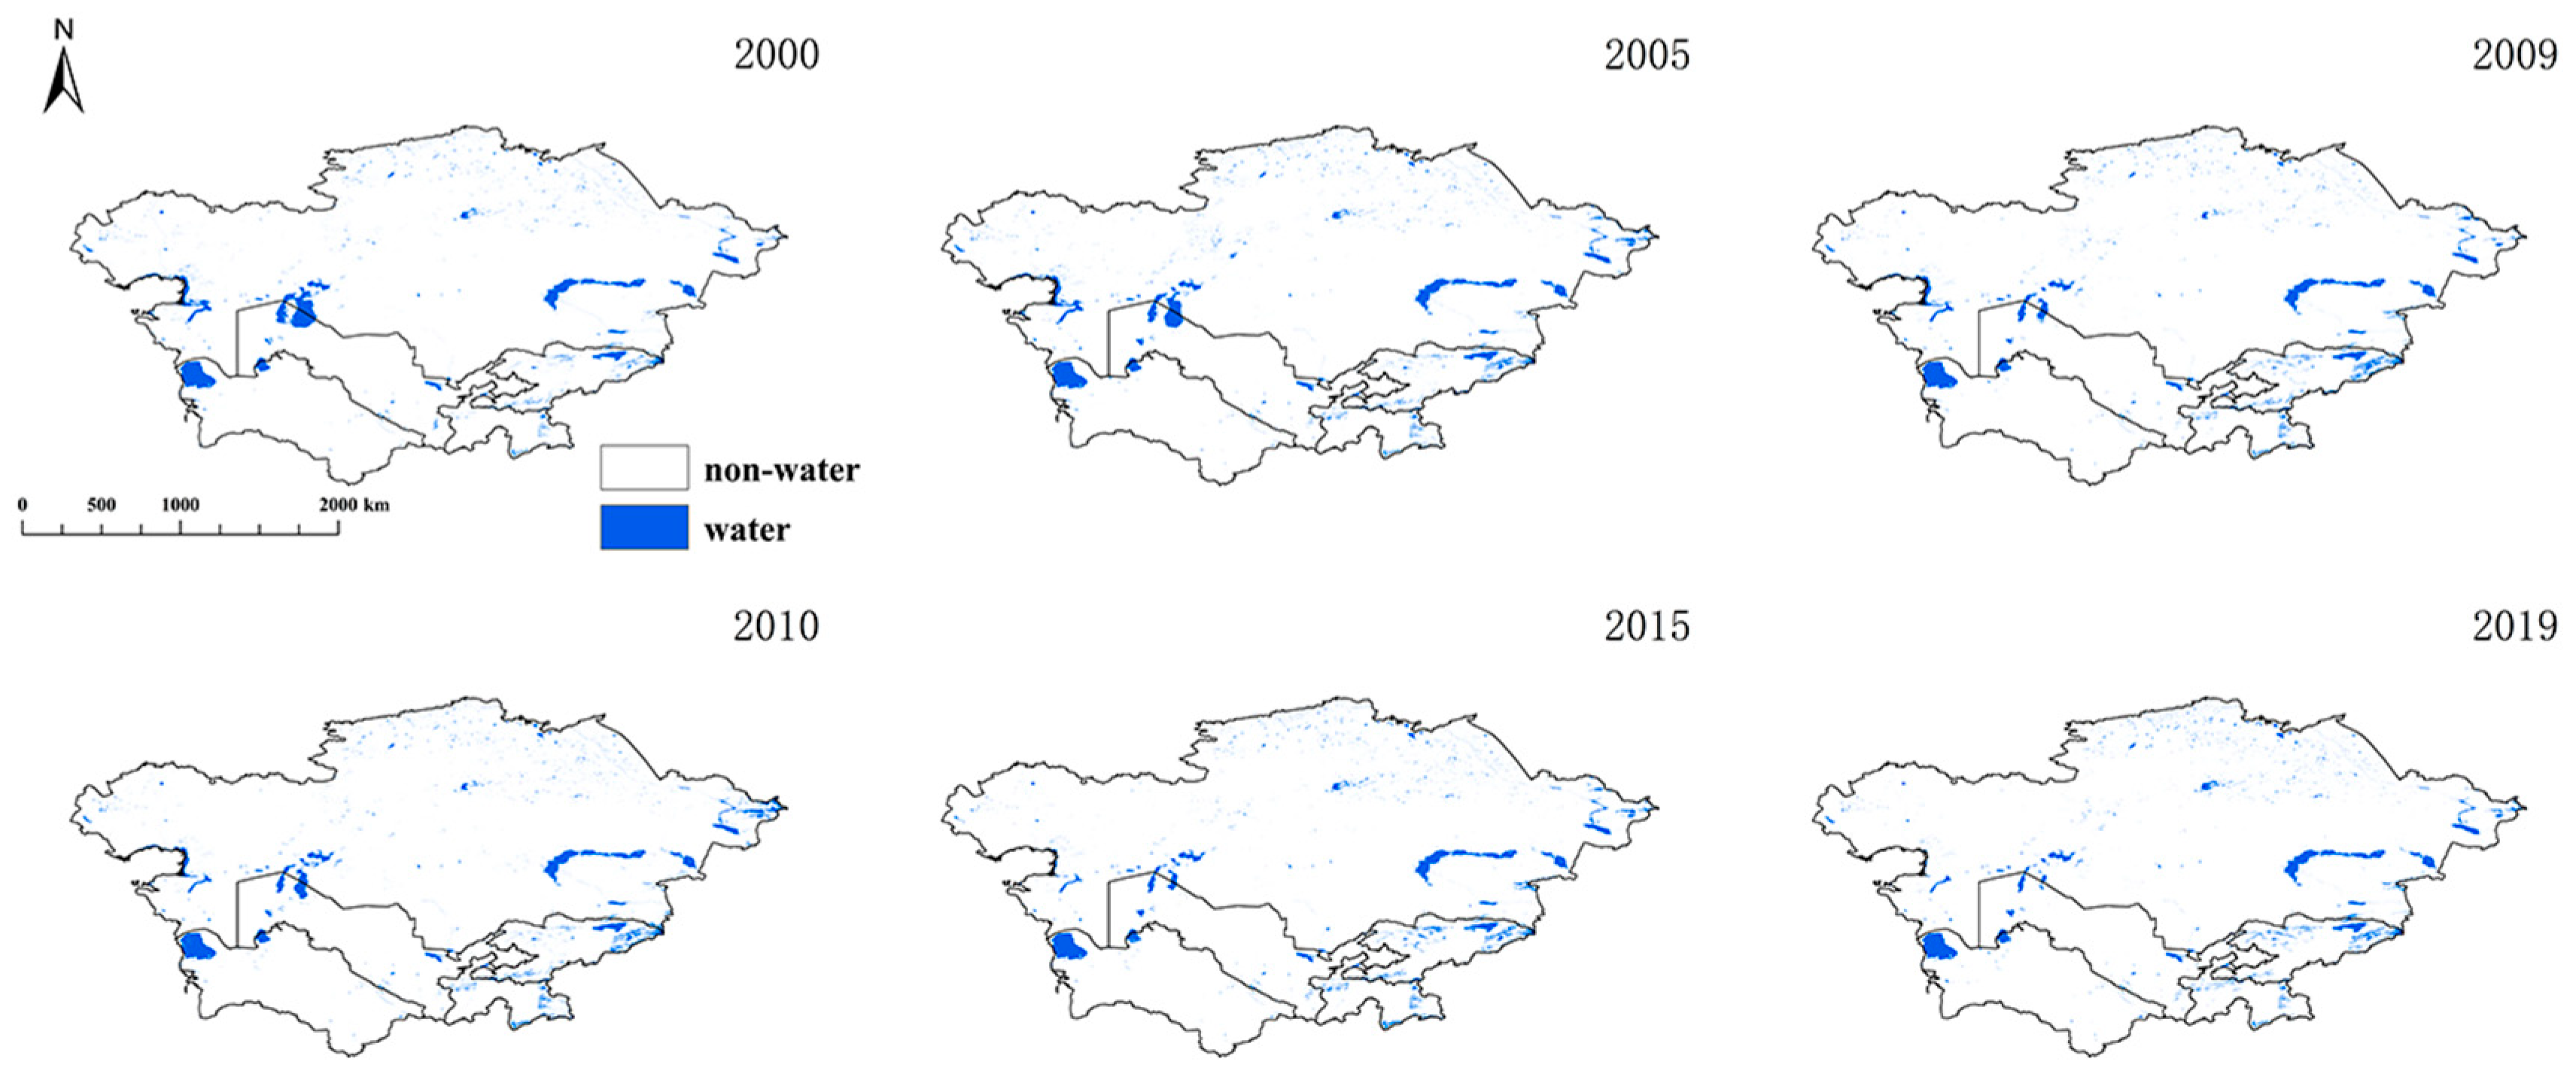
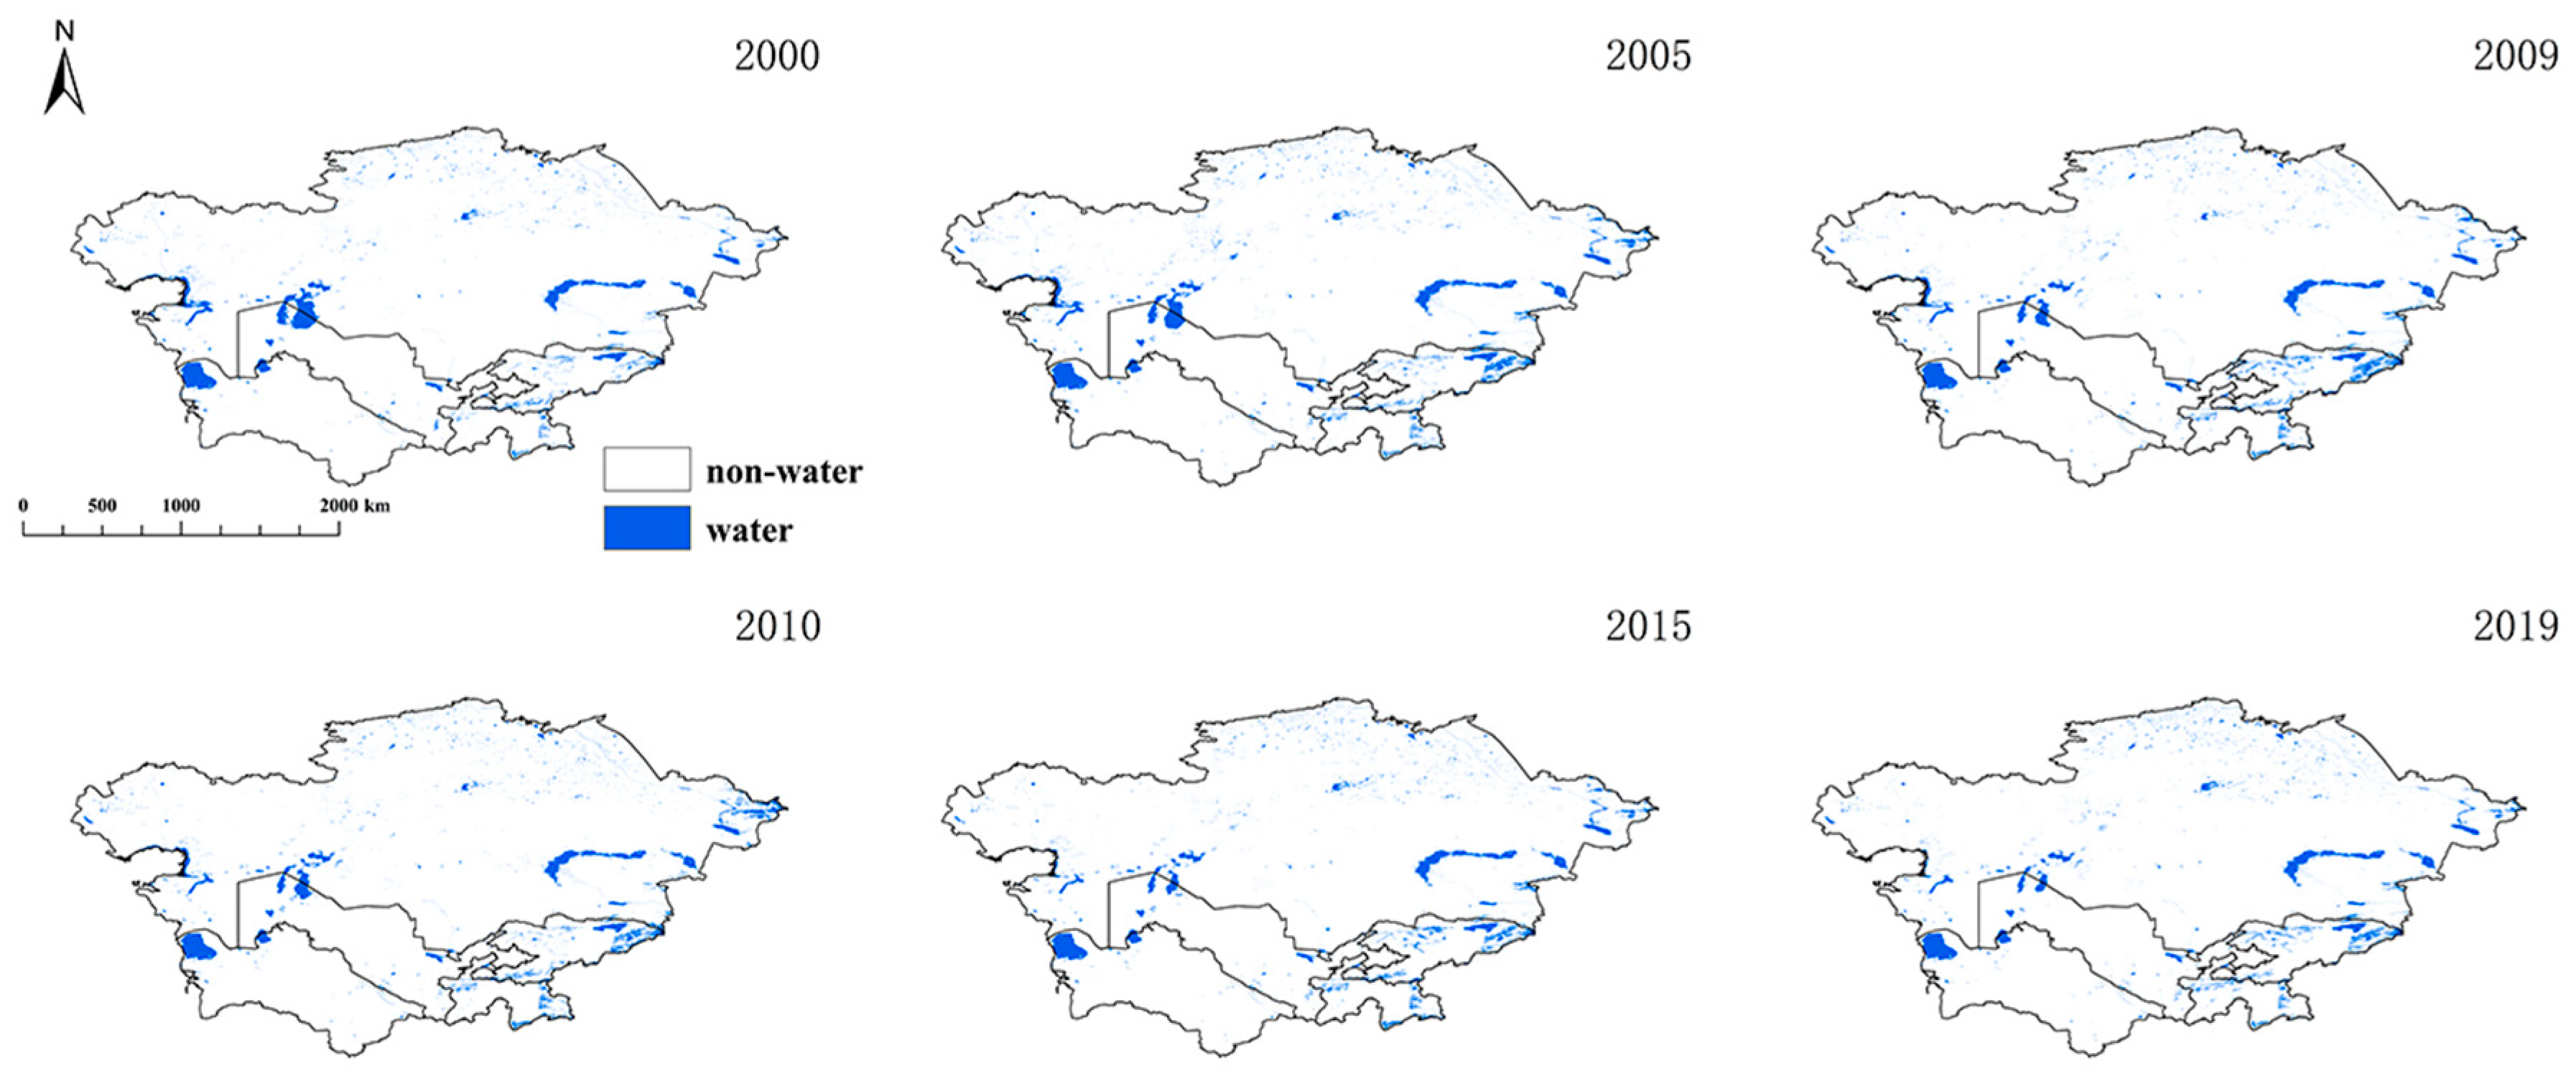
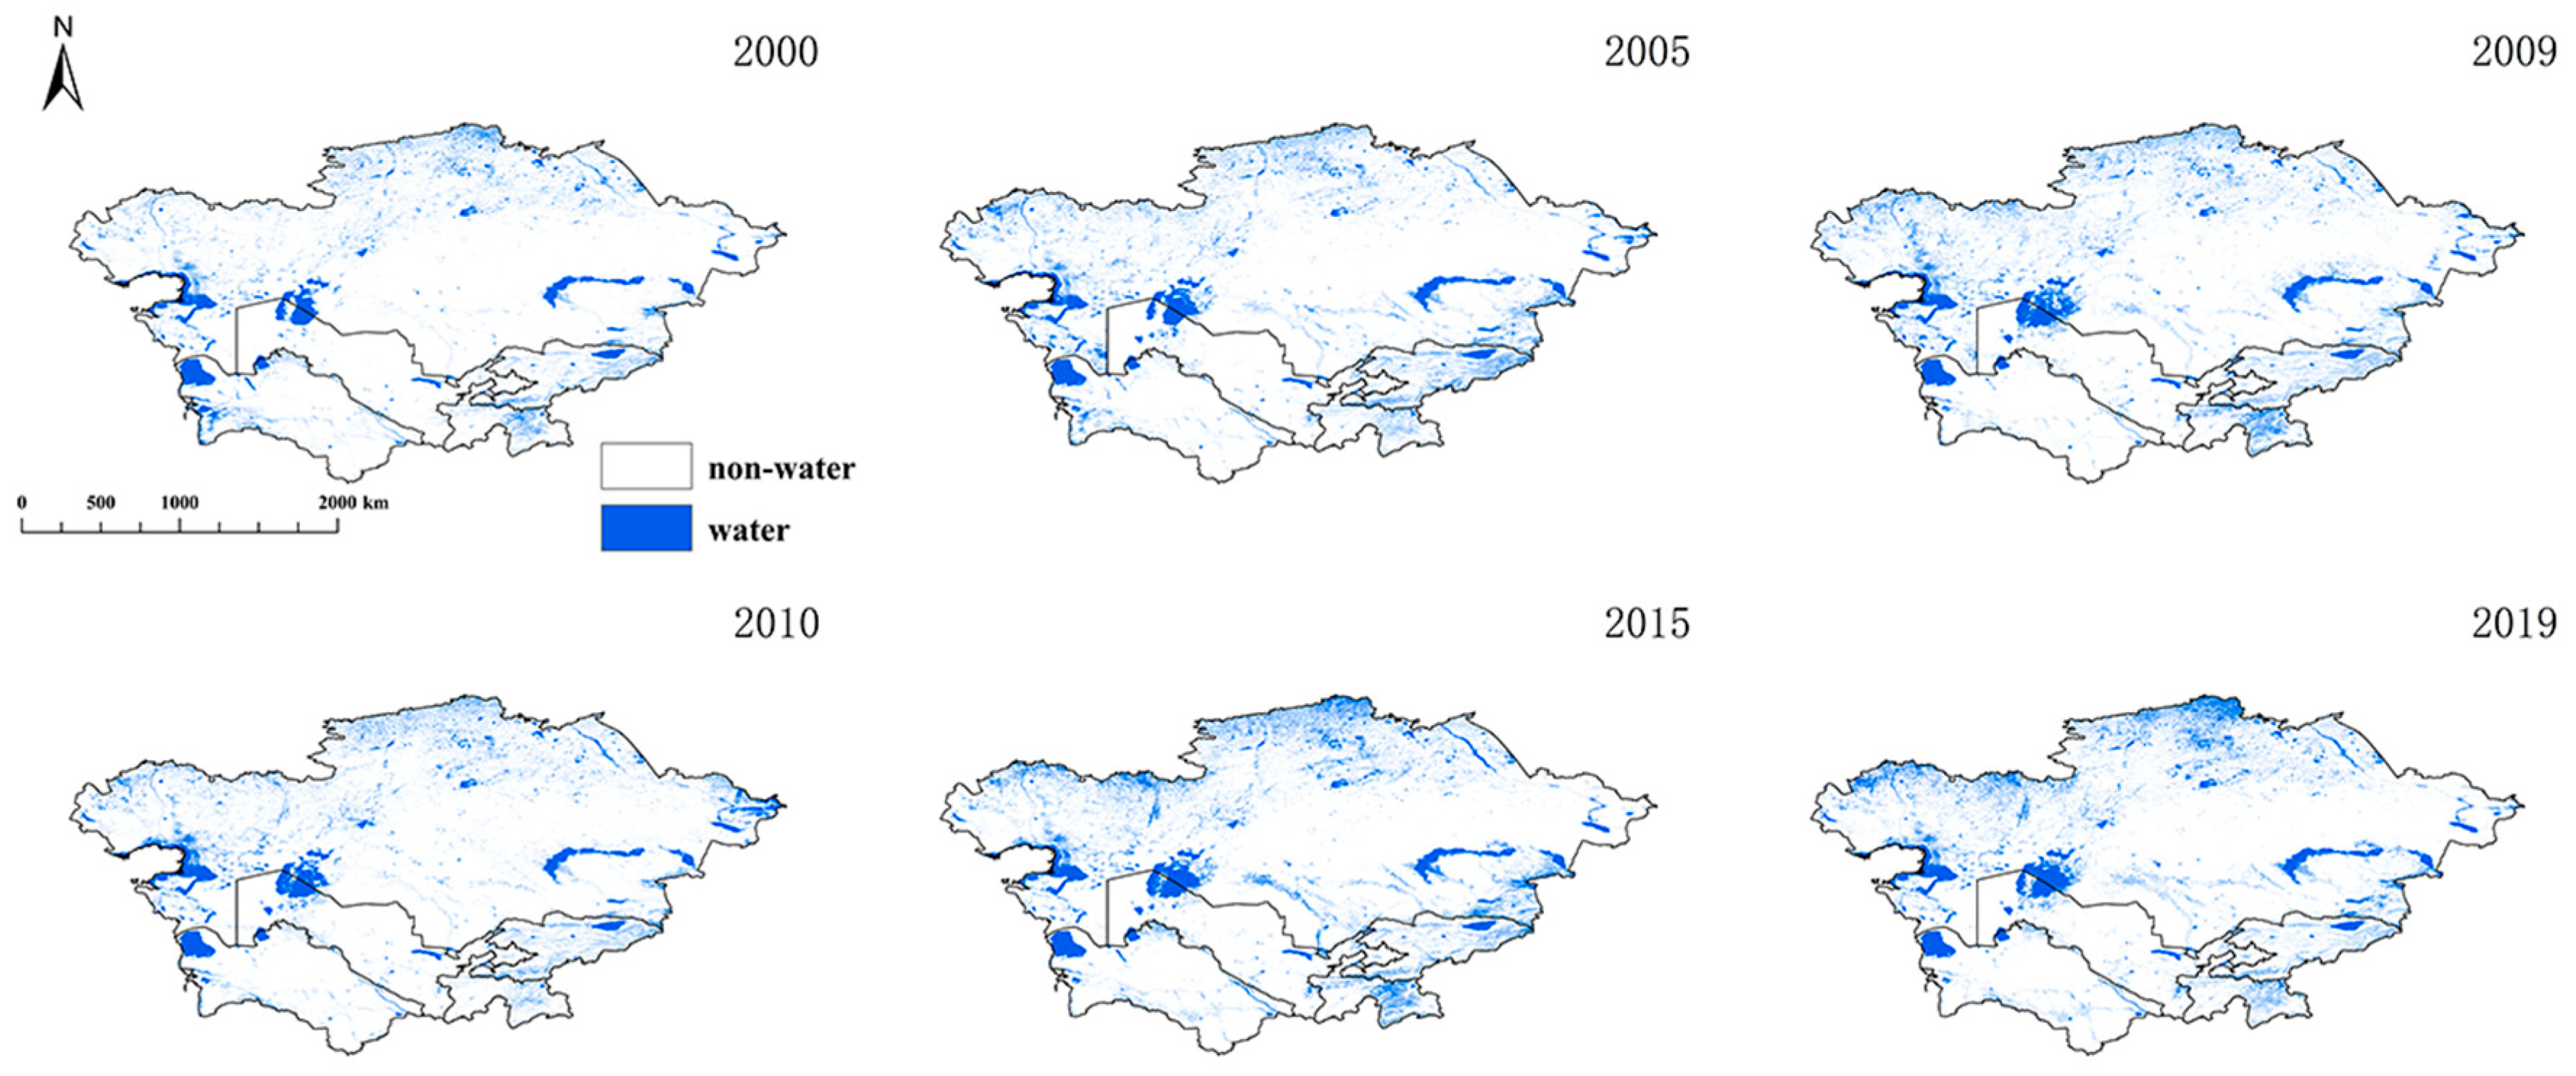
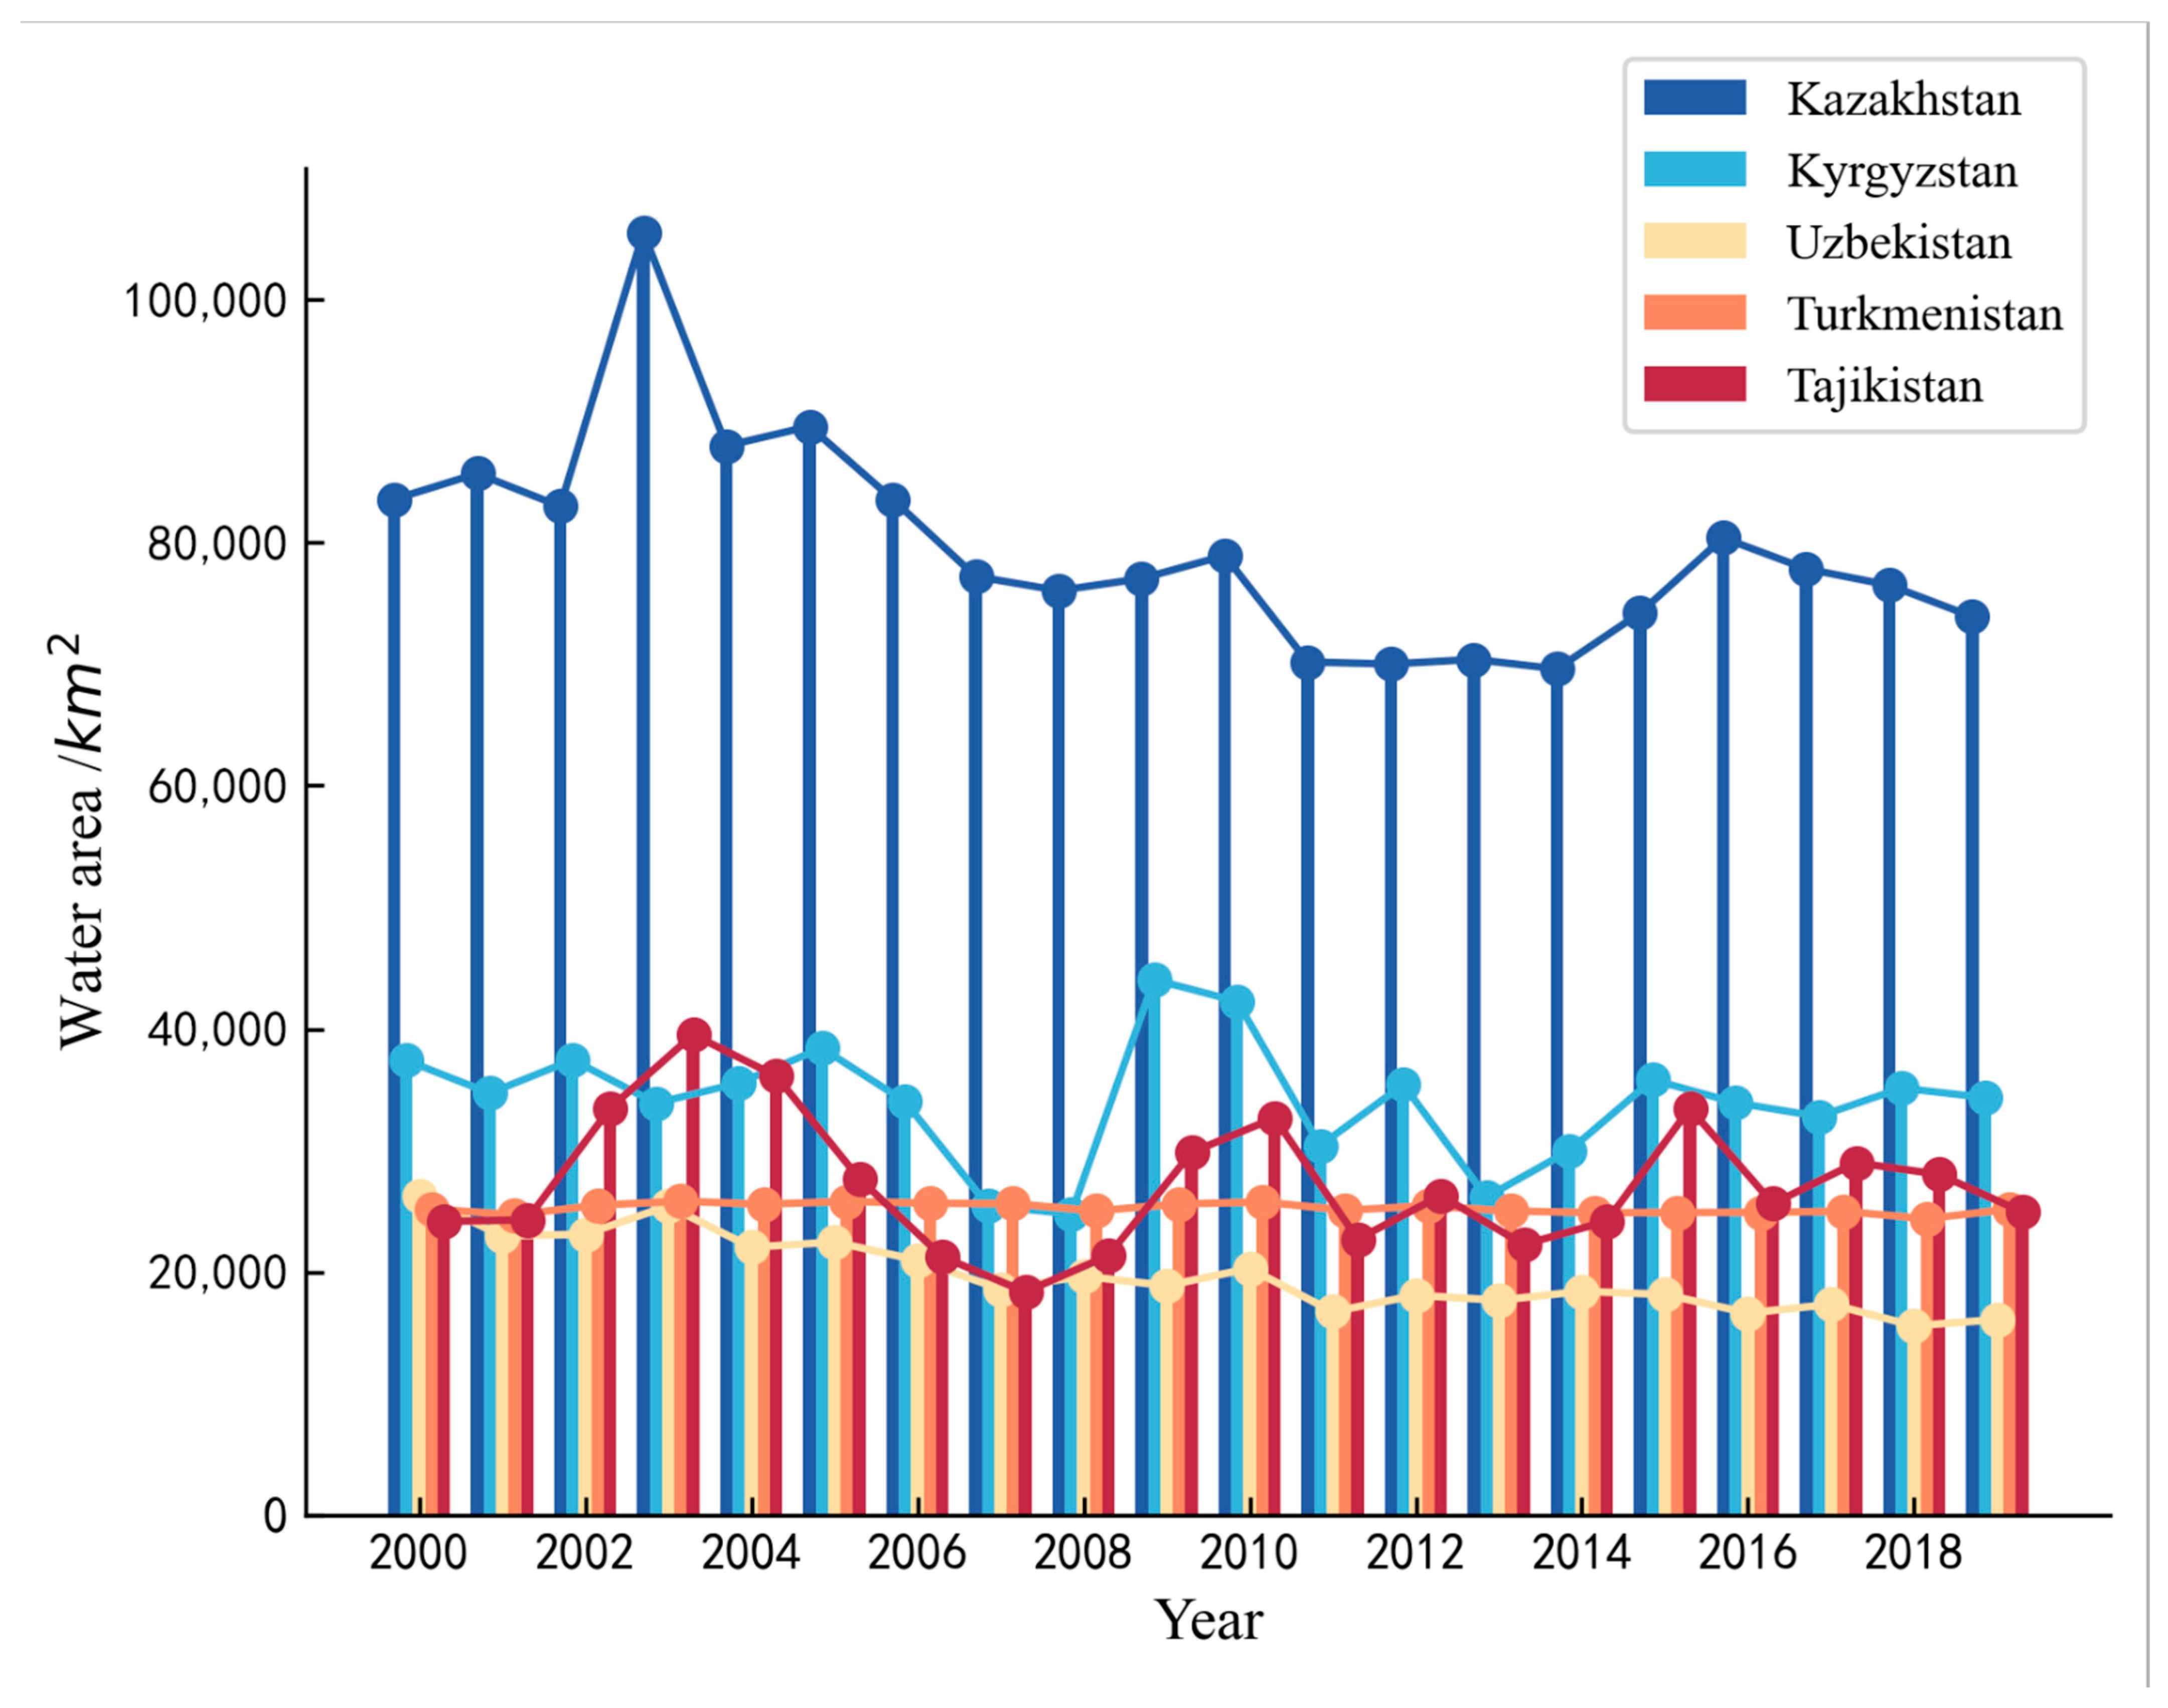
3.1.2. Water Bodies in Central Asian Countries Change Year by Year

Figure 6 shows the year-to-year tendency of the water body area in the five Central Asian countries from 2000 to 2019. In Kazakhstan, Kyrgyzstan, and Tajikistan, owing to the effect of climate, altitude, and other influences, changes in water resources will be with the seasonal precipitation, glacier ice, and snowmelt and temperature changes with a greater impact, so the fluctuation in the area of the water bodies of these three countries change more obviously. Turkmenistan and Uzbekistan are mostly located in desert areas, with high temperatures and little rainfall throughout the year and a single structure of water replenishment, so the change in the area of their water bodies is smaller, but the overall trend is gradually decreasing.
Based on the extraction results from the random forest algorithm, we determined the area of water bodies in Central Asia over a 20-year period (2000–2019). For instance, the areas covered by water bodies in 2000, 2005, 2009, 2010, 2015, and 2019 were 196,590.76 km2, 203,962.44 km2, 195,420.16 km2, 199,943.31 km2, 186,547.7 km2, and 174,476.67 km2, respectively. As shown in Figure 6, the data indicate a gradual decrease in the overall area of water bodies in Central Asia from 2000 to 2019. In 2000, the average annual area of water bodies was 196,590.76 km2, whereas in 2019 it had decreased to 174,476.67 km2, reflecting a reduction of 11.25%. Throughout this period, while the overall trend showed a decline in the area of water bodies across Central Asia, there were slight recoveries observed in certain years, such as in 2002, 2003, 2009, 2010, 2012, 2015, and 2017, which increased by 10,170.02 km2, 17,709.72 km2, 28,562.54 km2, 4523.15 km2, 10,158.01 km2, 19,494.67 km2, 490.71 km2.

3.2. Analysis of Typical Water Extraction Results

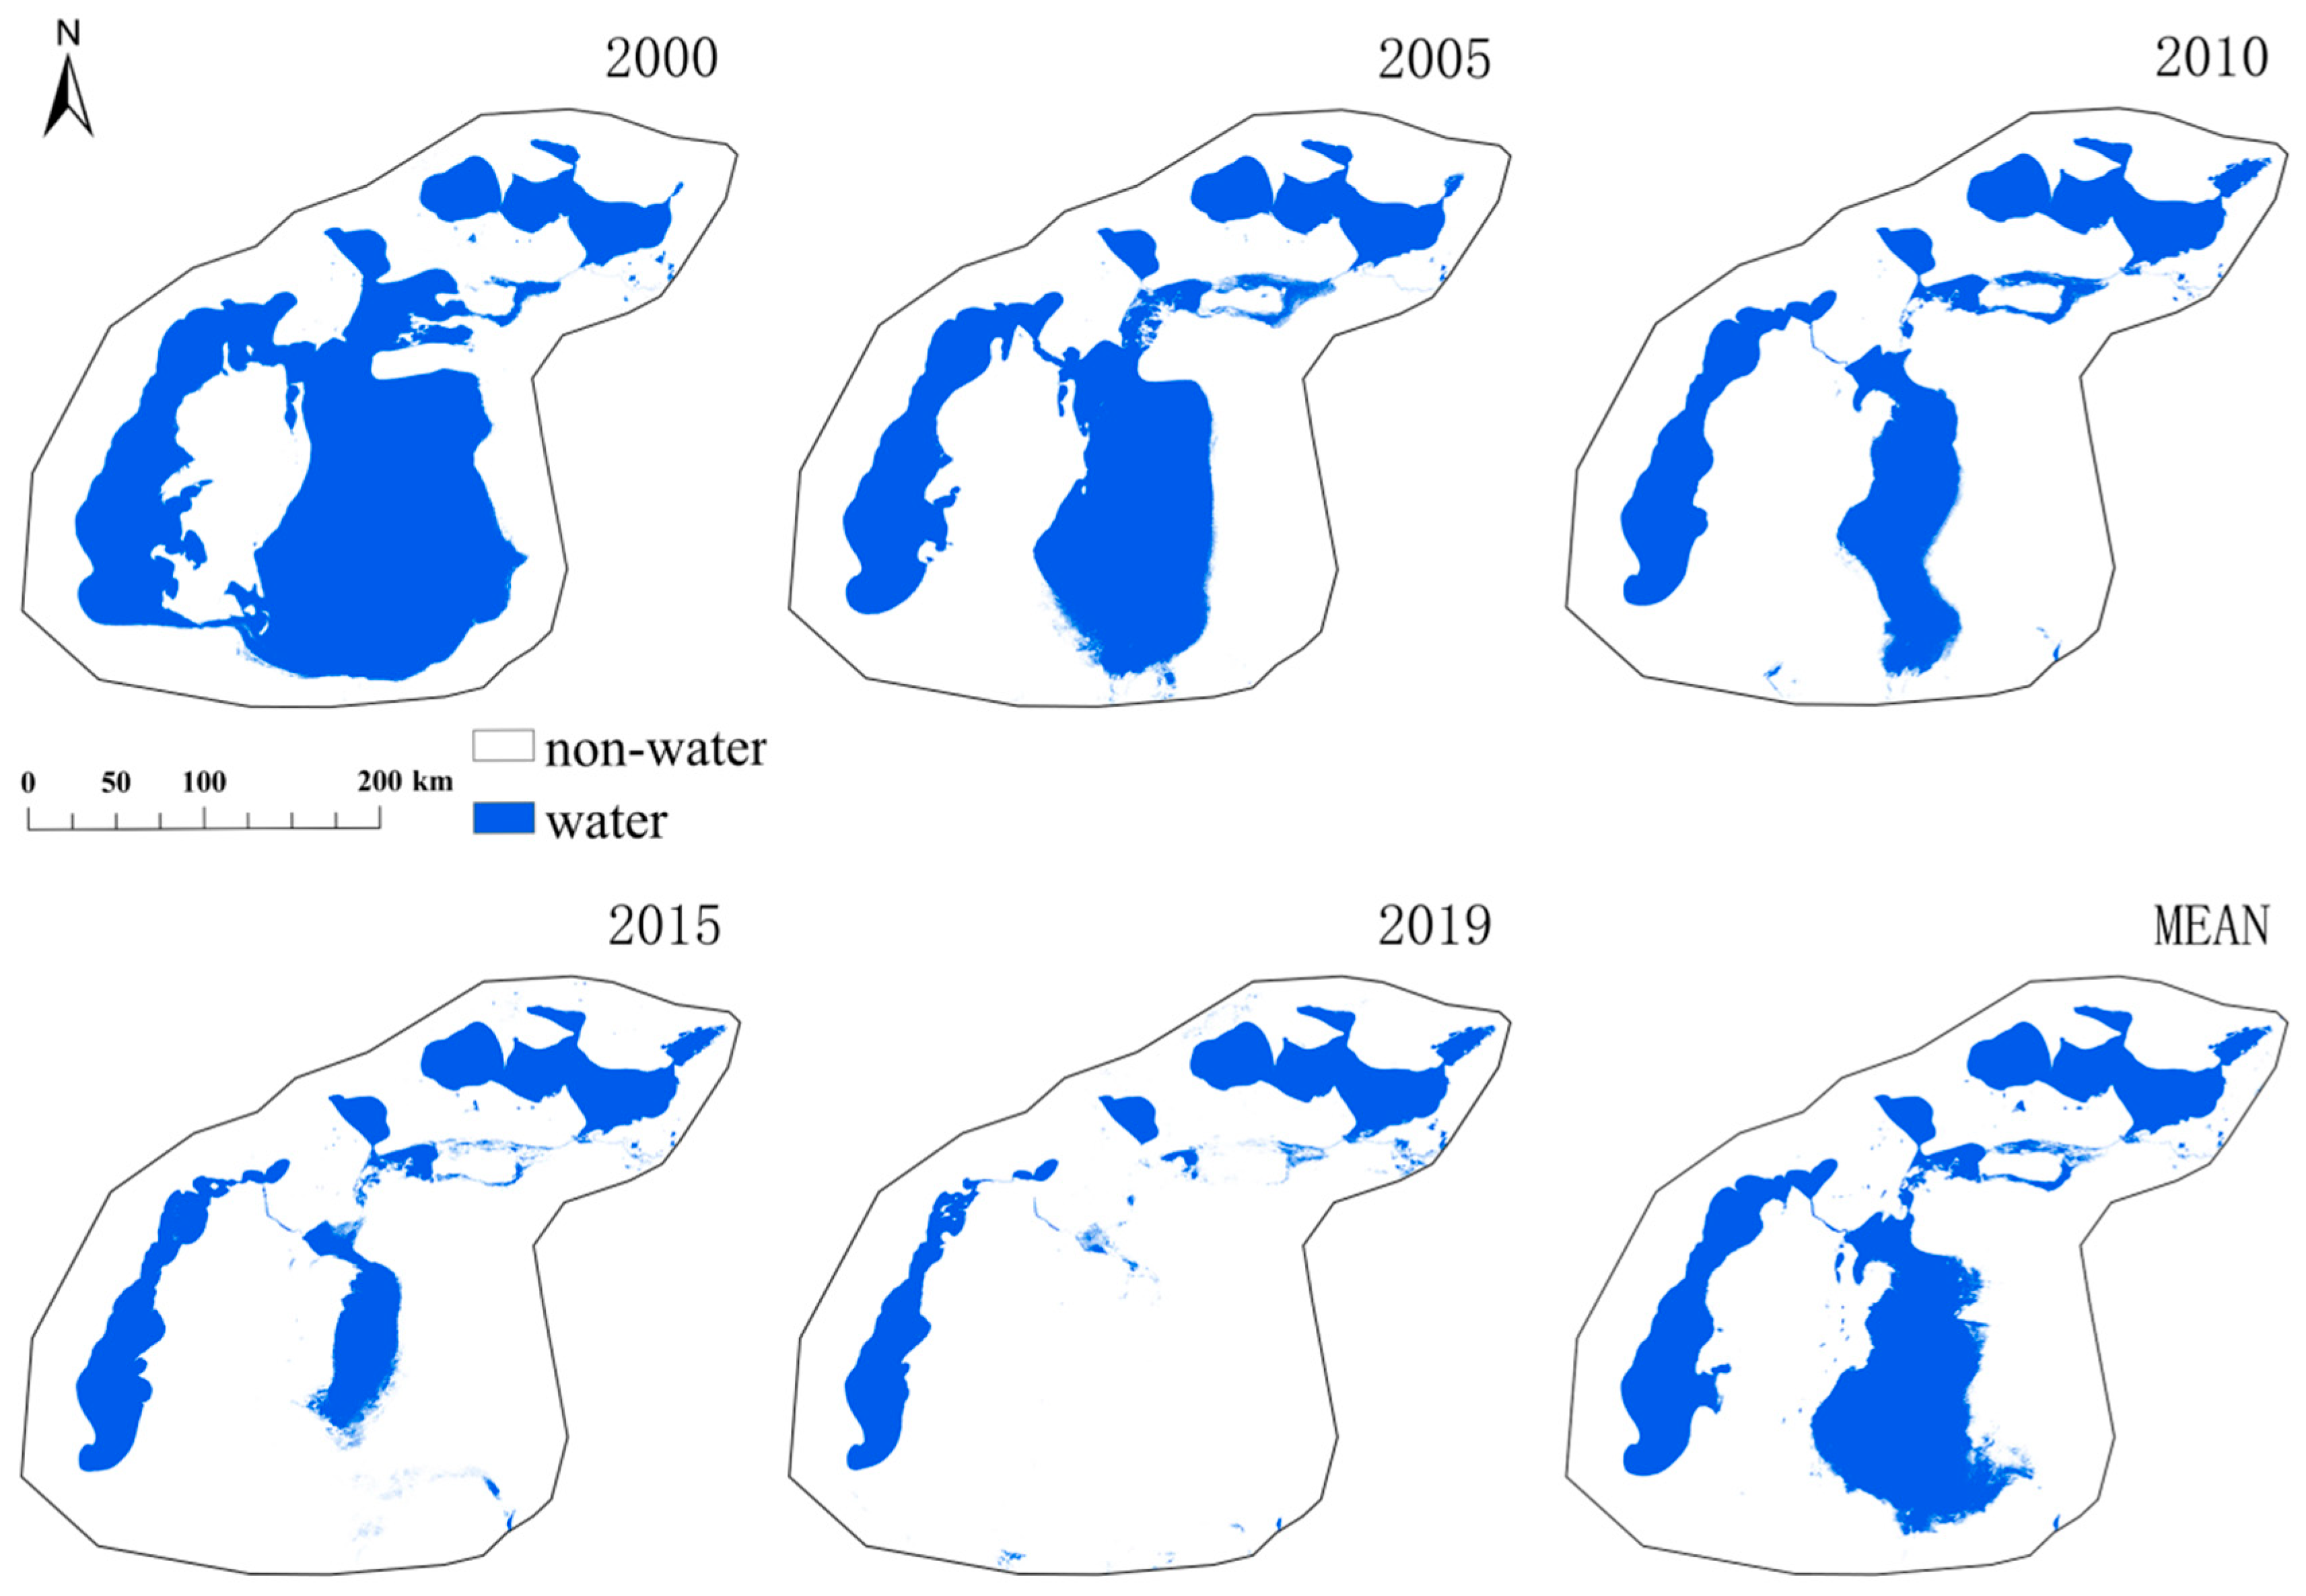
3.2.1. Analysis of the Extraction Results of Water Bodies in the Aral Sea Area

The ecological environment of Central Asia’s arid and semi-arid regions is highly fragile. Studying the changes in inland lakes, particularly in the Aral Sea region, is crucial for understanding how these bodies of water respond to both natural climatic and anthropogenic factors. Such research is essential for assessing their impact on the water cycle, the broader ecological environment, and the living conditions of human populations in the region. Figure 7 shows the distribution map of water bodies in the Aral Sea region extracted using the random forest algorithm, and five years, namely 2000, 2005, 2010, 2015 and 2019, were selected for comparison, so that the year-by-year spatial change of the water bodies can be obtained. In 1986, the Aral Sea was divided into the South Aral Sea and the North Aral Sea, with each following distinctly opposite trajectories thereafter. Since the South Aral Sea accounts for the majority of the Aral Sea’s total area, the trends in its area change from 2000 to 2019 closely mirror those of the entire Aral Sea, as shown in Figure 7 and Figure 8. The South Aral Sea’s water supply has steadily declined due to climatic, anthropogenic, and other factors, leading to its division into two separate bodies of water, the East and West Aral Seas, in 2003. These two parts are connected by a narrow waterway. The overall process of area change in the Aral Sea, as well as in its individual sections, is clearly illustrated in the figures below.
From 2000 to 2019, the overall area of the Aral Sea decreased dramatically, shrinking from 25,722.76 km2 in 2000 to 7168.6832 km2 in 2019, with the water body shrinking by 72.13%, and the annual rate of decrease in the area being 927.7038 km2/y. Changes in the Aral Sea’s area have primarily been observed in the South Aral Sea, while the area of the North Aral Sea has remained relatively stable.
As shown in Figure 8 and Table 1, the area of the North Aral Sea has steadily increased, growing from 2888.48 km2 in 2000 to 3425.62 km2 in 2019, reflecting an 18.6% rise, with an annual growth rate of 26.86 km2/year. In contrast, the South Aral Sea has experienced significant shrinkage, with its area decreasing from 22,843.78 km2 in 2000 to 3425.62 km2 in 2019, marking an 83.62% reduction and an annual decrease of 970.91 km2/year.
The primary change in the South Aral Sea’s water body area is concentrated in the East Aral Sea, which was separated into the East and West Aral Seas in 2003 following the connection of Easter Island to the mainland. The reduction in the East Aral Sea’s water body area has been dramatic, decreasing from 12,459.56 km2 in 2003 to 1069.87 km2 in 2019, representing a 93.3% decrease, with an annual reduction rate of 669.98 km2/year. This significant loss has led to the near-total disappearance of the East Aral Sea, leaving only residual waters in the northern part, which is expected to vanish completely within one to two years.

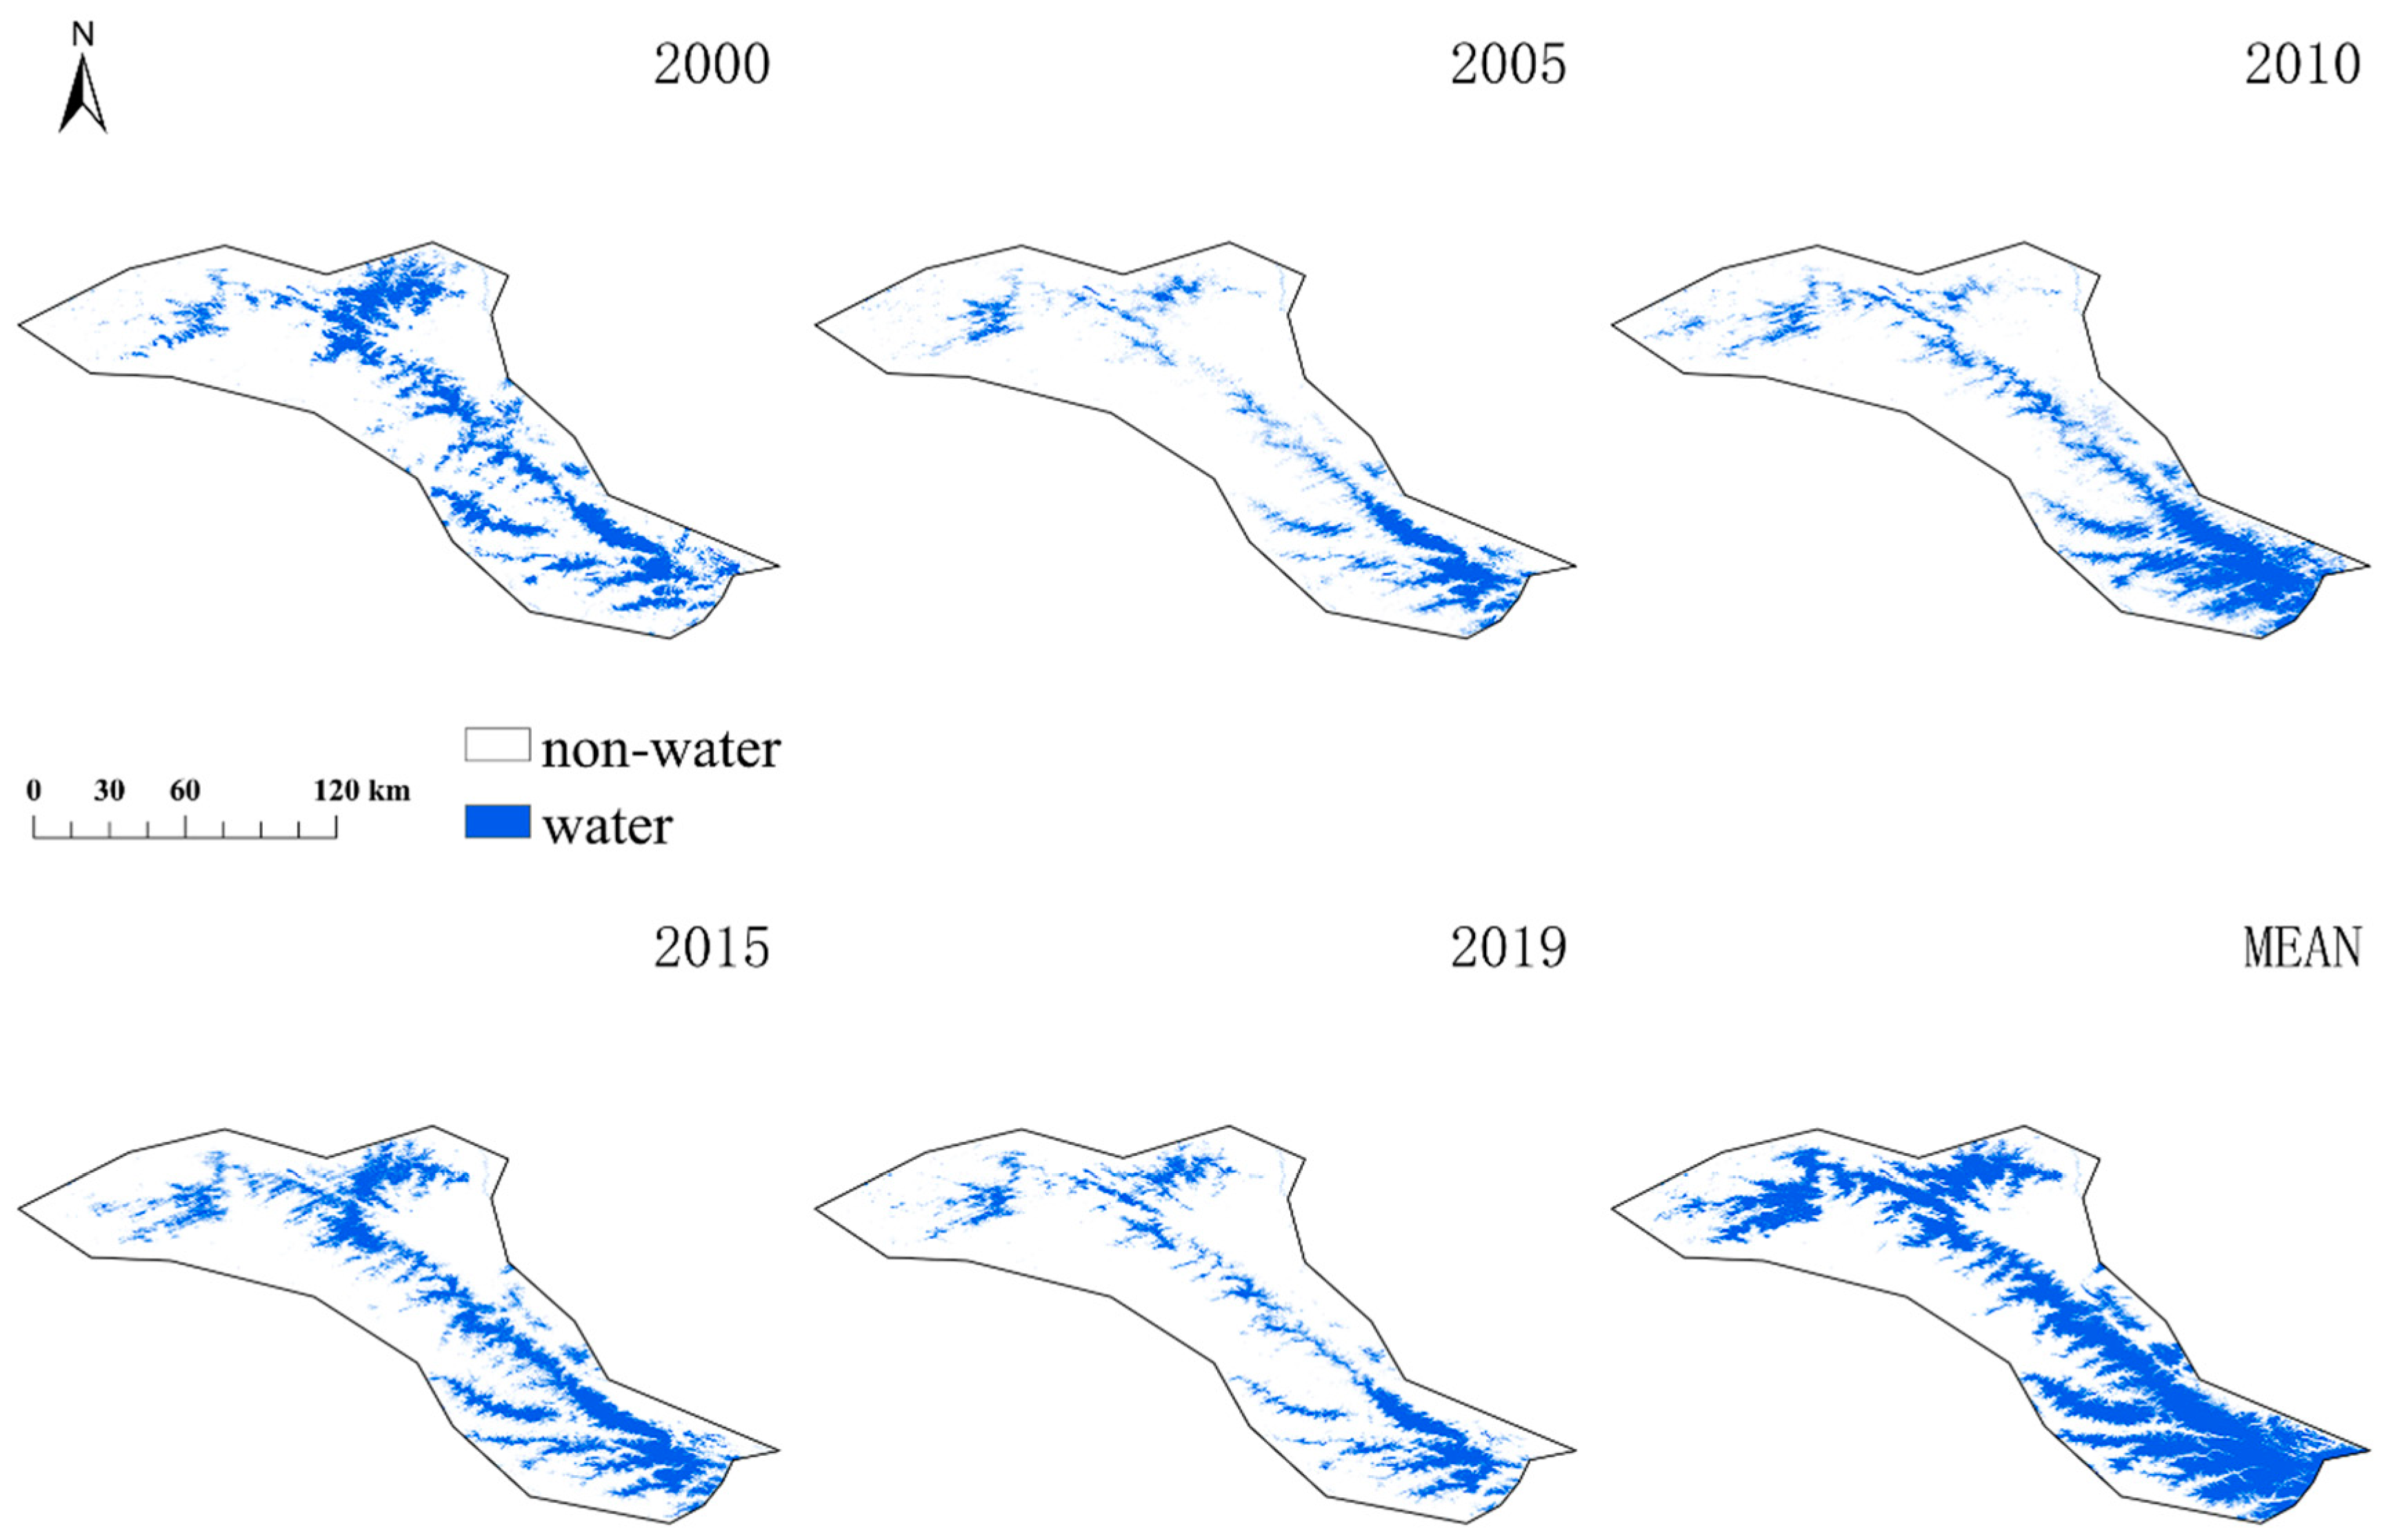
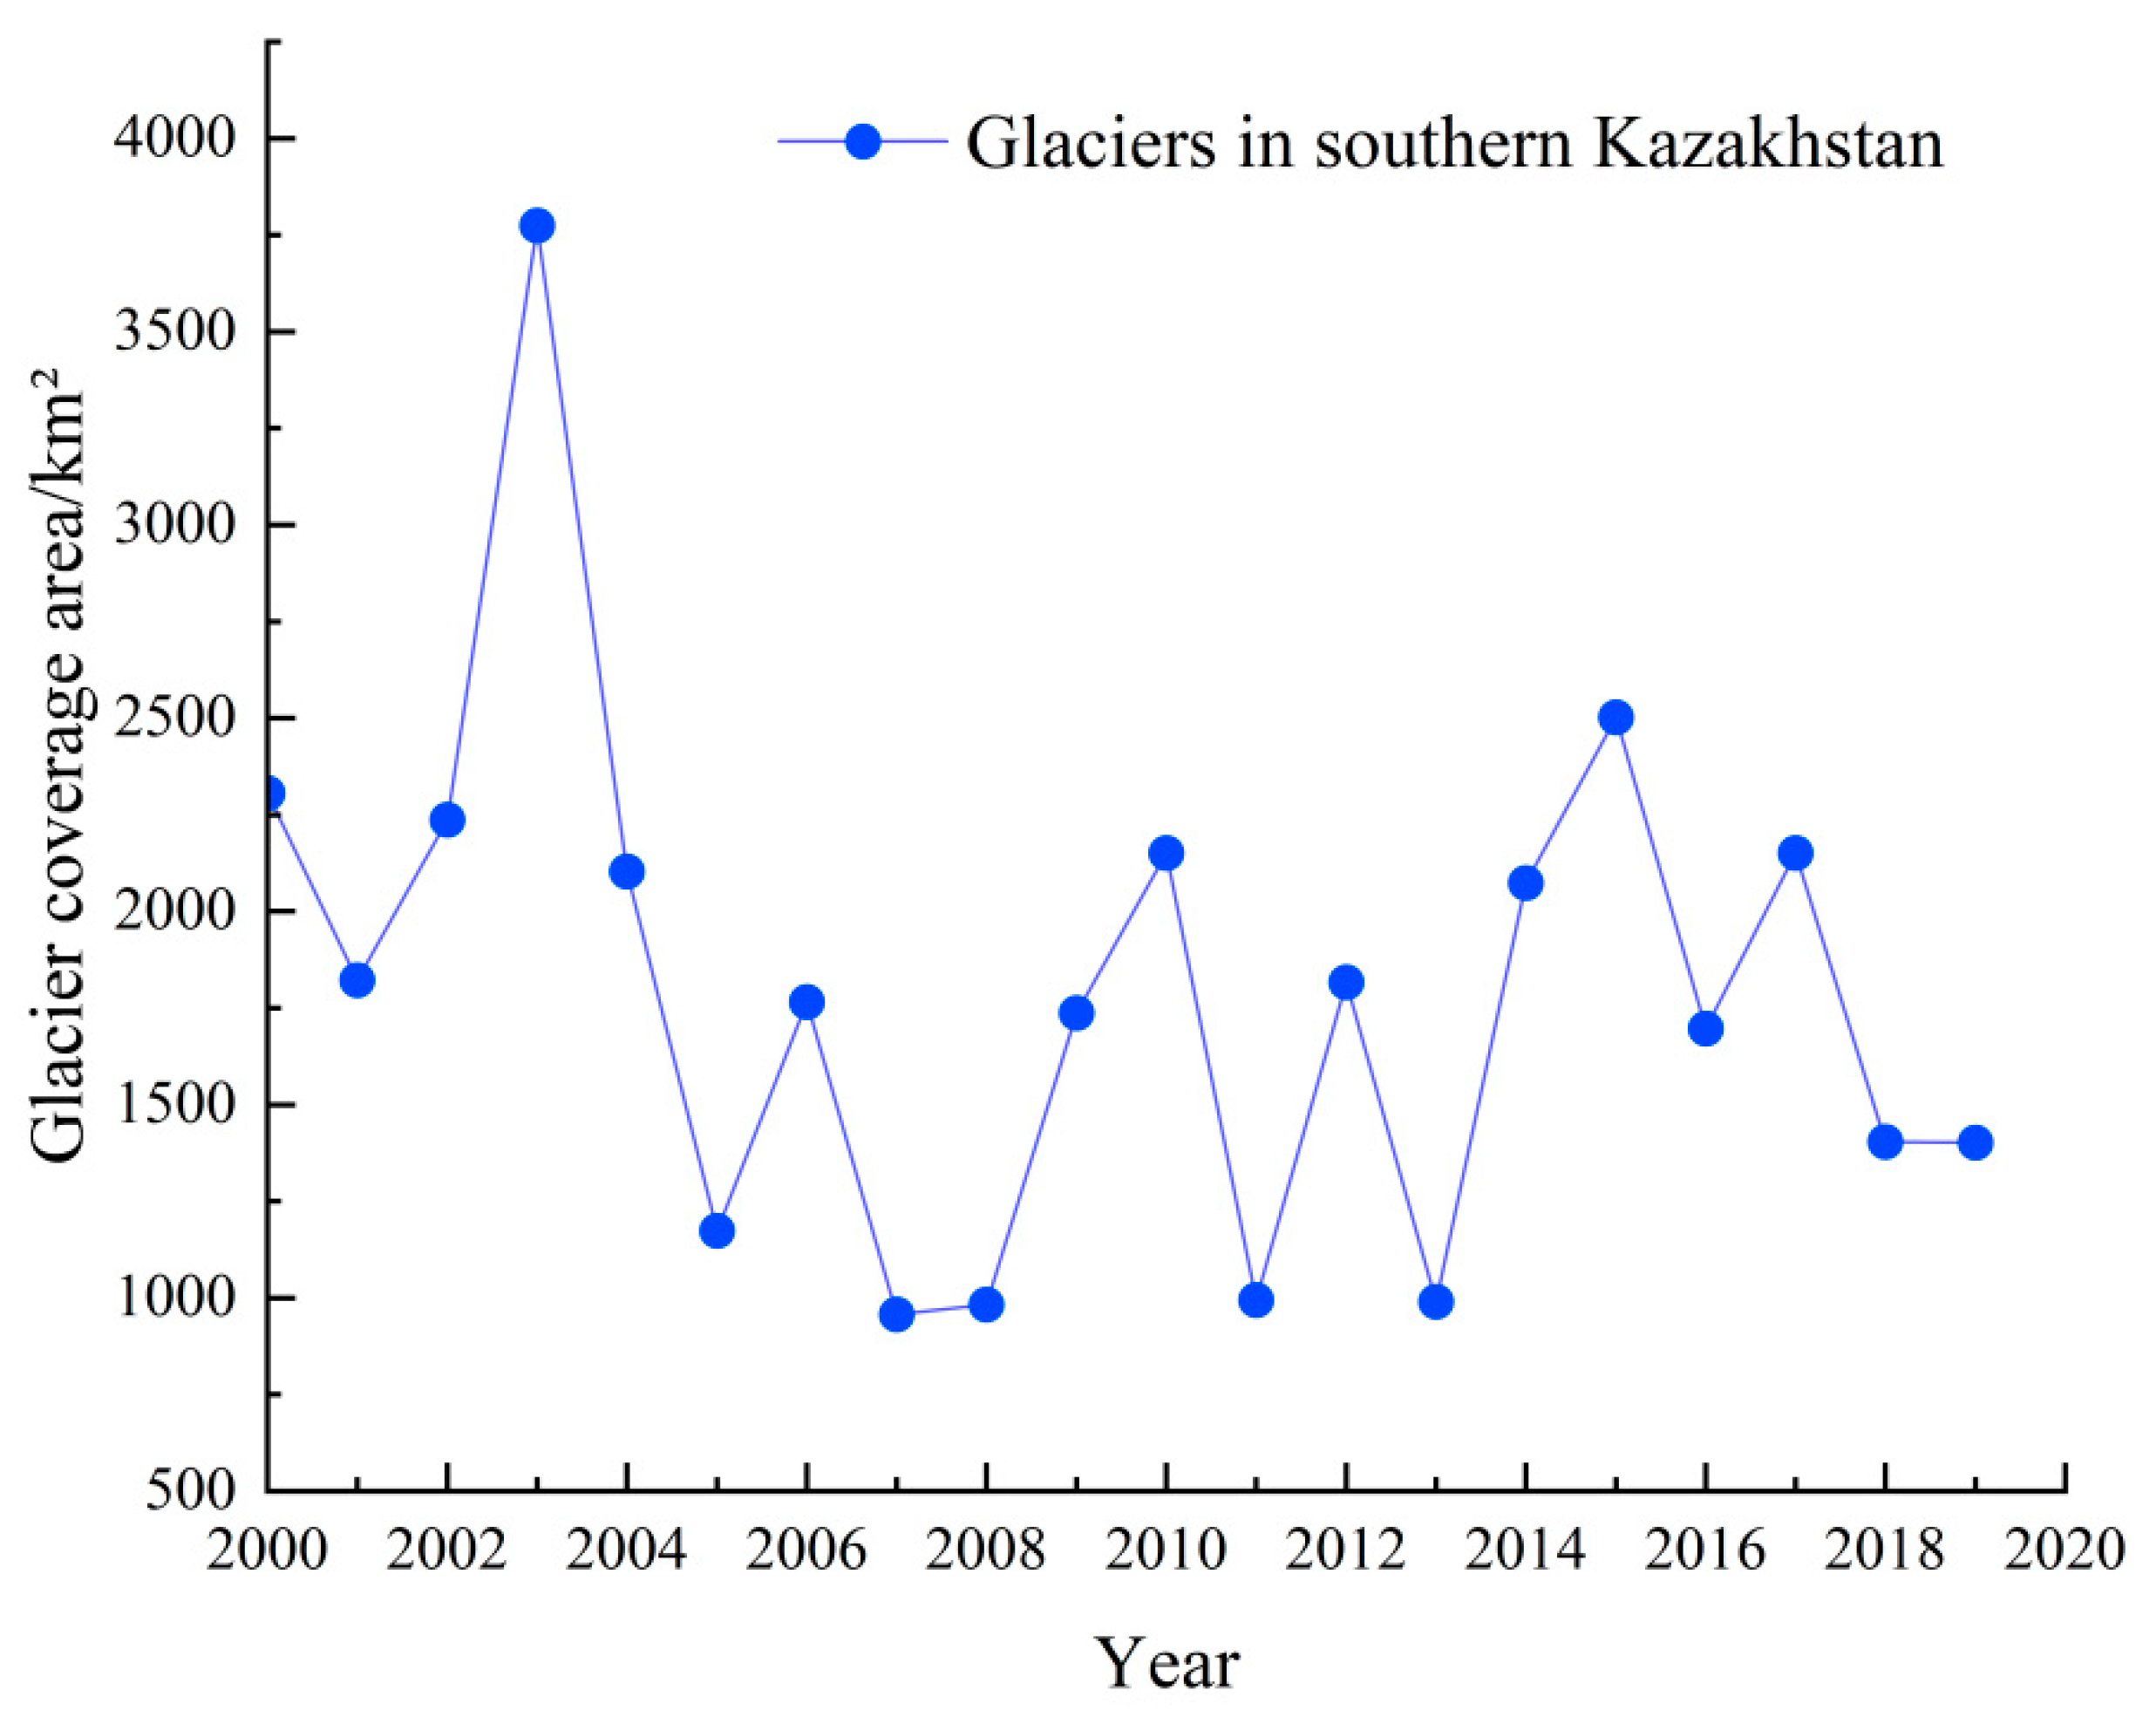
3.2.2. Analysis of the Results of Glacier Extraction in Southern Kyrgyzstan

Glaciers, as a crucial component of water resources in Central Asia, are also highly sensitive indicators of climate change. Changes in glaciers directly reflect regional climatic shifts, with variations in accumulation and ablation influencing factors such as the snow line and glacier elevation. By analyzing these glacier changes, we can gain insights into the characteristics and trends of climate change. Consequently, studying glacier area variations has become a significant method for assessing changes in water resources in Central Asia. The majority of glaciers in the region are concentrated in the Tien Shan mountain range, which is primarily located in the southeastern parts of Kyrgyzstan and Tajikistan. This study focuses on the glaciers in the southern part of Kyrgyzstan (referred to as the “southern glaciers”) and examines the changes in glacier area from 2000 to 2019. The Figure 9 shows the interannual changes of glaciers in southern Kyrgyzstan.
The degradation of glaciers in Central Asia has attracted significant attention. Studies show that since the 1970s, the total area of glaciers in the Tien Shan Mountains has decreased by 8.5%. This glacier retreat has profoundly affected the region’s hydrological characteristics, water resources, ecological environment, and socio-economic development. Simultaneously, one-fifth of the glaciers in Central Asia have disappeared over the past half-century, and glacier retreat is accelerating, which is extremely unfavorable to the sustainable development of the water cycle [17].
It was found that the area covered by the southern glacier was 2306.1628 km2 in 2000, and the area of the glacier has been changing continuously in 20 years, in which it reached 3774.9288 km2 in 2003, which is the maximum value of the extracted area, but the area covered by the glacier was reduced to 957.8246 km2 in 2007, which is the minimum value of the extracted area, and the area covered by the glacier is still decreasing. But the glacier coverage area tends to decrease in general. By 2019, the area covered by glaciers has been reduced to 1401.5996 km2, which is 39.23% smaller than that of 2000. The Figure 10 shows the changes in glacier cover.
In summary, the analysis of the water area in the Aral Sea region and the changes in glacier coverage in southern Kyrgyzstan provide valuable insights into the broader trend of water area decline in Central Asia, which is also consistent with relevant research conclusions [29,30]. This trend is consistent with the overall decrease in water resources in the region, which can be attributed to the rise in global temperatures.

3.3. Accuracy Verification of Water Extraction Results

According to the statistical results presented in the Table 2, the highest extraction accuracy and Kappa coefficient, 97.14% and 94.21%, respectively, were achieved using the MNDWI method. The OTSU extraction method yielded an accuracy of 90.80% and a Kappa coefficient of 83.48%, while the random forest algorithm produced an accuracy of 95.21% and a Kappa coefficient of 90.29%. Additionally, the mean area of the water bodies was 187,940.93 km2.
According to the comparison of the extraction accuracy and kappa coefficient of the three extraction methods, we can intuitively see that the MNDWI algorithm is optimal in terms of accuracy data, but because the accuracy calculation method adopts the manual visual deciphering method, the selection of water body and non-water body labels will be affected by subjective factors to a large extent, and it can be judged according to the comparison of the extraction accuracy and the extraction effect diagram that the MNDWI extraction method will lead to the phenomenon of over-extraction of the water body distribution map, and the extraction accuracy and kappa coefficient are “inflated”. According to a comparison of extraction accuracy and extraction effect, it can be judged that the MNDWI extraction method will lead to the phenomenon of over-extraction in the water body distribution map, and the extraction accuracy and kappa coefficient will be “unrealistically high”.
In Figure 11, Figure 11a shows the local original image map of Landsat7 remote sensing image in the northern Aral Sea, Figure 11b shows the extraction map of the MNDWI method, Figure 11c figure shows the extraction map of the OTSU algorithm, and Figure 11d shows the extraction map of the random forest algorithm. It can be seen from the comparison that there is a serious over-extraction phenomenon in Figure 11b, where the dry riverbed and the area that has been transformed into land are still recognized as water bodies, and the accuracy calculation and kappa coefficients are “inflated” due to the manual labeling of water bodies/non-water bodies according to the original image. Figure 11c and Figure 11d both show better extraction results, but the random forest algorithm performs better in edge smoothing and the extraction of small water bodies.
The mismatch between the quality and quantitative indicators may be attributed to several factors. Primarily, the study area is situated in arid and semi-arid regions, where water bodies are significantly influenced by seasonal and interannual variations. Additionally, the presence of “salt marshes” or “salt layers” in these regions can complicate the identification process. When applying the MNDWI for water extraction, these areas may not be accurately detected, leading to deviations in the classification results. Consequently, when evaluating the algorithm’s performance, certain evaluation metrics may appear “falsely high” due to the influence of the image recognition framework.
In terms of future research directions, it is the future trend for us to use the GEE platform combined with random forest algorithm, which has excellent performance in all aspects, to extract water body information in Central Asia, and the method can also be applied to more large-scale and long time series remote sensing impact analyses, which can be used to perform complex spatial analysis with the help of GEE in the cloud, which provides powerful computational power and integrates a variety of remote sensing data sources, time series analyses, and multi-source data analyses. The implementation of the random forest algorithm with GEE can enhance the accuracy of classification results and effectively increase the accuracy of remote sensing image interpretation.
Overall, in comparing the influence of water extraction in Central Asia from 2000 to 2019, with the influence of seasonal changes and global warming, certain waters in Central Asia are subject to large seasonal or permanent water degradation, where seasonal water bodies change their submerged area from season to season due to precipitation, evaporation, surface runoff, and other factors, resulting in the emergence of bare riverbeds or lakebeds [31]. The degradation of permanent water bodies, such as those in the Aral Sea region, has been caused by a combination of human activities, climatic factors, and other influences, leading to a significant reduction in the Aral Sea’s area and exposing vast expanses of bare lakebed [32]. As demonstrated by the following comparative charts of algorithm extraction and corresponding accuracy metrics, the MNDWI algorithm proves less effective in addressing both seasonal water body areas and regions experiencing permanent water body degradation. In contrast, both the OTSU algorithm and the random forest algorithm perform better in managing these complex scenarios. Notably, the random forest algorithm excels in edge smoothing and in extracting small water bodies, resulting in a higher overall accuracy.

4. Discussion

4.1. Data Analysis and Discussion

Between 2000 and 2019, significant changes in the area of water bodies in Central Asia were observed [33]. This chapter aims to examine the role of temperature and precipitation as primary drivers of these changes, with the goal of enhancing our understanding of the long-term trends in water body area variations across the region. Climate change can directly influence water body areas in Central Asia through factors such as open water evaporation and precipitation, while also exerting indirect effects by altering glacier melt rates, which in turn cause seasonal fluctuations in watershed volumes [34]. Temperature and precipitation are particularly important in determining water body changes in the region. To analyze these factors, we utilized the Climate Hazards Group InfraRed Precipitation with Station Data (Version 2.0 Final) dataset (CHIRPS Daily) for precipitation trends from 2000 to 2019. Additionally, the GLDAS (Global Land Data Assimilation System) dataset, which provides global surface air temperature records from 1979 to the present, was employed to assess the average air temperature in Central Asia over the same period.
Figure 12 presents the correlation analysis between precipitation, mean annual air temperature, and water body area. The Pearson correlation coefficient between water body area and mean annual air temperature in Central Asia is −0.5583, while the correlation between water body area and mean annual precipitation is 0.6872. These values clearly indicate that both air temperature and precipitation are key factors jointly influencing the reduction in water body areas in Central Asia [35].
We have conducted supplementary calculations of the R-squared coefficient and p-value for multiple linear regression, focusing on the water area of the five Central Asian countries from 2000 to 2019. The results of these calculations are as follows: for Kazakhstan, the R-squared coefficient is 0.402, and the p-value is 0.003; for Kyrgyzstan, the R-squared coefficient is 0.027, and the p-value is 0.49; for Tajikistan, the R-squared coefficient is 0.02, and the p-value is 0.549; for Turkmenistan, the R-squared coefficient is 0.253, and the p-value is 0.024; and for Uzbekistan, the R-squared coefficient is 0.036, with a p-value of 0.001.
Statistical analysis of the R-squared coefficient and multivariate linear regression p-values across the five Central Asian countries reveals distinct patterns. Notably, Kyrgyzstan and Tajikistan exhibit significantly higher p-values (p > 0.05) compared to other regional counterparts. This statistical phenomenon can be attributed to their unique geographical characteristics and hydrological dynamics.
Geospatial analysis indicates that both countries are situated in the southeastern region of Central Asia, characterized by elevated mountainous terrain, including the Tianshan Mountains and Pamir Plateau, with mean elevations of approximately 3000 m and 2750 m, respectively. Despite the overall declining trend in water surface area across Central Asia (11.25% reduction from 2000 to 2019), these high-altitude nations demonstrate relatively stable hydrological conditions, resulting in statistically insignificant variations (p > 0.05) in their water surface area changes.
The primary contributing factors to this phenomenon include:
(1)
Low-temperature suppression of evaporation in high-altitude areas
Analysis of meteorological data from 2000 to 2019 indicates that the study regions exhibit comparatively low mean annual temperatures, with Kyrgyzstan and Tajikistan recording 12.22 °C and 9.85 °C, respectively. These values contrast sharply with the significantly higher temperatures observed in low-altitude areas, such as Uzbekistan (31.28 °C). The reduced thermal energy in these high-altitude environments substantially suppresses evaporation rates, while the presence of persistent ice and snow cover during winter months provides additional evaporative insulation. This dual mechanism—comprising thermal regulation and cryospheric protection—effectively minimizes water loss, thereby maintaining stable water surface areas with negligible fluctuations.
(2)
Less interference from human activities
The low population density in Tajikistan and Kyrgyzstan correlates with limited agricultural and industrial water demand, thereby minimizing anthropogenic pressure on water resources. Consequently, variations in water surface area are predominantly influenced by natural hydrological processes, including glacier meltwater contributions and precipitation patterns, resulting in relatively stable long-term trends.
(3)
Main types of water bodies and types of water recharge
The aquatic systems in these regions predominantly consist of high-altitude hydrological features, including alpine lakes (e.g., Issyk Kul in Kyrgyzstan), montane rivers (e.g., Vakhsh River in Tajikistan), and glacial formations. These high-elevation water bodies exhibit reduced susceptibility to evaporative losses due to their unique thermal characteristics. Furthermore, the primary recharge mechanism for these lakes and rivers is derived from glacial meltwater, whose consistent supply contributes to the observed stability in water surface area fluctuations across both countries.
The statistical analysis demonstrates that the elevated multiple linear correlation coefficient (p > 0.05) observed in these two countries can be attributed to their distinctive geographical characteristics, as evidenced by the aforementioned factors.
As shown in Figure 12, the average annual temperature in Central Asia exhibits a fluctuating upward trend, while the average annual precipitation follows a fluctuating downward trend [33,36]. This pattern aligns with the consistent decrease in water body area across the region over the years. Consequently, the average temperature in 2000–2019 was 19.31 °C, reaching an annual average temperature minimum of 18.15 °C in 2003 and an average temperature maximum of 20.18 °C in 2013. The average precipitation in 2000–2019 was 284.94 mm, reaching an annual average in 2008. The lowest precipitation was 230.19 mm and reached the highest average annual precipitation of 363.86 mm in 2003.
The average temperatures in Kazakhstan, Tajikistan, Kyrgyzstan, Uzbekistan, and Turkmenistan for the years 2000–2019 are 16.31 °C, 9.85 °C, 12.22 °C, 31.28 °C, and 26.88 °C, respectively, with the presence of year-round glaciers in Kyrgyzstan’s mountainous terrain and an average altitude of 2750 m, so the average temperature of Kyrgyzstan is the lowest, which is in line with the real situation. Turkmenistan and Uzbekistan, characterized by a typical temperate continental climate, are located far from the sea and, therefore, experience minimal influence from oceanic climate regulation. These regions feature hot, dry summers and cold winters with limited precipitation. They also have extensive desert areas with a high albedo and a high capacity to absorb solar radiation, resulting in average temperatures that are much higher than those of the other three countries.
The average precipitation of Kazakhstan, Tajikistan, Kyrgyzstan, Turkmenistan, and Uzbekistan from 2000 to 2019 is 261.66 mm, 438.80 mm, 357.34 mm, 176.17 mm, and 190.74 mm, respectively. Kyrgyzstan and Tajikistan have a significantly higher amount of precipitation compared to the other three Central Asian, mainly because Kyrgyzstan and Tajikistan are situated in mountainous regions with high altitudes, and the air in mountainous areas condenses when it rises in the presence of cold, which makes it easy to form precipitation, and this is one of the important reasons for the higher amount of precipitation.

4.2. The Relevant Contributions of This Study

This study focuses on five Central Asian countries—Kazakhstan, Kyrgyzstan, Tajikistan, Turkmenistan, and Uzbekistan—examining changes in water bodies within these regions, with particular emphasis on the Aral Sea and the glacier regions of Kyrgyzstan. This area, long impacted by both global climate change and human activities, offers a unique natural laboratory for research. Compared to other studies, this approach addresses the research gap regarding water body changes in arid regions of Central Asia, especially in terms of the impact on water resources within the broader context of environmental change.
In terms of data analysis, this study employs a combination of the MNDWI, OTSU, and the random forest algorithms, facilitated by the GEE cloud platform. This integrated approach provides an efficient technical solution for water body extraction and classification, particularly enhancing the accuracy of water body identification in arid regions. These methods significantly improve both the precision of water body extraction and the efficiency of data processing.

4.3. Limitations of This Study

However, the study does have some limitations. First, the quality of satellite imagery, while generally stable through the use of Landsat7 data, may be affected in certain areas of Central Asia due to factors such as cloud cover, shadows, and non-water features like salt marshes or salt crusts. These factors may introduce errors in the extraction of some water bodies. Second, the time span of the analysis could be expanded to include data from after 1984, which would provide a more comprehensive view of long-term climate trends and their impacts on water resources.
Neglecting altitudinal influences may result in an inadequate interpretation of geographical heterogeneity across Central Asia. The region exhibits pronounced topographical diversity, ranging from high mountain systems in the southeast to lowland desert plains in the northwest, with distinct variations in hydrological characteristics and mechanisms across different elevation zones. An analysis that fails to incorporate altitude-based zoning risks produces generalized descriptions of water body dynamics, potentially obscuring the unique hydrological patterns of both high- and low-elevation areas. Furthermore, the unquantified interaction between climatic variables and elevation gradients may lead to either overestimation or underestimation of the independent effects of climate factors on hydrological processes.

5. Conclusions

This study leverages the Google Earth Engine (GEE) platform, utilizing Landsat 7 satellite data (LANDSAT/LE07/C02/T1_RT_TOA) alongside auxiliary datasets such as GLDAS temperature data and the CHIRPS precipitation dataset. The analysis of water body areas in Central Asia was conducted using three methods: the Modified Normalized Difference Water Index (MNDWI), the maximum inter-class variance algorithm (OTSU), and the random forest (RF) algorithm. Among these, the random forest algorithm demonstrated the highest computational accuracy and was selected for further analysis. The study’s key findings are summarized as follows:
(1)
The Effectiveness of Extraction Methods: The random forest algorithm outperformed both the MNDWI and the OTSU in terms of overall accuracy and kappa coefficient, achieving 95.21% accuracy and a kappa coefficient of 90.29%. While the MNDWI method showed the highest accuracy (97.14%) and kappa coefficient (94.21%), these values were likely inflated due to the manual visual interpretation process, which can introduce subjective biases. The MNDWI method also struggled with accurately identifying seasonal water bodies and areas affected by permanent water degradation. In contrast, the random forest algorithm excelled in edge smoothing and the extraction of small water bodies, making it the most effective method for water body extraction in Central Asia.
(2)
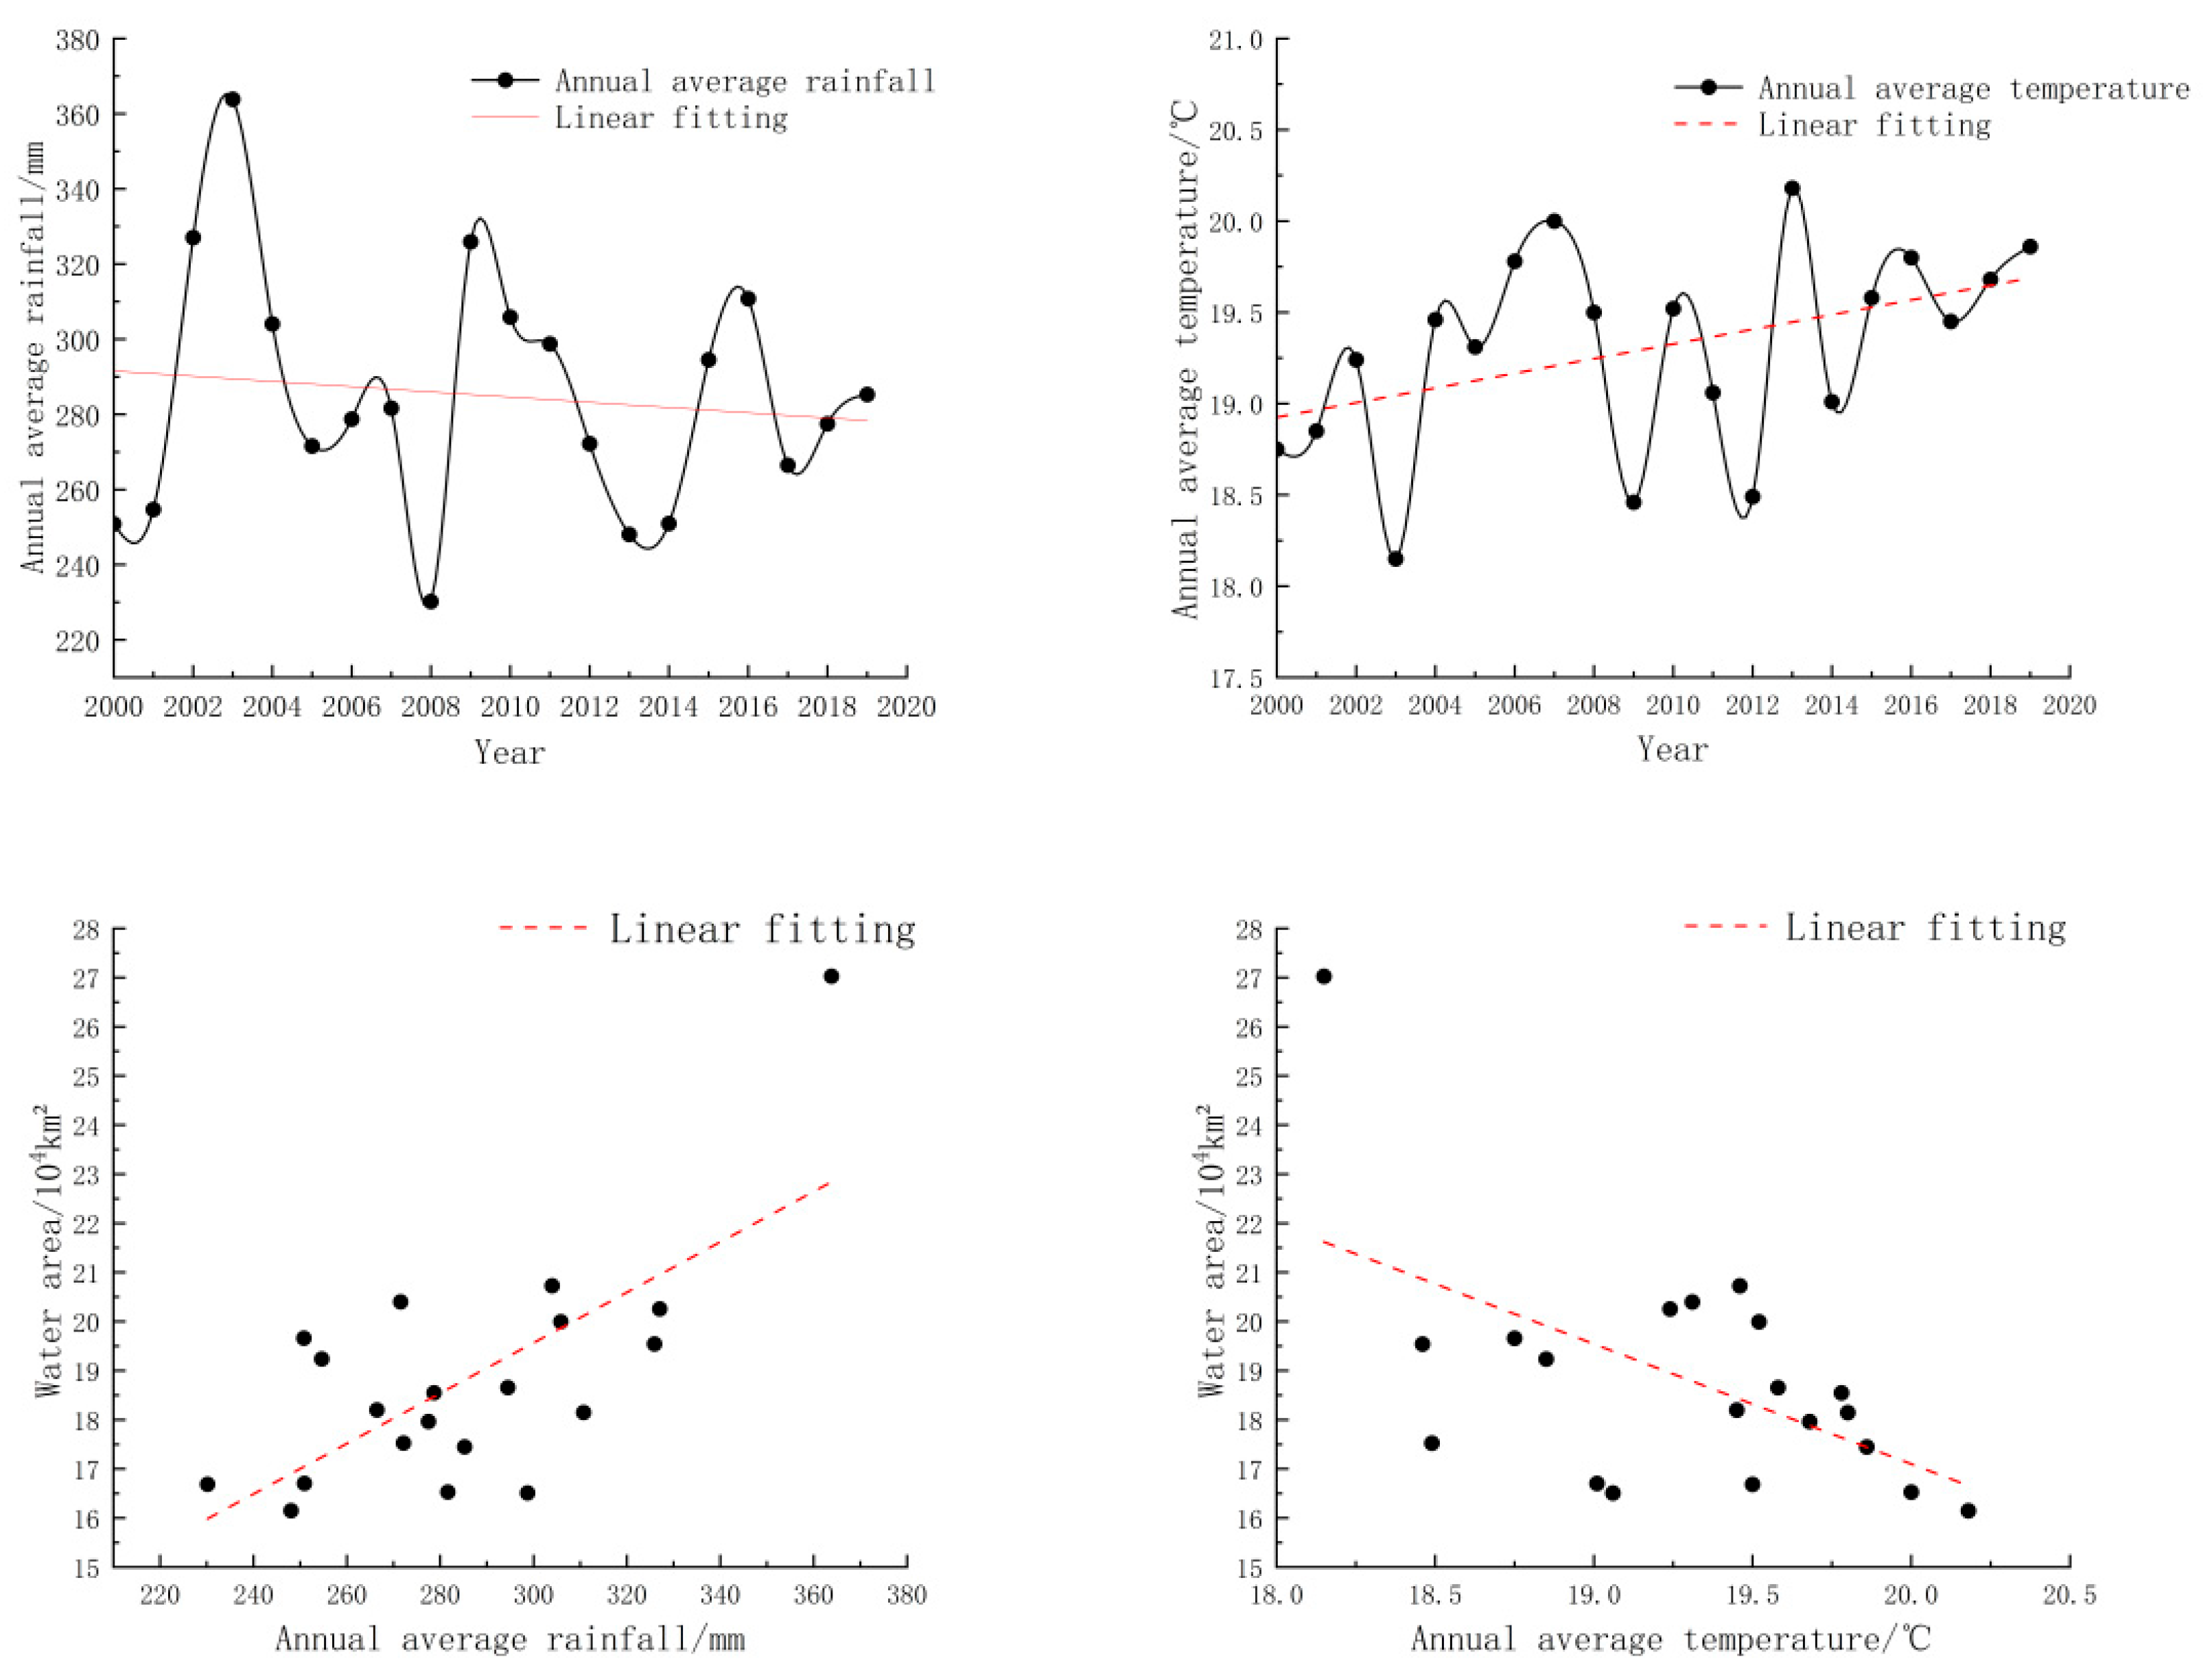
Climate-Driven Water Loss: The study revealed a strong correlation between climate variables and water body area changes in Central Asia. The Pearson correlation coefficients indicated that rising temperatures (−0.5583) and declining precipitation (0.6872) are key drivers of water loss in the region. Over the 20-year study period (2000–2019), the average annual temperature in Central Asia exhibited a fluctuating upward trend, while precipitation showed a fluctuating downward trend. These climatic changes align with the observed 11.25% reduction in the total water body area across the region.
(3)
Regional Water Body Changes: The analysis highlighted significant regional variations in water body changes. The Aral Sea, for instance, experienced a dramatic 72.13% reduction in its water area, with the East Aral Sea shrinking by 93.3% from 2003 to 2019. Similarly, glaciers in southern Kyrgyzstan decreased by 39.23% over the same period. These changes underscore the vulnerability of Central Asia’s water resources to both climatic and anthropogenic pressures.
(4)
Implications for Water Resource Management: The findings emphasize the urgent need for adaptive water resource management strategies in Central Asia, particularly in light of the region’s increasing vulnerability to climate change. The RF-GEE framework proved to be an effective tool for large-scale, long-term hydrological monitoring, offering critical insights for climate resilience planning. Future research should focus on expanding the temporal scope of analysis and incorporating additional data sources to further enhance the accuracy and comprehensiveness of water body extraction in arid and semi-arid regions.
In conclusion, this study provides a robust methodological framework for monitoring water body changes in Central Asia, offering valuable insights into the region’s hydrological dynamics and the impacts of climate change. The integration of advanced machine learning algorithms with cloud-based platforms like GEE represents a promising approach for addressing the challenges of water resource management in arid regions.

Author Contributions

Conceptualization, K.C., X.C., H.W. and W.C.; Data curation, W.Y., K.T. and X.L.; Writing—original draft, K.C.; Project administration, K.C. All authors have read and agreed to the published version of the manuscript.

Funding

This work was supported by the Program of Support Xinjiang by Technology (2024E02028, B2-2024-0359), Xinjiang Tianchi Talent Program of 2024, the Foundation of Chinese Academy of Sciences (B2-2023-0239), and the Youth Foundation of Shandong Natural Science (ZR2023QD070). Special thanks to the anonymous reviewers and editors for helpful comments, as well as to the Xinjiang Uygur Autonomous Region Meteorological Service and Institute of Environmental Sciences of Xinjiang Uygur Autonomous Region, China for providing data.

Data Availability Statement

Data are contained within the article.

Conflicts of Interest

Author Hongzhi Wang was employed by the company of Xinjiang Herun Technology Co., Ltd. The remaining authors declare that the research was conducted in the absence of any commercial or financial relationships that could be construed as a potential conflict of interest.

References

  1. Bi, X.; Chang, B.; Hou, F.; Yang, Z.; Fu, Q.; Li, B. Assessment of Spatio-Temporal Variation and Driving Mechanism of Ecological Environment Quality in the Arid Regions of Central Asia, Xinjiang. Int. J. Environ. Res. Public Health 2021, 18, 7111. [Google Scholar] [CrossRef]
  2. Li, J.; Chen, X.; Bao, A. Spatial-temporal characteristics of lake level changes in central Asia during 2003–2009. Acta Geogr. Sin. 2011, 66, 1219–1229. [Google Scholar]
  3. Mueller, L.; Suleimenov, M.; Karimov, A.; Qadir, M.; Saparov, A.; Balgabayev, N.; Helming, K.; Lischeid, G. Land and Water Resources of Central Asia, Their Utilisation and Ecological Status. In Novel Measurement and Assessment Tools for Monitoring and Management of Land and Water Resources in Agricultural Landscapes of Central Asia; Mueller, L., Saparov, A., Lischeid, G., Eds.; Springer International Publishing: Cham, Switzerland, 2014; pp. 3–59. [Google Scholar]
  4. Peng, D.; Zhou, T.; Zhang, L. Moisture Sources Associated with Precipitation during Dry and Wet Seasons over Central Asia. J. Clim. 2020, 33, 10755–10771. [Google Scholar] [CrossRef]
  5. Xia, Q.-Q.; Chen, Y.-N.; Zhang, X.-Q.; Ding, J.-L. Spatiotemporal Changes in Ecological Quality and Its Associated Driving Factors in Central Asia. Remote Sens. 2022, 14, 3500. [Google Scholar] [CrossRef]
  6. Cheng, C.; Fu, W.; Hu, Z.; Li, X. Changes of major lakes in Central Asia over the past 30 years revealed by remote sensing technology. Remote Sens. Land Resour. 2015, 27, 146–152. [Google Scholar]
  7. Kandekar, V.U.; Pande, C.B.; Rajesh, J.; Atre, A.; Gorantiwar, S.; Kadam, S.; Gavit, B. Surface water dynamics analysis based on sentinel imagery and Google Earth Engine Platform: A case study of Jayakwadi dam. Sustain. Water Resour. Manag. 2021, 7, 44. [Google Scholar] [CrossRef]
  8. Deng, Y.; Jiang, W.; Tang, Z.; Ling, Z.; Wu, Z. Long-Term Changes of Open-Surface Water Bodies in the Yangtze River Basin Based on the Google Earth Engine Cloud Platform. Remote Sens. 2019, 11, 2213. [Google Scholar] [CrossRef]
  9. Wang, C.; Jia, M.; Chen, N.; Wang, W. Long-Term Surface Water Dynamics Analysis Based on Landsat Imagery and the Google Earth Engine Platform: A Case Study in the Middle Yangtze River Basin. Remote Sens. 2018, 10, 1635. [Google Scholar] [CrossRef]
  10. Gorelick, N.; Hancher, M.; Dixon, M.; Ilyushchenko, S.; Thau, D.; Moore, R. Google Earth Engine: Planetary-scale geospatial analysis for everyone. Remote Sens. Environ. 2017, 202, 18–27. [Google Scholar] [CrossRef]
  11. Cheng, W.; Qian, X.; Li, S.; Ma, H.; Liu, D.; Liu, F.; Liang, J.; Hu, J. Research and application of PIE-Engine Studio for spatiotemporal remote sensing cloud computing platform. Natl. Remote Sens. Bull. 2022, 26, 335–347. [Google Scholar] [CrossRef]
  12. Fu, D.; Xiao, H.; Su, F.; Zhou, C.; Dong, J.; Zeng, Y.; Yan, K.; Li, S.; Wu, J.; Wu, W.; et al. Remote sensing cloud computing platform development and Earth science application. Natl. Remote Sens. Bull. 2021, 25, 220–230. [Google Scholar] [CrossRef]
  13. Jintao, L.; Chao, C.; Weiwei, S.; Gang, Y.; Zhisong, L.; Zili, Z. Spatio-temporal land use/cover change dynamics in Hangzhou Bay, China, using long-term Landsat time series and GEE platform. Natl. Remote Sens. Bull. 2023, 27, 1480–1495. [Google Scholar]
  14. Sheng, X.; Cao, Y.; Zhou, W.; Cheng, L.; Zhang, H.; Planning, R. Impact of land use change on ecosystem service value in Beijing-Tianjin-Hebei region. Chin. J. Agric. Resour. 2018, 39, 79–86. [Google Scholar]
  15. Shelestov, A.; Lavreniuk, M.; Kussul, N.; Novikov, A.; Skakun, S. Exploring Google Earth Engine Platform for Big Data Processing: Classification of Multi-Temporal Satellite Imagery for Crop Mapping. Front. Earth Sci. 2017, 5, 17. [Google Scholar] [CrossRef]
  16. Yan, K.; Chen, H.; Fu, D.; Zeng, Y.; Dong, J.; Li, S.; Wu, Q.; Li, H.; Du, S. Bibliometric visualization analysis related to remote sensing cloud computing platforms. Natl. Remote Sens. Bull. 2022, 26, 310–323. [Google Scholar] [CrossRef]
  17. Deng, H.; Chen, Y.; Wang, H.; Zhang, S. Climate change with elevation and its potential impact on water resources in the Tianshan Mountains, Central Asia. Glob. Planet. Change 2015, 135, 28–37. [Google Scholar] [CrossRef]
  18. Ali, M.I.; Dirawan, G.D.; Hasim, A.H.; Abidin, M.R. Detection of changes in surface water bodies urban area with NDWI and MNDWI methods. Int. J. Adv. Sci. Eng. Inf. Technol. 2019, 9, 946–951. [Google Scholar] [CrossRef]
  19. Xu, Q. Research on extracting water information using improved normalized difference water index (MNDWI). J. Remote Sens. 2005, 9, 589–595. [Google Scholar]
  20. Otsu, N. A threshold selection method from gray-level histograms. Automatica 1975, 11, 23–27. [Google Scholar] [CrossRef]
  21. Breiman, L. Random forests. Mach. Learn. 2001, 45, 5–32. [Google Scholar] [CrossRef]
  22. Cutler, A.; Cutler, D.R.; Stevens, J.R. Random forests. In Ensemble Machine Learning: Methods; Springer: New York, NY, USA, 2012; pp. 157–175. [Google Scholar]
  23. Rigatti, S.J. Random forest. J. Insur. Med. 2017, 47, 31–39. [Google Scholar] [CrossRef] [PubMed]
  24. Du, P.; Xu, M.; Li, R. Impacts of climate change on water resources in the major countries along the Belt and Road. PeerJ 2021, 9, e12201. [Google Scholar] [CrossRef] [PubMed]
  25. Rodell, M.; Houser, P.R.; Jambor, U.E.A.; Gottschalck, J.; Mitchell, K.; Meng, C.J.; Arsenault, K.; Cosgrove, B.; Radakovich, J.; Bosilovich, M.; et al. The global land data assimilation system. Bull. Am. Meteorol. Soc. 2004, 85, 381–394. [Google Scholar] [CrossRef]
  26. Funk, C.; Peterson, P.; Landsfeld, M.; Pedreros, D.; Verdin, J.; Shukla, S.; Husak, G.; Rowland, J.; Harrison, L.; Hoell, A.; et al. The climate hazards infrared precipitation with stations—A new environmental record for monitoring extremes. Sci. Data 2015, 2, 150066. [Google Scholar] [CrossRef]
  27. Gao, B.-C. NDWI—A normalized difference water index for remote sensing of vegetation liquid water from space. Remote Sens. Environ. 1996, 58, 257–266. [Google Scholar] [CrossRef]
  28. Hastie, T.; Tibshirani, R.; Friedman, J.; Hastie, T.; Tibshirani, R.; Friedman, J. Random forests. In The Elements of Statistical Learning: Data Mining, Inference, Prediction; Springer: New York, NY, USA, 2009; pp. 587–604. [Google Scholar]
  29. Huang, S.; Chen, X.; Ma, X.; Fang, H.; Liu, T.; Kurban, A.; Guo, J.; De Maeyer, P.; Van de Voorde, T. Monitoring surface water area changes in the aral sea basin using the Google Earth engine cloud platform. Water 2023, 15, 1729. [Google Scholar] [CrossRef]
  30. Osmonov, A.; Bolch, T.; Xi, C.; Kurban, A.; Guo, W. Glacier characteristics and changes in the Sary-Jaz River Basin (Central Tien Shan, Kyrgyzstan)–1990–2010. Remote Sens. Lett. 2013, 4, 725–734. [Google Scholar] [CrossRef]
  31. Yang, X.; Wang, N.; He, J.; Hua, T.; Qie, Y. Changes in area and water volume of the Aral Sea in the arid Central Asia over the period of 1960–2018 and their causes. Catena 2020, 191, 104566. [Google Scholar] [CrossRef]
  32. Wang, X.; Chen, Y.; Li, Z.; Fang, G.; Wang, F.; Liu, H. The impact of climate change and human activities on the Aral Sea Basin over the past 50 years. Atmos. Res. 2020, 245, 105125. [Google Scholar] [CrossRef]
  33. Huang, W.; Duan, W.; Chen, Y. Rapidly declining surface and terrestrial water resources in Central Asia driven by socio-economic and climatic changes. Sci. Total Environ. 2021, 784, 147193. [Google Scholar] [CrossRef]
  34. Xia, X.; Wu, Q.; Mou, X.; Lai, Y. Potential impacts of climate change on the water quality of different water bodies. J. Environ. Inf. 2015, 25, 85–98. [Google Scholar] [CrossRef]
  35. Klein, I.; Dietz, A.J.; Gessner, U.; Galayeva, A.; Myrzakhmetov, A.; Kuenzer, C. Evaluation of seasonal water body extents in Central Asia over the past 27 years derived from medium-resolution remote sensing data. Int. J. Appl. Earth Obs. Geoinf. 2014, 26, 335–349. [Google Scholar] [CrossRef]
  36. Fallah, B.; Didovets, I.; Rostami, M.; Hamidi, M. Climate change impacts on Central Asia: Trends, extremes and future projections. Int. J. Climatol. 2024, 44, 3191–3213. [Google Scholar] [CrossRef]
Figure 1. The scope of the Central Asian research area (The different background colors indicate different elevations).
Water 17 00804 g001
Figure 2. Flow Chart of This Study.
Water 17 00804 g002
Figure 3. Image of Water Body Extraction Using MNDWI.
Water 17 00804 g003
Figure 4. Image of Water Body Extraction Using OTSU Algorithm.
Water 17 00804 g004
Figure 5. Image of Water Body Extraction Using Random Forest Algorithm.
Water 17 00804 g005
Figure 6. Map of Water Body Area Changes in Central Asian Countries from 2000 to 2019.
Water 17 00804 g006
Figure 7. Changes in water area in the Aral Sea region.
Water 17 00804 g007
Figure 8. Map of changes in the area of various parts of the Aral Sea (It was not until 2003 that the East and West Aral Seas separated from the South Aral Sea).
Water 17 00804 g008
Figure 9. Changes in Glacier Area in Southern Kyrgyzstan.
Water 17 00804 g009
Figure 10. Annual variation chart of glacier cover area in southern Kyrgyzstan.
Water 17 00804 g010
Figure 11. Comparison Chart of Extraction Effects for Various Algorithms. (The research area for this study is selected from the northern part of the Aral Sea region).
Water 17 00804 g011
Figure 12. Annual variation chart of water area in Central Asia from 2000 to 2009 and correlation analysis chart of water area with annual average temperature and annual average precipitation, respectively.
Water 17 00804 g012
Table 1. The water area of the Aral Sea in different years.
YearWater Body Area in Different Years/km2
Aral SeaNorth Aral SeaSouth Aral SeaEast Aral SeaWest Aral Sea
200025,722.762888.4822,843.78\\
200320,576.012956.4617,619.4212,459.565157.48
200519,563.942970.8216,593.1311,620.714971.18
201014,326.933385.8310,940.897107.823831.45
20159456.323385.096071.212884.923185.98
20197168.683425.623741.021069.872667.16
MEAN16,135.773168.7112,968.247028.583962.65
Table 2. Extraction accuracy, kappa coefficient, and water area of the MNDWI, OTSU, and RF algorithms in the Central Asian region from 2000 to 2019.
YearMNDWIOTSURF
AccuracyKappaAccuracyKappaAccuracyKappa
20000.98530.97050.98740.97430.95930.9181
20010.97270.94490.95520.96890.95160.9032
20020.97420.94770.96870.93660.95740.9134
20030.93710.87410.85580.69640.94910.8962
20040.97520.94980.87790.74500.96170.9215
20050.97530.95010.97570.95110.95860.9161
20060.96370.92650.95370.89300.94930.8970
20070.96730.93380.94570.88800.96330.9263
20080.97420.94760.77370.73880.94870.8964
20090.96530.92940.75390.52200.93680.8717
20100.96440.92740.97750.95460.94600.8900
20110.96580.93070.96120.94460.93730.8718
20120.96780.93540.96720.93410.95420.9062
20130.96030.91750.65160.48650.94890.8970
20140.97370.94660.85210.70360.95650.9117
20150.98440.96800.96890.93470.94750.8941
20160.98800.97560.97840.96300.95650.9122
20170.97960.95760.96320.91110.96620.9321
20180.97410.94660.90540.78140.94590.8911
20190.98100.96150.88640.76770.94630.8916
Mean0.97140.94210.90800.83480.95210.9029
Disclaimer/Publisher’s Note: The statements, opinions and data contained in all publications are solely those of the individual author(s) and contributor(s) and not of MDPI and/or the editor(s). MDPI and/or the editor(s) disclaim responsibility for any injury to people or property resulting from any ideas, methods, instructions or products referred to in the content.

