Article

Research on the Recovery Technology and Application of Copper Resources from Mine Wastewater at High Altitudes

1
School of Metallurgy and Environmental, Central South University, Changsha 410083, China
2
Zijin Mining Group Company Limited, Shanghang 364200, China
3
College of Environmental Science and Engineering, Hunan University, Changsha 410083, China
4
Sainz Environmental Protection Co., Ltd., Nonferrous Industry Pollution Control and Equipment Engineering Technology Research Center, Changsha 410083, China
*
Author to whom correspondence should be addressed.
Water 2025, 17(6), 856; https://doi.org/10.3390/w17060856
Submission received: 18 February 2025 / Revised: 9 March 2025 / Accepted: 15 March 2025 / Published: 17 March 2025
(This article belongs to the Section Wastewater Treatment and Reuse)

Abstract

:
In this study, we studied the process of recovering copper from mine-leached water at an altitude of 4500 m. The process was ion exchange–esolution–nanofiltration–separation–cyclone electrodeposition. As a result, high-purity copper cathodes were produced. The study demonstrated that the maximum adsorption capacity of ion exchange resin D402 for Cu2+ reached 174.6 g/L and the efficiency of Cu2+ adsorption and eluent was found to be 97.2% and 94.2%, respectively. The results of Fourier Transform infrared spectroscopy (FTIR) analysis indicated that the resin contains -OH and -NH2. The lone pair electrons on O and N atoms can form coordination bonds with copper ions to form stable complexes. The results of X-ray photoelectron spectroscopy (XPS) analysis indicated that copper ions were absorbed into the resin. The recovery efficiency of Cu2+ throughout the entire process reaches 95.1%, and the purity of the resulting copper cathode reaches 99.997%. This method is distinguished by a straightforward process, minimal environmental impact, optimal operating conditions, high copper recovery efficiency, and a high copper grade.

1. Introduction

Mining and processing operations generate a considerable volume of wastewater, which represents a significant environmental concern. China’s copper deposits have a long mining history, with different periods of development giving rise to varying approaches to waste rock disposal [1]. The copper content in copper deposits is typically less than 1%, with the silica-type and porphyry-type copper ores containing no more than 20% metal minerals. Consequently, the overwhelming majority of the extracted volume from copper mines is waste rock [2]. The waste rock piled on the surface contains heavy metals to varying degrees. These metals are released by the natural process of leaching with rain, forming leaching wastewater. Once leachate enters the aquatic environment, it has a significant negative impact on the surrounding ecosystem [3,4].
At present, the principal treatment methods for copper-containing leachate are biological [5], chemical [6], membrane filtration [7], electrolysis [8], and other methods [9,10]. It should be noted that the aforementioned methods have certain limitations, including low efficiency, a proclivity for secondary pollution, high investment costs, a complex operational process, and difficulties in resource recovery [11]. The ion exchange method involves exchanging ions in a solid ion exchanger with ions in a dilute solution, and the exchange between ions in the liquid phase and ions in the solid phase is a reversible chemical reaction [12,13,14]. Ion exchange resin is the most widely used ion exchange agent, offering the key advantage of enabling effective copper ion enrichment on the resin, which in turn facilitates resource recovery. The rejection rate of copper ions in the nanofiltration process can usually reach more than 90%, which is especially suitable for the concentration and recovery of low-concentration copper wastewater [15,16]. Cyclone electrowinning has a significant effect on the wastewater treatment of high concentration of copper ions, with high current efficiency, copper recovery rate can exceed 95%, and high-purity metal copper can be directly produced [17,18].
The total amount of copper resources discovered in a copper mine in China is 10.36 million tons, with an additional 25 million tons of prospective resources [19,20]. As the highest-altitude copper mine in the world, the mine site is home to a fragile ecosystem. Furthermore, the leaching wastewater has the following characteristics: low temperature, low reaction efficiency, large water volume, high copper concentration, and low air pressure [21,22]. Additionally, the environmental capacity is limited, and there are high environmental protection requirements, as well as the implementation of special discharge standards. Consequently, the water quality of high-altitude leaching wastewater is poor, with stricter environmental protection requirements and higher value.
The existing 30,000 m3 water treatment project employs the sulfide precipitation method, which primarily utilizes sodium sulfide and sodium hydroxide. However, the cost of the chemicals represents a significant concern. The copper sulfide residues produced after precipitation have a copper content of 12–14%, significantly lower than the 20–22% in conventional copper concentrate [23]. In accordance with prevailing industry pricing norms, the price coefficient of the copper sulfide slag is less than that of conventional copper concentrate, resulting in a comparatively low added value for the product. The greatest economic value is represented by the copper cathode produced through electrowinning. The main economic benefits of this project stem from the difference between the valuation coefficient of copper sulfide slag and copper cathode, and the current price of copper, which is CNY 70,000–80,000 per ton (https://sem.smm.cn/, accessed on 15 January 2024). The concentrate contains 0.1 g/L of copper and has a total recovery rate of 95%. The daily wastewater volume of 30,000 m3 aligns with the project’s scale and is detailed in Table S1 for financial reporting purposes.
The combination of ion exchange process, membrane process, and electrodeposition process to recover copper has been studied before. However, there are few studies on the use of cyclone electrowinning cascade control voltage to recover copper. This is the voltage control method that can obtain high-quality copper products. In this study, copper was recovered from mining wastewater generated from a copper mine using a combined process comprising ion exchange, nanofiltration separation, and cyclonic electrowinning. This article studied the parameters of the combined process and analyzed the adsorption mechanism to obtain high-value-added cathode copper. This study provides process parameter support and explores operational experience for the design and operation of practical engineering projects.

2. Materials and Methods

2.1. Reagents and Equipment

The primary equipment used in this study comprises precision filters, ion exchange columns, nanofiltration units, electrowinning apparatus, air compressors, submersible pumps, transfer pumps, raw water tanks, acid tanks, alkali tanks, wastewater tanks, concentrated liquid tanks, analytical recycling tanks, electrowinning tanks, and assorted pipeline components.
The analytical-grade sulfuric acid (H2SO4) and sodium hydroxide (NaOH) are supplied by Sinopharm Group Chemical Reagent Co., Ltd., Shanghai, China. The adsorbent material is D402 macroporous chelating cation exchange resin (Tianjin Lotus New Material Technology Co., Ltd., Tianjin, China), and the characteristics and properties of the D402 resin are shown in Table S2. The actual leaching wastewater is obtained from the copper industry, pH = 4.0. The wastewater required for the study comes from the acidic leaching water in the regulating tank of the water treatment station, which is sealed and stored after sampling. The average concentration of the quality of leaching wastewater is presented in Table 1.

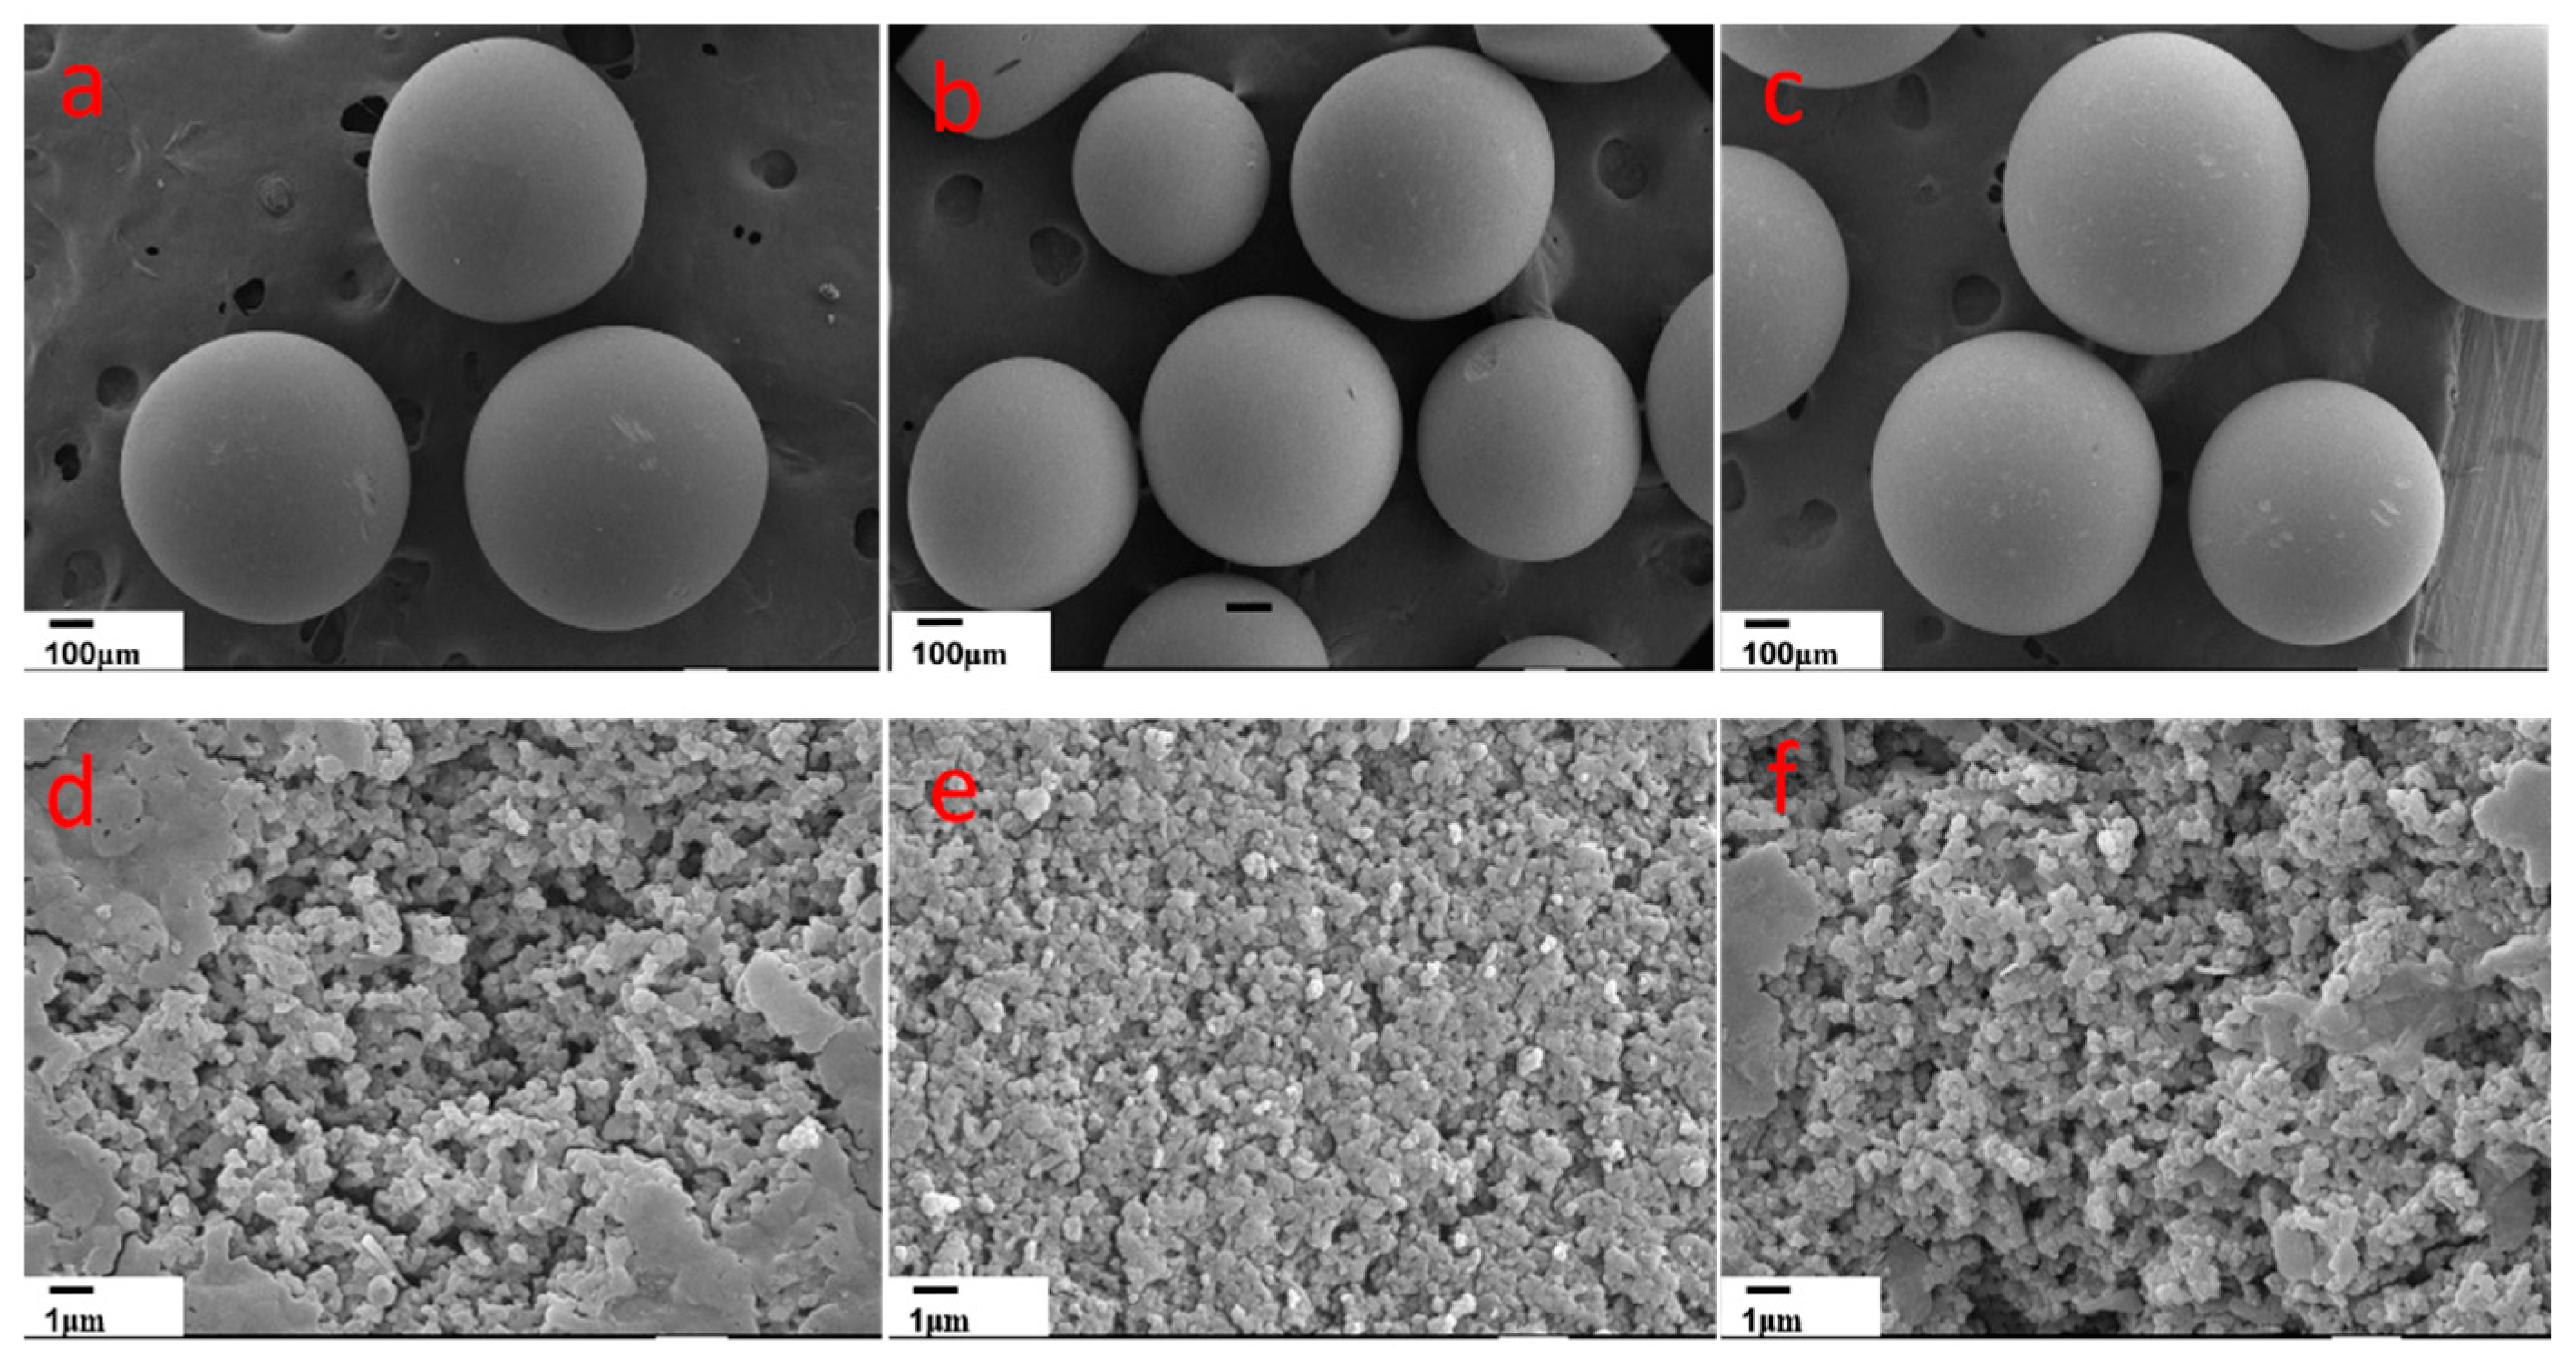
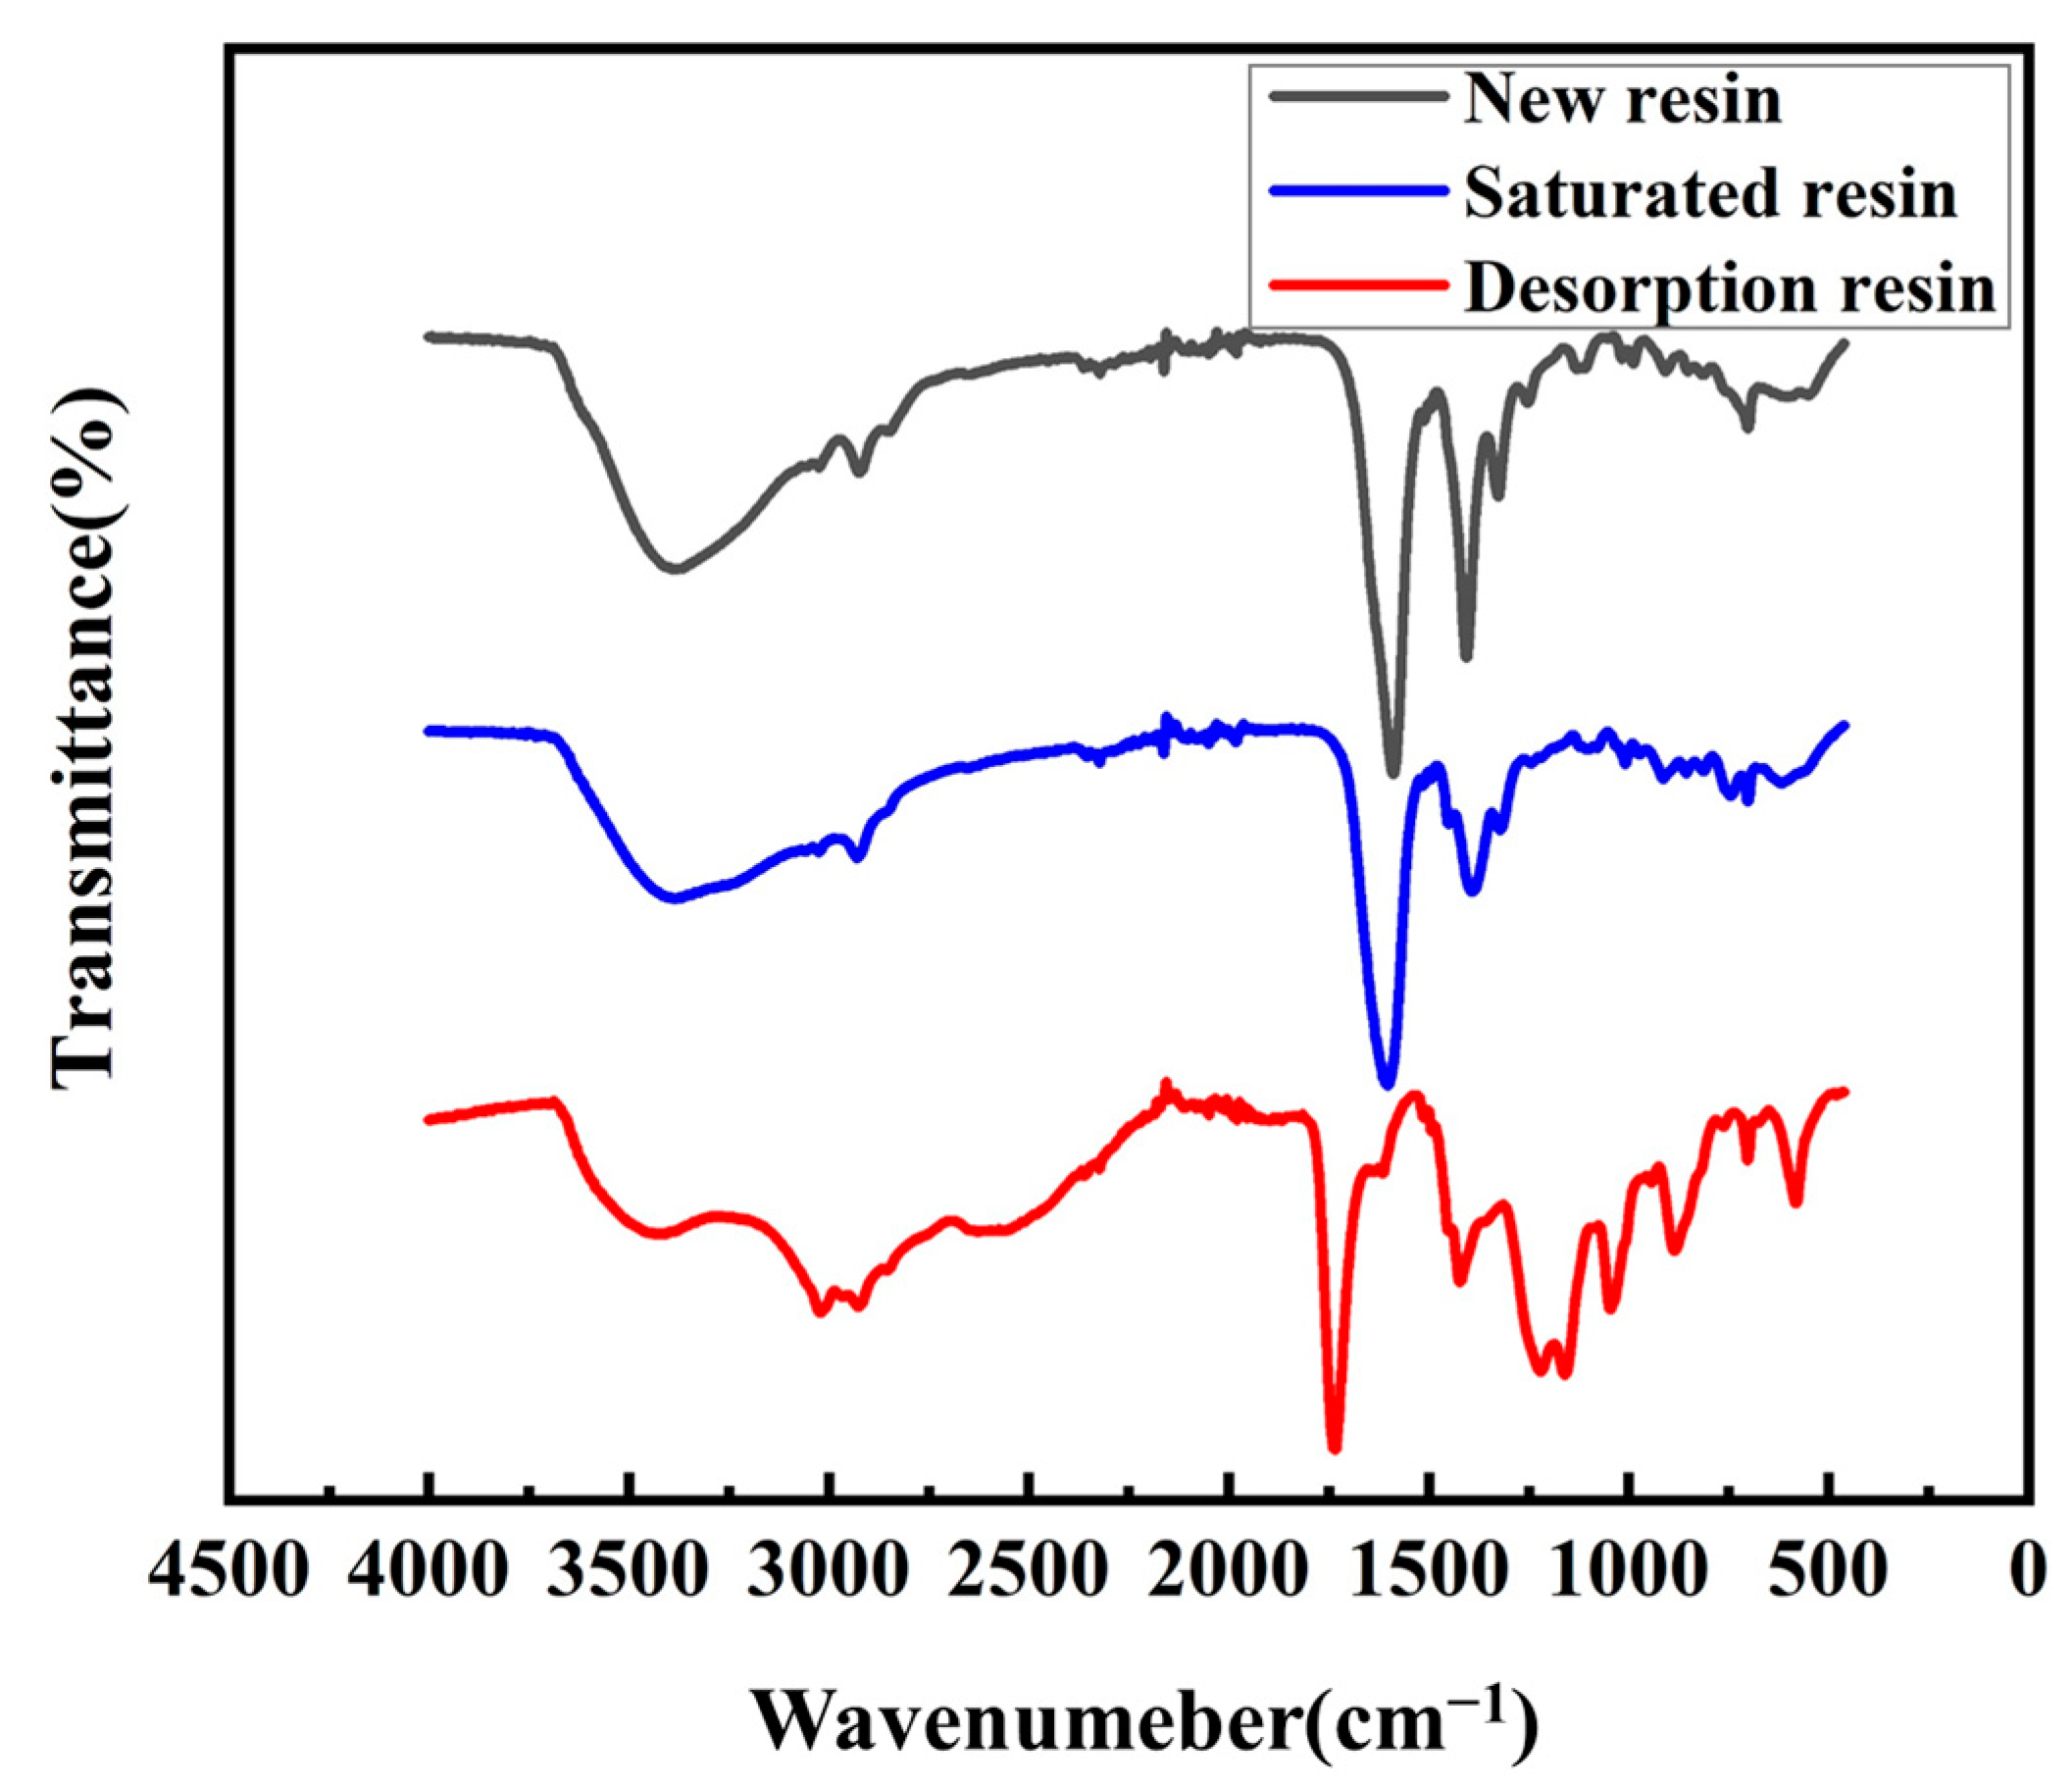
2.2. Characterization Methods

The scanning electron microscopy (SEM, Carl Zeiss AG, GeminiSEM300, Oberkochen, Germany) was used to observe the morphological characteristics of D402; Photoelectron spectroscopy (XPS, Thermo Scientific, Escalab 250Xi, MA, USA) was used to determine the binding energy of elements, with a C 1s standard peak (284.8 eV) as a reference; Fourier Transform infrared spectroscopy (FTIR, Thermo Fisher Scientific, Nicolet iS20, MA, USA) was used to determine various functional groups in resins.

2.3. Experimental Methods

The leaching wastewater is filtered and then enters the ion exchange column which is loaded with 250 L resin. During the adsorption process, the flow rate and residence time were controlled at 10 BV/h (2.5 m3/h) and 6 min. The liquid that has been adsorbed then enters the existing water treatment station. Once the resin has reached its maximum adsorption capacity, the eluent agent, which is prepared with 5% sulfuric acid, is introduced to the resin eluent system at a flow rate of 2 BV/h (0.5 m3/h). The eluate is then transferred to the nanofiltration device for concentration and the nanofiltration pressure was set at 2 MPa, 4 MPa, and 5 MPa, respectively. The concentrated water from nanofiltration is returned to electrowinning. The cathode of swirl electrowinning is a titanium plate, and the anode is titanium plated. The cascade constant current mode is used to gradually reduce the current intensity, voltage, and deposition time data such as in Table S8. The water produced by nanofiltration can be used as the eluent liquid, entering the resin-resolving system once more. Once the resin has been fully desorption, the regeneration agent, which is configured with 5% NaOH, is introduced to the resin regeneration system. This process restores the resin’s adsorption and analysis functions. The concentration of copper ion was determined by inductively coupled plasma optical emission spectrometry (ICP-OES, SPECTRO Analytical Instruments GmbH, FMX46, Kleve, Germany). The pilot scale experiment process is shown in Figure S1. The detailed data processing is shown in Text S1.

3. Results and Discussion

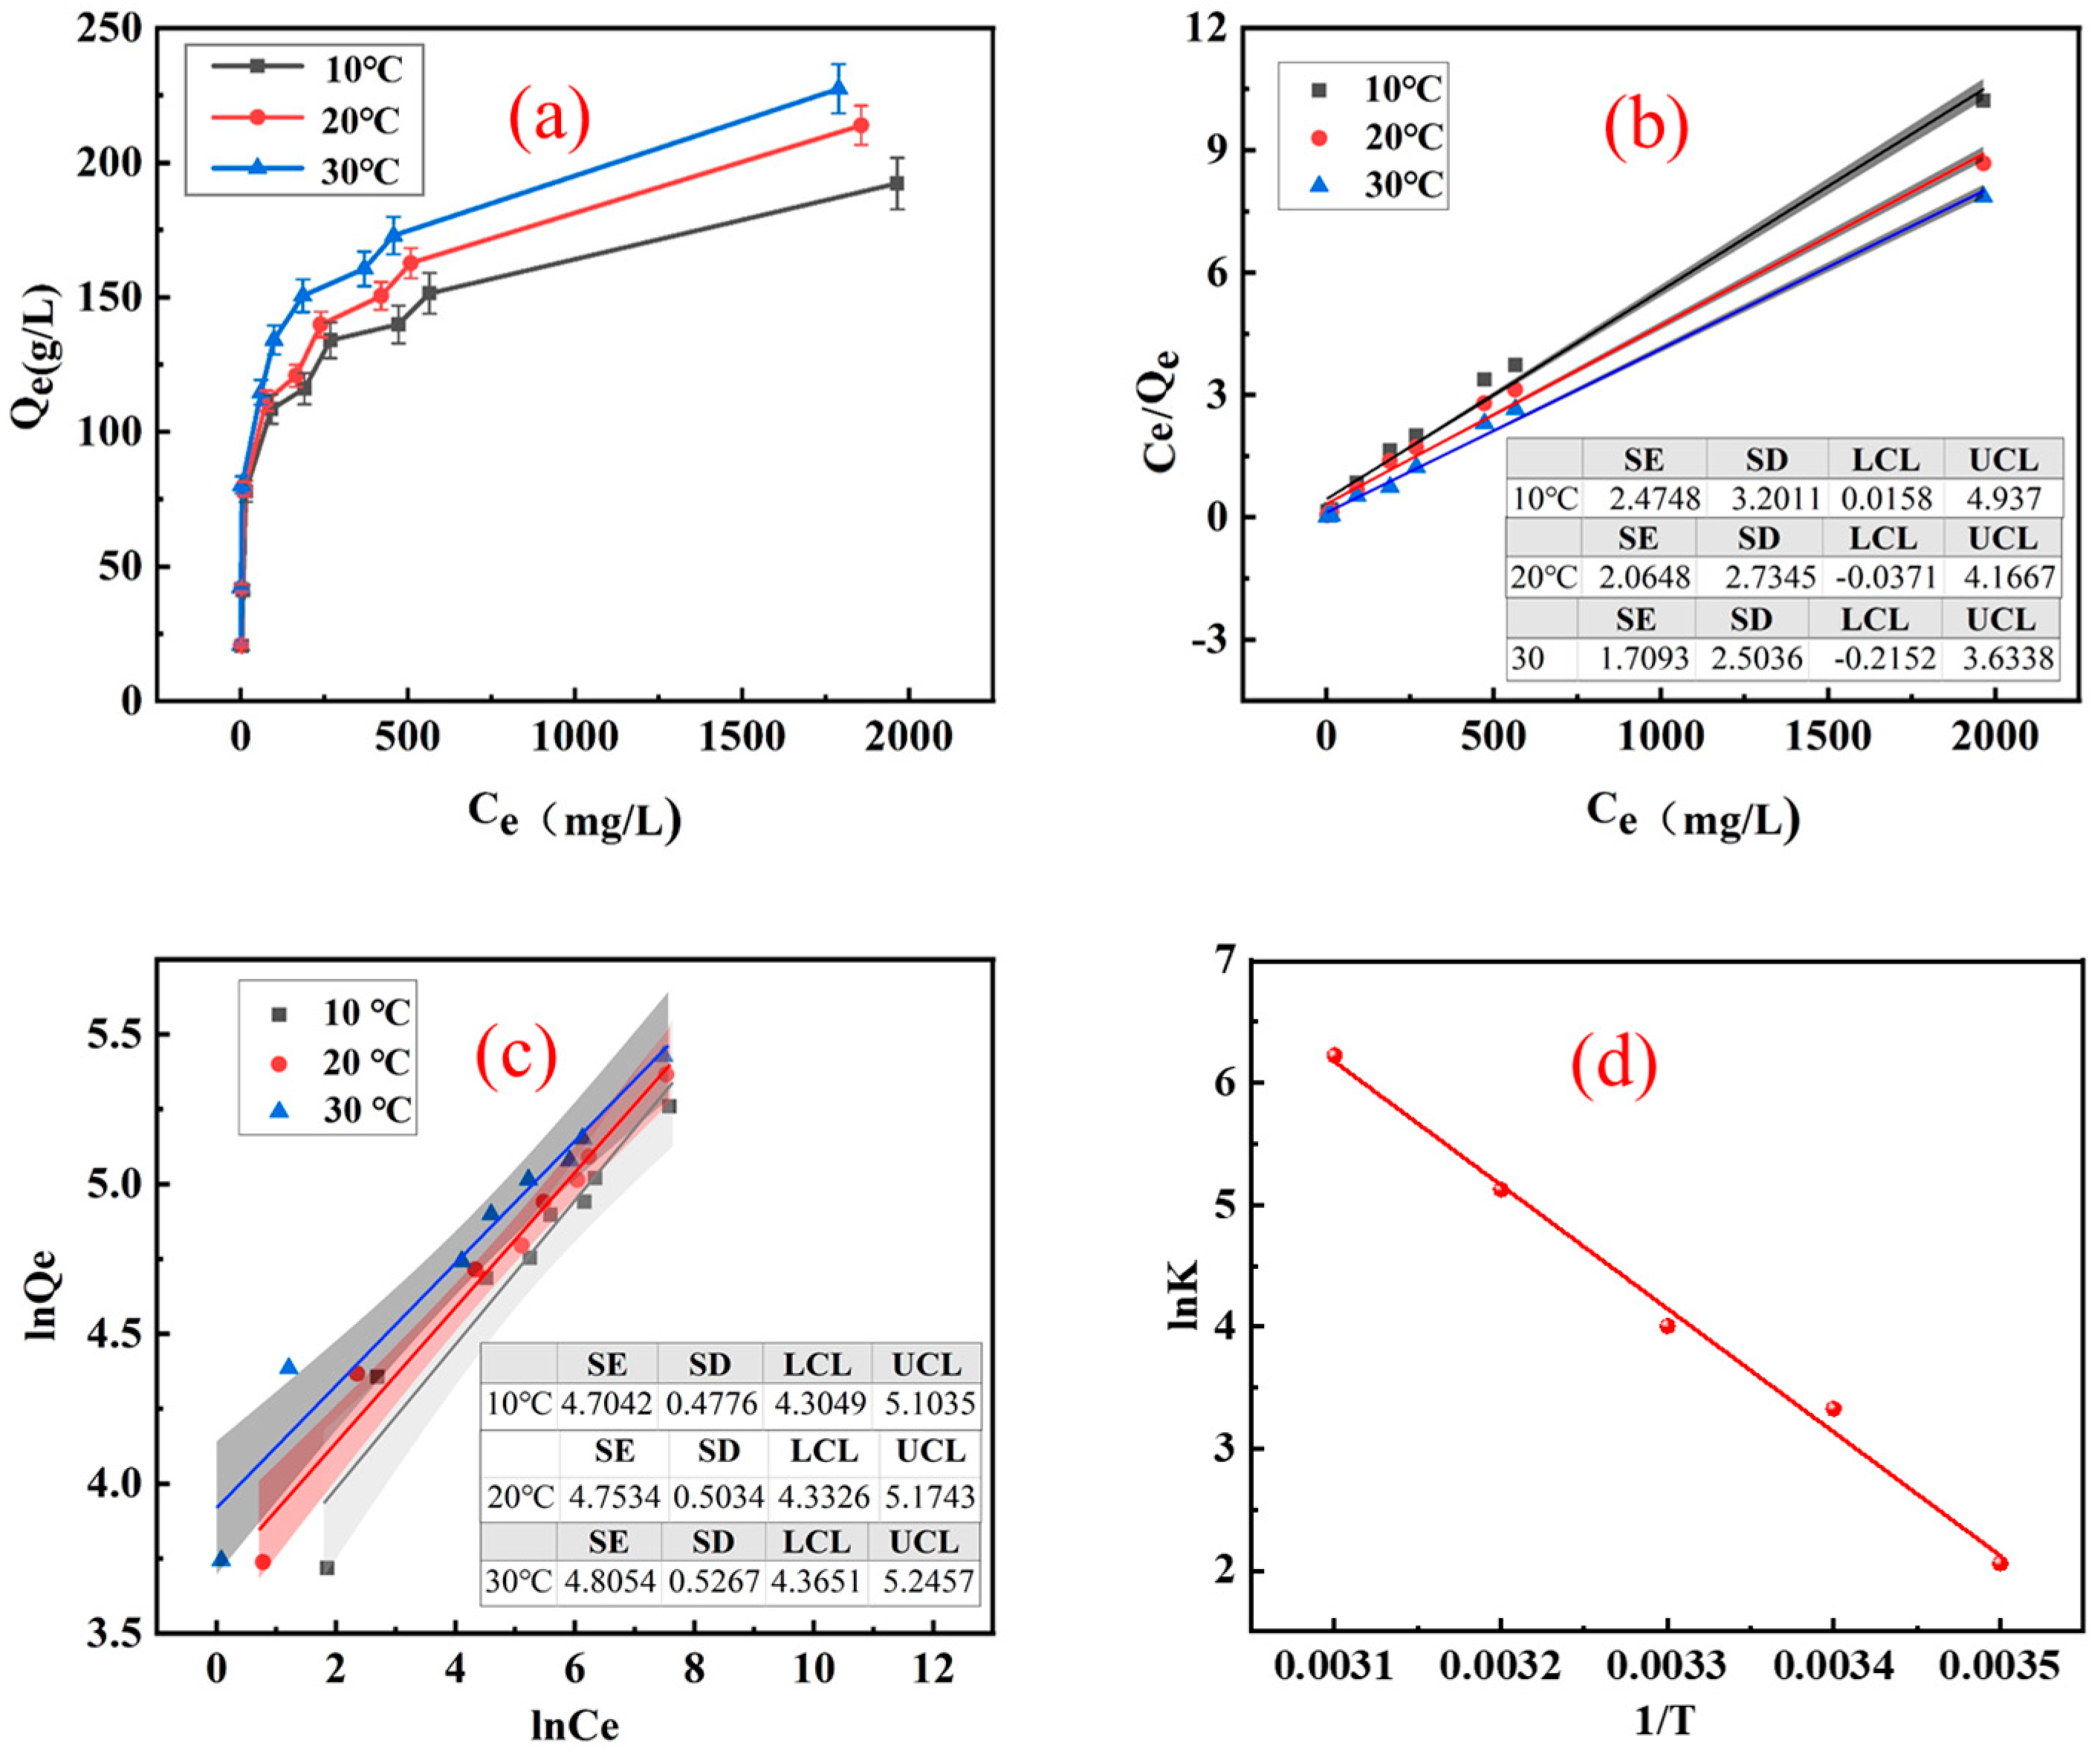
3.1. Adsorption Performance of Resin

After undergoing two stages of filtration, the untreated water in the conditioning tank is conveyed to the resin adsorption system at a flow rate of 10 BV/h (2.5 m3/h). The Cu2+ in the wastewater is concentrated on the ion exchange resin. This entire process takes place at the current water treatment station, which is situated at an altitude of 4500 m, and the water temperature varies within the range of 5–18 °C. Following adsorption, the liquid is moved to the wastewater tank and then circulated back into the conditioning tank by a submersible pump, establishing an internal circulation loop without any external discharge.
Following the completion of the adsorption experiment, the data was collated to create the adsorption performance curve, as illustrated in Figure 1a. The results demonstrated that the single-tower ion exchange resin exhibited a Cu2+ adsorption efficiency of 97.2%, and the concentration of copper in the exhausted liquid is negligible, which achieves the deep removal of copper in wastewater.
Furthermore, a dynamic adsorption experiment was conducted and the results are presented in Figure 1b,c. The saturated adsorption capacity of the resin for Cu2+ in the wastewater was calculated to be as high as 174.6 g/L, which demonstrates a significant enrichment potential. Furthermore, the adsorption dynamics of other impurity elements in the wastewater were also analyzed, and the results of the saturation adsorption capacity comparison are presented in Table S3. It is evident that the D402 resin exhibits a relatively low adsorption capacity for other impurity cations, yet it demonstrates a high degree of selectivity.
To assess the adsorption process of Cu2+ on the resin, the experimental data were analyzed using the proposed first-order and second-order kinetic models. The analysis results are shown in Figure 1d. Please refer to Equations (1) and (2) for the proposed first-order and second-order kinetic models, respectively.
l n ( Q e Q t ) = l n Q e k 1 t
t Q t = 1 k 2 Q e 2 + t Q e
Table 2 shows the proposed primary and secondary kinetic rate constants, k1 (h−1) and k2 (L·g−1·h−1), respectively. The adsorption capacity at equilibrium, qe (g/L), and the adsorption capacity at time t (h), Qt (g/L), are also shown.
To gain further insight into the relationship between the adsorbent and the adsorbed substance, as well as the underlying mechanism, the equilibrium concentration of Cu2+ after adsorption was fitted to the adsorption capacity under specific temperature conditions. We employed the Langmuir and Freundlich models. As illustrated in Figure 2b,c, the kinetic data were integrated with the resin. As illustrated in the figure, the correlation coefficient of the proposed primary kinetic model is higher than that of the proposed secondary kinetic model, with an R2 of 0.9939. Accordingly, the proposed primary kinetic model is the optimal choice for forecasting the kinetic process of this adsorption. This indicates that the adsorbent is copper ions from copper-containing wastewater with a higher concentration, and the adsorption process is not controlled by active site adsorption. It is possible that monolayer adsorption may exist. Furthermore, the proposed one-level kinetic model can be used to describe external or internal diffusion of the adsorbate on the adsorbent in certain instances [24,25]. The Langmuir model and Freundlich model are shown in Texts S2 and S3.
Figure 2a illustrates the isotherm plot of Cu2⁺ adsorption by the resin. As the initial concentration of Cu2+ increases, the equilibrium adsorption amount rises. Similarly, as temperature rises, the equilibrium adsorption amount rises. The elevated temperature facilitates the movement of Cu2⁺, effectively reducing the diffusion resistance and increasing the likelihood of contact between Cu2⁺ and the active sites on the resin surface [26]. This increases the equilibrium adsorption amount. Figure 2b,c illustrate the linear fitting plots and statistical analysis results of the Langmuir and Freundlich models, respectively, and the shaded areas in Figure 2b,c represent the error bands of the Langmuir and Freundlich models, with the specific fitting parameters presented in Table 3. The linear correlation coefficients of the Langmuir model at 10 °C, 20 °C, and 30 °C are 0.989, 0.985, and 0.988, respectively. The corresponding coefficients for the Freundlich model are 0.896, 0.896, 0.988, 0.896, 0.896, and 0.896, respectively. The latter coefficients are also 0.896 and 0.988, respectively. The results show that the Langmuir model is more compatible for describing the adsorption process of copper ions adsorbed by the resin, indicating that the adsorption is more inclined to monolayer adsorption.
In the Langmuir model, the adsorption constant KL ranges from 0 to 1 and increases with increasing temperature. This indicates that increasing the temperature is favorable for adsorption, which is consistent with the experimental results. Furthermore, the linear correlation coefficients of the Freundlich model fits were also relatively high, indicating that the resin adsorption mechanism for Cu2+ has additional mechanisms of action besides monolayer adsorption.
The Gibbs free energy change (ΔG) in adsorption thermodynamics is a critical indicator of whether the adsorption process is spontaneous [16]. Similarly, the enthalpy change (ΔH) can be used to ascertain whether the adsorption is adsorptive or exothermic. The entropy change (ΔS) can be used to determine the degree of disorder. If the Gibbs free energy change is greater than zero, the adsorption process cannot proceed spontaneously. Conversely, when the Gibbs free energy change is less than zero, the adsorption process can proceed spontaneously [27]. When the enthalpy change is positive, the process can be classified as a heat-absorbing reaction. An increase in temperature will facilitate the adsorption process. Conversely, when the enthalpy change is negative, the process is exothermic. Reducing the temperature will improve the adsorption process. In accordance with Equations (3) and (4), the Gibbs free energy change (∆G), enthalpy change (∆H), and entropy change (∆S) can be calculated in sequence.
Δ G = R T l n K
L n K = Δ S R Δ H R T
The variables ∆G (kJ·mol−1), ∆H (kJ·mol−1), and ∆S (kJ·mo−1·K−1) represent the Gibbs free energy, enthalpy change, and entropy change, respectively. The adsorption temperature is represented by T (K), while K is the thermodynamic equilibrium constant.
By plotting ln(Qe/Ce) and Ce, we can obtain lnK through an intercept calculation. The resulting fitting plot of lnK versus 1/T is shown in Figure 2d. We can then calculate the values of ∆H and ∆S using the Gibbs free energy variation formula and the relationship between lnK and 1/T. Please refer to Table 4 for the data obtained from the calculations. As shown in Table 4, the Gibbs free energy change (ΔG) is less than zero for all three temperature conditions. This indicates that the adsorption process of Cu2+ on the resin is spontaneous and that the degree of spontaneity increases with temperature. The positive value of ∆H indicates that the adsorption process is heat-absorbing. As the temperature is increased, the reaction is favored, which provides further confirmation of the accuracy of the experimental results. While the change in entropy is positive, indicating that the adsorption process is entropy-increasing, the system’s disorder increases as the process progresses.

3.2. Desorption

We used 5% sulfuric acid as the eluent agent with a flow rate of 2 BV/h (0.5 m3/h); this enabled the enrichment of Cu2+ in the resin and its desorption into the liquid in the thick liquid tank or desorption tank for recycling. The entire process is conducted at an elevation of 4500 m at the existing water treatment station in the outdoor space. The eluent agent temperature is maintained within a range of 8–14 °C. The initial two batches were produced by immersing the eluent agent in the resin tank for a period of five hours. The remaining batches were obtained through the resolving cycle, which was conducted in the resolving cycle tank using the resolving cycle pump. Please refer to Figure S2 for the experimental data. The ion exchange resin demonstrated an impressive desorption capacity of 165.6 g/L, eluent 41.14 kg of Cu2+ with a desorption rate of 94.2%. The results demonstrate that the ion exchange resin exhibits excellent desorption performance. The solution will provide sufficient stock for the next stage of nanofiltration and electrowinning experiments.
In addition, the dynamic analysis of other impurity elements in the wastewater revealed valuable insights, as presented in Table S4. The D402 resin demonstrates a high desorption capacity for other impurity cations, with the majority of them eluted into the eluate. This enhances the reusable performance of the resin by eliminating the presence of excessive impurity cations, preventing the generation of excessive hydroxide colloid during regeneration with NaOH. This avoids blockage of the pore channels, ensuring optimal secondary adsorption capacity. But with the increase in adsorption–desorption cycles, the adsorption capacity of resin to copper ions will be reduced and the amount of resin will be lost. During the experiment, the resin desorption and regeneration should be sufficiently regenerated to ensure the stability of adsorption and copper removal.

3.3. Nanofiltration

The nanofiltration experimental pilot equipment is composed of the following principal components: a central control display, a high-pressure pump, a nanofiltration membrane, a concentrated water tank, a produced water tank, and a portion of the pipeline. The frequency of the high-pressure pump is regulated by the frequency converter. Prior to initiating the nanofiltration experiment, it is imperative that the raw water within the nanofiltration system undergoes a complete operational cycle. The eluent liquid with a low copper concentration was introduced to the raw water tank of the nanofiltration system, with a volume of 200 L. The pressure after the membrane was regulated by modulating the frequency of the high-pressure pump and the opening of the valve situated downstream of the membrane, thereby controlling the flow rate of the fresh solution. The entire operation was conducted at an altitude of 4500 m at the existing water treatment station, with the temperature of the outdoor area exhibiting fluctuations within the range of 1–9 °C. Subsequently, the water was pumped through the high-pressure pump, and the pressure after the membrane was adjusted by a frequency converter to maintain optimal control. During the experimental procedure, the pressure readings after membrane adjustment were 2 MPa, 4 MPa, and 5 MPa. The influence of pressure on nanofiltration efficiency is shown in Figure 3. The operating parameters and experimental data are presented in Tables S5–S7.
As the duration of the concentration process was extended, the temperature of the concentrated water and the temperature of the produced water increased. This phenomenon can be attributed to the retention of copper ions by the nanofiltration membrane, which is driven by the action of a high-pressure difference. The concentration of the concentrated liquid was maintained at the same level both before and after the concentration process. As the pressure after the membrane increased, the concentration of Cu2+ exhibited a gradual increase in multiples of 2.32, 2.51, and 2.79 times, respectively, reaching 16.59 g/L, 24.06 g/L, and 3.60 g/L. The results indicate that increasing the pressure after the membrane is advantageous for the concentration of copper. Specifically, the concentration multiples of Cu2+ increased by 2.32 times, 2.51 times, and 2.79 times, respectively, when the pressure was increased. Moreover, the flow rate of produced water increased in conjunction with the rise in pressure behind the membrane, significantly reducing the duration of nanofiltration and enhancing its efficiency.

3.4. Electrowinning

The electrowinning experimental pilot equipment is comprised of a central control display, a circulating pump, a discharge pump, a device for regulating current and voltage, an electrowinning tank, and a portion of the pipeline. The frequency of the circulating pump is regulated by a frequency converter, and the entire operation is conducted in the indoor workshop of the existing water treatment station at an altitude of 4500 m. The indoor temperature fluctuates between 4 and 11 degrees Celsius. The concentrated liquid, with a volume of 1550 L, was transferred via pumping into the electrowinning tank. Subsequently, the circulating pump was initiated, enabling the electrowinning liquid to complete the circulation process within the interior. It is now necessary to activate the current-voltage startup device in order to commence the electrowinning process and to take samples at regular intervals. The experiment employs a constant current mode with the objective of achieving high-purity copper plate and enhancing current efficiency. A principal strategy for success is the gradual reduction in the current intensity employed in the electrowinning method. The initial concentration of copper in the electrowinning solution was 16.50 g/L, and the final concentration of copper in the solution was 5.37 g/L. For a comprehensive account of the operational parameters utilized in the electrowinning process, along with the associated experimental data, please direct your attention to Table S8.
The data demonstrate a gradual decline in Cu2+ concentration with an increase in electrowinning time. Once the experiment had reached its conclusion, the five copper plates were removed and their collective mass was determined to be 18.73 kg. Moreover, the theoretical total of 18.88 kg of copper plates should be accumulated in accordance with the electrochemical equivalent coefficients calculation. The physical object is depicted in Figure S3, and the current efficiency is 99.2%. The resulting copper product was found to exhibit a copper grade of 99.997%. The electrowinning device represents an effective solution for improving the quality of copper products and enhancing energy utilization, with promising applications in a range of industrial sectors.
As the duration of the electrowinning process is extended, the concentration of copper in the electrowinning solution is observed to diminish. This results in a depletion of the solution in the vicinity of the cathode. If the current output is maintained at a high level, it will result in an increase in energy consumption and the generation of black copper powder. Furthermore, the capacity of impurity cations to vie for electrons is amplified, resulting in a reduction in the copper grade due to deposition on the cathode. Accordingly, the implementation of a mode of gradually decreasing current intensity has been demonstrated to be an effective method for enhancing the purity of the copper cathode.
Moreover, the acidity of the electrowinning solution demonstrated a gradual increase with the prolongation of the electrowinning time. Once the electrowinning process was complete, the acidity of the lean solution was determined to be 1.1378 mol/L (0.9718 mol/L for the initial electrowinning solution). This was due to the precipitation of oxygen, which occurred primarily at the anode during the electrowinning of the concentrated solution. This reaction resulted in a gradual decrease in the concentration of hydroxyl ions (OH) in the solution. Furthermore, the degree of hydrolysis of water molecules was augmented, which consequently augmented the quantity of H+ in the solution. This process enables the recycling of the electrowinning solution, which can then be employed as an eluent solution. Moreover, Table S9 presents a breakdown of the electrical energy consumption. It is evident that as the current intensity diminishes, the average electrical energy consumption also declines. The calculation demonstrates that the production of one ton of copper necessitates 7676.45 kW·h of electrical energy, which represents a relatively low cost when viewed in the context of the advantages of hydropower in the plateau.

3.5. Regeneration

Once the regeneration of the resolved resin was complete, the 5% sodium hydroxide solution was used to carry out the adsorption work. The entire process was conducted at the existing water treatment station, located at an altitude of 4500 m. The water temperature remained within a range of 1–8 °C throughout. The second set of adsorption conditions was identical to the first, with an adsorption flow rate of 10 BV/h (2.5 m3/h). The resulting adsorption performance curve is presented in Figure 4. The maximum adsorption capacity of the resin for Cu2+ in the second adsorption was calculated to be 170.36 g/L, which was slightly smaller than that of the first adsorption (174.6 g/L). Furthermore, it was observed that the utilization rate of the resin in the second adsorption could reach 97.6%. The resin has excellent reusability, which confirms its cost-effective durability.

3.6. Adsorption Mechanism Analysis

Figure 5 illustrates the scanning electron microscope images of the new resin, saturated resin, and resolved resin. As illustrated in Figure 5a–c, the morphology of the resin in its three states is essentially similar, displaying a spherical crystal structure with a relatively smooth surface. As illustrated in Figure 5d, the resin’s surface displays a honeycomb-like pore structure upon closer examination. This observation indicates that the resin possesses a high specific surface area and substantial potential for Cu2⁺ adsorption, as previously documented in reference. Furthermore, as illustrated in Figure 5e, the surface of the saturated resin is relatively smooth, and the pore channels are occupied by small molecules. This is caused by Cu2+ occupying the pore channels, indicating that Cu2+ is effectively enriched on the resin surface. Figure 5f illustrates the resolved resin. It is evident that the surface of the resin has been restored to its original morphology, and the large void structure is visible. Furthermore, the cyclic regeneration experiments demonstrated that the regenerated resin has effectively restored the adsorption performance of the brand-new resin.
According to Figure 6, the new resin exhibits a strong and broad absorption peak at 3386.27 cm−1, which is the stretching vibration peak of O-H or N-H. The absorption peak at 1588.66 cm−1 may be caused by the vibration of the benzene ring skeleton [28]. The bending vibrations of the methyl and methylene groups are 1405.43 cm−1 and 1326.34 cm−1. The absorption peaks of 1130.42 cm−1 and 1016.81 cm−1 are C-O bond stretching vibrations. The peak intensity and gap width of the absorption peak of copper-saturated resin at 3432.70 cm−1 are weakened, which may be due to the substitution of some O-H or N-H bonds in the resin by Cu-O and Cu-N bonds, thereby affecting the dipole moment change. The new absorption peak at 582.25 cm−1 may be the stretching vibration peak of the Cu-O bond. The absorption peaks at 1219.60 cm−1 and 1159.60 cm−1 are the vibration peaks of Cu-N [19]. From the infrared analysis results, it can be inferred that the new resin is composed of aromatic alcohols or amines containing benzene rings. It adsorbs copper ions through ion exchange/chelation, and the infrared absorption peaks of the desorption resin and the new resin are in good agreement, demonstrating good structural stability.
To investigate the adsorption mechanism of adsorbent materials, XPS energy spectrum analysis was performed on the materials before adsorption, after adsorption saturation, and after desorption. According to Figure 7, a binding energy peak of Cu2p3 appeared in the material after copper adsorption, indicating that Cu2+ has been adsorbed into the resin material. The peak area of Na1s in the resin before adsorption accounts for 7.31%, and the peak area of N1s is 5.78% [29,30]. However, there was no Na1s binding peak observed in the resin that was saturated with adsorption. This may be due to the stronger affinity between Cu2+ and the resin compared to Na+, where Cu2+ in the solution binds to the resin and replaces Na+. As shown in Figure 7, there is no binding energy peak of Cu2p3 in the resin after analysis, indicating that the adsorbed copper ions have been completely resolved during the analysis process. The FTIR and XPS results indicate that the resin contains -OH and -NH2. The lone pair electrons on O and N atoms can form coordination bonds with copper ions to form stable complexes, thereby adsorbing copper ions onto the resin.

4. Conclusions

A series of pilot experiments were conducted to validate the combined ion exchange-desorption-nanofiltration-cyclonic electrode deposition process. A series of engineering parameters were obtained, including a maximum adsorption capacity of 174.6 g/L and a desorption capacity of 165 g/L for the ion exchange resin. It is found that the adsorption process conforms to the first-order kinetic model, and is an endothermic and spontaneous process, and the higher the temperature, the greater the degree of spontaneity. As the membrane pressure increases, the concentration efficiency can be improved. To illustrate, at a pressure of 5 MPa, the concentration of 12.91 g/L Cu2+ can be concentrated to 35.96 g/L in 40 min. The current efficiency of swirl electrowinning was 99.2% and the grade of the copper product was 99.997%. The electric energy consumption was found to be 7676.5 kW·h for each ton of copper produced. The resin capacity in secondary adsorption was determined to be 170.4 g/L, with a secondary utilization rate of 97.6%. This combination process is suitable for copper ion resource utilization in high-altitude and low-temperature areas compared to other processes and can produce high-grade copper products. This process is applied to 30,000 m3 of copper-containing wastewater in a certain enterprise, generating an economic benefit of 221,000 yuan per day. These findings will reinforce the rationale for future engineering applications and serve as a valuable point of reference for similar processes.

Supplementary Materials

The following supporting information can be downloaded at: https://www.mdpi.com/article/10.3390/w17060856/s1. Text S1. Data processing formula; Text S2. Langmuir Model; Text S3. Freundlich Model; Table S1. Economic benefit balance of two kinds of copper products; Tablr S2. Characteristics and properties of the D402 resin; Table S3. Comparison of adsorption data of major elements; Table S4. Comparison of analytic capacity and analytic rate of each element; Table S5. The pressure behind the membrane is 2 MPa; Table S6. The pressure behind the membrane is 4 MPa; Table S7. The pressure behind the membrane is 5 MPa; Table S8. Electrodeposition operation parameters and data; Table S9. Electrical energy consumption accounting; Figure S1. Pilot experiment process flow; Figure S2. Desorption experimental data; Figure S3. Cathode copper products obtained on site. References [31,32,33] are citied in the Supplementary Materials.

Author Contributions

X.Y.; methodology, J.W.; investigation, C.Z.; writing—review and editing, Y.M.; validation. All authors have read and agreed to the published version of the manuscript.

Funding

This research was funded by the Program for the National Key Research and Development Program of China, grant number 2021YFB3801403.

Data Availability Statement

Data are contained within the article.

Conflicts of Interest

Author Jianhui Wu was employed by the company Zijin Mining Group Company Limited. Author Yun Meng was employed by the company Sainz Environmental Protection Co., Ltd. The remaining authors declare that the research was conducted in the absence of any commercial or financial relationships that could be construed as a potential conflict of interest.

References

  1. Tian, S.; Liu, Z.W.; Mao, Q.; Ye, H.; Tian, C.; Zhu, Y.; Zhang, L. Leaching characteristics and environmental impact of heavy metals in tailings under rainfall conditions: A case study of an ion-adsorption rare earth mining area. Ecotoxicol. Environ. Saf. 2024, 281, 116642. [Google Scholar] [CrossRef] [PubMed]
  2. Shi, J.; Zhao, D.; Ren, F.; Huang, L. Spatiotemporal variation of soil heavy metals in China: The pollution status and risk assessment. Sci. Total Environ. 2023, 871, 161768. [Google Scholar] [CrossRef] [PubMed]
  3. Cravotta, C.; Trahan, M. Limestone drains to increase pH and remove dissolved metals from acidic mine drainage. Appl. Geochem. 1999, 14, 581–606. [Google Scholar] [CrossRef]
  4. Liu, J.; Wu, J.; Feng, W.; Li, X. Ecological Risk Assessment of Heavy Metals in Water Bodies around Typical Copper Mines in China. Int. J. Environ. Res. Public Health 2020, 17, 4315. [Google Scholar] [CrossRef]
  5. Liu, W.; Sun, J.; Ai, C.; Zhang, R.; Cheng, H.; Chen, Z.; Zhou, H.; Wang, Y. Moderate permeability enhanced microbial community turnover and copper extraction during bioleaching of low-grade copper ores. Sci. Total Environ. 2024, 954, 176563. [Google Scholar] [CrossRef]
  6. Li, Q.; Wang, Y.; Chang, Z.; El Kolaly, W.; Fan, F.; Li, M. Progress in the treatment of copper(II)-containing wastewater and wastewater treatment systems based on combined technologies: A review. J. Water Process Eng. 2024, 58, 104746. [Google Scholar] [CrossRef]
  7. Mulungulungu, G.A.; Mao, T.; Han, K. Efficient removal of high-concentration copper ions from wastewater via 2D g-C3N4 photocatalytic membrane filtration. Colloids Surf. A Physicochem. Eng. Asp. 2021, 623, 126714. [Google Scholar] [CrossRef]
  8. Wu, L.; Garg, S.; Waite, T.D. Electrochemical treatment of wastewaters containing metal-organic complexes: A one-step approach for efficient metal complex decomposition and selective metal recovery. J. Hazard. Mater. 2024, 466, 133526. [Google Scholar] [CrossRef] [PubMed]
  9. Xiang, T.; Liu, X.; Wang, Z.; Zeng, Y.; Deng, J.; Xiong, W.; Cheng, M.; Liu, J.; Zhou, C.; Yang, Y. Boosting active hydrogen generation via ruthenium single atoms for efficient electrocatalytic nitrate reduction to ammonia. Appl. Catal. B Environ. Energy 2025, 365, 124943. [Google Scholar] [CrossRef]
  10. Deng, J.; Chen, J.; Zeng, Y.; Yang, H.; Li, F.; Song, B.; Yang, Y.; Wang, Z.; Zhou, C.; Wang, W. Mechanistic insights into ultrafast degradation of electron-rich emerging pollutants by waste cyanobacteria resource utilization. Chem. Eng. J. 2024, 499, 155918. [Google Scholar] [CrossRef]
  11. Al-Jabari, M. Kinetic models for adsorption on mineral particles comparison between Langmuir kinetics and mass transfer. Environ. Technol. Innov. 2016, 6, 27–37. [Google Scholar] [CrossRef]
  12. Ran, J.; Wu, L.; He, Y.; Yang, Z.; Wang, Y.; Jiang, C.; Ge, L.; Bakangura, E.; Xu, T. Ion exchange membranes: New developments and applications. J. Membr. Sci. 2017, 522, 267–291. [Google Scholar] [CrossRef]
  13. Afridi, M.N.; Lee, W.-H.; Kim, J.-O. Effect of phosphate concentration, anions, heavy metals, and organic matter on phosphate adsorption from wastewater using anodized iron oxide nanoflakes. Environ. Res. 2019, 171, 428–436. [Google Scholar] [CrossRef] [PubMed]
  14. Gao, J.; Zhang, L.; Liu, S.; Liu, X. Enhanced adsorption of copper ions from aqueous solution by two-step DTPA-modified magnetic cellulose hydrogel beads. Int. J. Biol. Macromol. 2022, 211, 689–699. [Google Scholar] [CrossRef] [PubMed]
  15. Ahmad, N.N.R.; Ang, W.L.; Teow, Y.H.; Mohammad, A.W.; Hilal, N. Nanofiltration membrane processes for water recycling, reuse and product recovery within various industries: A review. J. Water Process Eng. 2022, 45, 102478. [Google Scholar] [CrossRef]
  16. Wang, C.; Sun, M.; Wang, X.; Zhang, X.; Zhao, Y.; Huo, M. Enhanced resource recovery from wastewater using electrochemical-osmotic system with nanofiltration membranes. Resour. Conserv. Recycl. 2022, 186, 106555. [Google Scholar] [CrossRef]
  17. Liu, Z.; Guo, X.; Xu, Z.; Tian, Q. Recent advancements in aqueous electrowinning for metal recovery: A comprehensive review. Miner. Eng. 2024, 216, 108897. [Google Scholar] [CrossRef]
  18. Duyen, L.T.; Bac, B.H. Adsorption–desorption behavior of halloysite clay for Cu2+ ions and recovery of copper by electrodeposition method. Desalination Water Treat. 2024, 317, 100207. [Google Scholar] [CrossRef]
  19. Sun, W.; Zheng, Y.; Wang, W.; Feng, X.; Zhu, X.; Zhang, Z.; Hou, H.; Ge, L.; Lv, H. Geochemical Characteristics of Primary Halos and Prospecting Significance of the Qulong Porphyry Copper–Molybdenum Deposit in Tibet. Minerals 2023, 13, 333. [Google Scholar] [CrossRef]
  20. Dai, J.; Qu, X.; Song, Y. Porphyry Copper Deposit Prognosis in the Middle Region of the Bangonghu–Nujiang Metallogenic Belt, Tibet, Using ASTER Remote Sensing Data. Resour. Geol. 2018, 68, 65–82. [Google Scholar] [CrossRef]
  21. Arief, V.O.; Trilestari, K.; Sunarso, J.; Indraswati, N.; Ismadji, S. Recent Progress on Biosorption of Heavy Metals from Liquids Using Low Cost Biosorbents: Characterization, Biosorption Parameters and Mechanism Studies. CLEAN—Soil Air Water 2008, 36, 937–962. [Google Scholar] [CrossRef]
  22. Dávila-Guzmán, N.E.; de Jesús Cerino-Córdova, F.; Soto-Regalado, E.; Rangel-Mendez, J.R.; Díaz-Flores, P.E.; Garza-Gonzalez, M.T.; Loredo-Medrano, J.A. Copper Biosorption by Spent Coffee Ground: Equilibrium, Kinetics, and Mechanism. CLEAN—Soil Air Water 2013, 41, 557–564. [Google Scholar] [CrossRef]
  23. Wang, L.; Chen, Y.; Tang, J.; Lü, P.; Luo, M.; Wang, H.; Chen, W.; Leng, Q. LA-ICP-MS Zircon U-Pb Dating of Intermediate-Acidic Intrusive Rocks and Molybdenite Re-Os Dating from the Bangpu Mo (Cu) Deposit, Tibet and its Geological Implication. Acta Geol. Sin.—Engl. Ed. 2012, 86, 1225–1240. [Google Scholar] [CrossRef]
  24. Zeng, X.; Huang, J. Anisole-modified hyper-cross-linked resins for efficient adsorption of aniline from aqueous solution. J. Colloid Interface Sci. 2020, 569, 177–183. [Google Scholar] [CrossRef]
  25. Wang, J.; Guo, X. Adsorption kinetic models: Physical meanings, applications, and solving methods. J. Hazard. Mater. 2020, 390, 122156. [Google Scholar] [CrossRef]
  26. Xu, J.; Wang, L.; Zhu, Y. Decontamination of Bisphenol A from Aqueous Solution by Graphene Adsorption. Langmuir 2012, 28, 8418–8425. [Google Scholar] [CrossRef]
  27. Wang, J.; Lei, S.; Liang, L. Preparation of porous activated carbon from semi-coke by high temperature activation with KOH for the high-efficiency adsorption of aqueous tetracycline. Appl. Surf. Sci. 2020, 530, 147187. [Google Scholar] [CrossRef]
  28. Samadi, N.; Ansari, R.; Khodavirdilo, B. Removal of Copper ions from aqueous solutions using polymer derivations of poly (styrene-alt-maleic anhydride). Egypt. J. Pet. 2017, 26, 375–389. [Google Scholar] [CrossRef]
  29. Ling, C.; Liu, F.; Pei, Z.; Zhang, X.; Wei, M.; Zhang, Y.; Zheng, L.; Zhang, J.; Li, A.; Xing, B. Citric Acid Enhanced Copper Removal by a Novel Multi-amines Decorated Resin. Sci. Rep. 2015, 5, 9944. [Google Scholar] [CrossRef] [PubMed]
  30. Qiu, H.; Ling, C.; Yuan, R.; Liu, F.; Li, A. Bridging effects behind the coadsorption of copper and sulfamethoxazole by a polyamine-modified resin. Chem. Eng. J. 2019, 362, 422–429. [Google Scholar] [CrossRef]
  31. Lima, E.C.; Hosseini-Bandegharaei, A.; Moreno-Piraján, J.C.; Anastopoulos, I. A critical review of the estimation of the thermodynamic parameters on adsorption equilibria. Wrong use of equilibrium constant in the van’t hoof equation for calculation of thermodynamic parameters of adsorption. J. Mol. Liq. 2019, 273, 425–434. [Google Scholar] [CrossRef]
  32. Zhai, W.; He, J.; Han, P.; Zeng, M.; Gao, X.; He, Q. Adsorption mechanism for tetracycline onto magnetic fe3o4 nanoparticles: Adsorption isotherm and dynamic behavior, location of adsorption sites and interaction bonds. Vacuum 2022, 195, 110634. [Google Scholar] [CrossRef]
  33. Chang, J.; Shen, Z.; Hu, X.; Schulman, E.; Cui, C.; Guo, Q.; Tian, H. Adsorption of tetracycline by shrimp shell waste from aqueous solutions: Adsorption isotherm, kinetics modeling, and mechanism. ACS Omega 2020, 5, 3467–3477. [Google Scholar] [CrossRef]
Figure 1. The adsorption performance curve (a); dynamic adsorption curve (b,c); and pseudo−first−order and second−order kinetic fitting diagrams (d).
Water 17 00856 g001
Figure 2. Adsorption isotherm (a); Langmuir model (b); Freundlich model (c); fitting graph of ln K and 1/T (d).
Water 17 00856 g002
Figure 3. The influence of pressure on nanofiltration efficiency.
Water 17 00856 g003
Figure 4. Resin regeneration adsorption property curve.
Water 17 00856 g004
Figure 5. SEM images, new resin (a,d), saturated resin (b,e), desorption resin (c,f).
Water 17 00856 g005
Figure 6. Fourier Transform infrared spectrum of new resin, saturated resin, and desorption resin.
Water 17 00856 g006
Figure 7. XPS of Na type new resin, saturated resin and desorption resin.
Water 17 00856 g007
Table 1. Metal concentrations of the leaching wastewater.
ElementCuCaMgAlFe
Concentration (mg/L)100150672559
Table 2. Quasi-first-order and quasi-second-order kinetic parameters.
Kinetic ModelParametersValue
Quasi-first-order kinetic equationsk1 (h−1)−0.00827
Qe (g/L)174.6
R20.9939
SE4.98965
SD0.10999
CLC4.98282
UCL4.99647
quasi-second-order kinetic equationsk2 (L·g−1·h−1)−0.018
Qe (g/L)174.6
R20.6406
SE1.0887
SD0.23957
CLC1.07384
UCL1.10357
Table 3. Isotherm model fitting parameters.
T (K)Qe (mg/g−1)Langmuir ModelFreundlich Model
Qm (mg/g−1)KLR2nKFR2
283.15192.2195.30.0120.9893.26522.690.896
293.15213.8216.90.0130.9853.63230.270.940
303.15227.5229.90.0150.9884.12240.850.947
Table 4. Adsorption thermodynamic parameter.
T (K)∆G (kJ·mol−1)∆H (kJ·mol−1)∆S (kJ·mol−1·K−1)R2
283.15−4.84780.9780.3010.971
293.15−8.108
303.15−10.01
Disclaimer/Publisher’s Note: The statements, opinions and data contained in all publications are solely those of the individual author(s) and contributor(s) and not of MDPI and/or the editor(s). MDPI and/or the editor(s) disclaim responsibility for any injury to people or property resulting from any ideas, methods, instructions or products referred to in the content.

