Article

Study on the Influence of Relative Chord Length and Frequency of Flapping Hydrofoil Device on Hydrodynamic Performance and Bank Slope Scour

College of Mechanical Engineering, Zhejiang University of Technology, Hangzhou 310023, China
*
Author to whom correspondence should be addressed.
Water 2025, 17(7), 1026; https://doi.org/10.3390/w17071026
Submission received: 12 March 2025 / Revised: 28 March 2025 / Accepted: 30 March 2025 / Published: 31 March 2025
(This article belongs to the Special Issue Ecological Hydraulic Engineering and River Restoration)

Abstract

:
A flapping hydrofoil device is an innovative device for enhancing the hydrodynamics of small rivers. While increasing the flow velocity of the river, it inevitably causes different degrees of scouring on the bank slope. This study aims to find an optimal combination of flapping hydrofoil parameters to maximize the pushing-water performance while minimizing the impact on bank slope scour, which is of great significance for the device’s application and environmental protection. Based on the finite volume method and overlapping dynamic grid technology, this paper selects the maximum bank slope scouring section as the research plane for numerical simulation. In order to expand the scope of application, the relative chord length c* (the ratio of chord length to river channel width) is introduced as a research parameter, and the influence of different relative chord lengths c* and frequencies f on the pushing-water performance of the device and the degree of bank slope scouring is systematically analyzed. The research results show that the near-shore current mean scouring force increases significantly with the increase in f and c*. The pushing-water efficiency will increase with c*, and will gradually increase with the increase in f and then tend to be stable. When c* = 1/2 and f = 2.5 Hz, the pushing-water efficiency reaches 51.04%, but at this time, the impact on bank slope scour is the most serious. When c* is reduced to 1/8, the bank slopes are not scoured even at the maximum frequency f = 2.5 Hz, and the pushing-water efficiency is 24.59% at this time. As c* decreases, the threshold frequency at which scour does not occur on the riverbank increases gradually. In addition, when c* is constant, decreasing f will significantly reduce the scouring force, but will have little effect on pushing-water efficiency. In order to achieve the purpose of this study, the parameters of flapping hydrofoil are recommended to be larger relative chord length and smaller motion frequency combinations.

1. Introduction

In plain river network areas, many rivers have worsened eutrophication and water quality problems due to flat terrain, insufficient hydrodynamics and human activities [1]. Although the traditional engineering solution of adding pump gates can enhance water flow, it is inefficient in shallow water and low-head small river environments, and it is difficult to effectively solve the problem of river water quality deterioration [2]. For example, the highest pumping efficiency of Zhejiang Yanguan pumping station is 76.17%, but when the head is less than 1 m, the pumping efficiency is less than 30% [3]. References [4,5] proposed an underwater flapping hydrofoil device inspired by the movement pattern of the fish tail fin. The maximum average head of the device at a frequency of 1 Hz is only 0.024 m, but the propulsion efficiency exceeds 37%, indicating that it can achieve efficient pumping under low head conditions. The device can be used in different water depths, especially in shallow water conditions with a depth of less than 1.5 m. It can show unique advantages and provide a new way to enhance the hydrodynamics of river networks and improve water quality. However, this type of pumping device based on the principle of reversed Kármán vortex jet will aggravate bank slope scouring due to the influence of vortex flow and affect the stability of bank soil. Based on this actual demand, this study systematically investigates the effects of two critical parameters on both the pushing-water efficiency and bank slope scouring. The goal is to identify an optimal parameter combination that maximizes propulsion performance while minimizing environmental impact.
At present, the research on flapping hydrofoil devices is mostly focused on the optimization of hydrodynamic performance [6,7]. Von Kármán [8] first discovered in the experiment that the reverse Kármán vortex street “jet” phenomenon generated by flapping hydrofoil motion is the direct cause of thrust generation. Freymuth [9] observed through experiments that when positive thrust is generated, the tail vortex shed by the flapping hydrofoil in the flow field presents a reversed Kármán vortex street distribution, which provides a qualitative explanation for the generation of thrust. Since then, scholars have continuously optimized the motion mode and parameter configuration of flapping hydrofoils in order to improve thrust and propulsion efficiency. Chao et al. [10] investigated the thrust and tail vortex structure of flapping hydrofoils under non-sinusoidal motion by numerical methods, and the results showed that the non-sinusoidal mode of motion could improve thrust performance. Song et al. [11] studied based on numerical simulation and found that the propulsive force of flapping hydrofoil is approximately proportional to the square of the oscillation frequency. Ding et al. [12] established a propulsion efficiency estimation model of the flapping hydrofoil, investigated the relationship between the motion parameters such as motion frequency, heaving and pitching amplitude on the thrust of the flapping hydrofoil by numerical methods, and obtained the variation curve of the propulsion efficiency of the flapping hydrofoil with the motion parameters and the optimal propulsion efficiency point. Read et al. [13] conducted tests on the NACA0012 oscillating airfoil to assess its performance in generating high thrust and effective maneuvering. The tests showed that certain combinations of parameters for heave amplitude, Strouhal number, angle of attack and phase angle between heave and pitch produced good thrust. Zhang et al. [14] investigated the effect of different wing tip shapes on the propulsive performance of flapping hydrofoils using numerical methods, and the results showed that the wing tip shape contracted according to an elliptical shape was the best, with an efficiency of 76.5%. Gao et al. [15] investigated the effect of flapping hydrofoil stiffness on the hydrodynamic characteristics, and found that increasing the wing stiffness can effectively reduce the generation of negative thrust, and the low-stiffness flapping hydrofoil has excellent thrust performance at low frequencies. Fan et al. [16] investigated the effect of different aspect ratios on the propulsive performance of the NACA0012 bionic flapping hydrofoil by using the immersed boundary lattice Boltzmann method (IB-LBM). It was found that the propulsive performance firstly increased and then decreased with the increase in the aspect ratio. Ding et al. [17] analyzed the effects of parameters such as chord aspect ratio and chord length on the thrust through experiments, and found that the larger the chord length, the higher the mean thrust coefficient.
Early flapping hydrofoil devices were mainly applied to underwater propulsion [18], gliders [19], and energy harvesting [20,21,22]. Hua et al. [4] proposed the use of flapping hydrofoil devices to pump water to lift the hydrodynamic conditions of a low-lift small river channel, and investigated the effects of different flapping frequencies and incoming flow velocities on the pushing performance, and found that the head of flapping hydrofoil devices is proportional to the square of the motion frequency, and the pumping efficiency is proportional to the incoming flow velocity. The current research on flapping hydrofoil devices focuses on the optimization of pushing water performance of physical parameters, while the influence trend of the device parameters on slope scour has not been fully studied. Therefore, a study of the effect of flapping hydrofoil device on pushing-water performance and bank slope scour at the same time is carried out, which is of great significance for parameter optimization in practical applications.
Regarding bank slope scouring, Xu et al. [23] concluded that scouring by longitudinal water flow parallel to the river bank is the most important factor in bank erosion and morphological changes. Dou et al. [24] found that when the velocity of the water body is greater than the starting velocity of the sediment particles, the sediment particles will be swept into the channel by the water flow. Ma et al. [25] considered the effect of the relative velocity of water flow and pulsation velocity on the initiation of single particles of sediment and carried out a three-dimensional force analysis on a single slope bulk sediment to obtain the sliding initiation conditions of sediment particles on slopes. Wu et al. [26] considered the influence of gravity in the direction of water flow and the slope gradient on sediment initiation and obtained the formula for the initiation velocity of non-uniform sediment particles on the slope. In addition, in terms of the impact resistance of the bank slope soil, Zhang et al. [27] concluded that bank slopes scour when the near-shore current scouring force is greater than the bank slope soil scour resistance. Wang et al. [28] analyzed the relationship between the initiation shear force of sediment on the bank slope and the initiation shear force of sediment on the bed surface and believed that under the same water flow conditions, bank slope sediment is more likely to be initiated and scoured than bed surface sediment.
In this paper, the finite volume method and overlapping mesh technology are used to firstly verify and select the maximum bank slope scour cross-section at a specific installation height as the study plane for numerical simulation, and then introduce the ratio of the chord length of flapping hydrofoil device to the channel width of the non-main tributaries in the plains river network as the relative chord length, and the near-bank current scouring force measures the degree of the scouring degree of the water flow on the bank slope. Numerical simulation is used to investigate the trend of bank slope scour under different relative chord lengths and motion frequencies, and to determine the optimal combination of flapping hydrofoil motion frequency and relative chord length. This study aims to provide solid theoretical support for the practical application of flapping hydrofoil devices and effective protection of bank slopes. It ensures that the motion frequency and chord length of flapping hydrofoils can be scientifically optimized to maintain the efficient pushing-water performance and reduce the scouring effect of the near-shore current on the bank slope in actual operation. Achieve the dual goals of efficient pushing-water and slope protection.

2. Physical Methods

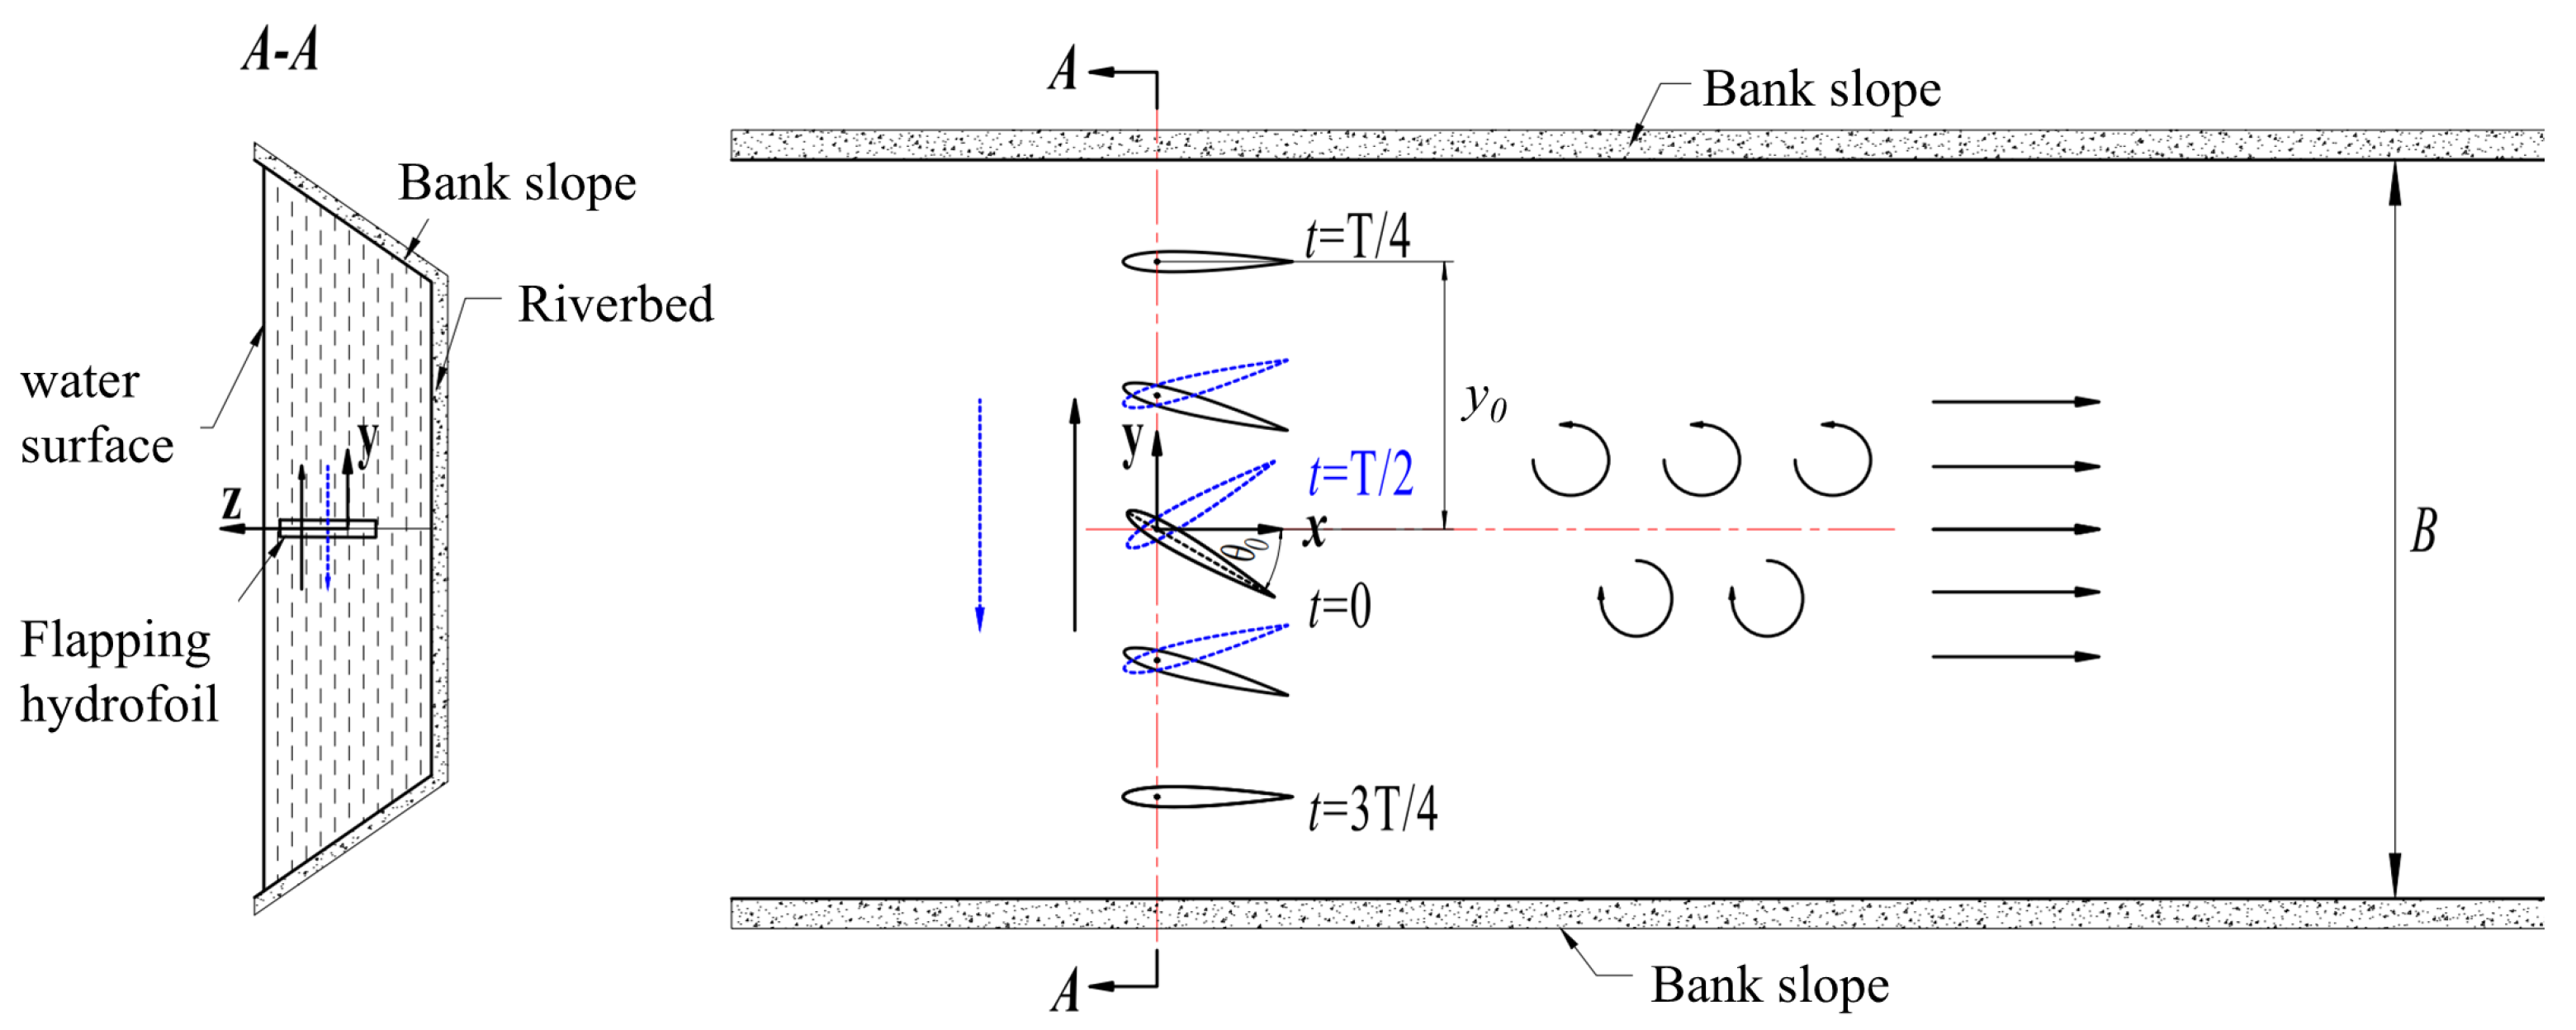
2.1. Modeling and Kinematic Parameters of Flapping Hydrofoils

By controlling the flapping hydrofoil movement, the device produces a number of groups of continuously arranged anti-Kamen vortex street in the water body, forming a ‘jet’, thus generating thrust on the water body, to achieve the purpose of increasing the fluidity of the river water body. Figure 1 shows the schematic motion of the flapping hydrofoil device in a small river channel, where the left side shows a generalized view of a typical river channel section obtained from the literature [29], and the right side shows the motion of the flapping hydrofoil device in the river channel on the study plane.
The flapping hydrofoil couples the two motion modes of heave and pitch [30], and its motion equation is:
y(t) = y0sin(2πft),
θ(t) = θ0sin(2πft + φ),
where y(t) is the heave displacement of the flapping hydrofoil, θ(t) is the pitch angle of the flapping hydrofoil. y0 is the heave amplitude, θ0 is the pitch amplitude, φ is the phase lag between heave and pitch motion. In this paper take y0 = 0.5c, where c is the flapping hydrofoil chord length, take c = 0.6 m, θ0 = π/6, φ = π/2, and the distance from the center of rotation of the flapping hydrofoil to the leading edge is 0.2c. The motion frequency f is studied in this paper and the specific parameter determinations are mentioned in the results.
In the study, the relative chord length is defined as c* = c/B, where B is the channel width, and this definition is used to quantify the ratio of the chord length of the flapping hydrofoil device to the channel width in order to analyze the effect of the dimensionless chord length on the hydrodynamic characteristics and bank slope stability. According to the literature [31], when the chord length and other parameters remain unchanged, the wider the river width, the lower the outlet water velocity. In order to ensure that the river water velocity can be significantly improved, c = 0.6 m is taken to increase the scope of application of the study. Since this study is carried out in a small river, the river width B is set to 2c, 4c, 6c, 8c, 10c, 15c, and the corresponding relative chord length c* is 1/2, 1/4, 1/6, 1/8, 1/10, 1/15. According to the literature [5], when the frequency is greater than 2.5 Hz, the efficiency will no longer change significantly. Therefore, the frequency studied in this paper is within 2.5 Hz.
In the study of flapping hydrofoils, the pushing-water efficiency η is a key parameter to measure the hydrodynamic performance of flapping hydrofoils, which depends on the mean thrust coefficient C T ¯ and the mean power coefficient C P ¯ . The mean thrust coefficient C T ¯ is calculated as follows [32]:
C T ¯ = 1 T t t + T C T d t = 2 F T ¯ ρ U ¯ 2 c
where C T is the instantaneous thrust coefficient, F T ¯ is the average thrust in the horizontal direction, F T ¯ = 1 T t t + T F T t d t , F T t is the instantaneous thrust in the horizontal direction, ρ is the density of the water body, and U ¯ represents the mean flow velocity at the outlet section of the flow channel after the flow field has stabilized.
The mean power coefficient C P ¯ is defined as:
C P ¯ = 1 T t t + T C P d t = 2 P in ¯ ρ U ¯ 3 c ,
where C P is the instantaneous power coefficient, and P in ¯ is the average input power, which is defined as:
P in ¯ = 1 T t t + T F L t y t d t + t t + T M t θ t d t ,
where F L t is the instantaneous thrust in the vertical direction and M t is the instantaneous torque of the flapping hydrofoil around the center of rotation.
Ultimately, the pushing-water efficiency can be expressed as:
η = C T ¯ C P ¯ .

2.2. Modeling of Bank Slope Scour

Bank slope scour depends on the erodibility of the fine soil layer, defined as the suspension or lifting of fine-grained sediment by water flow. The longitudinal near-bank current scour force is the main driving force of water flow to promote soil uplift on the bank slope surface; therefore, the longitudinal near-bank current scour force is used in the study as an indicator to assess the degree of scouring of bank slopes by water flow, which can generally be expressed as the near-bank current shear stress [27]:
τ = ρ u * 2
where τ is the near-shore current scouring force, ρ is the density of the river water body, u * is the friction velocity. The friction velocity is in accordance with the logarithmic distribution formula:
u b ¯ u * = 5.75 lg 30.2 l k s χ
where u b ¯ is the near-shore time-averaged flow velocity; l is the location of the near-shore time-averaged flow velocity action point; k s is the roughness height of the wall; and χ is the correction coefficient considering the effect of water viscosity. For the rough wall, according to the literature [33], we take l = 2/3D (D is the sediment particle size), k s = 2 D , χ = 1 .
Substituting Equation (8) into Equation (7), it can be obtained that
τ = ρ u b ¯ 5.75 lg 30.2 l χ / k s 2 = ρ u b ¯ 5.767 2
When the near-shore current scouring force τ is greater than the bank slope soil scour resistance τc, the soil particles or agglomerates begin to move, at which time the bank slope is considered to be subjected to scouring, and scouring is negligible if the current scouring force is less than the soil scour resistance [34]. According to the literature [35], the riverbank test soil of the Brahmaputra River in the Nalbari area is fine clay soil, mainly composed of silt or clay soils, with a median particle size of 0.06 mm, a median bulk density of 17.62 kN/m3, and an average natural moisture content of 33.0%. Through the test, the critical scour resistance of the tested soils on the river bank ranges from 1.0 Pa to 10 Pa. In this paper, the minimum critical scour resistance of 1.0 Pa in this section of the river is taken as the bank slope soil scour resistance τc. When τ ≥ 1.0 Pa, the river bank is considered to be subjected to scour, and vice versa the river bank is not subjected to scour.

3. Numerical Method and Validation

3.1. Control Equations and Turbulence Modeling

During the movement of flapping hydrofoils, vortices are frequently generated and shed on the hydrofoil surface, and the flow characteristics of the wall boundary layer need to be captured. Compared with the Large Eddy Simulation (LES) method, the Reynolds time-averaged Navier–Stokes (RANS) method can better capture the separation and reattachment of the boundary layer, and has relatively low requirements on the grid, and has better convergence in the iterative solution process. Therefore, in the study, the numerical method adopts the Reynolds time-averaged Navier–Stokes (N-S) equations to capture the flow field characteristics of two-dimensional incompressible turbulence, and the governing equations can be expressed as follows [36]:
u i ¯ x i = 0
u i ¯ t + u j ¯ u i ¯ x j = 1 ρ p ¯ x i + x j γ + γ t u i ¯ x j + u j ¯ x i
where u i ¯ (i = 1, 2) represents the fluid velocity; xi (i = 1, 2) denotes the control coordinates; p is the fluid pressure; t stands for time; γ is the kinematic viscosity; γi = cμk2 is the turbulent viscosity coefficient; cμ is a constant; k represents the turbulent kinetic energy; and ε is the turbulent energy dissipation rate.
Considering that the flapping hydrofoil motion process will be accompanied by the shedding and transport of the wake vortex, in order to more accurately capture this type of complex flow field characteristics, this paper adopts the Realizable k-ε turbulence model to solve the above Reynolds time-averaged Navier–Stokes (N-S) equations, the corresponding literature can be found in [37].

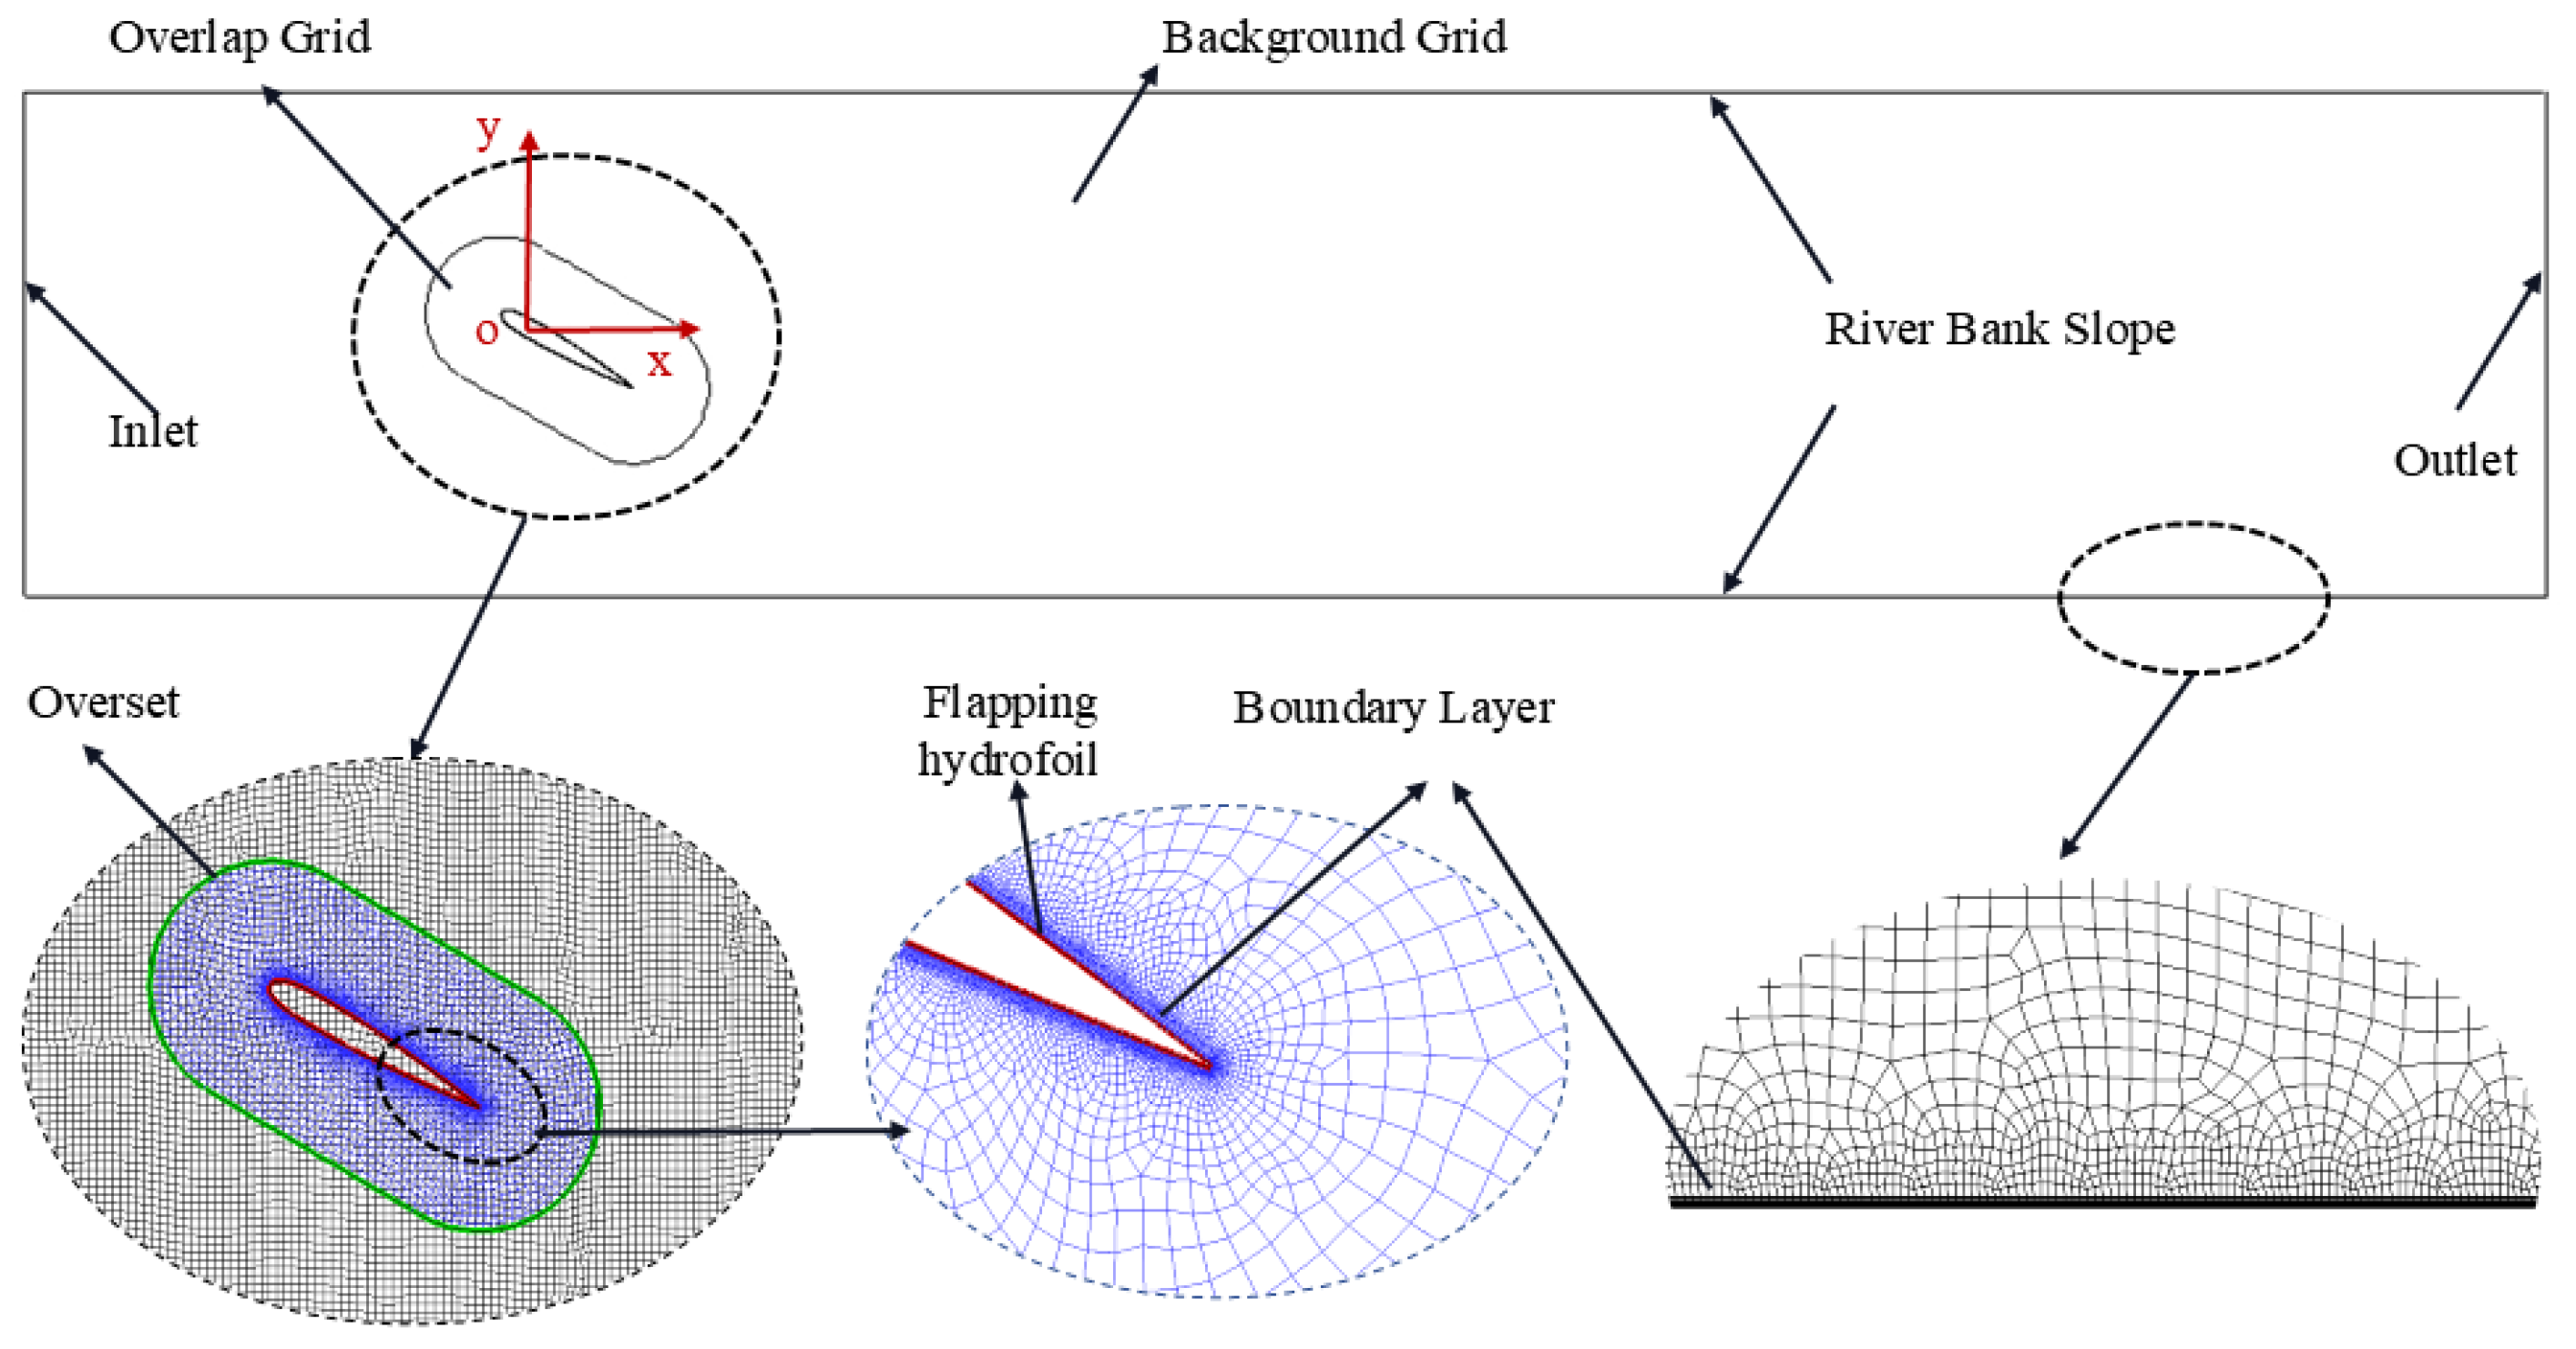
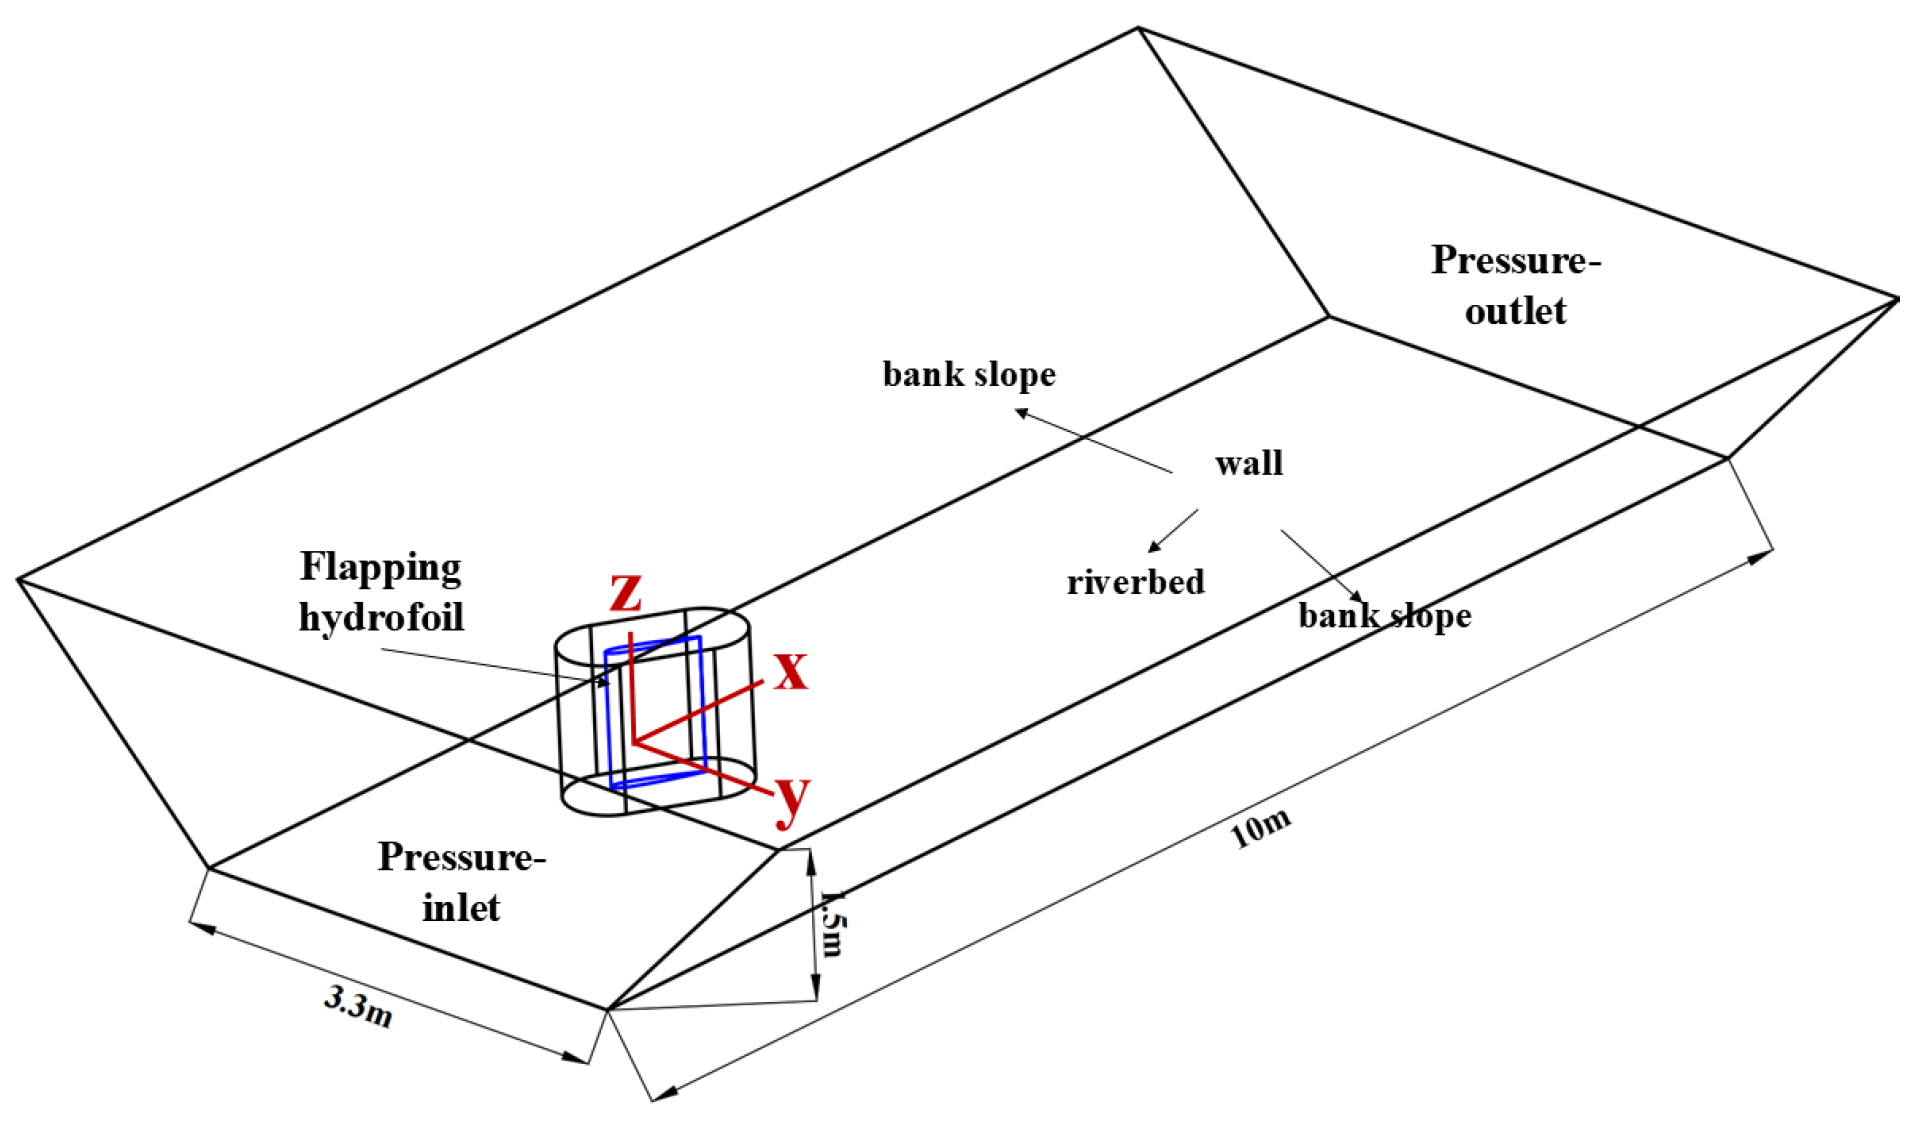
3.2. Computational Domain and Meshing

The numerical simulation is based on the finite volume method and overlapping grid technology, and is carried out in the commercial fluid dynamics calculation software Ansys-Fluent 2022R1. The movement of the flapping hydrofoil is controlled by a user-defined function to achieve movement in the flow channel. The computational domain consists of the foreground overlapping grid motion domain and the background grid stationary domain. The overlapping grid region corresponds to the flapping hydrofoil motion region, which is composed of a hybrid grid; the background grid region corresponds to the river cross-section composed of a structured grid. In the near-bank position, the normal velocity gradient is larger due to the wall shear interference, so the boundary layer is set in the flapping hydrofoil and the bank slope wall on both sides of the river to ensure the accuracy of the calculation in the near-bank position and the accurate capture of the flow field characteristics, and the grid division of the computational domain is shown in Figure 2.
In order to observe the flow field changes more fully, it is necessary to fully develop the subsequent flow field of the flapping hydrofoil. The computational domain length is set to 20 c in this study. To simulate the static water environment, the inlet boundary condition is pressure-inlet, the outlet boundary condition is pressure-outlet, the flapping hydrofoil surface and the sloping wall on both sides of the river are set to wall, and the flapping hydrofoil motion control is realized by a user-defined function. The solution uses a coupling algorithm to couple the pressure field and the velocity field, and the discrete time uses the second-order upwind format.

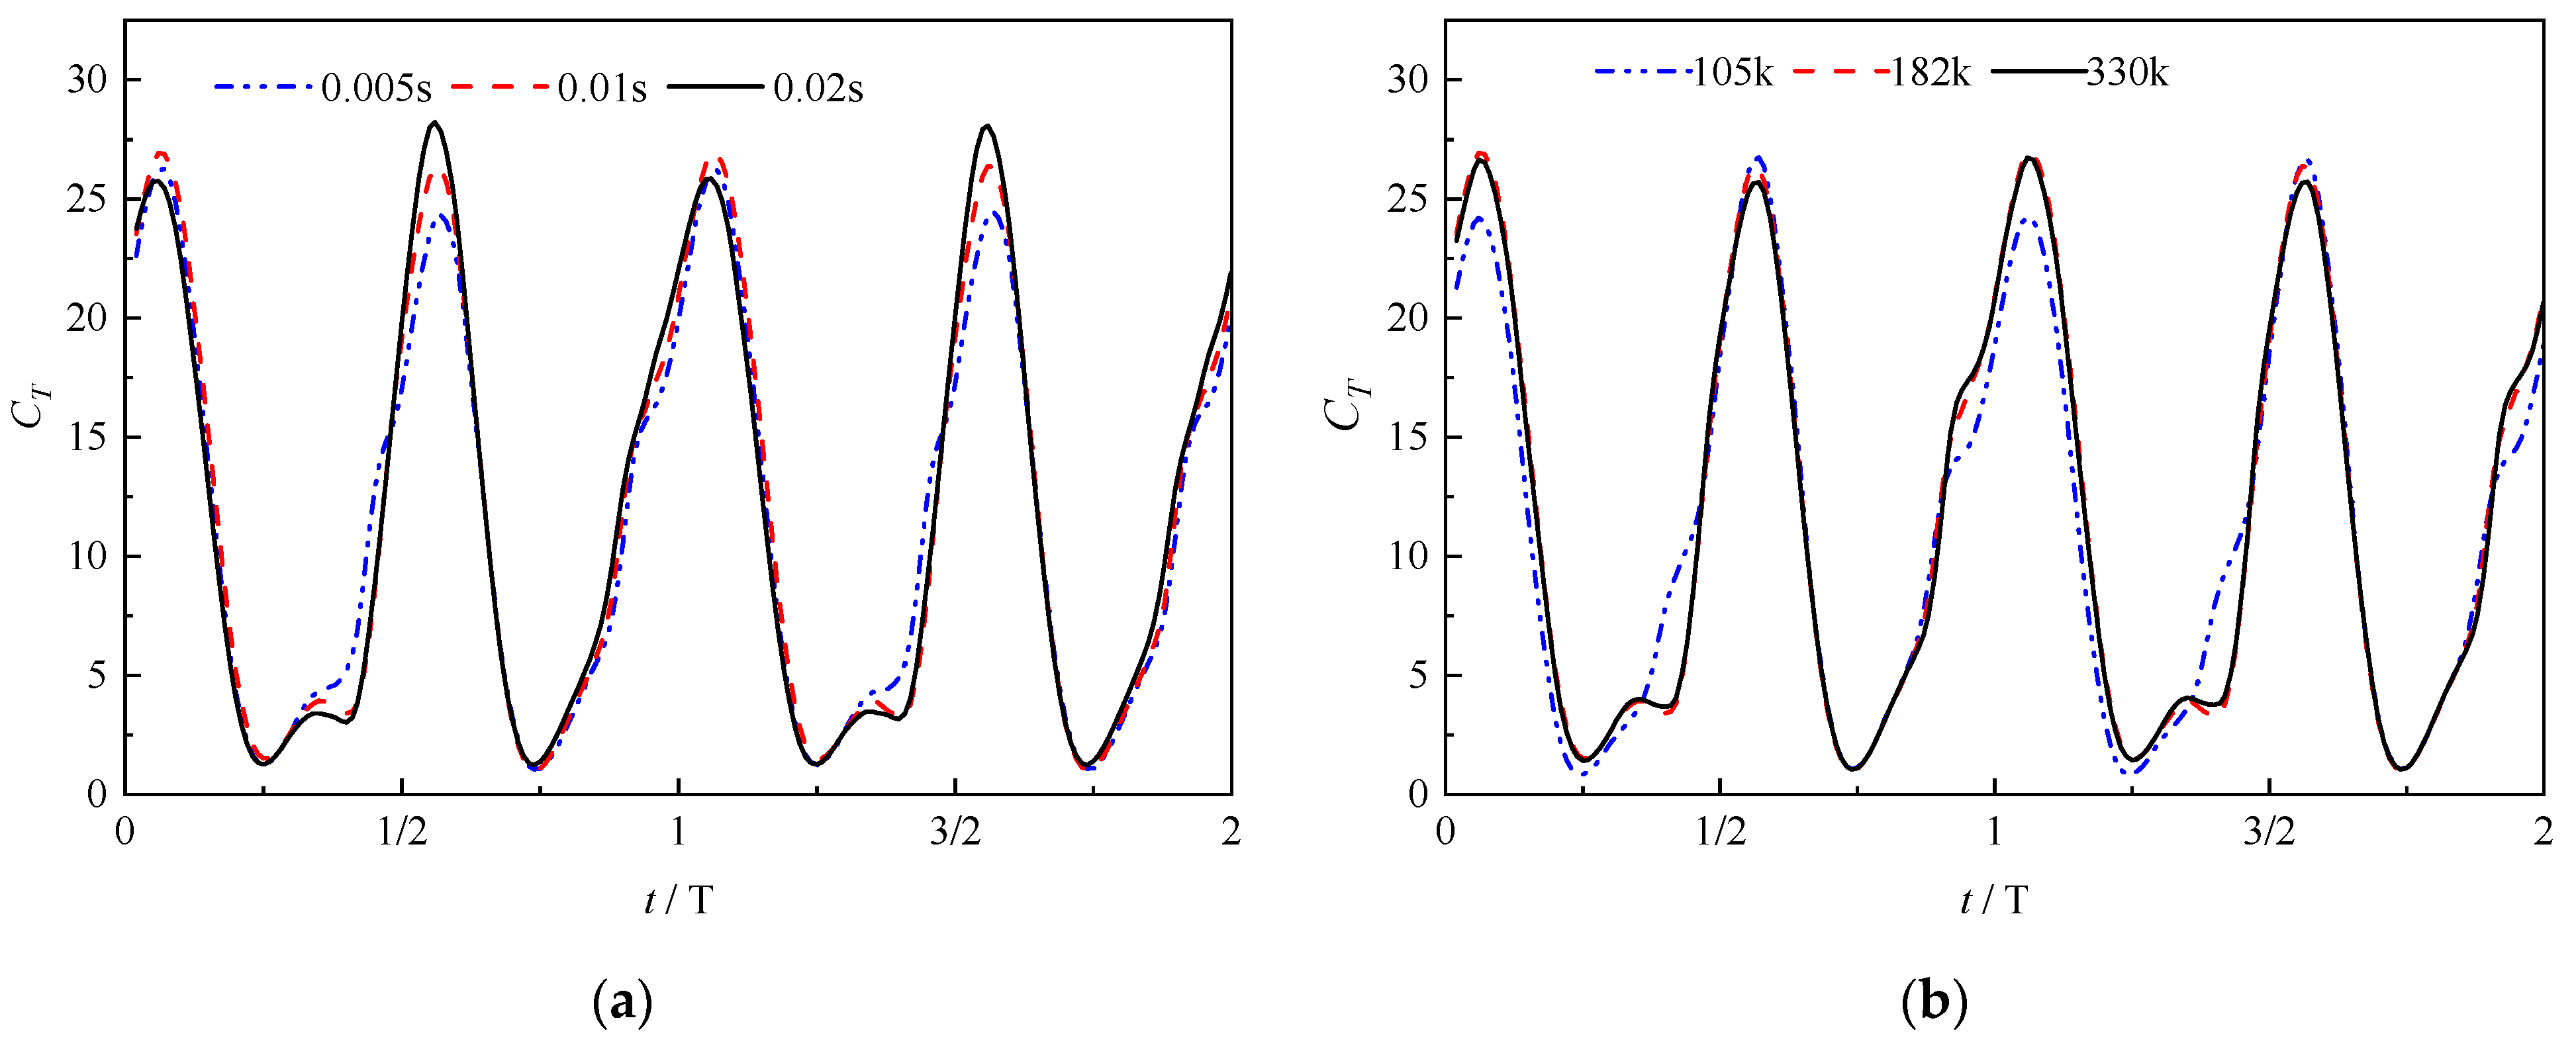
3.3. Numerical Method Validation

In unsteady transient numerical calculations, the time step and grid density have an impact on the speed and accuracy of numerical calculations. In order to maintain high simulation accuracy while minimizing the simulation time, we verified the independence of the time step and grid density. Figure 3a shows the curves of the instantaneous thrust coefficient with a period for time steps of 0.005 s, 0.01 s, and 0.02 s, respectively. The results show that the instantaneous thrust coefficient when the time step is selected as 0.02 s has a larger deviation compared with the other two, so the time step of 0.01 s is finally selected for the subsequent calculations considering the calculation accuracy and efficiency. In order to verify the independence of the grid density, we set three grid unit sizes of 10 mm, 20 mm, and 40 mm, and the corresponding grid numbers are 105k, 182k, and 330k, respectively. The results are shown in Figure 3b. By comparing the changes in the instantaneous thrust coefficient under the three sets of grids, it can be seen that when the grid number is 105k, the instantaneous thrust coefficient is significantly different from the other two groups. Therefore, considering the calculation efficiency and computing resources, the grid unit size of 20 mm corresponding to the grid number of 182k is finally selected for subsequent calculations.
In addition, in order to verify the reliability of the numerical calculation method, according to the experimental study on the propulsive performance of flapping hydrofoils in the literature [12], this section establishes a corresponding simulation model to simulate the propulsive performance of flapping hydrofoils, and compares the numerical method used in this paper with the experimental results of the literature [12], and the numerical calculation model and the simulation parameter settings are consistent with the experimental working conditions in the literature. According to the literature [12], the NACA0012 airfoil with chord length c = 0.1 m is selected, the computational domain size is 20 c × 15 c, the mean incoming velocity is taken as 0.4 m/s, the maximum angle of attack αmax = 20°, the phase difference φ = 90°, the heave amplitude y0 = 0.075 m, and a distance of 1/3 c between the center of rotation of the flapping foil and the leading edge. The mean incoming velocity is taken as 0.4 m/s. The average thrust coefficients at Strouhal number St of 0.15, 0.2, 0.25, 0.3, 0.35, and 0.4 are calculated, respectively, and compared with the experimental results as shown in Figure 4. The Root Mean Square Error (RMSE) is 0.0482 and the Index of Agreement (IA) is 0.9595 calculated from the data in Figure 4, indicating that the numerical calculation results in this paper are consistent with the experimental results and have the same trend, which confirms that the numerical method adopted is effective.

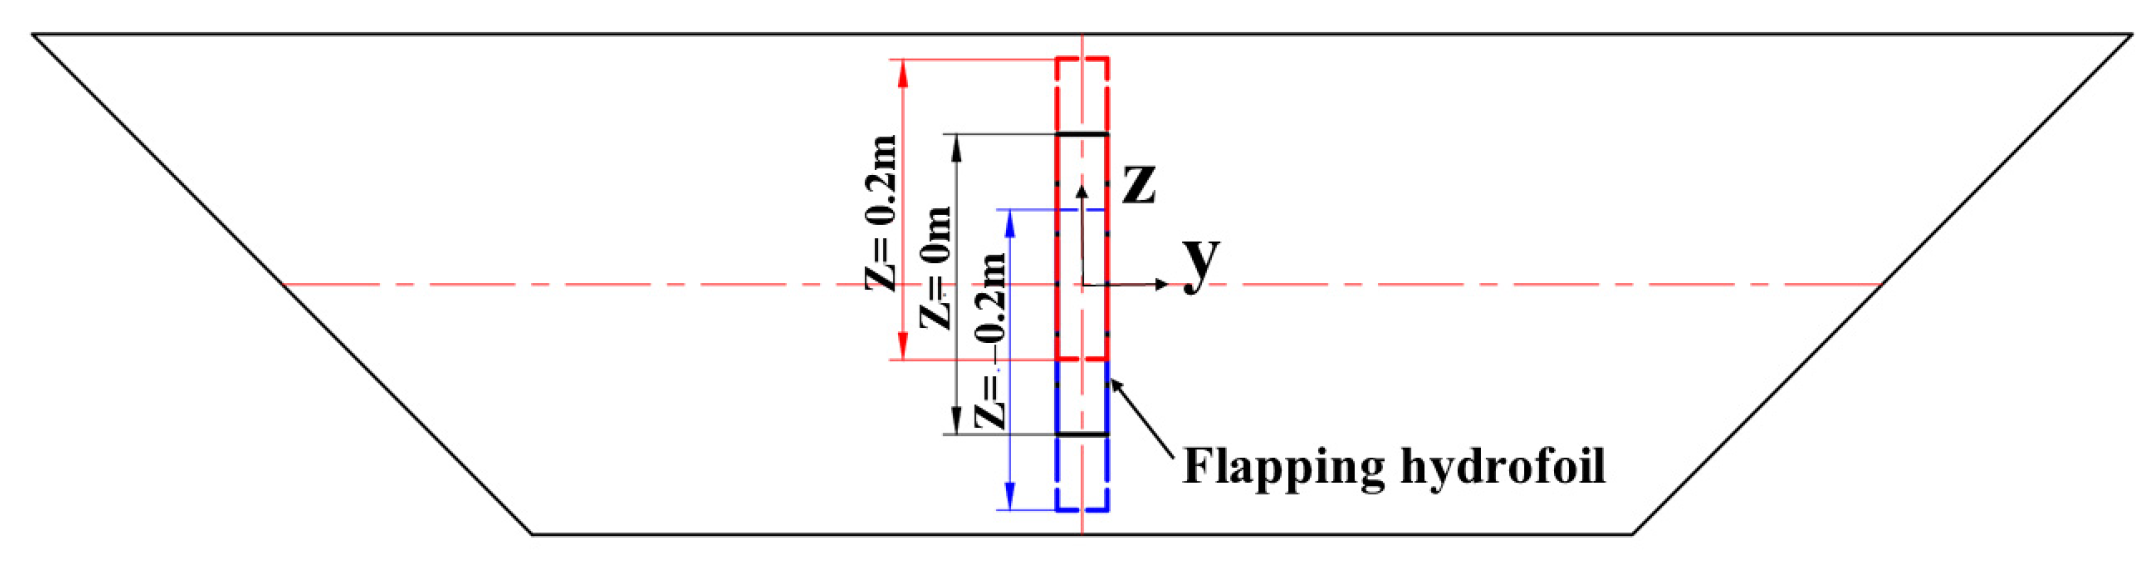
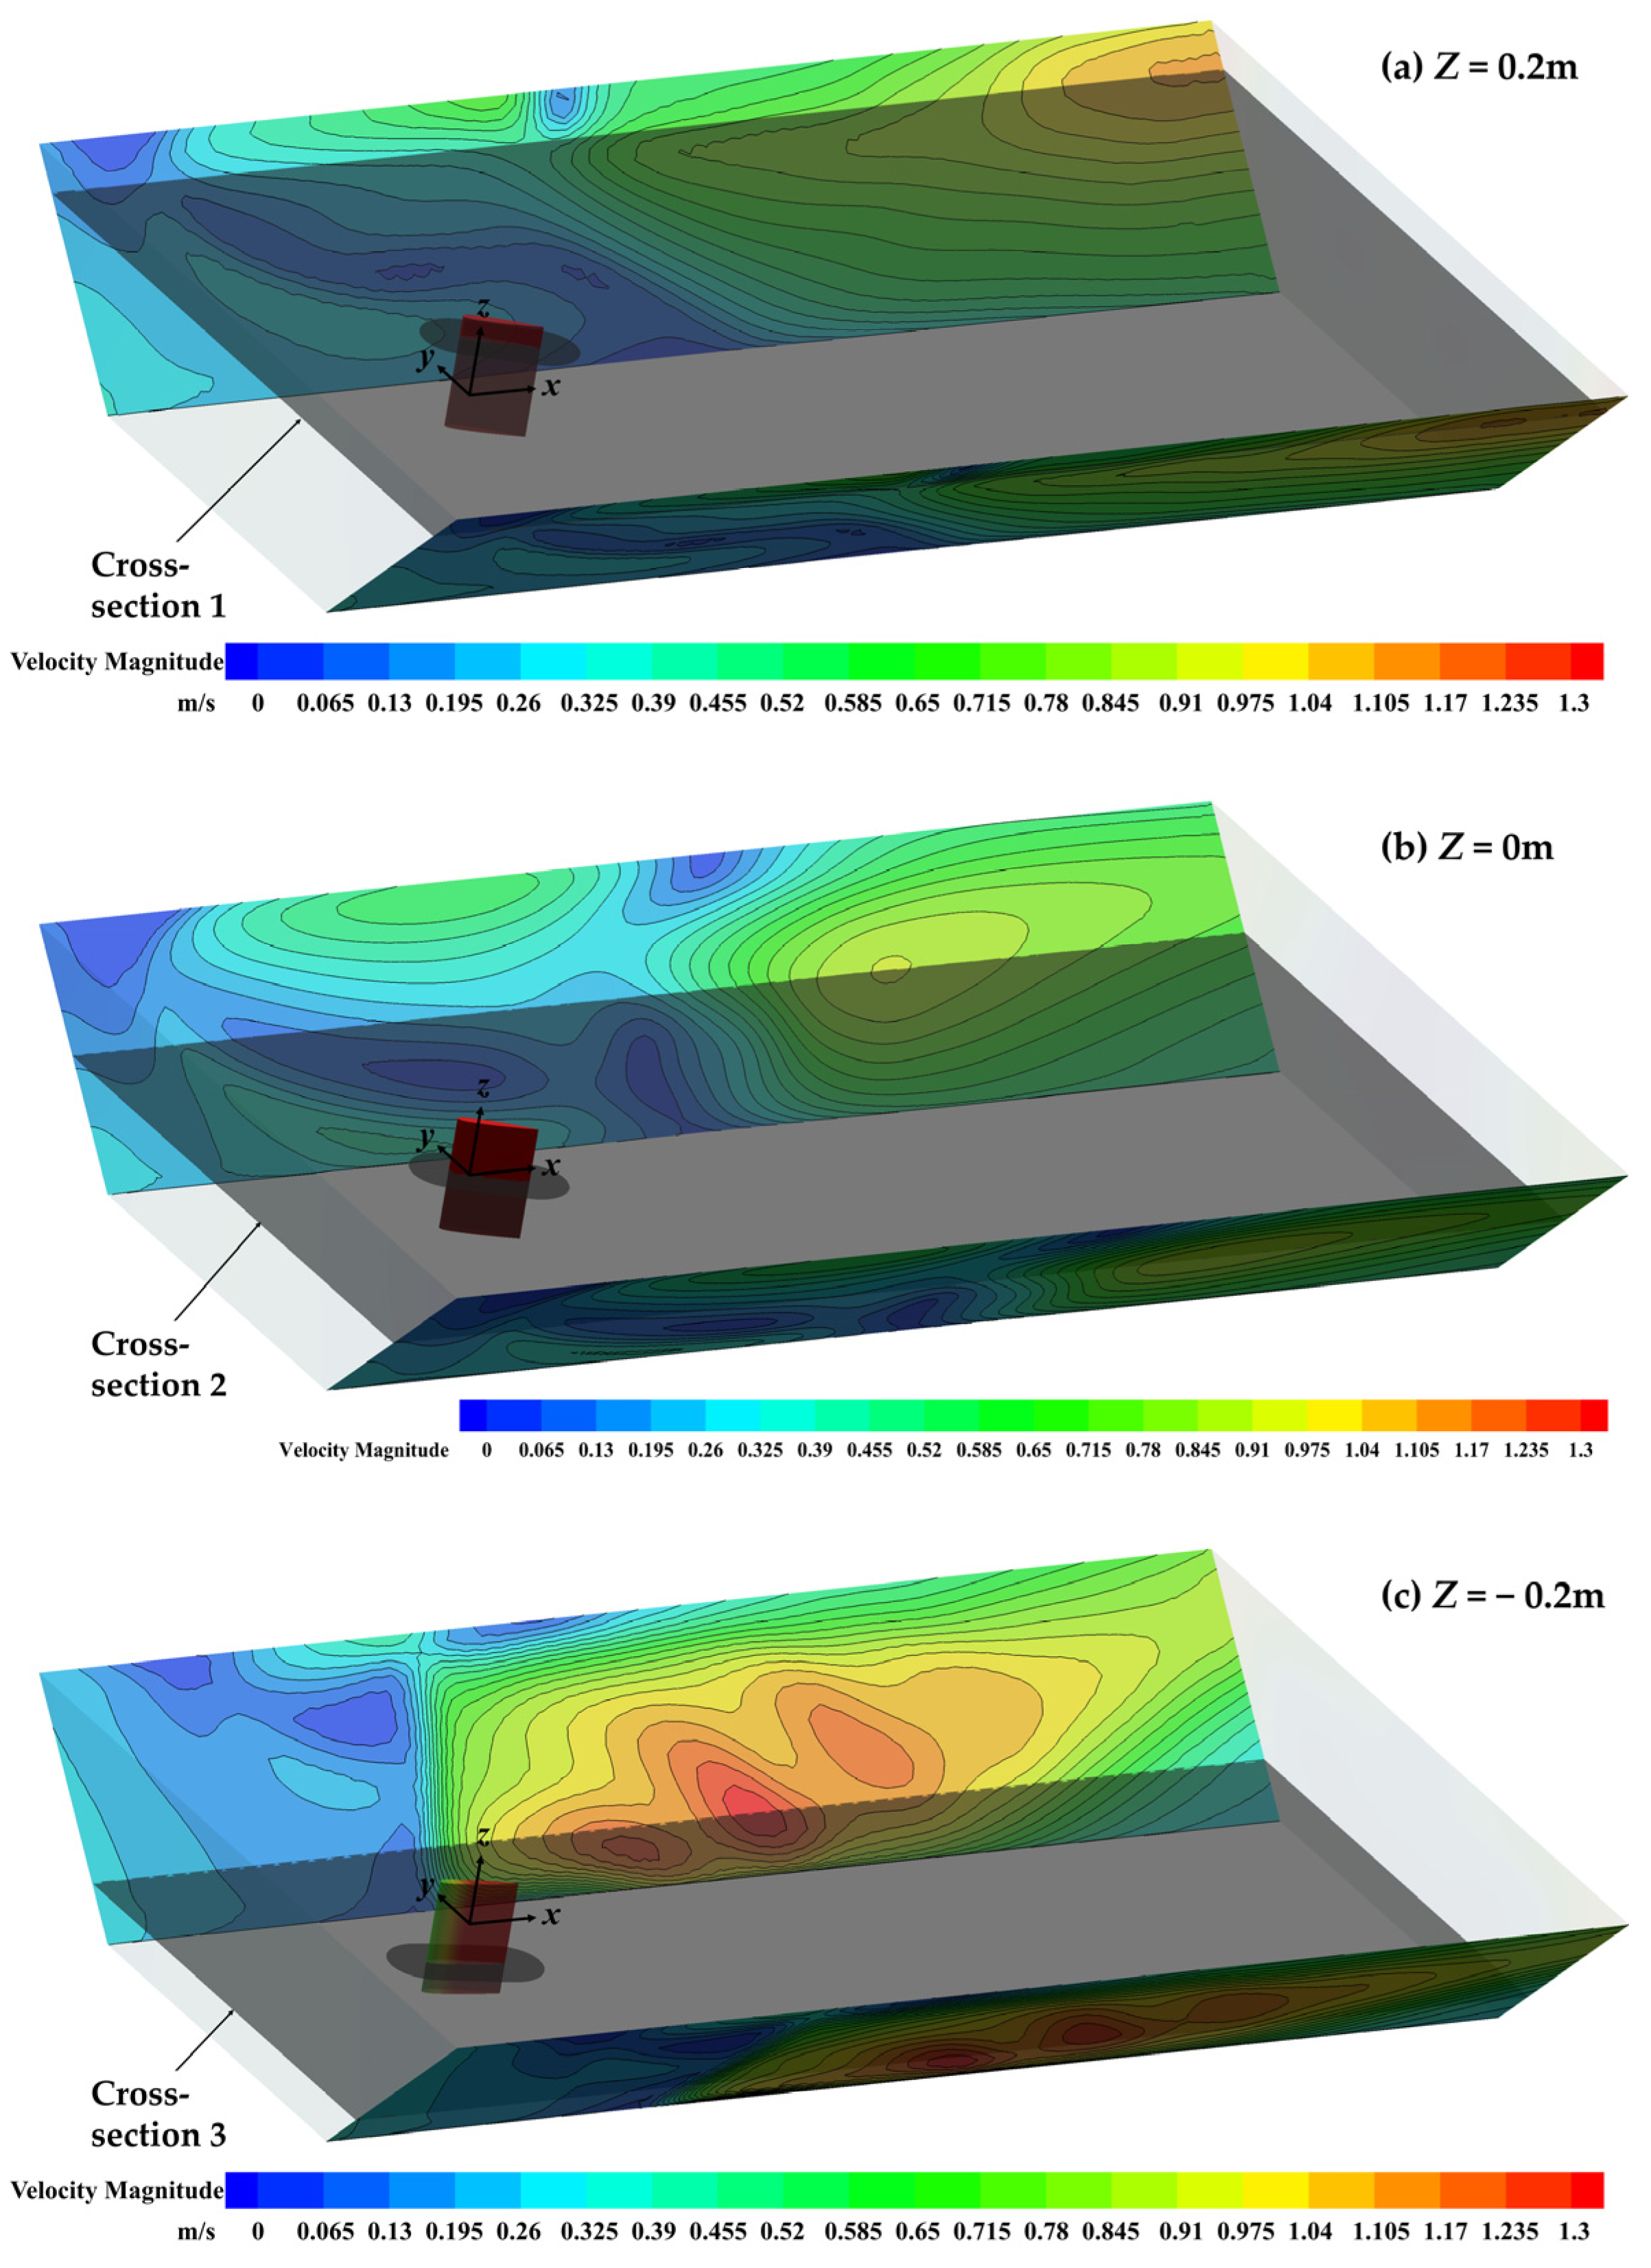
4. Determination of Maximum Scour Section

After validating the numerical method (Section 3), we proceeded to determine the maximum scour cross-section. This step is critical because the installation height of the flapping hydrofoil significantly affects the spatial distribution of scouring forces, and selecting the worst-case scenario ensures conservative design recommendations. The maximum scour plane at different installation heights was determined through three-dimensional simulation in this study, and a two-dimensional study was carried out on the installation height where the slope scour is most obvious. The computational domain and boundary conditions of the 3D simulation are shown in Figure 5, with flapping hydrofoil chord length c = 0.6 m, motion frequency f = 1 Hz, and other settings consistent with the 2D calculation. In addition, the installation position of the flapping hydrofoil device in the channel width direction (y-axis direction) also affects the distribution of the flow field in the channel, and in order to avoid the resultant error due to the inconsistency of the distance between the two side walls, the flapping hydrofoil device is installed at the middle position of the y-axis direction of the channel in this paper.
Figure 6 shows the schematic diagram of the installation position in the height direction, where the dashed line is the middle plane position in the height direction. The height direction is divided into three groups of installation heights according to the ratio of the flapping hydrofoil spread length to the height of the river channel, which are 0.2 m, 0 m, and −0.2 m, respectively, and the width direction is maintained in the middle of the river channel for all three groups.
In the study, in order to obtain the maximum bank slope scour location under different installation heights, it is necessary to determine the location of the maximum flow velocity based on the velocity contour cloud map of the bank slope surface, and further determine the maximum scour cross-section under each group of installation heights based on the z-axis coordinates corresponding to this location. Figure 7 shows the flow velocity distribution and the corresponding cross-section of the maximum bank slope scour force in the near-shore flow field under three different installation heights.
In order to measure the comprehensive effect of flapping hydrofoils on the nearshore flow velocity at different installation heights, the average value of the instantaneous flow velocity at each point in a single cycle over time was taken on the entire slope surface, and the maximum value was taken to obtain the maximum time-averaged nearshore flow velocity. The cross-section at the height where the maximum time-averaged near-shore flow velocity occurs is the maximum scour cross-section. As shown in Figure 7, the maximum scour sections corresponding to the heights of 0.2 m, 0 m, and −0.2 m are cross-sections 1, 2, and 3, respectively. The maximum time-averaged near-shore flow velocity and maximum scour force corresponding to the maximum scour cross section at the three sets of installation heights are shown in Table 1.
From Table 1, it can be found that the maximum scour force at the middle installation height (Z = 0 m) is significantly lower than that at the other two installation heights (Z = 0.2 m and Z = −0.2 m), when the flapping hydrofoil motion has the least impact on bank slope scour. When the installation height Z = 0.2 m, from the near-shore flow velocity distribution in Figure 7a, the maximum scour cross-section appears near the upper end of the flapping hydrofoil. The main reason is that the upper end of the flapping hydrofoil is closer to the water surface, at this time the fluid is less restricted near the upper end of the flapping hydrofoil, and the water flow can flow and diffuse more freely, so that the energy of the vortex ring rupture is mainly concentrated in the region close to the water surface, which results in a larger flow velocity and scouring force. At the installation height Z = −0.2 m, it can be seen in Figure 7c that the maximum scouring cross-section occurs closer to the lower end of the flapping hydrofoil. At this time, the lower end of the flapping hydrofoil is closer to the riverbed and the width of the channel narrows, resulting in a greater restriction of fluid flow at the lower end of the flapping hydrofoil. When the flapping hydrofoil is in motion, the bypassing flow generated at the lower end squeezes against the riverbed, creating a wall effect. The presence of the wall effect causes the fluid to form a high-pressure zone in the region close to the riverbed, which drives the fluid to accelerate the flow, leading to an increase in the scouring force. While the installation height Z = 0 m, as shown in Figure 7b, the maximum scour cross-section is in the middle position and the resulting scour force is relatively small. The flapping hydrofoil is in the middle position of the water body, and the fluid flow around the flapping hydrofoil is relatively more symmetrical and uniform. After the vortex ring generated at the upper and lower end surfaces breaks up, there is a certain space for it to dissipate, so that the energy of the fluid can be more evenly distributed around the flapping hydrofoil. Therefore, the maximum scouring cross-section is in the middle position, and the scouring force generated is relatively small.
Among the three sets of cross sections, cross-section 3 has the largest scouring force, and when there is no scouring in this cross-section, no scouring occurs in the other cross-sections where the degree of scouring is much smaller. Therefore, in this paper, the maximum scour cross section is taken as the research cross section to start the research. On this cross section, the effects of relative chord length c* and motion frequency f of flapping hydrofoil on bank slop scour are analyzed by numerical study.

5. Results and Discussion

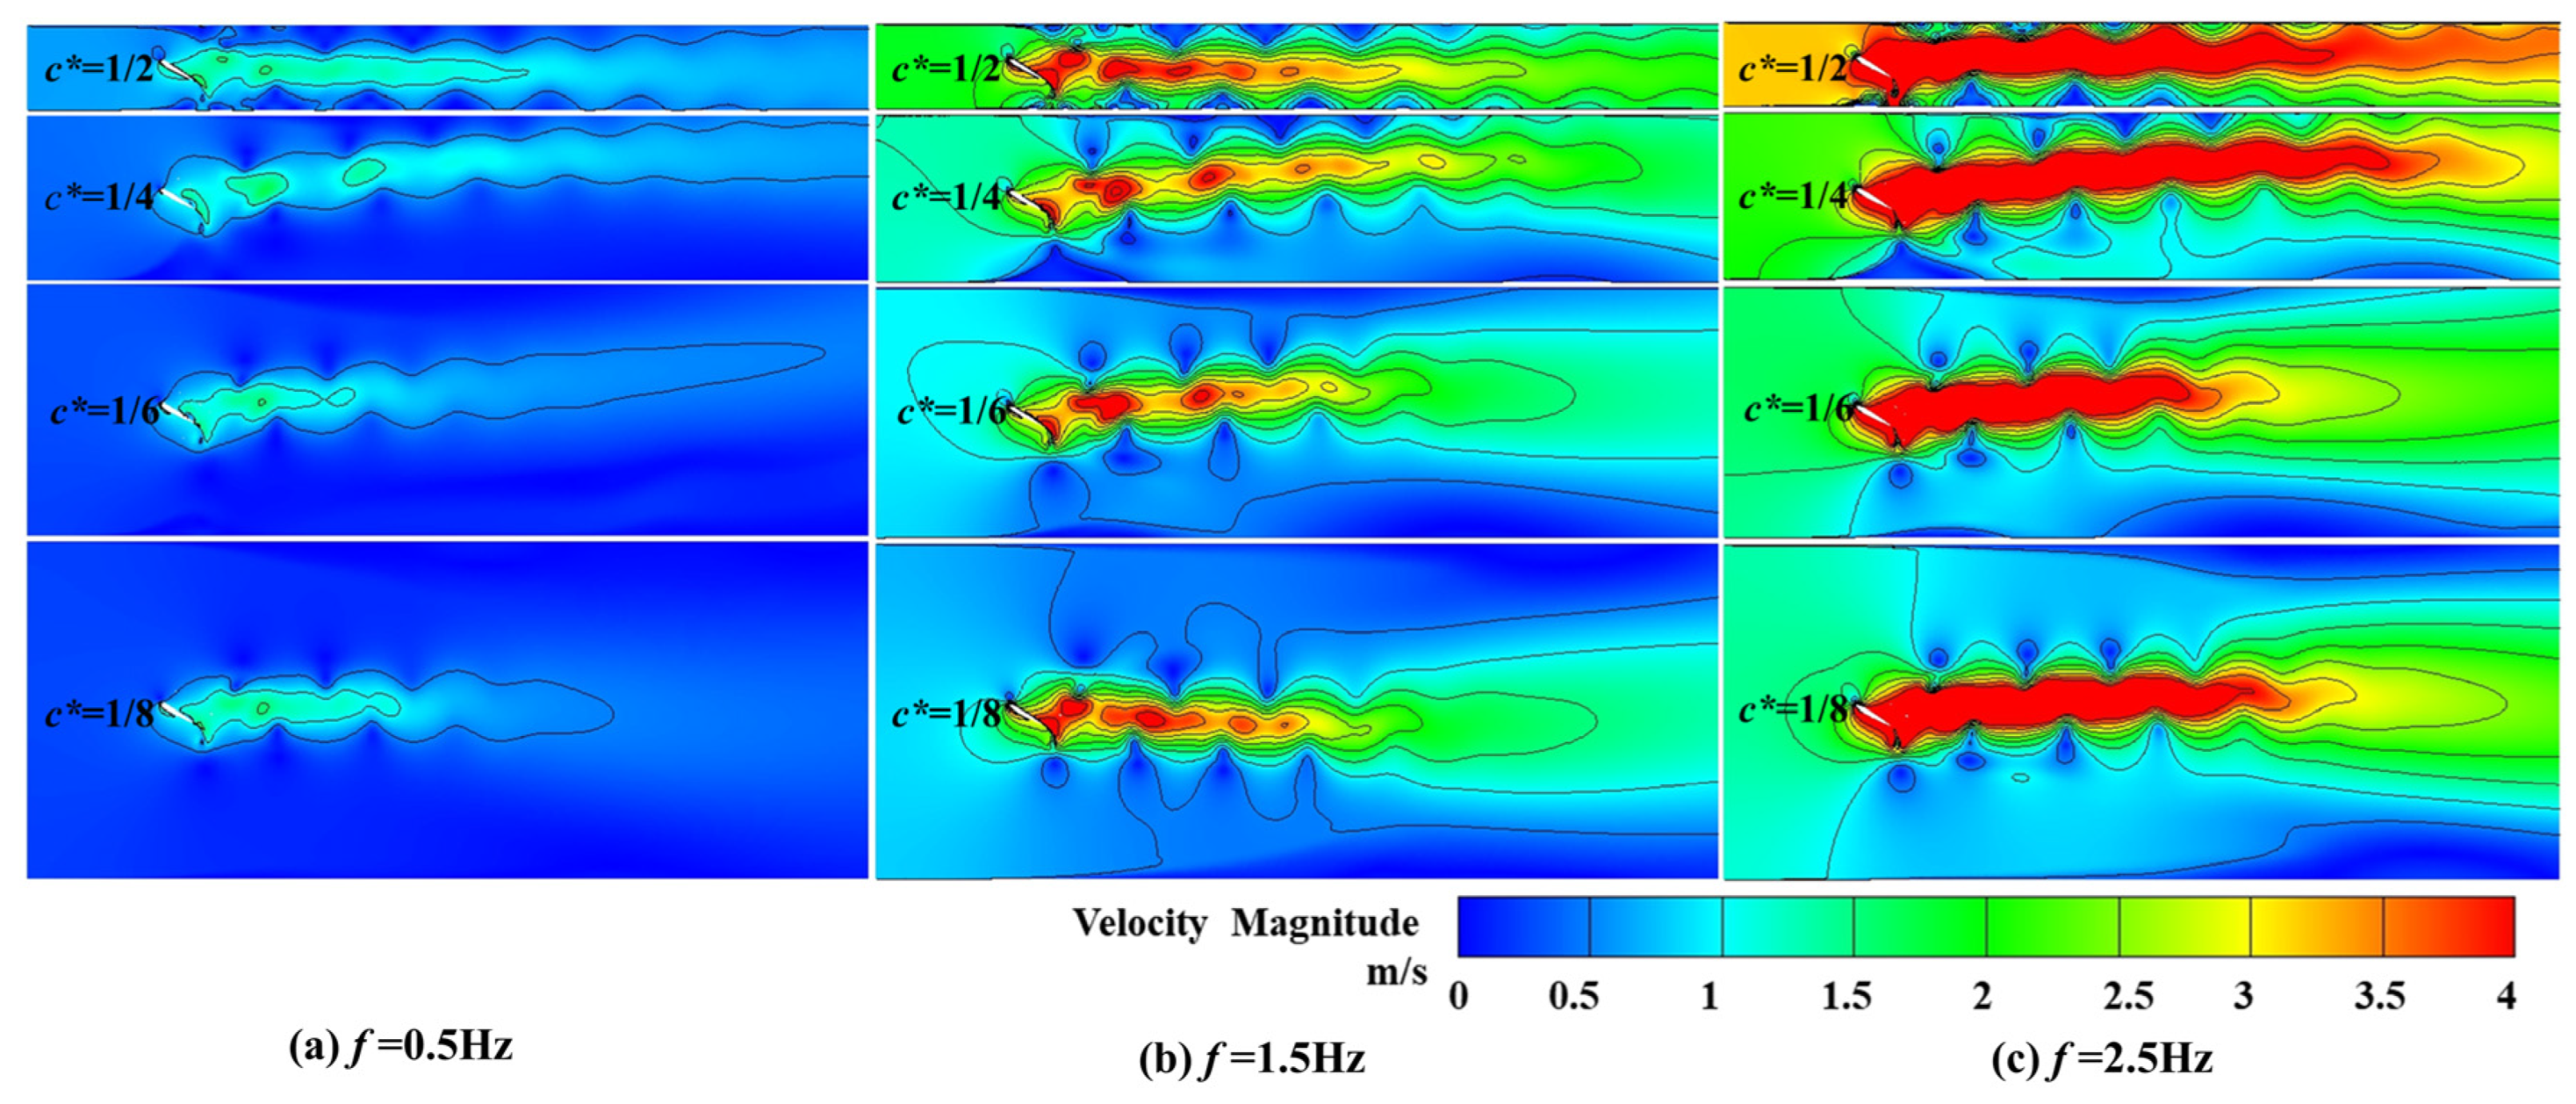
5.1. Effects of Relative Chord Length and Motion Frequency on Bank Slope Scour

Based on the bank slope scour model in Section 2.2, the near-shore current scouring force for bank-sloped soils needs to be calculated based on the maximum time-averaged near-shore flow velocity u ¯ b max . Figure 8 shows the variation of the maximum time-averaged near-shore flow velocity with the motion frequency under different relative chord lengths. In Figure 8, it can be seen that the maximum time-averaged near-shore flow velocity increases gradually with the increase in motion frequency, and its growth rate depends on the relative chord length. Specifically, when the relative chord length c* ≤ 1/8, although the maximum time-averaged near-shore flow velocity increases with the increase in the motion frequency, the change of the relative chord length does not have much effect on the maximum time-averaged near-shore flow velocity. However, when the relative chord length increases to c* ≥ 1/6, the maximum time-averaged near-shore flow velocity increases dramatically with increasing motion frequency, and the larger the relative chord length, the faster the rate of increase.
In order to analyze the reasons for the effects of different relative chord lengths and motion frequencies on the maximum time-averaged near-shore flow velocity, it is necessary to analyze the velocity cloud generated by the flapping hydrofoil motion at different relative chord lengths. In Figure 8, it can be seen that the change of relative chord length has less effect on the maximum time-averaged near-shore flow velocity when c* < 1/8, so the velocity cloud diagrams for c* ≥ 1/8 and the motion frequencies f = 0.5 Hz, 1.5 Hz, and 2.5 Hz are analyzed, as shown in Figure 9.
It can be seen in Figure 9, a high-speed jet will be formed at the tail after all flapping hydrofoil motions. The near-shore water body will flow under the high-speed jet, and the flow velocity of the water body is distributed in a gradient from the middle to both sides, and the intensity of the jet will be enhanced with the increase in the motion frequency. Mainly due to the increase in motion frequency, the work enacted on the water body per unit time increases, and the energy transferred to the water body increases, thus making the jet flow velocity increase and intensity enhancement. When the relative chord length is large (e.g., c* = 1/2), the jet formed by the tail of the flapping hydrofoil basically covers the entire watershed, and the distance between the center jet and the bank slope wall is small, after the motion frequency is increased, the jet strength is enhanced, and the flow velocity of the near-shore water body is rapidly increased under the direct drive of the center high-speed jet. As the relative chord length decreases, the whole basin becomes larger, but the intensity of the jet formed by the tail of the flapping hydrofoil remains basically unchanged when the motion frequency is unchanged, and the distance between the center jet and the bank slope wall starts to increase, and due to the viscous force of the water body, the growth rate of the flow velocity of the nearshore water body will be smaller than that of the case of larger relative chord length. This is also the reason why the growth rate of the nearshore flow velocity increases significantly with the relative chord length in Figure 8 when the relative chord length is large (c* ≥ 1/6).
In addition, there is a limit to the extent to which the flapping hydrofoil produces a jet. When the relative chord length decreases to c* ≤ 1/8, the degree of jet influence on the near-shore flow tends to be saturated, and the continued decrease in the relative chord length weakens the influence on the maximum time-averaged near-shore flow velocity, so the maximum time-averaged near-shore flow velocity does not change much. This is reflected in Figure 8, where the maximum time-averaged near-shore flow velocity increases slowly with increasing motion frequency for smaller relative chord lengths (c* ≤ 1/8), and the effect of relative chord length on the growth rate is weakened.
In the study, the near-shore current mean scouring force was used to measure the effect of bank slopes scouring, which is a direct reflection of the bank slopes scouring by flapping hydrofoil devices, the larger the scouring force, the more obvious the bank slopes scouring. Figure 10 shows the variation curves of the near-shore current mean scouring force with the motion frequency under different relative chord lengths.
As can be seen from Figure 10, the near-shore current mean scouring force is proportional to both relative chord length and motion frequency. In addition, the effect of motion frequency on bank slope scours increases as the relative chord length increases. When the relative chord length c* = 1/2, the motion frequencies f = 0.5 Hz, 1.5 Hz, and 2.5 Hz correspond to near-shore current mean scouring forces of 0.60 Pa, 10.80 Pa, and 40.66 Pa, respectively, but when the relative chord length is reduced to c* = 1/8, the near-shore current mean scouring forces of 0.5 Hz, 1.5 Hz, and 2.5 Hz correspond to 0.0022 Pa, 0.094 Pa, and 0.39 Pa, respectively. are 0.0022 Pa, 0.094 Pa, and 0.39 Pa, respectively. From Figure 10, it can be seen that the scouring force increases gradually with the increase in motion frequency, and the scouring force reaches a maximum value of 40.66 Pa at a frequency of 2.5 HZ. According to the bank scour model in Section 2.2, when c* = 1/2, the threshold frequency at which the bank will not be scoured is 0.5 Hz. As the relative chord length decreases, the threshold frequency of no scour on the bank gradually increases. When the relative chord length decreases to c* = 1/8, since the near-shore current mean scouring force τmean is always less than the bank slope soil scour resistance τc within the frequency range given in this study, the flapping hydrofoil device does not scour the bank.
In addition, in order to provide a more intuitive reference for engineering applications, a polynomial interpolation is fitted to the data at relative chord lengths c* ≥ 1/8 in Figure 10, and the near-shore current mean scouring force τmean versus motion frequency f relationship is obtained for different relative chord lengths, as shown in Table 2.
From Section 2.2, the bank slope soil scouring resistance τc = 1.0 Pa. When the near-shore current mean scouring force τmean is stronger than τc, the bank slope is considered to be scoured. Substituting τmean = 1.0 Pa into the τmeanf relationship equation in Table 2, the bank slopes without scour threshold frequency is obtained. From Table 2, it can be concluded that when the relative chord length c* is 1/2, 1/4, 1/6, and 1/8, respectively, the corresponding threshold frequencies that make the bank slopes not scour are 0.65 Hz, 0.70 Hz, 1.26 Hz, and 3.50 Hz, respectively.

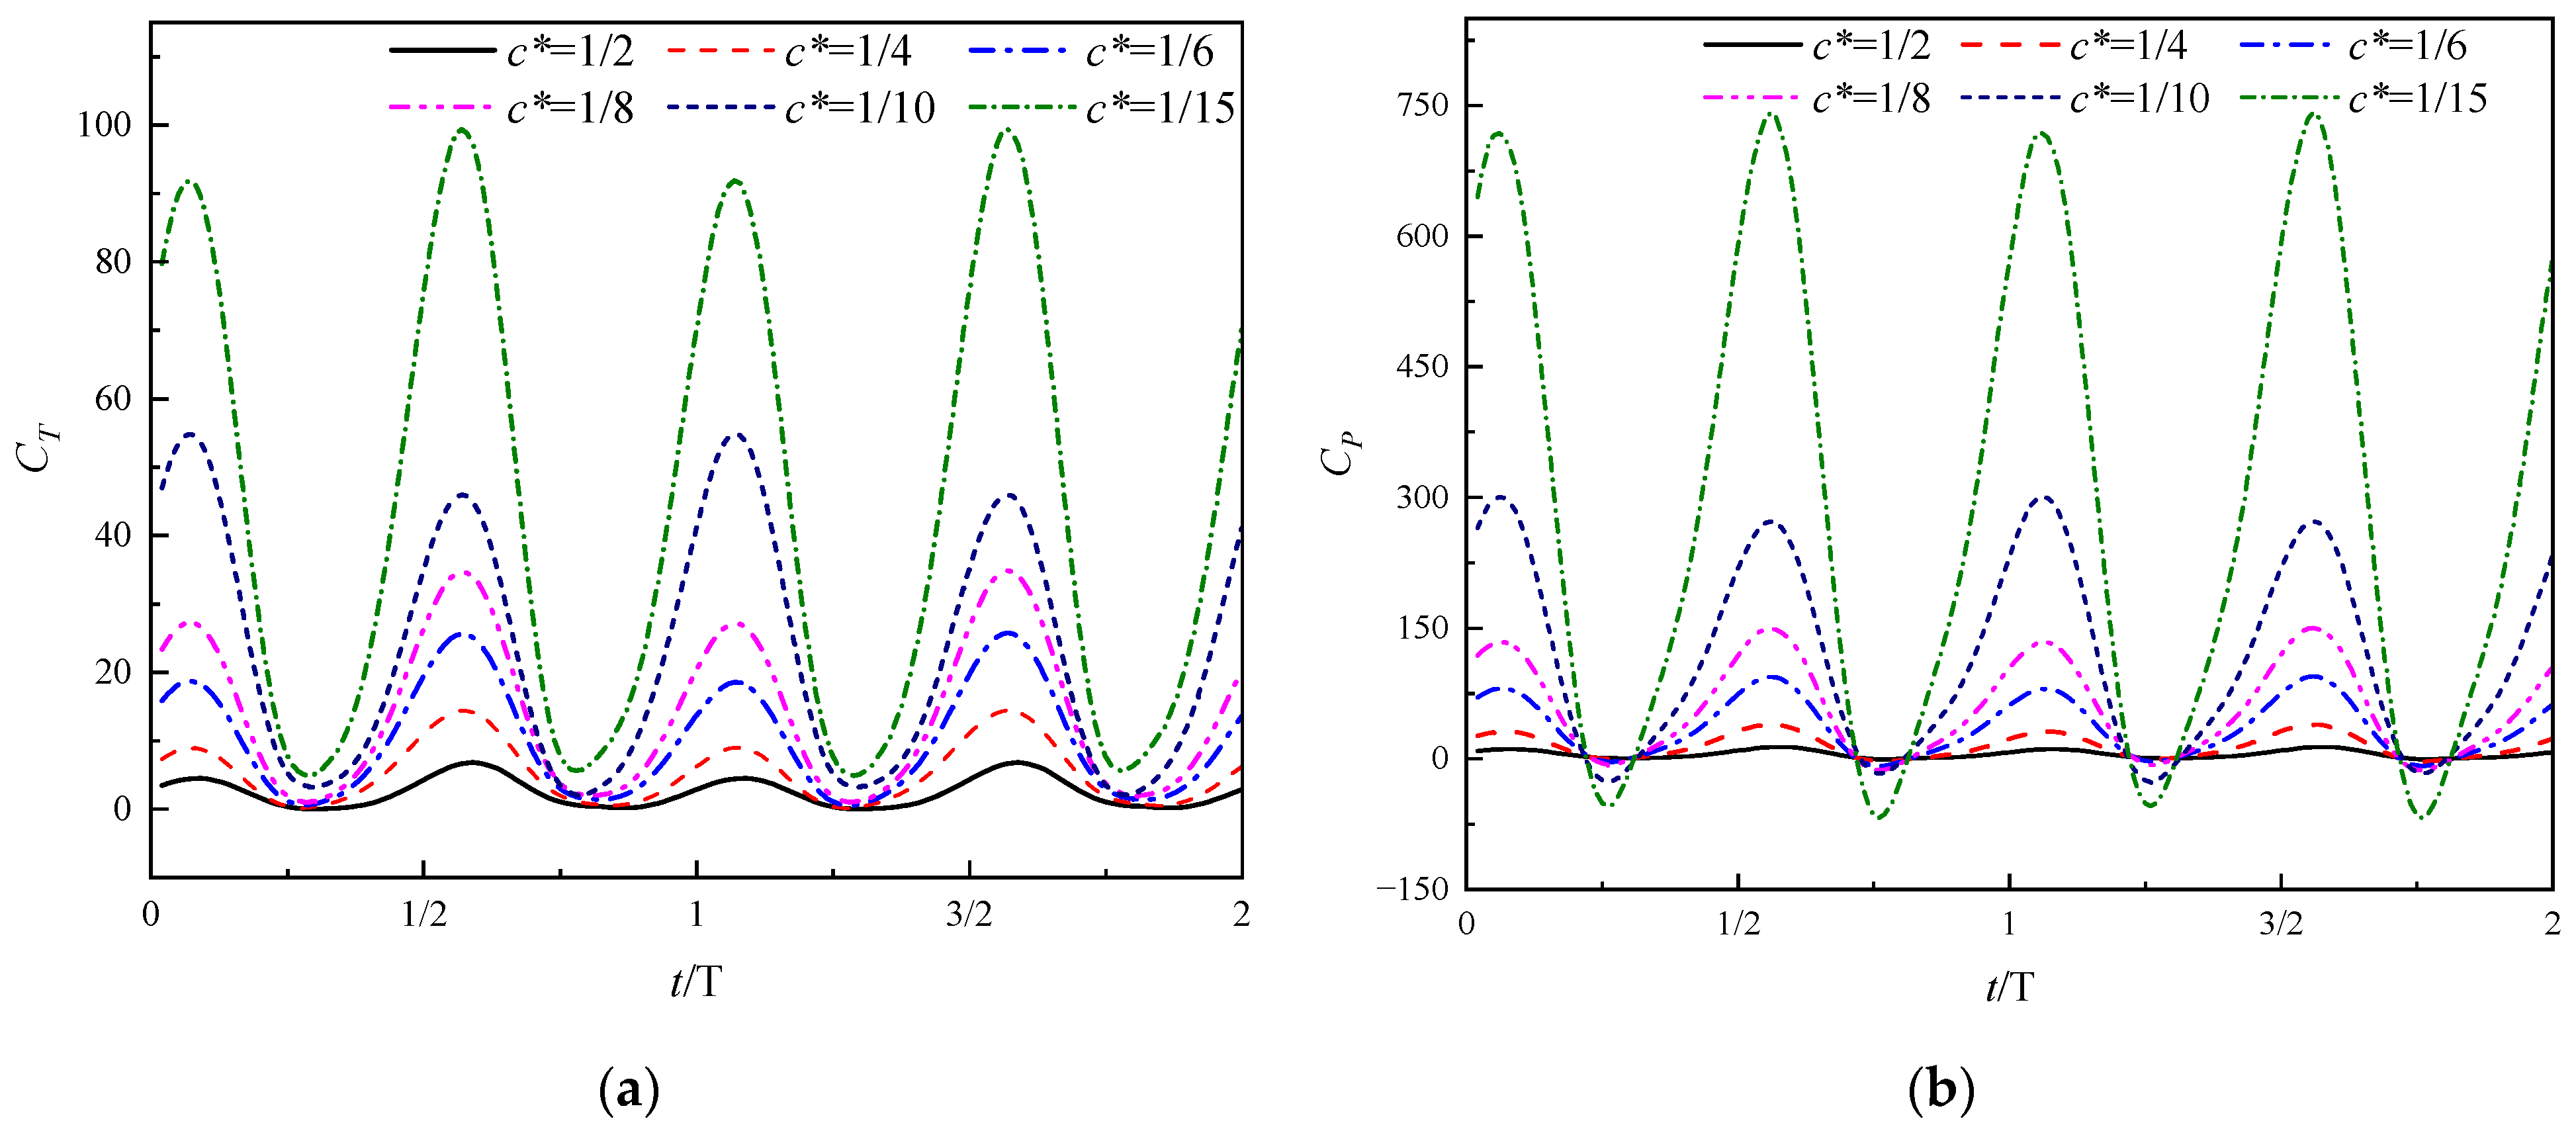
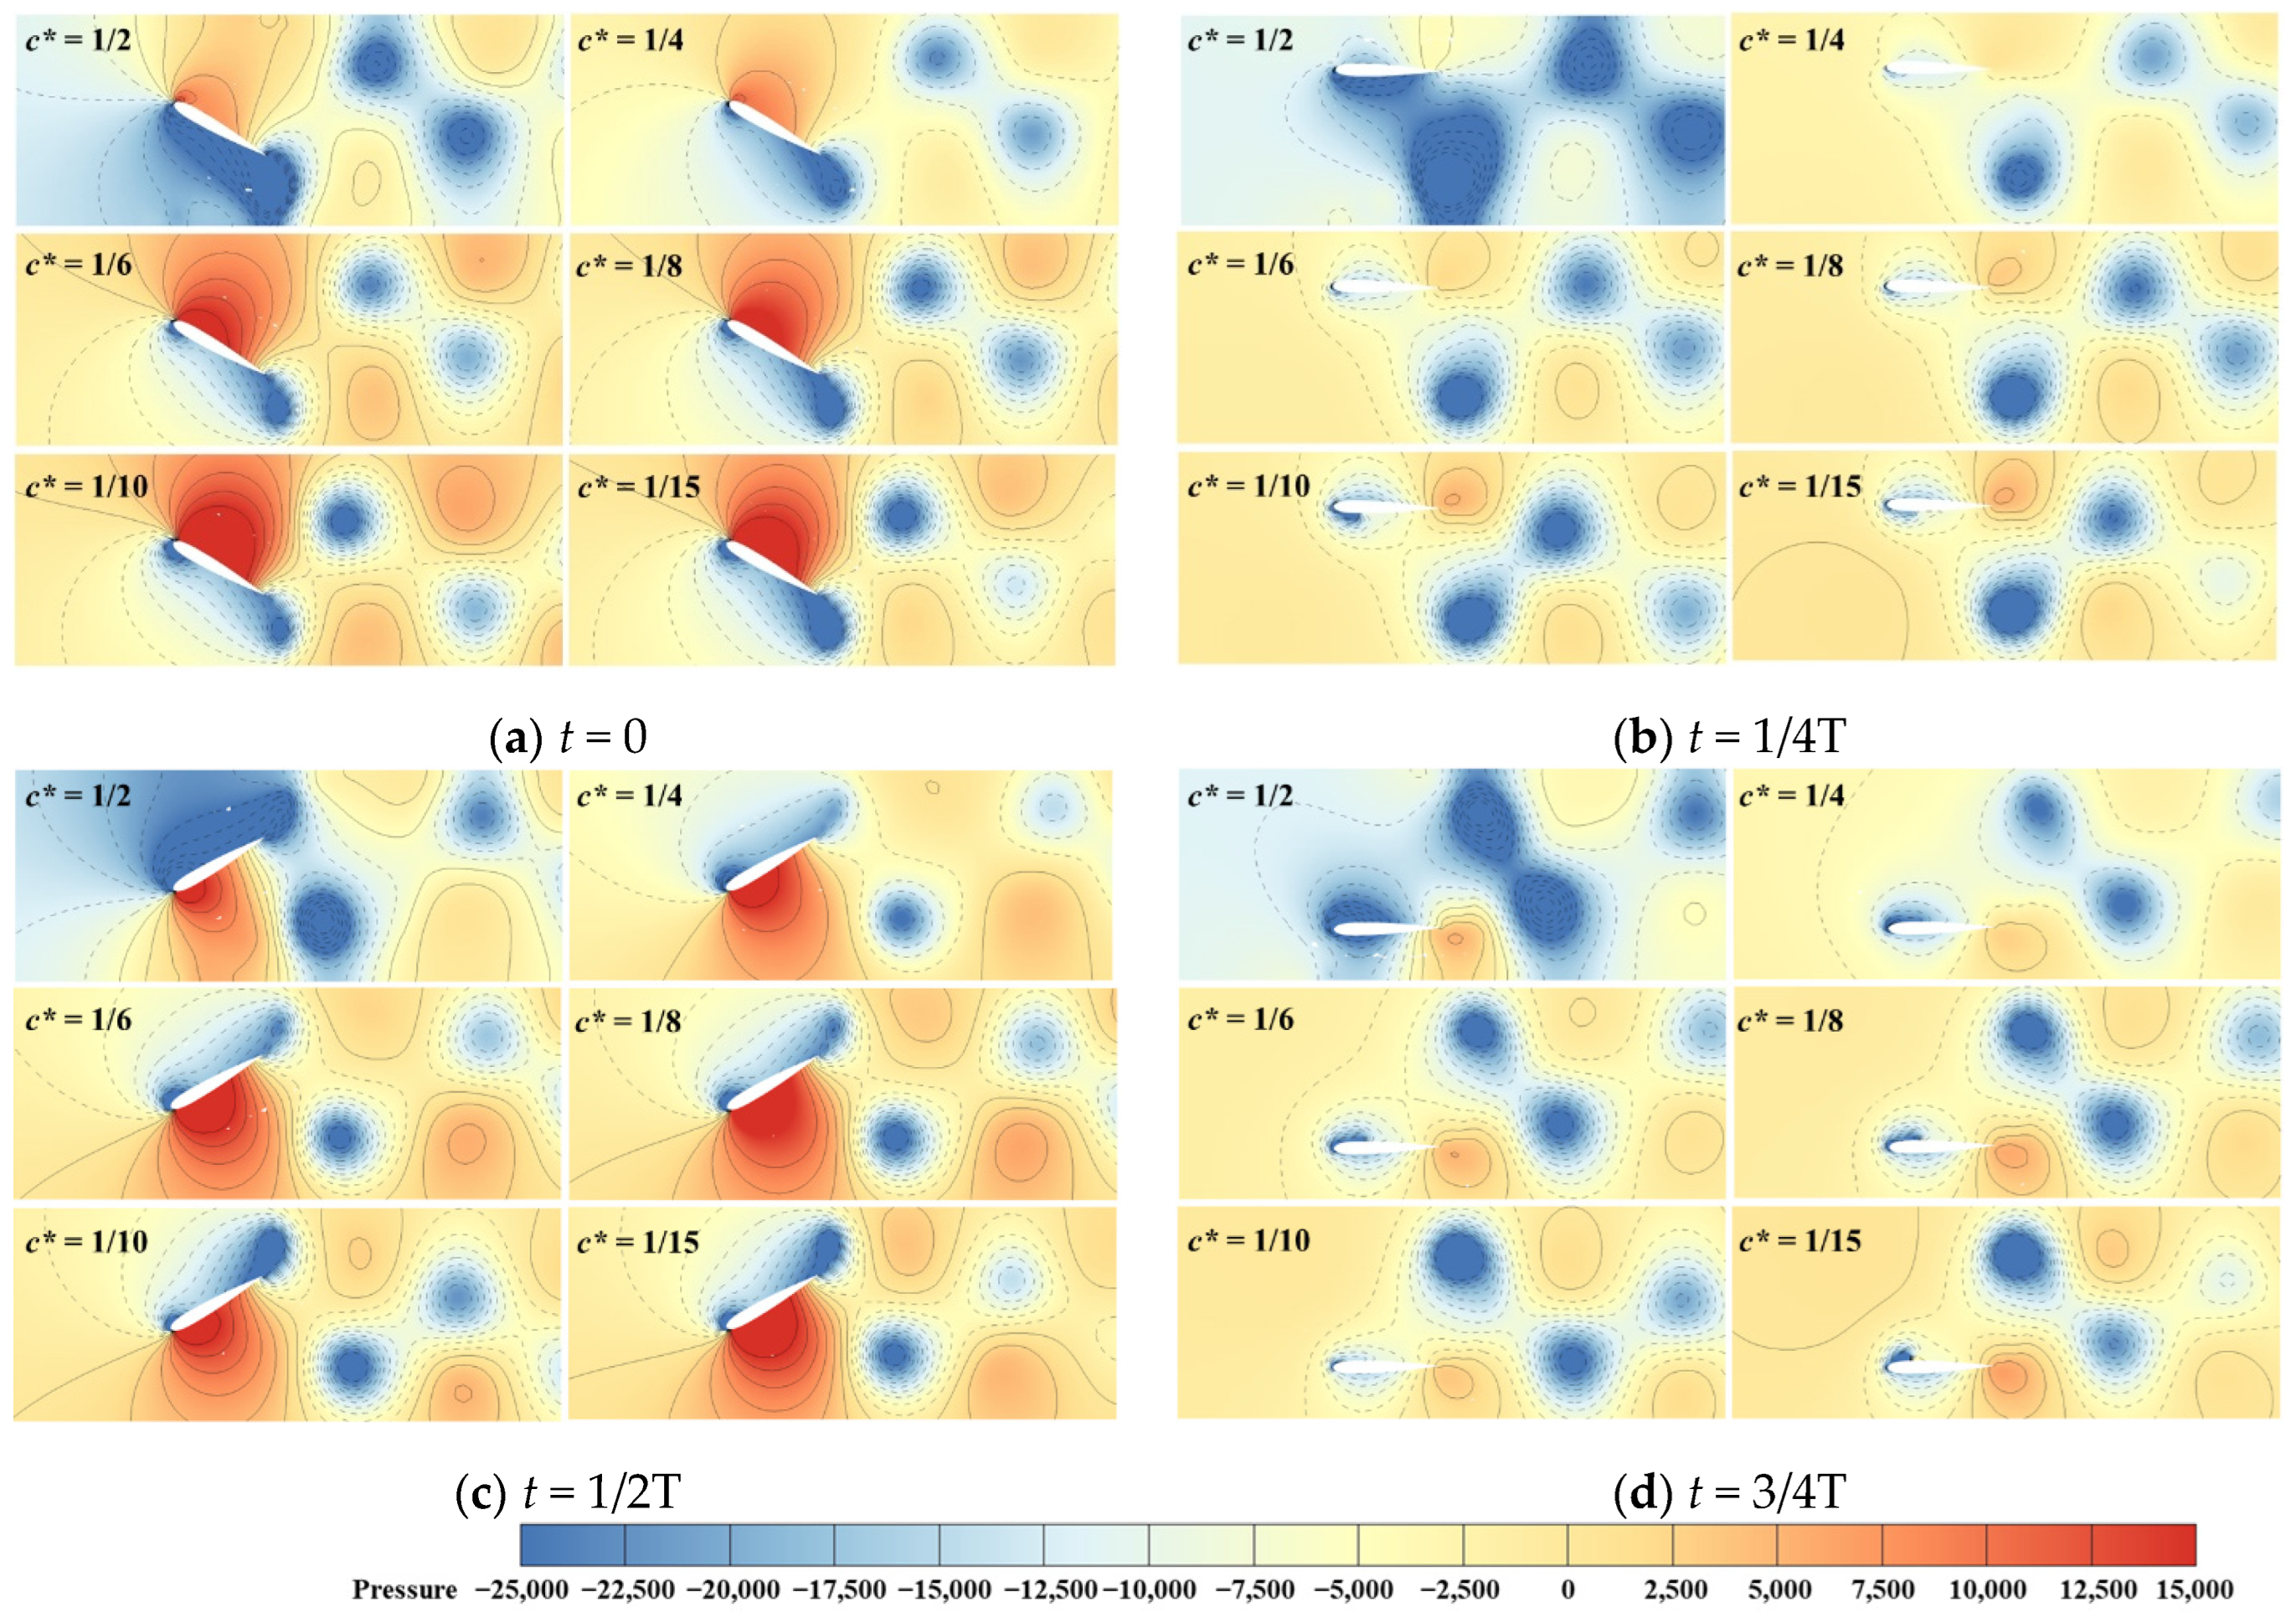
5.2. Effects of Relative Chord Length and Motion Frequency on Pushing-Water Performance

The force of the flapping hydrofoil on the water body in the process of movement can be decomposed into horizontal thrust and vertical lift, the existence of thrust is the main reason why the flapping hydrofoil can push the water body to flow forward. Figure 11 shows the curves of mean thrust with motion frequency for different relative chord lengths.
From Figure 11, it can be seen that the mean thrust produced by the flapping hydrofoil on the water body increases significantly with the increase in the motion frequency of the flapping hydrofoil, and the mean thrust is approximately proportional to the square of the motion frequency of the flapping hydrofoil. This is mainly because that the increase in motion frequency increases the work enacted on the water body per unit of time, increasing the mean thrust. In addition, the mean thrust decreases with increasing relative chord length, which is due to the wall spacing affecting the flapping hydrofoil’s force on the water column; at larger relative chord lengths, the flapping hydrofoil is closer to the bank slope, at which time the flapping lift increases and the thrust decreases. As the relative chord length decreases, the influence of the bank slope on the flapping hydrofoil gradually decreases, at which time the flapping lift decreases and the thrust increases.
In order to further analyze the effects of different relative chord lengths on the mechanical properties of the flapping hydrofoil, the periodic variation curves of the instantaneous thrust coefficient and instantaneous power coefficient under different relative chord lengths at the motion frequency f = 2.5 Hz are plotted, as shown in Figure 12. From the figure, it can be seen that the instantaneous thrust coefficient and instantaneous power coefficient have the same trend of change, and the moments of peaks and valleys of the instantaneous thrust coefficient correspond to the instantaneous power coefficient.
From Figure 12, it can be seen that the instantaneous thrust coefficient and instantaneous power coefficient have the same trend of change, and the moments of peaks and valleys of the instantaneous thrust coefficient correspond to the instantaneous power coefficient. There are two peaks and two valleys in one motion cycle, with the relative chord length decreasing, the absolute value of the peaks and valleys increase accordingly, and the absolute value of the peaks increases much faster than the valleys, which corresponds to the trend of the mean thrust decreasing with the relative chord length in Figure 11. Meanwhile, the instantaneous thrust coefficients are always greater than zero at different relative chord lengths, indicating that the flapping hydrofoil always generates positive thrust to push the water flow during the motion.
In addition, since the force generated by flapping hydrofoil motion is directly reacted to the distribution of pressure around the flapping hydrofoil, in order to more intuitively show the effect of relative chord length on the thrust, the pressure periodic variation cloud diagram near the flapping hydrofoil under different relative chord lengths when the motion frequency f = 2.5 Hz is analyzed, as shown in Figure 13.
It can be seen in Figure 13 that when the flapping hydrofoil starts to move upward from t = 0, the positive pressure on the upper surface of the flapping hydrofoil increases, and the negative pressure on the lower surface decreases. The pressure difference between the upper and lower surfaces increases with the decrease in the relative chord length. The increase in the pressure difference increases the thrust of the flapping hydrofoil in the horizontal direction, so the first peak in Figure 12a increases with the decrease in the relative chord length. At t = T/4, the flapping hydrofoil moves to the upper limit position, at which time the speed of the heave motion is zero, and the intensity of the positive pressure zone on the upper hydrofoil surface of the flapping hydrofoil is weakened. When the flapping hydrofoil continues to move downward from the upper limit position to t = T/2, since the heave and pitch motion of the lapping hydrofoil are both downward, a negative pressure zone is formed on the upper surface of the flapping hydrofoil, and a positive pressure zone is formed on the lower surface. The pressure difference between the upper and lower surfaces in the horizontal direction increases, thereby generating a greater instantaneous thrust to form the second peak. At t = 3T/4, the flapping hydrofoil moves to the lower limit position, the intensity of the positive pressure zone on the lower surface of the flapping hydrofoil decreases, the pressure difference decreases, and the instantaneous thrust reaches the second valley value, and the valley value decreases with the decrease in the relative chord length.
From the above analysis, the flapping hydrofoil device can effectively promote the flow of water in small rivers. In order to further analyze the influence of motion frequency and relative chord length on the pushing-water performance, a curve of the water-pushing characteristics of the flapping hydrofoil under different relative chord lengths as the motion frequency changes is drawn, as shown in Figure 14.
From Figure 14a, it can be seen that the larger the relative chord length is, the greater the increase in the mean flow velocity of the water body with frequency is. The reason for this is that as the relative chord length decreases, the watershed area becomes larger, and the proportion of low-velocity water near the wall of both sides of the bank slope increases, which in turn decreases the increase in the mean flow velocity of the water body with frequency. From the analysis of Figure 14b, it can be seen that the pushing-water efficiency increases with the increase in the relative chord length, and the larger the relative chord length, the more obvious the increase. As the frequency increases, the pushing-water efficiency will first increase and then tend to be stable.
In addition, the relative chord length has a greater impact on the pushing-water efficiency, while the motion frequency has a smaller impact on the pushing-water efficiency. The pushing-water efficiency reaches a maximum value of 51.04% when c* = 1/2 and f = 2.5 Hz, 24.59% when c* = 1/8 and f = 2.5 Hz, and a minimum value of 12.16% when c* = 1/15 and f = 0.25 Hz. Combining the analysis of Figure 11 and Figure 14a, it can be seen that although the mean thrust of the flapping hydrofoil is inversely proportional to the relative chord length, the mean flow velocity of the water body changes more significantly and has a greater impact on the propulsion performance. Therefore, the final performance is that the pushing-water efficiency is proportional to the relative chord length.
As can be seen in Figure 10 and Figure 14b, when c* = 1/2 and f is varied from 2.5 Hz to 0.25 Hz, the pushing-water efficiency is maintained at 46.30% (just less than 5% below the peak at f = 2.5 Hz), while the near-shore current mean scouring force is reduced by 99.7% (from 40.66 Pa to 0.115 Pa). This shows that choosing a larger relative chord length c* and a smaller frequency f will slightly sacrifice efficiency but greatly reduce environmental risks, making this combination ideal for practical applications.

6. Conclusions

This paper numerically calculates the flow field of the flapping hydrofoil device in the river channel when it performs heave and pitch coupled motion. The maximum bank slope scouring section corresponding to the flapping hydrofoil at the maximum bank slope scouring installation height is used as the reference plane, and numerical calculations are performed on this plane. The pushing-water performance of the flapping hydrofoil under different motion frequencies and different relative chord lengths is analyzed, and its influence on the bank slope scouring effect is explored, and the following conclusions are drawn:
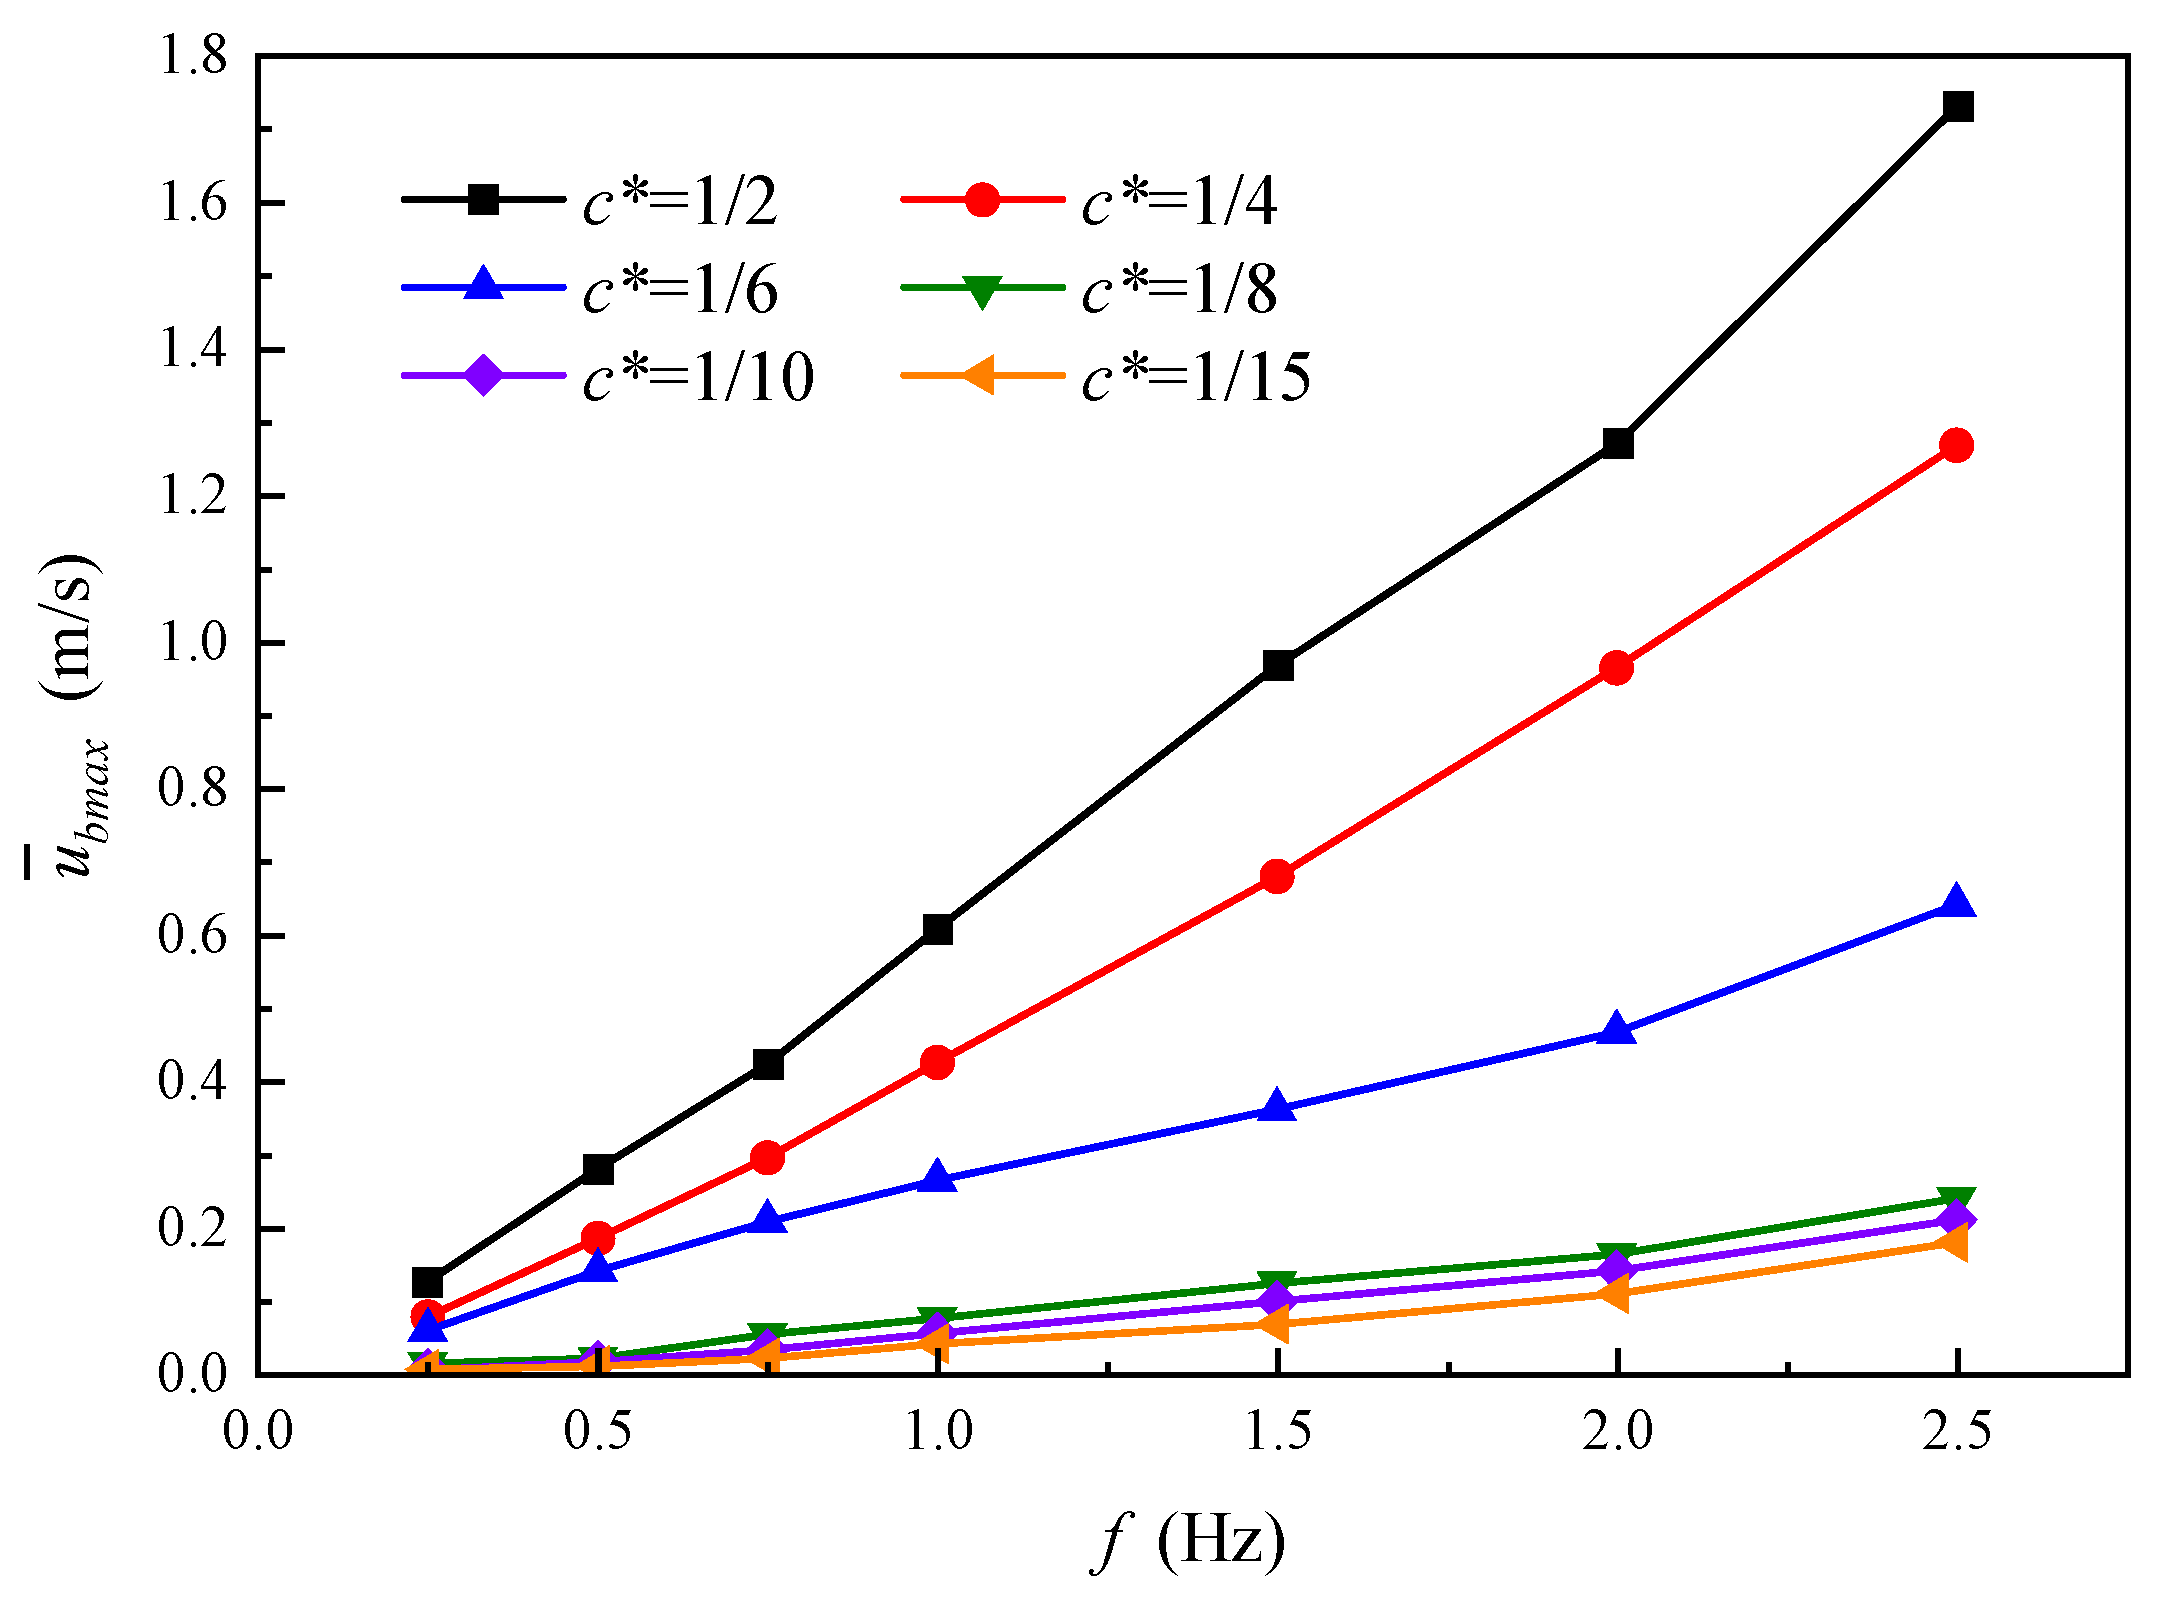
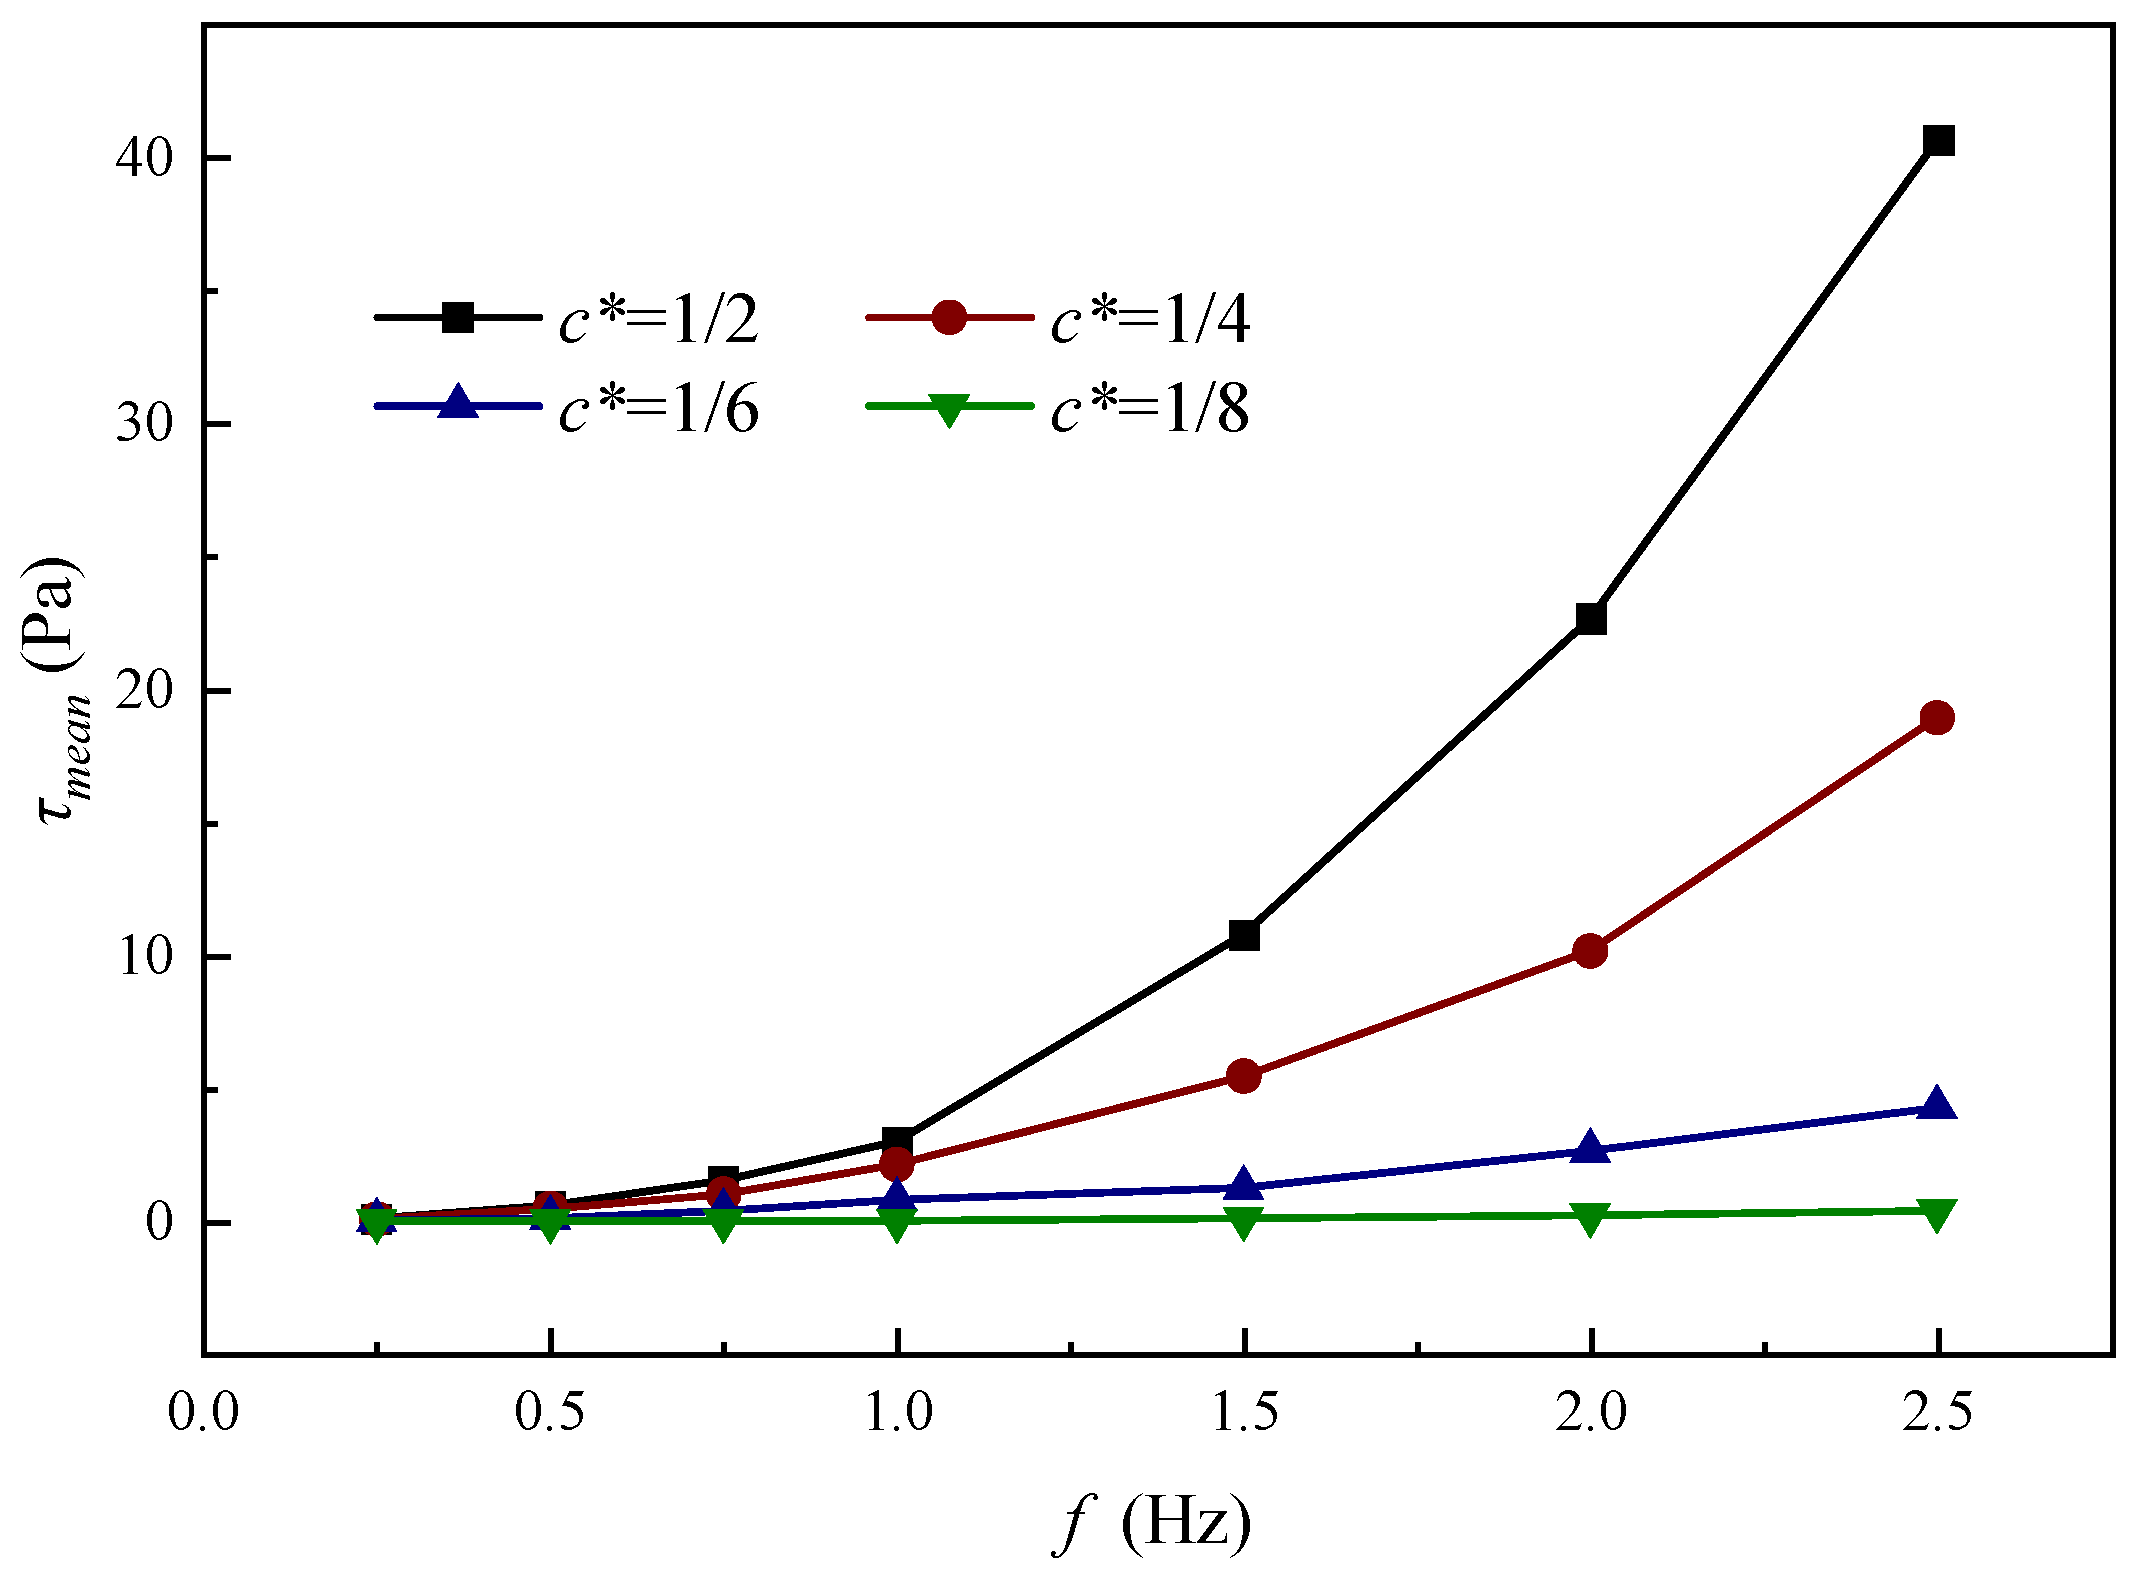
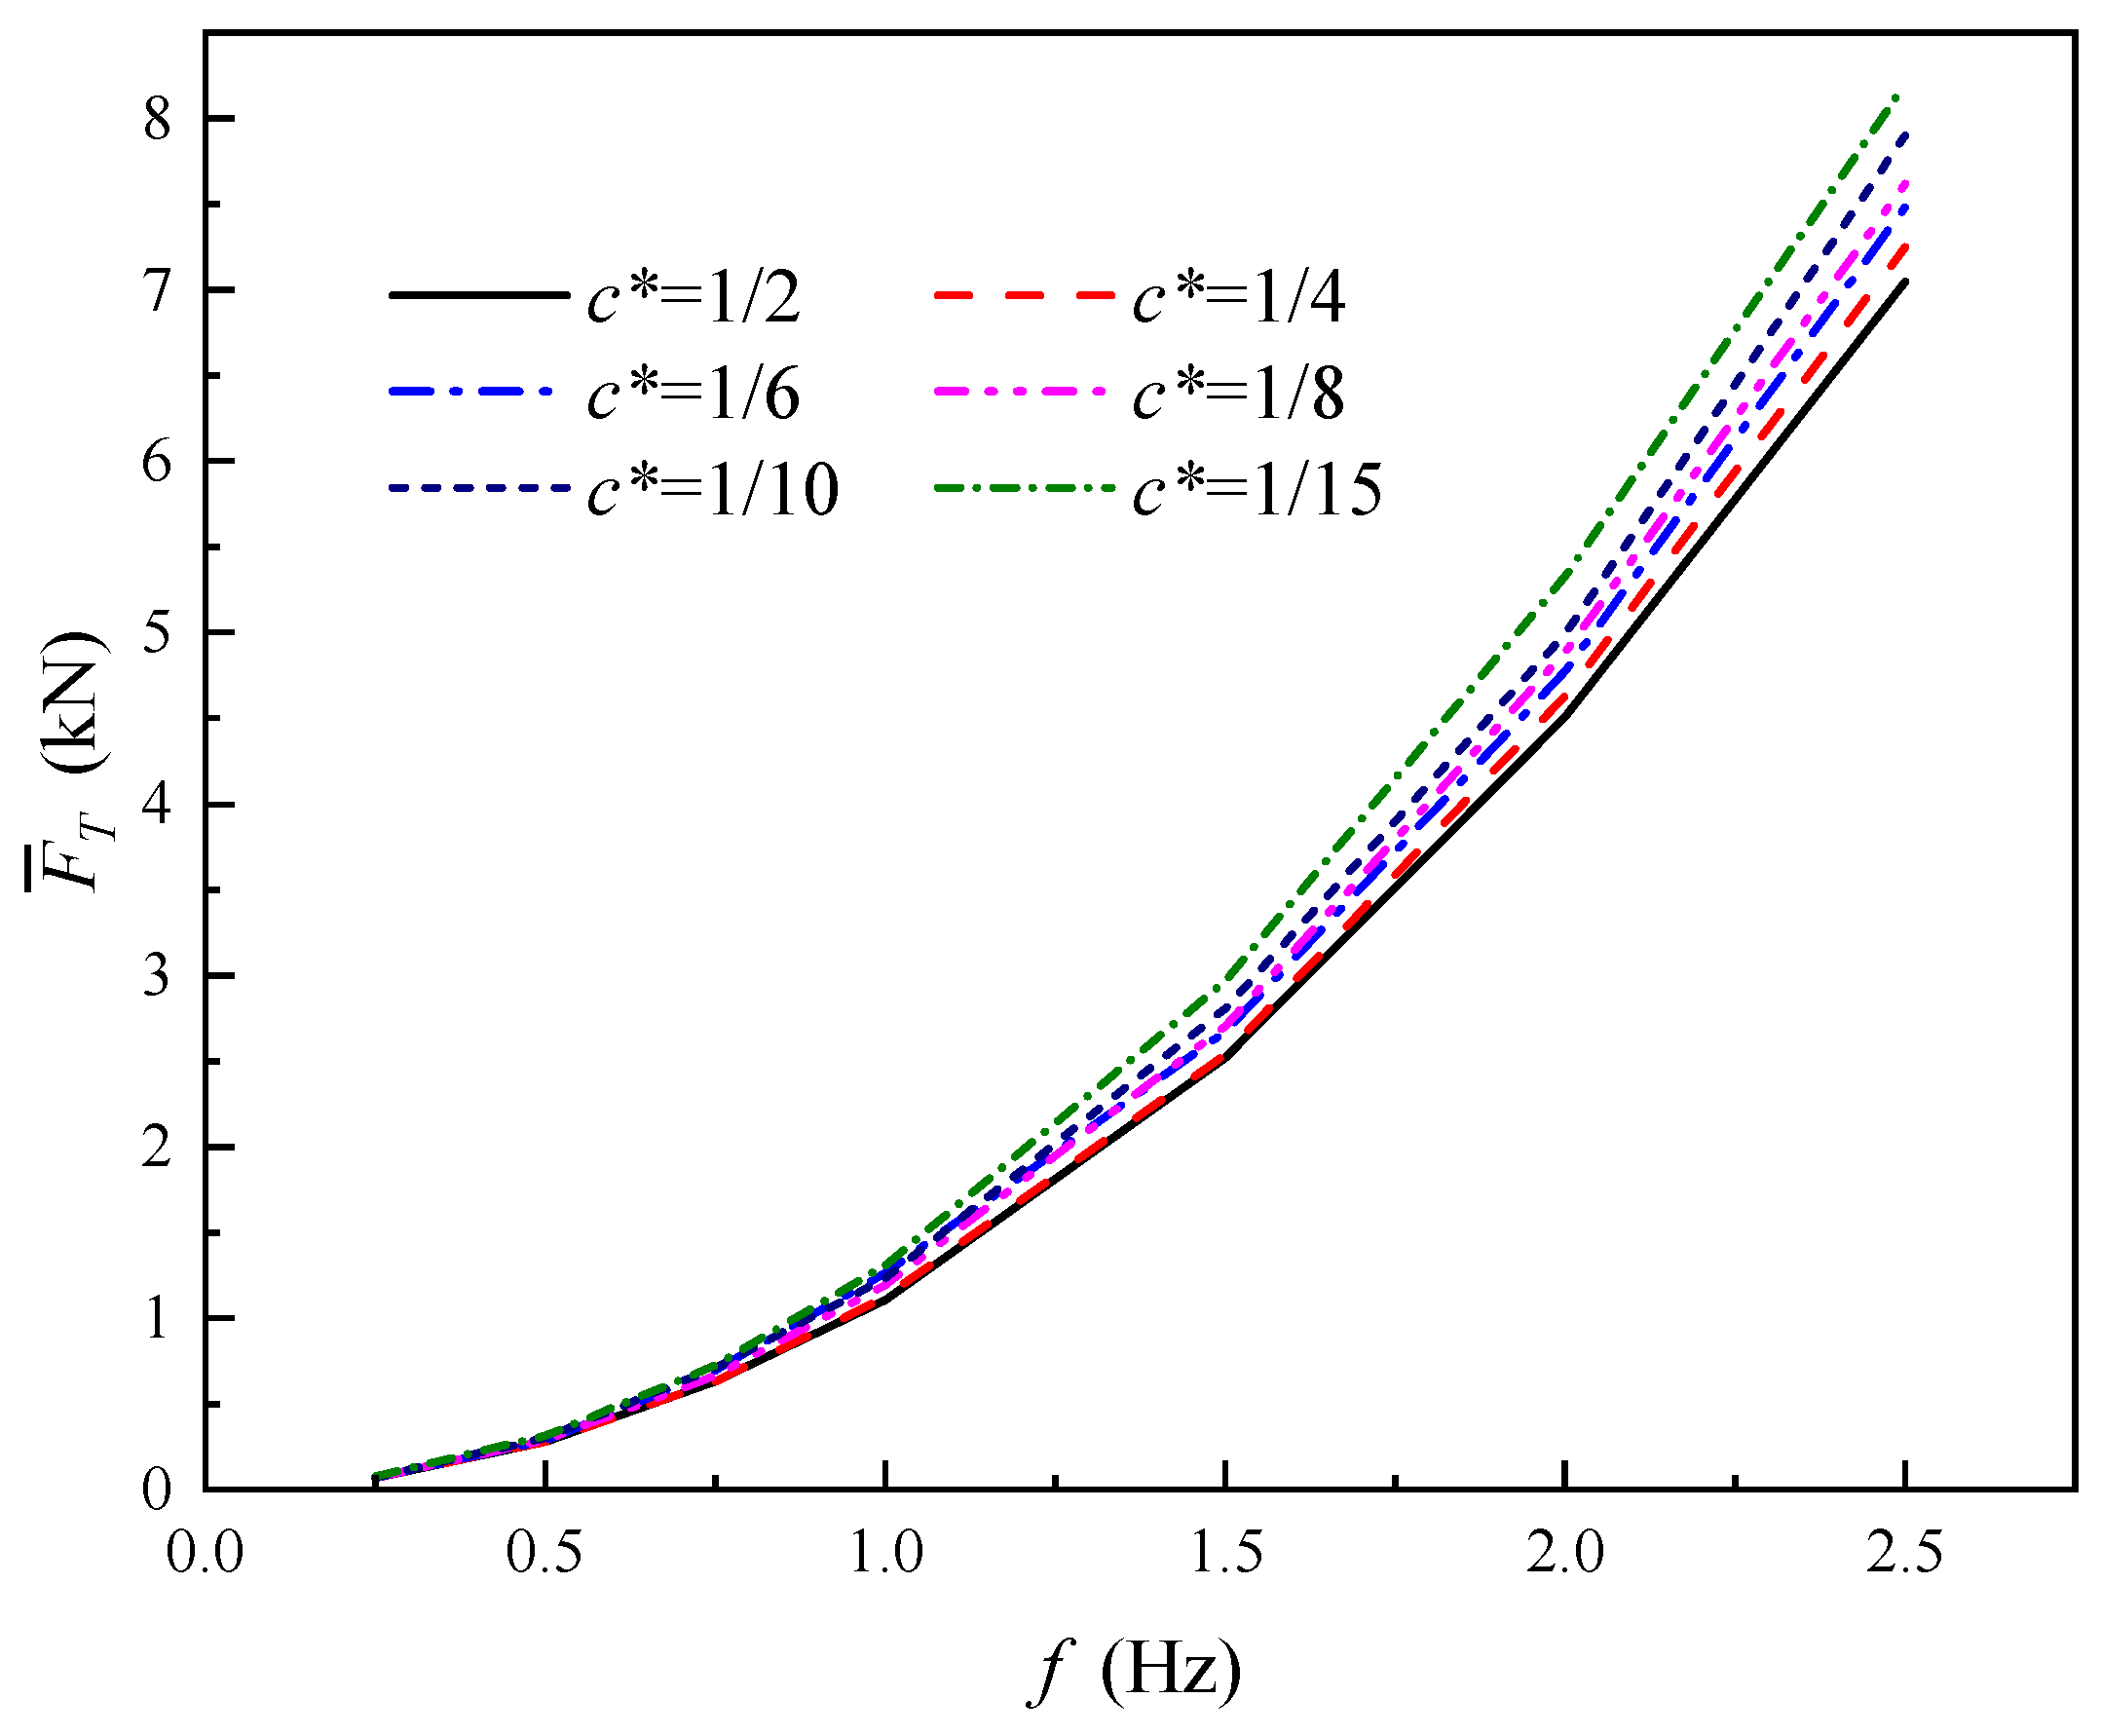
  • The near-shore current mean scouring force is proportional to the frequency f and the relative chord length c*, and the effect of frequency f on the flapping hydrofoil’s bank slope scour increases with the relative chord length c*. The pushing-water efficiency of flapping hydrofoil increases significantly with the increase in c*, and tends to level off after increasing gradually with the increase in f. In addition, the effect of c* on the pushing-water efficiency is larger than that of f.
  • As the relative chord length c* decreases, the threshold frequency at which bank slopes do not scour gradually increases. When c* is 1/2, 1/4, 1/6, and 1/8, the corresponding bank slope scour-free threshold frequencies are 0.65 Hz, 0.70 Hz, 1.26 Hz, and 3.50 Hz, respectively.
  • When c* is certain, reducing f can significantly reduce the near-shore current mean scouring force, but the effect on pushing-water efficiency is small. By reasonably selecting the combination of larger c* and smaller f, the bank slope scours can be effectively reduced while maintaining high pushing-water efficiency. According to the results of this paper, it is recommended to select the combination of c* = 1/2 and f = 0.65 Hz to achieve the optimum effect.
Through the study of this paper, a set of optimal parameter combinations are found to ensure the pushing-water efficiency while reducing bank slope scour. It provides a ‘high efficiency’ and ‘low scour’ technical solution for improving the hydrodynamics of small rivers in the plains network, and at the same time provides a theoretical reference for the optimal design of flapping hydrofoil devices in practical applications.

Author Contributions

Conceptualization, E.H.; methodology, C.L.; software, C.L.; validation, M.X., C.L. and Y.S.; formal analysis, Y.S.; investigation, M.X.; resources, E.H.; data curation, C.L.; writing—original draft preparation, C.L.; writing—review and editing, Q.S.; visualization, T.W.; supervision, C.L.; project administration, E.H.; funding acquisition, E.H. All authors have read and agreed to the published version of the manuscript.

Funding

This research was funded by the Zhejiang Provincial Key Research and Development Project (Grant No. 2021C03019).

Data Availability Statement

Data are contained within the article.

Acknowledgments

The authors gratefully thank the Zhejiang Provincial Key Research and Development Project for their financial support.

Conflicts of Interest

The authors declare no conflicts of interest.

References

  1. Tang, H.; Yuan, S.; Cao, H. Theory and practice of hydrodynamic reconstruction in plain river networks. Engineering 2023, 24, 202–211. [Google Scholar]
  2. Zhang, X.; Zheng, X.; Wang, L. Application of Relay Pump Station to Coastal Plain Drainage. J. Chang. River Sci. Res. Inst. 2018, 35, 46–51. [Google Scholar]
  3. Xie, L.; Wang, F.; He, C. Experimental investigation on hydrodynamic characteristics of a 15-degree slanted axial-flow pump system. J. Hydraul. Eng. 2019, 50, 798–805. [Google Scholar]
  4. Hua, E.; Tang, S.; Chen, W. Analysis on influence of swinging modes of swing hydrofoil on water propulsion. J. Hydroelectr. Eng. 2022, 41, 93–103. [Google Scholar]
  5. Hua, E.; Chen, W.; Tang, S.; Xie, R.S.; Guo, X.M.; Xu, G.H. Water Pushing Flow Characteristics of Flapping Hydrofoil Device in Small River. Trans. Chin. Soc. Agric. Mach. 2022, 53, 154–162. [Google Scholar]
  6. Xu, W.; Xu, G.; Duan, W.; Song, Z.; Lei, J. Experimental and numerical study of a hydrokinetic turbine based on tandem flapping hydrofoils. Energy 2019, 174, 375–385. [Google Scholar]
  7. Wu, X.; Zhang, X.; Tian, X.; Li, X.; Lu, W. A review on fluid dynamics of flapping foils. Ocean Eng. 2020, 195, 106712. [Google Scholar]
  8. Von Kármán, T. General aerodynamic theory-perfect fluids. Aerodyn. Theory 1935, 2, 346–349. [Google Scholar]
  9. Freymuth, P. Propulsive vortical signature of plunging and pitching airfoils. AIAA J. 1988, 26, 881–883. [Google Scholar]
  10. Chao, L.M.; Pan, G.; Zhang, D.; Yan, G.X. Numerical investigations on the force generation and wake structures of a non-sinusoidal pitching foil. J. Fluids Struct. 2019, 85, 27–39. [Google Scholar]
  11. Song, B.; Zhou, W. Numerical Simulation Study on Hydrodynamic of Flapping Wing Propulsion Affected by Swing Frequency. Sci. Technol. Eng. 2012, 12, 1821–1824+1840. [Google Scholar]
  12. Ding, H.; Song, B.; Tian, W. Exploring Propulsion Performance Analysis of Bionic Flapping Hydrofoil. J. Northwestern Polytech. Univ. 2013, 31, 150–156. [Google Scholar]
  13. Read, D.A.; Hover, F.S.; Triantafyllou, M.S. Forces on oscillating foils for propulsion and maneuvering. J. Fluids Struct. 2003, 17, 163–183. [Google Scholar]
  14. Zhang, S.; Yan, W.; Zhou, J.; Mei, L.; Yu, D. Influence of tip shapes on hydrodynamic performance of low-aspect-ratio oscillating foils. J. Ship Mech. 2022, 26, 628–644. [Google Scholar]
  15. Gao, P.; Huang, Q.; Pan, G.; Zhao, J. Experimental study on hydrodynamic characteristics of flexible flapping foil. J. Huazhong Univ. Sci. Technol. (Nat. Sci. Ed.) 2022, 50, 144–148. [Google Scholar] [CrossRef]
  16. Fan, Z.; Han, J.; Chen, G. Investigation on the influence of aspect ratio on the thrust performance of bionic motion wing under low Reynolds number. Acta Aerodyn. Sin. 2018, 36, 156–162. [Google Scholar]
  17. Ding, H.; Chen, R.; Zhu, Y.; Shen, H.; Gao, Q. Effect of Frequency–Amplitude Parameter and Aspect Ratio on Propulsion Performance of Underwater Flapping-Foil. Biomimetics 2024, 9, 324. [Google Scholar] [CrossRef]
  18. Kumar, R.; Shin, H. Thrust prediction of an active flapping foil in waves using CFD. J. Mar. Sci. Eng. 2019, 7, 396. [Google Scholar] [CrossRef]
  19. Wang, P.; Tian, X.; Lu, W.; Hu, Z.; Luo, Y. Dynamic modeling and simulations of the wave glider. Appl. Math. Model. 2019, 66, 77–96. [Google Scholar]
  20. Kinsey, T.; Dumas, G. Parametric study of an oscillating airfoil in a power-extraction regime. AIAA J. 2008, 46, 1318–1330. [Google Scholar]
  21. Li, W.; Bao, Y. Effects of motion parameters on energy harvesting performance of flapping foils. J. Hydroelectr. Eng. 2023, 42, 79–86. [Google Scholar]
  22. Kinsey, T.; Dumas, G. Computational fluid dynamics analysis of a hydrokinetic turbine based on oscillating hydrofoils. J. Fluids Eng. 2012, 134. [Google Scholar] [CrossRef]
  23. Xu, L.; Wang, Y.; Zhao, W.; Jiang, E. Review on riverbank soil collapse. In MATEC Web of Conferences; EDP Sciences: Les Ulis, France, 2018; Volume 246, p. 01021. [Google Scholar]
  24. Dou, G.; Dou, X. Classical Theory of Sediment Movement; Science Press: Beijing, China, 2023. [Google Scholar]
  25. Ma, Z.P.; Zhang, G.G.; Gao, G.Y.; Tian, G.Z. Discussion on incipient condition of a noncohesive sediment particle on slope under 3D flow. J. Sediment Res. 2014, 3, 36–41. [Google Scholar]
  26. Wu, Y.; Han, Q.; Ba, Y. Incipient Velocity of Non-Uniform Sediment on Sloping Fluvial Beds. J. Tianjin Univ. 2012, 45, 209–214. [Google Scholar]
  27. Zhang, F.; Chen, X. Research progress on stability analysis of embankment under effects of river scouring. Adv. Sci. Technol. Water Resour. 2009, 29, 84–88. [Google Scholar]
  28. Wang, Y.; Kuang, S. Study on bank erosion and its influence on bank collapse. J. China Inst. Water Resour. Hydropower Res. 2005, 4, 251–257+296. [Google Scholar]
  29. Hu, P.; Cui, X.; Zhou, Z. Principle and Method of River Cross Section Regularization in Watershed Hydrological Model. J. China Hydrol. 2010, 30, 38–41,79. [Google Scholar]
  30. Lighthill, M.J. Aquatic animal propulsion of high hydromechanical efficiency. J. Fluid Mech. 1970, 44, 265–301. [Google Scholar]
  31. Hua, E.; Luo, H.; Xie, R.; Chen, W.; Tang, S.; Jin, D. Investigation on the Influence of Flow Passage Structure on the Performance of Bionic Pumps. Processes 2022, 10, 2569. [Google Scholar] [CrossRef]
  32. Li, Y.; Pan, Z.; Zhang, N. Numerical analysis on the propulsive performance of oscillating wing in ground effect. Appl. Ocean. Res. 2021, 114, 102772. [Google Scholar]
  33. Cheng, N.S.; Chiew, Y.M. Pickup probability for sediment entrainment. J. Hydraul. Eng. 1998, 124, 232–235. [Google Scholar]
  34. Hanson, G.J.; Cook, K.R.; Simon, A. Non-vertical jet testing of cohesive streambank materials. In Proceedings of the ASAE Annual Meeting, Chicago, IL, USA, 28 July–31 July 2002. [Google Scholar]
  35. Karmaker, T.; Dutta, S. Erodibility of fine soil from the composite river bank of Brahmaputra in India. Hydrol. Process. 2011, 25, 104–111. [Google Scholar]
  36. Du, X.; Zhang, Z. Numerical analysis of influence of four flapping modes on propulsion performance of underwater flapping foils. Eng. Mech. 2018, 35, 249–256. [Google Scholar]
  37. Shaheed, R.; Mohammadian, A.; Kheirkhah, G.H. A comparison of standard k–ε and realizable k–ε turbulence models in curved and confluent channels. Environ. Fluid Mech. 2019, 19, 543–568. [Google Scholar]
Figure 1. Schematic diagram of the movement of the flapping hydrofoil device in a small river channel.
Water 17 01026 g001
Figure 2. Schematic diagram of grid division of computational domain.
Water 17 01026 g002
Figure 3. Verification of independence: (a) time steps; (b) grid number.
Water 17 01026 g003
Figure 4. Comparison of numerical and experimental data.
Water 17 01026 g004
Figure 5. Computational domain and boundary conditions for 3D simulation.
Water 17 01026 g005
Figure 6. Installation location schematic.
Water 17 01026 g006
Figure 7. Velocity distribution in the near-shore flow field at three different installation heights and the corresponding cross-section of the maximum bank slope scour force: (a) Z = 0.2 m (b) Z = 0 m (c) Z = −0.2 m.
Water 17 01026 g007
Figure 8. Curves of maximum time-averaged near-shore flow velocity changing with frequency under different relative chord lengths.
Water 17 01026 g008
Figure 9. Velocity contours at different relative chord lengths when f = 0.5, 1.5, 2.5 Hz.
Water 17 01026 g009
Figure 10. Curves of the near-shore current mean scouring force with the frequency under different relative chord lengths.
Water 17 01026 g010
Figure 11. Curves of mean thrust versus frequency for different relative chord lengths.
Water 17 01026 g011
Figure 12. Periodic variation curves of the instantaneous thrust coefficient and instantaneous power coefficient under different relative chord lengths at f = 2.5 Hz: (a) instantaneous thrust coefficient, (b) instantaneous power coefficient.
Water 17 01026 g012
Figure 13. Cloud diagram of pressure cycle variation near flapping hydrofoil under different relative chord lengths at f = 2.5 Hz.
Water 17 01026 g013
Figure 14. Curves of pushing-water characteristics versus frequency for flapping hydrofoils with different relative chord lengths: (a) the mean flow velocity of the water, (b) the pushing-water efficiency.
Water 17 01026 g014
Table 1. Maximum time-averaged near-shore flow velocity and maximum scouring force for different cross-sections.
Installation HeightsCross-SectionsMaximum Time-Averaged Near-Shore Flow Velocity, m/sMaximum Scouring Force, Pa
Z = 0.2 m11.0432.46
Z = 0 m20.8019.21
Z = −0.2 m31.2849.17
Table 2. Relationship between τmean and f at different relative chord lengths.
The Relative Chord LengthsThe τmeanf RelationshipThe Threshold Frequencies
1/2τmean = 1.449 f3 + 3.434 f2 − 1.359 f0.65 Hz
1/4τmean = 0.881 f3 + 0.582 f2 − 0.574 f0.70 Hz
1/6τmean = 0.118 f3 + 0.309 f2 − 0.206 f1.26 Hz
1/8τmean = 0.014 f3 + 0.040 f2 − 0.028 f3.50 Hz
Disclaimer/Publisher’s Note: The statements, opinions and data contained in all publications are solely those of the individual author(s) and contributor(s) and not of MDPI and/or the editor(s). MDPI and/or the editor(s) disclaim responsibility for any injury to people or property resulting from any ideas, methods, instructions or products referred to in the content.

