
Absolute Meteorological Drought Indices Validated Against Irrigation Amounts


Abstract
:1. Introduction
- The Standardized Precipitation Index (SPI) [8], which is a widely used measure of drought that evaluates precipitation over a specific period relative to historical averages. It is dimensionless, with negative values indicating drought and values below −2.0 reflecting extreme drought. Its strength lies in its simplicity and broad applicability across different climates, but it does not consider evapotranspiration, which can be a critical factor in regions with high temperatures.
- The Standardized Precipitation-Evapotranspiration Index (SPEI) [9] builds on SPI by incorporating potential evapotranspiration. This makes it more suitable for assessing droughts influenced by high evapotranspiration rates.
- The Rainfall Anomaly Index (RAI) [10] measures deviations in precipitation relative to historical norms, highlighting both drought and excessive rainfall. While straightforward, it lacks the nuance provided by indices like SPEI, which consider evapotranspiration.
- The Aridity Index (AI) [11] is the ratio of total precipitation to potential evapotranspiration, used for defining arid, semi-arid, and dry sub-humid regions and drought monitoring worldwide. It does not account for short-term climate variability and, like the other indices, it does not provide information about the absolute amount of precipitation deficits.
2. Materials and Methods
2.1. Climate of The Netherlands
2.2. Irrigation Data

2.3. Drought Indices
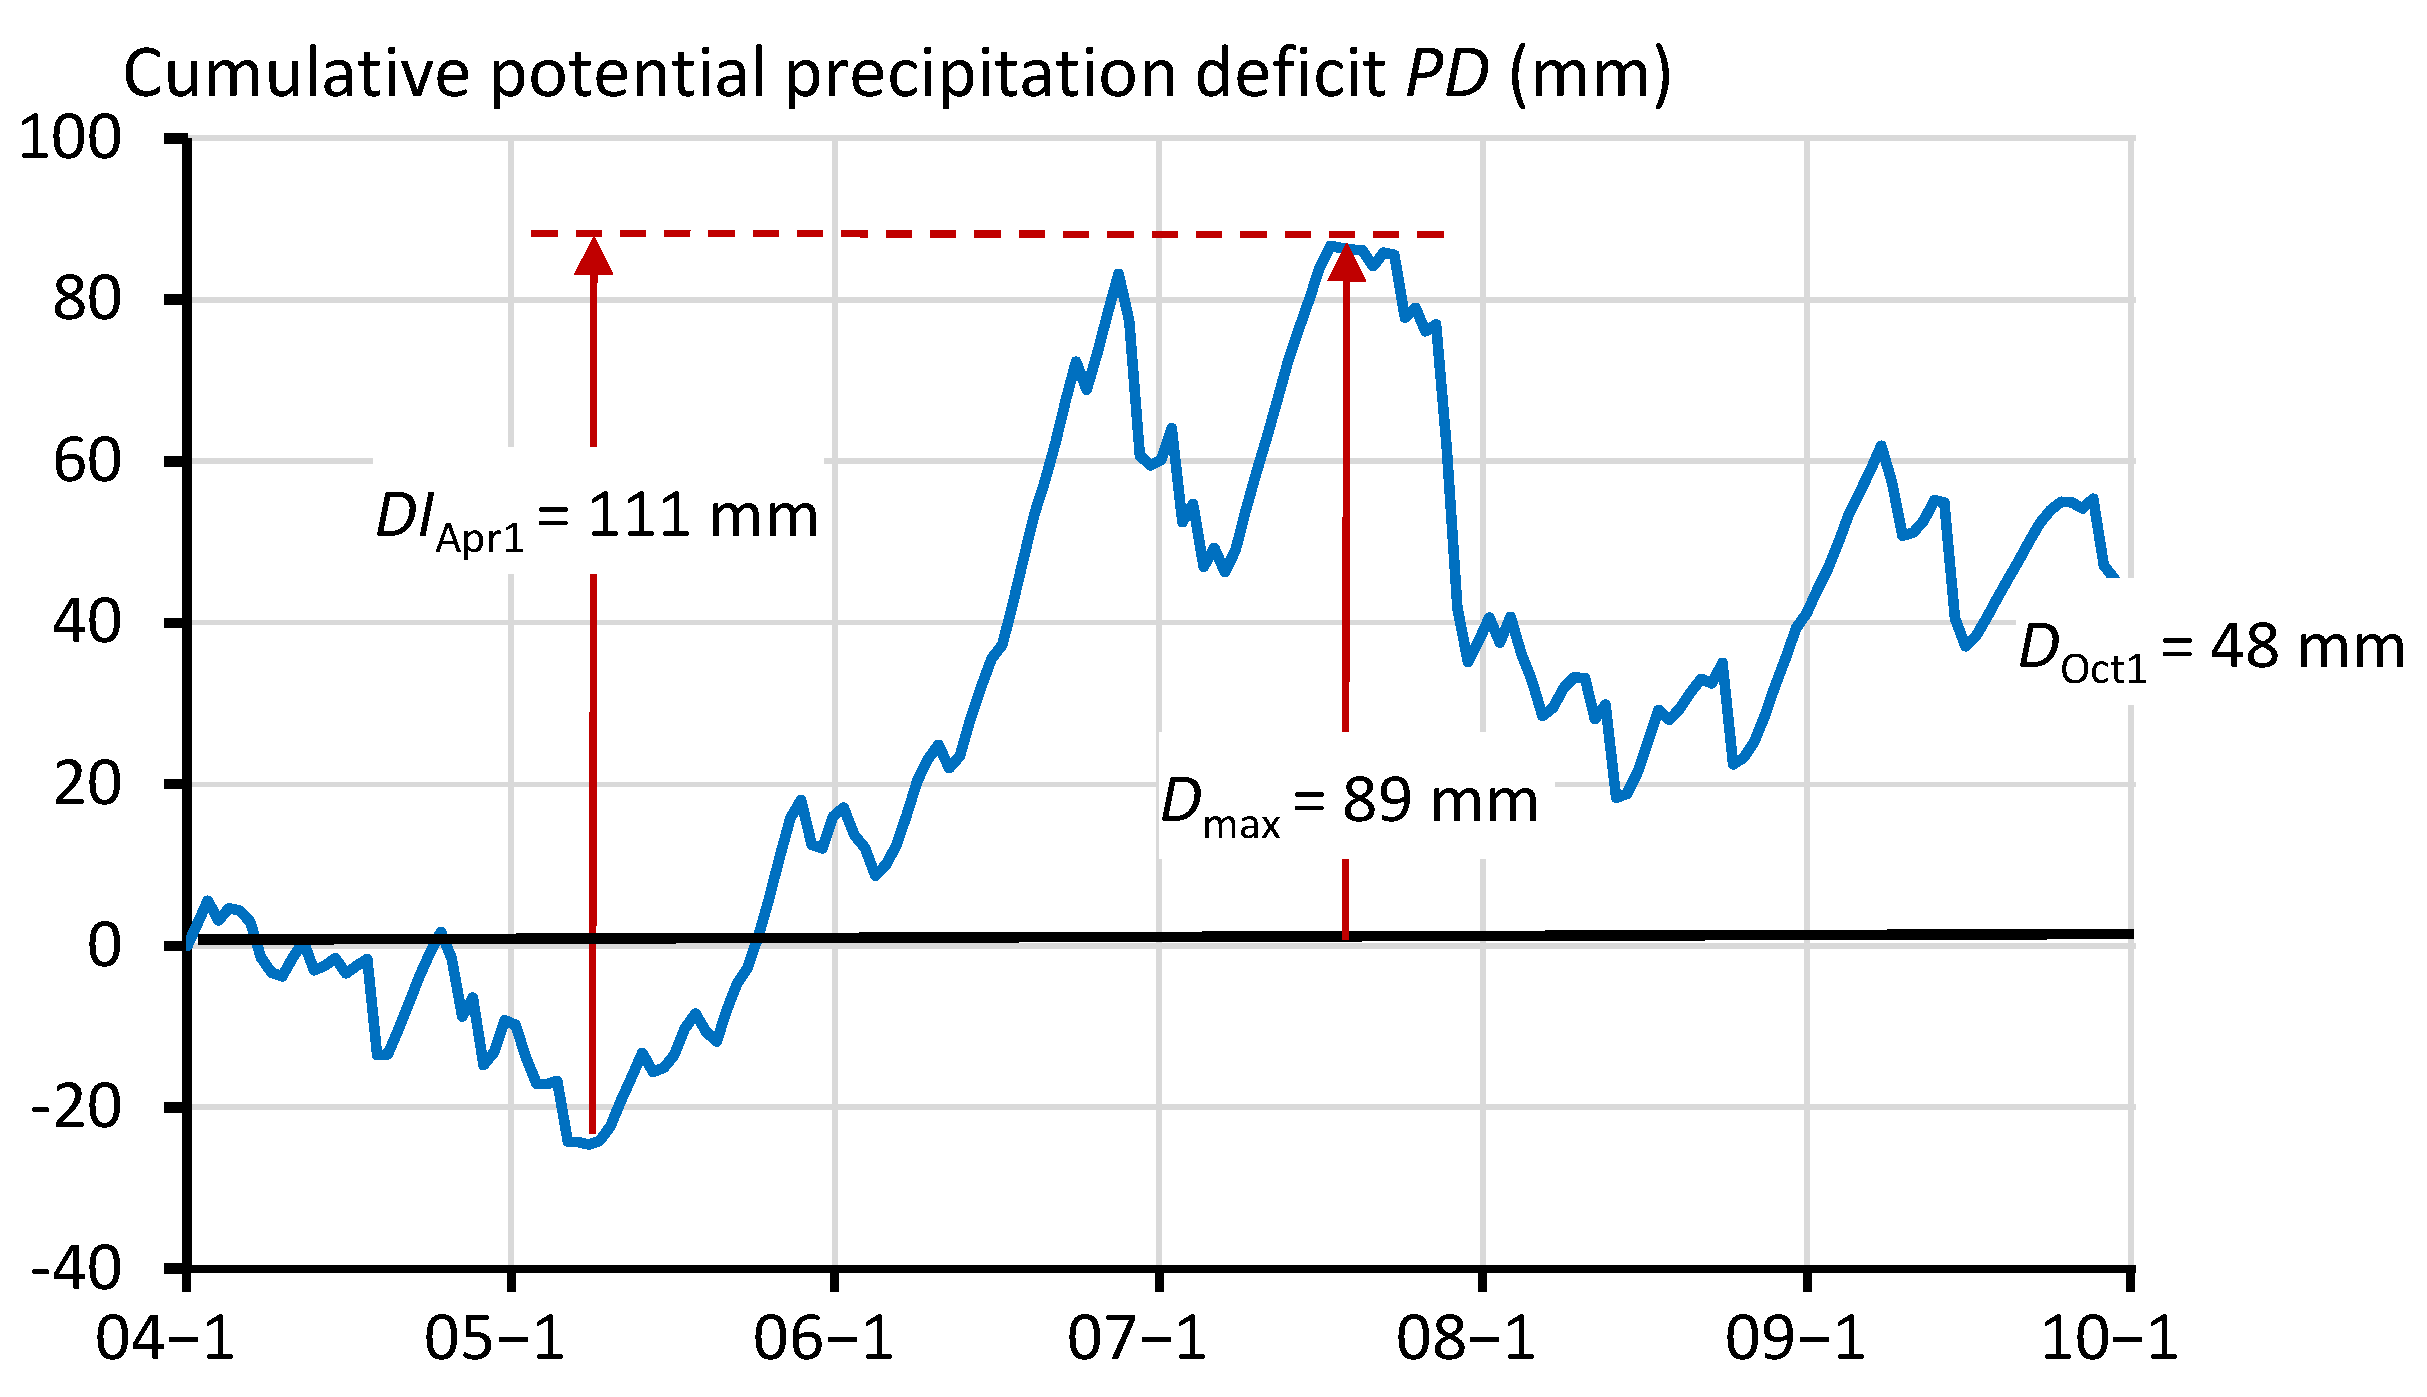
2.3.1. Definition of Cumulative Potential Precipitation Deficit
2.3.2. Precipitation Deficit at the End of the Growing Season, DOct1
2.3.3. Maximum Value of the Precipitation Deficit, Dmax
2.3.4. Maximum Increase in the Precipitation Deficit Starting from 1st April, DIApr1
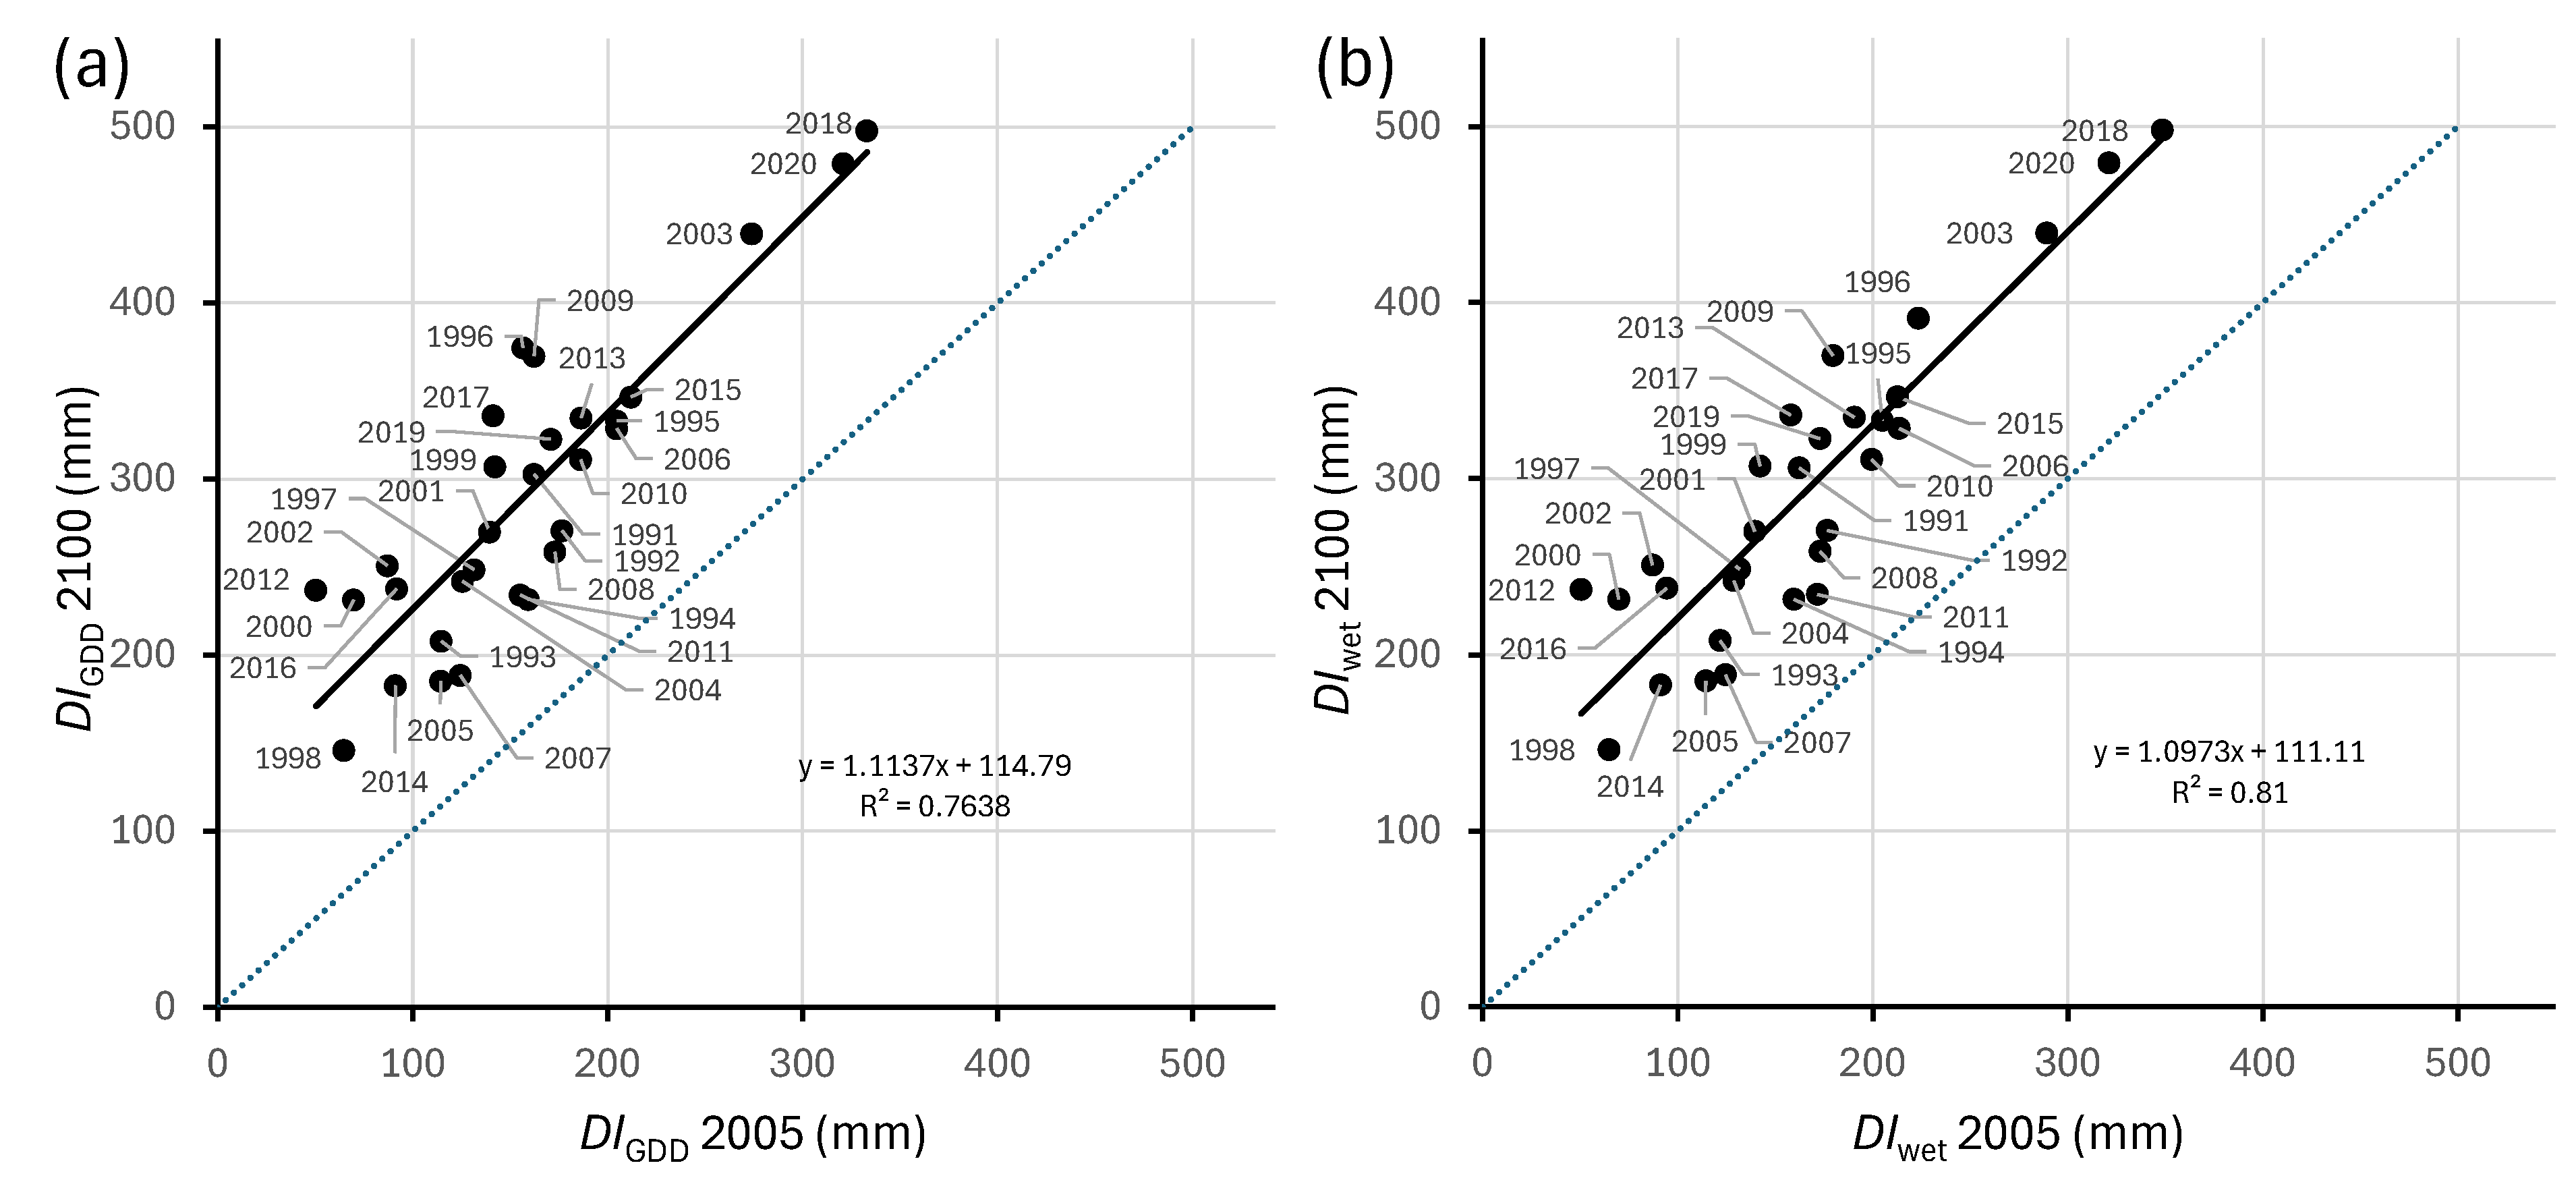
2.3.5. Maximum Increase in the Precipitation Deficit with a Starting Date Determined by a Temperature Sum, DIGDD
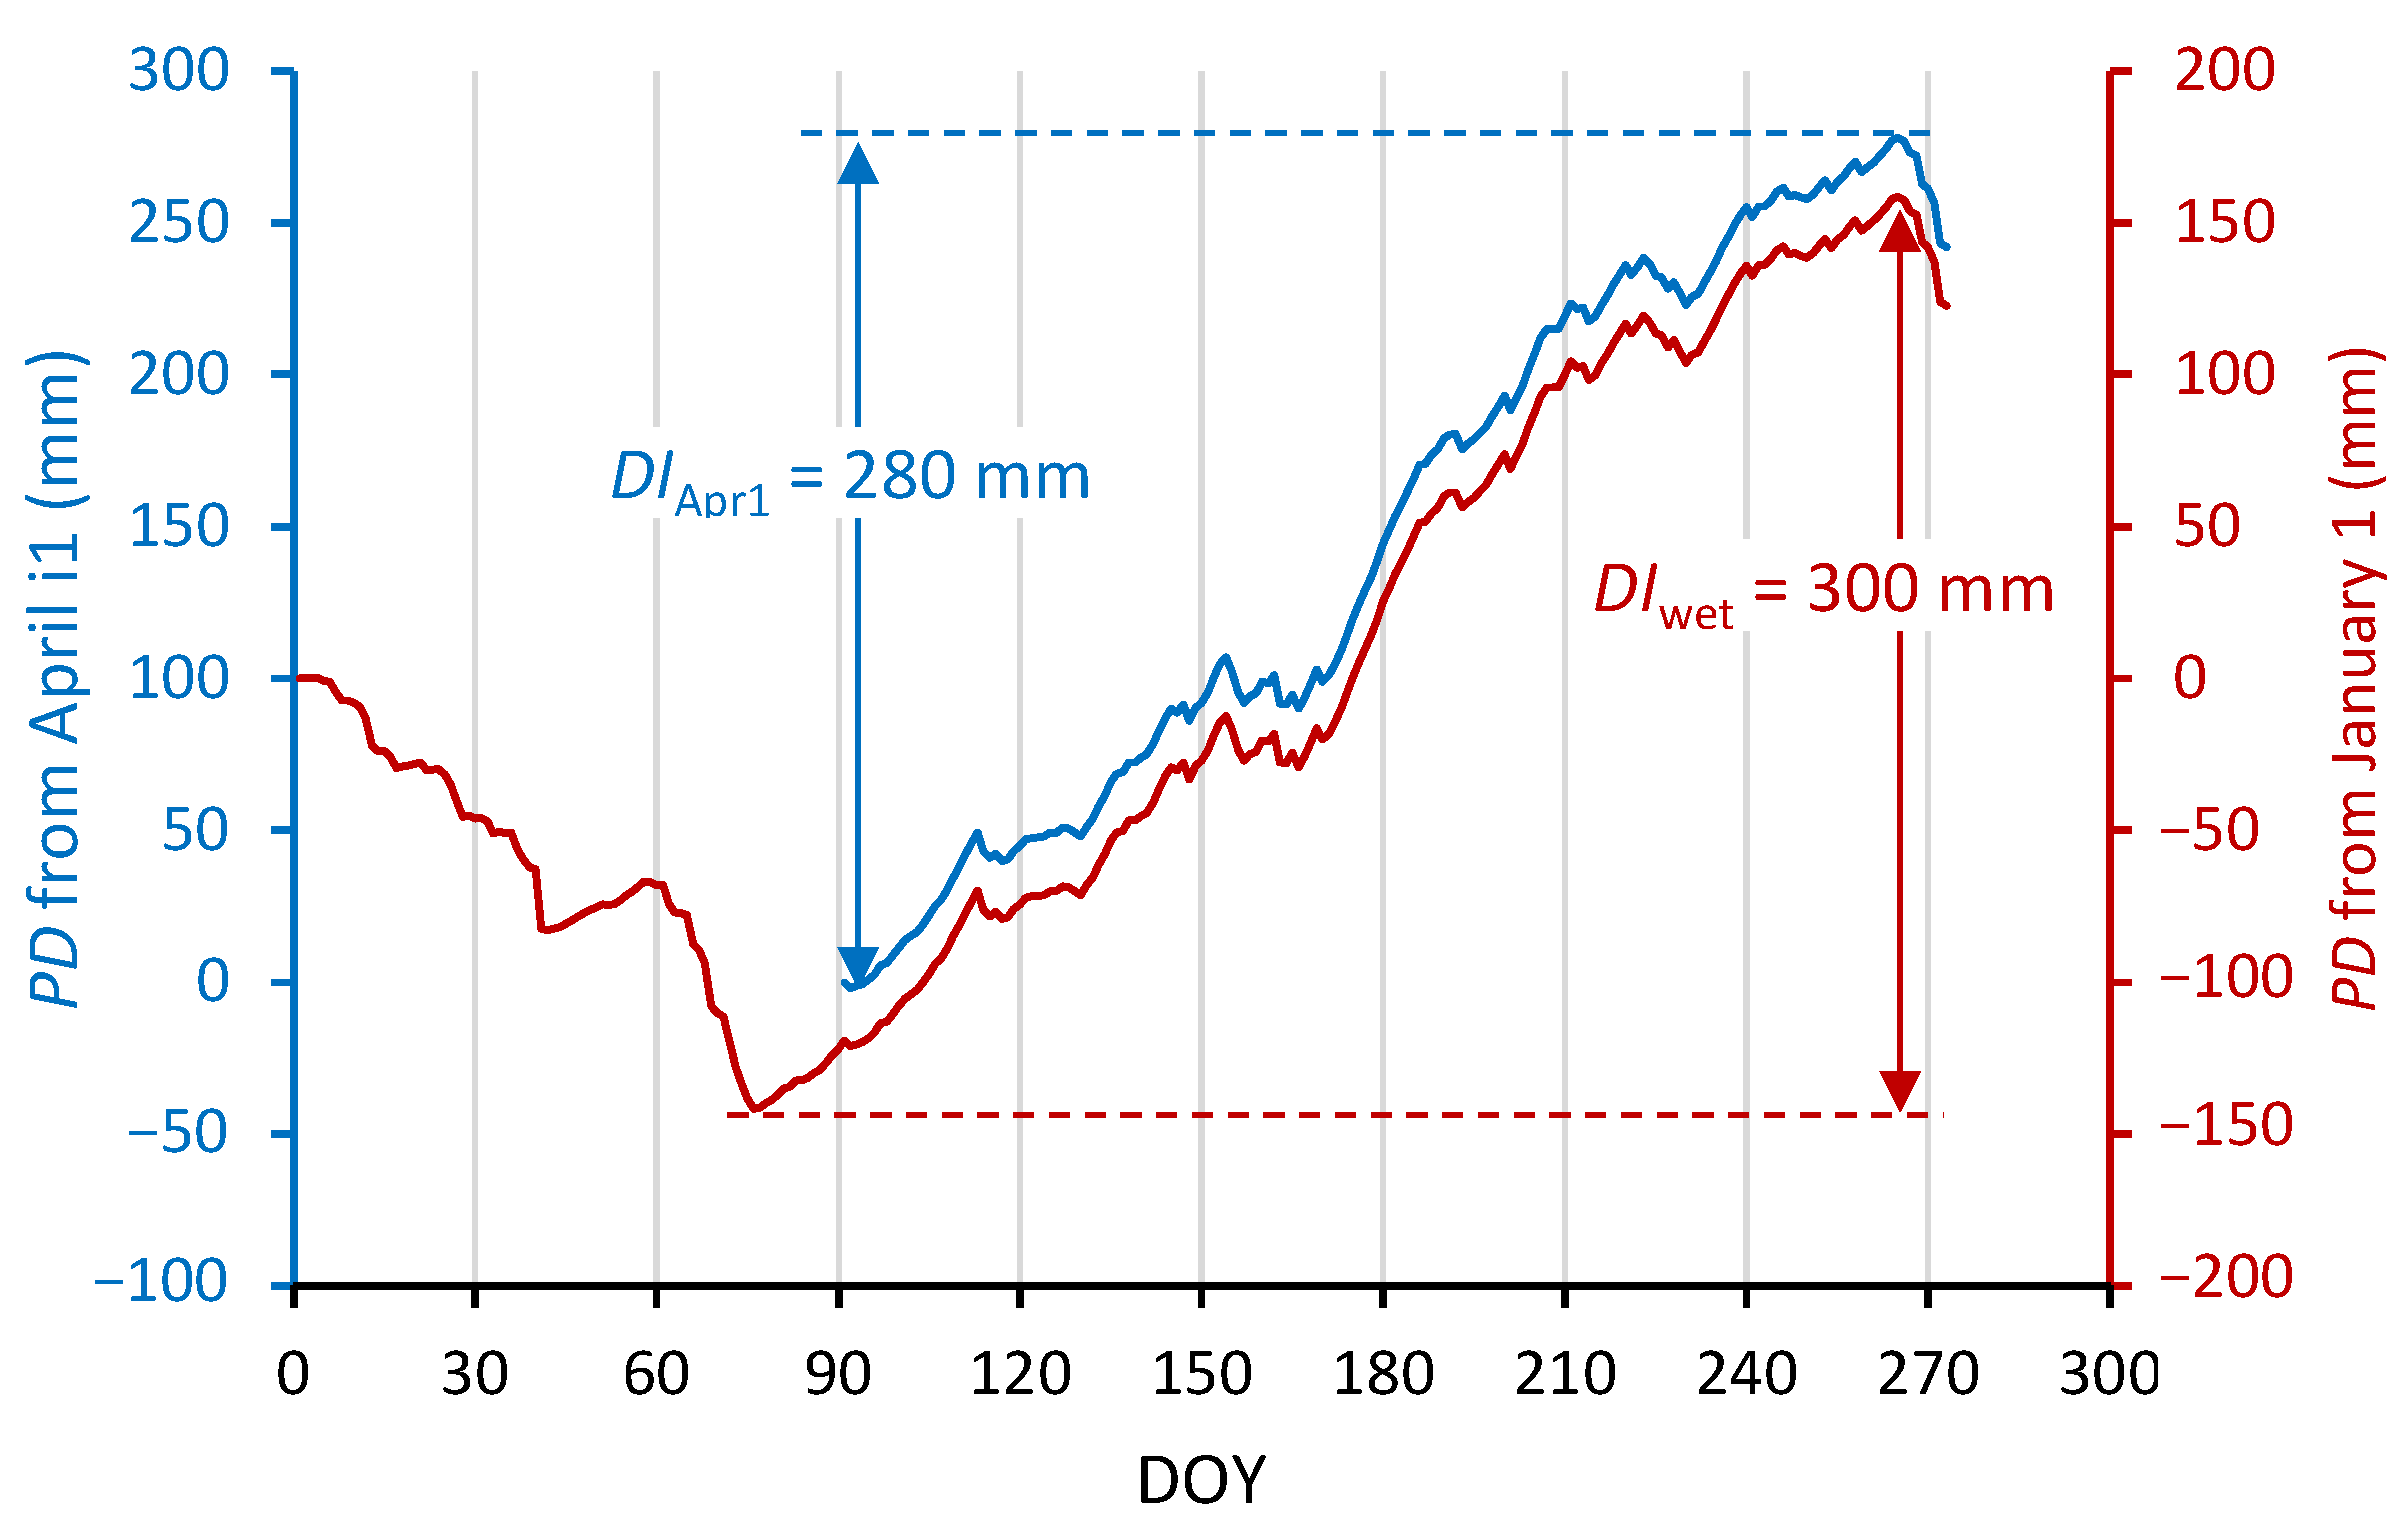
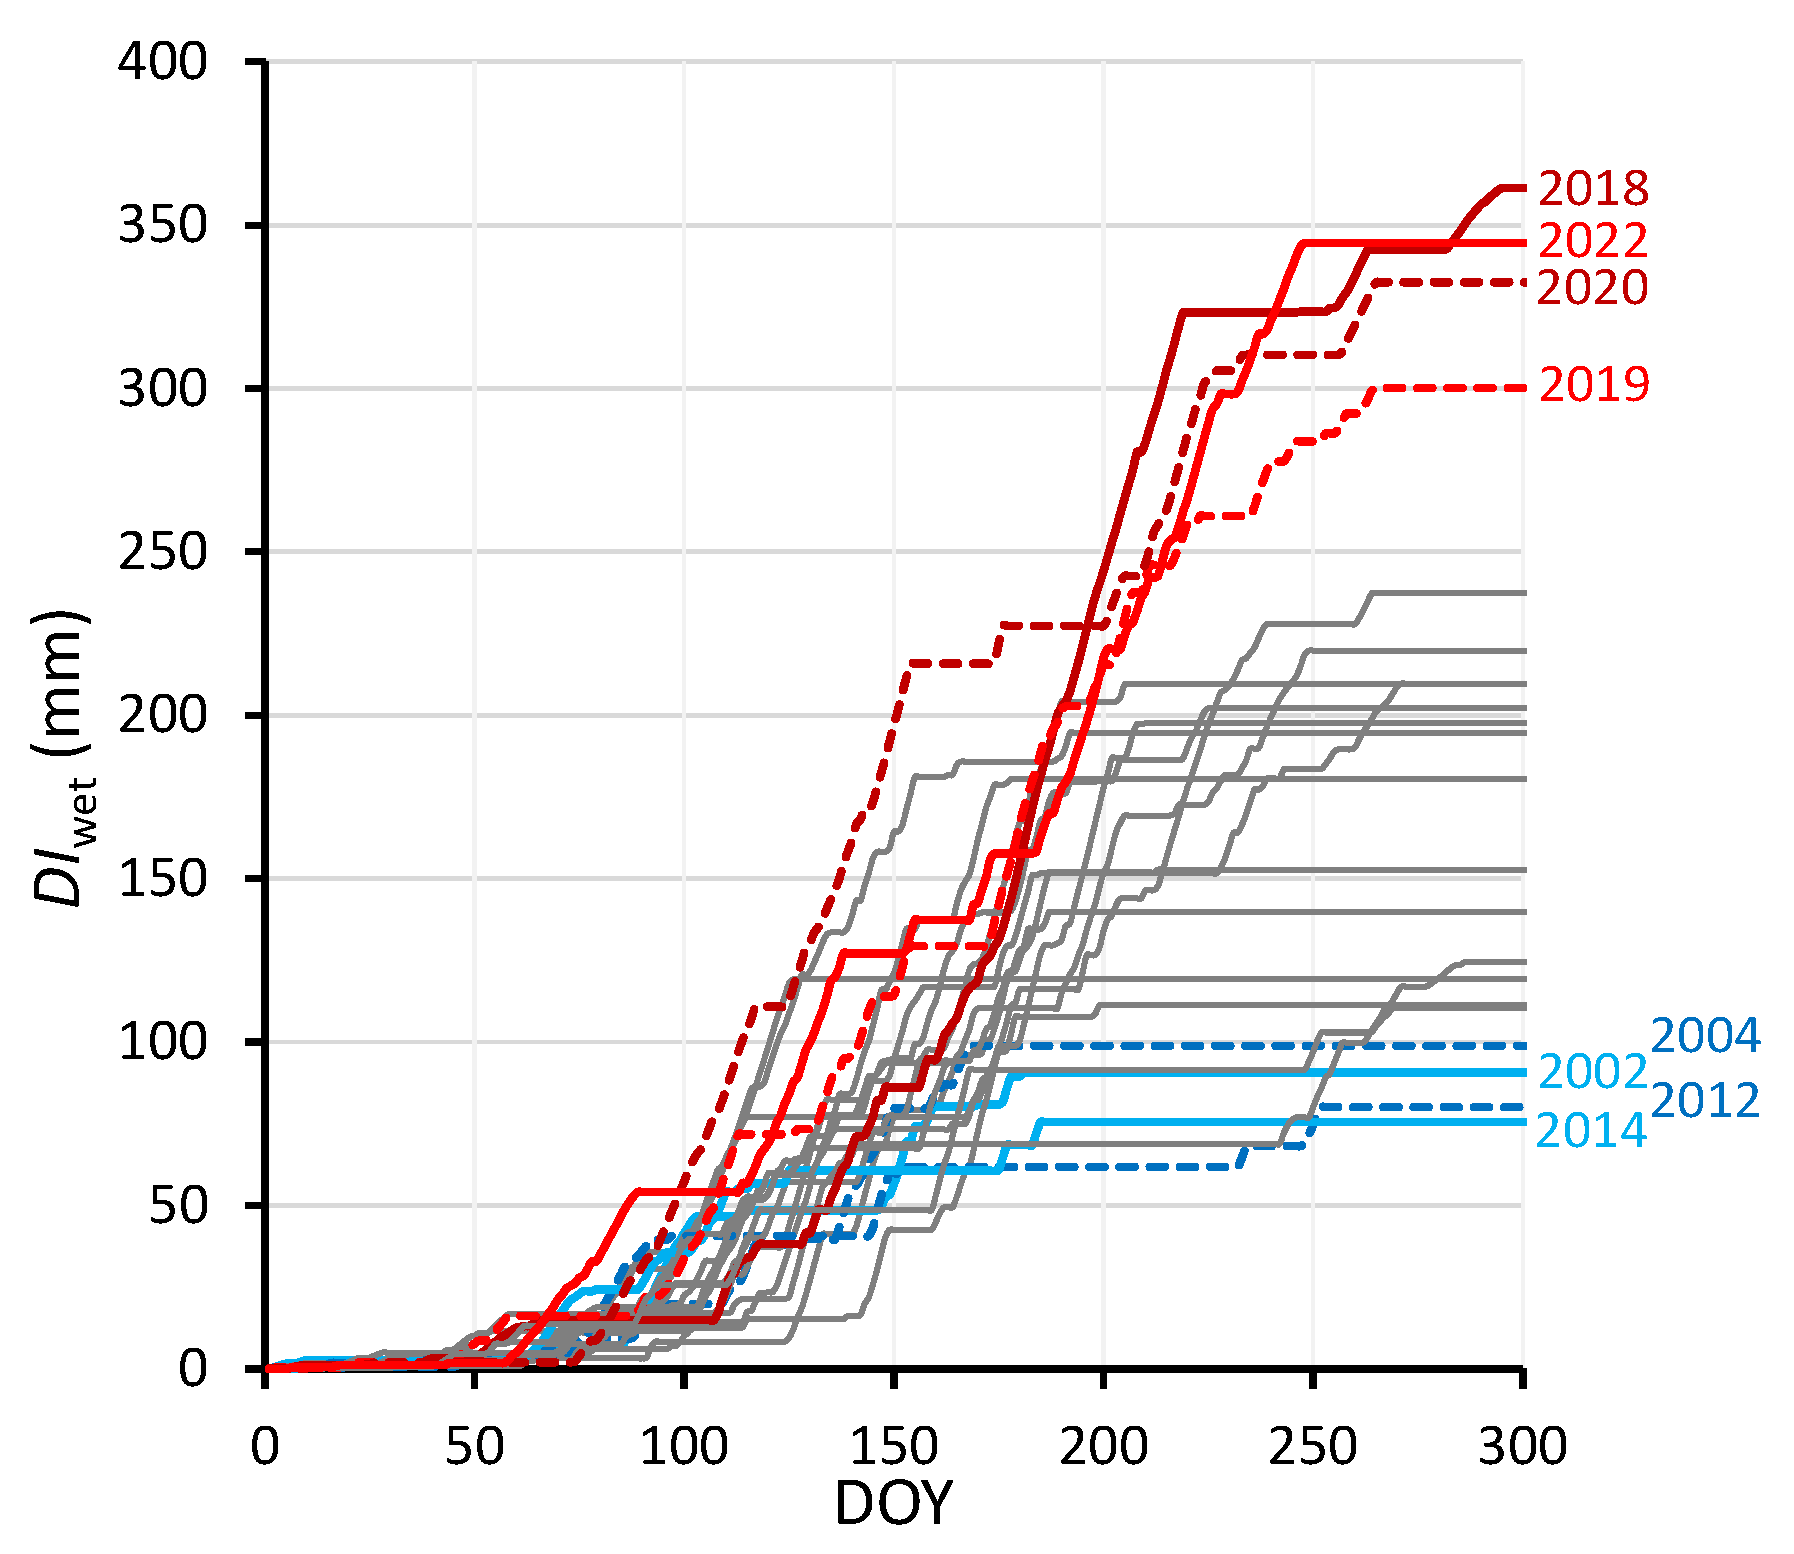
2.3.6. Maximum Increase in the Precipitation Deficit Starting in the Wet Season, DIwet
2.4. Statistical Analysis
3. Results
4. Discussion
4.1. Discussion of the Results
4.2. Discussion of the Indices
4.3. Which Drought Index Is to Be Preferred to Characterize Absolute Meteorological Drought?
4.4. Example of Two Applications: Daily Drought Monitoring and Climate Change Projection
4.5. Perspectives for Future Research
5. Conclusions
- To the best of our knowledge, this is the first study to compare different meteorological drought indices by validating them against annual irrigation data, which we consider an integrated proxy of the drought experienced by farmers.
- Of the five indices examined, the cumulative potential precipitation deficit calculated with (a) a temperature sum-dependent start of the growing season or (b) a start in the wet winter season most closely matched irrigation amounts (R2 = 95% and 94%, respectively).
- Despite almost the same R2, DIGDD significantly outperformed DIwet.
- The advantage of DIwet is that it does not require defining the start of the growing season and that it has the widest geographical applicability: presumably all climates with an annual dry season following a distinct wet season.
- DIGDD and DIwet can be recalculated daily, offering an up-to-date view of meteorological drought development throughout the year.
Author Contributions
Funding
Data Availability Statement
Acknowledgments
Conflicts of Interest
Abbreviations
| GDD | Growing Degree days (°C), here defined as the cumulative total of daily temperatures above zero from 1 January onwards |
| I | annual irrigation amount (Mm3) |
| PD | cumulative potential precipitation deficit (mm) |
| DOct1 | PD measured from 1 April at the end of the growing season (mm) |
| Dmax | maximum value of PD, measured from 1 April (mm) |
| DIApr1 | largest increase in PD, measured from 1 April (mm) |
| DIGDD | largest increase in PD, measured from GDD (mm) |
| DIwet | largest increase in PD, measured from a day in the wet season (mm), here 1 January |
| ET | Evapotranspiration (mm/d or mm/yr) |
References
- Van den Hurk, B.; Siegmund, P.; Tank, A.K. KNMI’14: Climate Change Scenarios for the 21st Century-A Netherlands Perspective; KNMI: The Bilt, The Netherlands, 2014. [Google Scholar]
- Aalbers, E.E.; Van Meijgaard, E.; Lenderink, G.; De Vries, H.; Van den Hurk, B.J.J.M. The 2018 west-central European drought projected in a warmer climate: How much drier can it get? Nat. Hazards Earth Syst. Sci. 2023, 23, 1921–1946. [Google Scholar] [CrossRef]
- Prins, H.; Jager, J.; Stokkers, R.; van Asseldonk, M. Damage to Dutch Agricultural and Horticultural Crops as a Result of the Drought in 2018. Extent of Crop Yield Losses and Mitigating and Adaptive Measures Taken by Farmers and Growers; Wageningen Economic Research: Wageningen, The Netherlands, 2018. [Google Scholar]
- Witte, J.P.M.; Van Deijl, D.; Van den Eertwegh, G.A.P.H. Gevolgen voor de Natuur van de Droge Jaren 2018 en 2019; Resultaten van Een Enquête Onder Deskundigen. Deelrapport van Het Project: Droogte in Zandgebieden van Zuid-, Midden- en Oost-Nederland; FWE & KnowH2O: Oosterbeek, The Netherlands, 2020. [Google Scholar]
- Vervoort, R.W.; Van der Zee, S.E.A.T.M. Simulating the effect of capillary flux on the soil water balance in a stochastic ecohydrological framework. Water Resour. Res. 2008, 44, W08425. [Google Scholar] [CrossRef]
- Royal Netherlands Meteorological Institute (KNMI). KNMI’23 Klimaatscenario’s voor Nederland; KNMI: De Bilt, The Netherlands, 2023. [Google Scholar]
- Van Loon, A.F. Hydrological drought explained. Wiley Interdiscip. Rev. Water 2015, 2, 359–392. [Google Scholar] [CrossRef]
- McKee, T.B.; Doesken, N.J.; Kleist, J. The relationship of drought frequency and duration to time scales. In Proceedings of the Eight Conference on Applied Climatology, Anaheim, CA, USA, 17–22 January 1993; pp. 179–183. [Google Scholar]
- Vicente-Serrano, S.M.; Beguería, S.; López-Moreno, J.I. A multiscalar drought index sensitive to global warming: The standardized precipitation evapotranspiration index. J. Clim. 2010, 23, 1696–1718. [Google Scholar] [CrossRef]
- Van Rooy, M.P. A rainfall anomally index independent of time and space. Notos 1965, 14, 43–48. [Google Scholar]
- Middleton, N.J.; Thomas, D.S.G. (Eds.) World Atlas of Desertification; Edward Arnold: London, UK, 1992. [Google Scholar]
- Palmer, W.C. Meteorological drought. Weather Bur. Res. Pap. 1965, 45, 1–58. [Google Scholar]
- Dullaart, J.; Van der Wiel, K. Underestimation of meteorological drought intensity due to lengthening of the drought season with climate change. Environ. Res. Clim. 2024, 3, 041004. [Google Scholar] [CrossRef]
- Wolters, D.; Homan, C.; Bessembinder, J. Ruimtelijke Klimatologische Verschillen Binnen Nederland; KNMI: De Bilt, The Netherlands, 2011. [Google Scholar]
- De Wit, C.T. Transpiration and Crop Yields; Pudoc: Wageningen, The Netherlands, 1958; Volume 64.4, p. 88. [Google Scholar]
- Van der Meer, R.W. Watergebruik in de Land- en Tuinbouw, 2021. Berekeningen op Basis van Het Bedrijveninformatienet; Wageningen Economic Research: Wageningen, The Netherlands, 2023. [Google Scholar]
- Roskam, J.L.; Van der Meer, R.W.; Van der Veen, H.B. Sample for the Dutch FADN 2017; Wageningen Economic Research: Wageningen, The Netherlands, 2020. [Google Scholar]
- De Waal, T. General Approaches for Consistent Estimation Based on Administrative Data and Surveys; Statistics Netherlands: The Hague, The Netherlands, 2015. [Google Scholar]
- Vrolijk, H.C.J.; Dol, W.; Kuhlman, T. Integration of Small Area Estimation and Mapping Techniques; Tool for Regional Studies; LEI: The Hague, The Netherlands, 2005. [Google Scholar]
- Van der Meer, R.W. Watergebruik in de Land-en Tuinbouw 2019; Wageningen Economic Research: Wageningen, The Netherlands, 2021; Volume 87. [Google Scholar]
- Stokkers, R.; Jager, J.; van Asseldonk, M. Beregening in akkerbouw-, Groente- en Voedergewassen in Diverse Regio’ s van Nederland in de Periode 2010–2019; Wageningen Economic Research: Wageningen, The Netherlands, 2022. [Google Scholar]
- Van den Eertwegh, G.; Van Bakel, J.; Massop, H.T.L.; Van Dam, J.C.; Bosveld, F.; Veldhuizen, A.A. Efficiëntie van Beregening: Een Deskstudy Naar Kennis en Inzicht Ten Aanzien van Waterverliezen Bij Midden op de Dag Beregenen Vergeleken Met Beregen in de Nachtelijke Uren; KnowH2O: Berg en Dal, The Netherlands, 2020. [Google Scholar]
- Makkink, G.F. Testing the Penman formula by means of lysimeters. J. Inst. Water Eng. 1957, 11, 277–288. [Google Scholar]
- Terink, W.; Van Deijl, D.; Van den Eertwegh, G.; Wonink, S.; Brombacher, J. Een Nieuwe Kaart van Potentieel Beregende Percelen in 2018 voor Toepassing Binnen Het NHI. Combinatie van Bestaande Informatie en Kennis ter Realisatie van een Nieuwe en Gevalideerde Kaart; KnowH2O & eLeaf: Berg en Dal, The Netherlands, 2023. [Google Scholar]
- Van Boheemen, P.J.M. Seizoen- en Piekbehoefte aan Kunstmatige Watervoorziening Bij Gras-, Aardappelen en Tuinbouwgewassen; ICW: Wageningen, The Netherlands, 1980. [Google Scholar]
- CoGroWa. Landbouwkundige Aspecten van Grondwateronttrekking; Commissie Grondwaterwet Waterleidingbedrijven—Werkgroep Landbouwkundige Aspecten: Utrecht, The Netherlands, 1984. [Google Scholar]
- Philip, S.Y.; Kew, S.F.; Van der Wiel, K.; Wanders, N.; Van Oldenborgh, G.J. Regional differentiation in climate change induced drought trends in the Netherlands. Environ. Res. Lett. 2020, 15, 094081. [Google Scholar] [CrossRef]
- McMaster, G.S.; Wilhelm, W.W. Growing degree-days: One equation, two interpretations. Agric. For. Meteorol. 1997, 87, 291–300. [Google Scholar] [CrossRef]
- Taylor, S.A.; Ashcroft, G.L. Physical Edaphology. The Physics of Irrigated and Nonirrigated Soils; Freeman: San Francisco, CA, USA, 1972. [Google Scholar]
- De Wilde, J.G.S.; Linthorst, T.J. Beregening en Bevloeiing in Nederland in 1976; ICW: Wageningen, The Netherlands, 1978. [Google Scholar]
- Van Boheemen, P.J.M. Ontwikkeling in de Toepassing van Beregening en Bevloeiing Tot 1983; ICW: Wageningen, The Netherlands, 1985. [Google Scholar]
- Pulles, J.W. Beleidsanalyse voor de Waterhuishouding in Nederland—PAWN; Staatsuitgeverij: The Hague, The Netherlands, 1985. [Google Scholar]
- Riahi, K.; Van Vuuren, D.P.; Kriegler, E.; Edmonds, J.; O’Neill, B.C.; Fujimori, S.; Bauer, N.; Calvin, K.; Dellink, R.; Fricko, O.; et al. The Shared Socioeconomic Pathways and their energy, land use, and greenhouse gas emissions implications: An overview. Glob. Environ. Chang. 2017, 42, 153–168. [Google Scholar] [CrossRef]
- Hoylman, Z.H.; Holden, Z.; Bocinsky, R.K.; Ketchum, D.; Swanson, A.; Jencso, K. Optimizing drought assessment for soil moisture deficits. Water Resour. Res. 2024, 60, e2023WR036087. [Google Scholar]
- Qin, Y.; Yang, D.; Lei, H.; Xu, K.; Xu, X. Comparative analysis of drought based on precipitation and soil moisture indices in Haihe basin of North China during the period of 1960–2010. J. Hydrol. 2015, 526, 55–67. [Google Scholar] [CrossRef]
- Halwatura, D.; McIntyre, N.; Lechner, A.M.; Arnold, S. Capability of meteorological drought indices for detecting soil moisture droughts. J. Hydrol. Reg. Stud. 2017, 12, 396–412. [Google Scholar] [CrossRef]


| Year | I | Year | I | Year | I | Year | I | Year | I | Year | I | Year | I |
|---|---|---|---|---|---|---|---|---|---|---|---|---|---|
| 2001 | 43 | 2004 | 45 | 2007 | 37 | 2010 | 80 | 2013 | 66 | 2016 | 38 | 2019 | 215 |
| 2002 | 43 | 2005 | 36 | 2008 | 35 | 2011 | 79 | 2014 | 40 | 2017 | 80 | 2020 | 269 |
| 2003 | 155 | 2006 | 89 | 2009 | 53 | 2012 | 22 | 2015 | 68 | 2018 | 264 | 2021 | 44 |
| Start Date PD | Max PD | Min PD | |
|---|---|---|---|
| DOct1 | Apr 1 | PD on Oct 1 | 0.00 |
| Dmax | Apr 1 | Max between Apr 1 and Oct 1 | 0.00 |
| DIApr1 | Apr 1 | Max between Apr 1 and Oct 1 | Min before Max |
| DIGDD | 1st day GDD > 440 °C | Max between 1st day and Oct 1 | Min before Max |
| DIwet | Jan 1 | Max between Jan 1 and Oct 1 | Min before Max |
| Drought Index (mm) | Date (mmdd) | Drought Index (mm) | Date (mmdd) | ||||||||||||
|---|---|---|---|---|---|---|---|---|---|---|---|---|---|---|---|
| DOct1 | Dmax | DIApr1 | DIGDD | DIwet | 440 | max | DOct1 | Dmax | DIApr1 | DIGDD | DIwet | 440 | max | ||
| 2001 | 5 | 124 | 153 | 153 | 153 | Apr 7 | Aug 1 | 2012 | 24 | 46 | 75 | 75 | 80 | Mar 26 | Sep 10 |
| 2002 | 67 | 74 | 79 | 91 | 91 | May 17 | June 30 | 2013 | 143 | 207 | 205 | 186 | 220 | Apr 26 | Sep 6 |
| 2003 | 198 | 202 | 214 | 211 | 237 | Apr 12 | Sep 27 | 2014 | 20 | 49 | 71 | 71 | 75 | Mar 14 | Jul 4 |
| 2004 | 5 | 80 | 99 | 99 | 99 | Apr 2 | Jun 17 | 2015 | 101 | 196 | 202 | 190 | 202 | Apr 9 | Aug 13 |
| 2005 | 48 | 89 | 111 | 111 | 111 | Apr 2 | Jul 18 | 2016 | 96 | 97 | 117 | 117 | 124 | Apr 3 | Sep 28 |
| 2006 | 136 | 192 | 198 | 180 | 198 | Apr 25 | Jul 29 | 2017 | 86 | 159 | 160 | 161 | 181 | Mar 30 | Jun 27 |
| 2007 | 15 | 106 | 103 | 119 | 119 | Mar 9 | May 6 | 2018 | 328 | 336 | 342 | 338 | 361 | Apr 9 | Sep 20 |
| 2008 | 95 | 132 | 140 | 140 | 140 | Mar 16 | Jul 6 | 2019 | 244 | 280 | 280 | 294 | 300 | Mar 22 | Sep 22 |
| 2009 | 204 | 205 | 202 | 186 | 210 | Apr 11 | Sep 28 | 2020 | 272 | 301 | 299 | 333 | 333 | Mar 10 | Sep 22 |
| 2010 | 52 | 199 | 210 | 178 | 210 | Apr 20 | Jul 25 | 2021 | 81 | 91 | 103 | 103 | 110 | Mar 31 | Sep 26 |
| 2011 | 64 | 170 | 169 | 169 | 195 | Apr 2 | Jul 11 | ||||||||
| DOct1 | 81 | 80 | 81 | 81 |
| 89 | Dmax | 98 | 98 | 99 |
| 88 | 99 | DIApr1 | 97 | 99 |
| 90 | 98 | 98 | DIGDD | 99 |
| 89 | 99 | 99 | 99 | DIwet |
| DOct1 | 0.909 | 0.865 | 0.999 | 0.993 |
| 0.091 | Dmax | 0.492 | 0.975 | 0.915 |
| 0.135 | 0.571 | DIApr1 | 0.992 | 0.952 |
| 0.001 | 0.025 | 0.008 | DIGDD | 0.000 |
| 0.007 | 0.085 | 0.048 | 1.000 | DIwet |
Disclaimer/Publisher’s Note: The statements, opinions and data contained in all publications are solely those of the individual author(s) and contributor(s) and not of MDPI and/or the editor(s). MDPI and/or the editor(s) disclaim responsibility for any injury to people or property resulting from any ideas, methods, instructions or products referred to in the content. |
© 2025 by the authors. Licensee MDPI, Basel, Switzerland. This article is an open access article distributed under the terms and conditions of the Creative Commons Attribution (CC BY) license (https://creativecommons.org/licenses/by/4.0/).
Share and Cite
Witte, J.-P.M.; van den Eertwegh, G.A.P.H.; Torfs, P.J.J.F. Absolute Meteorological Drought Indices Validated Against Irrigation Amounts. Water 2025, 17, 1056. https://doi.org/10.3390/w17071056
Witte J-PM, van den Eertwegh GAPH, Torfs PJJF. Absolute Meteorological Drought Indices Validated Against Irrigation Amounts. Water. 2025; 17(7):1056. https://doi.org/10.3390/w17071056
Chicago/Turabian StyleWitte, Jan-Philip M., Gé A. P. H. van den Eertwegh, and Paul J. J. F. Torfs. 2025. "Absolute Meteorological Drought Indices Validated Against Irrigation Amounts" Water 17, no. 7: 1056. https://doi.org/10.3390/w17071056
APA StyleWitte, J.-P. M., van den Eertwegh, G. A. P. H., & Torfs, P. J. J. F. (2025). Absolute Meteorological Drought Indices Validated Against Irrigation Amounts. Water, 17(7), 1056. https://doi.org/10.3390/w17071056