Abstract
Oil leakage during the processes of extraction, storage, and transportation poses a significant challenge due to the complex nature of pollution caused by frequent fluctuations in groundwater levels and variations in the water–oil interface. To effectively identify and monitor the position of the water–oil interface and displacement processes, geophysical methods have proven to be an efficient approach. This study utilizes electrical resistivity measurements to analyze changes in medium resistivity during water–oil displacement, enabling simulation of the spatial relationship between groundwater levels and petroleum contaminants based on resistivity characteristics and natural potential responses. After analysis, the following conclusions can be drawn: (1) During the water displacement process, when water forms a connected flow channel between sand and gravel, the resistivity decreases abruptly. Conversely, during oil displacement by water, when oil fills soil pores and creates a high-resistance conductive path, the resistivity increases abruptly. (2) Changes in resistivity are determined by the position of the water–oil interface. By observing characteristic changes in resistivity, it is possible to verify whether soil is undergoing water–oil displacement. (3) The direction of displacement significantly affects changes in resistivity for all three media involved due to gravity effects during water displacement by the oil process. (4) Resistance values during the water–oil displacement process are directly influenced by the size of sand particles used in experiments.
1. Introduction
Light non-aqueous phase liquid (LNAPL) contamination poses a significant environmental challenge due to their low density, limited water solubility, and high volatility. Common LNAPLs include gasoline, kerosene, and diesel fuel. These pollutants have substantial impacts on soil and groundwater by impairing soil structure, impeding volatilization of residual materials in the soil matrix, reducing soil permeability, and inhibiting microbial growth [1]. Furthermore, LNAPL contamination presents a grave threat to various industrial sectors such as manufacturing and plastics industries. Therefore, obstructive, comprehensively understanding the distribution and migration patterns of LNAPLs and identifying effective monitoring methods are two critical aspects for enhancing pollution control.
For the migration and distribution of LNAPLs, researchers have conducted studies using a combination of laboratory experiments and numerical simulations. In their investigation of LNAPL migration within fracture networks and porous media, Shen et al. [2] developed a multiphase numerical flow model by integrating laboratory experimental devices with COMSOL software (v5.6). This approach was aimed at elucidating the migration behavior of LNAPLs within filled fractures and adjacent porous media. The experimental results revealed that the migration velocity of LNAPLs in fractures is significantly higher than in porous media, demonstrating that fractures markedly accelerate the diffusion process of LNAPLs. Additionally, fluctuations in groundwater levels influence LNAPL migration: as the groundwater level decreases, LNAPL migrates downward; conversely, as the groundwater level rises, LNAPL becomes trapped. In the study of LNAPL migration under shallow point source leakage scenarios, Zuo et al. [3] conducted a two-dimensional sandbox experiment to simulate the movement of LNAPLs in fine sand and silt media. The results indicate that LNAPLs are significantly retained within the capillary fringe, with this retention effect intensifying over time. This suggests that the capillary fringe exerts a substantial obstructive influence on the vertical migration of LNAPLs, potentially serving as a critical control factor in its migration process.
Onaa et al. [4] experimentally simulated surface and subsurface imbibition scenarios for pollutant fluids and utilized numerical simulation methods to describe and predict the underground migration behavior of LNAPL pollutants. The findings demonstrate a high degree of consistency between the numerical simulation results and experimental observations, validating the reliability and accuracy of the numerical model in predicting LNAPL migration. This study provides robust support for employing numerical simulation tools to forecast the extent of LNAPL pollution. In the study of how leakage conditions and medium characteristics influence the migration of LNAPLs, Yuan et al. [5] employed a combination of two-dimensional visualization experiments and T2VOC numerical simulations to examine the effects of initial leakage rate, medium particle size, and heterogeneity on the migration and distribution of LNAPLs. The findings revealed that the migration distance and contaminated area of LNAPLs in porous media were significantly affected by leakage conditions and medium structure. Specifically, a higher initial leakage rate and larger medium particle size facilitated LNAPL migration, whereas heterogeneity complicated the migration pathways. Based on these experimental results, Yuan also revised the prediction equation for large-scale LNAPL leakage behavior in real-world settings, providing a scientific foundation for the remediation of contaminated sites.
Yang et al. [6] investigated the distribution characteristics of diesel in soil under varying porosities and temperatures, as well as the temporal evolution of diesel migration under two-phase flow saturation conditions. Their findings indicate that, over time, the diffusion range, coverage area, and volume of leaked diesel increase in both radial and axial directions under different porosity and temperature scenarios. Specifically, when soil temperature has a negligible impact on diesel distribution, soil porosity emerges as the dominant factor influencing diesel dispersion. Additionally, Waqar [7] performed a comprehensive qualitative literature review on the issue of contaminant diffusion to adjacent aquifers, summarizing research outcomes from 2000 to 2022. The analysis reveals that fluctuations in groundwater levels significantly affect pollutant migration rates, particularly before the saturation zone reaches equilibrium. During this period, sharp increases in migration rates may occur due to groundwater level variations. Furthermore, differing saturation states and limiting factors play crucial roles in lateral migration velocities, and once each saturation zone achieves dynamic equilibrium, light non-aqueous phase liquids (LNAPLs) cease further movement.
During the migration and distribution of LNAPLs, changes in soil resistivity occur. Monitoring LNAPL migration through the measurement of these resistivity changes in the medium is an effective geophysical method.
The investigation into the electrical resistivity characteristics of soil and rock originated from studies within the field of petroleum well logging, where Archie [8]’s integration of resistivity into soil microstructure paved the way for further research endeavors. Subsequently, Yoon and Park [9] expanded its application within environmental geotechnical engineering through meticulous experimental analysis. Notably, Fukue et al. [10]’s findings demonstrated that clay particles possess greater conductivity compared to coarser-structured soils due to disparities in their specific surface areas—thereby establishing a close relationship between soil resistivity and particle-specific surface area. Building upon this knowledge base through extensive experimentation, Yoon et al. [11], highlighted that fine-grained soils generally harbor a higher concentration of conductive particles along with larger specific surface areas—factors contributing to enhanced surface conductivity ability.
With the rapid advancement of computer technology and the ongoing refinement of resistivity testing devices, scholars have carried out in-depth investigations into resistivity characteristics across various soil media. Nai et al. [12] conducted a sand simulation experiment to examine the impacts of rising groundwater levels, seawater intrusion, and heavy metal pollution on resistivity, thereby validating the superior performance of the resistivity method in detecting and monitoring changes in the electrical properties of complex contaminated sites. For instance, this method can effectively differentiate between the distinct pollution processes associated with seawater intrusion and heavy metal contamination. Tang et al. [13] employed the resistivity method to analyze the cracking behavior of cohesive soil during the drying process. Their findings indicate that the variation in apparent resistivity within cohesive soil is governed by the interplay of two competing effects: volume shrinkage, which results in a more compact soil structure and an increase in pore fluid ion concentration, and water loss due to evaporation, which causes hydration film shrinkage and the insulating effect of drying-induced cracks. Furthermore, Zhang et al. [14] introduced a technique for converting the resistivity field into a local factor of safety (LFS) field to capture the dynamics of water infiltration and slope failure in loess landslides. Research has demonstrated that this approach not only elucidates the process and distribution patterns of water migration within slopes under rainfall conditions but also theoretically substantiates the feasibility of transforming the slope resistivity field into a soil moisture content (SMC) field.
Numerous scholars have conducted extensive research to examine the impact of light non-aqueous phase liquids (LNAPLs) on soil resistivity following contamination, establishing a verified correlation between LNAPL presence and changes in soil electrical properties. During the research process, scholars, respectively, explored the variation characteristics of resistivity in different contaminated media. Fajana et al. [15] conducted a laboratory two-dimensional resistivity modeling experiment to study the migration mode of soil contaminants in the sandy gravel layer and found that the resistivity of the sand layer showed heterogeneous changes, with some areas presenting high resistivity values while other areas exhibited a decrease in resistivity. Adepelumi et al. [16] simulated the scenario of LNAPL underground pipeline leakage to the clayey-sandy aquifer. After injecting diesel, a significant accumulation of high resistivity was observed. Pan et al. [17] adopted the resistivity monitoring method to study the migration of petroleum in heterogeneous soil layers. The results showed that in the initial stage, the petroleum mainly had a circular migration front in the vertical direction; when the vertical migration was blocked, the lateral migration became dominant; as the crude oil gradually accumulated, the migration front broke through the lithological interface limit and continued to migrate vertically. Adeniran et al. [18] designed a laboratory sandbox framework to evaluate the effectiveness of resistivity imaging technology in describing the spatio-temporal distribution of crude oil in coastal sandy sediments and verified the high sensitivity of this technology to the subtle anisotropy of soil pore distribution, which could capture the spatial changes in pore size caused by crude oil migration. Kong et al. [19] discussed the influence of wettability on the variation in resistivity characteristics during the infiltration of diesel into the unsaturated zone. Ghahremani et al. [20] evaluated the influence of wastewater pollution on the geotechnical engineering and resistivity characteristics of silty clay. Furthermore, Masi et al. [21] employed time-lapse resistivity tomography to monitor the internal erosion processes within geotechnical structures. Meanwhile, Sangprasat et al. [22] performed an in-depth analysis of the relationship between soil resistivity and geotechnical engineering properties. Teng et al. [23] verified that there is a linear relationship between resistivity and pollutant concentration.
By synthesizing previous research on LNAPL migration and soil resistivity, it is evident that a substantial amount of investigation has been conducted in this field. However, there is currently limited research focusing on the impact of changes in LNAPL–groundwater interface position on soil resistivity. This study builds upon prior achievements in LNAPL and soil resistivity testing methods, and comprehensively examines the effects of water–LNAPL interface position changes, variations in resistivity, displacement directions, and media particle size through laboratory column experiments. Homogeneous soil columns with different particle sizes and displacement directions were designed to investigate their influence on resistivity changes, aiming to provide a scientific basis for better understanding the contamination of underground soils and groundwater by LNAPLs.
2. Materials and Methods
2.1. Experimental Materials
In the laboratory geotechnical test, the sand sample medium is categorized into three groups: fine sand, medium sand, and coarse sand. The preparation process is as follows: First, dry the original sand sample to a constant weight at 105 ± 5 °C and cool it to room temperature. Then, select the appropriate standard sieve set for classification and screening based on the target type (fine sand, medium sand, coarse sand). The particle size ranges are as follows: fine sand (0.125–0.25 mm), medium sand (0.25–0.5 mm), and coarse sand (0.5–1 mm). Collect the sand grains within the corresponding particle size range, clean the sieve mesh thoroughly, mix the samples evenly, seal them for storage, and label them with the relevant parameters. The particle size distribution of the sand sample is presented in Table 1.

Table 1.
Experimental medium particle grading.
According to the data presented in Table 1, it is evident that all three media exhibit significantly high heterogeneity coefficients (exceeding 10 by a large margin), curvature coefficients surpassing 2, and a well-graded particle size distribution [24]. The LNAPL utilized in this experimental study corresponds to diesel fuel #0. The physical properties of diesel fuel #0 are provided in Table 2.
Table 2.
Basic physical properties of diesel fuel.
2.2. Experimental Setup and Calculation Principle
The electrical resistivity test device for soil columns comprises five components: Liquid supply device, earthen pillar device, as well as voltage and current meters, and batteries (as depicted in Figure 1). Injection and discharge ports are positioned at the bottom and top of the soil column apparatus, respectively, interconnected by silicone tubes. Copper electrodes are evenly distributed every four centimeters along the entire height of the soil column apparatus. (a) and (b) illustrate distinct displacement directions.
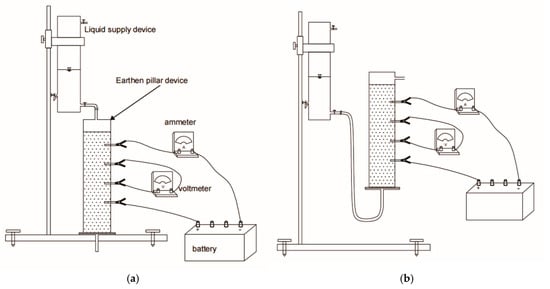
Figure 1.
Schematic diagram of the experimental setup. (a) is the schematic diagram of the device for the top-down displacement process, and (b) is the schematic diagram of the device for the bottom-up displacement process.
According to the definition of resistivity [25], resistivity is a physical property that characterizes the conductivity of materials employed in fabricating conductors. The determination of resistivity can be derived by rearranging the equation representing Ohm’s law.
In the equation, ρ denotes resistivity, R represents the resistance value computed based on voltage and current measurements, S signifies the cross-sectional area of the soil column, and L indicates the length of the soil column.
2.3. Experimental Design and Procedure
The experiment utilized three distinct particle sizes of homogeneous sand samples, namely fine sand, medium sand, and coarse sand, The cylindrical device used in the experiment has a height of 25 cm and a diameter of 7.5 cm, while the height of the medium cylinder is 15 cm. The oil–water displacement test was conducted using soil columns in both water-saturated and oil-saturated states to observe the pattern of electrical resistivity changes with variations in the position of the water–oil interface. The specific experimental procedure is illustrated in Figure 2.
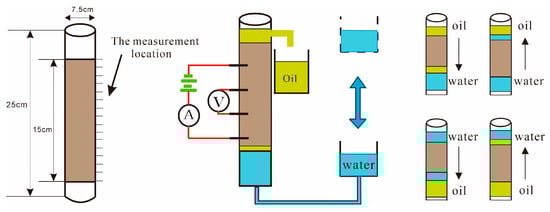
Figure 2.
Schematic diagram of the test. (Color note: The light blue two-way arrows represent two displacement directions. The upward arrow represents from top to bottom, and the downward arrow represents from bottom to top. The “A” in the black circle represents an ammeter, and the “V” in the black circle represents a voltmeter).
Three separate experiments on water–oil displacement were conducted in different media, both from top to bottom and from bottom to top, with control groups established. This experiment was conducted in a controlled environment with constant temperature and humidity. The laboratory temperature was maintained at (20 ± 2) °C, and the relative humidity was kept at (50 ± 5)%. The light intensity in the conventional area was set between 300 and 500 lux. Additionally, the test device was positioned on an independent shock-proof platform with a vibration frequency of less than 0.1 Hz. When the water–oil interface initially contacts the soil, it is denoted as P0. Throughout the rising (or falling) process of the water–oil interface, resistivity values are recorded and calculated for every centimeter of change. The specific experimental procedure is as follows: ① uniformly apply Vaseline on the device wall to mitigate edge effects [26]; fill a screened sand sample into a soil column; ② connect the water (oil) tank to the injection port for saturating the soil column; ③ adjust the voltmeter and ammeter settings, ensuring correct circuit connections before powering on; ④ reinject oil (water) through valve adjustment at the injection port while observing and recording corresponding current and voltage values; ⑤ calculate respective resistivity using Formula (1).
3. Results and Analysis
3.1. The Resistivity Variation Law During Water Flooding as a Replacement for Oil
To investigate the resistivity changes of different media during water displacement oil processes, we conducted experiments on homogeneous soil columns with both top-to-bottom and bottom-to-top water displacements. Our observations in Figure 3 illustrate the variations in resistivity and its rate of change based on the position of the water–oil interface.
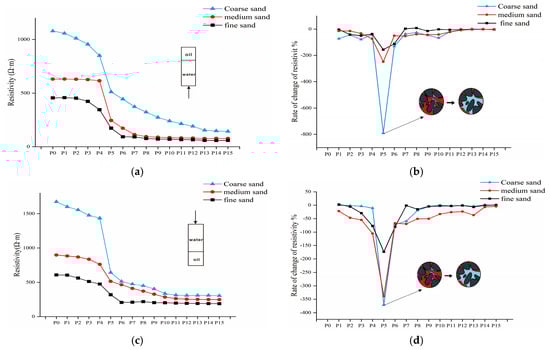
Figure 3.
The resistivity response characteristics during the process of water displacing oil: (a–d) represent two displacement directions. (Color note: In Figures (b,d), the black arrows indicate the mutation positions, and the two circles represent the microstructure of the mutation positions. Among them, black-grey is the sand sample particles, red is the oil, and light blue is the water).
In Figure 3a,b, respectively, illustrate the changes in resistivity and its rate of change during the process of water displacement of diesel from bottom to top. It can be clearly seen from this figure that with the change in the water–oil interface, the resistivity of uniform fine sand, uniform medium sand and uniform coarse sand columns can be divided into three stages.
At the initial stage of the experiment, when the water–oil interface was at P0, the pores of the medium were completely saturated with diesel. Given that diesel is a type of LNAPL and exhibits high electrical resistivity as an insulating liquid, the resistivity at P0 reached its maximum value.
At the initial stage of change (P0–P4), water infiltrates from the bottom of the column and displaces some of the oil located in the lower layer of the sand grains. Owing to the high conductivity of water, the resistivity of the entire column gradually decreases.
From P4 to P5, the system transitions into the resistivity mutation stage. Continuous water injection disrupts the original capillary forces within the medium, breaking the continuity of the oil phase. The previously isolated and high-resistance oil droplets are replaced by low-resistance water-phase connectivity pathways, which establish dominant seepage channels. Once the water-phase saturation surpasses the critical threshold, conductive pathways become rapidly interconnected. Given that water is a highly conductive medium, the overall conductive properties of the medium are significantly enhanced. (as illustrated in Figure 3b–d) [27].
Finally, from P5 to P15, the system reaches the resistivity stabilization stage. Under the influence of water, stable flow paths are established and expanded within the sand grain pores. Although the resistivity continues to decrease slowly during this period, it essentially stabilizes at a low level. Consequently, the resistance value of the column remains consistently low and stable.
In the experiment of water displacement by diesel oil, Figure 3c,d show similar patterns.
3.2. The Variation Law of Resistivity During Oil Displacement by Water
In order to investigate the resistivity variation in different media during water displacement by oil, we conducted oil displacement experiments on homogeneous soil columns from top to bottom and from bottom to top, and plotted the changes in resistivity as well as its rate of change with respect to the position of the water–oil interface. The specific results are illustrated in Figure 4.
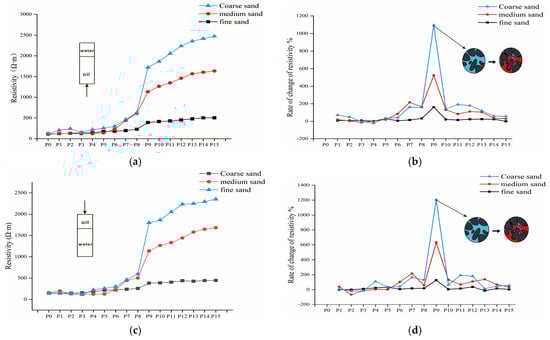
Figure 4.
The resistivity response characteristics during the process of oil displacing water, (a–d) represent two displacement directions. Color note: In Figures (b,d), the black arrows indicate the mutation positions, and the two circles represent the microstructure of the mutation positions. Among them, black-grey is the sand sample particles, red is the oil, and light blue is the water.
In Figure 4a,b, respectively, illustrate the changes of resistivity and its rate of change during the process of water displacement by diesel from bottom to top. It can be clearly seen from this figure that with the change in the water–oil interface, the resistivity of uniform fine sand, uniform medium sand and uniform coarse sand columns can be divided into three stages.
At the initial stage of the experiment, when the water–oil interface was at P0, the pores of the medium were fully saturated with water. Since the water used in the experiment had low resistivity as a conductive liquid, the resistivity at P0 attained its minimum value.
The initial change stage occurs from P0 to P8. During this period, diesel begins to seep from the bottom of the column, displacing water that resides between the sand grains. As diesel is non-conductive, this infiltration leads to a gradual increase in the overall resistivity of the column.
From P8 to P9, the system enters the stage of sudden change in resistivity. This phenomenon can be attributed to oil displacing the original water within the pore spaces between sand particles, forming an oil film that coats their surfaces. This leads to enhanced cementation and increased contact area between particles. The hydrophobic nature of oil induces a “lotus effect” on the porous media, thereby altering the internal soil moisture connectivity. Furthermore, significant free-phase oil contamination in soil results in thicker surface films that block pore pathways, leading to higher resistance [28] (as illustrated in Figure 4b,d).
Finally, from P9 to P15, the system transitions into the stage of stable resistivity. During this period, nearly all voids are saturated with oil, reaching their maximum capacity and maintaining a relatively stable state. Although resistivity exhibits a slight upward trend, it essentially stabilizes at a consistently high level. Consequently, the column’s resistivity remains consistently high and stable throughout this phase.
In the experiment of diesel-driven water displacement from top to bottom, Figure 4c,d show similar patterns.
3.3. Analysis of the Influence of Medium Particle Size on Test Results
In order to investigate the impact of varying particle sizes on resistivity changes during the experimental process, we generated a total of 12 sets of graphs illustrating the variations in resistivity differences for three distinct particle sizes.
In this subsection, the index adopted is the resistivity change value. This index represents the relative increase or decrease in resistivity at each measurement position compared to the previous one as the water–oil interface shifts during the experiment. It can quantify the amplitude of resistivity variation at each measurement position during the water–oil displacement process and elucidate the impact of particle size differences on resistivity by comparing resistivity changes across different media at the same position.
Figure 5 illustrates the variations in resistivity values for three different particle sizes of media under various testing conditions. Specifically, (a) depicts the process of water displacing diesel from bottom to top, while (b) shows the reverse process from top to bottom. Panels (c) and (d) represent the processes of diesel displacing water in both directions. The resistivity values of the three media types change to varying extents depending on the position of the water–oil interface.
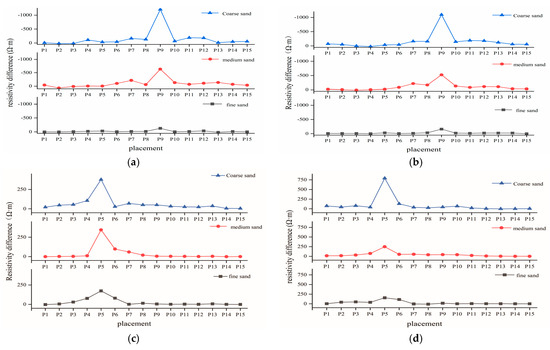
Figure 5.
The variations in resistivity values of three media: (a–d) represent two displacement directions.
As shown in the figure, (a) and (b) are water displacing oil, so the resistivity change values are all negative. (c) and (d) are oil displacing water; therefore, the resistivity change values are positive. This figure demonstrates that, irrespective of the testing conditions, the magnitude of resistivity change during the mutation stage is highest for coarse sand, followed by medium sand and fine sand. This phenomenon can be attributed to the presence of larger pores in coarse sand particles. During water displacement of diesel, these large pores facilitate the formation of wide and dense channels, leading to rapid and significant changes in resistivity [29]. Similarly, when saturated with oil, the larger pores in coarse sand increase the resistivity because oil acts as a non-conductive filling material. Larger pores are more likely to form high-resistance bodies, which ultimately manifest as changes in resistivity values, as illustrated in Figure 5.
3.4. The Impact of the Direction of Displacement on the Experimental Results
To thoroughly investigate the impact of displacement direction on experimental outcomes, this study constructed a scatter plot (Figure 6) illustrating the resistivity variation values of three media under different displacement directions. Figure 6a–c correspond to coarse sand, medium sand, and fine sand media during the water flooding oil process, respectively. Meanwhile, (d), (e), and (f) represent coarse sand, medium sand, and fine sand media during the oil flooding water process, respectively.
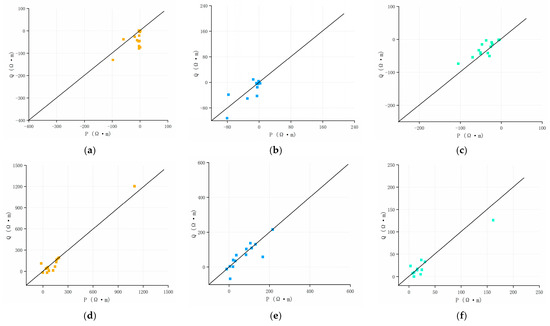
Figure 6.
Relationship diagram of P–Q, where P denotes the displacement direction from top to bottom, while Q indicates the direction from bottom to top. (a–c) are coarse sand, medium sand, and fine sand, respectively, in the process of water displacing oil. (d–f) are coarse sand, medium sand, and fine sand, respectively, in the process of oil displacing water.
Specifically, in the figure, P denotes the displacement direction from bottom to top, while Q indicates the displacement direction from top to bottom. The index data for both P and Q are derived from the resistivity change values at the same measurement positions under different displacement directions as the water–oil interface varies. To more intuitively observe and analyze the relationship between resistivity changes during these two displacement processes, we define P as the x-axis and Q as the y-axis, construct (P, Q) coordinates using the data from all measurement positions obtained during the experiment, plot a scatter diagram, and use P = Q as the reference line.
When scatter points align with or closely follow the P = Q straight line, it indicates that regardless of which direction of displacement is employed, there will be no differential impact on experimental results. However, when scatter points deviate above or below this straight line, it implies that displacement direction does affect resistivity changes when water–oil interfaces are located at those positions; furthermore, the greater their deviation from this straight line, the more pronounced their impact becomes. As illustrated in Figure 5a–c, the water displacement process exhibits markedly different behaviors across various sand types. Fine and medium sands display concentrated or uniform distributions of dispersed points on both sides of the P = Q line, whereas coarse sand predominantly clusters below this line. This observation suggests that the top-to-bottom displacement direction exerts a more pronounced influence on coarse sand by promoting the rapid formation of wide and stable water-conducting channels due to gravitational effects. In contrast, fine and medium sands are less affected by this displacement direction because their stronger capillary force [30] counteracts the influence of gravity [31].
In Figure 6d–f, all three types of media—coarse sand, medium sand, and fine sand—exhibit concentrated points at P = Q in their respective P–Q plots during oil displacement by water. This indicates that changes in resistivity are almost unaffected by the displacement direction. The equilibrium state observed during the water displacement of diesel oil can be attributed to the balance of the buoyancy of the oil, the gravitational force between water and oil, the capillary force within the medium [32], and the continuum mechanics mechanism [33].
4. Discussion
This study systematically investigates the variation in electrical resistivity with different positions of the water–oil interface through indoor column displacement experiments.
In analogous experiments, the resistivity method is commonly favored to delineate the migration pathways of LNAPLs under the influence of groundwater, define its contamination extent, and investigate pollution concentration levels. Li Z et al. [34] utilized the time-lapse resistivity tomography technique to study the migration mechanism of LNAPLs under the conditions of a constant groundwater level and a dropping groundwater level. The relationship between resistivity and the contents of water and oil was established, and the content of LNAPLs was inversely calculated through resistivity inversion. Yang C et al. [35] explored the use of resistivity technology to delineate the contaminated area range after LNAPL contaminated shallow groundwater. Conversely, this study adopts a novel research orientation by concentrating on the interface dynamics between LNAPLs and water and their impact on resistivity. Notably, the prominent mutation points in the experimental results effectively reveal the spatial positional relationship between the groundwater and the LNAPL contamination interface, thus furnishing robust evidence for the spatial interaction mechanism between these two phases.
The experimental results demonstrate significant abrupt changes in resistivity for three types of media: homogeneous fine sand, homogeneous medium sand, and homogeneous coarse sand. The mechanism and patterns of these changes are highly consistent. This abrupt change phenomenon provides a strong scientific basis for monitoring underground pollution and groundwater level fluctuations. Particle size is confirmed as a key factor affecting both the rate and magnitude of resistivity variations. In LNAPL-contaminated soils subjected to water injection displacement, there are differences in resistivity variations among different media regions. The correlation between particle size and resistivity helps explain differential resistance changes during water–oil displacements in various particle-sized media.
During oil–water displacements, displacement direction has an impact on experimental results; however, its effect can be negligible when oil displaces water. Therefore, when using injection methods for site remediation purposes, it is important to consider the role of displacement direction fully and utilize favorable conditions such as gravity to improve efficiency.
In the “Results and Analysis” section, this study extensively investigates the influence of particle size on changes in resistivity. The pore structure formed by different particle sizes of the medium affects the trend of resistivity variation. Further research from a microscopic perspective may involve studying the role of minor minerals and free mineral ions in media with different particle sizes, which would contribute to a more comprehensive understanding of the impact of particle size on experimental results. This study uses homogeneous sand samples and diesel oil as LNAPL contaminants to explore specific patterns of resistivity changes. Future research could incorporate other types of LNAPL contaminants for experimental analysis, providing scientific basis for addressing more complex soil and groundwater pollution issues. Furthermore, incorporating the factor of time into the experiment is a very good research idea. Future studies can explore the relationship between resistivity and the position of the oil–water interface as well as time to deepen our understanding of this process.
5. Conclusions
In this study, we investigated the resistivity changes during the mutual displacement process of water and oil, examining the effects of displacement direction and particle size on the experimental outcomes.
The results indicate that when water displaces oil, resistivity decreases, with a sharp decline observed as water forms a continuous flow channel within the gravel pores. Conversely, when oil displaces water, resistivity increases due to the high-resistance characteristics of oil filling the soil pores. The position of the oil–water interface is closely correlated with resistivity changes, and monitoring sudden shifts in resistivity offers a reliable method for verifying the mutual displacement phenomenon of water and oil in rock and soil formations. Additionally, during oil displacement of water, the displacement direction has minimal influence on resistivity changes among the three media; however, during water displacement of oil, gravitational effects significantly impact resistivity changes, underscoring the importance of relative permeability and fluid dynamics. Moreover, the particle size of the sand medium directly influences resistivity changes, with larger particles resulting in more pronounced variations. These findings provide valuable insights into the monitoring and characterization of fluid dynamics in underground environments.
Author Contributions
Methodology, H.Z. (Hongli Zhang); Resources, H.Z. (Hongli Zhang); Data curation, H.Z. (Huan Zhu); Writing—original draft, G.Z.; Writing—review & editing, J.A. All authors have read and agreed to the published version of the manuscript.
Funding
This research was funded by [Key Scientific Research Project of Colleges and Universities in Henan Province] grant number [24A170020]. And The APC was funded by [Key Scientific Research Project of Colleges and Universities in Henan Province] grant number [24A170020].
Data Availability Statement
The original contributions presented in the study are included in the article, further inquiries can be directed to the corresponding author.
Acknowledgments
Throughout the entire process of writing this thesis, I received a great deal of support and assistance. I especially want to thank my team members, Jie An and Hongli Zhang, for their excellent cooperation and patient support. I also want to thank my supervisor, Guizhang Zhao, for the valuable guidance they provided throughout my learning process. You provided me with the necessary tools, enabling me to choose the right direction and successfully complete my thesis.
Conflicts of Interest
Author Huan Zhu was employed by the company Zhongsheng Environmental Science and Technology Development Co., Ltd. The remaining authors declare that the research was conducted in the absence of any commercial or financial relationships that could be construed as a potential conflict of interest.
References
- Mineo, S. Groundwater and soil contamination by LNAPL: State of the art and future challenges. Sci. Total Environ. 2023, 874, 162394. [Google Scholar] [PubMed]
- Shen, H.; Huang, Y.; Illman, W.A.; Su, Y.; Miao, K. Migration behaviour of LNAPL in fractures filled with porous media: Laboratory experiments and numerical simulations. J. Contam. Hydrol. 2023, 253, 104118. [Google Scholar] [PubMed]
- Zuo, R.; Wu, Z.; Li, J.; Zheng, S.; Liu, J.; Han, K.; Liu, Y.; Wang, J. Retention effect and mode of capillary zone on the migration process of LNAPL pollutants based on experimental exploration. Ecotoxicol. Environ. Saf. 2023, 253, 114669. [Google Scholar] [CrossRef] [PubMed]
- Onaa, C.; Olaobaju, E.A.; Amro, M.M. Experimental and numerical assessment of Light Non-Aqueous Phase Liquid (LNAPL) subsurface migration behavior in the vicinity of groundwater table. Environ. Technol. Innov. 2021, 23, 101573. [Google Scholar] [CrossRef]
- Yuan, C.; Yin, Y.; Hu, X.; Yu, X.; Li, Y. Experimental and numerical simulation study on quantitative assessment of LNAPL migration behavior in porous media. J. Hydrol. 2024, 651, 132619. [Google Scholar]
- Yang, J.; Jiang, W.; Liu, Y.; Feng, Q. Influence of porosity and temperature on light non-aqueous phase liquid diffusion in soils. Chemosphere 2023, 333, 138744. [Google Scholar] [PubMed]
- Waqar, A. Evaluation of factors causing lateral migration of light non-aqueous phase liquids (LNAPLs) in onshore oil spill accidents. Environ. Sci. Pollut. Res. 2024, 31, 10853–10873. [Google Scholar]
- Archie, G.E. The electrical resistivity log as an aid in determining some reservoir characteristics. Trans. AIME 1942, 146, 54–62. [Google Scholar]
- Yoon, G.L.; Park, J.B. Sensitivity of leachate and fine contents on electrical resistivity variations of sandy soils. J. Hazard. Mater. 2001, 84, 147–161. [Google Scholar]
- Fukue, M.; Minato, T.; Horibe, H.; Taya, N. The micro-structures of clay given by resistivity measurements. Eng. Geol. 1999, 54, 43–53. [Google Scholar]
- Yoon, G.; Oh, M.; Park, J. Laboratory study of landfill leachate effect on resistivity in unsaturated soil using cone penetrometer. Environ. Geol. 2002, 43, 18–28. [Google Scholar]
- Nai, C.; Sun, X.; Wang, Z.; Xu, Y.; Liu, Y.; Liu, J.; Dong, L.; Huang, Q.; Wang, Y. Complex resistivity characteristics of saltwater-intruded sand contaminated by heavy metal. Sci. Rep. 2019, 9, 10944. [Google Scholar] [CrossRef] [PubMed]
- Tang, C.S.; Wang, D.Y.; Zhu, C.; Zhou, Q.Y.; Xu, S.K.; Shi, B. Characterizing drying-induced clayey soil desiccation cracking process using electrical resistivity method. Appl. Clay Sci. 2018, 152, 101–112. [Google Scholar] [CrossRef]
- Zhang, B.; Feng, L.; Zhang, M.; Sun, P.; Li, T.; Liu, H. Application of resistivity measurement to stability evaluation for loess slopes. Landslides 2022, 19, 2871–2887. [Google Scholar] [CrossRef]
- Fajana, A.O.; Ofobutu, H.O.; Eluwole, A.B. Laboratory modeling for contaminant migration monitoring using electrical resistivity method. Model. Earth Syst. Environ. 2020, 6, 1027–1043. [Google Scholar] [CrossRef]
- Adepelumi, A.A.; Solanke, A.A.; Sanusi, O.B.; Shallangwa, A.M. Model tank electrical resistivity characterization of LNAPL migration in a clayey-sand formation. Environ. Geol. 2006, 50, 1221–1233. [Google Scholar] [CrossRef]
- Pan, Y.; Zhang, Q.; Yu, Y.; Tong, Y.; Wu, W.; Zhou, Y.; Hou, W.; Yang, J. Three-dimensional migration and resistivity characteristics of crude oil in heterogeneous soil layers. Environ. Pollut. 2021, 268, 115309. [Google Scholar] [CrossRef]
- Adeniran, M.A.; Oladunjoye, M.A.; Doro, K.O. Electrical resistivity imaging of crude oil contaminant in coastal soils–A laboratory sandbox study. J. Appl. Geophys. 2024, 230, 105516. [Google Scholar] [CrossRef]
- Kong, K.; Shao, S. Effect of wettability on the variation of resistivity characteristics during diesel oil infiltration into the unsaturated zone. Environ. Earth Sci. 2023, 82, 552. [Google Scholar] [CrossRef]
- Ghahremani, N.; Moghaddas, N.H.; Ghafoori, M.; Lashkaripour, G.R. Evaluation of the effect of wastewater contamination on the geotechnical and electrical resistivity properties of a silty clay. Environ. Earth Sci. 2019, 78, 1–10. [Google Scholar] [CrossRef]
- Folch, A.; del Val, L.; Luquot, L.; Martínez-Péreza, L.; Bellmunt, F.; Le Lay, H.; Rodellas, V.; Ferrer, N.; Palacios, A.; Fernández, S.; et al. Monitoring of internal erosion processes by time-lapse electrical resistivity tomography. J. Hydrol. 2020, 589, 125340. [Google Scholar]
- Sangprasat, K.; Puttiwongrak, A.; Inazumi, S. Comprehensive analysis of correlations between soil electrical resistivity and index geotechnical properties. Results Eng. 2024, 23, 102696. [Google Scholar] [CrossRef]
- Teng, X.; Yanhui, D.; Deqiang, M.; Jian, M. Delineation of LNAPL contaminant plumes at a former perfumery plant using electrical resistivity tomography. Hydrogeol. J. 2021, 29, 1189–1201. [Google Scholar]
- Zhang, Y.; Hou, D.; Xu, C.; Wang, H.; Peng, L.; Yuan, X.; Zhang, X.; Li, G.; Sun, S. Sand gradation detection method based on local sampling. Sci. Rep. 2024, 14, 29464. [Google Scholar] [CrossRef]
- Samouëlian, A.; Cousin, I.; Tabbagh, A.; Bruand, A.; Richard, G. Electrical resistivity survey in soil science: A review. Soil Tillage Res. 2005, 83, 173–193. [Google Scholar] [CrossRef]
- Fan, Y.; Lee, P.S.; Chua, B.W. Investigation on the influence of edge effect on flow and temperature uniformities in cylindrical oblique-finned minichannel array. Int. J. Heat Mass Transf. 2014, 70, 651–663. [Google Scholar] [CrossRef]
- Ansari, S.; Norooz, R.; Zeynolabedin, A.; Foadi, H.; Ghiassi, R. Experimental investigation of correlations between electrical resistivity, moisture content and voltage values for leachate contaminated clayey sand. J. Appl. Geophys. 2021, 193, 104391. [Google Scholar] [CrossRef]
- Pan, Y.; Jia, Y.; Wang, Y.; Xia, X.; Guo, L. Study on diesel vertical migration characteristics and mechanism in water-bearing sand stratum using an automated resistivity monitoring system. Environ. Sci. Pollut. Res. 2018, 25, 3802–3812. [Google Scholar] [CrossRef]
- Abidin, M.H.Z.; Wijeyesekera, D.C.; Saad, R.; Ahmad, F. The influence of soil moisture content and grain size characteristics on its field electrical resistivity. Electron. J. Geotech. Eng. 2013, 18, 699–705. [Google Scholar]
- Morrow, N.R. Physics and thermodynamics of capillary action in porous media. Ind. Eng. Chem. 1970, 62, 32–56. [Google Scholar] [CrossRef]
- Bijeljic, B.; Markicevic, B.; Navaz, H.K. Capillary climb dynamics in the limits of prevailing capillary and gravity force. Phys. Rev. E Stat. Nonlinear Soft Matter Phys. 2011, 83, 056310. [Google Scholar] [CrossRef] [PubMed]
- Wang, W.; Chen, Y. Mesoscale modeling: Beyond local equilibrium assumption for multiphase flow. In Advances in Chemical Engineering; Academic Press: Cambridge, MA, USA, 2015; Volume 47, pp. 193–277. [Google Scholar]
- Dou, X.; Chen, Z.; Cao, X.; Ma, C.; Liu, J. Oil displacement by the magnetic fluid inside a cylindrical sand-filled sample: Experiments and numerical simulations. ACS Omega 2022, 7, 26473–26482. [Google Scholar] [CrossRef] [PubMed]
- Li, Z.-P.; Liu, Y.; Zhao, G.-Z.; Liu, S.-K.; Liu, W.-H. LNAPL migration processes based on time-lapse electrical resistivity tomography. J. Contam. Hydrol. 2023, 259, 104260. [Google Scholar] [CrossRef] [PubMed]
- Yang, C.H.; Yu, C.Y.; Su, S.W. High resistivities associated with a newly formed LNAPL plume imaged by geoelectric techniques-a case study. J. Chin. Inst. Eng. 2007, 30, 53–62. [Google Scholar] [CrossRef]


Disclaimer/Publisher’s Note: The statements, opinions and data contained in all publications are solely those of the individual author(s) and contributor(s) and not of MDPI and/or the editor(s). MDPI and/or the editor(s) disclaim responsibility for any injury to people or property resulting from any ideas, methods, instructions or products referred to in the content. |
© 2025 by the authors. Licensee MDPI, Basel, Switzerland. This article is an open access article distributed under the terms and conditions of the Creative Commons Attribution (CC BY) license (https://creativecommons.org/licenses/by/4.0/).