Article

Deep Learning Downscaling of Precipitation Projection over Central Asia

1
State Key Laboratory of Loess Science, Institute of Earth Environment, Chinese Academy of Sciences, Xi’an 710061, China
2
University of Chinese Academy of Sciences, Beijing 100049, China
3
School of Computer Science, Xi’an Shiyou University, Xi’an 710065, China
*
Authors to whom correspondence should be addressed.
Water 2025, 17(7), 1089; https://doi.org/10.3390/w17071089
Submission received: 3 March 2025 / Revised: 1 April 2025 / Accepted: 3 April 2025 / Published: 5 April 2025

Abstract

:
Central Asia, as a chronically water-stressed region marked by extreme aridity, faces significant environmental challenges from intensifying desertification and deteriorating ecological stability. The region’s vulnerability to shifting precipitation regimes and extreme hydrometeorological events has been magnified under anthropogenic climate forcing. Although global climate models (GCMs) remain essential tools for climate projections, their utility in Central Asia’s complex terrain is constrained by inherent limitations: coarse spatial resolution (~100–250 km) and imperfect parameterization of orographic precipitation mechanisms. This investigation advances precipitation modeling through deep learning-enhanced statistical downscaling, employing convolutional neural networks (CNNs) to generate high-resolution precipitation data at approximately 10 km resolution. Our results show that the deep learning models successfully simulate the high center of precipitation and extreme precipitation near the Tianshan Mountains, exhibiting high spatial applicability. Under intermediate (SSP-245) and high-emission (SSP-585) future scenarios, the increase in extreme precipitation over the next century is significantly more pronounced compared to mean precipitation. By the end of the 21st century, the interannual variability of mean precipitation and extreme precipitation will become even larger under SSP-585, indicating an increased risk of extreme droughts/floods in Central Asia under high greenhouse gas emissions. Our findings provide technical support for climate change impact assessments in the region and highlight the potential of CNN-based downscaling for future climate change studies.

1. Introduction

Central Asia, situated in inland Asia, represents one of the world’s largest arid zones characterized by fragile ecosystems highly sensitive to global climate change. Changes in the precipitation regimes and extreme weather events exert profound impacts on regional ecological stability and human livelihoods [1,2]. Recent observational studies (1979–2018) reveal an intensification of both mean and extreme precipitation across Central Asian drylands, with maximum increases observed east of 65° E longitude [3,4]. Coordinated modeling experiments under the Coupled Model Intercomparison Project Phase 5 (CMIP5) emission scenarios project substantial precipitation augmentation throughout Asia by the late 21st century, particularly pronounced in the Tianshan Mountains and northern regions [5]. These projections align with the subsequent CMIP6 simulations, reaffirming precipitation enhancement trends [6,7].
Despite significant advancements in models, the current global climate models (GCMs) face critical limitations in regional climate applications, particularly over complex terrain such as Central Asia. Their coarse spatial resolution impedes the accurate characterization of localized precipitation dynamics and extreme event patterns [8,9,10]. While traditional statistical downscaling techniques maintain computational efficiency, their capacity to resolve nonlinear atmospheric circulation–precipitation relationships remains constrained, particularly in reproducing spatiotemporal precipitation evolution across Central Asia’s complex terrain. Recent advancements in artificial intelligence (AI) have significantly enhanced the application of deep learning architectures in climate downscaling. These data-driven approaches exhibit remarkable capabilities in modeling complex nonlinear climate interactions, while effectively addressing overfitting challenges through improved adaptability and enhanced generalization capacity [11,12,13,14,15]. Comparative analyses by Sun and Lan (2021) utilizing Baño-Medina’s framework demonstrated that convolutional neural networks (CNNs) outperform the generalized linear models in precipitation downscaling accuracy across Chinese watersheds [16,17]. Nevertheless, the inherent limitations of CNNs become apparent in deep architectures, including progressive accuracy degradation, gradient instability (vanishing/exploding gradients), and performance plateauing. Zhang et al. (2018) addressed these challenges through Residual Dense Block (RDB) integration, strategically combining residual structures, dense connections, and nonlinear mappings while eliminating batch normalization constraints [18]. This architectural innovation facilitates enhanced high-level feature learning, parameter efficiency optimization, and gradient flow stabilization in deep networks. According to this innovation, Fu et al. (2024) developed the Residual in Residual Dense Block-based (RRDB) network, which demonstrated significant advancements in extreme precipitation modeling within China’s Yellow River Basin compared to conventional CNNs [19].
This study establishes a comprehensive statistical downscaling framework for Central Asian precipitation, aiming to generate high-resolution climate data that enhance regional forecasting accuracy and improve predictive capabilities for future precipitation patterns. Through a systematic evaluation of three advanced deep learning architectures (CNN1, CNN10, and RRDB), we evaluate the model performance in simulating both mean annual precipitation and extreme precipitation indices (R95p), using Global Precipitation Measurement (GPM) mission observations as benchmark data. The research pursues two primary objectives: (1) quantifying climate change impacts on Central Asian hydroclimatic systems, and (2) critically assessing deep learning model applicability under projected climate scenarios.

2. Materials and Methods

2.1. Study Area

The primary study area of this research is Central Asia (36–50° N, 66–90° E), as illustrated in Figure 1. Central Asia is situated at the convergence zone of Asia and Europe, encompassing northwestern China, northern Kazakhstan, and western Kyrgyzstan and Tajikistan. The region features rugged mountains and complex topography, with distinct geographic landmarks including the Balkhash Lake and Altai Mountains in the north, the narrow Tianshan Mountains in the central area, and the Kunlun Mountains in the south. Due to the high sensitivity of precipitation generation to this complex topography, high-resolution precipitation data are essential for accurately capturing the influence of this heterogeneous terrain on precipitation patterns and improving regional precipitation forecasting.

2.2. Research Data

The input dataset used for training and testing deep learning models came from the fifth generation of atmospheric reanalysis data (ERA5) [20] released by the European Centre for Medium-Range Weather Forecasts (ECMWF). This dataset is widely used as a set of predictors in statistical downscaling analysis [17,19]. The selected predictor variables include the daily zonal wind component, meridional wind component, potential height, specific humidity, and temperature, with a horizontal resolution of 2° × 2° at 850 hPa, 700 hPa, and 500 hPa [17,19,21]. These 15 predictor variables were stacked together to form the input data matrix.
The target precipitation data for Central Asia was sourced from the Multi-Satellite Precipitation Joint Inversion Precipitation Product (MSPJIPP) provided by the Global Precipitation Measurement (GPM) program [22], with a horizontal resolution for 0.1° × 0.1° and a temporal resolution for 0.5 h. To maintain the temporal resolution of the target precipitation data consistent with the predictor variables, the precipitation data were averaged daily to derive daily precipitation values, which were then used as the observed daily precipitation data. The ERA5 and GPM datasets covered the period from 1 January 2001 to 31 December 2020. Data from 2001 to 2015 were used to train the model and establish the statistical relationships between atmospheric circulation factors and precipitation in Central Asia. The validation period spanned from 2016 to 2020, and these data were used to evaluate the ability of the deep learning models to simulate the regional precipitation over Central Asia.
In the analysis of future precipitation forecasts for Central Asia, the set of predictor variables used in the statistical precipitation model came from the EC-Earth3 global climate model [23] which is part of the CMIP6 multi-model comparison project. These predictor variables were identical to the 15 variables in the ERA5 dataset described earlier. Model experiments were based on historical simulations (1979–2014) and scenario simulations (2015–2100) under two Shared Socioeconomic Pathways (SSP simulations), namely the SSP-245 (moderate emission scenario) and SSP-585 (high emission scenario). To ensure consistency in horizontal resolution between the EC-Earth3 model data and the predictor datasets of the training model, the bilinear interpolation method was applied to interpolate the EC-Earth3 predictors into a 2° × 2° grid. In addition, we also used the GPM daily precipitation (with a horizontal resolution of 0.1° × 0.1° from 2001 to 2020) to evaluate the results of GCM and the deep learning models.

2.3. Research Methodology

Three deep learning models were employed for statistical precipitation downscaling in Central Asia including CNN1, CNN10, and RRDB in Figure 2. Figure 2a illustrates the complete architecture of the CNN model. The fundamental structure of convolutional neural networks comprises several specialized layers: convolutional layers, nonlinear activation function layers (ReLU), pooling layers, and fully connected layers [17]. The baseline CNN1 architecture serves as the foundational framework. To investigate the influence of convolutional feature extraction capacity, they also modified CNN1 to create CNN10 by increasing the third convolutional layer filters from 1 to 10 [17]. In addition, Figure 2b presents the complete architecture of the Residual-in-Residual Dense Block (RRDB) network [18]. The model first processes the input dataset X through an initial feature extraction module consisting of convolutional layers (Conv) with ReLU activation functions. The core feature extraction is performed by the RRDB architecture, which enhances feature learning through the following: (1) dense local connections that preserve fine-scale precipitation patterns, (2) residual learning that facilitates gradient flow during backpropagation, and (3) an adaptive mechanism that effectively combines hierarchical features from both preceding and current network layers. The network then generates the precipitation distribution parameters (p, α, and β) through a sequence of processing layers: two consecutive convolution operations with ReLU nonlinearities, followed by a fully connected layer (FC) that produces the final precipitation predictions (Y). The RRDB network was adopted for its demonstrated superiority over conventional models in high-resolution precipitation simulation, particularly in capturing spatiotemporal rainfall patterns [19].
In this study, we employed the Bernoulli-Gamma distribution to predict the model precipitation occurrence probability and precipitation amounts [17,19]. The Bernoulli-Gamma probability density function is defined as
f y ; p , α , β = 1 p ,                                                         f o r   y = 0 , p y α 1 e x p y / β β α Γ α                 f o r   y > 0 ,  
where y represents the observed precipitation, p is the probability of precipitation occurrence, and α and β are the shape and scale parameters of the Gamma distribution, respectively. Γ(α) denotes the Gamma function.
The loss function quantifies the discrepancy between model predictions and observed values. Based on the Bernoulli-Gamma probability density function (Equation (1)), we adopt the Bernoulli-Gamma loss function L as follows [19]:
L =   t = 1 N M = 1 M l o g { f m [ ( y m ( t ) | x ( t ) ) ] }
where x t denotes input predictors at time t , and y m t represents the observed precipitation amount at grid point m and time t. f m is the probability density function for grid point m, M indicates the total number of spatial grid points, and N corresponds to the batch time step.
In this paper, the model was trained to utilize data spanning the years 2001 to 2015 in ERA5 atmospheric variables and GPM precipitation, while the test data relied on data collected from 2016 to 2020. The training set contained 5478 daily precipitation samples, while the test set contained 1826 daily precipitation samples. We used the Adam optimizer to optimally update the weights of the convolution filter [24], the learning rate set to 10−4, and the batch size set to 32. The training objective was to optimize the network parameters by minimizing the Bernoulli-Gamma loss function L through backpropagation-based gradient descent. This optimization process iteratively adjusted the model weights to maximize the probability of observing the actual precipitation values given the input meteorological conditions. To avoid the model becoming too specialized for the training data, an early stopping technique was implemented with a patience level set at 30 iterations. In the training, we loaded several R language libraries related to climate downscaling, including loadeR (https://github.com/PROMiDAT/loadeR (accessed on 15 November 2023)), loadeR.2nc (https://github.com/SantanderMetGroup/loadeR.2nc (accessed on 15 November 2023)), transformeR (v0.2.0) [25], downscaleR (v3.1.0) [26], and downscaleR.keras (v3.1.0) [17], which are mainly used for reading, preprocessing, and downscaling modeling of climate data. Server parameters: Intel ® Xeon ® w7-3445 (manufactured by Intel, Santa Clara, CA, USA) (20 cores, up to 4.8 GHz Turbo, 270 W), Ubuntu ® Linux ® 22.04 (developed by Canonical Ltd., London, UK), NVIDIA ® RTX TM 4000 Ada Generation (manufactured by NVIDIA, Santa Clara, CA, USA), 256 GB DDR5, 1024 GB SSD. Each training takes 35 min for this service.
Figure 2. (a) Overall framework flowchart of the CNN1/CNN10 model [26] and (b) the RRDB model [19].
Water 17 01089 g002
Model performance was quantified using difference (bias, mm day−1), root mean square error (RMSE, mm day−1), and Pearson correlation coefficient (CC). Extreme precipitation simulation capability was further evaluated using the R95p index—cumulative precipitation exceeding the 95th percentile threshold, which is defined by the Expert Team on Climate Change Detection and Indices (ETCCDI) [8,27].

3. Results

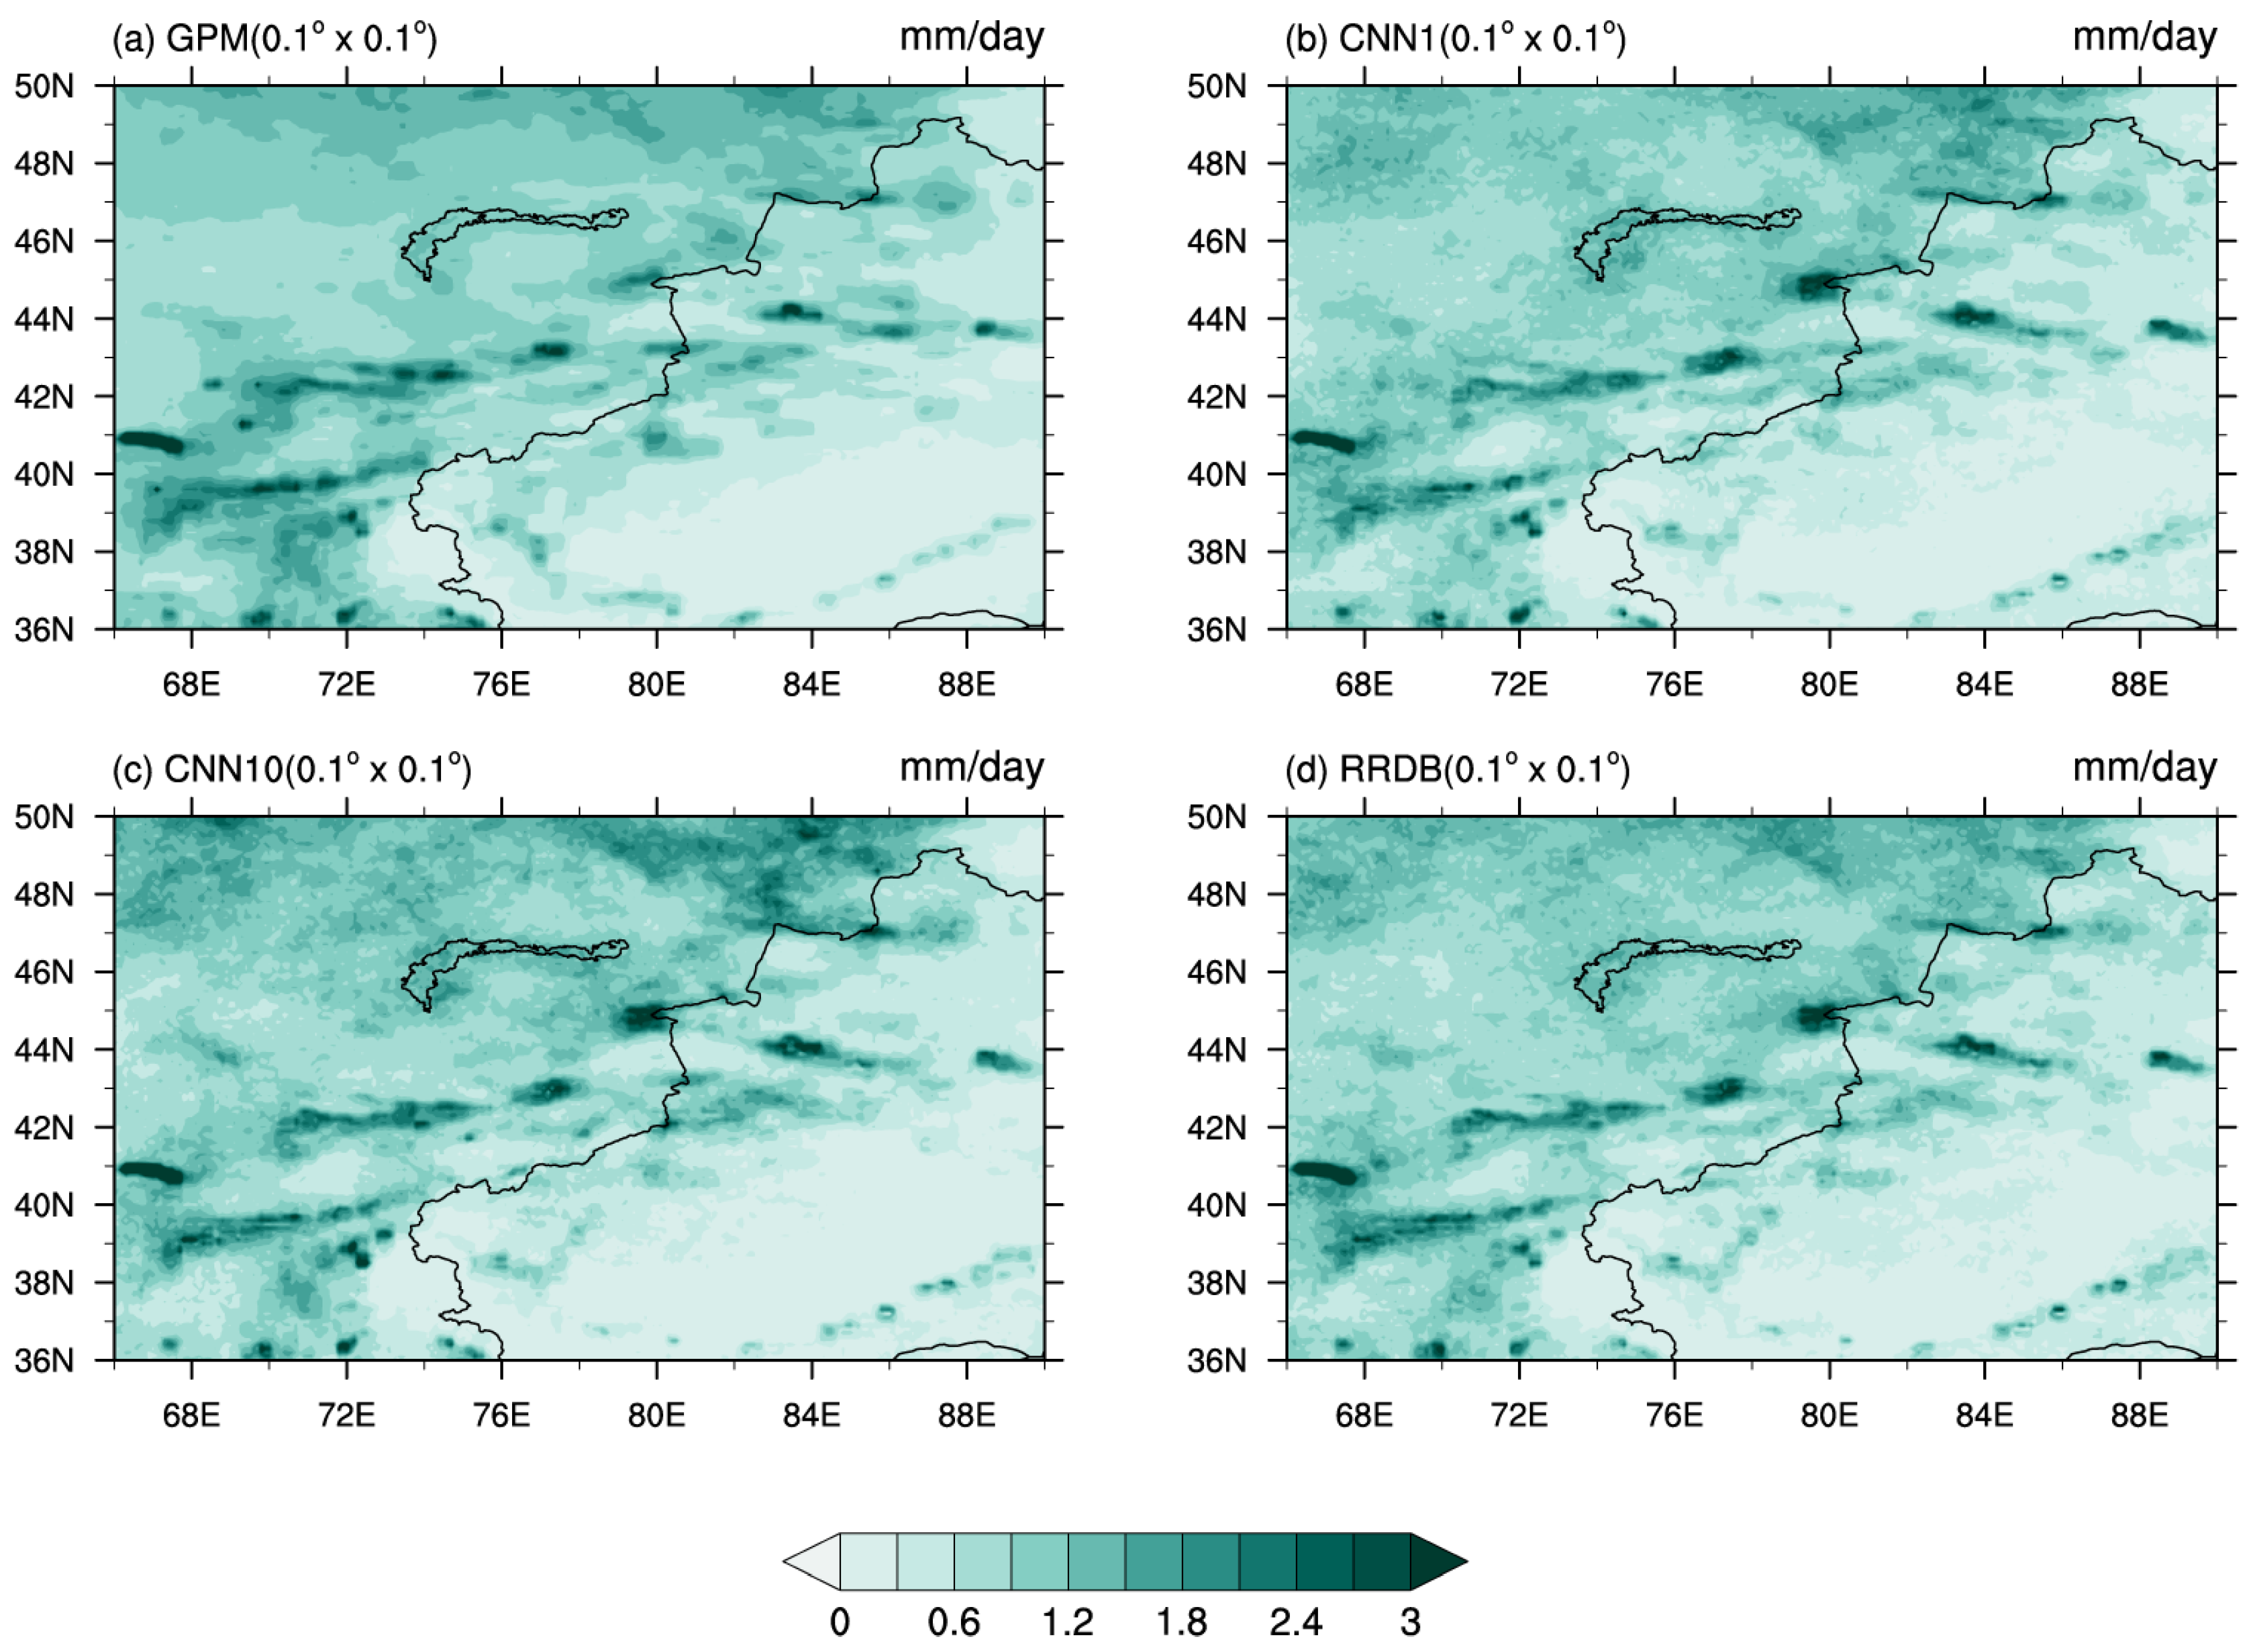
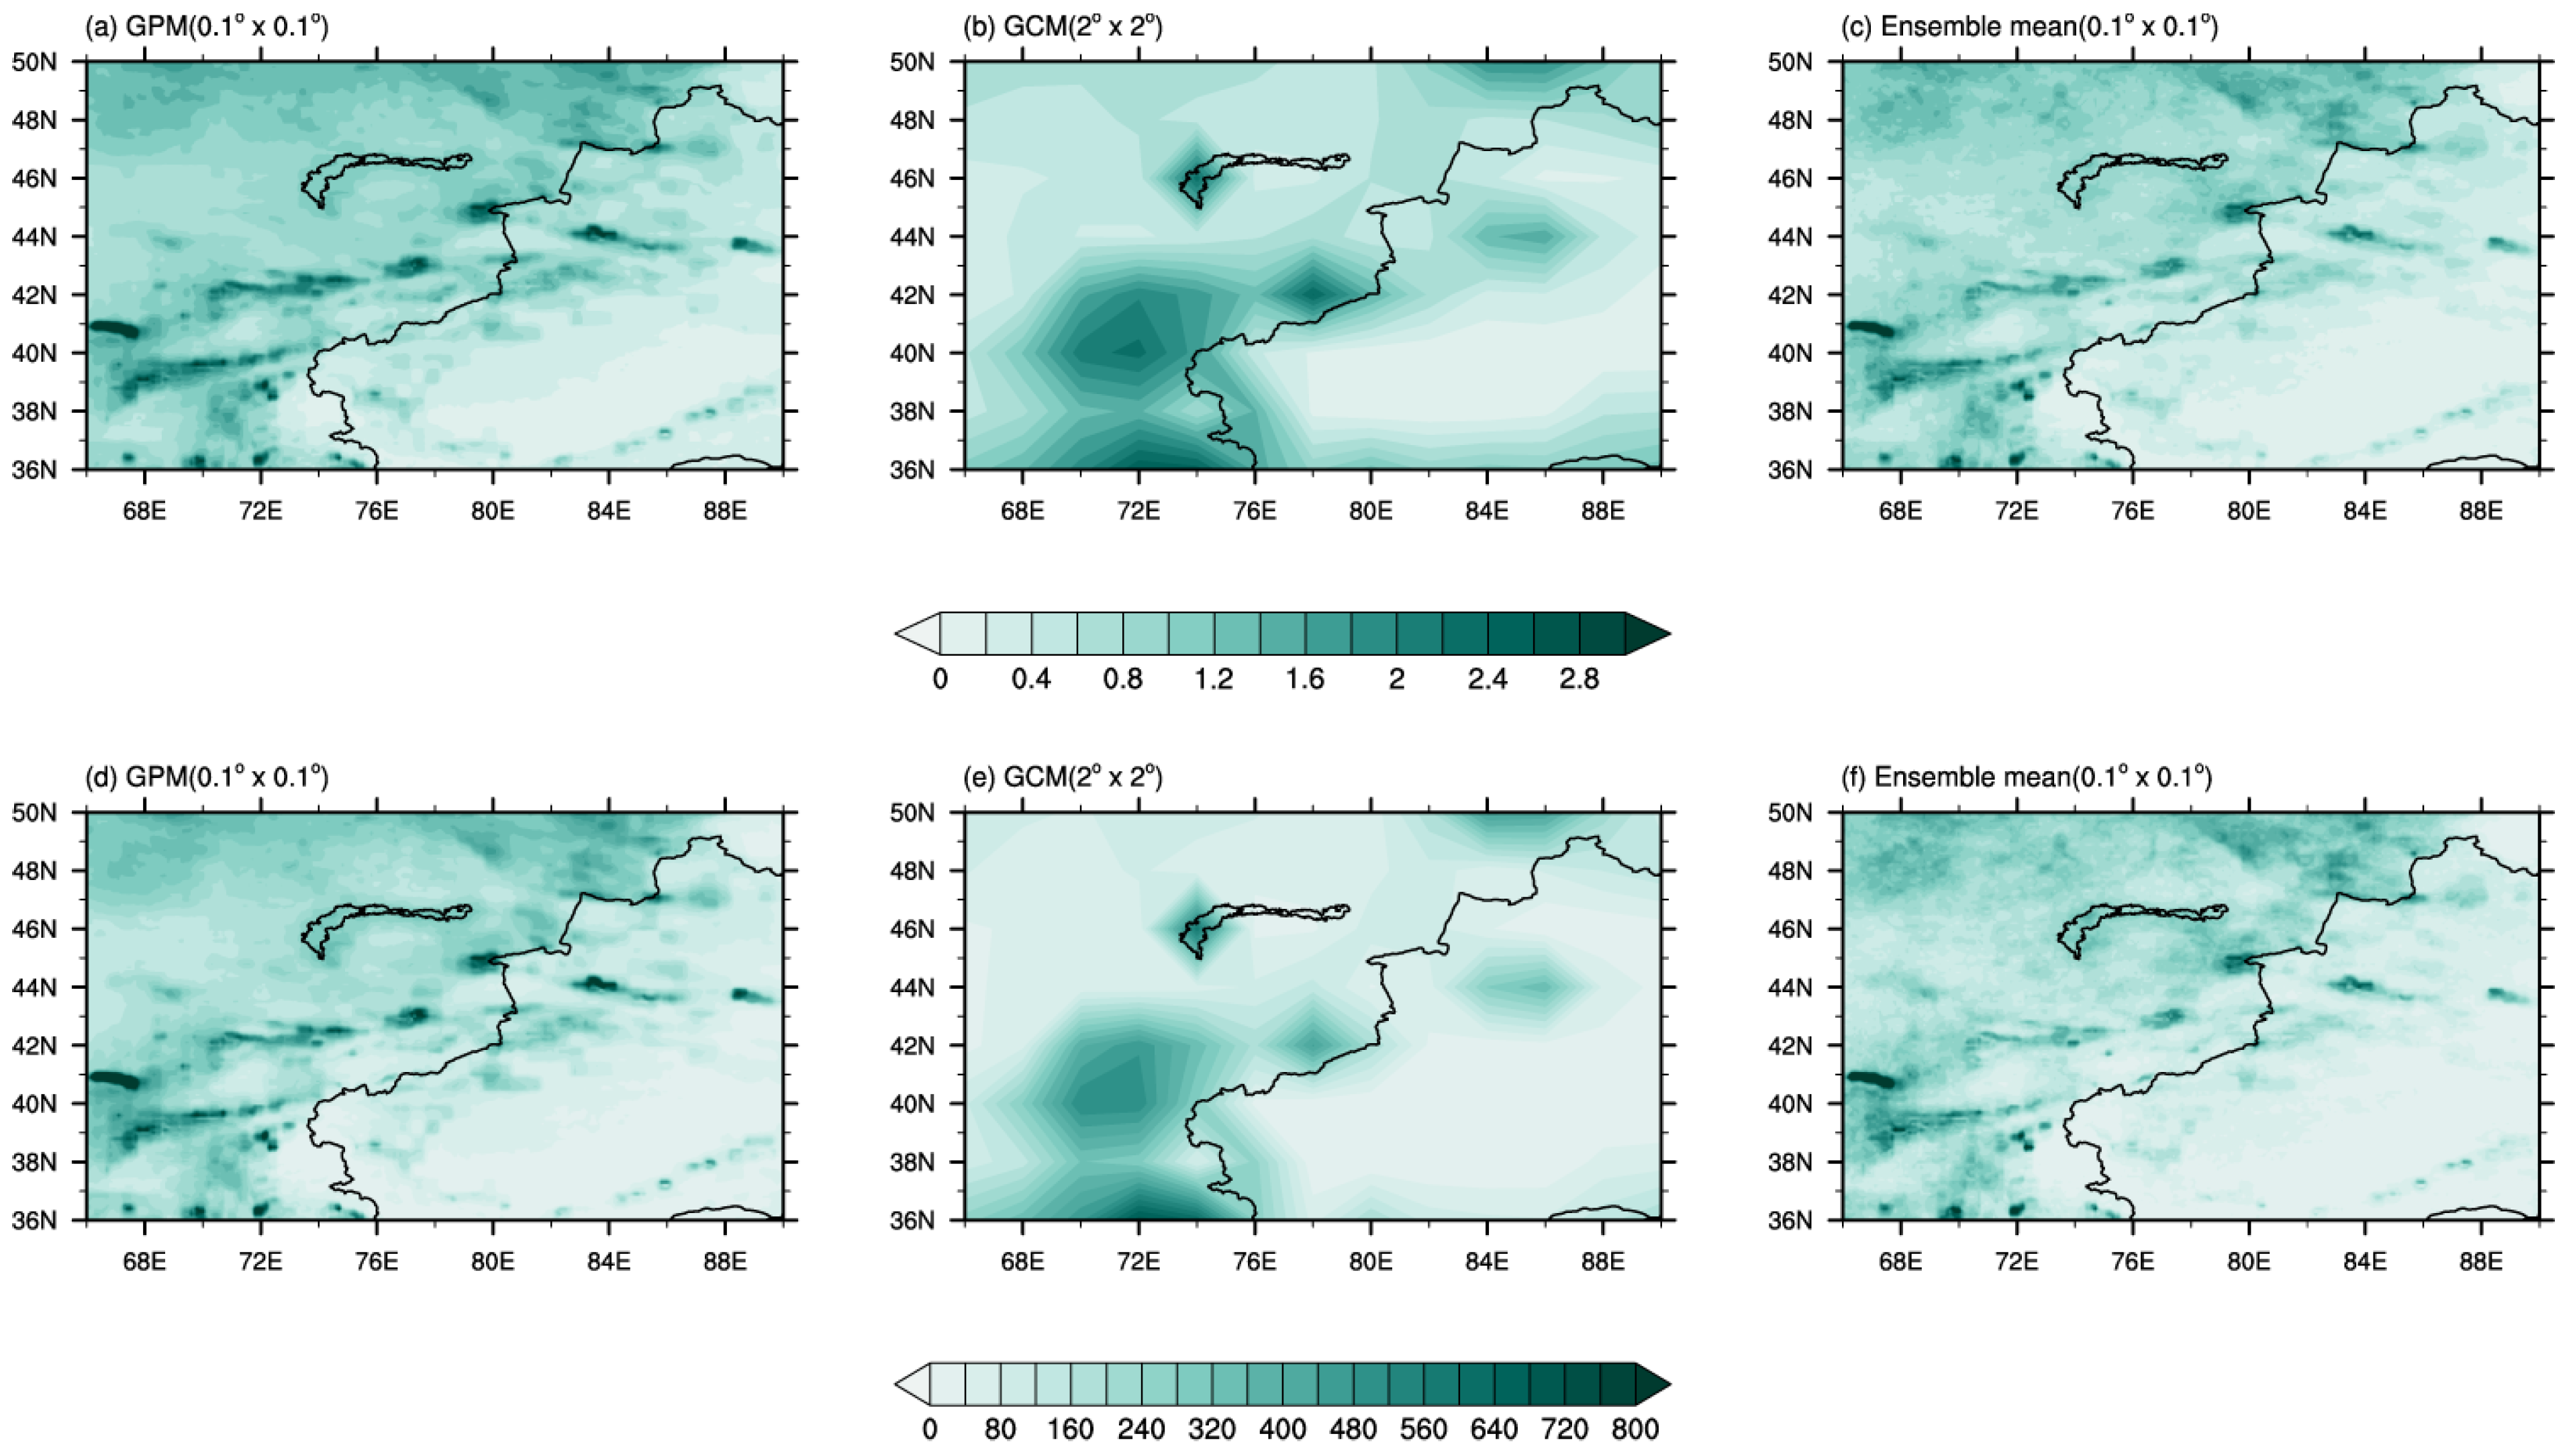
3.1. Validation of Precipitation Simulations from Deep Learning Models

To assess the performance of the three deep learning architectures (CNN1, CNN10, and RRDB) in simulating precipitation patterns across Central Asia, we conducted a comparative analysis between model outputs and GPM observational data (2016–2020) through the spatial distribution mapping of annual mean precipitation (Figure 3). Observations revealed maximum precipitation concentrations near the Tianshan and Pamir Mountains, with minimal accumulation occurring in the Tarim Basin (Figure 3a). All three models effectively reproduced GPM’s principal spatial precipitation patterns (Figure 3b–d), including enhanced precipitation levels north of Balkhash Lake. Notable discrepancies emerged in the northeastern Balkhash Lake and Altai Mountains, where model simulations overestimated precipitation compared to GPM observations. Furthermore, while GPM data exhibited coarser resolution in depicting precipitation gradients across northeastern Central Asia, the deep learning models demonstrated superior capacity to resolve fine-scale spatial variations, particularly within the complex terrain of the Altai Mountains.
Quantitative validation metrics—including mean bias, root mean square error, and correlation coefficients—between model simulations and GPM observations are presented in Table 1. The CNN10 exhibited the smallest mean bias (−0.03 mm day−1), attributed primarily to reduced systematic errors near the Altai Mountains. CNN1 achieved optimal RMSE performance (0.35 mm day−1), while all the models maintained strong spatial correlation coefficients with observational data. These results collectively demonstrate that while minor discrepancies persist between simulated and observed precipitation magnitudes, all three architectures successfully capture the region’s dominant precipitation distribution dynamics.
Although the validation confirms the models’ robust precipitation simulation capabilities, future precipitation projections require integration with GCM outputs. We, therefore, implemented a CMIP6-based framework using EC-Earth3 historical and its SSP-245 and SSP-585 scenario experiments to drive our deep learning precipitation downscaling system. Prior to conducting future projections, we validated the coupled GCM-deep learning system against GPM observational datasets for both annual mean and extreme precipitation metrics during the historical period (2001–2020).
Spatial comparisons revealed high-precipitation zones concentrated along the western Tianshan Mountains, the Pamirs, and the Altai Mountains in both observations and simulations (Figure 4a–c). While the parent GCM systematically underestimated precipitation in northern Central Asia, the deep learning downscaling effectively rectified these biases, producing precipitation patterns that closely aligned with observational data. Similar improvements were evident in extreme precipitation simulations (Figure 4d–f), where deep learning models maintained accurate spatial distributions of heavy precipitation events across orographic features despite the GCM’s underestimation tendencies. This performance enhancement highlights the critical role of deep learning approaches in refining GCM outputs through topography-aware precipitation downscaling.

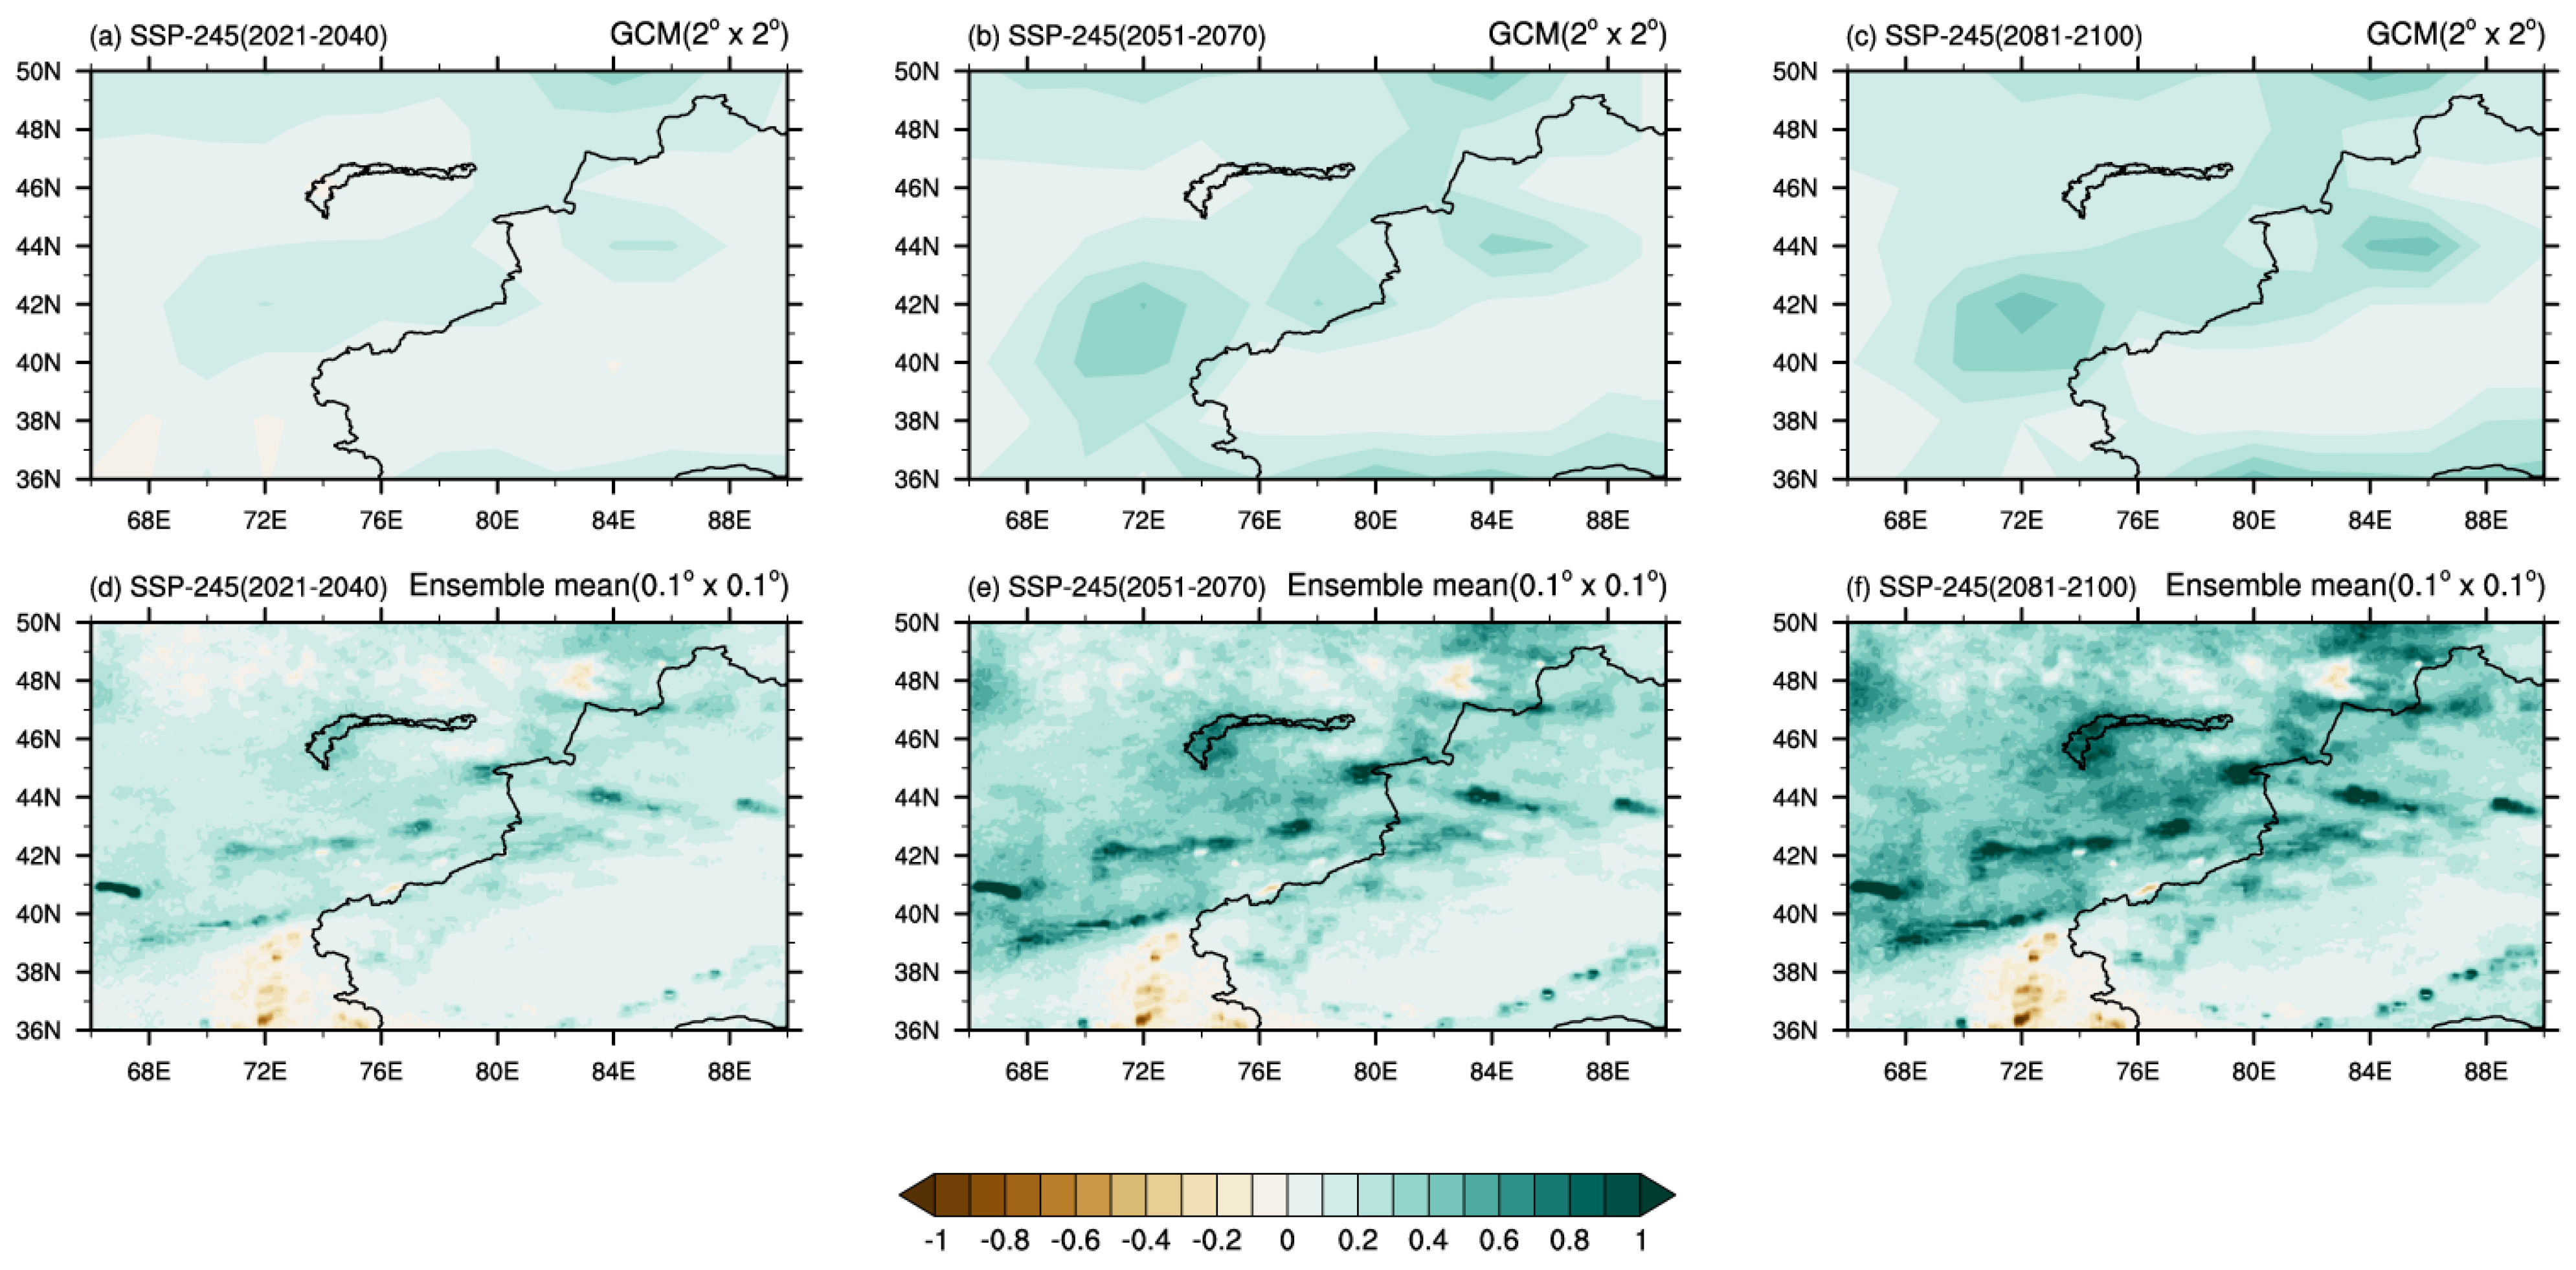
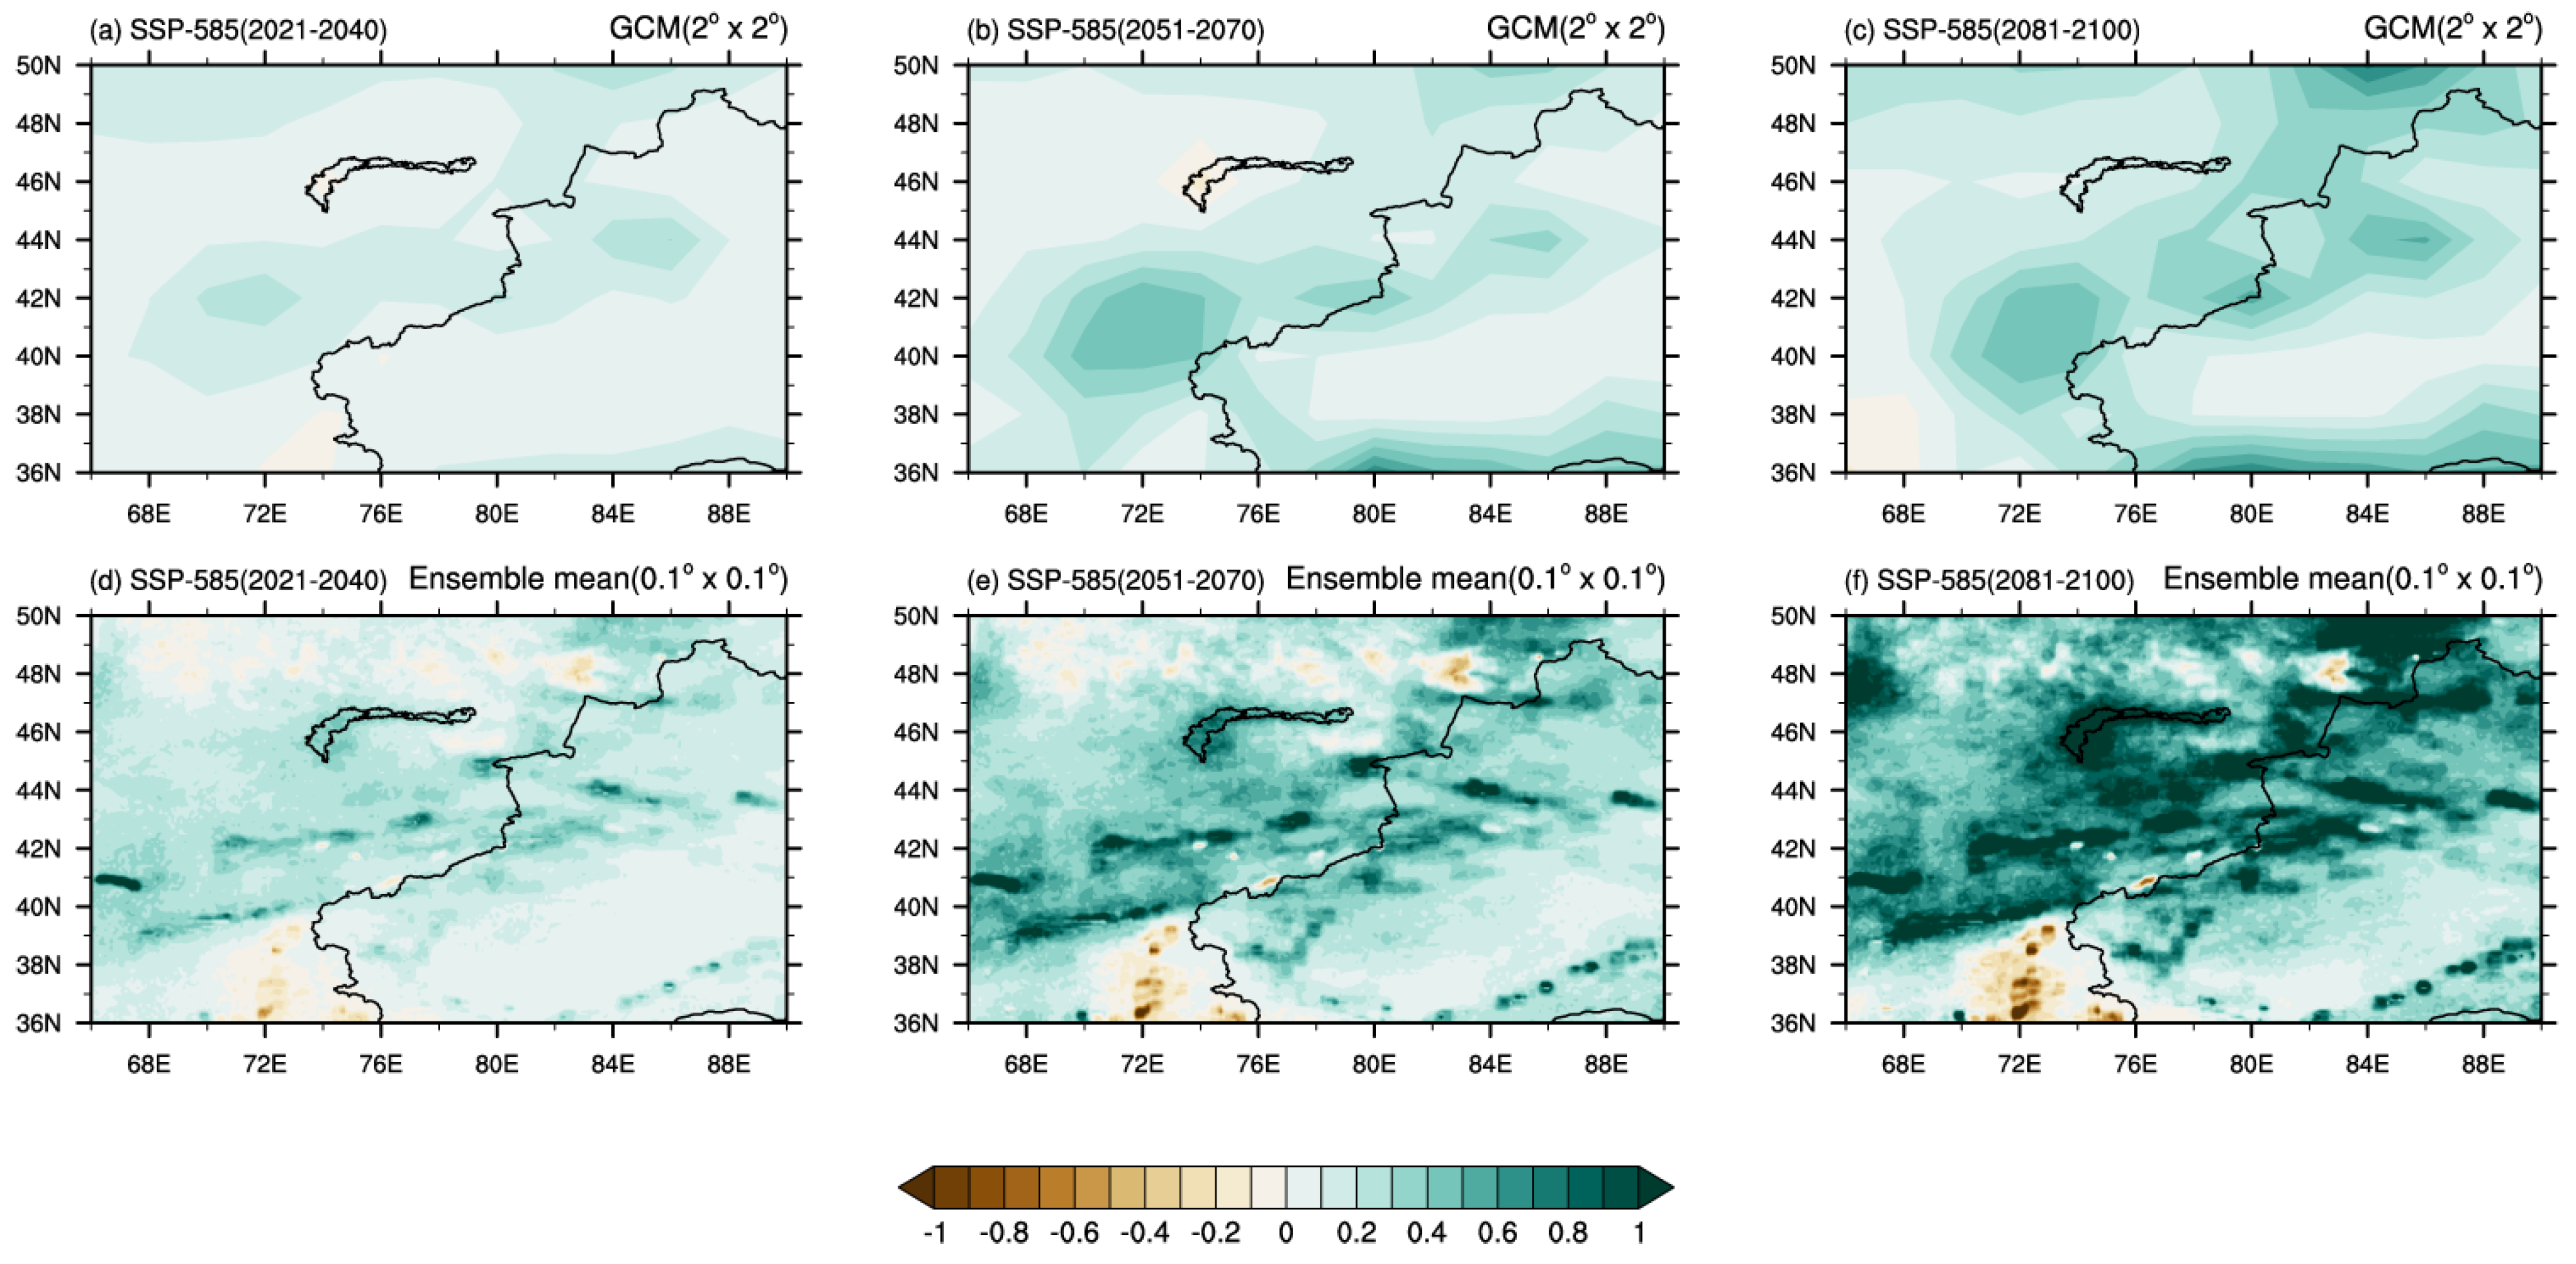
3.2. Future Precipitation Changes Simulated by Deep Learning Models

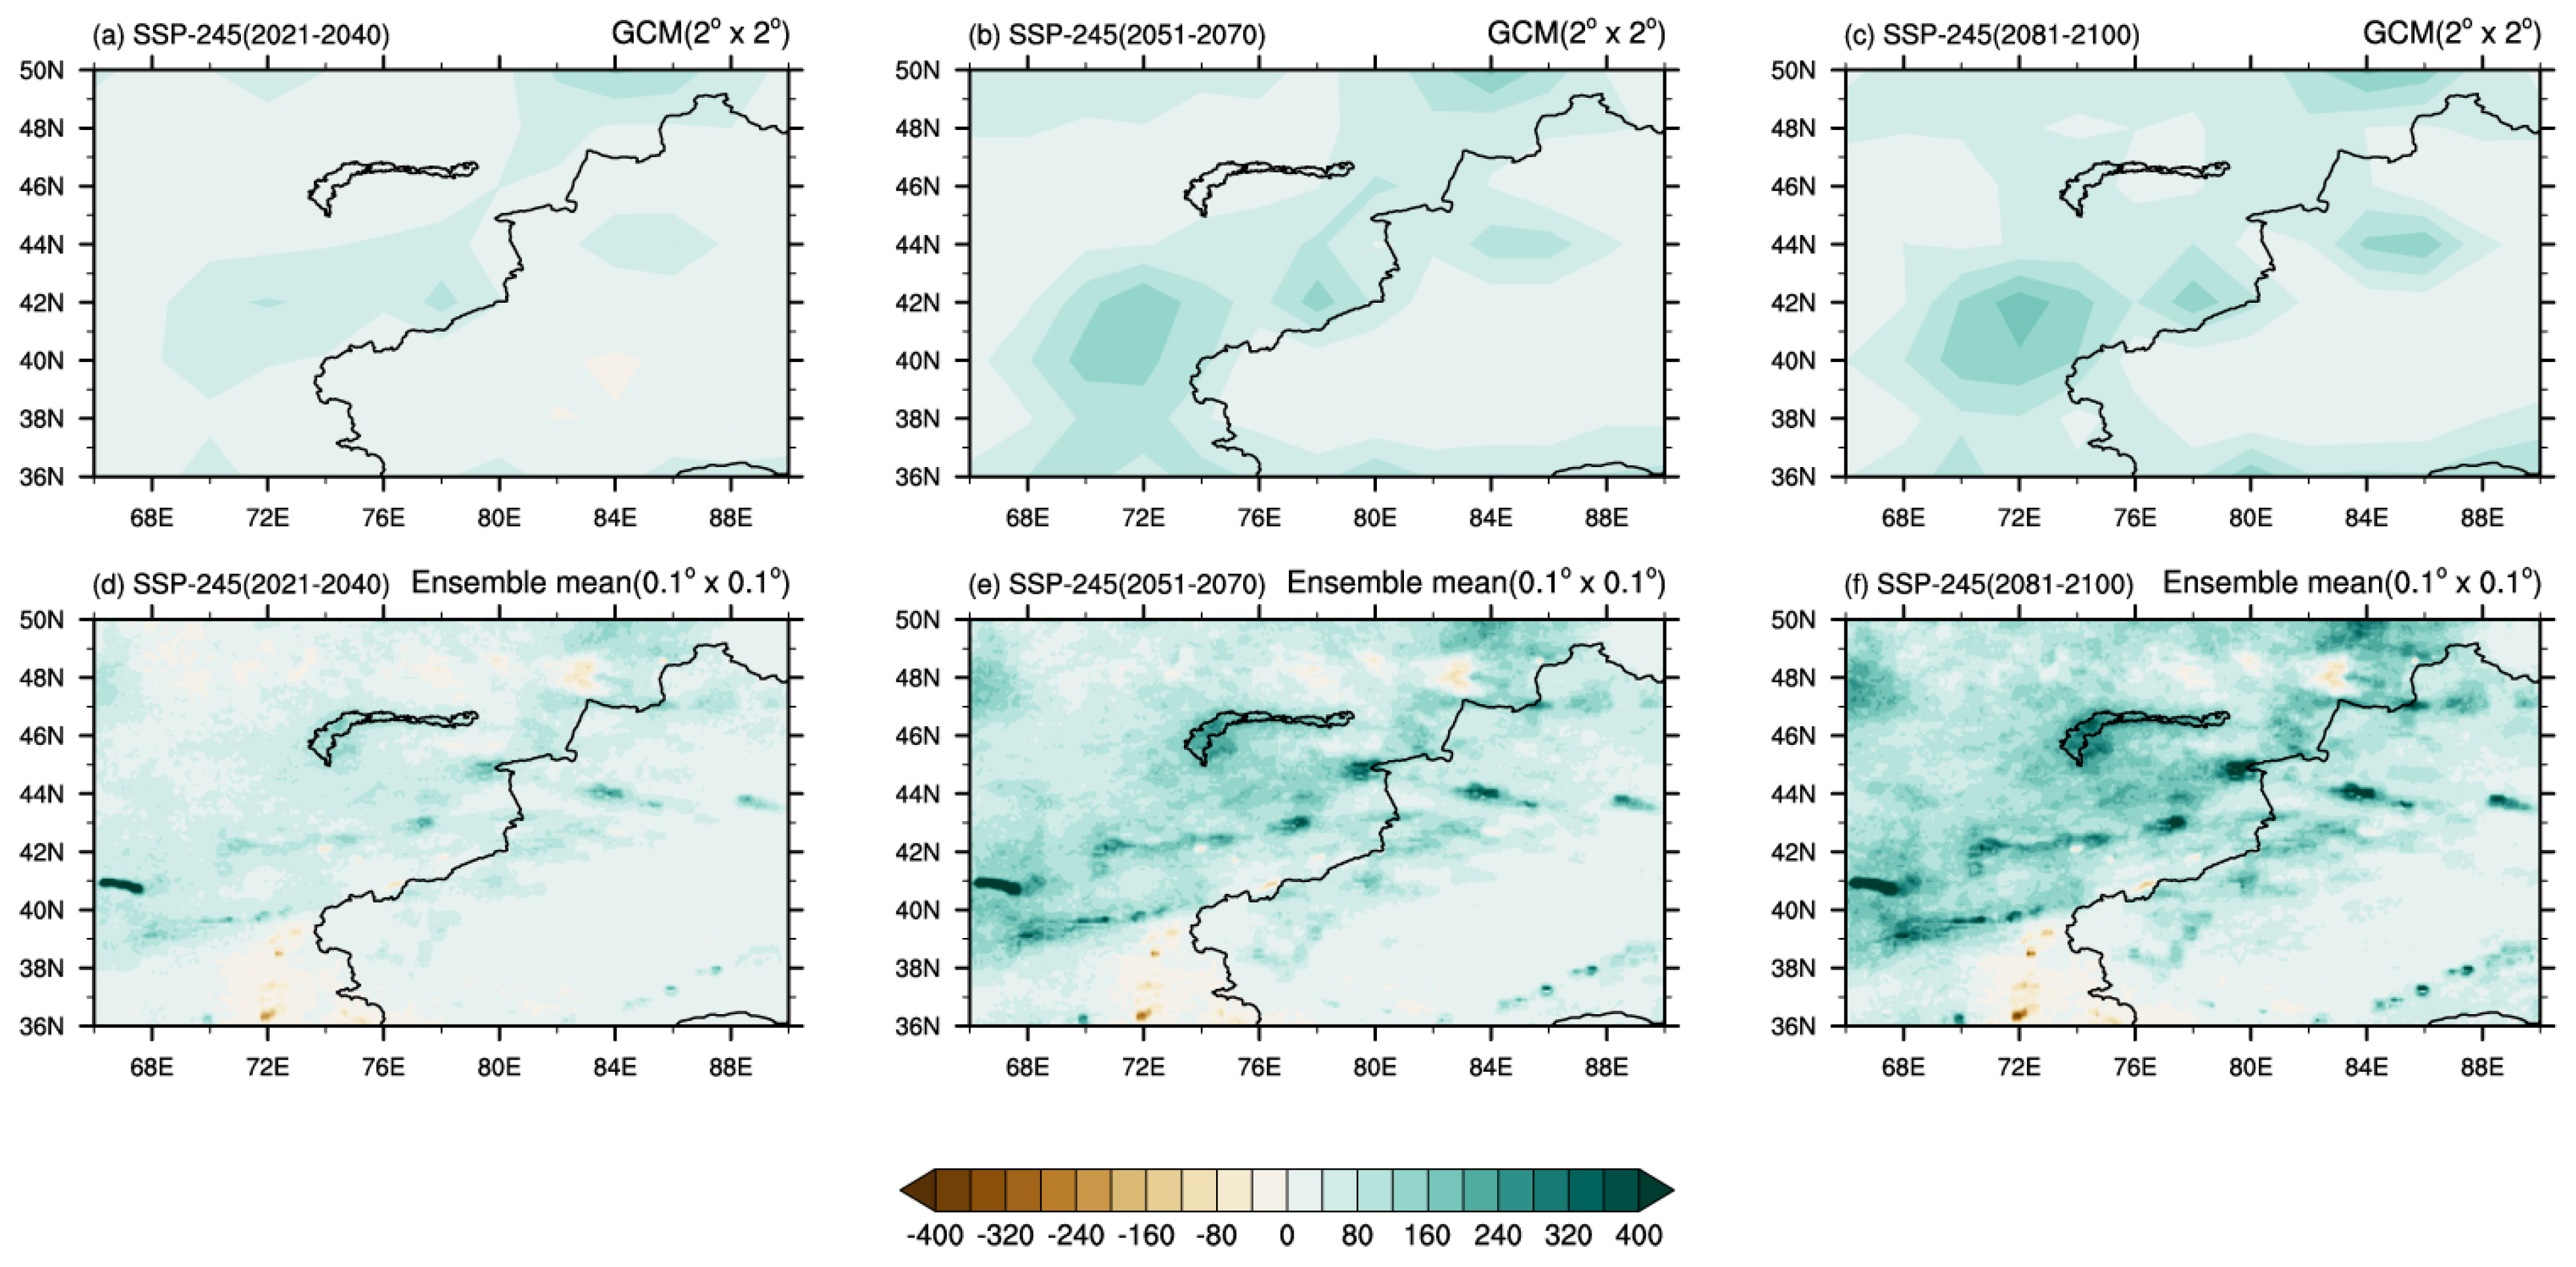
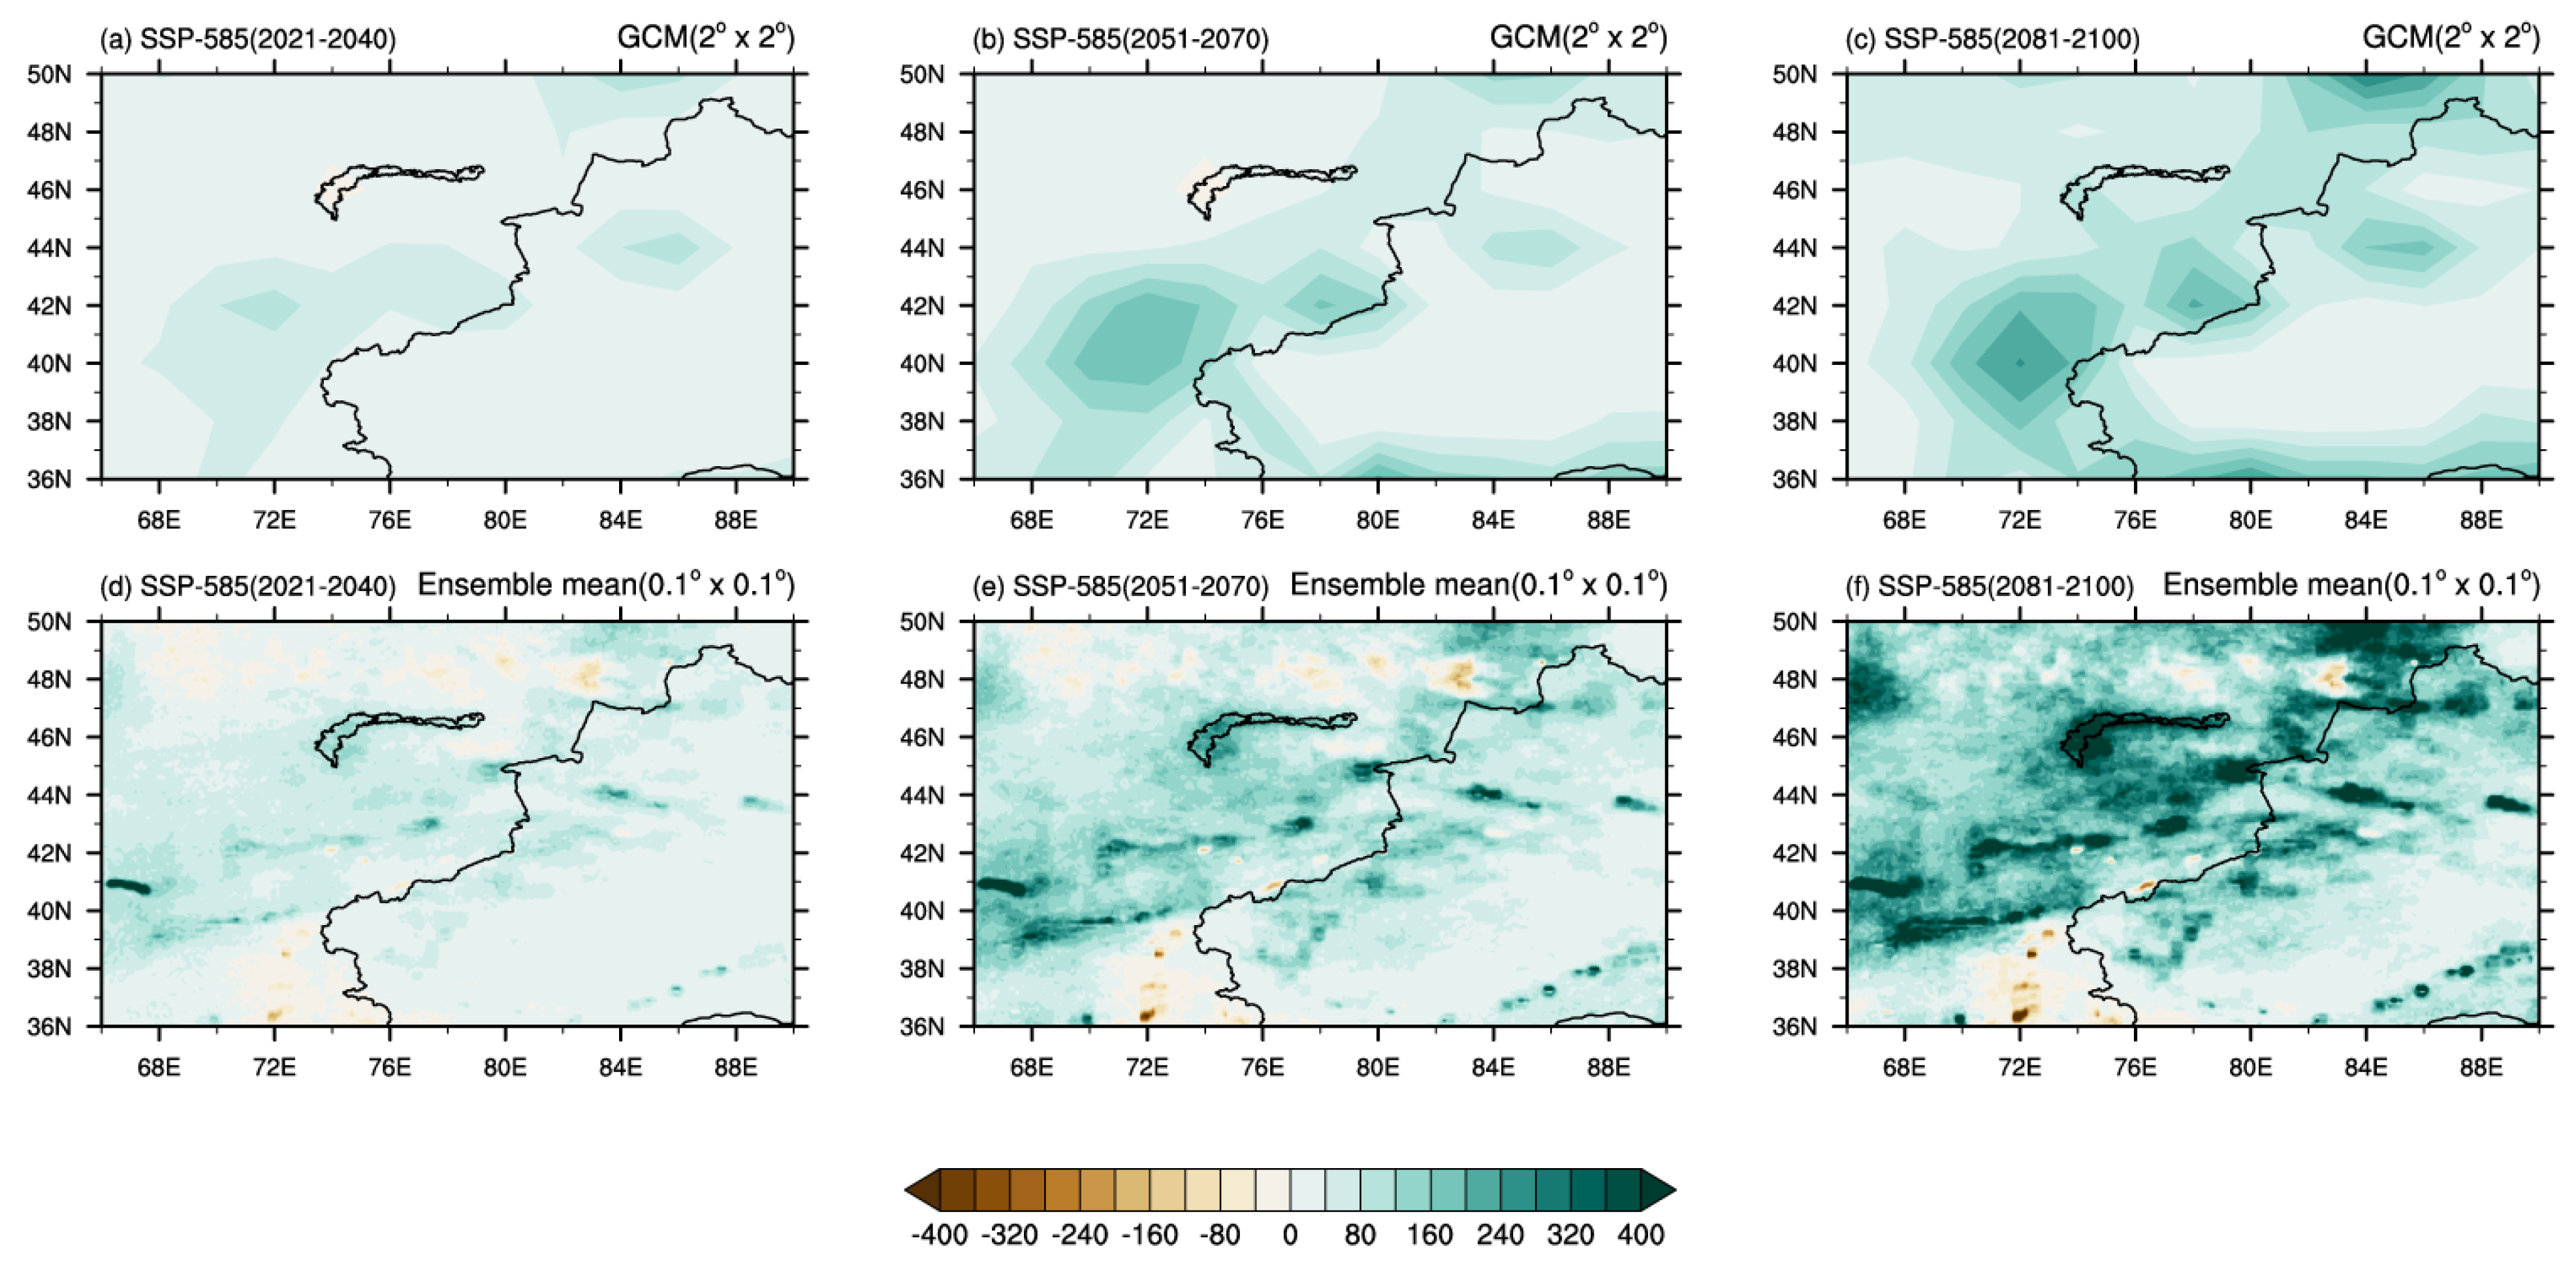
3.2.1. Annual Mean Precipitation

Figure 5 compares the projected precipitation changes under the SSP-245 scenario, downscaled by the three deep learning models, across three future periods: near-term (2021–2040), mid-term (2051–2070), and long-term (2081–2100). The near-term projections suggest a slight increase in precipitation across Central Asia, with both the GCM and deep learning models indicating enhanced rainfall near the Tianshan Mountains but reduced rainfall over the Pamirs. The mid-term projections reveal considerable amplified precipitation in the Tianshan and Altai Mountains compared to earlier periods. Additionally, the deep learning models project a substantial rise in precipitation across Central Asia. These models also delineate more spatially detailed patterns of precipitation magnitude and distribution compared to the GCM outputs, highlighting the advantages of deep learning models in downscaling. Notably, while GCMs struggle to resolve localized topographic effects, the deep learning models successfully capture enhanced precipitation in the mountainous regions surrounding the Tarim Basin—a challenge for coarse-resolution GCM simulations.
Under SSP-245, which incorporates moderate emission reduction measures, both the GCM and deep learning simulations indicate that long-term precipitation increases marginally exceed mid-term levels. This implies that achieving mid-term carbon peak targets could moderate the intensification of future precipitation trends in Central Asia. Our downscaled projections of increasing humidity near the Tianshan Mountains align with recent findings by [19].
The high-emission SSP-585 scenario intensifies Central Asia’s humidification compared to SSP-245, expanding wetter conditions beyond mountainous regions to low-lying plains and lake areas (Figure 6). The deep learning simulations suggest that by the late 21st century, most of Central Asia—particularly the Balkhash Lake region—will transition from arid to humid climates. All the models simulate narrow bands of intense precipitation along the Tianshan Mountains, exceeding projections under SSP-245. Crucially, the deep learning results demonstrate high sensitivity to Central Asia’s steep topographic gradients, producing precipitation maxima over the Tianshan Mountains that are absent in coarse-resolution GCM simulations but consistent with high-resolution GPM data. These results affirm deep learning’s capacity to resolve fine-scale precipitation dynamics in complex terrain, compensating for limitations in both sparse observational networks and low-resolution GCM outputs.
Figure 7 compares region-averaged precipitation changes across Central Asia under both scenarios relative to the historical baseline. The GCM exhibits delayed responses to greenhouse gas forcing and systematically underestimates precipitation increases compared to the deep learning models (Figure 7a,b). While the GCM projects persistent drought conditions in Central Asia over the next two decades, the deep learning models indicate a gradual shift toward wetter trends (Figure 7a,c). Mid- to long-term GCM projections likely reflect isolated CO2 effects without topographic feedback, whereas deep learning simulations incorporate synergistic CO2 and orographic forcing, yielding stronger precipitation amplification (Figure 7b,d).

3.2.2. Extreme Precipitation

Figure 8 shows the projected changes in the R95p index under SSP-245. Both the GCM and deep learning simulations locate extreme precipitation hotspots along the Tianshan Mountains, their northern foothills, and the Altai Mountains. Although long-term precipitation intensification slightly exceeds the mid-term values, the stabilization of trends after 50 years under low emissions suggests Central Asia may approach a precipitation ceiling. Notably, the deep learning models project emerging extreme precipitation events in Central Asian plains post-2050, this feature is absent in the GCM projections. Both modeling approaches concur that the Tarim Basin will resist extreme wetting trends observed north of the Tianshan Mountains under SSP-245.
Under SSP-585 (Figure 9), extreme precipitation amplifies dramatically across Central Asia, with century-scale increases doubling those under SSP-245. By 2100, the maximum R95p values are projected to reach 400 mm in core regions. The deep learning models further suggest expanded impacts to the northern Tarim Basin and Kunlun Mountain foothills—patterns potentially overlooked in the GCM simulations. The regional R95p averages (Figure 10) reveal diverging trajectories: SSP-245 shows slowing intensification over the next 50 years (Figure 10a,c), while SSP-585 projects doubling trends between 2050 and 2100 (Figure 10b,d). The stronger amplification in deep learning outputs underscores their incorporation of combined CO2 and topographic forcing, contrasted with GCMs’ limited capacity to resolve these interactions.

3.3. Interannual Variability of Future Precipitation

In this subsection, we show the projected interannual variability of annual mean precipitation and extreme precipitation (R95P) under the SSP-245 and SSP-585 scenarios in Central Asia throughout the 21st century. Both the SSP-245 (Figure 11a) and SSP-585 (Figure 11b) scenarios indicate an increasing precipitation trend accompanied by amplified interannual variability, while the high-emission SSP-585 scenario exhibits particularly greater interannual variability. Figure 12 compares projections of extreme precipitation between GCM and deep learning frameworks. The historical simulations from the GCM and deep learning models modestly underestimated extreme precipitation relative to GPM observations, likely due to inaccurate local atmospheric variables. Further emission scenarios show the increased interannual variability of extreme precipitation, especially under SSP-585 (Figure 12b). Therefore, the enhanced greenhouse forcing correlates strongly with the increased interannual variability of mean and extreme precipitation. This anthropogenic amplification of precipitation variability suggests increased vulnerability to severe hydrological extremes (floods and droughts) across Central Asia under high greenhouse gas emission scenarios.

4. Discussion and Conclusions

The current global climate models (GCMs) exhibit limitations in accurately simulating precipitation patterns and extreme precipitation across Central Asia, particularly in topographically complex regions, due to their coarse spatial resolution and imperfect physical parameterization schemes. To address this gap, we developed high-precision statistical downscaling models (CNN-based models) to produce future high-resolution precipitation projections for the region. Three distinct deep learning architectures—CNN1, CNN10, and RRDB—were employed to simulate precipitation under multiple Shared Socioeconomic Pathway (SSP) scenarios. Our analyses yield three principal findings: (1) The CNN-based models (CNN1, CNN10, and RRDB) demonstrate superior performance in downscaling regional precipitation compared to the current GCMs, particularly in mountainous terrain. These models effectively capture localized precipitation maxima and extreme precipitation patterns near the Tianshan Mountains, highlighting their robust spatial applicability. (2) The CNN-based projections indicate notable increases in both mean and extreme precipitation under both SSP scenarios, with the most dramatic intensification under the high-emission SSP5-8.5 scenario. Extreme precipitation events are projected to escalate more substantially than mean precipitation over the coming century. (3) Amplified interannual precipitation variability in mean and extreme precipitation is anticipated under both SSP2-4.5 and SSP5-8.5 scenarios by 2100. This enhanced precipitation variability suggests increased vulnerability to severe hydrological extremes, including catastrophic droughts and floods, across Central Asia under high greenhouse gas emission scenarios.
This study pioneers the application of deep learning approaches (CNN-based approaches) for climate downscaling in Central Asia. Our results reveal that the current GCMs may systematically underestimate future extreme precipitation amplification in the region under global warming (Figure 10), underscoring the urgency for advancing next-generation high-resolution GCM development [28]. However, divergent projections among CNN-based models for extreme precipitation trends (Figure 12) necessitate further refinement. Future research should prioritize integrating sophisticated deep learning frameworks to minimize inter-model discrepancies and improve projection reliability, including hybrid physics-driven models [29], physics-informed neural networks [30], and generative AI architectures [31,32]. Additionally, our current study is limited to using only the EC-Earth3 global climate model due to the large computational demands from multi-models. This limitation does indeed constrain our ability to fully assess inter-model uncertainty. However, we recognize the importance of this issue and plan to address it in future work by incorporating additional CMIP6 global climate models to perform comprehensive uncertainty quantification in the downscaling process.
Regional climate models such as the Regional Climate Model version 4 (RegCM4) and the Weather Research and Forecasting model (WRF) have been widely used for dynamical downscaling to produce high-resolution climate projections [33,34]. These methods have successfully produced detailed climate simulation datasets that have proven invaluable for various applications, including future climate scenario assessments, hydroclimate risk analyses, and renewable energy potential evaluations across China [35,36,37]. Building on these successful implementations, it is crucial to expand the application of dynamical downscaling techniques to precipitation projection in Central Asia. This expansion would facilitate comprehensive cross-validation with CNN-based downscaling approaches while simultaneously improving the accuracy and reliability of future climate change projections in this arid region [21].
Recent observational evidence reveals that the precipitation variability has increased globally (over 75% of land areas) across daily to intraseasonal timescales over the past century, primarily driven by global warming [38]. Our findings further demonstrate a significant increase in interannual variability of annual mean precipitation, particularly for extreme precipitation. This increasing interannual variability underscores an elevated risk of extreme droughts and floods in Central Asia under high-emission scenarios, which could pose substantial threats to critical infrastructure, water resource management, and societal stability in the region.

Author Contributions

Conceptualization, H.S. and X.X.; methodology, Y.J. and L.F.; software, Y.J. and L.F.; writing—original draft preparation, Y.J.; writing—review and editing, H.S., Y.J., J.G. and X.X.; funding acquisition, H.S. and X.X. All authors have read and agreed to the published version of the manuscript.

Funding

This work was jointly supported by the National Key R&D Program of China (2024YFF1306901), the Science and Technology Innovation Program of Laoshan Laboratory (LSKJ202203300), and the National Natural Science Foundation of China (42175059 and 42275048).

Data Availability Statement

The data presented in this study are available upon request from the corresponding authors.

Conflicts of Interest

The authors declare no conflicts of interest.

References

  1. Gessner, U.; Naeimi, V.; Klein, I.; Kuenzer, C.; Klein, D.; Dech, S. The relationship between precipitation anomalies and satellite-derived vegetation activity in Central Asia. Glob. Planet. Chang. 2013, 110, 74–87. [Google Scholar] [CrossRef]
  2. Huang, J.; Yu, H.; Han, D.; Zhang, G.; Wei, Y.; Huang, J.; An, L.; Liu, X.; Ren, Y. Declines in global ecological security under climate change. Ecol. Indic. 2020, 117, 106651. [Google Scholar] [CrossRef]
  3. Peng, D.; Zhou, T. Why was the arid and semiarid northwest China getting wetter in the recent decades? J. Geophys. Res. Atmos. 2017, 122, 9060–9075. [Google Scholar] [CrossRef]
  4. Zhang, J.; Ma, Q.; Chen, H.; Zhao, S.; Chen, Z. Increasing warm-season precipitation in Asian drylands and response to reducing spring snow cover over the Tibetan Plateau. J. Clim. 2021, 34, 3129–3144. [Google Scholar] [CrossRef]
  5. Jiang, J.; Zhou, T.; Chen, X.; Zhang, L. Future changes in precipitation over Central Asia based on CMIP6 projections. Environ. Res. Lett. 2020, 15, 054009. [Google Scholar]
  6. Dike, V.N.; Lin, Z.; Fei, K.; Langendijk, G.S.; Nath, D. Evaluation and multimodel projection of seasonal precipitation extremes over central Asia based on CMIP6 simulations. Int. J. Clim. 2022, 42, 7228–7251. [Google Scholar]
  7. Huang, X.; Wang, Y.; Ma, X. Simulation of extreme precipitation changes in Central Asia using CMIP6 under different climate scenarios. Theor. Appl. Climatol. 2024, 155, 3203–3219. [Google Scholar] [CrossRef]
  8. Sillmann, J.; Kharin, V.V.; Zhang, X.; Zwiers, F.W.; Bronaugh, D. Climate extremes indices in the CMIP5 multimodel ensemble: Part 1. Model evaluation in the present climate. J. Geophys. Res. Atmos. 2013, 118, 1716–1733. [Google Scholar]
  9. Jiang, Z.; Li, W.; Xu, J.; Li, L. Extreme precipitation indices over China in CMIP5 models. Part I: Model evaluation. J. Clim. 2015, 28, 8603–8619. [Google Scholar]
  10. Zarrin, A.; Dadashi-Roudbari, A. Projection of future extreme precipitation in Iran based on CMIP6 multi-model ensemble. Theor. Appl. Climatol. 2021, 144, 643–660. [Google Scholar]
  11. Misra, S.; Sarkar, S.; Mitra, P. Statistical downscaling of precipitation using long short-term memory recurrent neural networks. Theor. Appl. Climatol. 2018, 134, 1179–1196. [Google Scholar] [CrossRef]
  12. Anaraki, M.V.; Farzin, S.; Mousavi, S.F.; Karami, H. Uncertainty analysis of climate change impacts on flood frequency by using hybrid machine learning methods. Water Resour. Manag. 2021, 35, 199–223. [Google Scholar] [CrossRef]
  13. Wang, K.; Deng, L.; Shangguan, Z.; Chen, Y.; Lin, X. Sustainability of eco-environment in semi-arid regions: Lessons from the Chinese Loess Plateau. Environ. Sci. Policy 2021, 125, 126–134. [Google Scholar] [CrossRef]
  14. Sha, Y.; Gagne, D.J., II; West, G.; Stull, R. Deep-learning-based gridded downscaling of surface meteorological variables in complex terrain. Part I: Daily maximum and minimum 2-m temperature. J. Appl. Meteorol. Climatol. 2020, 59, 2057–2073. [Google Scholar] [CrossRef]
  15. Sha, Y.; Gagne, D.J., II; West, G.; Stull, R. Deep-learning-based gridded downscaling of surface meteorological variables in complex terrain. Part II: Daily precipitation. J. Appl. Meteorol. Climatol. 2020, 59, 2075–2092. [Google Scholar] [CrossRef]
  16. Sun, L.; Lan, Y. Statistical downscaling of daily temperature and precipitation over China using deep learning neural models: Localization and comparison with other methods. Int. J. Climatol. 2021, 41, 1128–1147. [Google Scholar] [CrossRef]
  17. Baño-Medina, J.; Manzanas, R.; Gutiérrez, J.M. Configuration and intercomparison of deep learning neural models for statistical downscaling. Geosci. Model Dev. 2020, 13, 2109–2124. [Google Scholar] [CrossRef]
  18. Zhang, Y.; Tian, Y.; Kong, Y.; Zhong, B.; Fu, Y. Residual dense network for image super-resolution. In Proceedings of the IEEE Conference on Computer Vision and Pattern Recognition, Salt Lake City, UT, USA, 18–22 June 2018; pp. 2472–2481. [Google Scholar]
  19. Fu, H.; Guo, J.; Deng, C.; Liu, H.; Wu, J.; Shi, Z.; Wang, C.; Xie, X. Deep-learning-based downscaling of precipitation in the middle reaches of the Yellow River using residual-based CNNs. Q. J. R. Meteorol. Soc. 2024, 150, 3290–3304. [Google Scholar] [CrossRef]
  20. Hersbach, H.; Bell, B.; Berrisford, P. The ERA5 global reanalysis. Q. J. R. Meteorol. Soc. 2020, 146, 1999–2049. [Google Scholar] [CrossRef]
  21. Baño-Medina, J.; Manzanas, R.; Cimadevilla, E.; Fernández, J.; González-Abad, J.; Cofiño, A.S.; Gutiérrez, J.M. Downscaling multi-model climate projection ensembles with deep learning (DeepESD): Contribution to CORDEX EUR-44. Geosci. Model Dev. 2022, 15, 6747–6758. [Google Scholar] [CrossRef]
  22. Huffman, G.J.; Bolvin, D.T.; Braithwaite, D.; Hsu, K.; Joyce, R.; Xie, P.; Yoo, S.H. NASA global precipitation measurement (GPM) integrated multi-satellite retrievals for GPM (IMERG). Algorithm Theor. Basis Doc. (ATBD) Version 2015, 4, 30. [Google Scholar]
  23. Döscher, R.; Acosta, M.; Alessandri, A.; Anthoni, P.; Arneth, A.; Arsouze, T.; Bergmann, T.; Bernadello, R.; Bousetta, S.; Caron, L.P.; et al. The EC-Earth3 Earth system model for the Coupled Model Intercomparison Project 6. Geosci. Model Dev. 2022, 15, 2973–3020. [Google Scholar]
  24. Kingma, D.P.; Ba, J. Adam: A method for stochastic optimization. arXiv 2014, arXiv:1412.6980. [Google Scholar]
  25. Vaswani, A.; Shazeer, N.; Parmar, N.; Uszkoreit, J.; Jones, L.; Gomez, A.N.; Kaiser, Ł.; Polosukhin, I. Attention is all you need. Adv. Neural Inf. Process. Syst. 2017, 30. [Google Scholar] [CrossRef]
  26. Bedia, J.; Baño-Medina, J.; Legasa, M.N.; Iturbide, M.; Manzanas, R.; Herrera, S.; Casanueva, A.; San-Martín, D.; Cofiño, A.S.; Gutiérrez, J.M. Statistical downscaling with the downscaleR package (v3.1.0): Contribution to the VALUE intercomparison experiment. Geosci. Model Dev. 2020, 13, 1711–1735. [Google Scholar] [CrossRef]
  27. Sillmann, J.; Kharin, V.V.; Zwiers, F.W.; Zhang, X.; Bronaugh, D. Climate extremes indices in the CMIP5 multimodel ensemble: Part 2. Future climate projections. J. Geophys. Res. Atmos. 2013, 118, 2473–2493. [Google Scholar]
  28. Palmer, T. Climate forecasting: Build high-resolution global climate models. Nature 2014, 515, 338–339. [Google Scholar]
  29. Reichstein, M.; Camps-Valls, G.; Stevens, B.; Jung, M.; Denzler, J.; Carvalhais, N.; Prabhat, F. Deep learning and process understanding for data-driven Earth system science. Nature 2019, 566, 195–204. [Google Scholar]
  30. Raissi, M.; Perdikaris, P.; Karniadakis, G.E. Physics-informed neural networks: A deep learning framework for solving forward and inverse problems involving nonlinear partial differential equations. J. Comput. Phys. 2019, 378, 686–707. [Google Scholar]
  31. Irrgang, C.; Boers, N.; Sonnewald, M.; Barnes, E.A.; Kadow, C.; Staneva, J.; Saynisch-Wagner, J. Towards neural Earth system modelling by integrating artificial intelligence in Earth system science. Nat. Mach. Intell. 2021, 3, 667–674. [Google Scholar]
  32. Mardani, M.; Brenowitz, N.; Cohen, Y.; Pathak, J.; Chen, C.Y.; Liu, C.C.; Vahdat, A.; Nabian, M.A.; Ge, T.; Subramaniam, A.; et al. Residual corrective diffusion modeling for km-scale atmospheric downscaling. Commun. Earth Environ. 2025, 6, 124. [Google Scholar] [CrossRef]
  33. Rastogi, D.; Kao, S.C.; Ashfaq, M. How may the choice of downscaling techniques and meteorological reference observations affect future hydroclimate projections? Earth’s Future 2022, 10, e2022EF002734. [Google Scholar] [CrossRef]
  34. Hall, A.; Rahimi, S.; Norris, J.; Ban, N.; Siler, N.; Leung, L.R.; Ullrich, P.; Reed, K.A.; Prein, A.F.; Qian, Y. An evaluation of dynamical downscaling methods used to project regional climate change. J. Geophys. Res. Atmos. 2024, 129, e2023JD040591. [Google Scholar] [CrossRef]
  35. Gao, S. Dynamical downscaling of surface air temperature and precipitation using RegCM4 and WRF over China. Clim. Dyn. 2020, 55, 1283–1302. [Google Scholar]
  36. Han, Z.; Zhou, B.; Xu, Y.; Wu, J.; Shi, Y. Projected changes in haze pollution potential in China: An ensemble of regional climate model simulations. Atmos. Chem. Phys. 2017, 17, 10109–10123. [Google Scholar] [CrossRef]
  37. Wu, J.; Han, Z.Y.; Yan, Y.P.; Sun, C.Y.; Xu, Y.; Shi, Y. Future changes in wind energy potential over China using RegCM4 under RCP emission scenarios. Adv. Clim. Chang. Res. 2021, 12, 596–610. [Google Scholar] [CrossRef]
  38. Zhang, W.; Zhou, T.; Wu, P. Anthropogenic amplification of precipitation variability over the past century. Science 2024, 385, 427–432. [Google Scholar] [CrossRef]
Figure 1. Spatial distribution of elevation in Central Asia (m).
Water 17 01089 g001
Figure 3. Spatial distribution of annual mean precipitation (mm day−1) during 2016–2020 over Central Asia from (a) GPM, (b) CNN1, (c) CNN10, and (d) RRDB driven by ERA5 data.
Water 17 01089 g003
Figure 4. Spatial distribution of annual mean precipitation (mm day−1) and R95p (mm) over Central Asia derived from (a,d) GPM (2001–2020), (b,e) EC-Earth3 (1979–2020), and (c,f) ensemble mean (CNN1+CNN10+RRDB) driven by EC-Earth3 data (CNN1+CNN10+RRDB, 1979–2020).
Water 17 01089 g004
Figure 5. Spatial distribution of annual mean precipitation changes (mm day−1) from GCM and ensemble mean (CNN1+CNN10+RRDB) for SSP−245 during 2021–2040, 2051–2070, and 2081–2100 compared with 1979–2020. (ac) show the changes for the periods 2021−2040, 2051−2070, and 2081−2100, respectively, for the GCM. (df) display the corresponding changes for the ensemble mean (CNN1+CNN10+RRDB) for the same periods.
Water 17 01089 g005
Figure 6. Same as Figure 5, but for SSP-585 (mm day−1). (ac) show the changes for the periods 2021−2040, 2051−2070, and 2081−2100, respectively, for the GCM. (df) display the corresponding changes for the ensemble mean (CNN1+CNN10+RRDB) for the same periods.
Water 17 01089 g006
Figure 7. Annual mean precipitation changes (mm day−1) and relative changes (%) from GCM and ensemble mean (CNN1+CNN10+RRDB) for SSP-245 and SSP-585 during 2021–2040, 2051–2070, and 2081–2100 compared with 1979–2020. (a) Absolute changes under SSP-245, (b) Absolute changes under SSP-585, (c) Relative changes under SSP-245, (d) Relative changes under SSP-585.
Water 17 01089 g007
Figure 8. Same as Figure 5 but for R95p (mm) of SSP−245. (ac) show the changes for the periods 2021−2040, 2051−2070, and 2081−2100, respectively, for the GCM. (df) display the corresponding changes for the ensemble mean (CNN1+CNN10+RRDB) for the same periods.
Water 17 01089 g008
Figure 9. Same as Figure 5, but for R95p (mm) of SSP−585. (ac) show the changes for the periods 2021−2040, 2051−2070, and 2081−2100, respectively, for the GCM. (df) display the corresponding changes for the ensemble mean (CNN1+CNN10+RRDB) for the same periods.
Water 17 01089 g009
Figure 10. Same as Figure 7, but for R95p (mm) of SSP-245 and SSP-585. (a) Absolute changes under SSP-245, (b) Absolute changes under SSP-585, (c) Relative changes under SSP-245, (d) Relative changes under SSP-585.
Water 17 01089 g010
Figure 11. (a) Time series of annual mean precipitation (mm day−1) from GPM, GCM, CNN1, CNN10, RRDB, and ensemble mean (CNN1+CNN10+RRDB) during 1979–2100 for SSP-245 and (b) SSP-585.
Water 17 01089 g011
Figure 12. (a) Time series of R95p (mm) from GPM, GCM, CNN1, CNN10, RRDB, and ensemble mean (CNN1+CNN10+RRDB) during 1979–2100 for SSP-245 and (b) SSP-585.
Water 17 01089 g012
Table 1. Evaluation metrics of annual mean precipitation for the CNN1, CNN10, and RRDB models.
ModelsDifferenceRMSECC
CNN1−0.050.350.80
CNN10−0.030.380.80
RRDB−0.050.360.80
Disclaimer/Publisher’s Note: The statements, opinions and data contained in all publications are solely those of the individual author(s) and contributor(s) and not of MDPI and/or the editor(s). MDPI and/or the editor(s) disclaim responsibility for any injury to people or property resulting from any ideas, methods, instructions or products referred to in the content.

