Abstract
The performance of urban drainage systems can be significantly compromised by siltation in pipeline networks. This study focuses on the drainage network of central Zhengzhou, analyzing operational risks under current siltation conditions. Using complex network theory, the study examines the structural characteristics and propagation mechanisms of the siltation propagation chain, quantifying node risks through indicators such as pipeline risk factors and degree centrality. Edge vulnerability is incorporated to evaluate the risk values of siltation propagation paths. The study’s findings indicate the following: (1) Despite a relatively low overall siltation risk, regular pipeline inspection and maintenance is necessary. (2) A total of 22 critical nodes, primarily located in main pipelines or confluence manholes, exhibit high risk and require priority attention. (3) Siltation propagation shows significant chain characteristics, with main pipeline and junction node failures potentially leading to systemic crises. In the central Zhengzhou stormwater network presented in this paper, high-risk factors are concentrated in a southern downstream outlet caused by an edge identified as critical that propagates siltation risks to the downstream nodes, forming a long path with elevated risk levels. This study provides crucial insights into the risk management and prevention of sedimentation and blockages in urban drainage networks, not only offering important technical references and a solid scientific basis for pipeline maintenance and network upgrades—thereby contributing to drainage system planning and the enhancement of urban flood protection capabilities—but also serving as a valuable technical reference for improving the overall resilience and operational efficiency of drainage systems.
1. Introduction
“Recurrent Flooding” has become a prevalent urban challenge in China’s large and medium-sized cities, driven by the accelerating impacts of global climate change and rapid urbanization [1,2]. This issue significantly disrupts urban production and livelihoods [3,4]. The proper operation and maintenance of drainage networks are fundamental to mitigating urban flooding and ensuring urban drainage management [5]. However, pipelines frequently experience siltation due to subsurface conditions, drainage pipeline network layout characteristics, and socio-economic activities [6,7]. As siltation propagates along the water flow, it alters the internal conditions of connected pipelines, triggering a series of siltation issues that ultimately form a siltation chain within the drainage network [8,9]. This chain effect severely diminishes the drainage capacity of pipelines and poses a substantial threat to the safe operation of the entire system [10,11].
Current research on drainage pipeline siltation primarily focuses on three areas [12,13]. The first involves indoor experiments that analyze the overflow characteristics of siltation and the impact of silt accumulation on overflow capacity [14,15], revealing the mechanisms of silt transfer between pipelines and influencing factors. The second area utilizes hydraulic dynamics models to assess the effects of siltation on the hydraulic performance of drainage networks [16,17], including risks to pipeline drainage capacity and related parameters [18,19]. The third area employs machine learning methods to construct diagnostic models for real-time and accurate evaluation of siltation levels [20,21], providing practical guidance for pipeline dredging and maintenance [22,23]. While these studies have advanced the understanding of siltation mechanisms and their impact on overflow capacity, they fall short in exploring the mutual transfer mechanisms of silt within the overall pipeline network structure [24]. This limitation hinders the ability to accurately evaluate the chain effects of siltation [25,26]. The formation and propagation of the siltation chain are closely linked to the structural topology of the drainage network [27,28]. Given the significant influence of this chain effect, it is essential to investigate the structural characteristics and critical risk pathways within the network to address siltation risks comprehensively [29,30].
In practice, pipeline siltation propagates within drainage networks through water movement and pipeline layout, triggering or exacerbating siltation issues in connected pipelines [31,32]. This phenomenon, termed the siltation chain, evolves along the network topology of the drainage system and can be abstracted as a complex network structure [33,34]. To understand how the connectivity of network nodes and edges affects system stability, topological analysis based on complex network theory has been widely applied in pipeline network vulnerability studies [35,36,37]. Unlike conventional disaster events, the formation and propagation of siltation chains exhibit distinct structural characteristics [38]. Although complex network theory is a critical tool for analyzing system structure and function, and can elucidate global propagation laws and interactions between nodes and edges, its application to the siltation chain in drainage networks remains limited. Existing studies lack a focus on the chain reactions and risk transfer mechanisms within siltation chains, making it challenging to comprehensively capture their global characteristics and evolutionary dynamics [39,40]. To address these gaps, this study integrates complex network theory [41] to abstract the drainage network as a system of nodes and edges, uncovering the risk propagation mechanisms of siltation chains and their cascading effects on drainage system stability. This integration represents a key innovation of this research.
This study aims to evaluate the system risk of a drainage network based on pipeline siltation by determining the pipeline risk factors following the current status of pipeline siltation and the significance of its influencing factors. It then applies complex network theory to analyze the characteristics of the nodes of the drainage network and identifies the critical nodes and risk nodes in the drainage network’s topology. Finally, it takes comprehensive consideration of the nodes of the chain of the drainage network and the risk of edge failure. It clarifies the pipeline siltation disease propagation path and propagation risk. The research findings can serve as critical technical references for the maintenance of pipeline networks, dredging, and chain-breaking in urban drainage networks, thereby facilitating the elimination of floods and drainage.
2. Overview of the Study Area and Data Sources
2.1. Overview of the Study Area
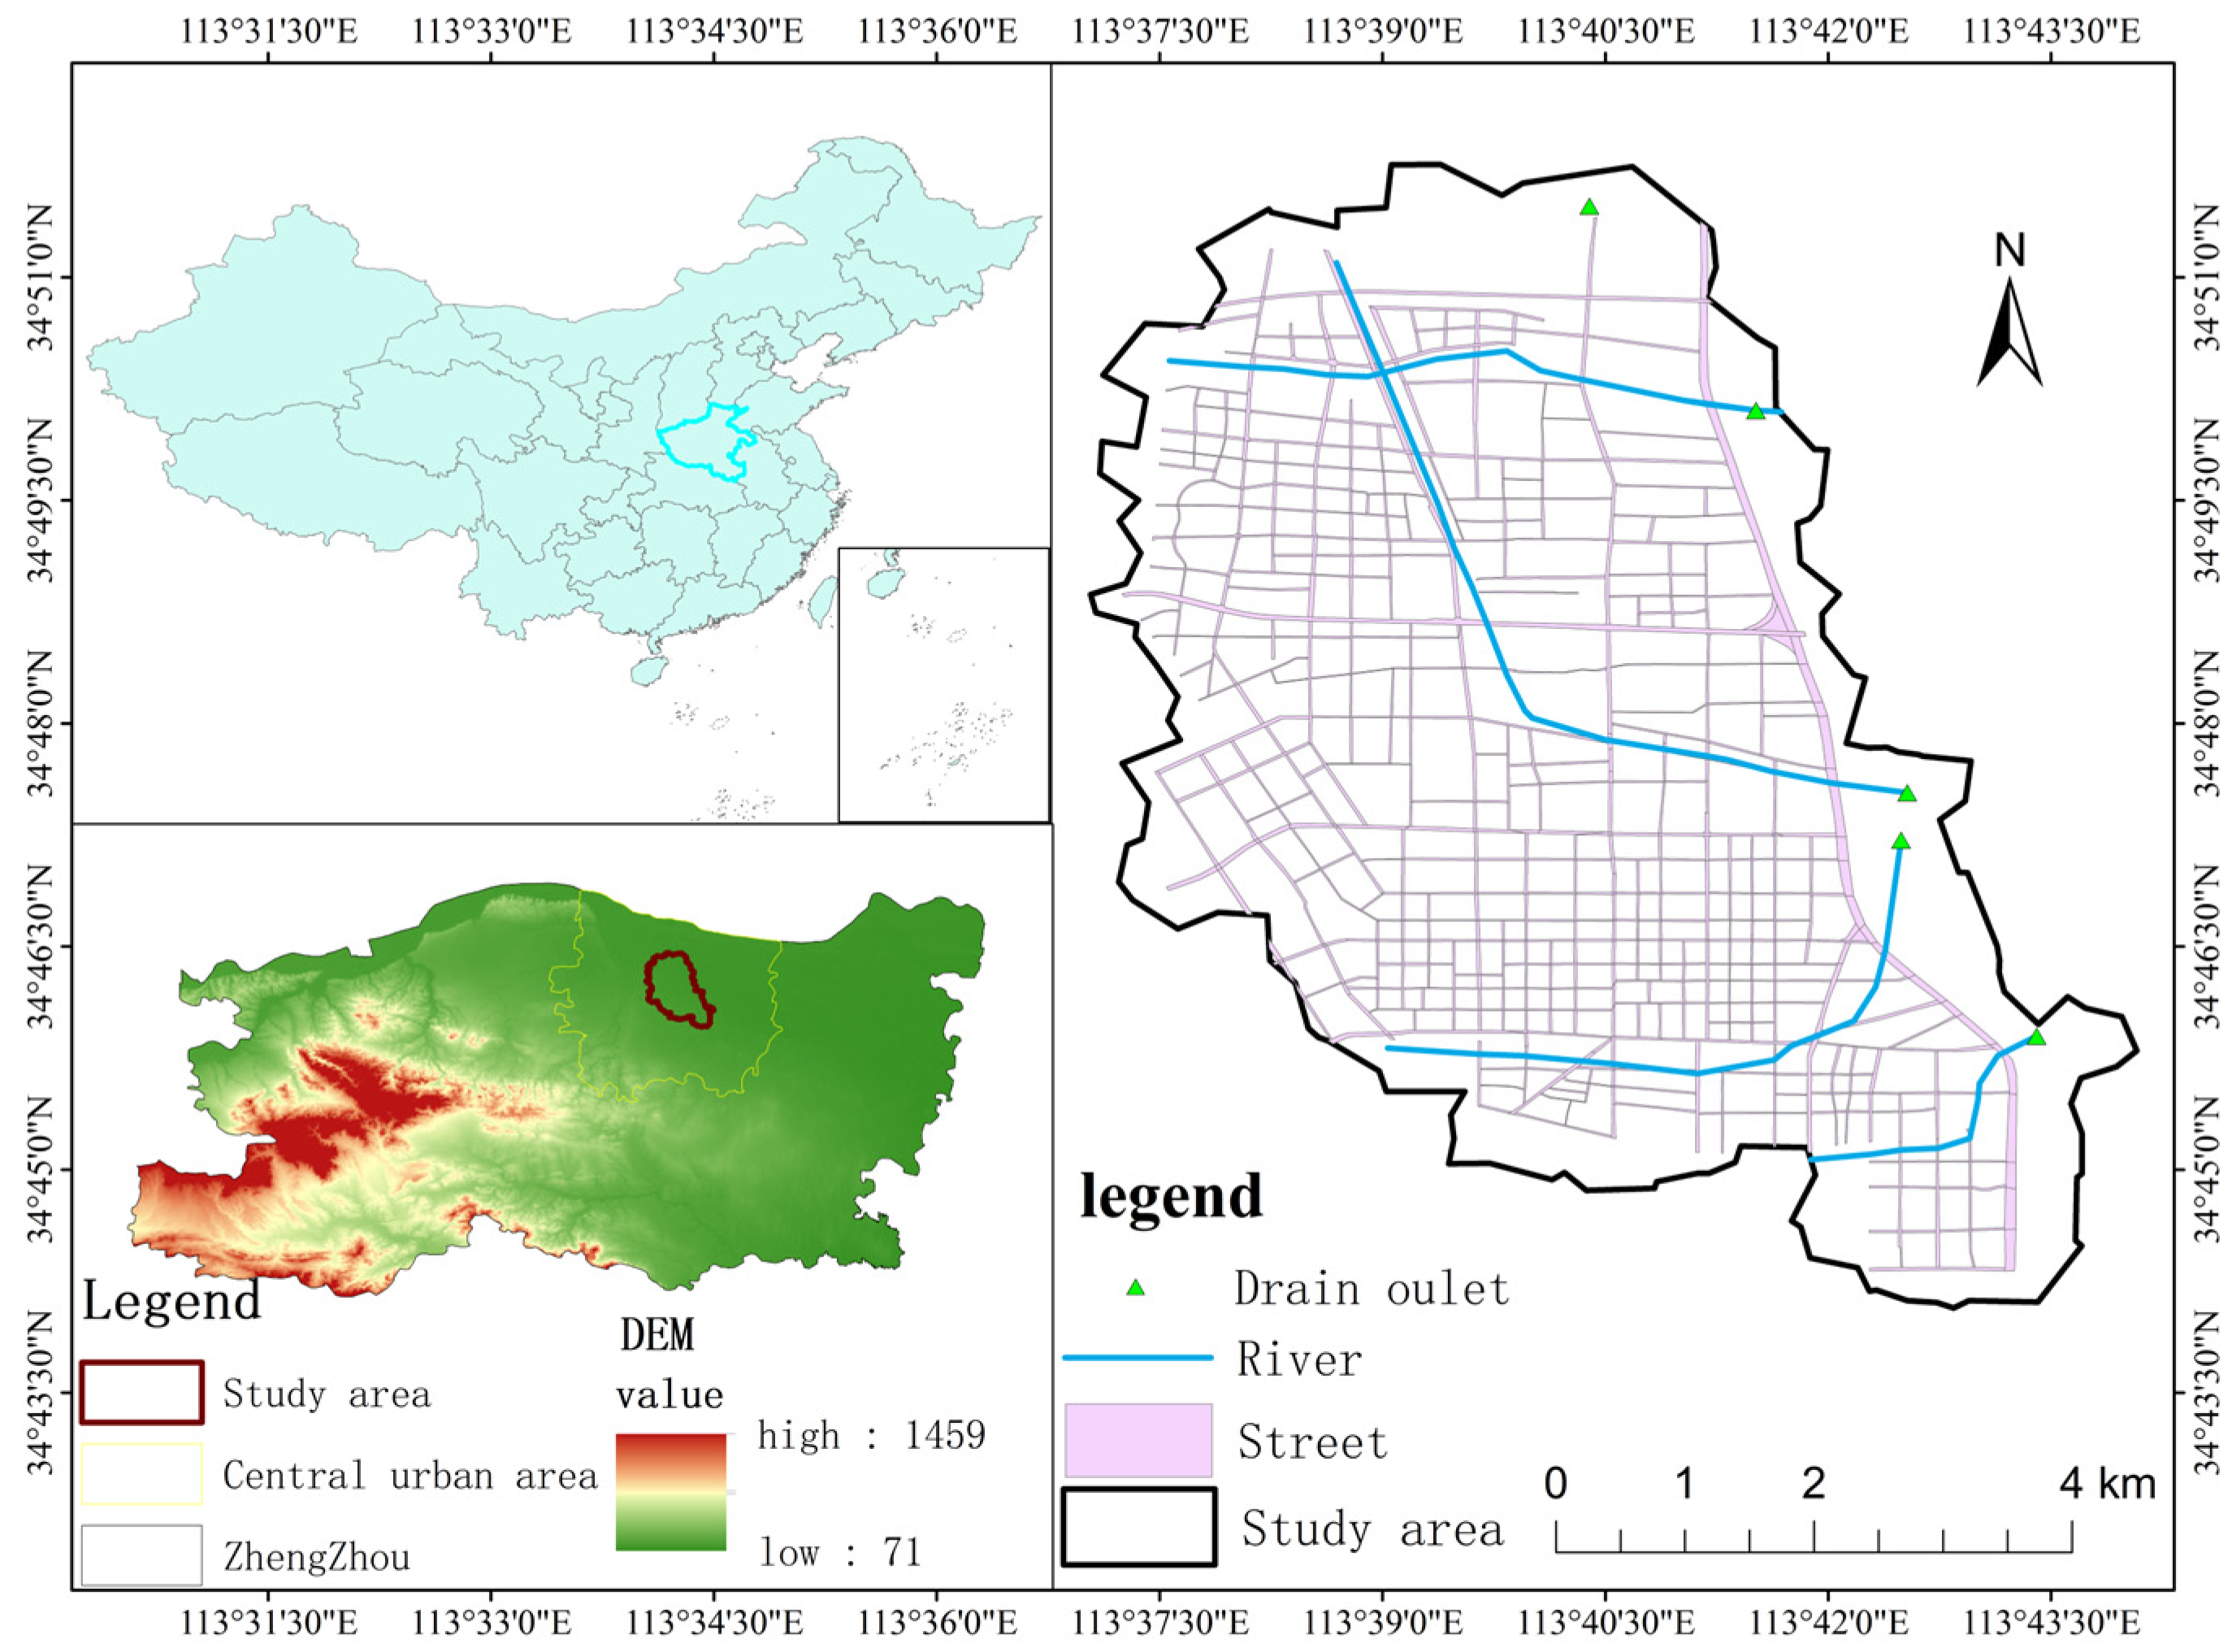
The study area is situated in the central region of the old city of Zhengzhou, Henan Province, China. It consists of a total area of 90.58 km2, and has an urbanization level of 92.16%, a highly concentrated population and economy, and the presence of large retail malls, provincial government institutions, affiliated offices, and hospitals. During the summer, the studied area experiences heavy rainfall, with an average annual rainfall of 640.9 mm. The terrain is high in the northwest and low in the southeast, and the climate is classified as north temperate continental monsoon. As shown in Figure 1, the primary drainage channels in the studied area are four rivers: the Dongfeng Canal, Wei River, Jinshui River, and Xiong’er River. Conversely, the majority of the drainage pipelines in the region are aged and plagued by severe siltation and disease, which causes insufficient drainage capacity in the network. This could easily result in a waterlogging catastrophe during periods of heavy rainfall.
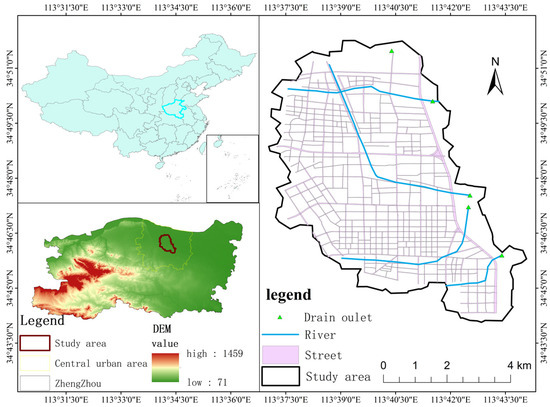
Figure 1.
Overview of the study area.
2.2. Data Sources
Drainage network base data, pipeline siltation data, land use data, population density data, and DEM data were the primary data sets required for this investigation.
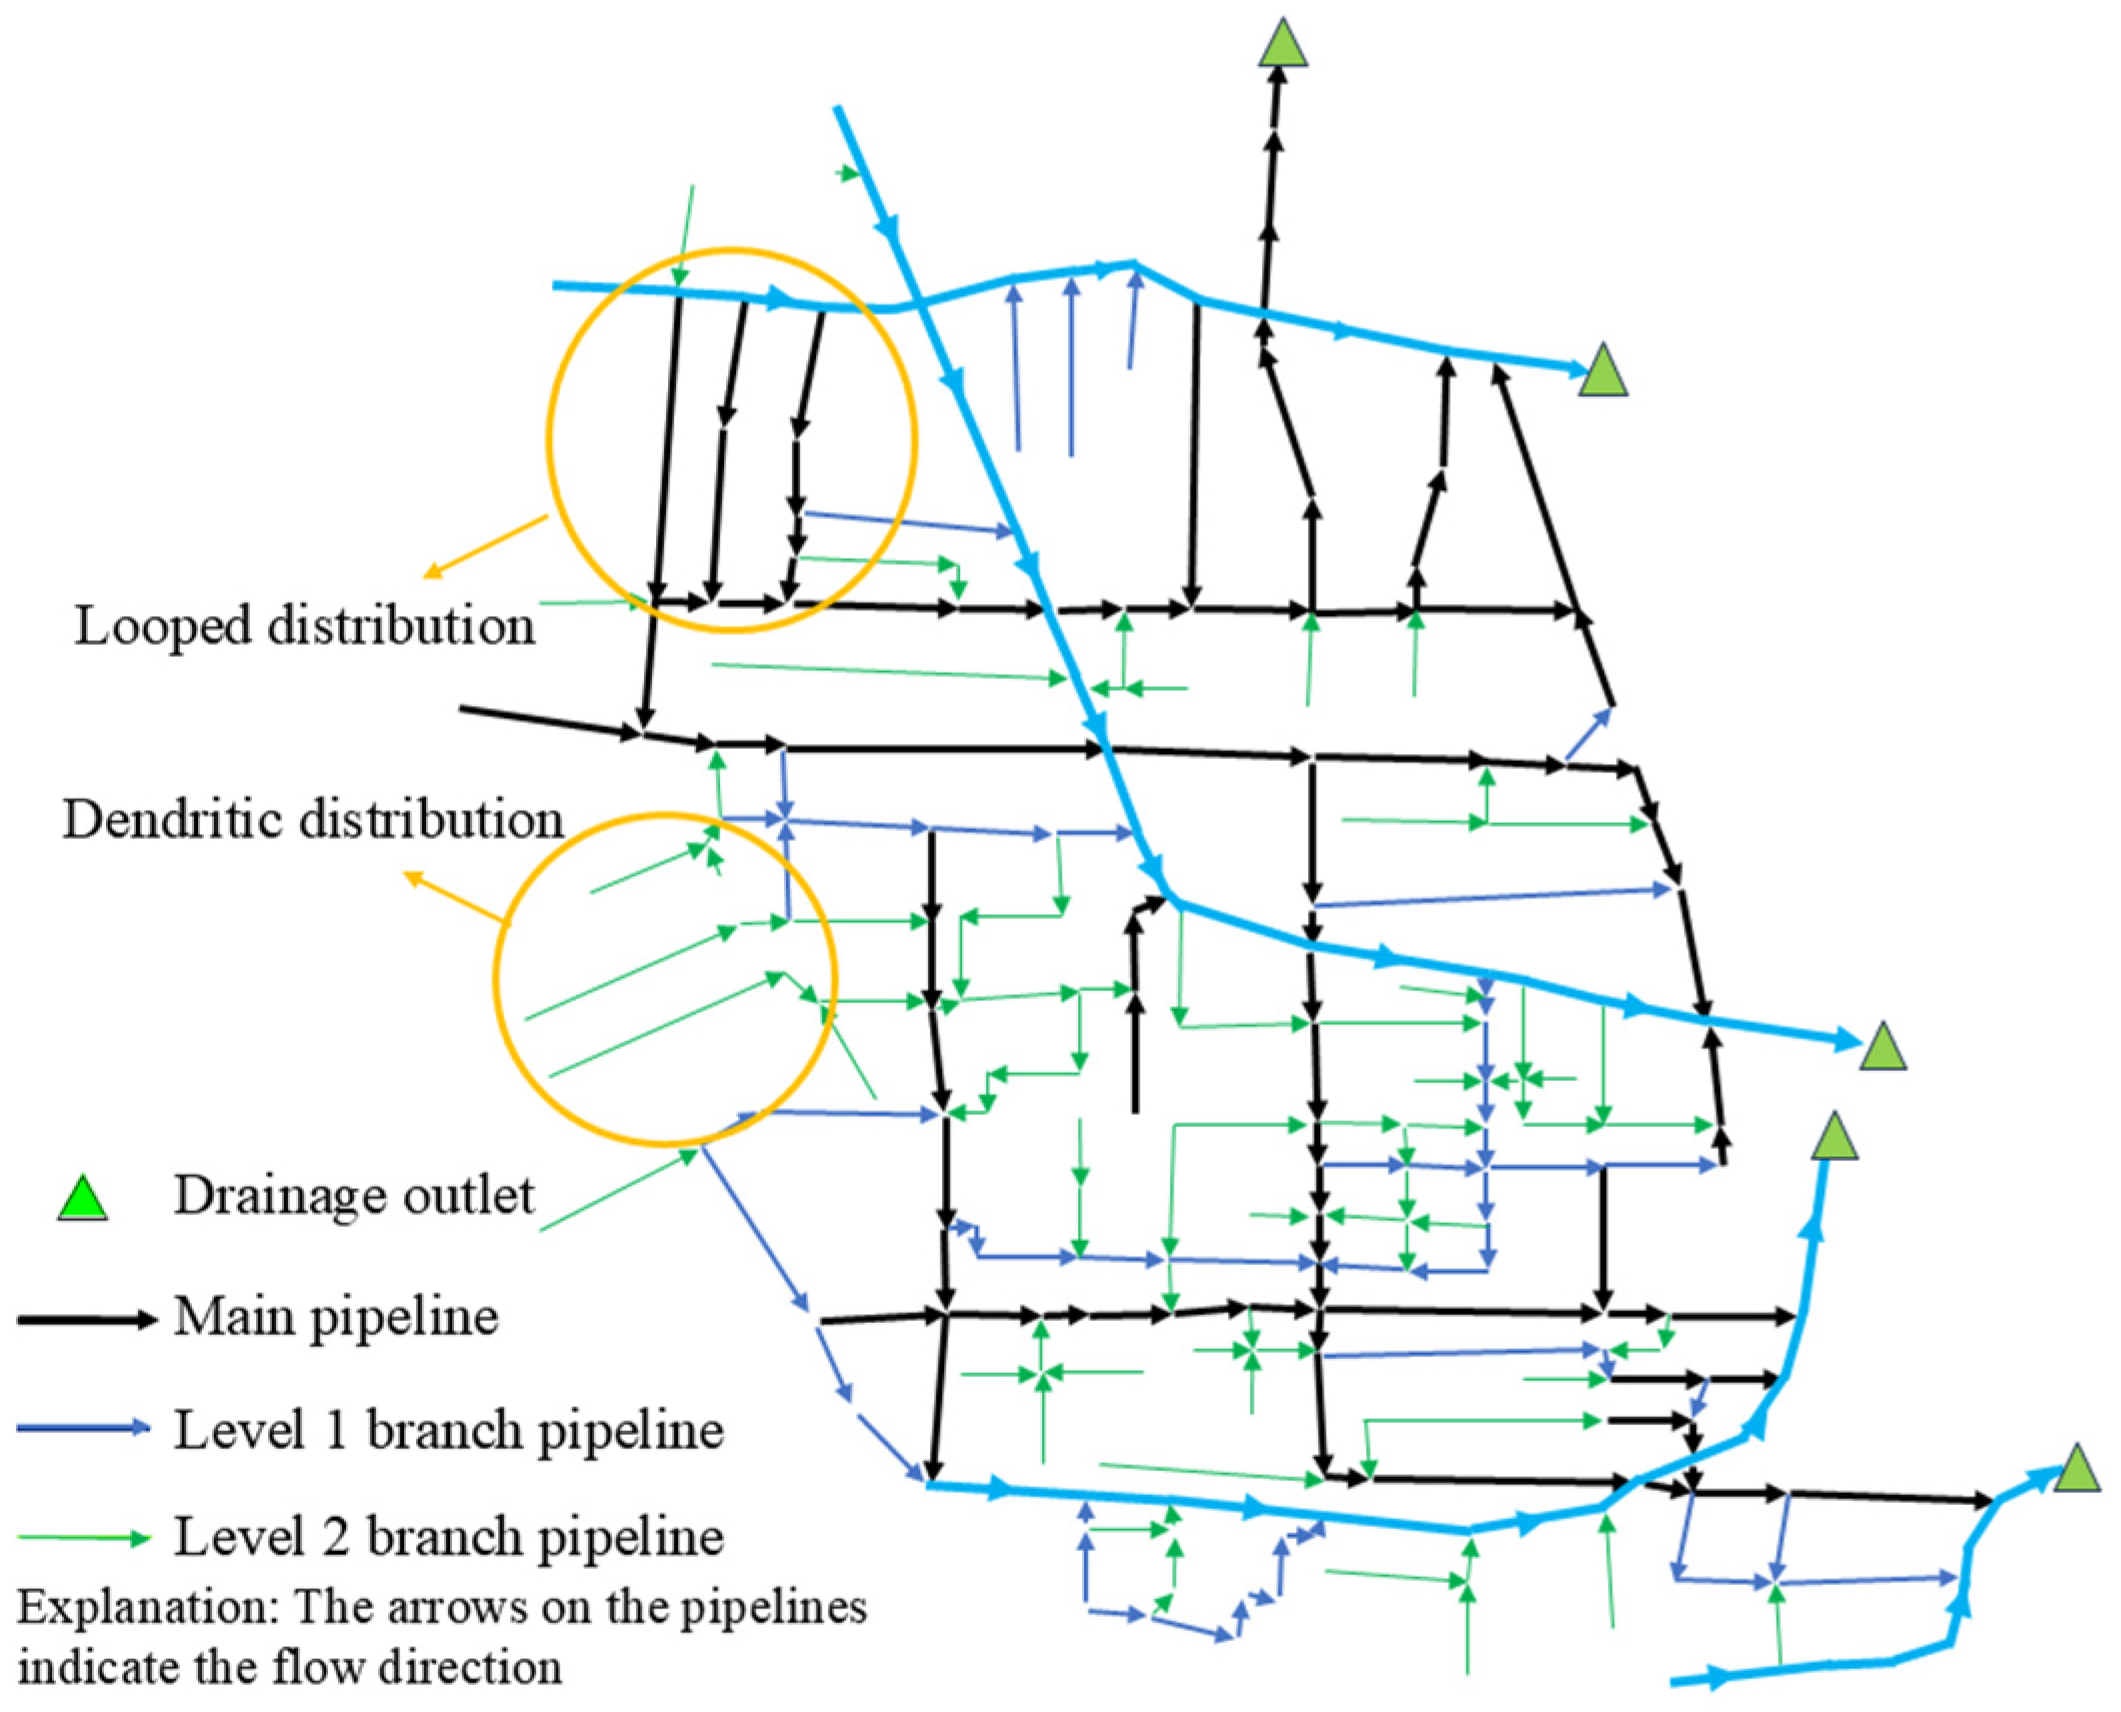
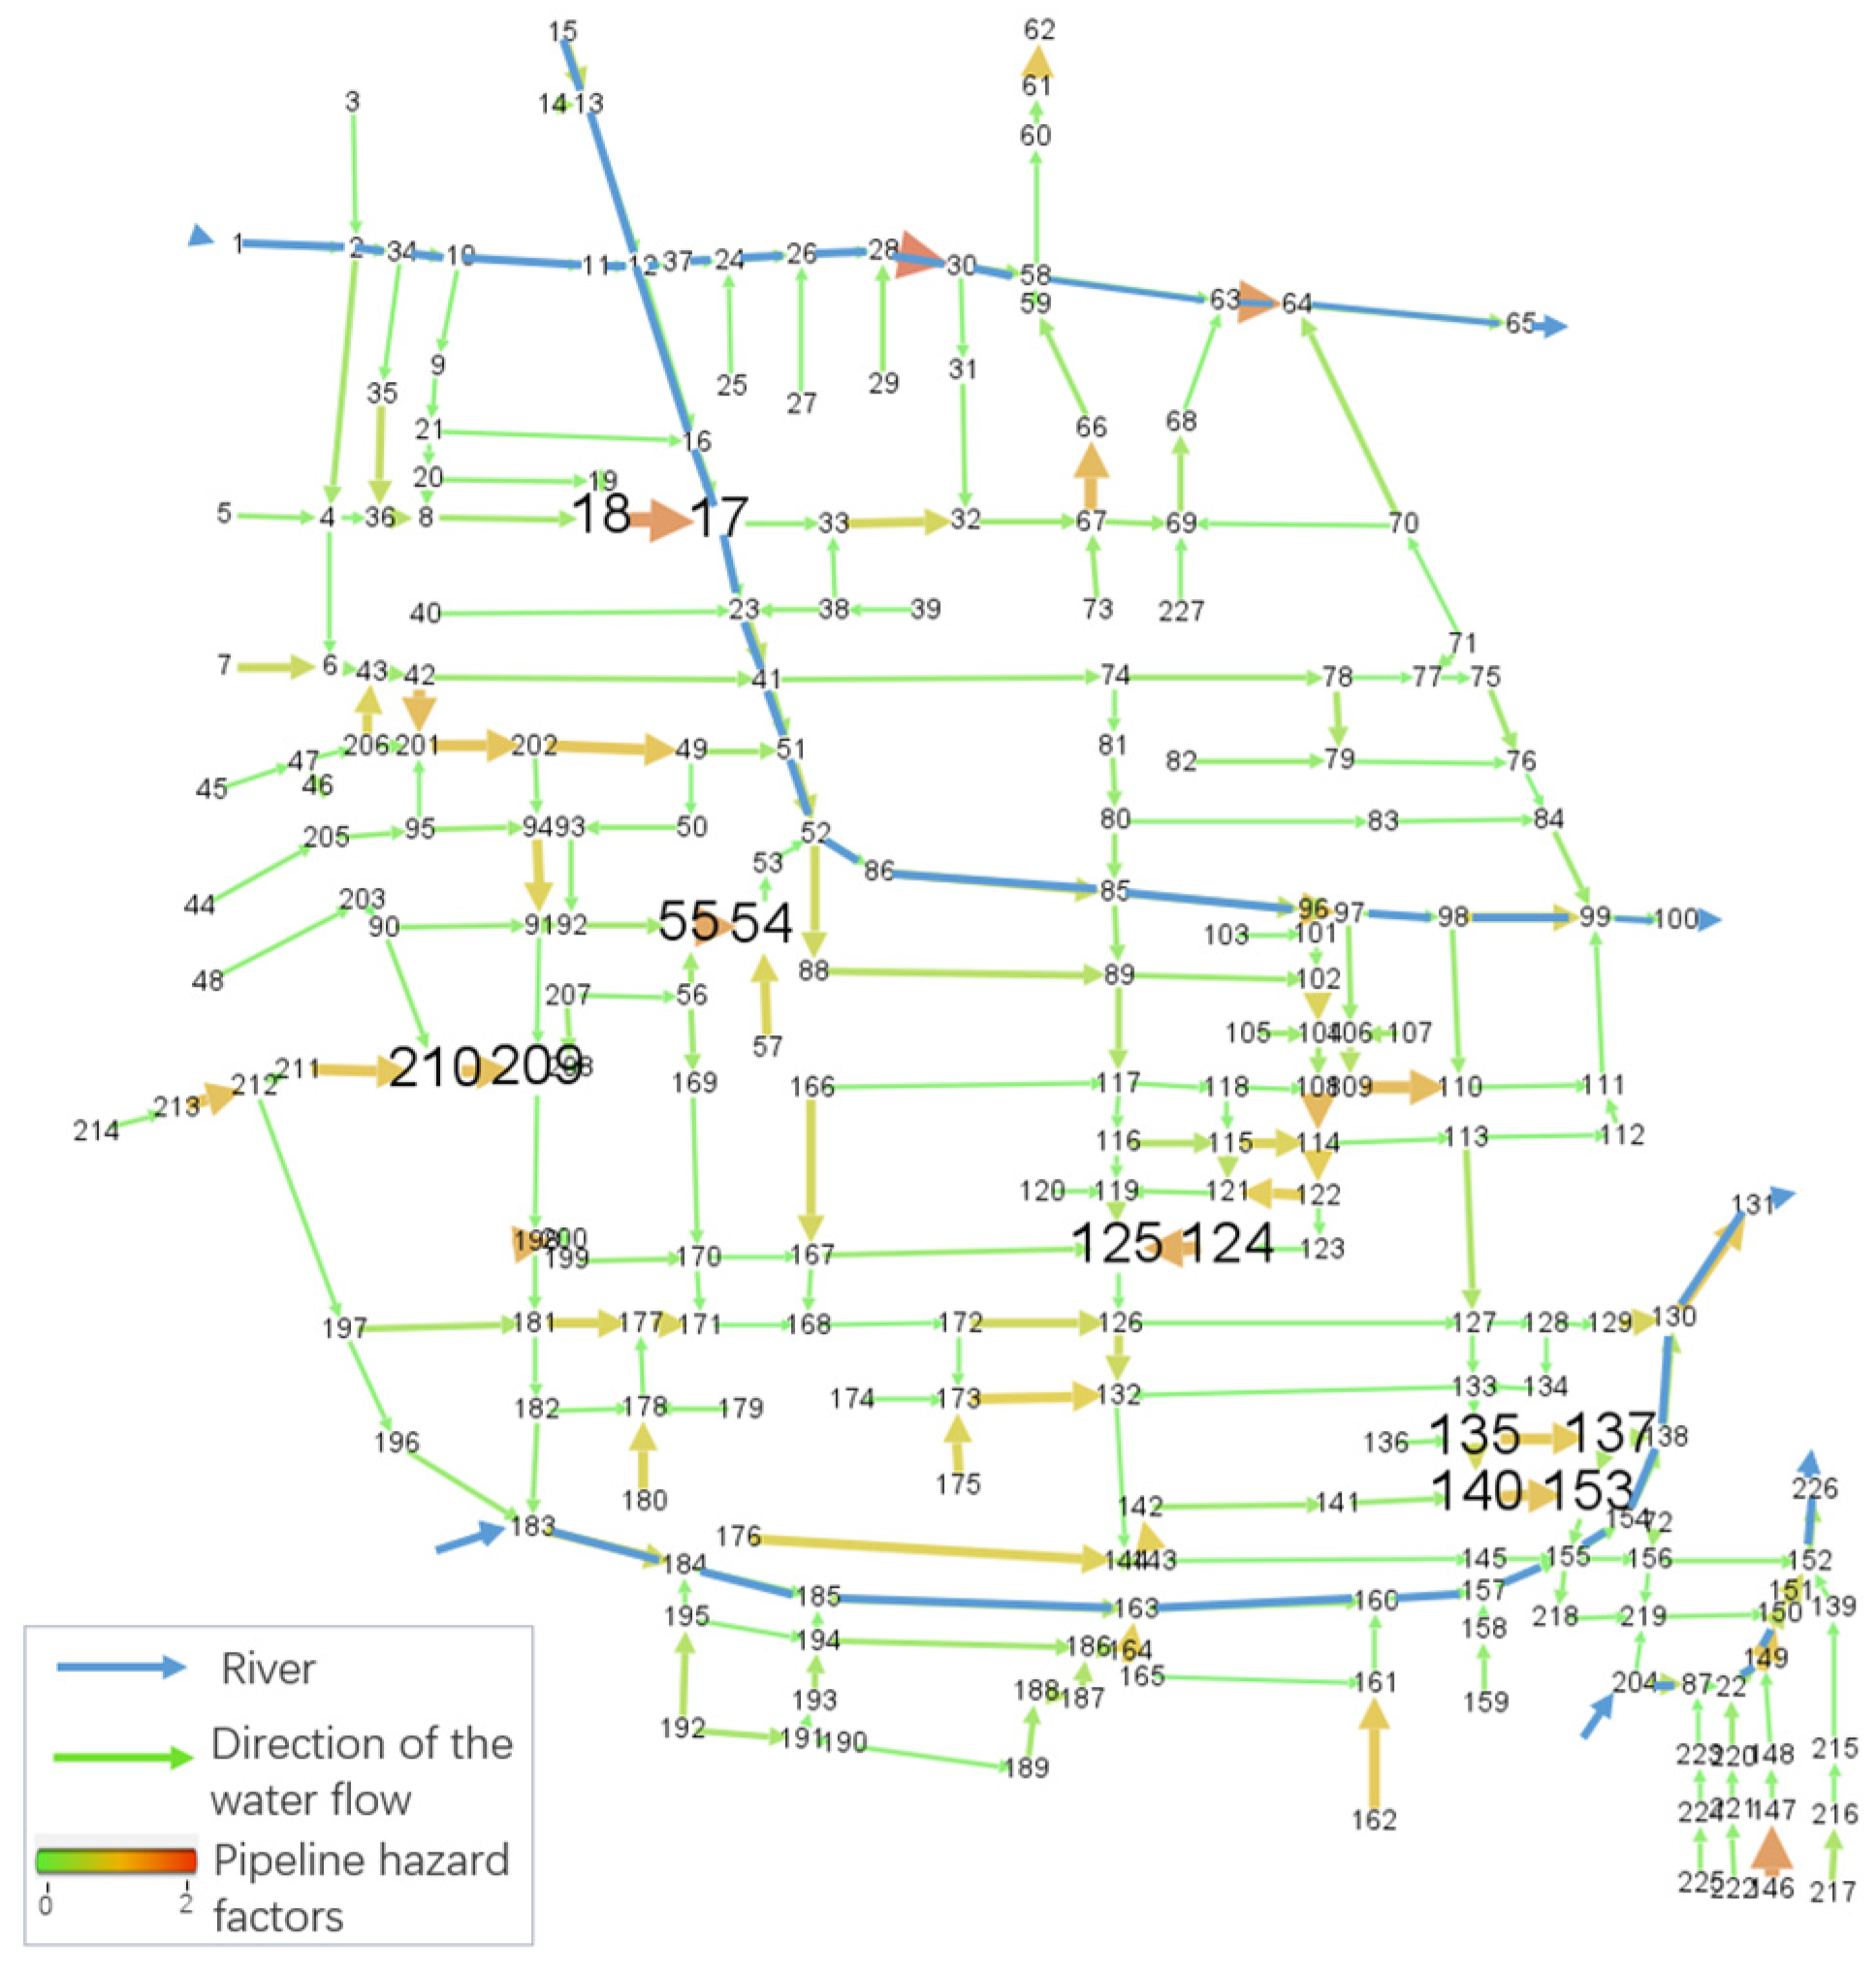
(1) Fundamental information regarding the drainage pipeline network was obtained from the Zhengzhou Municipal Engineering Management Office. The studied area’s pipeline network is configured in two deployment methods: looped and dendritic. The pipelines tier can be classified into main pipelines, level 1 branch pipelines, and level 2 branch pipelines. Reinforced concrete and double-wall bellows pipelines comprise the pipeline material, with a predominantly circular cross-section. Specifically, the main pipeline, level 1 branch, and level 2 branch have diameters of 1000–2500 mm, 500–1000 mm, and 300–500 mm, respectively. An overview of the drainage network is shown in Figure 2.
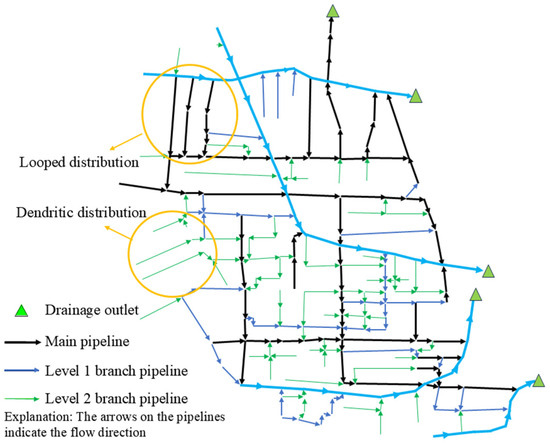
Figure 2.
Overview of the drainage network.
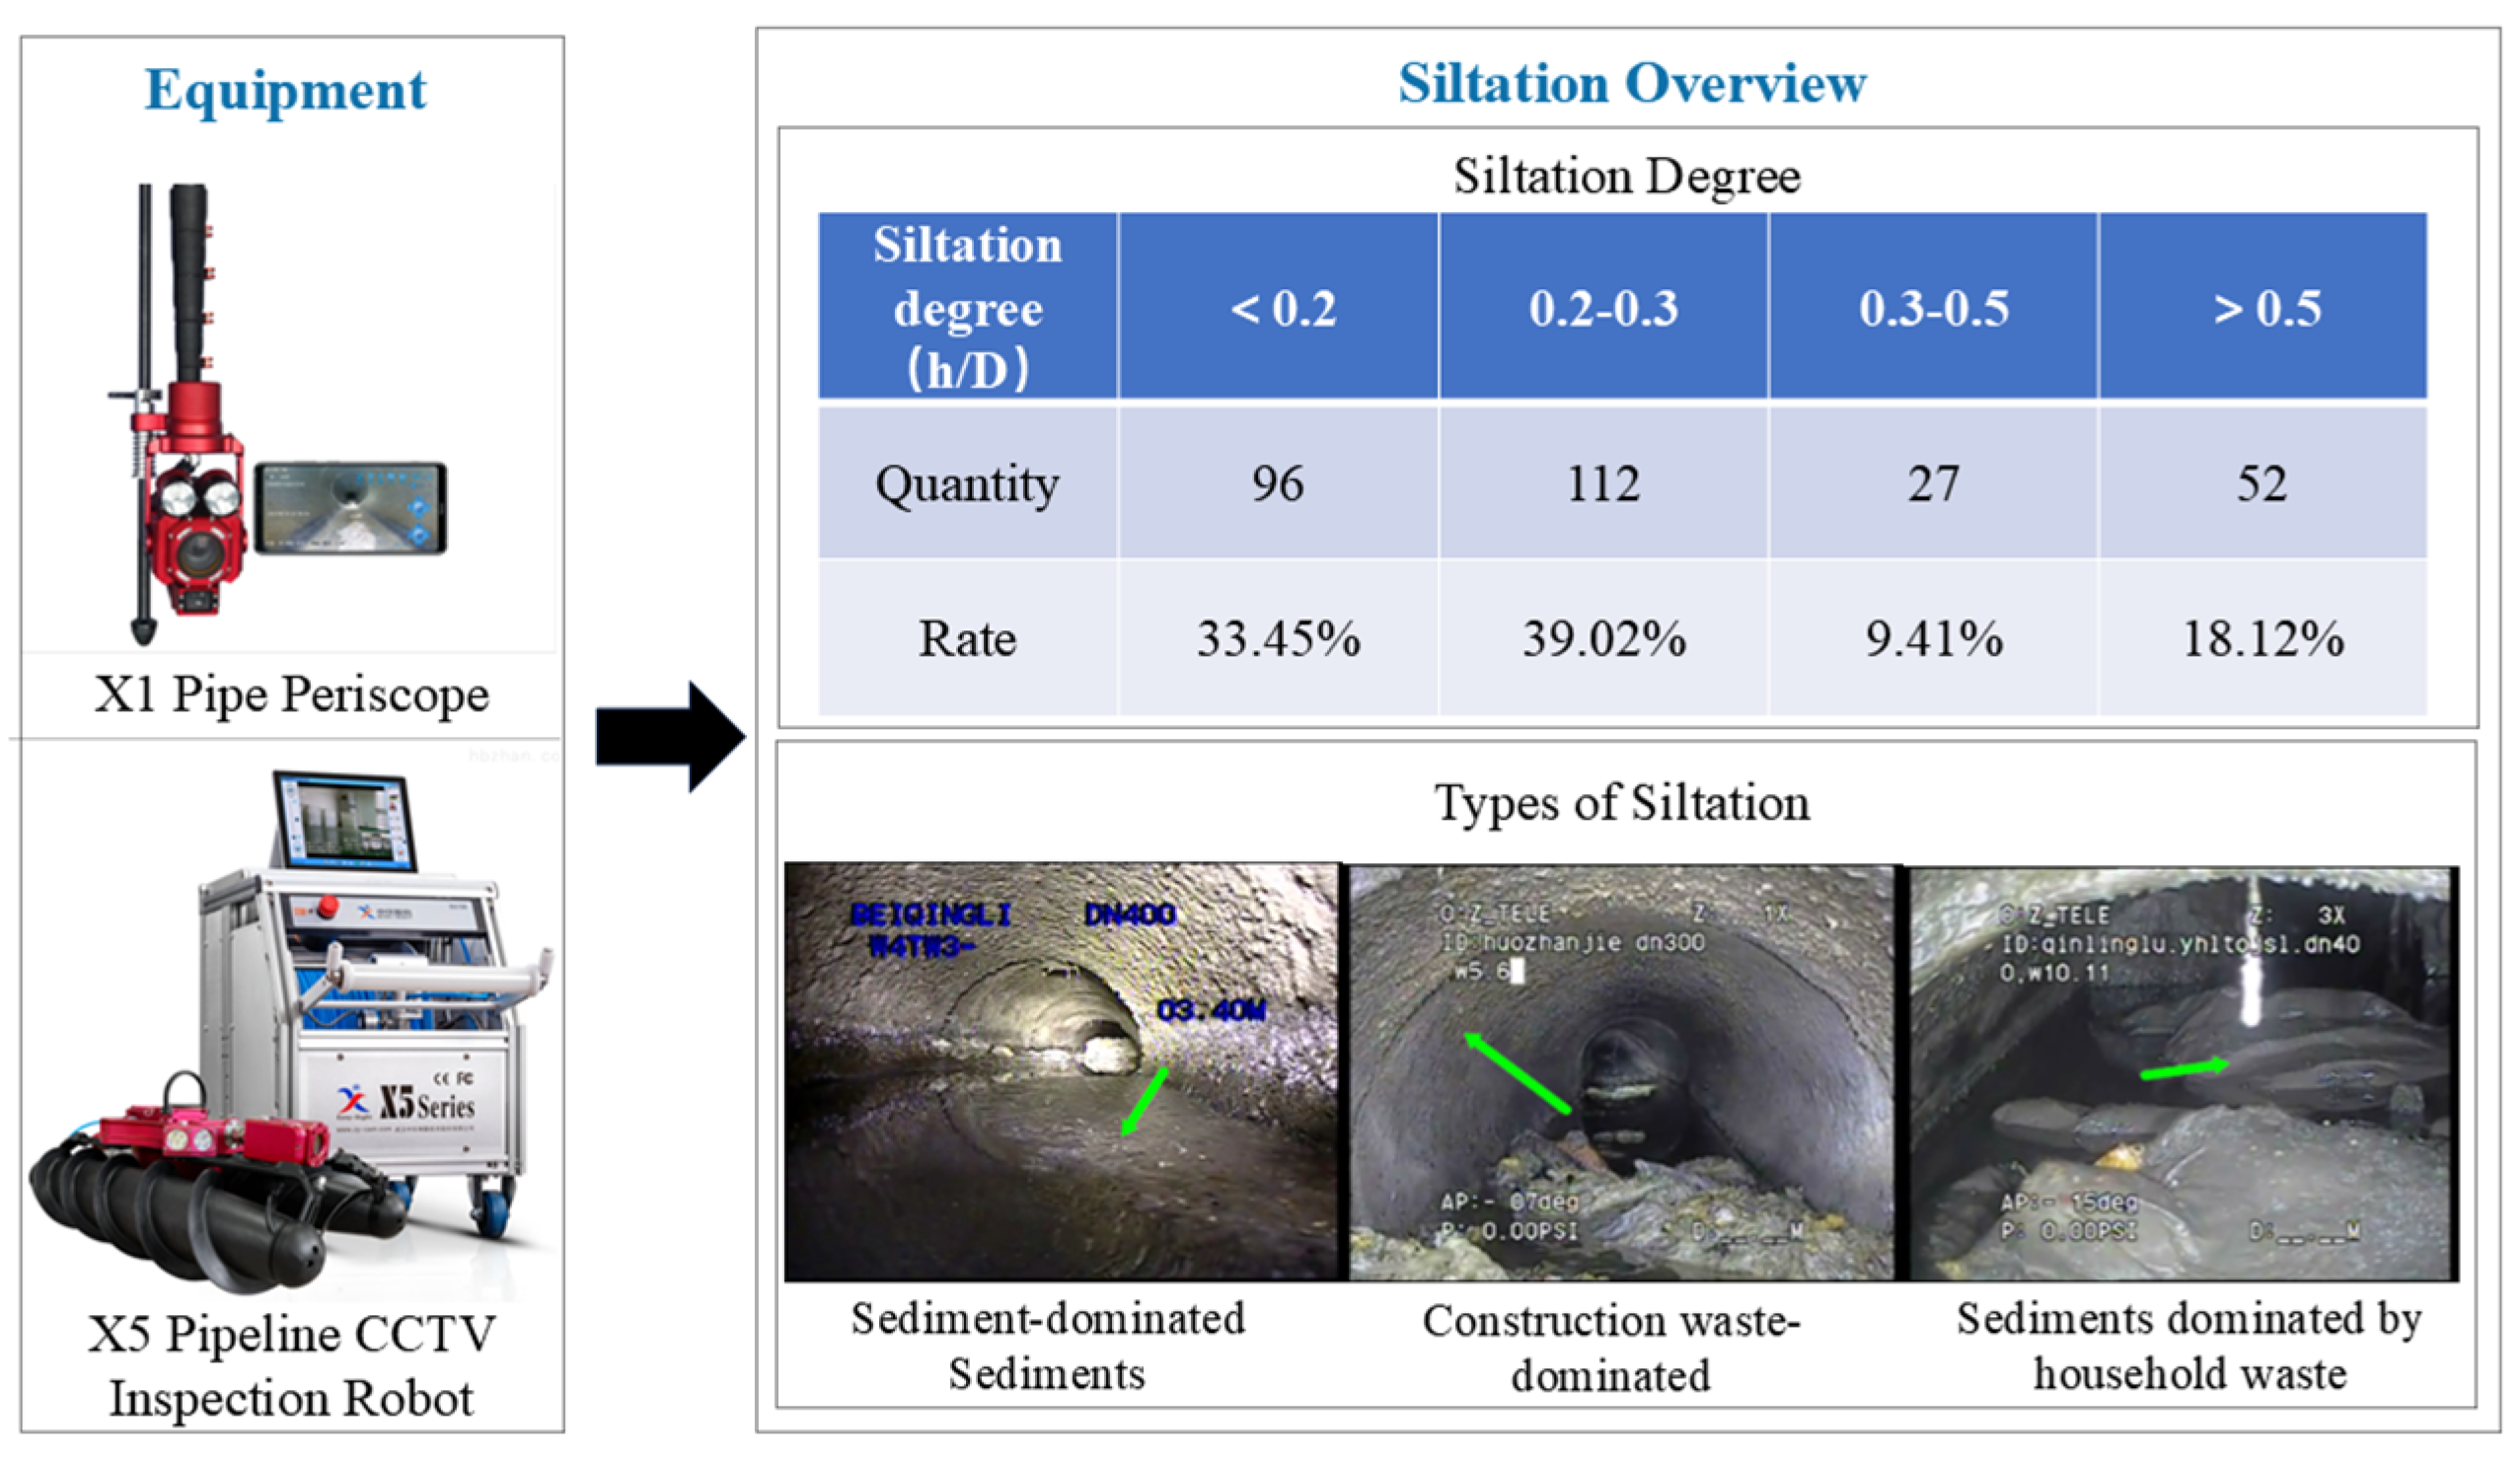
(2) Pipeline siltation data were obtained from Zhengzhou Municipal Engineering Management Office pipeline inspection data, for which the applied inspection equipment is an X1 pipeline periscope (YfmFly, Shenzhen, China)and X5 pipeline CCTV inspection robot (YfmFly, Shenzhen, China). There are 287 existing pipelines in the study area, and the proportion of pipelines with siltation degrees <0.2, 0.2–0.3, 0.3–0.5, and >0.5 are 33.45%, 39.02%, 9.41%, and 18.12%, respectively, and the siltation phenomenon is relatively common. Pipeline siltation was characterized by sediment deposition, construction debris, and domestic garbage. This is shown in Figure 3 (where the siltation degree is the ratio of siltation thickness to the pipeline diameter, expressed as h/D, where h represents the height of the sediment within the pipeline, and D represents the inner diameter of the pipeline).

Figure 3.
Drainage pipeline inspection equipment and siltation overview.
(3) Land use data were obtained from a geospatial data cloud in which NDVI (Normalized Difference Vegetation Index) was acquired by the Agua/Terra-MODIS satellite at a resolution of 500 m × 500 m. The study area had a maximal NDVI value of 0.588 and a minimum value of 0.2. The land use is shown in Figure 4a.
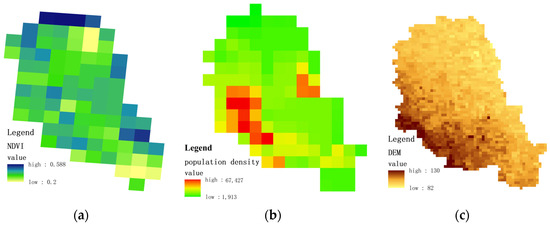
Figure 4.
NDVI (a), population density (b), and DEM (c).
(4) Population density data were rasterized to a resolution of 1000 m × 1000 m and derived from demographic data (GPWv4). The population density is shown in Figure 4b.
(5) DEM data were sourced from the 2024 DEM data by Zhongke Tuxin, with a resolution of 12.5 m. The DEM is shown in Figure 4c.
3. Research Methodology
3.1. Overview of the Research Methodology
The complex network is constructed by abstracting the intersection points of the drainage network’s catchment wells as nodes and the pipelines connecting these intersection points as edges. Rainwater flow follows the gravity-driven principle, and each edge is assigned a direction based on the flow direction.
3.2. Risk Calculation for Pipeline Network
(1) Assessment of the significance of variables that affect siltation
Pipeline attributes and the adjacent disaster-causing environment are the primary factors that influence siltation. This study focused on seven characteristic indicators in three categories: pipeline network attributes, land use, and socio-economics. The pipeline network’s attributes consist of pipeline diameter, pipeline network density, pipeline tier, and pipeline deployment method. Land use involves the use of NDVI, while socio-economics encompasses population density and siltation type. Hierarchical analysis can be employed to ascertain the significance of each siltation-influencing factor.
(2) Pipeline Risk factors
The risk of a specific pipeline is contingent upon the flow capacity of the diseased pipeline and the severity of the disease, which can be calculated as a pipeline risk factor, as in Equation (1).
where is the pipeline risk factor, is the conveyance capacity of pipeline after siltation, is the importance of the influence factor, is the value of the th influence factor of the th pipeline, and is the total number of pipelines in the drainage network. The pipeline risk factor is assigned a value between 0 and 1. The risk of pipeline siltation and the downstream transfer of silt increases as the value increases; is the maximum value of the th influencing factor among all pipelines.
The pipeline conveyance capacity at maximum flow is as shown in Equation (2), without any kind of siltation.
where is the pipeline conveyance capacity, is the roughness coefficient of the pipeline, is the diameter of the pipeline, and is the hydraulic gradient.
The conveyance capacity of a pipeline decreases as a result of a reduction in the overwater cross-section when siltation occurs. The following assumptions are made to facilitate the calculation: (a) the pipeline roughness is solely associated with siltation; (b) the effect of pipeline siltation is the sole factor considered, and structural damage, such as pipeline fracture, is not taken into account. Consequently, Manning’s formula is employed to determine the conveyance capacity following siltation. The conveyance capacity is determined for siltation degrees (h/D) of less than 0.5 and 0.5 to less than 1, as illustrated in Equation (3).
where is the relative conveyance capacity of the pipeline after siltation, is the silt thickness of the pipeline , is the diameter of pipeline i, and is the rate of siltation of pipeline .
(3) Drainage pipeline network risk
The drainage pipeline network system is composed of various pipelines, and the pipeline risk factor of each pipeline is distinct. Consequently, the drainage performance of the entire drainage network can be quantified by the pipeline risk factor. As illustrated in Equation (4), the average drainage capacity is weakened as the risk factor of the pipeline network increases.
where is the risk factor of the drainage network, is the length of pipeline , is the total length of the pipeline, and the other letters have the same meaning as above; is the total number of pipelines in the drainage network, and represents the same concept as in Equation (1).
3.3. Node Importance
Node importance is positively correlated to the importance degree of the network topology node; the higher the degree of importance, the more significant the node is in the network. Node importance is comprehensively evaluated by degree centrality, closeness centrality, and betweenness centrality in order to consider a node’s central characteristics in the network.
Degree centrality is equivalent to the sum of the number of edges connected to the node. The greater the node centrality, the greater the node’s significance, as stated in Equation (5).
where is node ’s degree centrality, is the sum of the number of edges connecting node and , and is the number of nodes.
Closeness centrality is a critical metric for determining the centrality of a node in a network, as it reflects the proximity of the node to other nodes. The higher the closeness centrality of a node, the greater its significance, as in Equation (6).
where is the closeness centrality value of node , and is the shortest path length between node and .
Betweenness centrality is a metric that quantifies the significance of a node by dividing the total number of shortest paths by the number of paths passing through that edge. According to Equation (7), the significance of a node increases as its betweenness centrality increases.
where is the betweenness centrality of node is the total number of shortest paths between nodes s and t, and is the number of shortest paths through node .
Consequently, Equation (8) can be used to calculate the node importance formula:
3.4. Node Risk Degree
By calculating the average pipeline risk factor of the edges connecting a node to other nodes, node riskiness is a reflection of the risk associated with that node. The peril of a node increases as its risk degree increases. Equation (9) is used to determine the risk degree of the node:
where is the risk degree of node , and is the sum of the pipeline risk factors at the connecting edges of node .
3.5. Drainage Network Siltation Chain Risk Level
(1) Degree of risk at the edge of the siltation chain
The risk degree of the siltation chain edge can be used to quantify the chain reaction of siltation in connected pipelines. The risk factor of the pipeline, the degree centrality of the node, and the vulnerability of the connecting edge are chosen as three indicators to comprehensively assess the risk degree of the siltation chain edge, as illustrated in Equation (10).
where is the riskiness of node k to node edge, is the risk factor of the pipeline from node to node , is the degree centrality of node , and is the vulnerability of the connecting edge from node to node .
The vulnerability of a connected edge in the pipeline drainage network topology is the measure of the impact on the entire network structure following the removal of this edge. This is typically represented by the average path length and the number of edge mediators. Equation (11) illustrates that the risk associated with an edge increases as its vulnerability increases.
where is the edge vulnerability, is the edge betweenness of node to node , and is the average path length of node to node
The number of network edges that appear on the shortest path is referred to as edge betweenness. A higher edge betweenness indicates that the edge in the network is able to bear more water, and the impact of the obstruction is greater when the degree of siltation on the pipeline network is high. This is calculated using Equation (12):
where is the number of edges that appear on the shortest path, and is the number of times the shortest path between nodes and passes through the connected edge .
The average path length is calculated by removing each edge to form a new network and then calculating the average path length of the new network. The larger the average path of the network, the greater the importance of the edge, and the more likely that the edge will be silted, as in Equation (13).
where is the shortest path length between node and node and m is the total number of pipelines.
(2) Risk of siltation chain
Equation (14) can be used to compute the risk degree of the entire chain based on the risk degree at the edge of the siltation chain.
where is the risk degree of the whole chain of siltation diseases, and is the risk degree of the connected edges from node to node .
4. Analysis of Results
4.1. Risk Evaluation of Pipeline Networks
(1) Analysis of the importance of siltation influencing factors and pipeline risk factor results
To comprehensively consider pipeline attributes and the surrounding environment, the following factors are primarily taken into account: Pipeline attributes, including pipeline density, pipeline tier, deployment method, and pipeline diameter. Land use can be represented by the NDVI (Normalized Difference Vegetation Index). Lower NDVI values for an area typically indicate lower vegetation coverage, which increases the likelihood of soil particles, plant residues, and other solid materials being washed into the drainage system by rainfall. Socio-economic factors can be represented by population density, as higher population density areas may contribute more waste and debris, potentially exacerbating siltation in drainage systems.
A hierarchical analysis was conducted to determine the factors that influence urban pipeline siltation, and the order of importance was as follows: Pipeline tier (0.191) > type of siltation (0.177) > NDVI (0.172) > density of pipeline (0.167) > manner of deployment (0.11) > population density (0.102) > diameter of pipeline (0.081).
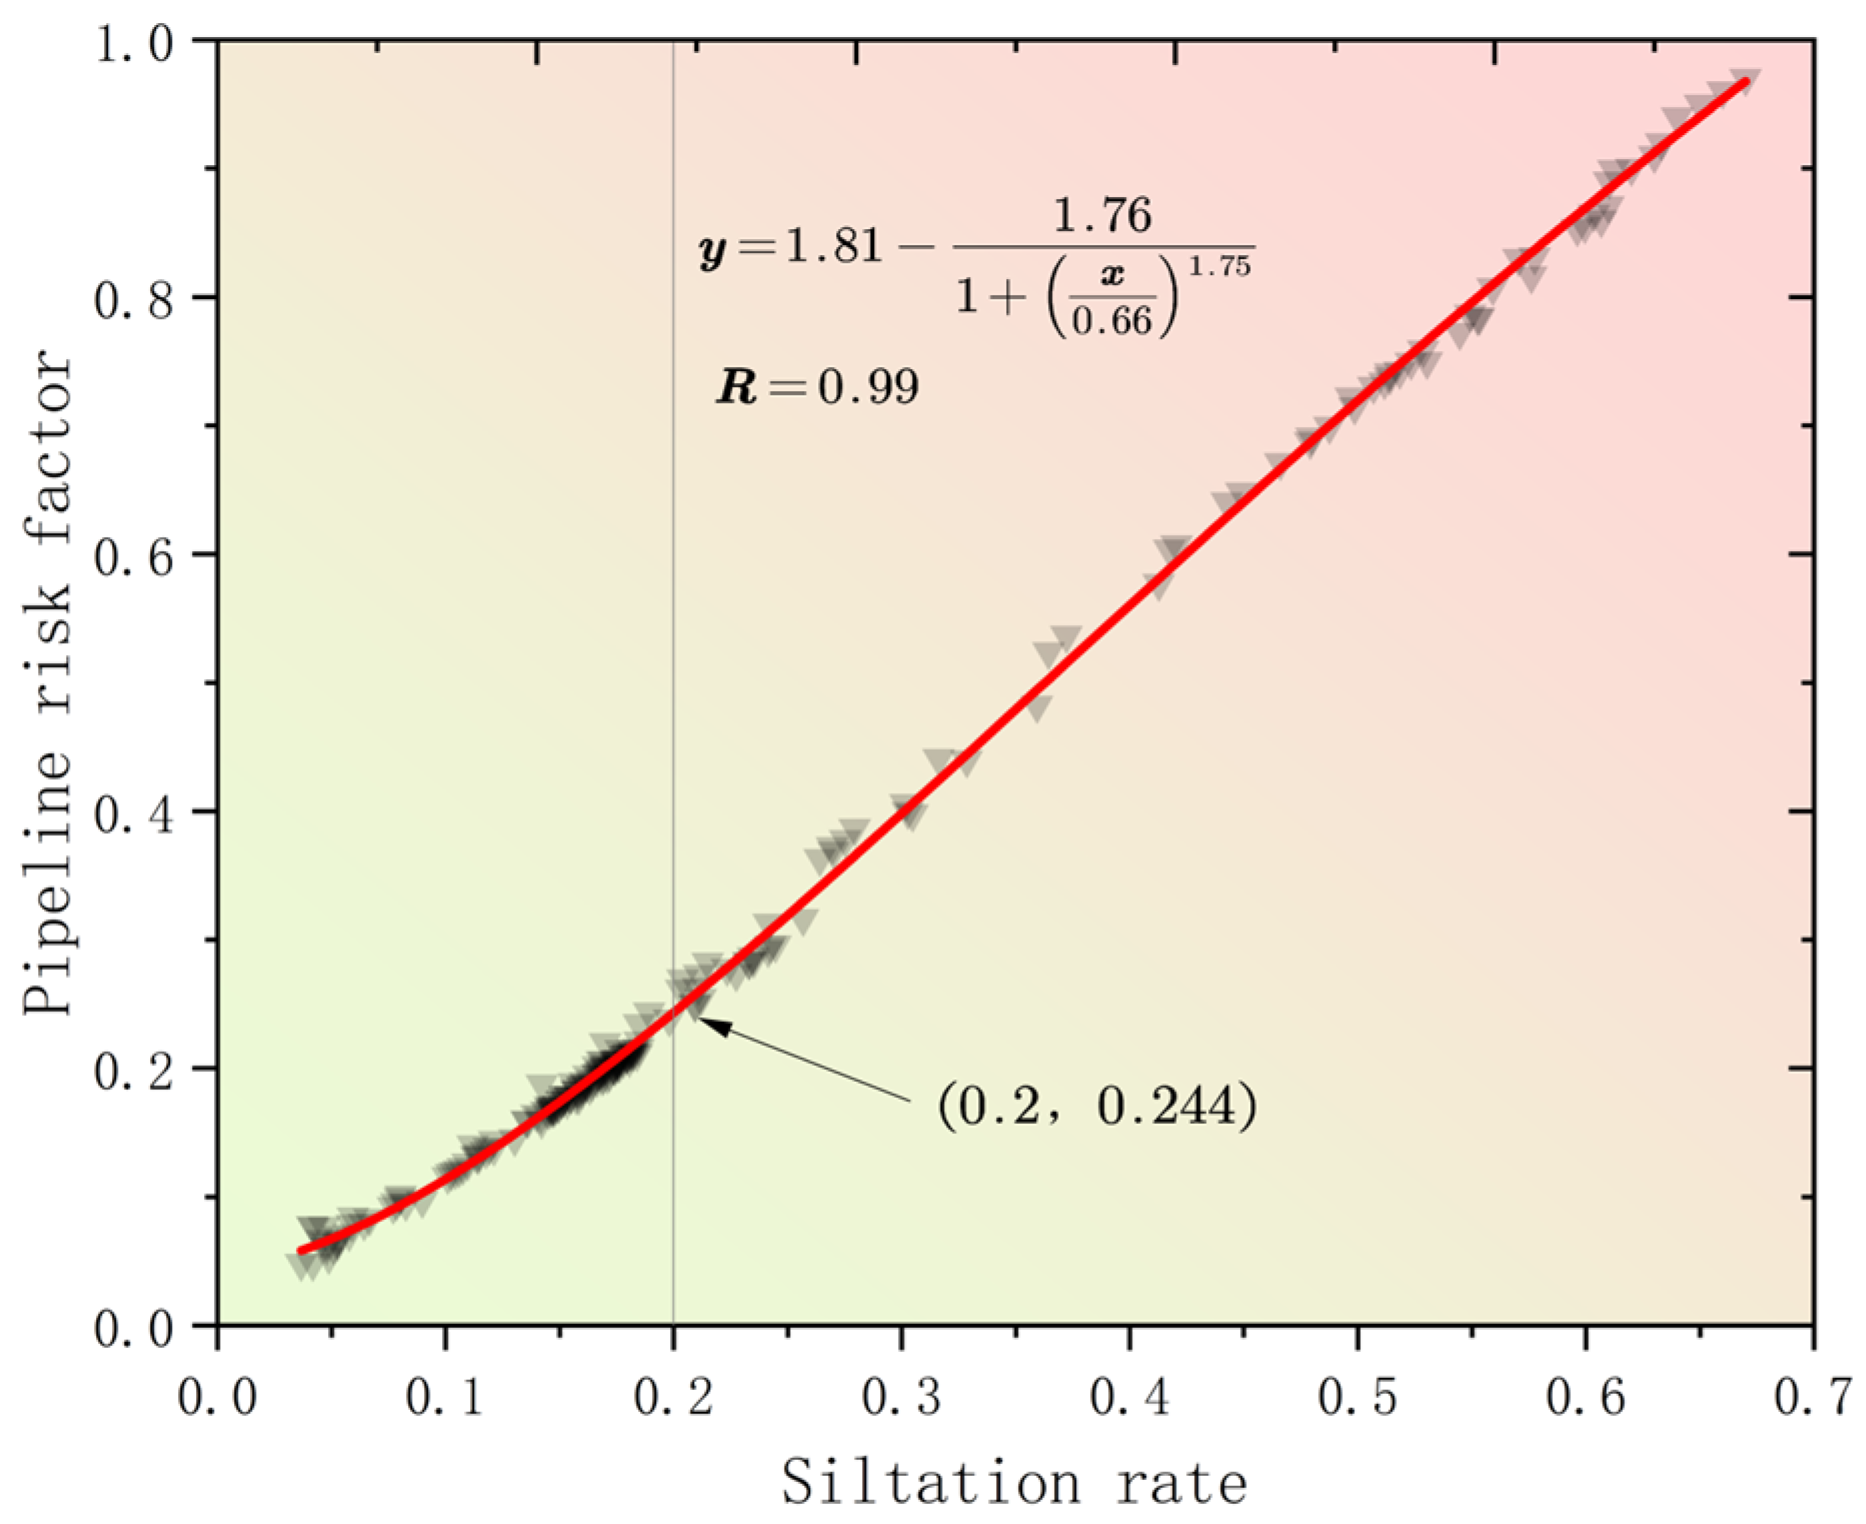
From this, the pipeline risk factor can be calculated and adapted to the pipeline siltation degree, as illustrated in Figure 5. The siltation degree distribution with the pipeline risk factor is illustrated in Figure 6 and Figure 7.
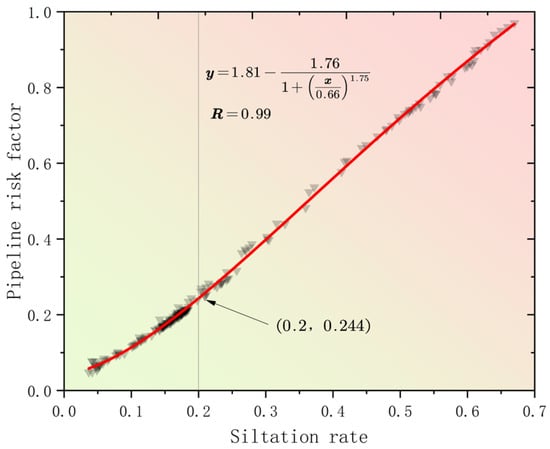
Figure 5.
Relationship curve between siltation rate and pipeline risk factor.
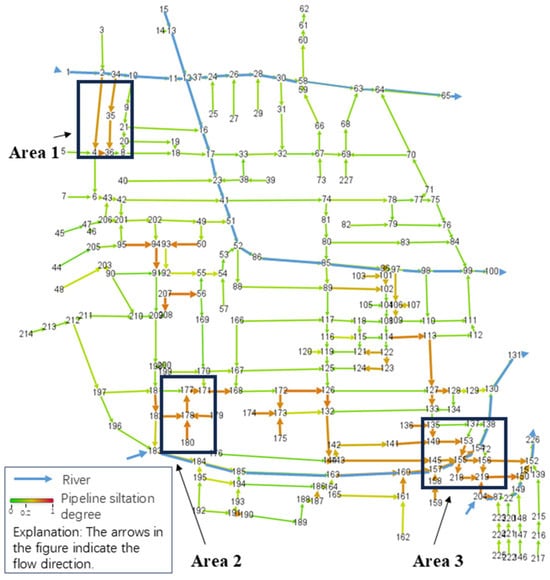
Figure 6.
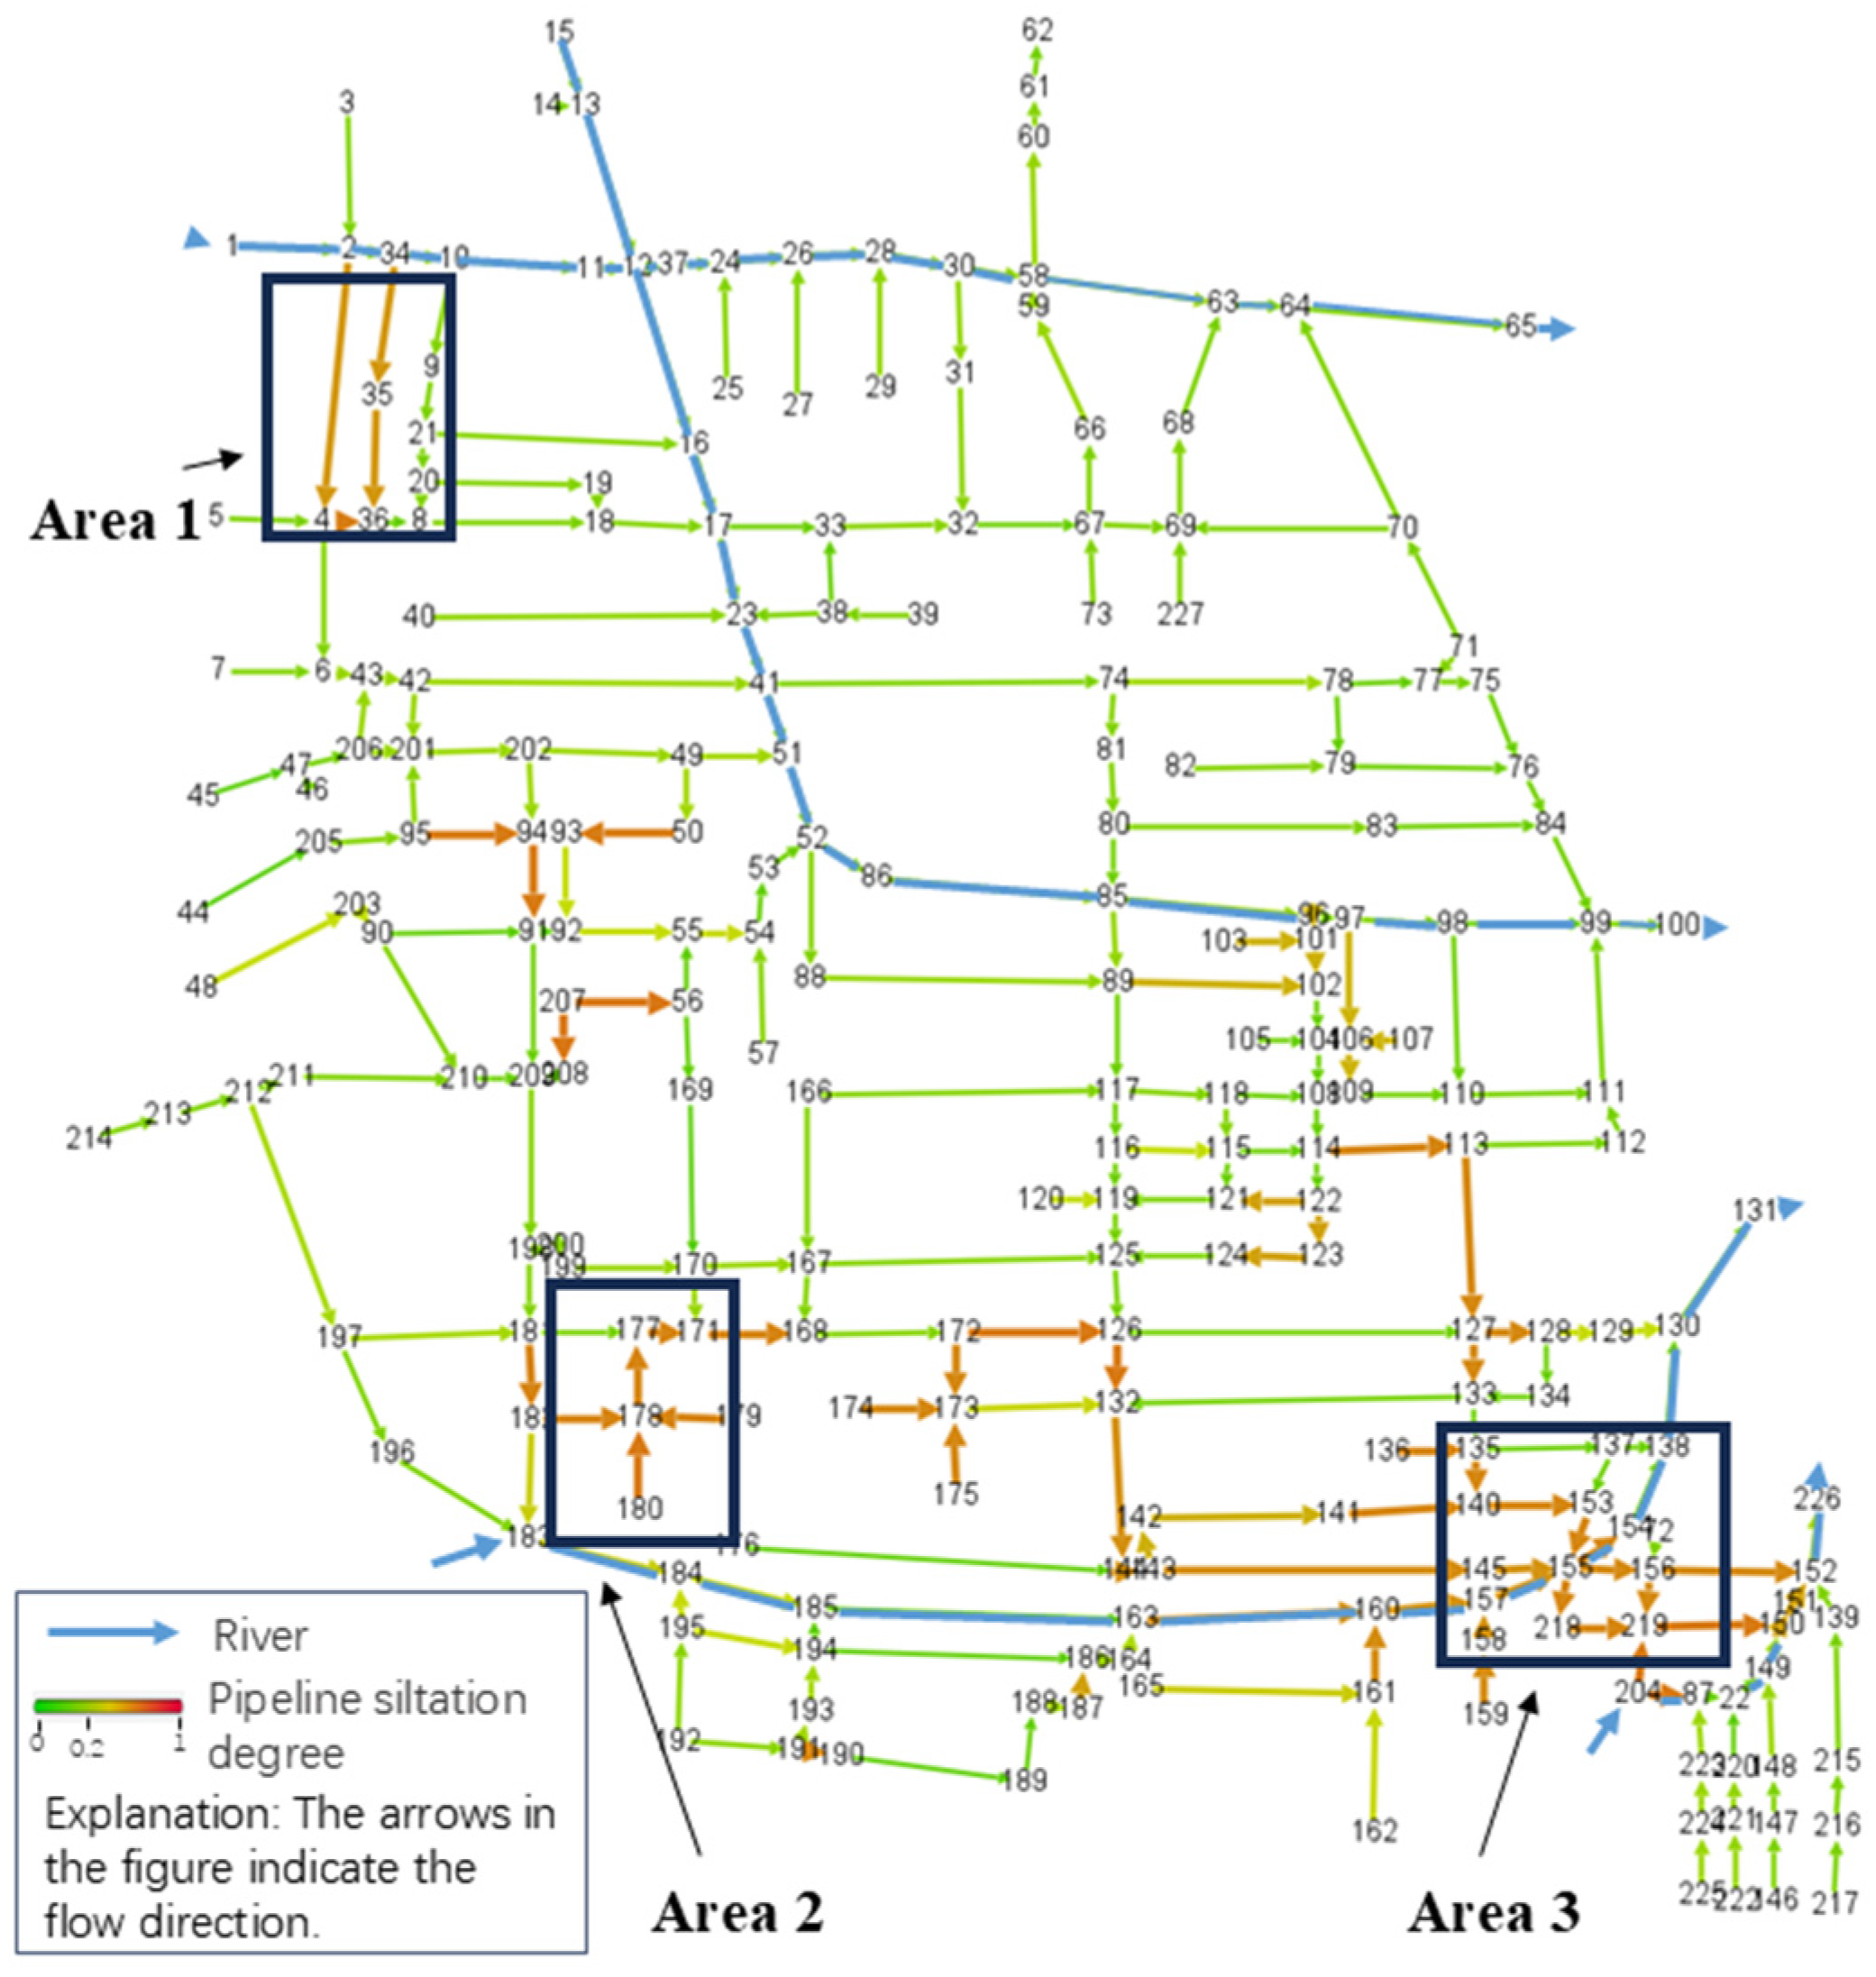
Pipeline siltation degree.
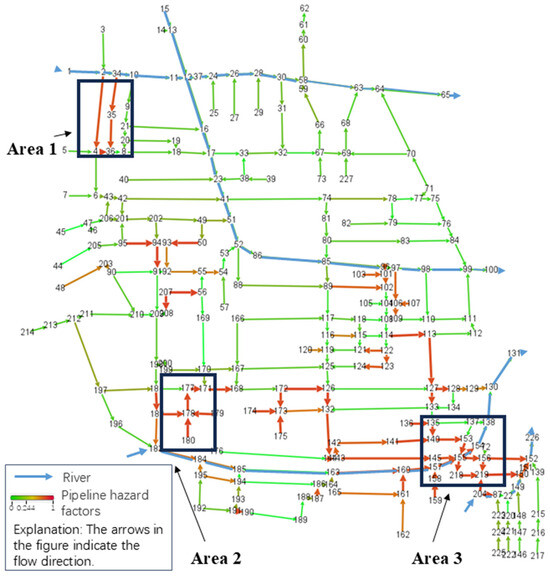
Figure 7.
Pipeline risk factor.
According to China’s “Technical specification for operation, maintenance, and security of sewers, channels, and pumping stations in city and town”, the permissible depth of mud accumulation in drainage pipelines must be less than 1/5 of the inner diameter of the pipeline, which indicates that the degree of siltation is less than 0.2. For pipelines with a degree of siltation greater than 0.2, dredging measures must be conducted. Figure 5 illustrates that the risk factor of the conduit is 0.244 when the degree of siltation is 0.2. Consequently, a pipeline with a risk factor of less than 0.244 is classified as low risk; a pipeline with a risk factor of more than 0.244 is considered high risk and necessitates dredging.
Figure 6 and Figure 7 demonstrate that the distribution of siltation and pipeline risk factor is essentially consistent, and the aggregate pipeline siltation and pipeline risk factor are negligible. Pipelines with a lower siltation degree and risk factor are primarily concentrated in the northern region of the study area. This is primarily due to the fact that the drainage pipeline in this region is located in close proximity to the river, which allows for the direct discharge of silt into the river to prevent its accumulation. The high pipeline hazard factor is primarily concentrated in the south downstream outlet, such as area 3 in Figure 7. The pipeline is not directly connected to the river, and it is subject to the convergence of water from several branch pipelines, resulting in the continuous transfer of silt to the downstream pipeline and the accumulation of silt in the pipeline, despite the fact that this area is closer to the river. Simultaneously, there is an additional portion of the pipeline that is at a higher pipeline risk factor, as illustrated in area 1 and area 2. This portion of the branch pipeline is more concentrated, susceptible to silt blockage, and is influenced by the pipeline tier and layout, resulting in a higher risk of silt transfer.
(2) Risk evaluation of pipeline networks
Based on the risk factor for each pipeline, the risk factor for the complete drainage network can be calculated to be 0.275, which is slightly higher than 0.244. As a result, it is necessary to de-silt the entire conduit system.
4.2. Node Importance Calculation
(1) Analysis of degree centrality, closeness centrality, and betweenness centrality results
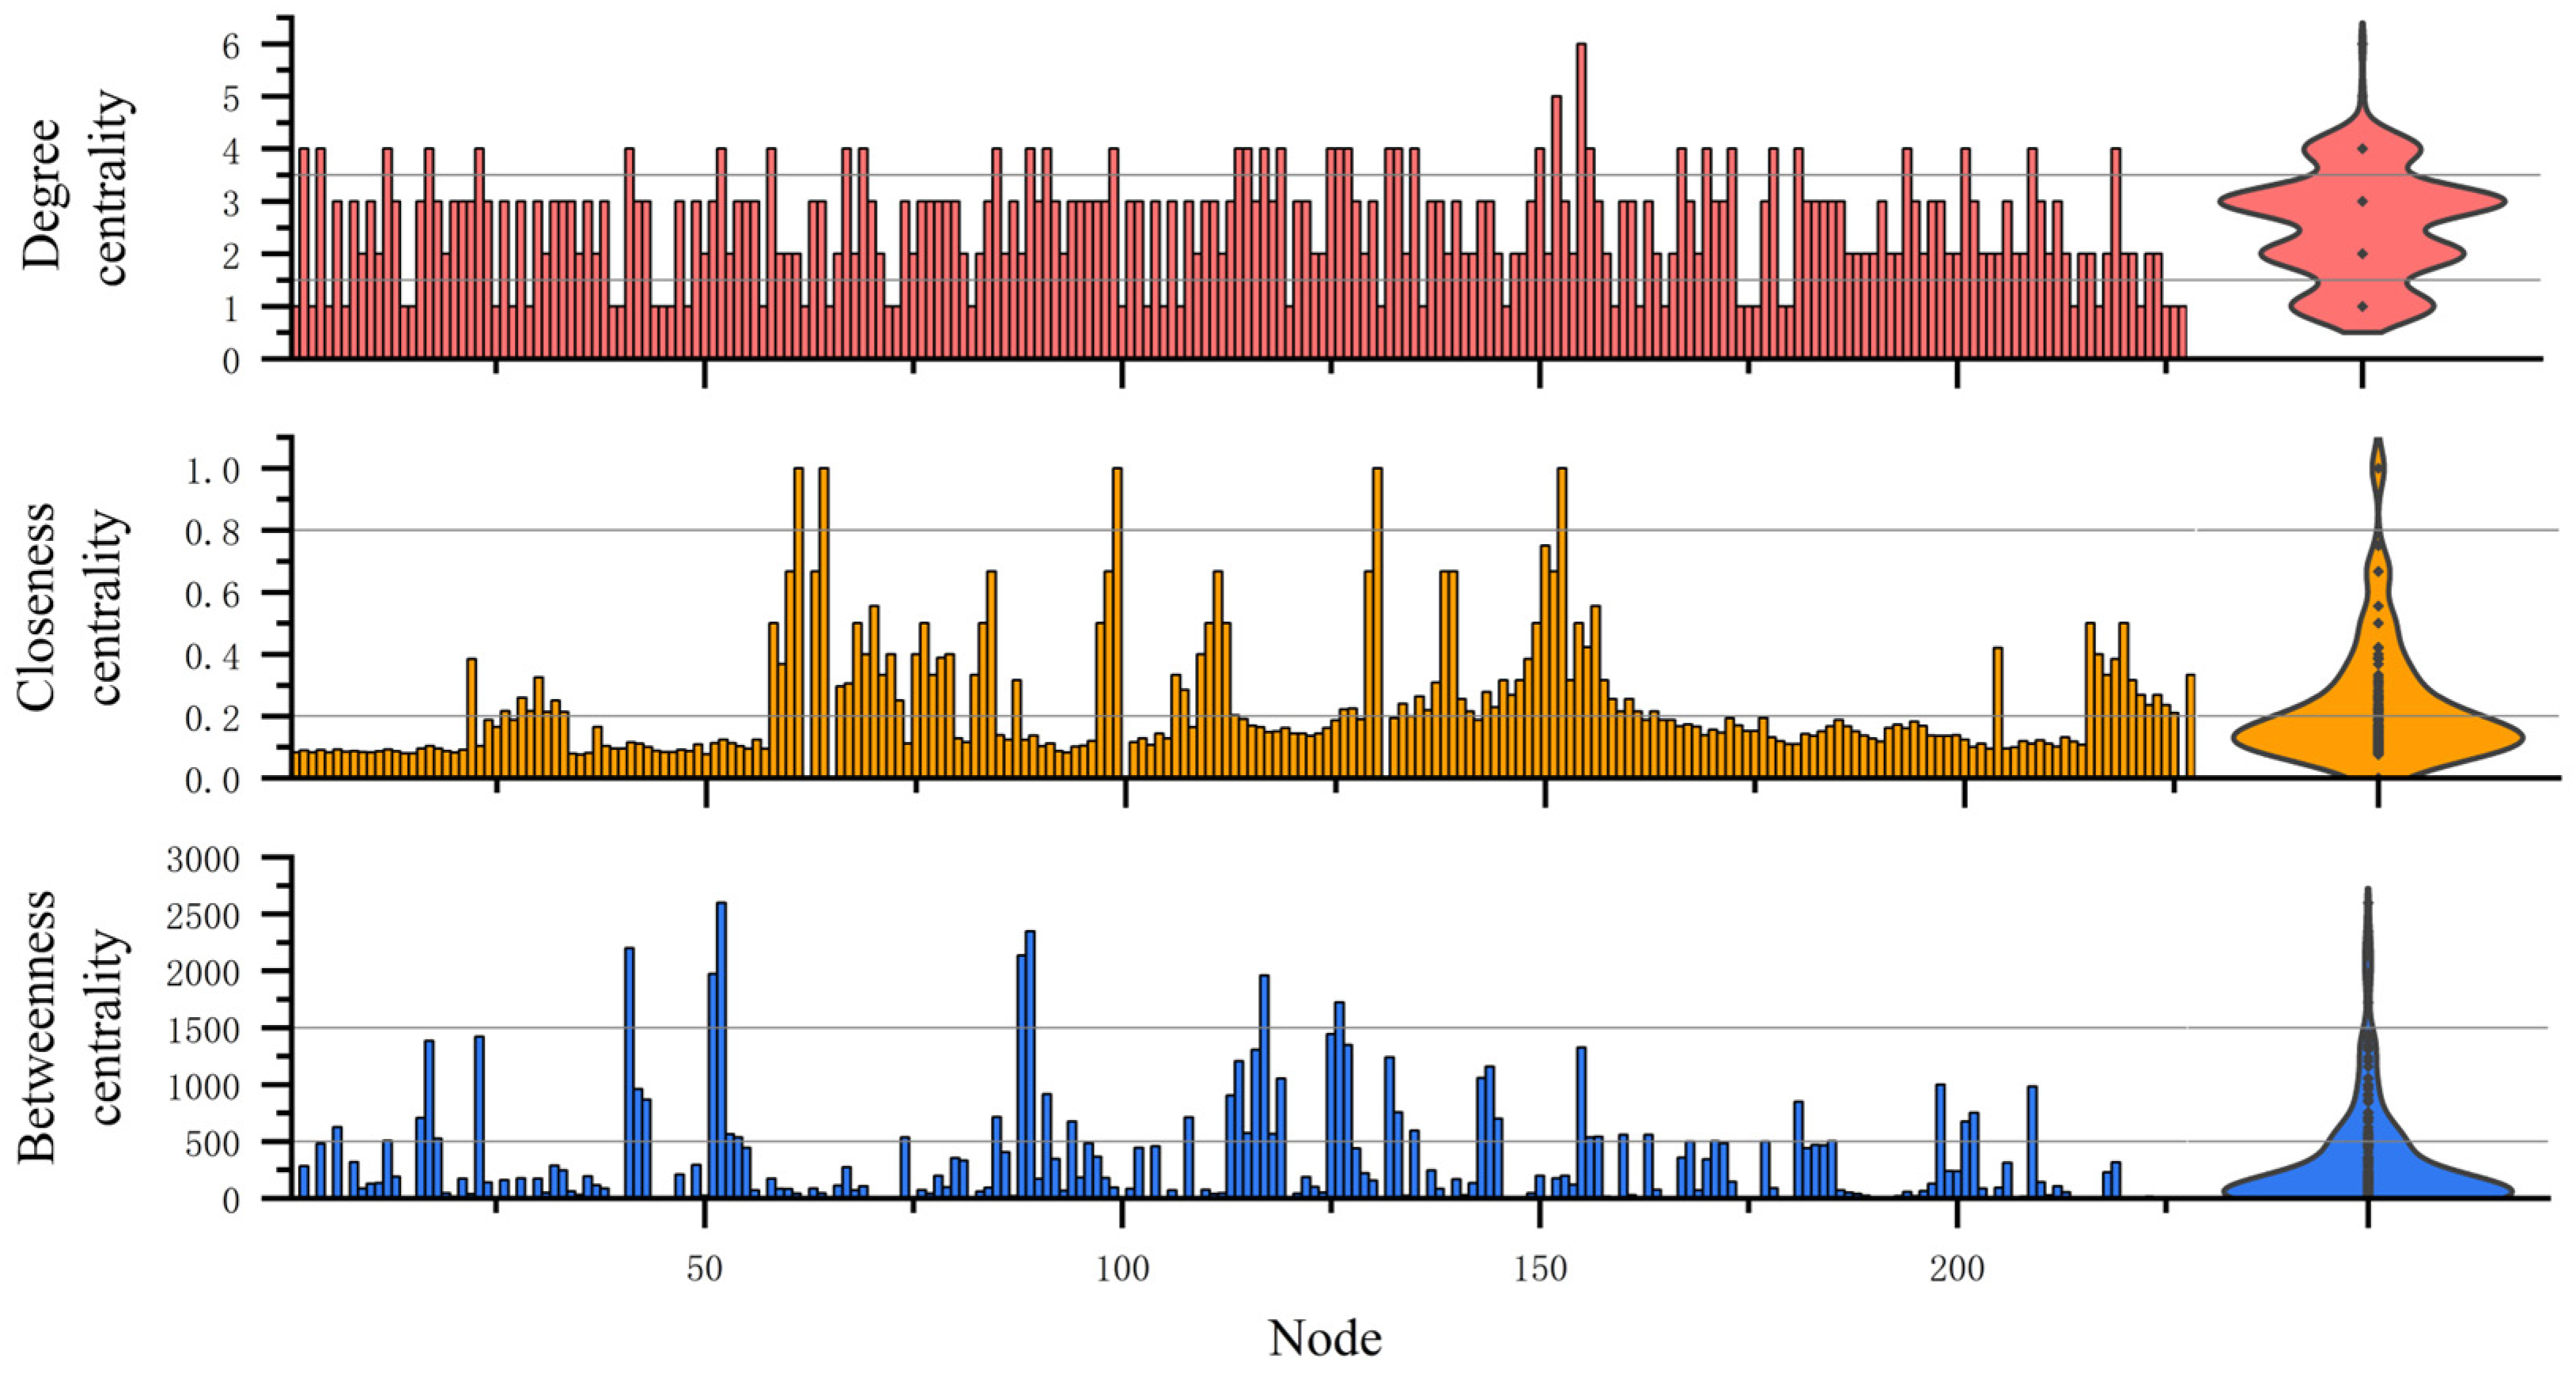
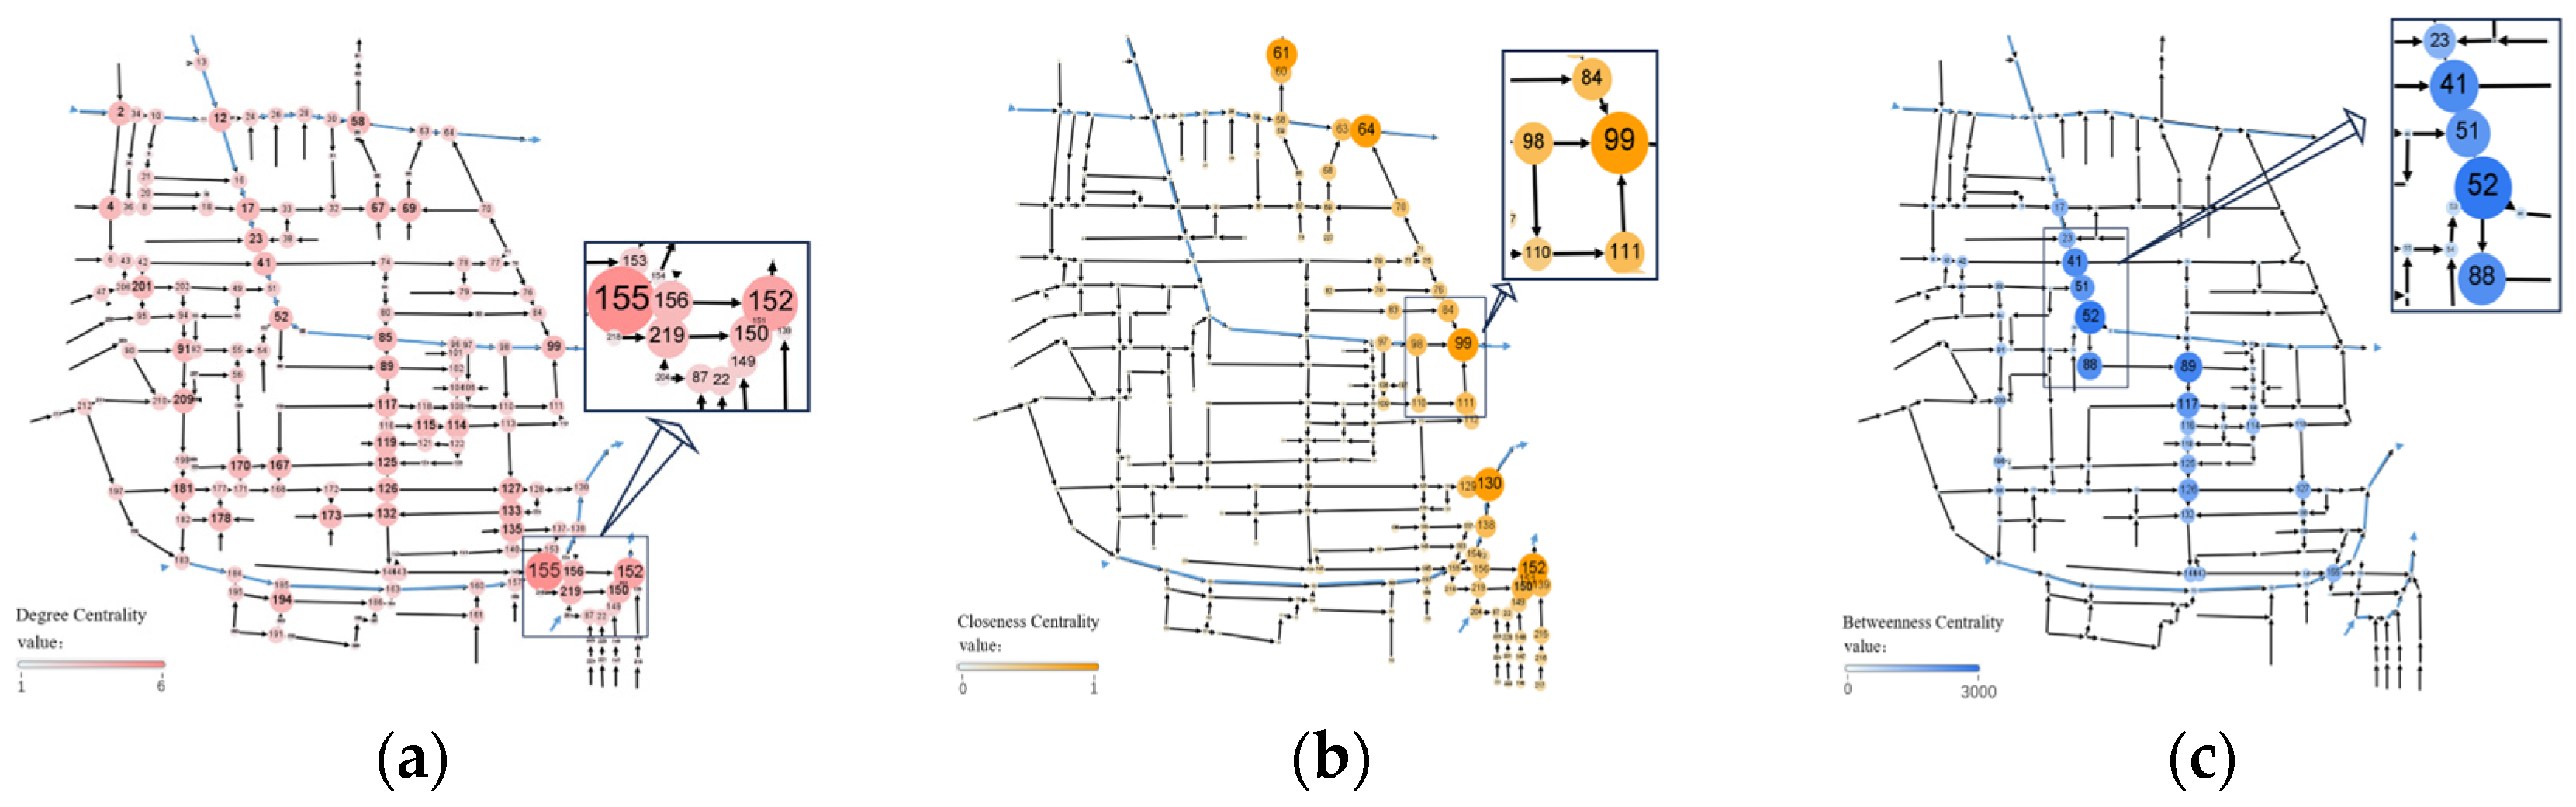
The nodal centrality, closeness centrality, and betweenness centrality of the nodes in the drainage network are calculated using Equations (5)–(7), as illustrated in Figure 8. The distribution maps of the degree centrality, closeness centrality, and betweenness centrality of the nodes are depicted in Figure 9.

Figure 8.
Degree centrality, closeness centrality, and betweenness centrality results.
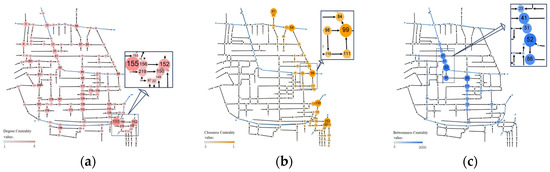
Figure 9.
Degree centrality (a), closeness centrality (b), and betweenness centrality distribution of the node (c).
The nodes of the drainage pipeline network generally have low node centrality, as illustrated in Figure 9a, and the pipeline network system has weak connectivity. The proportion of degree centrality less than 4 is as high as 84% among them, and the majority of these nodes are branch pipeline intersections. The proportion of nodes with a degree centrality value of 4 is a mere 15%, and these nodes are the intersections of branch pipelines and main pipelines (e.g., 156, 219, etc.). The only nodes with a point centrality value of 5 and 6 are nodes 152 and 155, which are critical intersections for the pipeline network into the river. Typically, the nodes with a centrality value of four or higher have a stronger connection, which has a significant impact on the ensuing downstream siltation. Consequently, these nodes should be given significant attention.
As shown in Figure 9b, 62% of the pipeline nodes have a closeness centrality of less than 0.2, and 36% of the nodes with a closeness centrality of between 0.2 and 0.8 are located in the downstream section of the pipeline (nodes 84, 98, etc.). An additional 2% of the nodes (e.g., node 99) have a centrality value that is relatively close to 1. These nodes are typically situated downstream of the chain of pipeline network siltation, which is the point at which the transmission distance to the pipelines of the other connecting nodes is the shortest. They are both river confluence nodes and confluence nodes of multiple pipelines.
As seen in Figure 9c, 78% of the peripheral nodes of the pipeline network have a betweenness centrality of less than 500, 18% of the nodes have a betweenness centrality between 500 and 1500, and individual nodes located in the central part of the study area have a betweenness centrality of more than 2000 (nodes 51 and 52). These nodes are primarily responsible for the transmission of pipeline water flow from the north and south sides of the study area and play a significant role as mediators. Simultaneously, these high-value nodes, as the “way to go” in the network, have a greater impact on other pipeline siltation diseases.
(2) Critical Node Analysis
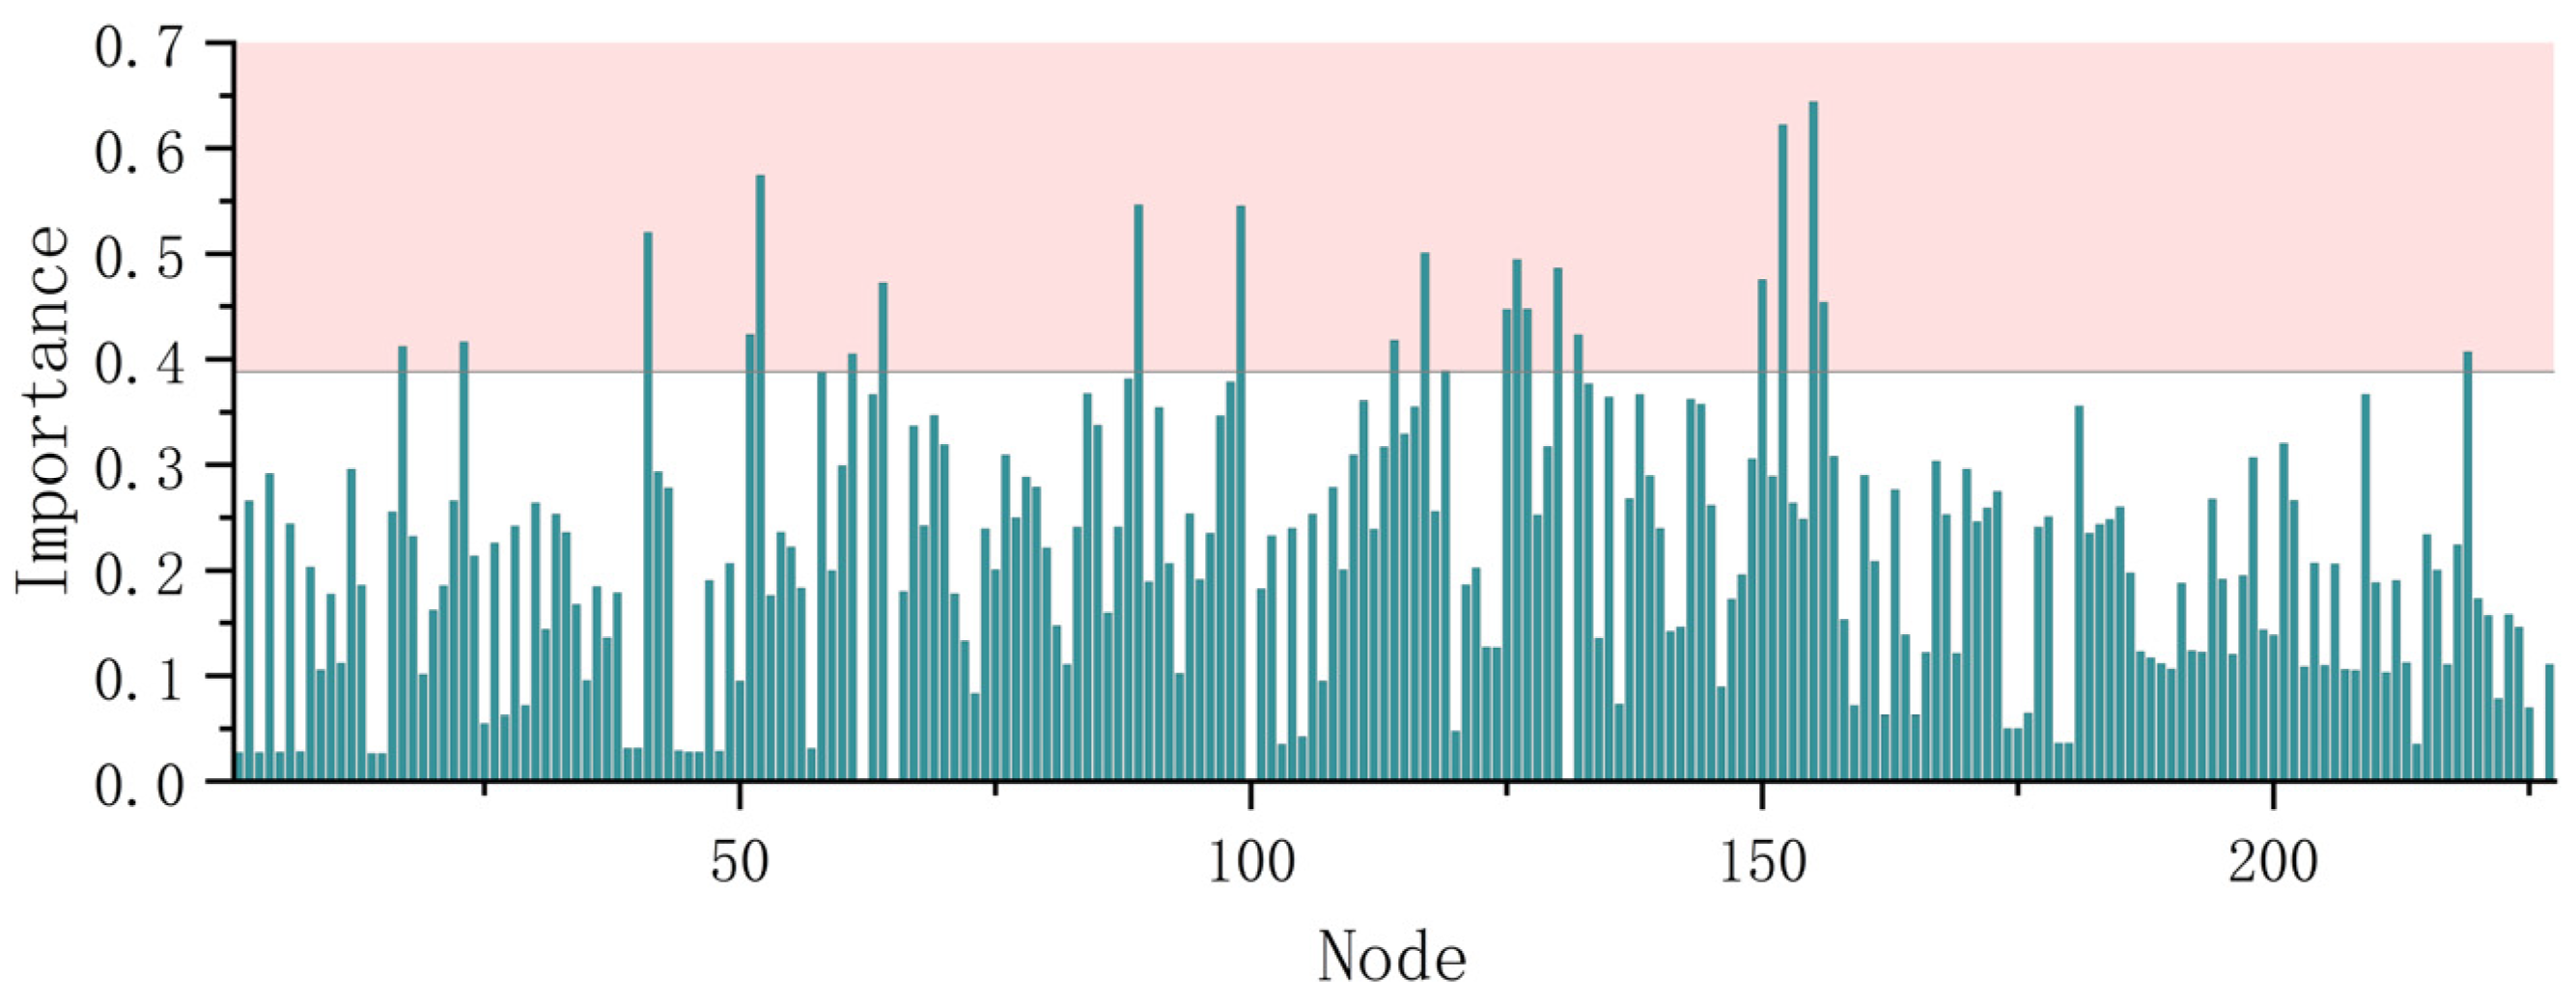
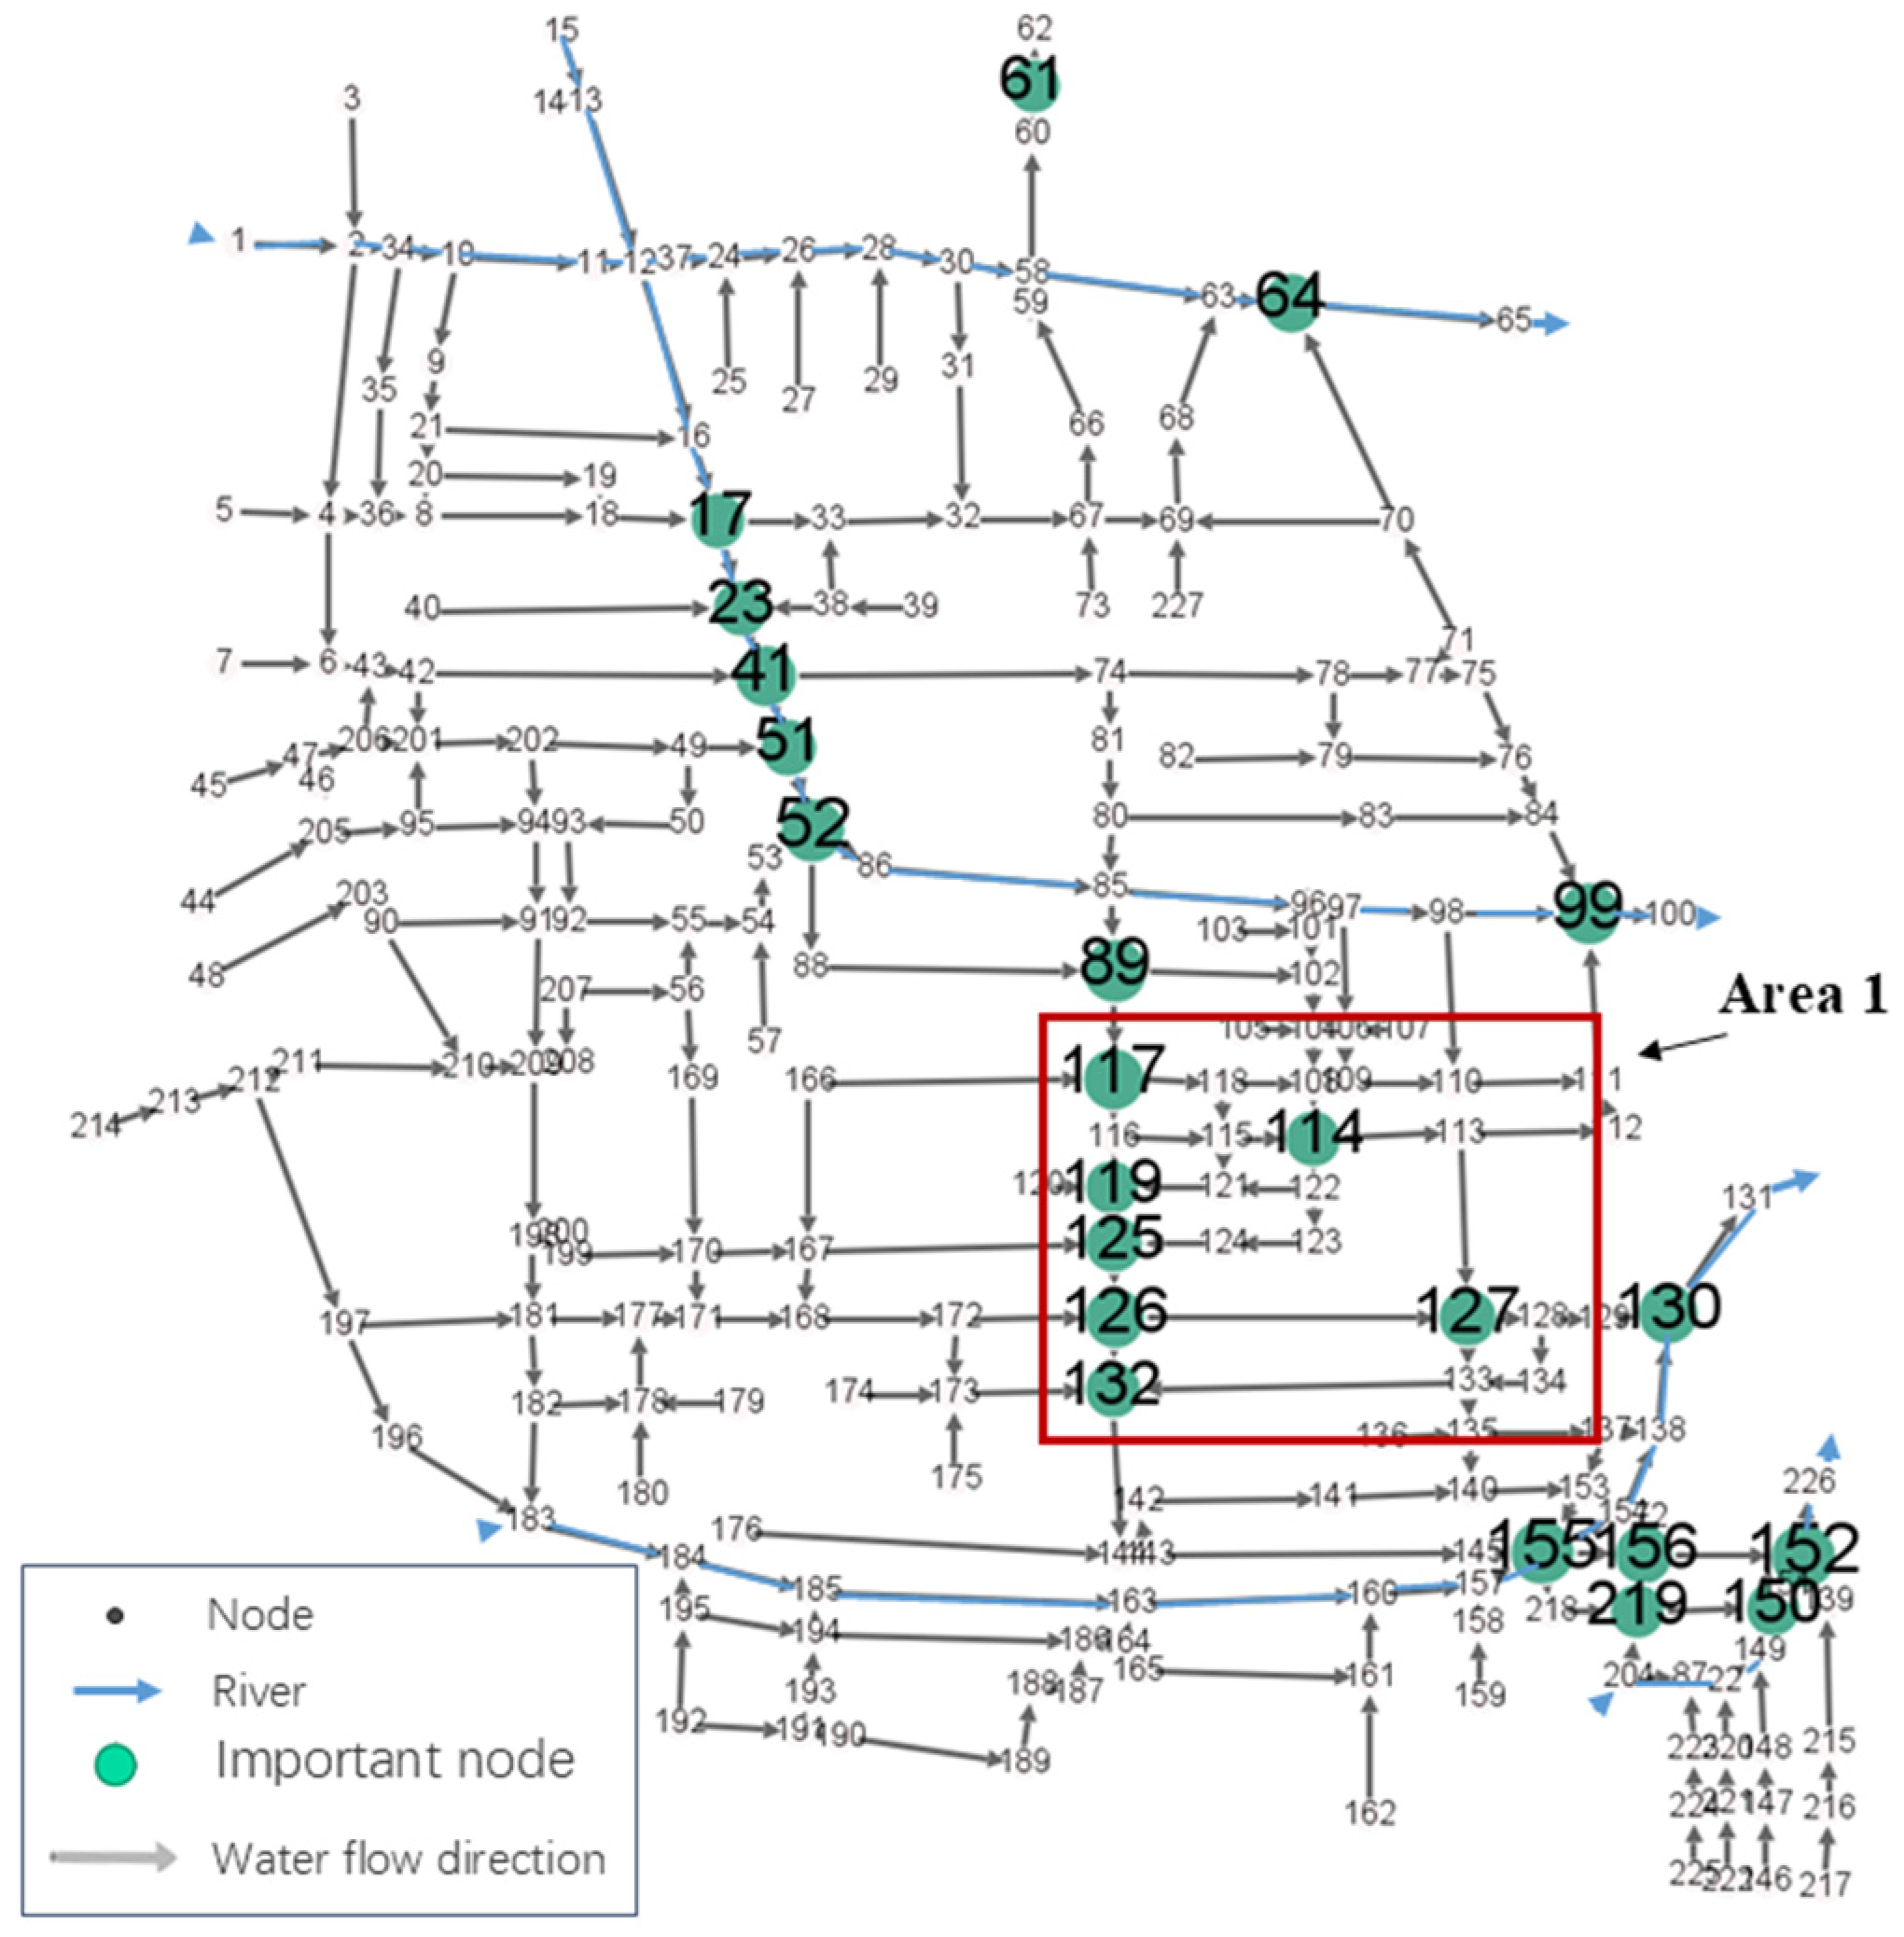
The calculation results of node importance are illustrated in Figure 10. Ten percent of the node importance is designated as the critical nodes of the network; as illustrated in Figure 10, there are 22 critical nodes. Figure 11 illustrates the distribution of critical nodes, while Figure 12 presents their degree centrality, betweenness centrality, and closeness centrality.
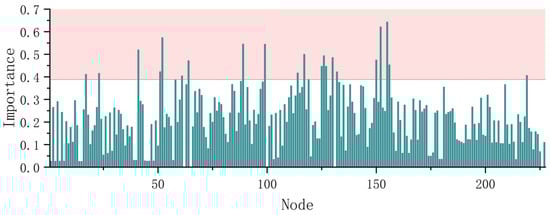
Figure 10.
Results of the node importance calculation.
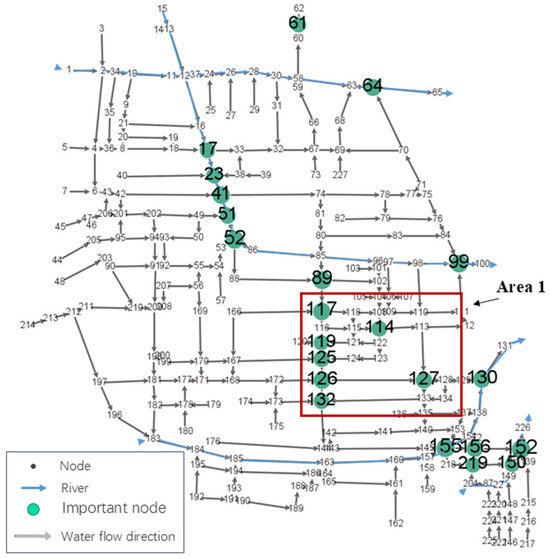
Figure 11.
Critical node distribution.
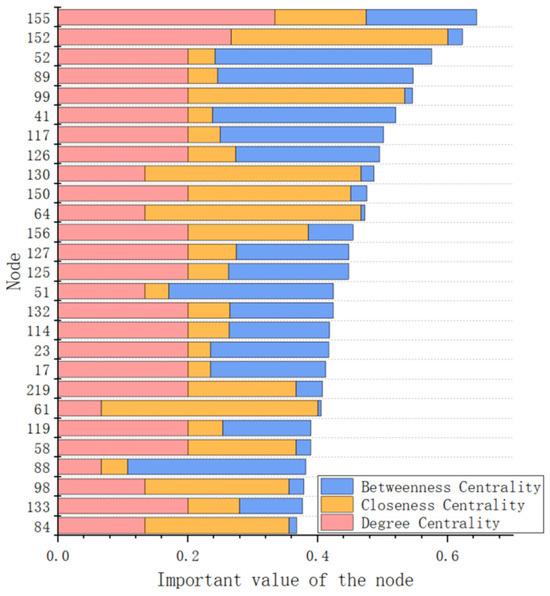
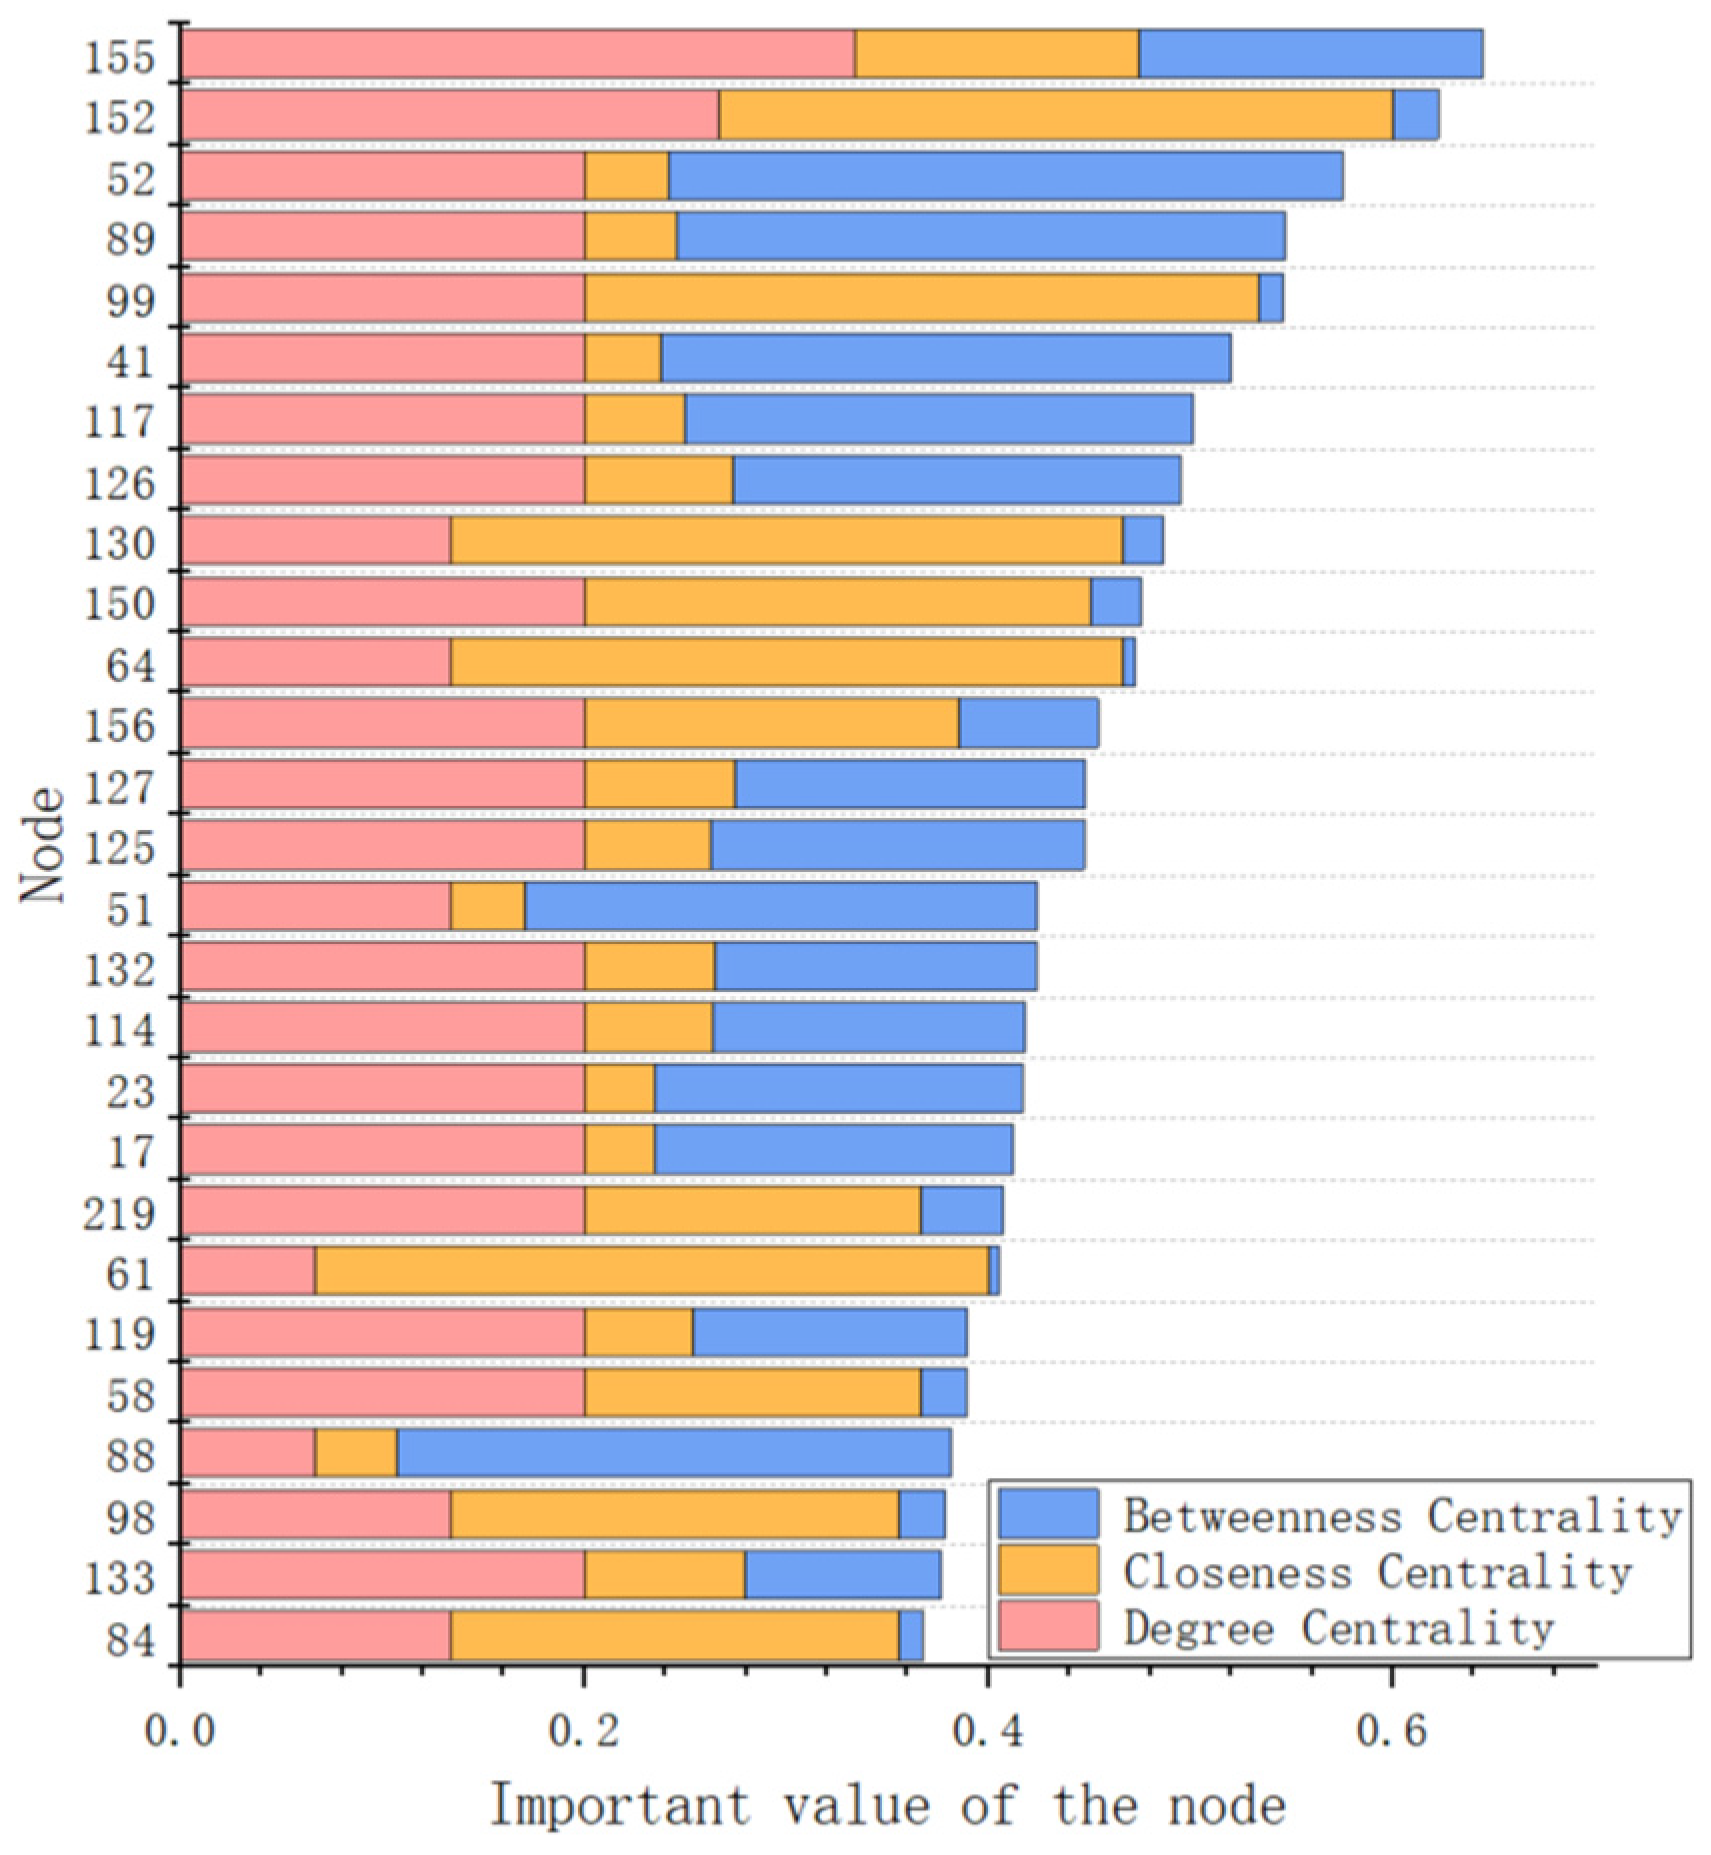
Figure 12.
Node importance of the critical nodes.
Of the 22 critical nodes, seven are situated in the area where the branch pipeline converges with the main pipeline (Area 1), as illustrated in Figure 11. The remaining 15 critical nodes are situated immediately adjacent to the river or drainage discharge. In Area 1, the critical node is primarily responsible for the downstream water discharge. The critical node with the highest importance in this area is 127, with an importance of 0.448. Critical nodes 155 and 152, which are adjacent to the river, exhibit the highest importance and exhibit superior degree centrality, closeness centrality, and betweenness centrality. They are the crucial intersections where the drainage network converges to the river. Concurrently, Figure 12 illustrates that degree centrality and betweenness centrality are the primary determinants of node importance. Only a small number of nodes have closeness centrality contributing to their importance, and the majority of these nodes are situated downstream of the drainage network.
4.3. Nodal Risk Degree Analysis
Figure 13 illustrates the node risk degree calculation results, while Figure 14 illustrates the distribution of node risk degree.
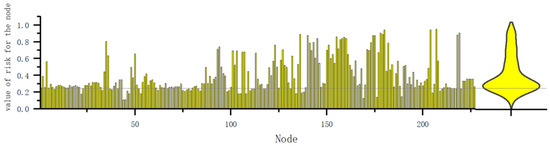
Figure 13.
Nodal Risk Degree.
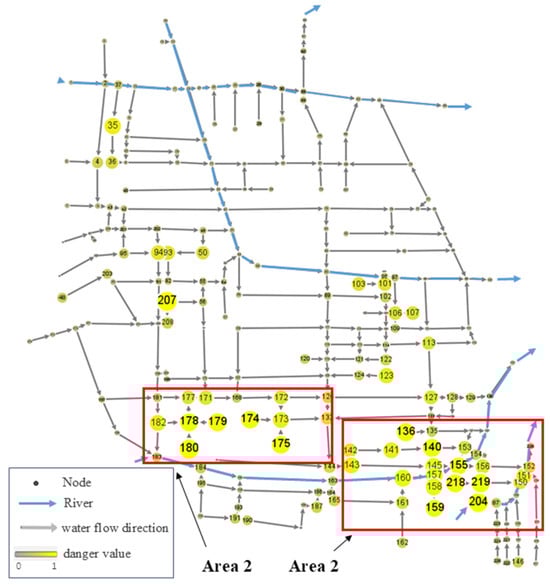
Figure 14.
Risk degree distribution of the nodes.
As shown in Figure 13 and Figure 14, the majority of pipeline network nodes in the northern region of the study area have a risk degree of less than 0.244, which is considered low. The high volume of garbage generated from adjacent streets has resulted in the silting of individual nodes (e.g., 35, 94, etc.). The pipeline network’s intersection area and the vicinity of the river’s confluence are the primary locations of high-risk nodes in the southern region. These nodes exhibit clear high centrality characteristics (Area 1 and Area 2). The node risk is elevated in nodes that are situated near rivers (e.g., 155, 218, 219, etc.), as they typically receive water from multiple pipelines, resulting in the accumulation and expansion of silt. The overall flow path of the network may be significantly impacted if a node malfunctions as a result of severe siltation in the connecting pipeline. Furthermore, nodes such as 178, which serve as transit nodes in the network, accumulate sediment from the upstream nodes 180 and 179, which in turn become nodes with elevated risk values.
4.4. Drainage Network Siltation Chain Risk Analysis
(1) Drainage network siltation chain edge vulnerability and risk of edge
In Figure 15, the distribution of vulnerability of the edge of the siltation chain in the drainage network is illustrated, while Figure 16 illustrates the risk of the edge.
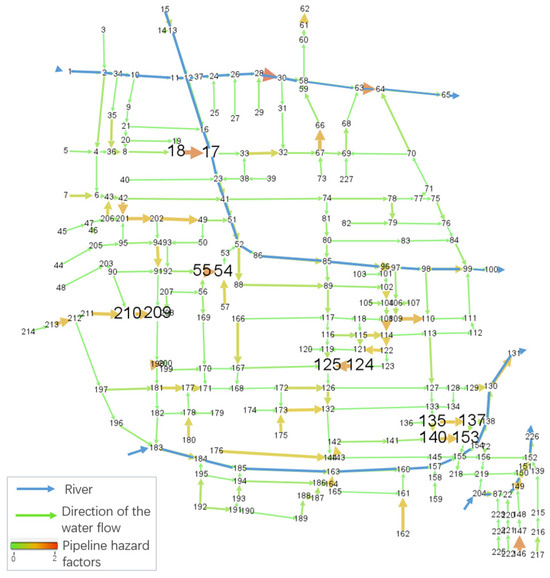
Figure 15.
Edge vulnerability.
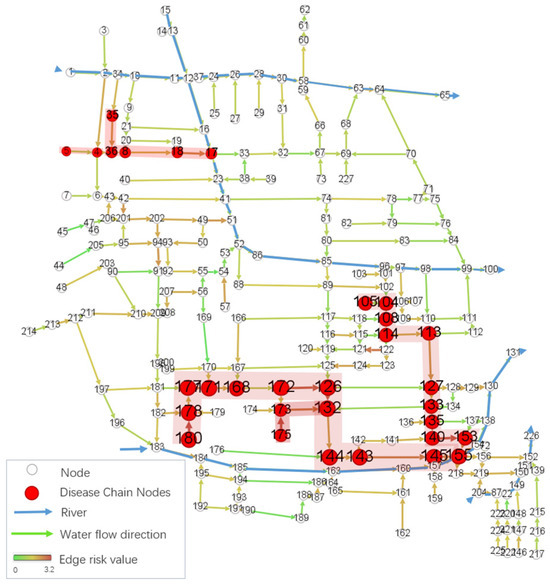
Figure 16.
Risk of the edge and chain path.
As illustrated in Figure 15, the edges with the highest vulnerability (V18→17 and V135→137, among others) are the shortest paths between the nodes of the drainage pipeline network in the siltation chain. This is advantageous for the rapid discharge of pipeline water flow. As a result, the drainage capacity of the upstream pipelines of the corresponding nodes will be significantly impacted if siltation occurs in these pipelines. This will result in the extension of the rainwater discharge path, which in turn will increase the pressure on other drainage pipelines.
As illustrated in Figure 16, the risk degree of the siltation chain edges of the drainage pipeline network progressively increases from the pipelines farther away from the river toward the river. The high-risk edges are situated in the main pipelines downstream of the drainage network, where they are highly vulnerable, due to the accumulation of silt in the pipelines as a result of long-term confluence. The lower-risk edges are primarily distributed in the branch pipelines, with some of them (e.g., side V148→145) having high-risk factors that contribute to the elevated risk of these edges. In addition, the high risk associated with individual branch pipelines (e.g., edges V180→178, V175→173, etc.) is a result of the centrality of the node and the high-risk factors associated with the pipeline.
(2) Drainage network siltation chain risk
Based on the risk of pipeline risk factor, degree centrality, and the risk degree of pipeline siltation chain edge, the risk of each chain in the drainage network can be determined. The risk degree of the top five chains is illustrated in Figure 16 and Table 1.

Table 1.
Siltation chain risk.
As demonstrated by Figure 16 and Table 1, the risk degree of the siltation chain is 12.09, and node 180 to node 155 have an extended propagation path and a higher risk value. Among them, the increased risk of edge V180→178 suggests that siltation has a clear chain reaction of propagation to the downstream area, resulting in the progressive exacerbation of siltation problems at the nodes along the way. The siltation of the intermediate and downstream nodes in the chain (e.g., 126, 132, 155) poses a further threat to the normal operation of the drainage system, as they are the critical nodes of the network. A siltation chain with a high-risk value is formed by the nodes from node 105 to node 155, and is ranked second in terms of risk. In particular, the only connecting conduit from the upstream area to the downstream area is V131→127, which is a vulnerable area of the network and has a high-risk value. A broader drainage failure may result if silting occurs in the pipeline on this side. Furthermore, despite the low risk of certain siltation chains between nodes, there is a substantial risk transfer from a single pipeline, such as node 94 to node 91 and node 129 to node 130. Siltation chain pipelines that are connected by such nodes may be susceptible to localized siltation as a result of human activities, such as the generation of more quantities of less readily flushable trash or sediment buildup with a slower water flow rate.
5. Discussion
This study employs complex network theory to evaluate the siltation chain in urban drainage pipeline networks, constructing a comprehensive model based on pipeline risk factors, degree centrality, and edge vulnerability.
The following insights and contributions highlight the significance of the model. First, by integrating actual siltation data and influencing factors, the study provides a systematic evaluation of pipeline network risk. The results reveal that 66.55% of the pipelines meet dredging standards, indicating a generally low overall risk level. However, the necessity for dredging persists to prevent potential risks. Unlike traditional methods, this approach effectively addresses limitations in accounting for environmental impacts on pipelines; Figure 14, Figure 15 and Figure 16 indicate that secondary pipelines with high levels of siltation exhibit a greater propagation risk, and that the siltation propagates in the direction of the water flow—namely, from secondary branches to main pipelines. Therefore, this approach offers a more precise identification of risks associated with silt transfer to downstream sections. Secondly, the research prioritizes critical nodes within the siltation chain, particularly multi-branch intersections (e.g., node 178) and river-entry nodes (e.g., node 155). These nodes exhibit significantly higher risk values and serve as critical nodes for silt transmission and accumulation. Proactive siltation management at these nodes is essential to mitigate further propagation and systemic chain reactions. Third, a novel aspect of the study is the quantitative ranking of high-risk pathways, identifying core areas and key propagation paths critical to the drainage network’s stable operation. The significance of this path may be attributed to the fact that critical paths are typically located in the main drainage pipelines or confluence areas, where water from multiple branch pipelines converges. This convergence results in reduced flow velocity in certain sections, leading to sediment accumulation. Additionally, these areas are often associated with high population density, where waste from surrounding residential areas (such as plastic bags and food scraps) can easily enter the drainage system and mix with sediment, forming more persistent and stubborn deposits. For example, the edge V180→V178 is identified as the primary propagation pathway of the disease chain due to its high pipeline risk factor and vulnerability, while pipelines with lower risk factors (such as V214→V213) indicate less sediment accumulation and, consequently, a lower risk of siltation propagation. Therefore, this quantitative analysis not only provides a scientific basis for prioritizing dredging but also offers a clear direction for the long-term maintenance and optimization strategies of the drainage system.
This study surpasses prior investigations by shifting from static, localized analyses to a dynamic, network-wide perspective. Unlike studies focusing solely on individual drainage failures, the proposed model captures the dynamic propagation paths and chain reactions of siltation disease across critical areas. By quantifying edge vulnerability and degree centrality, the model offers deeper insights into the systemic impact of siltation, enabling more effective disaster prevention and control measures. While the model demonstrates its utility in static data analysis, future enhancements could integrate real-time hydrodynamic models or monitoring systems for critical nodes to align with dynamic factors such as climate variability and rainfall intensity. This would further enhance the model’s applicability to real-world scenarios.
Based on the environmental and design factors discussed above, the following mechanisms may govern siltation propagation in drainage networks: Branch pipelines, due to lower flow velocities and higher sediment inputs, tend to experience siltation first. This reduced conveyance capacity can lead to a downstream transfer of sediments, progressively increasing the siltation risk at the main channels and critical nodes; Seasonal changes in rainfall and land use may alter flow conditions within the network. For instance, while intense rainfall can temporarily mitigate siltation by flushing sediments downstream, the subsequent reduction in flow velocity can lead to renewed sediment deposition in previously affected areas, creating new risk points. In conclusion, the complex network approach presented in this study provides an innovative and efficient framework for risk assessment and siltation diagnosis in drainage networks. By accurately identifying critical nodes and high-risk pathways, the study offers practical guidance for optimizing maintenance strategies and improving the resilience of urban drainage systems.
6. Conclusions
The drainage network’s siltation chain was systematically analyzed in this study using complex network theory. The findings of the investigation indicate the following:
(1) The aggregate pipeline siltation rate and pipeline risk factor of the 287 drainage pipelines in the study area are negligible, with the southern downstream outlet being the primary location of high siltation rate and high pipeline risk factor. Dredging is still necessary, despite the fact that the drainage network in the study location has a low overall risk level (0.275 > 0.244).
(2) A combination of degree centrality, closeness centrality, and betweenness centrality determines the importance of the nodes in the drainage network. The drainage network siltation disease system comprises 22 critical nodes. These nodes (e.g., 155, 152, 126, etc.) are primarily situated at the intersections of major pipelines or rivers. Additionally, they are considered high-risk and should be prioritized for de-silting and maintenance.
(3) The incremental propagation of upstream pipeline siltation downstream is a manifestation of the chain propagation effect of siltation chains in drainage networks, which exacerbates the risk of siltation and downstream pipeline loading. The siltation chain typically commences at the node with the highest risk and progresses through the high-risk region of the network, concluding at the river inlet. For instance, the risk from node “180→155” is the highest, at 12.09. Siltation at these nodes poses a safety threat to the seamless operation of the drainage network as a whole, as the downstream nodes of the siltation chain frequently assume the role of the confluence of multiple pipelines.
(4) This study offers the following recommendations for the drainage network of Zhengzhou: (a) Targeted maintenance and dredging at high-risk nodes: based on our findings, it is recommended that Zhengzhou prioritize regular monitoring and dredging of critical nodes and high-risk propagation pathways to prevent further deterioration. (b) Establish a real-time monitoring system: Installing sensors at key pipeline segments and convergence points to continuously monitor siltation and flow conditions will enable timely alerts and adaptive maintenance strategies. (c) Develop a comprehensive risk management framework: Combining various data sources and monitoring results to build an integrated risk management system that includes early warning, maintenance, and renovation strategies will enhance the overall resilience and stability of the drainage system.
Author Contributions
J.Z. and Y.W.: Conceptualization, Formal analysis, Funding acquisition, Investigation, Methodology, Project administration, Supervision, Validation, Visualization, Writing—original draft, Writing—review and editing. L.Z.: Data curation, Formal analysis, Investigation, Methodology, Software, Validation, Visualization. X.Z. and Y.Y.: Software, Visualization, Data curation, Methodology. J.Z.: Funding acquisition, Project administration, Resources. All authors have read and agreed to the published version of the manuscript.
Funding
This research was funded by the National Natural Sciences Foundation of China (Grant No. 52379028), and the Natural Science Foundation of Henan (Grant No. 242300421007).
Data Availability Statement
Data will be made available on request.
Conflicts of Interest
The authors declare that they have no known competing financial interests or personal relationships that could have appeared to influence the work reported in this paper.
References
- Huang, R.; Tao, Z.; Lin, Y.; Wei, J.; Zhou, W.; He, Y. Current Situation of Drainage Pipe Network in China and its Detection Technology: A Brief Review. Pol. J. Environ. Stud. 2023, 33, 19–29. [Google Scholar]
- Lyu, F.Z.; Xu, Z.W.; Ma, X.L.; Wang, S.H.; Li, Z.Y.; Wang, S.W. A vector-based method for drainage network analysis based on LiDAR data. Comput. Geosci. 2021, 156, 104892. [Google Scholar]
- Lu, J.; Li, F.; Wang, Y. Experience and enlightenment of urban waterlogging disaster prevention in foreign countries. In Proceedings of the E3S Web of Conferences, Avignon, France, 7–9 June 2022; Volume 352, p. 03010. [Google Scholar]
- Tang, Y.F.; Zeng, H.H.; Lei, C.W.; Tan, D.N.; Wang, B.L.; Li, Y.H.; Zhu, Z.Q.; Liang, Y.P. Studies on the Integration of Geographic Information System (GIS) and Drainage Pipe Network Model. In Proceedings of the International Conference on Advanced Design and Manufacturing Engineering (ADME 2011), Guangzhou, China, 16–18 September 2011; pp. 1749–1754. [Google Scholar]
- Liu, Y.; Zhao, W.G.; Wei, Y.X.; Sebastian, F.S.M.; Wang, M.N. Urban waterlogging control: A novel method to urban drainage pipes reconstruction, systematic and automated. J. Clean. Prod. 2023, 418, 137950. [Google Scholar]
- Lu, J.H.; Liu, J.H.; Fu, X.R.; Wang, J. Stormwater hydrographs simulated for different structures of urban drainage network: Dendritic and looped sewer networks. Urban Water J. 2021, 18, 522–529. [Google Scholar]
- Ren, H.C.; Liu, S.; Li, M.; Zhang, H.P.; Wang, H.Y.; Hao, X.L.; Cui, J. Topological Analysis and Application of Urban Drainage Network. Water 2022, 14, 3732. [Google Scholar] [CrossRef]
- Di, D.Y.; Wang, R.Y.; Fang, H.Y.; Shi, M.S.; Sun, B.; Wang, N.N.; Li, B. High-resolution analysis of hydraulic response characteristics of silted stormwater pipeline and manholes in urban catchments using GASM-TranGRU and CFD-DEM. Eng. Appl. Comput. Fluid Mech. 2025, 19, 2447389. [Google Scholar]
- Wang, R.Y.; Di, D.Y.; Fang, H.Y.; Li, B.; Shi, M.S.; Wang, N.N.; Zhang, T.L.; Li, T.W.; Zhang, Z.Y. Response characteristics of siltation flow in urban rainwater pipelines using computational methods. Phys. Fluids 2025, 37, 017113. [Google Scholar]
- Liao, Z.L.; Gu, X.Y.; Xie, J.Q.; Wang, X.; Chen, J.X. An integrated assessment of drainage system reconstruction based on a drainage network model. Environ. Sci. Pollut. Res. 2019, 26, 26563–26576. [Google Scholar] [CrossRef]
- Gallardo, A.; Sánchez, L.E. Follow-up of a road building scheme in a fragile environment. Environ. Impact Assess. Rev. 2004, 24, 47–58. [Google Scholar]
- Wang, J.; Li, Y.; Lai, Z.; Zhao, L.; Wang, Z. Study on the Motion Characteristics of Particles Transported by a Horizontal Pipeline in Heterogeneous Flow. Water 2022, 14, 3177. [Google Scholar] [CrossRef]
- Liu, W.L.; Shao, Y.X.; Chen, K.; Li, C.; Luo, H.B. Whale optimization algorithm-based point cloud data processing method for sewer pipeline inspection. Autom. Constr. 2022, 141, 104423. [Google Scholar]
- Liu, Y.Z.; Zhang, W.T.; Cui, X.M.; Zhang, T. The Study on Hydraulic Calculation for Drainage of Urban Waterlogging. Disaster Adv. 2013, 6, 222–225. [Google Scholar]
- Qi, D.; Bi, H.; Zeng, H.; Shen, Y.; Wang, Z. Research on Sediment Laden Flow Characteristics in Water Conveyance System. In IOP Conference Series: Earth and Environmental Science; IOP Publishing: Bristol, UK, 2022; p. 012047. [Google Scholar]
- Fang, H.; Zhang, Z.; Di, D.; Zhang, J.; Sun, B.; Wang, N.; Li, B. Integrating fluid–solid coupling domain knowledge with deep learning models: An automatic and interpretable diagnostic system for the silting disease of drainage pipelines. Tunn. Undergr. Space Technol. 2023, 142, 105386. [Google Scholar]
- Wang, H.; Lai, Q.; Yang, B. Urban Rainstorm Waterlogging Simulation Based on 1D/2D Bidirectional Coupling. In Proceedings of the ICSCIS ‘24: Proceedings of the 2024 International Conference on Smart City and Information System, Kuala Lumpur, Malaysia, 17–19 May 2024; pp. 345–350. [Google Scholar]
- Lv, J.; Hou, J.; Shen, R.; Li, D.; Guo, M.; Chen, G.; Guan, B.; Huang, M. Experimental study of rainwater grate blocking and submergence of outfall on drainage network capacity. J. Environ. Manag. 2024, 356, 120624. [Google Scholar]
- Chen, Z.; Huang, G. Numerical simulation study on the effect of underground drainage pipe network in typical urban flood. J. Hydrol. 2024, 638, 131481. [Google Scholar]
- Di, D.; Wang, R.; Li, T.; Zhu, D.; Zhang, Z. Design and Implementation of the Intelligent Management System of Drainage Pipe Network based on WSNs and MGRF-GBDT-AdaBoost. In Proceedings of the 2023 4th International Conference on Intelligent Design (ICID), Xi’an, China, 20–22 October 2023; pp. 1–6. [Google Scholar]
- Shi, J.; Di, D.; Yu, H. A Siltation Diagnosis Method for Underground Drainage Pipelines Based on Multi-Source Data Fusion and MLSTM-SVM. In Proceedings of the 2024 5th International Seminar on Artificial Intelligence, Networking and Information Technology (AINIT), Nanjing, China, 29–31 March 2024; pp. 2271–2275. [Google Scholar]
- Shen, Y.Q.; Jia, X.M.; Lv, M.C.; Wang, Y.Y.; Zhang, W.Z.; Qin, J.T. Initial Experimental Investigation of Hydraulic Characteristics at Right-Angle Diversion in a Combined Canal and Pipe Water Conveyance System. Water 2024, 16, 3174. [Google Scholar] [CrossRef]
- Cyrus, D.P.; MacKay, C.F.; Weerts, S.P. Intrusion of beach-disposed dredger spoil into the Mhlathuze Estuary, South Africa, and its impact on <Zostera capensis>. Afr. J. Aquat. Sci. 2008, 33, 223–231. [Google Scholar]
- Kratt, C.B.; Woo, D.K.; Johnson, K.N.; Haagsma, M.; Kumar, P.; Selker, J.; Tyler, S. Field trials to detect drainage pipe networks using thermal and RGB data from unmanned aircraft. Agric. Water Manag. 2020, 229, 105895. [Google Scholar]
- Hooshyar, M.; Singh, A.; Wang, D.B. Interbasin and Intrabasin Competitions Control Drainage Network Density. Geophys. Res. Lett. 2019, 46, 661–669. [Google Scholar]
- Nyreen, C.H.; Koivusalo, H.; Sørup, H.J.D. A model-based analysis for trapping suspended sediment in stormwater inlets of urban drainage network. J. Environ. Manag. 2024, 366, 121756. [Google Scholar]
- Sockness, B.G.; Gran, K.B. An experimental study of drainage network development by surface and subsurface flow in low-gradient landscapes. Earth Surf. Dynam. 2022, 10, 581–603. [Google Scholar]
- Howard, A.D. Theoretical-model of optimal drainage networks. Water Resour. Res. 1990, 26, 2107–2117. [Google Scholar]
- Reyes-Silva, J.D.; Zischg, J.; Klinkhamer, C.; Rao, P.S.C.; Sitzenfrei, R.; Krebs, P. Centrality and shortest path length measures for the functional analysis of urban drainage networks. Appl. Netw. Sci. 2020, 5, 1. [Google Scholar]
- Jarvis, R.S.; Sham, C.H. Drainage network structure and the diameter-magnitude relation. Water Resour. Res. 1981, 17, 1019–1027. [Google Scholar]
- Alalwan, N.; Arenas, A.; Estrada, E. “Melting” of complex networks. A mathematical model of complex networks resilience to external stress. Appl. Math. Comput. 2019, 362, 124579. [Google Scholar]
- Fathy, I.; Abdel-Aal, G.M.; Fahmy, M.R.; Fathy, A.; Zeleňáková, M. The Negative Impact of Blockage on Storm Water Drainage Network. Water 2020, 12, 1974. [Google Scholar] [CrossRef]
- Ye, H.; Li, Z.; Li, G.; Liu, Y. Topology Analysis of Natural Gas Pipeline Networks Based on Complex Network Theory. Energies 2022, 15, 3864. [Google Scholar] [CrossRef]
- Simone, A.; Cesaro, A.; Del Giudice, G.; Di Cristo, C.; Fecarotta, O. Potentialities of Complex Network Theory Tools for Urban Drainage Networks Analysis. Water Resour. Res. 2022, 58, e2022WR032277. [Google Scholar]
- Chen, H.Y.; Zhang, L.M.; Ran, L.Y. Vulnerability modeling and assessment in urban transit systems considering disaster chains: A weighted complex network approach. Int. J. Disaster Risk Reduct. 2021, 54, 102033. [Google Scholar]
- Guo, H.-X.; He, X.-Y.; Lv, X.-B.; Wu, Y. Risk analysis of rainstorm-urban lifeline system disaster chain based on the PageRank-risk matrix and complex network. Nat. Hazards 2024, 120, 10583–10606. [Google Scholar]
- D’Souza, R.M.; di Bernardo, M.; Liu, Y.-Y. Controlling complex networks with complex nodes. Nat. Rev. Phys. 2023, 5, 250–262. [Google Scholar]
- Pizzuti, C.; Socievole, A. Computation in Complex Networks. Entropy 2021, 23, 192. [Google Scholar] [CrossRef] [PubMed]
- Li, J.; Chen, C. Modeling the dynamics of disaster evolution along causality networks with cycle chains. Phys. A Stat. Mech. Its Appl. 2014, 401, 251–264. [Google Scholar]
- Liu, Y.; Zhang, S.; Su, H.; Wang, D.; Gu, Q. Modelling and Application of Urban Drainage Based on Mike Urban Model. In IOP Conference Series: Earth and Environmental Science; IOP Publishing: Bristol, UK, 2020; Volume 474. [Google Scholar]
- Yu, X.Y.; Wu, K.J.; Yang, Y.; Liu, Q. WaRENet: A Novel UrbanWaterlogging Risk Evaluation Network. ACM Trans. Multimed. Comput. Commun. Appl. 2024, 20, 1–28. [Google Scholar]


Disclaimer/Publisher’s Note: The statements, opinions and data contained in all publications are solely those of the individual author(s) and contributor(s) and not of MDPI and/or the editor(s). MDPI and/or the editor(s) disclaim responsibility for any injury to people or property resulting from any ideas, methods, instructions or products referred to in the content. |
© 2025 by the authors. Licensee MDPI, Basel, Switzerland. This article is an open access article distributed under the terms and conditions of the Creative Commons Attribution (CC BY) license (https://creativecommons.org/licenses/by/4.0/).