Article

Pesticide Mobility in Surface and Subsurface Irrigation Return Flow in a Container Plant Production System

by
Damon E. Abdi
1,†,
James S. Owen, Jr.
2,
P. Christopher Wilson
3,
Francisca O. Hinz
3,
Bert M. Cregg
1 and
R. Thomas Fernandez
1,*
1
Department of Horticulture, Michigan State University, 1066 Bogue St. Room A288, East Lansing, MI 48824, USA
2
Application Technology Research Unit, USDA ARS, 1680 Madison Ave, Wooster, OH 44691, USA
3
Department of Soil, Water, and Ecosystem Sciences, University of Florida, 2181 McCarty Hall, Gainesville, FL 32611, USA
*
Author to whom correspondence should be addressed.
Current address: Hammond Research Station, Louisiana State University, 21549 Old Covington Hwy, Hammond, LA 70403, USA.
Water 2025, 17(7), 953; https://doi.org/10.3390/w17070953
Submission received: 19 February 2025 / Revised: 18 March 2025 / Accepted: 21 March 2025 / Published: 25 March 2025
(This article belongs to the Special Issue Non-Point Source Pollution and Water Resource Protection)

Abstract

:
The objectives of this study were to determine the effects of irrigation method on the movement of 10 commonly used pesticides in container nursery production. Pesticide transport under three irrigation methods at a nursery engineered to collect irrigation return flow (IRF) from the production surface and subsurface was determined. Pesticide applications occurred three times throughout the study, followed by a 16-day monitoring period. The irrigation applied and surface and subsurface IRF volumes generated from single irrigation events were measured and subsamples of the IRF water were analyzed to assess pesticide presence. Overhead irrigation served as the control with two microirrigation treatments, one applying a fixed amount of water each day and the other scheduled using substrate moisture sensors. Microirrigation reduced irrigation volume by >75% and surface IRF by up to 100%. Subsurface IRF was similarly reduced by microirrigation, yielding 23–47% lower volumes. Pesticides with greater solubilities and lower adsorption coefficients were more mobile than the inversely characterized compounds, particularly in subsurface IRF. The least soluble pesticides had a reduced presence in surface and, to a larger extent, subsurface IRF. Reductions or elimination of surface IRF by using microirrigation reduced the transport of all pesticides by >90%. Pesticides that had a higher solubility were found in subsurface IRF regardless of irrigation method. This study demonstrates the importance of both the irrigation delivery method and pesticide physiochemical properties on the environmental fate of pesticides in nursery settings. Microirrigation can reduce and often eliminate surface IRF, limiting the movement of pesticides regardless of physiochemical properties; whereas, the selection of pesticides that are less soluble can be an effective way to limit the subsurface movement of pesticides, regardless of irrigation method.

1. Introduction

The environmental fate of agricultural chemicals is of global concern, with sectors of agriculture that intensively utilize pesticides elevating the risk of agrochemical movement in the environment. The nursery production of container crops demands routine water, fertilizer, and pesticide applications to produce a market-quality crop [1]. Pesticide applications are a common practice to support the vitality and visual quality of a plant by maintaining a pest and disease-free plant. Pesticide applications often occur multiple times per year to provide seasonal protection against a host of weeds, diseases, and pests. Spraying pesticides onto container crops covers the entire production area, providing the pesticide to the plant and the substrate surface where it can directly protect the crop, as well as to the space separating the containers. Pesticides degrade on-site through a variety of biotic and abiotic pathways. Light-induced degradation, microbial digestion, and volatilizing are common mechanisms of breakdown; however, water serves as a prominent vector in the mobility of pesticides on-farm and downstream [1,2,3]. Pesticides span a spectrum of physiochemical properties, with water solubility, adsorption characteristics, and vapor pressure influencing the mobility and fate of each pesticide [4]. Pesticides that have greater solubility and lower adsorption coefficients are indeed likely to dissolve in water; while pesticides with the inverse characteristics (low solubility in water or high sorption coefficients) would be more likely to bind to soils and/or organic materials. While movement in a dissolved form may not be a primary concern for these compounds, erosion and the subsequent transport of soil-bound pesticides may create similar issues [3]. Pesticide loss creates ecological concerns with the unintentional downstream fate of applied chemicals, and economic consequences with unrealized investment in crop protection being washed away. Pesticide movement in water may be facilitated by either precipitation-induced runoff or by irrigation-induced runoff (otherwise known as irrigation return flow, or IRF). Surface IRF represents water that does not infiltrate through the production surface, instead moving laterally towards a discharge point. Subsurface IRF encompasses water that infiltrates and percolates through production surfaces. Both surface and subsurface IRF can contribute to contamination in water resources and may carry contaminant residues in sufficient concentrations and quantities to pose toxic effects on biotic life downstream. Furthermore, the IRF-initiated removal of pesticides from a production site bears economic implications for producers, as the removal of applied agrochemicals may increase crop susceptibility to pests and disease.
The advantages of container crop production include the enhanced homogeneity of growing conditions, the more accessible handling of nursery stock, improved production efficiency, and the more rapid growth and development of the crop [5,6]. However, several unique challenges and considerations are presented when growing container crops, including the selection of proper container dimensions and volumes, providing adequate spacing for crop growth and development; the hydraulic characteristics of the substrate; and routine irrigation. Overhead irrigation is the most common mechanism of applying water in container crop production; however, the majority of the water applied (74–87%) lands in the space between containers and directly contributes to IRF [7,8,9]. The inefficiencies endemic to using overhead irrigation can generate substantial volumes of IRF, and the concomitant transport of agrochemicals [1,6,10,11,12]. More efficient methods of irrigating container crops include microirrigation practices that supply water directly to the crop. Technologies such as substrate moisture sensors may be used to apply irrigation water with more precision and can be incorporated across a spectrum of irrigation application methods [13,14].
This study investigated the concentration and load exported of ten common pesticides in both surface and subsurface IRF within a multi-taxa experimental nursery when plants are irrigated using either overhead or microirrigation methods. Microirrigation was chosen to provide irrigation directly to the container substrate, thus minimizing the washing-off of pesticide residues from the plant canopy and inter-container spacing. The ten pesticides were selected based on their prominent use in nursery production and the representative variability in physiochemical properties between compounds. While the movement of agrochemicals has been investigated in nursery production [10,11,12,13] and field soils [15,16], this study provides unique insights into the mobility of pesticides in an experimental nursery that enables the complete collection of both surface and subsurface irrigation return flow. This facilitates the assessment of both concentration and load and provides insights into agrochemical movement directly from a nursery production site, rather than at a downstream collection location such as on-site ponds [17] or following movement through constructed waterways (such as the gravel/clay berms or turfgrass plots in [10]). Furthermore, the partitioning of pesticide residues between both surface and subsurface IRF provides unique insights into subsurface pesticide mobility, whereas surface IRF has been more intensively investigated [9,11,12]. While the impacts of precipitation were excluded in other pesticide movement research [18], this study sought to consider the impacts of local weather effects. This research seeks to address existing knowledge gaps by (1) quantifying pesticide movement in terms of concentration and load through the complete collection of surface and subsurface IRF, rather than solely surface IRF, (2) collecting IRF directly from production areas without interference from intermediate drainage pathways and/or retention basins, (3) using a homogenized subsurface sand horizon free of clay particles to mitigate sorption effects, and (4) exposure to representative environmental conditions (i.e., precipitation was not excluded). To the knowledge of the authors, research of this nature has been limited to the Abdi et al. [2,19] studies utilizing the same experimental nursery in a different year with different irrigation, pesticide, and management treatments.
Knowing that microirrigation would reduce the volume of water applied, we hypothesized that it would subsequently reduce the volume of IRF, especially surface IRF, as water would not be applied to the nursery surface between containers. We hypothesized that surface IRF may be substantially reduced or even eliminated, and that subsurface IRF would similarly be reduced. We hypothesized that pesticides with greater solubility would be more prone to infiltration through the production surface and eventual loss to subsurface IRF, while less soluble pesticides (oftentimes with typically higher sorption coefficients) would primarily remain upon production surfaces and movement would primarily occur via surface IRF. Furthermore, we hypothesized that reducing surface IRF generation would further direct the partitioning of pesticides toward subsurface IRF, where physiochemical properties may inhibit the extent to which infiltration would occur.

2. Materials and Methods

2.1. Research Nursery

In accordance with guidance from the Text Recycling Research Project [20], the authors disclose that this research uses a raised bed research nursery and irrigation system that has been used for earlier research projects, thus there is substantial similarity and some text recycling of materials and methods with the first author’s dissertation [21] and previously published research [2,19]. The raised beds were constructed at the Michigan State University (MSU) Horticulture and Teaching Research Center in Holt, MI, USA (Latitude 42.67 N, Longitude 84.48 W), with sixteen 7.6 m × 7.6 m × 0.6 m (L × W × H) raised beds, arranged in two parallel rectangular blocks (eight each) measuring 61 m × 7.6 m each with the long axis running north to south (Figure S1). The blocks were separated by a 1 m alley. Native soil inside the walls of each individual bed was used for the initial 0.3 m of height and was graded to achieve a 2% slope towards a center swale, funneling water to the edge opposite the alley. A 9.1 m × 9.1 m impermeable ethylene propylene diene monomer pond liner (Firestone Pondgard 45Mil (1.14 mm) Nashville, TN, USA) was placed over the graded soil. Over the top of the pond liner, 0.3 m of washed natural sand, free of clay, with a particle size range of 0.75–9.5 mm was placed and graded in the same manner as the soil sub-base and covered with a black woven polypropylene landscape fabric (De Witt SBLT6300, Sikeston, MO, USA). The sand layer was selected to provide a homogenous soil type for the pesticides to move through, mitigating factors such as clay or organic matter sorptive sites, heterogenous soil moisture gradients, and soil settling/disturbances that can happen in field soils. Bulkhead fittings (Banjo tf150 polypropylene bulkhead tank fitting, Banjo Corp., Crawfordsville, IN, USA) were installed at the low points of the soil sub-base/pond liner and sand/fabric, respectively, and piped to separate 378 L polyethylene tanks (Duracast, manufacturer number 900100-1.2, Lake Wales, FL, USA) via 4.03 cm (inside diameter) schedule 40 polyvinyl chloride pipe for the collection of surface IRF and subsurface IRF. Collection tanks were buried 15 cm below the soil level and anchored in place with concrete. Three irrigation treatments and two fertilizer rates were compared beginning on 17 May 2017 and concluding on 22 September 2017. Precipitation and temperature were recorded throughout the season using an on-site MSU Enviro-weather station [22] (Figure S2).

2.2. Irrigation Monitoring and Control System

Each of the raised beds was fitted with a 150-mesh inline filter (Toro T-ALFS75150-L, Bloomington, MN, USA), a 0.21 MPa pressure reducer (Senninger PRL303F3F, Clermont, FL, USA), a flow meter (Badger Meter 62585-001 model 25, Milwaukee, WI, USA), and two solenoid valves (Rainbird CP075, Asuza, CA, USA). Irrigation was applied via either overhead sprinklers (Toro 961 P-120) or individual container spray stakes (Netafim 22500-002030, flow rate 12.1 Lph, Tel Aviv-Yafo, Israel). Overhead sprinklers were located at the corners of each bed. Spray stake irrigated beds also had a manifold consisting of four 6.1 m sections of polyethylene tubing adjacent to plant rows providing water for the spray stakes and a valve to the overhead sprinklers so that they could be turned on or off as needed.
An irrigation mesh network consisting of substrate volumetric moisture content (θ) sensors and control solenoids connected to wireless relay nodes (model EM50R, METER Group, Inc., Pullman, WA, USA), installed on the western raised beds, was managed via software (Sensorweb, Mayim LLC, Pittsburgh, PA, USA) by a computer-based communication hub installed in the main building of the Horticulture and Teaching Research Center. Four solenoid valves were controlled via DC-powered control nodes (model NC24, METER Group, Inc.). Each bed had one monitoring node and four θ sensors (Model 10HS, Meter Group, Inc.) set to take measurements at 5 min intervals. Sensors were randomly assigned to one plant per taxa per bed and inserted horizontally at an incision made halfway between the top and bottom of the container.

2.3. Irrigation Treatments

An overhead irrigated control was compared to two microirrigation treatments. The overhead control applied 19 mm daily, a common operational practice [23], as a single application beginning at 8:00 A.M. and ending at 9:30 A.M. The two spray stake treatments were operated under a static, daily application rate and a dynamic application rate based on sensor-monitored soil volumetric water content (θ), respectively. The static spray stake treatment applied 2 L per container (SS2Lpd) from 9:30 A.M. to 9:40 A.M. daily. This rate was based on daily application rates of 1.4–1.9 L per #3 container reported by nursery producers in a survey [24]. The sensor-based treatment (SSθ) applied water based on θ with the activation threshold set at 35%, or 6% below the average container capacity (synonymous with field capacity) measured in the containers during project setup (41.1% ± 0.6). The SSθ treatment-applied irrigation was based on the average θ of the four randomly assigned sensors in each bed. Between 9:45 A.M. and 10:15 A.M., up to three 0.8 L cycles (0–2.4 L per day) per container were applied as needed to bring containers back to container capacity. Each 4 min cycle of irrigation was followed by a 6 min intermission to enable water distribution within the substrate and θ readings to reoccur between cycles. The irrigation treatments were randomly assigned to each bed, with three beds serving as the control and receiving overhead irrigation, six beds being used for the SS2Lpd, and six beds for the SSθ treatment. One bed was left to serve as a blank, where 19 mm d−1 of overhead irrigation was applied to a bed without plants.

2.4. Plant Material and Substrate

Each raised bed section (replicate) had a total of 81 plants, split between four taxa, produced in 11.3 L containers (Nursery Supplies, Inc., model C1200, Chambersburg, PA, USA). The taxa used were Cornus obliqua ‘Powell Gardens’, Hydrangea paniculata ‘Limelight’, Physocarpus opulifolius ‘Seward’, and Weigela florida ‘Elvera’ (Spring Meadow Nursery, Grand Haven, MI, USA). Details regarding plant growth and nutrient movement in surface and subsurface return flow from this study are published in Abdi et al. [19]. Briefly, the plants were grouped by species, and the order in which they were placed on the beds was randomly assigned. All containers were spaced 0.3 m from container edge to edge. A composted pine bark substrate, sphagnum peat moss (85:15 v/v), was used (Renewed Earth, Otsego, MI, USA). A controlled-release fertilizer with micronutrients was surface-applied (i.e., top-dressed) at a rate of 38 g to each container (3078 g per bed) the preceding fall on 27 September 2016 (19% nitrogen, 5–6 month longevity, Polyon® Reactive Layers Coating, Harrell’s Inc., Lakeland, FL, USA).

2.5. Pesticide Application and Sampling

A total of 10 pesticides were applied over the course of three monitoring periods. Monitoring periods consisted of 16-day windows, where start dates were selected based on weather forecasts in an attempt to avoid precipitation-induced irrigation return flow, and to allow sufficient time (at least three weeks) for pesticide residual dissipation. The herbicides were applied first (between 7:00 A.M. and 8:00 A.M.), followed by insecticides and fungicides as a tank mix (between 10:00 A.M. and 12:00 P.M.). The pesticides were selected based on their physiochemical properties and common use in nursery production, and were further categorized into three groups based on McCall’s Koc class and FAO mobility classifications (Table 1). The trade name and application rate in g ha−1 applied for all pesticides are included in the tables pesticide load in IRF. The pesticides were applied at the ornamental crop label rate with a wagon-mounted sprayer with a four-nozzle boom, measuring 1.52 m across with a 1.83 m spray width. The herbicides isoxaben, oxyfluorfen, and prodiamine were applied first in each of their respective monitoring periods using nozzles with an 80° angle and 0.76 L min−1 application rate per nozzle (Teejet model 8002, Wheaton, IL, USA). Immediately following application, overhead irrigation was applied per label recommendations, with the control treatment beds receiving their daily 19 mm while the spray stake treatments received the recommended minimum 12.6 mm following isoxaben and prodiamine application, and 6.33 mm after oxyfluorfen.
After the cessation of runoff, the insecticides and fungicides were applied as a tank mix using the same boom with an 80° angle and a 2.27 L min−1 application rate per nozzle (Teejet model 8006). Isoxaben, acephate, bifenthrin, and mefenoxam were applied in the first monitoring period beginning on 27 June 2017. The second application of pesticides was on 7 August 2017, consisting of oxyfluorfen, chlorpyrifos, and triflumizole. Also, during this monitoring period, glyphosate was applied via a backpack sprayer in equivalent volume (750 mL per bed) to the inter-container spaces for each bed. The third pesticide application occurred on 28 August 2017 using prodiamine and thiophanate-methyl, after which glyphosate was applied in the same manner as in the second application.
The collection tanks were emptied 24 h prior to the collection times to allow the accumulation of subsurface IRF over a full day. Samples were collected on at least four dates for each monitoring period, in addition to including day 0 (i.e., day of application) for herbicides post watering-in for monitoring periods 1 and 3. Sample collections over the ensuing 16-day period for each monitoring period all included day 1 (the day after herbicide, insecticide, and fungicide applications) and day 16 (the final day for each monitoring period, 16 days after application). Intermediate-day sampling occurred on days 4 and 8 for monitoring period 1 (samples were damaged from day 2), days 2, 4, and 8 for monitoring period 2, and days 2, 4, and 11 for monitoring period 3 (precipitation on day 8 interfered with sampling, and we instead elected to collect samples on day 11 following another heavy precipitation event). The height of the water in the collection tanks was measured and converted to liters based on tank dimensions in order to quantify the total volume and subsequent pesticide load of the surface and subsurface IRF per bed. A sample of 750 mL from each tank was collected, providing there was adequate surface or subsurface IRF water, for pesticide concentration analysis. A submersible pump with a hose attachment was inserted into the tank and allowed to run for 10 s to clear out any remaining water prior to sample collection in a glass amber bottle (Qorpak, Clinton, PA, USA). Each sample was acidified with 75 µL of acetic acid to prevent pesticide disassociation prior to storage in a −4-degree C freezer.

2.6. Pesticide Analysis

Samples were analyzed at the Organic Contaminants Analytical Research Laboratory in the Soil and Water Sciences Department, University of Florida, Gainesville, FL, USA, using sample preparation and extraction techniques and instrument conditions based on EPA Methods 3510C [25] (Appendix A). Due to matrix effects determined in the preliminary work for this study, non-treated control water from the surface and subsurface IRF was provided to prepare corresponding matrix-matched calibration standards and quality assurance/quality control (QA/QC) samples.

2.7. Experimental Design and Statistical Analysis

A completely randomized design was used for this study. The data were analyzed using SAS v 9.4 (Cary, NC, USA). The volume of irrigation applied was evaluated using analysis of variance with the PROC GLM procedure, when the treatment effects were significant (p < 0.05), means were separated using Tukey tests in the LSMEANS prompt. Assessment of average surface and subsurface IRF volumes throughout the season used only sample days in which less than 0.5 cm of precipitation occurred. The volumes of water transported via surface and subsurface IRF, the pesticide concentration, and the pesticide load were subject to analysis of variance using the PROC Mixed procedure with repeated measures. When treatment effects were significant (p < 0.05), means were separated using Tukey tests in the LSMEANS prompt. Significant treatment effects, (using a threshold of α = 0.05) supported the rejection of the underlying assumptions that the irrigation method had no effect on the irrigation applied, the volume of water transported via surface and subsurface IRF, the pesticide concentration, and the pesticide load. The variable means and standard errors for the irrigation applied, the volume of water transported via surface and subsurface IRF, the pesticide concentration, and the pesticide load were calculated using the PROC MEANS feature. Pesticide samples that were below the limit of detection were recorded as the limit of detection, providing a worst-case scenario estimate. In cases where no IRF was generated, a value of zero was averaged with any collected samples; therefore, concentration averages reported below a particular compound’s limit of detection represent at least one replicate producing zero IRF.

3. Results

Site weather conditions (i.e., daily and cumulative precipitation and temperature) throughout the entirety of the study are published in Abdi et al. [2].

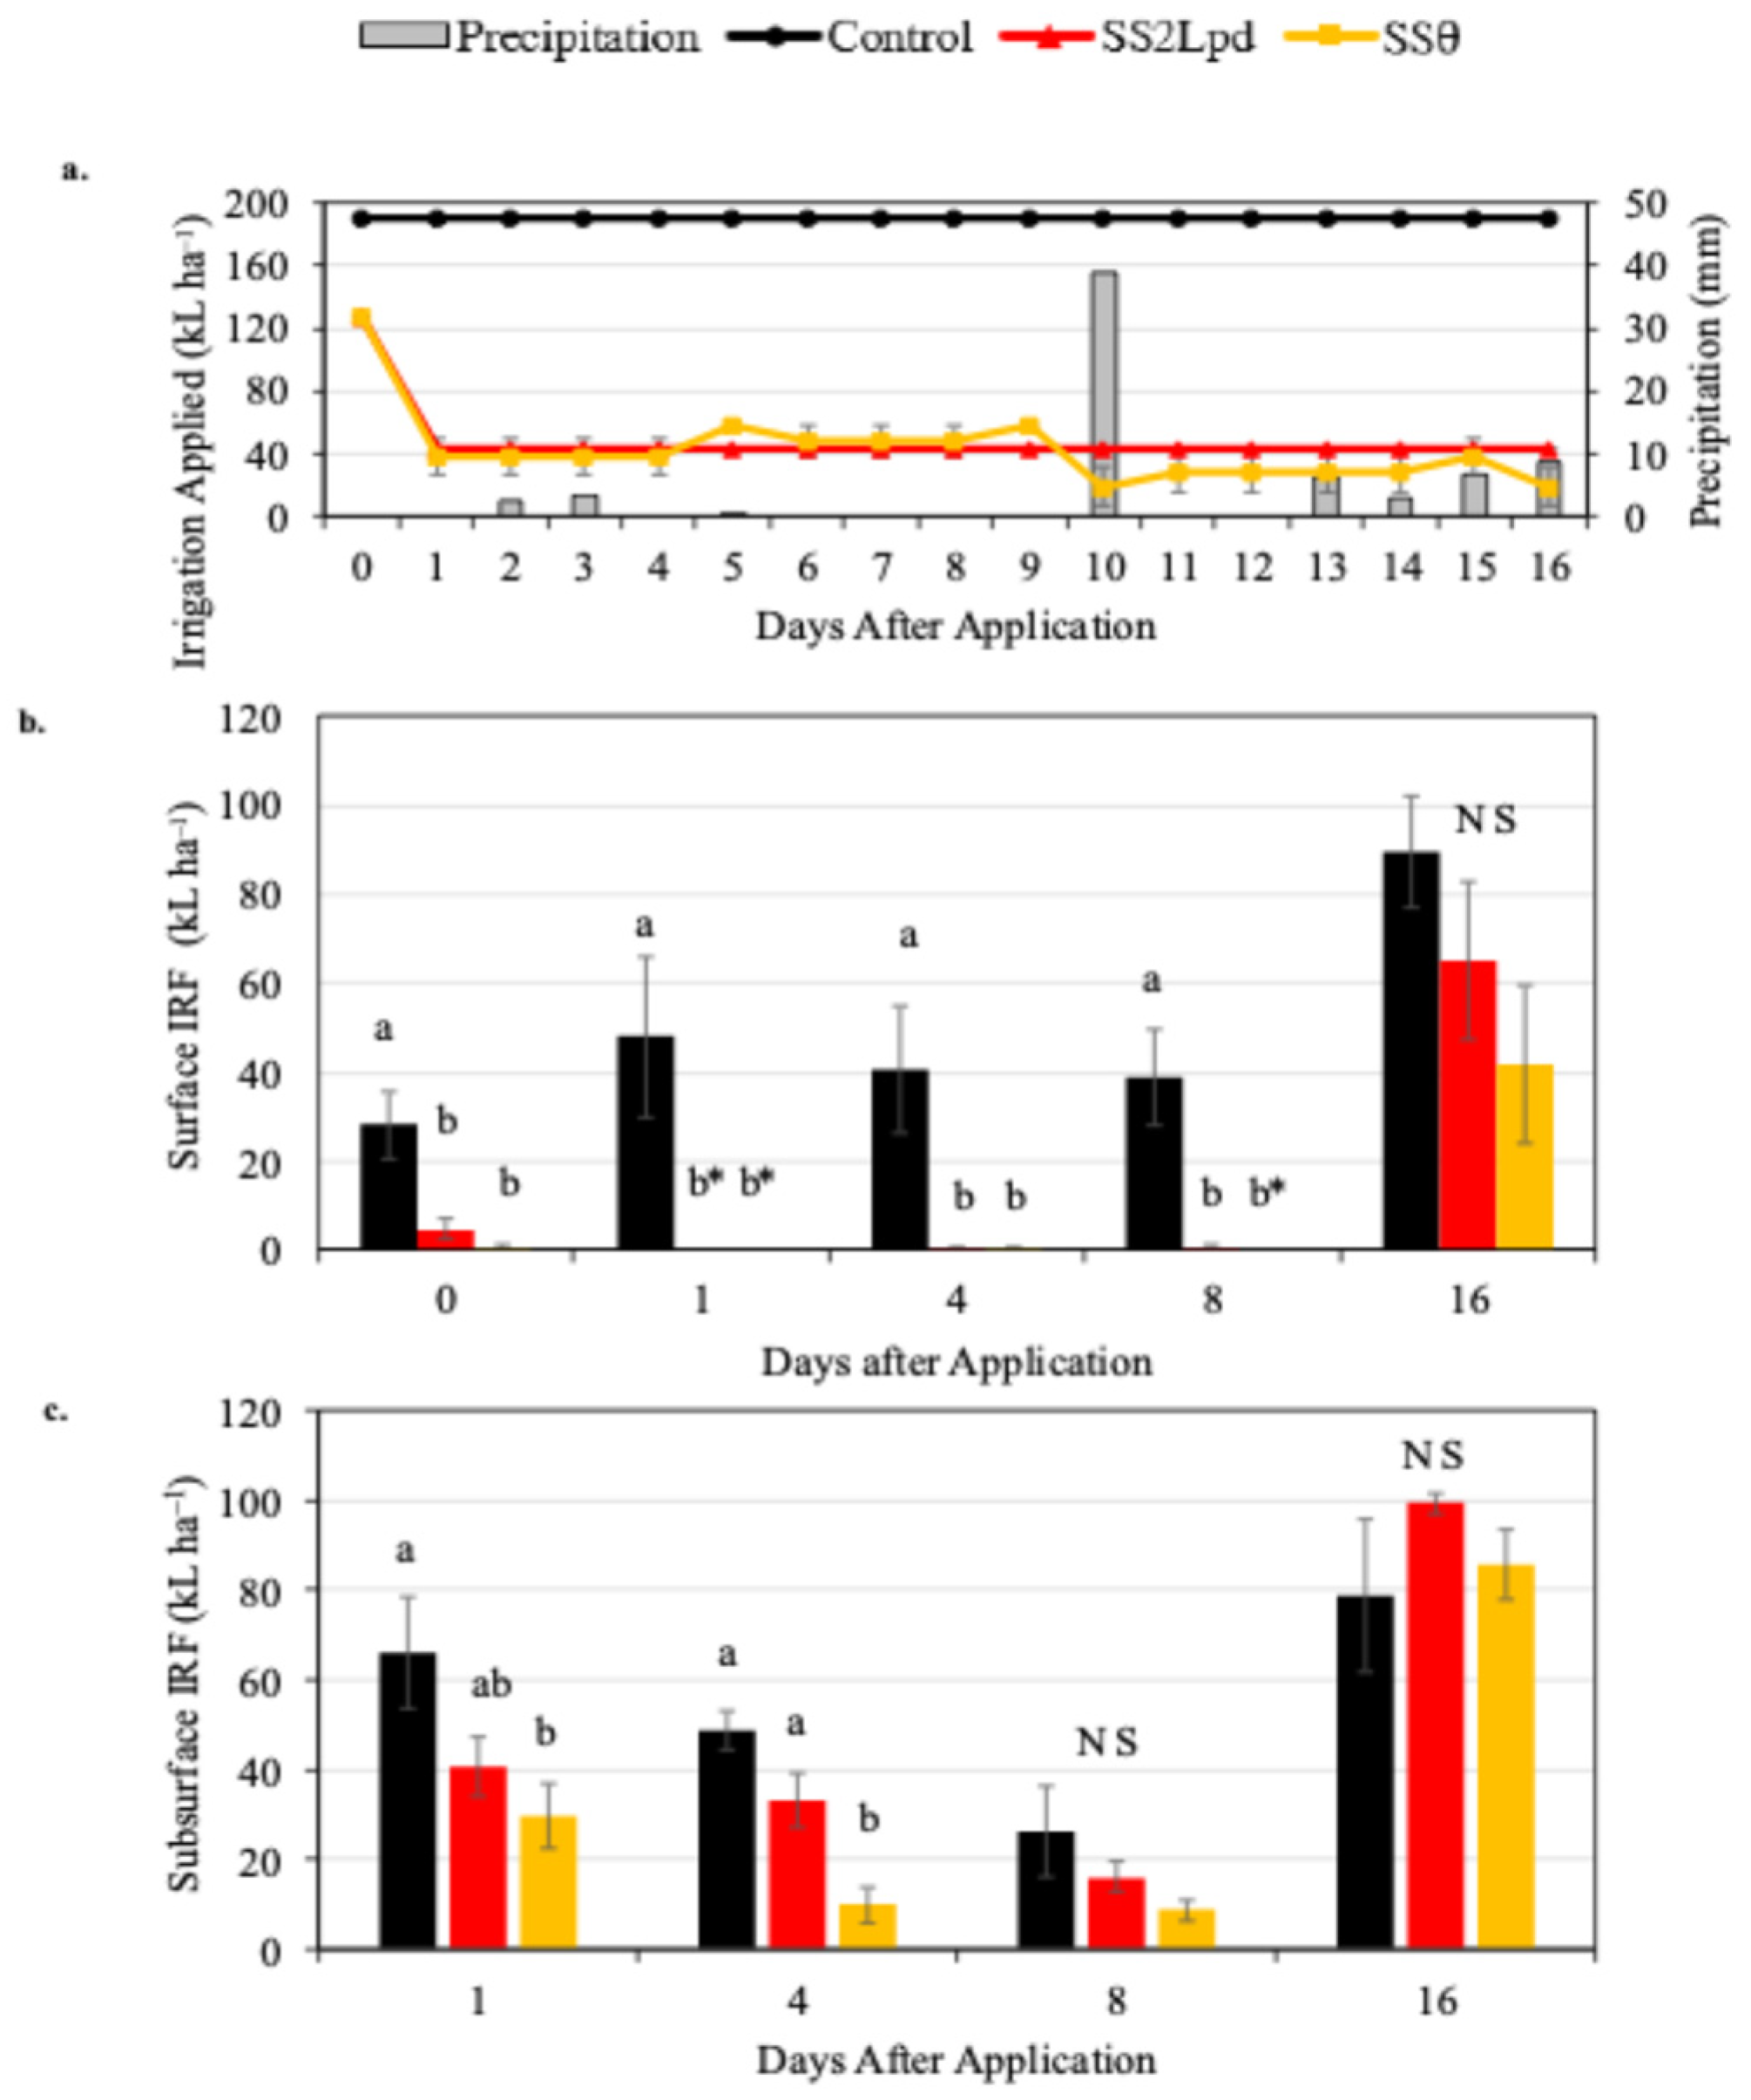
3.1. Irrigation and Irrigation Return Flow

3.1.1. Monitoring Period 1

A cumulative irrigation volume of 3238 kL ha−1 was supplied to the overhead irrigated control, spanning from the watering-in of the pre-emergent herbicide on day 0 (the day of application) through day 16, a total amount exceeding the volume applied to the two spray stake treatments (Table 2). Irrigation water was supplied on each of the 17 dates.
During monitoring period 1, water was supplied every day for the overhead control and the daily spray stake treatment (SS2Lpd), compared to an average of only 11.5 days where irrigation was applied for the SSθ treatment (Figure 1a). A total of 70.09 mm of precipitation occurred during monitoring period 1, with the daily cumulative volume displayed in Figure 1a. Precipitation occurred on days 2, 3, 5, 10, 13, 14, 15, and 16, with precipitation intensities of 0.85, 1.18, 0.25, 7.82, 1.27, 1.40, 1.71, and 2.88 mm h−1, respectively. Spanning all five sample dates, sans day 16, an increased volume of surface IRF was produced by the control compared to either treatment (Figure 1b). The control yielded greater subsurface IRF volumes than SSθ on both day 1 and day 4; however, on every other sample day, there were no differences between irrigation treatments or the control (Figure 1c).

3.1.2. Monitoring Period 2

A total of 3238 kL ha−1 of water was supplied to the overhead control between the post pre-emergent herbicide watering-in on day 0 and day 16 of the second monitoring period, a volume that was greater than either SSθ or SS2Lpd (Table 2). Both the irrigation treatments that supplied water daily, the control, and SS2Lpd, applied irrigation 17 times during the second monitoring period, greater than the average of 12.6 days of irrigation applied for SSθ (Figure 2a). A total of 22.83 mm of precipitation occurred during monitoring period 1, with the daily cumulative volume displayed in Figure 2a. Precipitation occurred on days 0, 4, 5, 8, 10, 11, 14, and 15, with precipitation intensities of 0.38, 1.91, 0.25, 1.97, 2.54, 1.02, 0.76, and 0.57 mm h−1, respectively. Spanning the five sample dates, the volume of surface IRF lost from the control was greater than from either microirrigation treatment (Figure 2b). On day 1 and day 2, the control exported a greater volume of subsurface IRF than the SSθ treatment; however, all days thereafter had no differences between the control and treatments (Figure 2c).

3.1.3. Monitoring Period 3

The volume of water received by the overhead irrigated control was 3238 kL ha−1, greater than the 827 kL ha−1 of water supplied via spray stake to SS2Lpd from the watering-in of the herbicides to day 16 of the third monitoring period (Table 2). The 935 total kL ha−1 supplied to the SSθ treatment was equivalent to SS2Lpd, and also lower than the control. The control and SS2Lpd received irrigation for all 17 days throughout this monitoring period, while the SSθ received irrigation for 15 days (Figure 3a). A total of 16.75 mm of precipitation occurred during monitoring period 1 with the daily cumulative volume displayed in Figure 3a. Precipitation occurred on days 0, 2, 8, 10, and 14, with precipitation intensities of 0.68, 0.25, 1.61, 2.35, and 0.25 mm h−1, respectively. The control again yielded more surface IRF than either microirrigation treatment on days 1, 2, 4, and 16; however, no differences in volume were observed on day 11 (Figure 3b). The control generated increased subsurface IRF relative to SSθ on days 1, 2, and 4, as well as SS2Lpd on day 4, but no differences on day 16 (Figure 3c).

3.2. Pesticide Transport

3.2.1. Monitoring Period 1

Acephate

The total loads of acephate recovered in the surface IRF samples were greater in the overhead control than in either microirrigation treatment on day 4 or 8; whereas no differences were observed on day 16 (Table 3). Comparisons between treatments for samples collected on day 1 were not possible as damage to some control replicate samples occurred. As both microirrigation treatments substantially limited, and often eliminated, surface IRF, there was minimal acephate loss in either treatment through this pathway. Over the four sample dates in this period, the control transported a total of 77.7 g ha−1 of acephate per hectare in surface IRF, while the SS2Lpd and SSθ treatments transported a sum of 6.56 g ha−1 and 3.40 g ha−1. The acephate load recovered via subsurface IRF samples was equal across all four of the sample dates. The total acephate load recovered in subsurface samples over the four sample dates was 94.9 g ha−1 from the control, 89.4 g ha−1 from SS2Lpd, and 34.8 g ha−1 from SSθ, respectively. Summing the surface and subsurface acephate load across the four sample dates, a total of 173 g ha−1, 96 g ha−1, and 38.2 g ha−1 were recovered from the control, SS2Lpd, and SSθ, respectively, representing 31.2%, 17.4%, and 6.9% of applied acephate.

Bifenthrin

The loads of bifenthrin recovered in surface IRF were greater in the control versus either treatment on days 4 and 8; however, on day 16 the amount was equivalent (Table 3). Day 1 comparisons were again not possible due to control sample replicate damage. Over the four sample dates, a cumulative amount of 454 mg ha−1 of bifenthrin was collected in surface IRF from the control, while SS2Lpd and SSθ totaled only 35.4 mg ha−1 and 17.9 mg ha−1; corresponding to just 0.3% of applied bifenthrin from the control, and less than 0.1% from either microirrigation treatment. The load of bifenthrin recovered in subsurface IRF was greater in the control than SSθ on days 1 and 4; however, there were no differences between the control or treatments on any subsequent day. Cumulative amounts of 29 mg ha−1, 23.6 mg ha−1, and 15.9 mg ha−1 were recovered from subsurface IRF over the four sample dates from the control, SS2Lpd, and SSθ, respectively, ubiquitously comprising less than 0.1% of the applied bifenthrin for the control and both microirrigation treatments. Summing both the surface and subsurface loads of bifenthrin recovered across the four sample dates, 484 mg ha−1, 59.1 mg ha−1, and 33.9 mg ha−1 were collected from the control, SS2Lpd, and SSθ, representing 0.4% of the applied bifenthrin for the control, and under 0.1% for either microirrigation treatment.

Isoxaben

The loads of isoxaben recovered from surface IRF samples were greater in the control than SSθ on day 0, after the herbicide label recommended watering-in, in addition to days 4 and 8 (Table 3). Despite the load recovered for SS2Lpd being equivalent to both the control and SSθ after the watering-in sample collection on day 0, it was less than the control on days 4 and 8. No differences occurred between the control or treatments on day 16. Over the five sample dates for both surface and subsurface IRF, cumulative amounts of 69.5 g ha−1, 5.95 g ha−1, and 0.53 g ha−1 were recovered from the control, SS2Lpd, and SSθ; representing 8%, 0.7%, and less than 0.1% of isoxaben applied. The loads of isoxaben recovered from subsurface IRF samples were greater in the control than either treatment on days 1, 4, and 8; however, no differences were observed on day 16. The cumulative loads of isoxaben collected spanning the four sample dates were 37.4 g ha−1, 6.86 g ha−1, and 0.87 g ha−1 for the control, SS2Lpd, and SSθ, respectively, representing 4.3%, 0.8%, and 0.2% of the applied compound. Summing the surface and subsurface isoxaben loads recovered spanning the five sample dates, 107 g ha−1, 12.8 g ha−1, and 2.1 g ha−1 were collected from the control, SS2Lpd, and SSθ; representing 12.3% of the applied isoxaben for the control, 1.5% for SS2Lpd, and less than 0.2% for SSθ.

Mefenoxam

The loads of mefenoxam recovered in the surface IRF were greater in the control than in either microirrigation treatment on days 4 and 8, but was equivalent on day 16 (Table 3). As with the other pesticides in monitoring period 1, day 1 comparisons were not possible due to sample replicate damage for the control. A cumulative amount of 2942 mg ha−1 was recovered from the control over the four sample dates, versus 68.7 mg ha−1 for SS2Lpd and 46.1 mg ha−1 for SSθ, representing 16.1%, 0.4%, and 0.3% of the applied mefenoxam, respectively. Mefenoxam loads recovered in subsurface IRF were equivalent for all four sample dates, with the exception of day 4, where more mefenoxam was exported from the control than SSθ, while SS2Lpd was equivalent to either. The cumulative mefenoxam loads collected in subsurface IRF were 979 mg ha−1, 429 mg ha−1, and 166 mg ha−1 for the control, SS2Lpd, and SSθ, respectively, equating to 5.4%, 2.4%, and 0.1% of the applied mefenoxam. Summing surface and subsurface mefenoxam loads recovered across the four sample dates, 3921 mg ha−1, 498 mg ha−1, and 213 mg ha−1 were collected from the control, SS2Lpd, and SSθ, representing 21.5% of the applied mefenoxam for the control, 2.7% for SS2Lpd, and 1.2% for SSθ.

3.2.2. Monitoring Period 2

Chlorpyrifos

The loads of chlorpyrifos recovered in surface IRF were greater in the control than in either microirrigation treatment across the five sample dates (Table 4). The chlorpyrifos loads collected over the five sample dates were 14,461 mg ha−1 for the control, 237 mg ha−1 for SS2Lpd, and 1 mg ha−1 for the SSθ; representing 1.3% of applied chlorpyrifos for the control, and under 0.01% for either microirrigation treatment. The load of chlorpyrifos recovered in subsurface IRF was greater in the control than in either microirrigation treatment on days 1 and 4; however, there were no differences were measured on any other sample date. The cumulative chlorpyrifos loads collected over the five sample days were 413 mg ha−1, 41.1 mg ha−1, and 44.7 mg ha−1 for the control, SS2Lpd, and SSθ, respectively, representing less than 0.1% of the applied chlorpyrifos. The subsurface IRF concentrations of chlorpyrifos were greater in the control on days 2 and 4 relative to both microirrigation treatments; however, all days thereafter had no differences. Summing the surface and subsurface IRF over all five sample dates, 14,875 mg ha−1, 278 mg ha−1, and 45.7 mg ha−1 of chlorpyrifos were collected from the control, SS2Lpd, and SSθ, respectively, representing 1.3% for the control, and less than 0.01% for either microirrigation treatment.

Glyphosate

During the second monitoring period, the loads of glyphosate recovered in the surface IRF were equivalent for all sample dates except for day 16 where the load was greater in the control than in either microirrigation treatment (Table 4). The cumulative loads of glyphosate recovered over the five sample dates were 80.2 g, 1.42 g, and 1.39 g for the control, SS2Lpd, and SSθ treatment, respectively, representing 3.9% of the applied glyphosate for the control, and less than 0.1% for either microirrigation treatment. The glyphosate loads collected in the subsurface IRF during monitoring period 2 were equivalent for all sample dates. The cumulative loads of glyphosate recovered in subsurface IRF samples equaled 1.76 g, 4.38 g, and 3.78 g for the control, SS2Lpd, and SSθ, respectively, representing less than 0.1%, 0.2%, and 0.2% of the glyphosate applied. Summing both the surface and subsurface IRF total loads over the entire monitoring period, 81.9 g, 5.8 g, and 5.2 g were collected from the control, SS2Lpd, and SSθ, respectively, representing 4%, 0.3%, and 0.2% of the glyphosate applied.

Oxyfluorfen

The load of oxyfluorfen recovered from surface IRF was greatest in the control compared to either microirrigation treatment on all five sample dates (Table 4). The cumulative oxyfluorfen loads recovered in the surface IRF throughout the five sample dates were 4706 mg ha−1 in the control, 273 mg ha−1 for SS2Lpd, and 78.2 mg ha−1 for SSθ, respectively, representing 0.4% of the applied oxyfluorfen for the control, and below 0.1% for either treatment. The control had a higher concentration than either spray stake treatment on days 1, 2, and 16, but this was equivalent to SS2Lpd on day 8. The load of oxyfluorfen recovered in subsurface IRF was equivalent for all five sample dates. The total loads of oxyfluorfen recovered in subsurface IRF throughout the five sample dates yielded 78.1 mg ha−1 for the control, 37.2 mg ha−1 for SS2Lpd, and 17.2 mg ha−1 for SSθ, respectively, representing less than 0.001% of the applied oxyfluorfen. Summing the surface and subsurface IRF, the total loads of oxyfluorfen recovered throughout the five sample dates were 4784 mg ha−1 for the control, 310 mg ha−1 for SS2Lpd, and 95 mg ha−1 for SSθ, respectively, representing 0.4% of the applied oxyfluorfen 0.03% for SS2lpd, and under 0.001% for SSθ.

Triflumizole

The load of triflumizole recovered from surface IRF was greater in the control than SSθ on all five of the sample dates, while also being greater than the SS2Lpd on days 1, 2, and 16 (Table 4). The total loads of triflumizole recovered in the surface IRF loads were 3747 mg in the control, 135.1 mg in SS2Lpd, and 0.43 mg in SSθ, respectively, corresponding to 1.3% and less than 0.01% of the applied triflumizole for the control and for both of the microirrigation treatments, respectively. The load of triflumizole recovered in subsurface IRF was greater in the control compared to either treatment on days 1, 2, and 4; however, no differences were observed on days 8 and 16. A cumulative total of 861 mg was recovered over the five sample dates for the control, compared to 28.2 mg and 51 mg for SS2Lpd and SSθ, respectively, representing 0.3% of the total applied triflumizole for the control, and under 0.01% for either treatment. Summing the surface and subsurface IRF, triflumizole recovery over the five sample dates yielded a total of 4608 mg, 163 mg, and 51.4 mg recovered from the control, SS2Lpd, and SSθ, respectively, representing 1.6% of the total triflumizole applied to the control and less than 0.01% for both treatments.

3.2.3. Monitoring Period 3

Glyphosate

In the third monitoring period, the glyphosate load collected in surface IRF was greater in the control than in either microirrigation treatment on days 1, 2, 4, and 16, but was no different on day 11 (Table 5). The total glyphosate recovered over the five sample dates was 104 g, 11 g, and 0.58 g for the control, SS2Lpd, and SSθ; representing 5%, 0.5%, and less than 0.1% of the applied glyphosate, respectively. The glyphosate load recovered in the third monitoring period from subsurface IRF was measured on days 2, 4, and 16, and the control was greater than either microirrigation treatment on days 2 and 4; however, no differences were observed on day 16. Additionally, SS2Lpd was greater than SSθ on day 4. The cumulative glyphosate loads collected in subsurface IRF over days 2, 4, and 16 totaled 5.24 g, 0.25 g, and 0.09 g for the control, SS2Lpd, and SSθ, respectively, representing 0.2%, less than 0.01%, and less than 0.001% of the glyphosate applied. Summing surface and subsurface IRF totals, 109 g, 11.2 g, and 0.67 g were collected from the control, SS2Lpd, and SSθ treatments, respectively, representing 5.2%, 0.5%, and less than 0.1% of the glyphosate applied.

Prodiamine

The load of prodiamine collected in surface IRF was greater in the control than either treatment on all days with the exception of day 11 (Table 5). The cumulative loads recovered over the five sample dates for surface IRF were assessed and yielded 3996 mg for the control, 1254 mg for SS2Lpd, and 61.4 mg for SSθ, representing up to 0.2% of the prodiamine applied for the control, and below 0.1% for either microirrigation treatment. The load of prodiamine collected in subsurface IRF was greater in the control than in either microirrigation treatment on days 2, 4, and 16. Comparisons were able to be made for day 1. Subsurface samples were not collected on day 11. The cumulative load collected on days 2, 4, and 16 was 144 mg for the control, 10 mg for SS2Lpd, and 4 mg for SSθ, ubiquitously corresponding to under 0.001% of prodiamine applied. Summing the surface and subsurface IRF total loads, 4110 mg of prodiamine was recovered from the control, 1264 mg from SS2Lpd, and 65.5 mg from SSθ, respectively, representing 0.2%, <0.1%, and <0.001% of the prodiamine applied.

Thiophanate-Methyl (TPM)

The load of TPM recovered from surface IRF was greater in the control than either of the microirrigation treatments across all days, with the sole exception of day 11 (Table 5). The cumulative load of TPM recovered in the surface IRF across all five sample days yielded 32.4 g in the control, 0.05 g for SS2Lpd, and 0.02 g for SSθ, representing 6.7% of the applied TPM for the control, and <0.001% for either microirrigation treatment. The load of TPM collected from subsurface IRF was greater in the control on day 2 compared to either treatment, and on day 4 compared to SSθ. Samples collected on day 16 were equivalent. Comparisons could not be calculated for day 1, and load samples were not collected from subsurface IRF on day 11. The total load collected for the control on days 2, 4, and 16 was 1.11 g for the control, 0.006 g for SS2Lpd, and 0.002 g for SSθ, representing 0.2% of the applied TPM for the control and <0.01% for either treatment. Summing the total surface and subsurface IRF collected over the entire monitoring period, a total of 33.5 g, 0.05 g, and 0.02 g were recovered from the control, SS2Lpd, and SSθ, yielding 6.9%, 0.01%, and <0.01% of the applied TPM, respectively.

4. Discussion

4.1. Irrigation and Irrigation Return Flow

The two spray stake treatments consistently reduced the volume of irrigation applied compared to the control within each monitoring period (a 74–76% reduction for SS2Lpd and 71–80% for SSθ). The lower volume of irrigation applied when using spray stakes was pre-emptively known to be less than the control via calculated application rates; however, the capacity to reduce the volume applied (as well as number of days irrigation was applied) when using SSθ vs. SS2Lpd remained to be seen. The irrigation volume applied with SSθ was equivalent to SS2Lpd throughout each monitoring period, but the volume of water applied via SSθ varied compared to SS2Lpd and reflected crop needs. Moreover, the reduction in the number of days on which irrigation was supplied using SSθ may provide further benefits in terms of reduced energy use to operate on-site pumps. Spray stake irrigation reliably reduced and typically eliminated surface IRF versus the control as a result of enhanced application precision (directly supplying water to the container rather than the entire production area). This allowed the irrigation water to rehydrate the substrate first, and if below the container capacity threshold, could modify container leachate dynamics, particularly when using SSθ. Overhead irrigation, applying water with less precision, longer run times, and the complete coverage of production areas, does not provide this luxury and reliably generates IRF. Therefore, surface IRF consistently occurs in response to overhead irrigation; whereas, surface IRF from spray stake irrigation may only be expected to happen in response to precipitation on-site.
The cumulative volume of surface IRF collected across all sample dates following the post-herbicide watering-in event for each monitoring period was reduced by 69–94% when irrigating using SS2Lpd and 81–98% when using SSθ compared to the overhead control. Subsurface IRF volumes were typically equivalent on a daily basis; however, the SSθ treatment was capable at times of reducing individual sample day subsurface IRF volume versus the control. The cumulative volume of the subsurface IRF recovered throughout each monitoring period in the SS2Lpd treatment was reduced by 14–37% and in the SSθ treatment by 39–75% versus the overhead control. Indeed, high levels of irrigation water leaching from containers irrigated using microirrigation practices may occur as a result of the high application rates of emitters localizing application directly to the container substrate when compared to overhead irrigation coupled with the consideration to hydraulic (preferential flow) and chemical properties (minimal ion exchange sites) endemic to most nursery substrates [26], creating a pathway for container leachate to infiltrate through the production surface and contribute to subsurface IRF. Burnett and Van Iersel [27] and Van Iersel et al. [28] highlighted that the use of substrate moisture sensors in irrigation scheduling could reduce or eliminate container leachate, particularly if irrigating at a lower θ threshold. This offers up the suggestion that the use of sensors in tandem with microirrigation methods may reduce the volume of IRF by limiting container leachate, a best management practice supported by Bilderback [29]. Moreover, days where θ is above the threshold of activation and irrigation is not needed may result in subsurface IRF elimination. Summarily, irrigation methods utilizing in-container spray stakes can generally prevent surface IRF, and when used in tandem with substrate moisture sensors, may provide additional benefits with regard to reducing subsurface IRF.

4.2. Pesticide Mobility

The relevant physiochemical properties of the investigated pesticides are displayed in Table 1. The chief physiochemical properties selected to assess movement in surface and subsurface IRF were solubility and Koc, as they are often inversely correlated and correspond to hydrophilic or hydrophobic potential of each pesticide. Pesticides with greater solubility were observed to move in a dissolved phase via either surface or subsurface IRF; whereas, relatively less soluble (and higher Koc) pesticides had a reduced likelihood of moving in a dissolved form orinfiltrate through the production surface, likely remaining in a bound phase sorbed to the production surface on either the underlying fabric, container, media, or plant tissue, where transport may occur in surface IRF via suspension. For immobile pesticides maintained at the surface, the vapor pressure of a particular pesticide may be used to anticipate the likely fate of a compound should it remain upon the production surfaces, suggesting whether vaporization is a factor in their lack of aqueous movement after application.

4.2.1. Acephate

Acephate was the most soluble compound investigated in this study, and with its low Koc coefficient, was anticipated to have a greater degree of mobility than other pesticides, particularly in a dissolved form. Aerobic degradation is considered a primary method of loss, as the relatively low vapor pressure coupled with the high solubility suggests that volatilization is not likely in either dry or wet conditions, furthermore, the compound is generally considered to be photostable [30]. Of the 10 investigated compounds in this study, acephate was recovered in the greatest percentage of the amount applied. Despite surface IRF largely being eliminated when using spray stake irrigation methods, subsurface IRF proved to be a major vector for the transportation of acephate regardless of irrigation application method; however, the microirrigation treatments exported >60% less total acephate over the same time period as the control. The observed increase in acephate load transported over time in either spray stake treatment suggested a delayed, lag effect in acephate infiltration through the subsurface. In a study investigating the movement of acephate and its metabolite methamidophos in soils, Yen et al. [31] noted the slower dissipation of acephate relative to its metabolite, and the importance of soil texture on mobility when comparing their results to those from Sánchez-Camazano et al. [32]. Both of those studies investigated the movement of acephate in soils, not a clay-free sand layer like ours; however, the composition of silt, clay, and organic matter in the soils for their studies further underscores the effects that soil texture may have on pesticide mobility. Bearing in mind the high mobility potential in both surface and subsurface IRF, reducing or eliminating irrigation events to reduce IRF in the days immediately after application may prove most effective in limiting the mobility of acephate.

4.2.2. Bifenthrin

Bifenthrin has a very low solubility and an inversely high Koc coefficient which suggests preferentially sorption to soils or organic matter would occur and pose a limited threat of compound infiltration through soils in a dissolved phase. Given the extremely low solubility of bifenthrin, vaporization from moist soils or surface water may be expected; however, the sorptive strength of this pesticide may mitigate the likelihood that this pathway of degradation takes place [30]. Bifenthrin is unlikely to degrade via photolysis [33]; however, microbial metabolization by bacterial species such as Pseudomonas sp. CB2 and Stenotrophomonas acidaminiphila provides a pathway for dissipation [34,35]. Bifenthrin was hypothesized to move nearly exclusively via surface IRF, likely a result of erosive transport of sediments or particulates in lieu of moving in a dissolved phase, posing potential impairment to receiving water bodies as a result of its persistence in the environment and widespread use across agricultural sectors [36]. Furthermore, the bioactivity of bifenthrin even when present at low concentrations creates concerns of toxicity to sensitive aquatic life [37,38]. Following the first irrigation event after application, the overhead control exported a concentration of 6.69 µg L−1 of bifenthrin in surface IRF; however, samples collected on dates thereafter failed to exceed 1 µg L−1 and typically remained below the limit of detection. Similarly, subsurface concentrations were nearly ubiquitously under the detection limit. The minute concentrations of bifenthrin recovered in IRF in our study harmonized with observations from Weston et al. [39], where concentrations of 0.073 µg L−1 and 1.2 µg g−1 of bifenthrin in collected water and suspended sediments from an urban creek in California were assessed. Bearing that in mind, the elimination or reduction of surface IRF may be expected to keep bifenthrin in place and allow preferred methods of degradation to occur before it can be lost to IRF.

4.2.3. Isoxaben

Isoxaben is a mildly soluble compound with a Koc coefficient that suggests that sorption to sediments and other materials may also likely occur, [30]. Vaporization may not be expected to provide a prominent pathway of degradation from dry soils, moist soils, nor water surfaces, nor is hydrolyzation to be expected due to the functional group composition of this pesticide; however, this isoxaben may indeed be subject to photodegradation [30]. Microbial metabolization has also been reported to be a considerable pathway in the dissipation of isoxaben, especially in soils that are aerobic and moist [40,41]. Reports from Briggs et al. [10] highlight that isoxaben loss in nursery IRF was greatest on the days immediately following application, which harmonized with our results where samples collected on the first four sample dates after application reflected a quadratic increase and subsequent decrease. The slightly soluble nature of isoxaben suggests that it may indeed exhibit mobility in subsurface IRF; however, 1% or less of applied isoxaben was recovered from the control or either microirrigation treatment, with no increases over time identified.

4.2.4. Mefenoxam

Mefenoxam exhibits a fairly high solubility and low Koc, where it would not be expected to volatilize, undergo photo-chemically induced degradation, or hydrolysis in water [42]. Gardner and Branham [15] investigated mefenoxam mobility through turfgrass plots or fallow plots under a static irrigation schedule (10 mm, 5 times per week) and irrigation applied based on estimated evapotranspiration, where it was observed that rapid infiltration and percolation of mefenoxam throughout the soil profile regardless of which irrigation method occured, and aerobic, microbially mediated degradation served as primary pathways of degradation. Due to the relatively high solubility and lower Koc, it was anticipated that mefenoxam movement would include infiltration through the sand layer as well as elevated mobility in surface IRF. Similarly to results from Gardner and Branham’s study, mefenoxam rapidly moved via IRF in the control, considering both quadratic decreases in surface IRF and peak loads exported in subsurface IRF during day 1, which was nearly three times as much as day 4 and ten times as much as days 8 and 16. While spray stake treatments were both effective in eliminating or substantially reducing surface IRF and concomitant mefenoxam movement, subsurface IRF mefenoxam movement represented the greatest pathway of mefenoxam mobility across the two microirrigation treatments, representing between 3 and 6 times as much mefenoxam recovered in subsurface IRF than surface loss. Beyond that, increases in mefenoxam load recovered over time via subsurface IRF across the two treatments indicate elevated potential for lag effects, as repeated irrigation events moved mefenoxam in subsurface profiles.

4.2.5. Oxyfluorfen

Oxyfluorfen was not expected to exhibit mobility in water due to its lower solubility and higher Koc coefficient, nor was this compound anticipated to volatilize [30]. Oxyfluorfen mobility was predominantly localized to surface IRF, with nearly 60 times more oxyfluorfen recovered in the control surface IRF than subsurface IRF, and 7.5 and 4.7 times as much in the SS2Lpd and SSθ treatments. The concentration of oxyfluorfen in subsurface IRF was universally below 1 µg L−1. The relatively low concentrations of oxyfluorfen measured in subsurface IRF were consistent with reports from Riley et al. [17] of water samples tested for oxyfluorfen being under the level of solubility, and that >74% of recovered oxyfluorfen from soil samples were located in the 2.5 cm closest to the surface following 90 and 340 days after application on a vineyard [43], supporting the notion that oxyfluorfen has a limited likelihood of moving through subsurface profiles.

4.2.6. Chloryprifos

Chlorpyrifos is a moderately soluble pesticide that bears a high Koc, suggesting that while mobility in water may be exhibited, it is expected to primarily adsorb to lipophilic materials. Common degradation pathways for chlorpyrifos may include vaporization, photolysis, and microbial metabolization [30]. Surface IRF represented the most likely vector for chlorpyrifos mobility, where nearly 35 times as much chlorpyrifos was recovered in surface IRF from the control compared to subsurface IRF. Within our study, the concentration of chlorpyrifos was routinely lower in subsurface IRF samples than in samples collected from surface IRF, which harmonized with results from Milhome et al. [44], where chlorpyrifos in groundwater samples was below detection. The observed reductions in chlorpyrifos load in surface IRF following day 4, and the minimal presence in subsurface IRF for any date, suggest that vaporization and photolysis were likely catalysts in degradation. Slotkin et al. [45] investigated the photodegradation of chlorpyrifos and highlighted how photodegradation of this compound may yield environmentally harmful metabolites that could be more mobile, such as trichloropyridinol (TCP). Tropospheric degradation was investigated by Muñoz et al. [46], indicating an atmospheric lifetime of approximately 2 h through OH-initiated oxidation, with TCP observed as a major metabolite. It is expected that a combination of mechanisms contributes to the degradation of chlorpyrifos, as Briceño et al. [47] stated, with their study observing how different microbial species may degrade both chlorpyrifos and the subsequent TCP. It is likely that the chlorpyrifos in our study underwent a variety of degradation methods within the experimental nursery; however, transformation products (which were not assessed within this study) should be considered.

4.2.7. Triflumizole

Triflumizole is a slightly soluble compound that bears a high Koc, lending itself to adsorption to soils and organic matter. Vaporization was not expected to be a major pathway of degradation; however, photo-induced degradation of triflumizole has been reported [30]. The widespread utilization of triflumizole spanning many agricultural sectors increases contamination risks to surface water, where detriment towards freshwater algal species, such as Chlorella vulgaris has been reported [48]. Bearing in mind the mild solubility of triflumizole, we hypothesized that mobility may occur in either surface or subsurface IRF; however, nearly 450% more triflumizole residues were collected in surface IRF than subsurface IRF within control plots. Regardless, this represented only a small fraction of the applied triflumizole, with only 1% in control surface IRF and <1% in control subsurface IRF, while both microirrigation treatments yielded less than 1% recovery.

4.2.8. Glyphosate

Glyphosate is an atypical compound, simultaneously bearing a high solubility and Koc, and has a reduced likelihood of vaporizing or undergoing photochemical degradation reactions [30]. Glyphosate sorption to soils has been reported, particularly to soils with a high clay content, acting in a manner similar to phosphorus, as well as exhibiting mobility in surface IRF and soil infiltrating water [16,49,50]. Considering the high solubility of glyphosate, it was hypothesized that mobility in surface IRF in both dissolved and sorbed phases could occur. Subsurface glyphosate movement has generally been reported to be in limited quantities, with concentrations seldom exceeding detection limits [51]. Glyphosate exhibited the highest levels of mobility in surface IRF, with nearly 46 times as much cumulative glyphosate recovered in surface IRF compared to subsurface IRF in the overhead control during monitoring period 2, and nearly 20 times as much during monitoring period 3. The peak concentration of glyphosate observed during the second monitoring period occurred 2 days following application, with 1403 µg L−1 recovered from surface IRF, and during the third monitoring period on the first day following application (2090 µg L−1), which while indeed greater than the peak concentration measured by Battaglin et al. [52] (8.7 µg L−1 in Midwestern USA streams) remained less than the greatest concentration (5153 µg L−1) identified in runoff from agricultural fields as described by Saunders et al. [51]. Glyphosate concentrations collected in subsurface IRF achieved peak concentrations during the second monitoring period on day 8 (134 µg L−1), and the third monitoring period on day 2 (92.3 µg L−1); however, the increased movement in subsurface profiles in our model nursery may likely be ascribed to the subsurface sand layer having no clay particles in which glyphosate may bind before degrading.

4.2.9. Thiophanate-Methyl (TPM)

TPM possesses a high solubility and a relatively moderate Koc coefficient, suggesting mobility within soil/water systems, and that transport may occur via IRF or precipitation events in the days following application [10,30]. TPM is not expected to vaporize nor undergo photolysis; however, microbially mediated transformations are considered a primary pathway [53,54] in the ultimate degradation of this compound. TPM mobility in irrigation IRF from container nurseries is likely to be greatest shortly following application, with reports from Briggs et al. [53] highlighting that between 3.5% and 7.0% of applied TPM was recovered in the first irrigation event post-application within their study. Similarly to the results from our work, the load of TPM recovered in surface IRF on the first irrigation event following application represented 6.0% of the total amount supplied, and the greatest concentrations of TPM were recovered from surface IRF collected from the control over the first two sample dates after application (625 µg L−1 on day 1 and 38.8 µg L−1 on day 2 before remaining below 1 µg L−1 on subsequent sample dates). The load of TPM recovered over the first two sample dates following application represented >99% of the total TPM recovered in surface IRF over the entire sample period, emphasizing the importance of limiting potential export immediately following application. While subsurface IRF data for day 1 was unavailable for the control, the load exported in surface IRF on day 2 was 30 times greater than the subsurface IRF that day. This suggests that not only was there residual TPM remaining on the surface after day 1, but that subsurface IRF was unlikely to be as prominent as a vector. It would be expected that residual TPM in the sand layer after day 1 would likely leach into day 2; however, the difference in loads between surface and subsurface IRF diminishes the likelihood. Regardless, the drop in TPM residues in samples collected after day 2 emphasizes the importance of mitigating the movement of this pesticide in the days immediately after application.

4.2.10. Prodiamine

With a low solubility and a high Koc coefficient, prodiamine is not expected to exhibit a high degree of mobility in water [55]. A study by Stearman et al. [56] assessed prodiamine removal using subsurface constructed wetlands, where reported irrigation IRF concentrations ranged from 500 to 3200 µg L−1; however, these concentrations substantially exceeded the peak concentrations measured in surface IRF from our model nursery (23.2 µg L−1). Subsurface IRF was generally below 1 µg L−1; however, samples collected on days 11 and 16 contained concentrations of 12.3 µg L−1 and 3.34 µg L−1.

4.3. Environmental, Ecological, and Plant Production Considerations

Bearing in mind that IRF represents the greatest vector in the movement of agrochemicals [6], irrigation practices which limit IRF can directly limit the movement of pesticides. As we hypothesized, the precision with which microirrigation applies water maintained consistent reductions in the volume of water applied throughout each monitoring period, while simultaneously limiting the volume of IRF generated. Surface IRF was consistently eliminated when applying irrigation using spray-stakes, whether sensors were used to dictate irrigation practices. Microirrigation allowed water to be directly applied to containers; whereas, overhead irrigation consistently generated surface IRF from non-target application of water to inter-container spaces. The eventual fate of pesticide residues manifested in partitioning between surface and subsurface IRF, and reflected physiochemical characteristics of each compound, primarily water-solubility and Koc coefficients.
The environmental persistence of pesticides can be predicted by using the half-lives reported for each compound in aqueous and soil systems. For the pesticide in this study with the shortest reported half-life in both soil and water systems, TPM, the majority of residues were exported on the day immediately following application, followed by a sharp decline (Table 1). Acephate, the pesticide in this study with the second shortest half-life, exhibited the most mobility in either surface or subsurface IRF, as well as the greatest percentage collected of the amount that was applied. Acephate was collected in the highest quantities across all sampling days, lending credence to half-life varying based upon localized soil and environmental conditions. For both pesticides, minimizing IRF volumes in the days directly following pesticide application may mitigate the overall mobility of these two pesticides and downstream impact on ecosystems.
For all the other compounds investigated, the half-lives in water are lower than the half-lives within soils. Each compound within this study exhibited increased overall movement via surface IRF compared to subsurface IRF, especially in days directly following the application of the pesticide. Efforts to reduce or eliminate surface IRF movement may provide the time necessary for these pesticides to adsorb to soils, organic matter, or surfaces throughout the production area, thus allowing the chance for vaporization, photodegradation, microbially mediated metabolism, and other pathways of removal to occur. The benefit of this is multi-faceted, limiting downstream risks to the aquatic environment as well as maintaining the protective attributes of the active ingredients in production. Frequently referenced indicator species Daphnia magna (water flea) and Oncorhynchus mykiss (rainbow trout) serve as a means to evaluate the potential negative effects of pesticide residues on ecosystems in aquatic environments, by considering the lethal concentration that causes mortality of 50% of a test population (LC50). Table 1 displays the reported LC50 values of each investigated compound on Daphnia magna and Oncorhynchus mykiss. Of the ten pesticides investigated in this research, only three (bifenthrin, chlorpyrifos, oxyfluorfen) had measured concentrations that exceeded at least one of the LC50 values of these two species. Considering the greatest concentrations of all pesticides were observed in the surface IRF produced on the day following pesticide application, efforts to delay or reduce irrigation (and subsequent IRF) when possible following application of pesticide may allow degradation in situ, limiting eventual transport towards downstream aquatic ecosystems. For the three compounds that yielded concentrations beyond the LC50 values for the two indicator species, the persistence in which these compounds may be maintained within aqueous environments ranges from just one month (in the case of oxyfluorfen) to greater than one year (bifenthrin), similar in length to their expected persistence within soils. With consideration towards the sorption coefficients of these compounds, efforts to minimize movement to surface waters in the immediate timeframe following pesticide application may facilitate greater potential for sorption to surfaces; therefore, manifesting in reductions to downstream ecological impacts by allowing the time necessary for degradation processes to take place. While transformation products of the investigated pesticides were not assessed within the scope of this work, it is expected that a variety of degradation or transformation mechanisms may yield compounds that may be of interest or pose environmental concerns.
This research provides information regarding the mobility of a range of commonly used pesticides in nursery production. The pesticides used in this study represent globally relevant compounds that have been used across a range of agricultural sectors throughout the world. While legislative action may limit the use of some of these specific pesticides in the future, such as acephate [57] and Chlorpyrifos [58,59], insights derived from their environmental movement as a function of physiochemical properties will maintain relevance as a model for assessing environmental fate.
Limitations of the research methods and techniques used in this study include the fact that not all days from application to day 16 were assessed (nor were days after day 16 assessed). Furthermore, precipitation-induced movement is likely to alter the effects that the irrigation method alone may have on pesticide movement. Pesticide movement dynamics in days where samples were not collected may yield insights that were not presented in this paper; however, inferences made from the sample days conducted provide a strong basis for the conclusions made in this manuscript. While precipitation may have impacted pesticide movement, major precipitation events generally occurred at least 4 days after application (limiting its impact) and are a reality that nursery producers deal with in producing crops outdoors.
Other limitations of this project include the representative risk of pesticide residue in IRF directly off of production areas. In practice, many nurseries will direct IRF through drainage channels which may have vegetation or physical filtration components (i.e., Briggs et al. [10]) or storage ponds (i.e., Riley et al. [17]), which can further dilute or remove pesticide residues. Therefore, pesticide concentrations and loads that may exit production sites are expected to be lower compared to IRF measured in this study. However, this study provides an understanding of the pesticide concentrations and loads that could be expected directly from production areas that would need to be managed to reduce environmental impact. Furthermore, using a clay-free sand layer beneath the production surface further impacts pesticide mobility, as clay particles can provide more surface area for charged contaminants to adsorb. Finally, while the 16 days of each monitoring period provided a robust assessment of immediate movement, increasing the length of time that samples were collected in each monitoring period could provide a more robust assessment of pesticide movement, particularly if residues exhibit a lag effect in movement through the sand layer. Therefore, pesticide movement data should be acknowledged as a “worst case scenario” of IRF pesticide content, and that nursery IRF will likely undergo a range of biological, physical, and chemical processes that limit contaminant presence before discharge. The mechanisms of pesticide fate within this project have been summarized individually for each pesticide; however, with several pesticides present on the production surface simultaneously, global approaches to reducing the movement of pesticide residues must be considered. Balancing the need to maintain pesticides in production to protect plants (mitigating movement) while also facilitating degradation can be accomplished through improved irrigation practices. Improved irrigation practices save water and reduce IRF, mitigating surface and subsurface movement, retaining pesticides on the surfaces of production areas to act on pests while also providing time for degradation processes to occur. Pesticides remaining upon the production surface (and not transported through production surfaces) are subject to greater photolysis and vaporization reactions. Lower IRF generation with more effective irrigation practices reduces erosive detachment and surface flow of immiscible compounds. Many factors affect the biological degradation and adsorption of pesticides including soil conditions and the time that a pesticide residue resides at a particular location. Generally, slowing down the movement of a pesticide can facilitate greater biological degradation in situ and/or sorption to occur. Therefore, implementing irrigation practices that reduce total application, application to non-target areas, and reduce IRF in nursery production (1) reduce water use and IRF movement, (2) maintain pesticides at the desired location for plant protection, and (3) provide time for degradation mechanisms in situ in either the surface or subsurface horizons. The effectiveness of employing improved irrigation practices to reduce pesticide residue movement will vary by pesticide physiochemical properties and formulation; however, movement can likely be predicted through interpolating between the range of pesticides investigated within this study.

5. Conclusions

The pesticides with the greatest solubilities in this study were recovered in greater percentages of the amount applied for all investigated compounds, with subsurface IRF movement representing a major fraction of the transported amount. Conversely, the pesticides with the lowest solubilities were oftentimes measured below detection limits and typically did not exceed 1 µg L−1 in subsurface IRF, with <1% of applied pesticide recovered. We had hypothesized that limiting or eliminating surface IRF by utilizing microirrigation would reduce water transport to subsurface IRF. This was the case for the mobile pesticides, and many of the more moderately mobile pesticides, while pesticides with low mobility were seldom detected in subsurface IRF. For the moderately mobile to relatively immobile compounds, this manifested in <1% of the total quantity of applied pesticide recovered in combined surface and subsurface IRF from the two microirrigation treatments. For some of the more moderately mobile pesticides, a delayed “lag effect” in subsurface IRF presence was observed, with increases in the load exported over time likely reflective of the compound matriculating through the subsurface profile due to repeated irrigation events. Microirrigation systems provide benefits that extend beyond solely achieving water conservation goals, as they represent an effective method of limiting IRF generation and the concomitant mobility of pesticides. Surface IRF represented the dominant vector for the movement of all investigated pesticides, regardless of solubility and sorption coefficients, where all compounds were lost in the greatest amounts in the days directly after pesticide application. While pesticides with greater solubility exhibited enhanced mobility in subsurface IRF, no matter the method of applying irrigation, less soluble compounds had a reduced likelihood of infiltrating and percolating through subsurface horizons; therefore, pesticide selection should involve consideration towards the inherent physiochemical properties of a compound, and how they may influence mobility. This consideration can serve towards improving best management practices when possible, understanding other factors must be accounted for with regard to selecting the proper pesticide. Efforts to ensure the retention of pesticides on production surfaces may provide enhanced pest control while facilitating conditions that support less environmentally impactful degradation processes taking place. Considering all these factors, microirrigation in container crop production represents an effective tool to simultaneously reduce the volume of water needed to irrigate crops, the volume of IRF that needs to be contained or addressed, modify pesticide movement dynamics, and mitigate potential the economic and ecologic ramifications of eventual pesticide fate. While microirrigation systems demand more labor to maintain, the water savings and the reduced agrochemical export that accompany these application mechanisms may enhance nursery crop sustainability production as concerns over water availability and resource protection mount. This research contributes to the knowledge base by enhancing understanding of the partitioning between the surface and subsurface return flow fates of pesticides, providing insights into pesticide movement that have, to date, generally focused on surface return flow movement. This research sought to provide more targeted insights into pesticide movement by assessing the total movement of return flow and associated contaminants in a clay-free sand layer as the soil, and with quantification and attention paid toward local environmental conditions that may influence movement.

Supplementary Materials

The following supporting information can be downloaded at: https://www.mdpi.com/article/10.3390/w17070953/s1, Figure S1. Schematic of the experimental nursery. Figure S2. Daily and cumulative precipitation and average daily temperature during the experimental period.

Author Contributions

Individual contributions to the research presented in this article are as follows: Conceptualization, D.E.A., R.T.F., J.S.O.J. and P.C.W.; methodology, D.E.A., B.M.C., R.T.F., F.O.H., J.S.O.J. and P.C.W.; validation, D.E.A., B.M.C., R.T.F., F.O.H., J.S.O.J. and P.C.W.; formal analysis, D.E.A., R.T.F., F.O.H., B.M.C. and P.C.W.; investigation, D.E.A., R.T.F. and F.O.H.; resources, R.T.F., J.S.O.J. and P.C.W.; data curation, D.E.A. and R.T.F.; writing—original draft preparation, D.E.A., R.T.F. and F.O.H.; writing—review and editing, D.E.A., B.M.C., R.T.F., F.O.H., J.S.O.J. and P.C.W.; visualization, R.T.F., J.S.O.J. and P.C.W.; supervision, R.T.F. and P.C.W.; project administration, R.T.F. and P.C.W.; funding acquisition, R.T.F., J.S.O.J. and P.C.W. All authors have read and agreed to the published version of the manuscript.

Funding

This research was funded by the National Institute of Food and Agriculture, the U.S. Department of Agriculture Specialty Crops Research Initiative Clean WateR3 Project, award number 2014-51181-22372; Hatch project numbers MICL02765, MICL04227, MICL02403, VA-136312, and FLA-SWS-005496; and the MSU Project GREEEN.

Data Availability Statement

Dataset available on request from the authors.

Acknowledgments

The authors appreciate the donation of plants from Spring Meadow Nursery (Grand Haven, MI, USA), and fertilizer from Harrell’s Inc. (Lakeland, FL, USA), as well as the operational support provided by Dan Kort, Shital Poudyal, Deborah Trelstad, Dana Ellison, John Lea-Cox, and Bruk Belayneh.

Conflicts of Interest

The authors declare no conflicts of interest. The funders had no role in the design of the study; in the collection, analysis, or interpretation of the data; in the writing of the manuscript; or in the decision to publish the results.

Abbreviations

The following abbreviations are used in this manuscript:
DOSDay of sampling
IRFIrrigation return flow
SS2LpdSpray stake irrigation at 2 L per day
SSθSpray stake irrigation based on sensor-derived substrate volumetric moisture content
θSubstrate volumetric water content
TPMThiophanate-methyl

Appendix A

Appendix A.1. Pesticide Analysis Methods

These methods first appeared in Agricultural Water Management, Abdi et al. [2], and are reprinted with permission from Elsevier.
Due to matrix effects determined in preliminary work for this study, non-treated control sample waters from a surface and subsurface return flow collection tank were provided to prepare corresponding matrix matched calibration standard series and quality assurance/quality control (QA/QC) samples.

Appendix A.1.1. Extraction Procedure

PESTANAL analytical grade standards of acephate (P/N: 45315-250MG), bifenthrin (P/N: 34314-100MG), chlorpyrifos (P/N: 45395-100MG), isoxaben (P/N: 36138-100MG), metalaxyl-m (P/N: 32808-100MG), oxyflurofen (P/N: 35031-100MG), thiophanate-methyl (P/N: 45688-250MG), and triflumizole (P/N: 32611-100MG), were purchased from Sigma-Aldrich (St. Louis, MO, USA). The prodiamine (P/N: N-13096-100MG) standard (99.5% purity) was purchased from ChemService (West Chester, PA, USA).
All samples were extracted according to a modified version of US EPA Method 3510C.3 Briefly, 500 mL of sample water was added to a 1000 mL Teflon separatory funnel and extracted with 30 mL methylene chloride. The procedure was repeated two additional times using a total of 90 mL of methylene chloride. The methylene chloride extracts were combined after each extraction, placed in a water bath at 35 °C, and concentrated to a final volume of 0.5 mL using a gentle flow of nitrogen gas. A solvent exchange with methanol was performed by adding approximately 1–2 mL of methanol to the concentrated extract, re-concentrating it to 0.5 mL, then repeating this step an additional two times or until all methylene chloride was evaporated. The final 1 mL extracts were transferred into individual 2 mL amber glass vials for analysis on the respective instrument. Matrix matched calibration standards were prepared by adding known amounts of pesticide solution then extracting 500 mL aliquots of each non-treated control water as previously described. Target pesticide concentrations in the final 1 mL calibration extracts were 25, 100, 500, and 750 µg L−1. Respective samples were quantitated under the paired matrix matched calibration series.

Appendix A.1.2. LCMS Analysis

Acephate, isoxaben, metalaxyl-m, triflumizole, and thiophante-methyl were analyzed by high-pressure liquid chromatography–mass spectrometry (HPLC-MS). Pesticide concentrations were quantified using a Waters Alliance 2695 HPLC (Waters Corp., Milford, MA, USA) equipped with a C18 reversed phase LC column (Phenomenex Synergi Hydro-RP; 80 Å, 50 × 2 mm, 4 µm; P/N 00B-4375-B0) with a C18 guard column (Waters Nova-Pak; 4 µm; P/N: WAT044380), coupled to a Micromass Quattro Ultima MS (Micromass UK Limited, Wythenshawe, UK). Fifty μL of each sample were injected onto the LC column and pesticides were separated and concentrated using a gradient mobile phase consisting of solution A (Optima LC-MS water with 0.1% Optima formic acid, 0.9% 1M ammonium formate (NH4COOH), and 5% Optima methanol) and solution B (Optima methanol with 0.1% Optima formic acid, 0.9% 1 M NH4COOH, and 9% Optima water). The gradient started with a 60:40 (A:B) ratio from 0 to 6 min, changing linearly to 5:95 (A:B) from 6 to 8 min where it was held from 8 to 15 min, and then returned to initial conditions at 15 min (total run time of 15 min). The flow rate was constant at 0.50 mL min−1 and the column was held at ambient temperature (~22 °C). All chemicals for the mobile phases A and B were purchased from Thermo Fisher Scientific, Waltham, MA, USA. The MS/MS was operated in heated electrospray ionization (ESI) positive mode with a capillary voltage of 2.96 kV. Source and desolvation temperatures were 150 °C and 350 °C, respectively. Cone and desolvation gas flow rates were 50 and 500 L h−1, respectively, with nitrogen used as the carrier gas. The data were acquired in multiple-reaction monitoring (MRM) mode. The conditions used to perform m/z transitions are summarized in Table A1.
Table A1. Retention times, precursor and product ions, and MS parameters used for identification and quantification of target pesticides by LCMS.
CompoundRetention Time (min)Precursor Ion Product Ions Dwell (ms)Cone (V)CE (V)
Acephate1.27184125, 1430.52517
Isoxaben8.863331650.52217
Metalaxyl-m8.44280192, 2200.51717
Thiophanate-methyl0.85343151, 2260.52017
Triflumizole9.834673, 2780.52217
AMPA6.5911063, 790.52021
13C-AMPA6.5911463.2, 790.52319
Glyphosate4.3516863, 790.52020
13C-Glyphosate4.35169.763.2, 79.10.52317

Appendix A.1.3. GC-ECD Analysis

Bifenthrin, chlorpyrifos, oxyfluorfen, and prodiamine were analyzed using an HP 5890 Series II GC (Agilent Technologies, Santa Clara, CA, USA) equipped with dual-electron capture detectors (ECDs) and fitted with DB-5MS + DG and DB-35MS columns (30 m × 0.250 mm; Agilent technologies, Santa Clara, CA). Extracts (1 μL) were injected into the injection port operating in splitless mode (1 min) and equipped with a Siltek gooseneck splitless liner with deactivated glass wool (Restek Corp., Bellefonte, PA, USA; 4 mm × 6.5 mm × 78.5; P/N 22406-213.5). The injector and detector temperatures were held at 225 °C and 300 °C, respectively, and the head pressure was held at 20 psi continuously. The oven program began with an initial temperature of 60 °C. After an initial hold time of 1.5 min, the temperature was increased to 280 °C at a rate of 65 °C min−1 with a final hold time of 5.2 min (with a total run time of 10.08 min). The retention times of each pesticide on the respective column are provided in Table A2. The pesticides needed to be detected in both columns in order to confirm their presence. Between the two columns, analyzed concentrations were generally within ±10% of one another. Calibration series were run before and after each batch of 20 samples as described earlier.
Table A2. Retention times used for identification and quantification of target pesticides by dual column GCECD.
CompoundColumn Retention Time (min)
DB-5MS + DGDB-35MS
Bifenthrin30.3731.49
Chlorpyrifos22.6525.73
Oxyfluorfen25.7928.28
Prodiamine21.9624.30

Appendix A.1.4. Quality Control/Assurance

QA/QC samples were extracted and analyzed along with experimental samples. Method blanks (reagent-grade water) were extracted and analyzed to verify that the extraction/analysis methods did not cross contaminate samples. Spiked QA/QC samples, consisting of reagent-grade water spiked with 100 μL of a 1 mg L−1 solution of pesticides in methanol, were also extracted and analyzed for method validation. The passing criterion was 80–120% recovery. One randomly selected sample per twenty samples collected was used for matrix spikes and matrix spike duplicates. These samples were randomly selected and divided into three 500 mL aliquots, with two aliquots receiving 100 μL of a 1 mg L−1 solution of pesticides in methanol. Each sample was extracted and analyzed as previously described. The passing criteria were 80–120% recovery of the added pesticide in spiked samples and ≤10% concentration differences between duplicate samples. The minimum method quantitation limit for all pesticides was 0.125 µg L−1.

References

  1. Abdi, D.E.; Fernandez, R.T. Reducing water and pesticide movement in nursery production. HortTechnology 2019, 29, 730–735. [Google Scholar] [CrossRef]
  2. Abdi, D.E.; Owen, J.S., Jr.; Wilson, P.C.; Hinz, H.O.; Cregg, B.M.; Fernandez, R.T. Reducing Pesticide Transport in Surface and Subsurface Irrigation Return Flow in Specialty Crop Production. Agric. Water Manag. 2021, 256, 107124. [Google Scholar] [CrossRef]
  3. Vryzas, Z. Pesticide fate in soil-sediment-water environment in relation to contamination preventing actions. Curr. Opin. Environ. Sci. Health 2018, 4, 5–9. [Google Scholar] [CrossRef]
  4. Von Merey, G.; Manson, P.S.; Mehrsheikh, A.; Sutton, P.; Levine, S.L. Glyphosate and Aminomethylphosphonic acid chronic risk assessment for soil biota. Environ. Toxicol. Chem. 2016, 35, 2742–2752. [Google Scholar] [CrossRef]
  5. Agro, E.; Zheng, Y. Controlled-release fertilizer application rates for container nursery crop production in southwestern Ontario, Canada. HortScience 2014, 49, 1414–1423. [Google Scholar] [CrossRef]
  6. Majsztrik, J.C.; Fernandez, R.T.; Fisher, P.R.; Hitchcock, D.R.; Lea-Cox, J.; Owen, J.S., Jr.; Oki, L.R.; White, S.A. Water Use and Treatment in Container-grown specialty crop production: A review. Water Air Soil Pollut. 2017, 228, 151. [Google Scholar] [CrossRef] [PubMed]
  7. Davies, M.J.; Harrison-Murray, R.; Atkinson, C.J.; Grant, O.M. Application of deficit irrigation to container-grown hardy ornamental nursery stock via overhead irrigation, compared to drip irrigation. Agric. Water Manag. 2016, 163, 244–254. [Google Scholar] [CrossRef]
  8. Million, J.B.; Yeager, T.H. Capture of sprinkler irrigation water by container-grown ornamental plants. HortScience 2015, 50, 442–446. [Google Scholar] [CrossRef]
  9. Pershey, N.A.; Fernandez, R.T.; Cregg, B.M.; Andresen, J.A. Irrigating based on daily water use reduces nursery effluent volume and nutrient load without reducing growth of four conifers. HortScience 2015, 50, 1553–1561. [Google Scholar] [CrossRef]
  10. Briggs, J.A.; Riley, M.B.; Whitwell, T. Quantification and remediation of pesticides in runoff water from containerized plant production. J. Environ. Qual. 1998, 27, 814–820. [Google Scholar] [CrossRef]
  11. Warsaw, A.L.; Fernandez, R.T.; Cregg, B.M.; Andresen, J.A. Container-grown ornamental plant growth and water runoff nutrient content and volume under four irrigation treatments. HortScience 2009, 44, 1573–1580. [Google Scholar] [CrossRef]
  12. Warsaw, A.L.; Fernandez, R.T.; Kort, D.R.; Cregg, B.M.; Rowe, B.; Vandervoort, C. Remediation of metalaxyl, trifluralin, and nitrate from nursery runoff using container-grown woody ornamentals and phytoremediation areas. Ecol. Eng. 2012, 47, 254–263. [Google Scholar] [CrossRef]
  13. Incrocci, L.; Marzialetti, P.; Incrocci, G.; Di Vita, A.; Balendonck, J.; Bibbiani, C.; Spagnol, S.; Pardossi, A. Sensor-based management of container nursery crops irrigated with fresh or saline water. Agric. Water Manag. 2019, 213, 49–61. [Google Scholar] [CrossRef]
  14. Lea-Cox, J.D.; Bauerle, W.L.; van Iersel, M.W.; Kantor, G.F.; Bauerle, T.L.; Lichtenberg, E.; King, D.M.; Crawford, L. Advancing wireless sensor networks for irrigation management of ornamental crops: An overview. HortTechnology 2013, 23, 717–724. [Google Scholar] [CrossRef]
  15. Gardner, D.S.; Branham, B.E. Effect of turfgrass cover and irrigation on soil mobility and dissipation of mefenoxam and propiconazole. J. Environ. Qual. 2001, 30, 1612–1618. [Google Scholar] [CrossRef]
  16. Lupi, L.; Bedmar, F.; Puricelli, M.; Marino, D.; Aparicio, V.C.; Wunderlin, D.; Miglioranza, K.S.B. Glyphosate runoff and its occurrence in rainwater and subsurface soil in the nearby area of agricultural fields in Argentina. Chemosphere 2019, 225, 906–914. [Google Scholar] [CrossRef]
  17. Riley, M.B.; Keese, R.J.; Camper, N.D.; Whitwell, T.; Wilson, P.C. Pendimethalin and oxyfluorfen residues in pond water and sediment from container plant nurseries. Weed Technol. 1994, 8, 299–303. [Google Scholar] [CrossRef]
  18. Hinz, F.O.; Fisher, P.R.; Wilson, P.C. Losses of selected pesticides in drainage water from containerized ornamental plants. J. Environ. Qual. 2020, 49, 1334–1346. [Google Scholar] [CrossRef]
  19. Abdi, D.E.; Owen, J.S., Jr.; Brindley, J.C.; Birnbaum, A.; Cregg, B.M.; Fernandez, R.T. Irrigation return flow and nutrient movement mitigation by irrigation method for container plant production. Irrig. Sci. 2021, 39, 567–585. [Google Scholar] [CrossRef]
  20. Text Recycling Research Project. Best Practices for Researchers. Available online: https://textrecycling.org/resources/best-practices-for-researchers/ (accessed on 14 November 2024).
  21. Abdi, D.E. Reducing Water and Agrochemical Movement from Container Nursery Production Using Bioreactors and Irrigation Management. Ph.D. Dissertation, Michigan State University, East Lansing, MI, USA, 2020. [Google Scholar]
  22. MSU Enviroweather. Available online: https://enviroweather.msu.edu/weather.php?stn=msu (accessed on 1 March 2023).
  23. Fare, D.C.; Gilliam, C.H.; Keever, G.J.; Olive, J.W. Cyclic irrigation reduces container nitrate-nitrogen concentration. HortScience 1994, 29, 1514–1517. [Google Scholar]
  24. Garber, M.P.; Ruter, J.M.; Midcap, J.T.; Bondari, K. Survey of container nursery irrigation practices in Georgia. HortTechnology 2002, 12, 727–731. [Google Scholar] [CrossRef]
  25. US Environmental Protection Agency Test Methods. Method 3510C: Separatory Funnel Liquid-Liquid Extraction; Revision 3; EPA: Washington, DC, USA, 1996; [CD-ROM].
  26. Lamack, W.F.; Niemera, A.X. Application method affects water application efficiency of spray stake-irrigated containers. HortScience 1993, 28, 625–627. [Google Scholar] [CrossRef]
  27. Burnett, S.E.; van Iersel, M.W. Morphology and irrigation efficiency of Gaura lindheimeri grown with capacitance sensor-controlled irrigation. HortScience 2008, 43, 1555–1560. [Google Scholar] [CrossRef]
  28. Van Iersel, M.W.; Dove, S.; Kang, J.G.; Burnett, S.E. Growth and water use of petunia as affected by substrate water content and daily light integral. HortScience 2010, 45, 277–282. [Google Scholar] [CrossRef]
  29. Bilderback, T.E. Water management is key in reducing nutrient runoff from container nurseries. HortTechnology 2002, 12, 541–544. [Google Scholar] [CrossRef]
  30. National Center for Biotechnology Information. Available online: https://pubchem.ncbi.nlm.nih.gov/ (accessed on 1 March 2023).
  31. Yen, J.; Lin, K.; Wang, U. Potential of the insecticides acephate and methamidophos to contaminate groundwater. Ecotox Environ. Saf. 2000, 45, 79–86. [Google Scholar] [CrossRef]
  32. Sánchez-Camazano, M.; Gonzalez-Pozuelo, J.M.; Sanchez-Martin, M.J.; Crisanto, T. Adsorption and mobility of acephate in soils. Ecotox Environ. Saf. 1993, 29, 61–69. [Google Scholar] [CrossRef]
  33. Jin, M.; Zhang, X.; Wang, L.; Huang, C.; Zhang, Y.; Zhao, M. Developmental toxicity of bifenthrin in embryo-larval stages of zebrafish. Aquat. Toxicol. 2009, 95, 347–354. [Google Scholar] [CrossRef]
  34. Lee, S.; Gan, J.; Kim, J.S.; Kabashima, J.N.; Crowley, D.E. Microbial transformation of pyrethroid insecticides in aqueous and sediment phases. Environ. Toxicol. Chem. 2004, 23, 1–6. [Google Scholar] [CrossRef]
  35. Zhang, Q.; Li, S.; Ma, C.; Wu, N.; Li, C.; Yang, X. Simultaneous degradation of bifenthrin and chlorpyrifos by Pseudomonas sp. CB2. J. Environ. Sci. Health B 2018, 53, 304–312. [Google Scholar] [CrossRef]
  36. Sardiña, P.; Leahy, P.; Metzeling, L.; Stevenson, G.; Hinwood, A. Emerging and legacy contaminants across land-use gradients and the risk to aquatic ecosystems. Sci. Total Environ. 2019, 695, 133842. [Google Scholar] [CrossRef] [PubMed]
  37. Bertotto, L.B.; Dasgupta, S.; Vliet, S.; Dudley, S.; Gan, J.; Volz, D.C.; Schlenk, D. Evaluation of the estrogen receptor alpha as a possible target of bifenthrin effects in the estrogenic and dopaminergic signaling pathways in zebrafish embryos. Sci. Total Environ. 2019, 651, 2424–2431. [Google Scholar] [CrossRef] [PubMed]
  38. Brander, S.M.; Gabler, M.K.; Fowler, N.L.; Connon, R.E.; Schlenk, D. Pyrethroid pesticides as endocrine disruptors: Molecular mechanisms in vertebrates with a focus on fishes. Environ. Sci. Technol. 2016, 50, 8977–8992. [Google Scholar] [CrossRef]
  39. Weston, D.P.; Holmes, R.W.; You, J.; Lydy, M.J. Aquatic toxicity due to residential use of pyrethroid insecticides. Environ. Sci. Technol. 2005, 39, 9778–9784. [Google Scholar] [CrossRef]
  40. Camper, N.D.; Kim, J.H.; Riley, M.B. Degradation of isoxaben in soils and an aqueous system. J. Environ. Sci. Health B 2001, 36, 729–739. [Google Scholar] [CrossRef]
  41. Walker, A. Evaluation of a simulation model for prediction of herbicide movement and persistence in soil. Weed Res. 1987, 27, 143–152. [Google Scholar] [CrossRef]
  42. Triantafyllidis, V.; Hela, D.; Papadaki, M.; Bilalis, D.; Konstantinou, I. Evaluation of mobility and dissipation of mefenoxam and pendimethalin by application of CSTR model and field experiments using bare and tobacco tilled soil columns. Water Air Soil Pollut. 2012, 223, 1625–1637. [Google Scholar] [CrossRef]
  43. Alister, C.A.; Gomez, P.A.; Rojas, S.; Kogan, M. Pendimethalin and oxyfluorfen degradation under two irrigation conditions over four years application. J. Environ. Sci. Health B 2009, 44, 337–343. [Google Scholar] [CrossRef]
  44. Milhome, M.A.L.; Sousa, P.L.R.; Lima, F.A.F.; Nascimento, R.F. Influence the use of pesticides in the quality of surface and groundwater located in irrigated areas of Jaguaribe, Ceara, Brazil. Int. J. Environ. Res. 2015, 9, 255–262. [Google Scholar] [CrossRef]
  45. Slotkin, T.A.; Seidler, F.J.; Wu, C.; MacKillop, E.A.; Linden, K.G. Ultraviolet photolysis of chlorpyrifos: Developmental neurotoxicity modeled in PC12 cells. Environ. Health Perspect. 2008, 117, 338–343. [Google Scholar] [CrossRef]
  46. Muñoz, A.; Ródenas, M.; Borrás, E.; Vázquez, M.; Vera, T. The gas-phase degradation of chlorpyrifos and chlorpyrifos-oxon towards OH radical under atmospheric conditions. Chemosphere 2014, 111, 522–528. [Google Scholar] [CrossRef]
  47. Briceño, G.; Fuentes, M.S.; Palma, G.; Jorquera, M.A.; Amoroso, M.J.; Diez, M.C. Chlorpyrifos biodegradation and 3,5,6-trichloro-2-pyridinol production by actinobacteria isolated from soil. Int. Biodeterior. Biodegrad. 2012, 73, 1–7. [Google Scholar] [CrossRef]
  48. Xi, J.; Shao, J.; Wang, Y.; Wang, X.; Yang, H.; Zhang, X.; Xiong, D. Acute toxicity of triflumizole to freshwater green algae Chlorella vulgaris. Pestic. Biochem. Physiol. 2019, 158, 135–142. [Google Scholar] [CrossRef] [PubMed]
  49. Dion, H.M.; Harsh, J.B.; Hill, H.H., Jr. Competitive sorption between glyphosate and inorganic phosphate on clay minerals and low organic matter soils. J. Radioanal. Nucl. Chem. 2001, 249, 385–390. [Google Scholar] [CrossRef]
  50. Sasal, M.C.; Demonte, L.; Cislaghi, A.; Gabioud, E.A.; Oszust, J.D.; Wilson, M.G.; Michlig, N.; Beldoménico, H.R.; Repetti, M.R. Glyphosate loss by runoff and its relationship with phosphorus fertilization. J. Agric. Food Chem. 2015, 63, 4444–4448. [Google Scholar] [CrossRef]
  51. Saunders, L.E.; Pezeshki, R. Glyphosate in runoff waters and in the root-zone: A review. Toxics 2015, 3, 462–480. [Google Scholar] [CrossRef]
  52. Battaglin, W.A.; Kolpin, D.W.; Scribner, E.A.; Kuivila, K.M.; Sandstrom, M.W. Glyphosate, other herbicides, and transformation products in Midwestern streams. J. Am. Water Resour. Assoc. 2005, 41, 323–332. [Google Scholar] [CrossRef]
  53. Briggs, J.; Whitwell, T.; Fernandez, R.T.; Riley, M.B. Effect of integrated pest management strategies on chlorothalonil, metalaxyl, and thiophanate-methyl runoff at a container nursery. J. Am. Soc. Hortic. Sci. 2002, 127, 1018–1024. [Google Scholar] [CrossRef]
  54. Cycoń, M.; Wójcik, M.; Piotrowska-Seget, Z. Biodegradation kinetics of the benzimidazole fungicide thiophanate-methyl by bacteria isolated from loamy sand soil. Biodegradation 2011, 22, 573–583. [Google Scholar] [CrossRef]
  55. National Pesticide Information Center. Available online: https://www.npic.orst.edu/ (accessed on 11 March 2025).
  56. Stearman, G.K.; George, D.B.; Hutchings, L.D. Removal of nitrogen, phosphorus, and prodiamine from a container nursery by a subsurface flow constructed wetland. J. Bioremediat. Biodegrad. 2012, S7, 1–5. [Google Scholar] [CrossRef]
  57. Environmental Protection Agency. Available online: https://www.epa.gov/pesticides/epa-proposes-cancel-all-one-use-pesticide-acephate-protect-human-health#:~:text=Home-,EPA%20Proposes%20to%20Cancel%20All%20but%20One%20Use,Acephate%20to%20Protect%20Human%20Health (accessed on 11 March 2025).
  58. Environmental Protection Agency. Available online: https://www.epa.gov/pesticide-worker-safety/epa-update-use-pesticide-chlorpyrifos-food (accessed on 11 March 2025).
  59. European Commission. Available online: https://food.ec.europa.eu/plants/pesticides/approval-active-substances-safeners-and-synergists/renewal-approval/chlorpyrifos-chlorpyrifos-methyl_en (accessed on 11 March 2025).
Figure 1. Irrigation applied (a) and surface (b) and subsurface (c) irrigation return flow (IRF) volumes during monitoring period 1 starting on 27 June 2017 (Day 0). Only surface IRF was collected on Day 0 since pesticides were applied this day and would not have been transported in subsurface IRF by sampling time on Day 0. Means with different letters above bars are significantly different at p ≤ 0.05 by Tudkey’s HSD. NS Not significantly different at p ≤ 0.10. * 0 (zero) IRF occurred.
Water 17 00953 g001
Figure 2. Irrigation applied (a) and surface (b) and subsurface (c) irrigation return flow (IRF) volumes during monitoring period 2 starting on 7 August 2017 (Day 0). Means with different letters above bars are significantly different at p ≤ 0.05 by Tukey’s HSD. NS Not significantly different at p ≤ 0.10. * 0 (zero) IRF occurred.
Water 17 00953 g002
Figure 3. Irrigation applied (a) and surface (b) and subsurface (c) irrigation return flow (IRF) volumes during monitoring period 3 starting on 28 August 2017 (Day 0). Means with different letters above bars are significantly different at p ≤ 0.05 by Tukey’s HSD. NS Not significantly different at p ≤ 0.10. * 0 (zero) IRF occurred.
Water 17 00953 g003
Table 1. Pesticide mobility groups, chemical class, and important physical and chemical properties for each active ingredient. Pesticides were categorized based on solubility and Koc Mccalls and FAO classifications.
Active Ingredient:Water Solubility (mg/L) zKoc zVapor Pressure mm Hg zHalf-Life Soil (days) zHalf-Life Water (days) zLC50 (µg L−1) Daphnia magnaLC50 (µg L−1) Onchorynchus mykissMccalls (Koc Class) yFAO Classification of Mobility (Koc) xFAO Classification of Mobility (Solubility) x
Acephate818,0004.71.7 × 10−6<3–326–201100–71,800 z,w,v1000–800,000Very HighHighly Mobile Highly Soluble
Mefenoxam26,0006605.62 × 10−6 707–27900–4100 u470LowModerately MobileHighly Soluble
Glyphosate10,5002600–49001.84 × 10−7473–91234,000 z77,600–134,000SlightlySlightly MobileHighly Soluble
Thiophanate-Methyl26.63307.13 × 10−87516,000 z7800–25,200MediumModerately MobileReadily Soluble
Triflumizole10.214001.4 × 10−6 1841420 z,t580LowSlightly MobileReadily Soluble
Isoxaben1.4233004.13 × 10−9100141300 s1100SlightlySlightly MobileModerately Soluble
Chlorpyrifos1.4995–31,0002.02 × 10−57–12035–781–3.7 z,r8–550Low to ImmobileModerately to Hardly MobileModerately Soluble
Oxyfluorfen0.11689002 × 10−730–7017–2880 z,q410ImmobileSlightly MobileSlightly Soluble
Prodiamine0.0135440–16,200 5.6 × 10−669–1201.4–5.1660 p830ImmobileSlightly to Hardly MobileNot Soluble
Bifenthrin<0.0018387–14,3321.81 × 10−7 122–345276–4160.86–12.4 z0.15ImmobileSlightly to Hardly MobileNot Soluble
Table 2. Comparison of irrigation volume applied per ha over the three monitoring periods when water was applied as 19 mm daily overhead irrigation (control), 2 L daily micrroirrigation via spray stake (SS2Lpd), or via spray stake based on daily water use as determined by volumetric substrate water content (SSθ). All control and SS2Lpd replicates received an identical, static volume every day throughout the course of the study (respectively); whereas, the SSθ treatment varied between replicates based on in-container substrate θ.
Monitoring Period 1Monitoring Period 2Monitoring Period 3
Total Precipitation (mm)70.0922.8316.75
Total kL ha−1 Applied
Control3238 a z3238 a3238 a
SS2Lpd827 b763 b827 b
SSθ733 b641 b935 b
Total Days of Irrigation Applied
Control17 a17 a17 a
SS2Lpd17 a17 a17 a
SSθ12 b13 b15 a
Notes: z Means followed by different letters are significantly different at p ≤ 0.05 by Tukey’s HSD.
Table 3. Daily pesticide load per ha and the percentage of applied pesticide recovered in samples collected from irrigation return flow over the 16 days of monitoring during period 1 starting on 7 June 2017. The herbicide isoxaben was applied before other pesticides and then watered-in as per the label instructions before the application of the remaining pesticides. Surface return flow was collected after watering-in but subsurface return flow was not collected until day 1; thus, isoxaben is the only pesticide with surface return flow data for day 0.
Sample Day
014816% Recovered
Acephate Load (g)
Insecticide applied as Acephate 97UP at 553 g ha−1 active ingredient
TreatmentSurface Return Flow
Control-56.7412.11 a5.89 a2.93 a14.05
SSLpd-00.03 b0.97 b5.56 a1.19
SSθ-00.02 b0 b3.39 a0.62
Subsurface Return Flow
Control-26.07 a40.19 a18.97 a9.63 a17.15
SSLpd-1.17 a42.69 a15.88 a29.68 a16.17
SSθ-0.93 a3.59 a8.65 a21.66 a6.30
Bifenthrin Load (mg)
Insecticide applied as Talstar P at 130,000 mg ha−1 active ingredient
Surface Return Flow
Control-405.274.42 a9.82 a34.79 a0.35
SSLpd-00.01 b0.08 a35.33 a0.03
SSθ-00.07 b0 a17.87 a0.01
Subsurface Return Flow
Control-10.15 a6.10 a3.26 a9.87 a0.02
SSLpd-4.07 ab5.14 a2.10 a12.43 a0.02
SSθ-3.44 b0.64 b1.11 a10.73 a0.01
Isoxaben Load (g)
Herbicide applied as Gallery 75DF at 867 g ha−1 active ingredient
Surface Return Flow
Control14.86 a36.089.73 a8.71 a0.15 a8.02
SSLpd5.11 ab00.02 b0.13 b0.69 a0.69
SSθ0.16 b0<0.01 b0 b0.36 a0.06
Subsurface Return Flow
Control-19.02 a13.65 a4.44 a0.29 a4.31
SSLpd-2.61 b2.19 b1.16 b0.90 a0.79
SSθ-0.58 b0.03 b0.06 b0.87 a0.18
Mefenoxam Load (mg)
Fungicide applied as Mefenoxam 2AQ at 18,200 mg ha−1 active ingredient
Surface Return Flow
Control-2825.1053.37 a31.12 a32.15 a16.16
SSLpd-00.04 b5.48 b63.16 a0.38
SSθ-00.07 b0 b46.03 a0.25
Subsurface Return Flow
Control-623.72 a241.70 a54.50 a59.45 a5.38
SSLpd-6.12 a131.30 ab55.21 a236.38 a2.36
SSθ-6.63 a4.87 b10.14 a145.08 a0.92
Notes: Means followed by different letters within each sample day and location (surface or subsurface) are significantly different at p ≤ 0.05 by Tukey’s HSD.
Table 4. Daily pesticide load per ha and percentage of applied pesticide recovered in samples collected from irrigation return flow over 16 days of monitoring during period 2 starting on 7 August 2017.
Sample Day
124816% Recovered
Chlorpyrifos Load (mg)
Insecticide applied as Lorsban 4E at 1,145,800 mg ha−1 active ingredient
TreatmentSurface Return Flow
Control11248.01 a1885.64 a1123.88 a118.24 a85.75 a1.26
SSLpd103.94 b0 b126.30 b6.86 b0 b0.02
SSθ1.00 b0 b0 b0 b0 b<0.01
Subsurface Return Flow
Control111.74 a90.70 a152.17 a45.22 a13.44 a0.04
SSLpd22.20 b8.44 a2.00 b6.62 a1.87 a<0.01
SSθ7.22 b1.35 a3.91 b23.07 a9.19 a<0.01
Glyphosate Load (g)
Herbicide applied as Roundup PowerMax at 2078 g ha−1 active ingredient
Surface Return Flow
Control1.07 a68.66 a9.84 a0.51 a0.08 a3.86
SSLpd0.21 a0 a1.20 a0.01 a0 b0.07
SSθ0.19 a0 a1.20 a0.01 a0 b0.07
Subsurface Return Flow
Control0.43 a0.55 a0.61 a0.10 a0.08 a0.08
SSLpd0.22 a0.58 a0.81 a2.37 a0.41 a0.21
SSθ0.08 a0.03 a1.49 a2.00 a0.17 a0.18
Oxyfluorfen Load (mg)
Herbicide applied as Goaltender at 1,142,200 mg ha−1 active ingredient
Surface Return Flow
Control2902.85 a495.20 a948.82 a175.64 a183.95 a0.41
SSLpd213.97 b0 b52.63 b6.22 b0 b0.02
SSθ78.20 b0 b0 b0 b0 b<0.01
Subsurface Return Flow
Control16.32 a23.30 a29.72 a6.15 a2.58 a<0.01
SSLpd13.21 a12.97 a1.58 a7.30 a2.09 a<0.01
SSθ1.17 a3.82 a2.59 a6.23 a3.39 a<0.01
Triflumizole Load (mg)
Fungicide applied as Terraguard SC at 288,500 mg ha−1 active ingredient
Surface Return Flow
Control2527.23 a730.37 a442.20 a20.01 a26.745 a1.30
SSLpd90.04 b0 b41.28 ab3.78 ab0 b0.05
SSθ0.41 b0 b0 b0 b0 b<0.01
Subsurface Return Flow
Control168.16 a397.91 a268.13 a22.48 a5.11 a0.30
SSLpd13.41 b3.79 b1.81 b6.76 a2.45 a0.01
SSθ2.12 b0.58 b2.95 b36.87 a8.48 a0.02
Notes: Means followed by different letters within each sample day and location (surface or subsurface) are significantly different at p ≤ 0.05 by Tukey’s HSD.
Table 5. Daily pesticide load per ha and percentage of applied pesticide recovered in samples collected from irrigation return flow over 16 days of monitoring during period 3 starting on 28 August 2017.
Sample Day
1241116% Recovered
Glyphosate Load (g)
Herbicide applied as Roundup PowerMax at 2078 g ha−1 active ingredient
TreatmentSurface Return Flow
Control84.35 a17.16 a2.17 a0.34 a0.21 a5.02
SSLpd0.24 b0 b0 b10.73 a0 b0.53
SSθ0 b0 b0 b0.58 a0 b<0.01
Subsurface Return Flow
Control.z4.15 a0.95 a.0.15 a0.25
SSLpd0.23 a0.08 b0.08 b.0.09 a0.02
SSθ0.02 b0.01 b<0.01 c.0.07 a0.01
Prodiamine Load (mg)
Herbicide applied as Barricade 65WG at 1,697,900 mg ha−1 active ingredient
Surface Return Flow
Control406.01 a756.93 a249.02 a2302.24 a252.26 a0.23
SSLpd8.71 b0 b0 b1245.00 a0 b0.07
SSθ0 b0 b0 b61.45 a0 b<0.01
Subsurface Return Flow
Control.25.39 a24.13 a.94.21 a0.01
SSLpd4.77 a4.25 b1.84 b.4.19 b<0.01
SSθ0.51 a0.17 b0.09 b.3.76 b<0.01
Thiophanate-Methyl Load (mg)
Fungicide applied as Thiophanate Methyl 85WDG at 482,500 mg ha−1 active ingredient
Surface Return Flow
Control28,694.04 a3644.97 a4.68 a8.49 a5.16 a6.71
SSLpd7.279 b0 b0 b38.13 a0 b0.01
SSθ0 b0 b0 b18.16 a0 b<0.01
Subsurface Return Flow
Control.106.49 a3.04 a.3.63 a0.23
SSLpd3.91 a2.367 b1.61 a.2.40 a<0.01
SSθ0.51 b0.22 b0.09 b.1.85 a<0.01
Notes: Means followed by different letters within each sample day and location (surface or subsurface) are significantly different at p ≤ 0.05 by Tukey’s HSD. z Sample unavailable for analysis.
Disclaimer/Publisher’s Note: The statements, opinions and data contained in all publications are solely those of the individual author(s) and contributor(s) and not of MDPI and/or the editor(s). MDPI and/or the editor(s) disclaim responsibility for any injury to people or property resulting from any ideas, methods, instructions or products referred to in the content.

