Article

Characteristics of Spatial and Temporal Distribution of Heavy Rainfall and Surface Runoff Generating Processes in the Mountainous Areas of Northern China

1
Institute of Geographical Sciences, Hebei Academy of Sciences, Shijiazhuang 050011, China
2
Hebei Technology Innovation Center for Geographic Information Application, Shijiazhuang 050011, China
3
Key Laboratory of Agricultural Water Resources, Hebei Key Laboratory of Agricultural Water-Saving, Center for Agricultural Resources Research, Institute of Genetics and Developmental Biology, Chinese Academy of Sciences, Shijiazhuang 050001, China
*
Authors to whom correspondence should be addressed.
Water 2025, 17(7), 970; https://doi.org/10.3390/w17070970
Submission received: 10 January 2025 / Revised: 4 March 2025 / Accepted: 18 March 2025 / Published: 26 March 2025
(This article belongs to the Special Issue Urban Drainage Systems and Stormwater Management)

Abstract

:
It is essential to understand the characteristics of surface runoff generating processes under different heavy rainfall events in mountainous areas. The intensity and duration of precipitation play an important role in surface runoff processes. In this study, annual rainfall characteristics from 1987 to 2023 in the Taihang Mountains were analyzed using the Pearson-III frequency curve, homogeneity tests, and the Mann–Kendall (MK) test. Four surface runoff generation events between 2014 and 2023 were monitored. The contribution of rainfall to runoff variations was quantified through the double mass curve method. Results indicate a significant increase in the frequency of moderate and heavy rainfall events over the last decade. Spatial variability of rainfall and elevation effects in the Taihang Mountains becomes less pronounced when 24 h rainfall is below 50 mm. The two surface runoff processes in 2016 and 2023 were typical runoff resulting from excess rain, which belonged to the storm runoff. The two surface runoff processes in 2021 were runoff generation under saturated conditions. For runoff generation under saturated conditions, the contribution of rainfall was only 58.17%. When the runoff coefficient exceeded 0.5, the surface runoff generating processes were entirely determined by rainfall. This study suggested that for semi-arid regions, where rainfall is unevenly distributed over the seasons, more soil water is needed to maintain local and downstream water demand during the non-rainy season. The limitations of the study are the lack of research on factors other than rainfall that intrinsically affect the surface runoff generating process.

1. Introduction

Surface runoff has an irreplaceable role in water recharge, ecological maintenance, agricultural productivity, climate modulation, human livelihood, disaster mitigation, and economic development [1,2,3]. Surface runoff can reach the stream quickly, and thus it significantly influences streamflow response to precipitation [4]. Land use and rainfall characteristics are crucial factors affecting surface runoff processes [5], with rainfall intensity and duration being particularly influential in ecohydrological dynamics [6]. Rainfalls with greater intensity or duration result in a greater peak runoff, leading to greater total runoff in watersheds [7]. Moreover, rainfall patterns and regimes are vital determinants of water conservation [8,9]. Different rainfall regimes cause different surface runoff [10]. Global warming and climate change, are driven by greenhouse gas emissions, leading to frequent and intensive floods, flash floods, and extreme storm occurrences with inundation consequences in urban and agricultural areas [11]. Because of its marked effects on hydrological processes, climate change has attracted considerable attention from scientists and governments worldwide [12,13,14,15].
A hilly area may have more complicated runoff processes than a plain area [3], due to the diversity and unknowability of many factors in mountainous areas that influence the runoff generation processes, such as topography [16], soil type [17], and land-use type [18]. The Taihang Mountains, a typical soil and rocky mountainous area in northern China [19], form a critical transition zone between the Loess Plateau and the North China Plain [20]. As an ecological barrier and water conversion area for the North China Plain and the Beijing-Tianjin-Hebei region, China [21], the Taihang Mountains provide 3.6 billion m3 of water to the North China Plain annually [22]. Due to the high degree of heterogeneity of topography, geomorphology, rocks, soils, climate, and vegetation [23] and variable climatic conditions, complex geography, and intensive human activities [24], the evolutionary regimes, influencing factors, and driving mechanisms of hydrological processes are complex and subject to great spatial and temporal variability and uncertainty [25]. Therefore, it is essential to understand the characteristics of the surface runoff generating process under different heavy rainfall events in mountainous areas, especially in soil and rocky mountainous areas where an ecologically fragile area with more complex rainfall infiltration processes [24].
In the Haihe River Basin, China, where most tributaries originate in the Taihang Mountains, mountainous water resources have declined by 40% [26]. Moreover, Jia et al. [27] also showed that runoff in the Taihang Mountains has declined significantly since 2000, with surface water resources declining by more than 40% in eastern regions and even more than 50% in the Taihang Mountains of Hebei province, China. Most of these tributaries have become seasonal, especially in the plains, basically, all rivers are dry [28]. Although the average annual rainfall has little inter-annual variability with a value of 548 mm [29], extreme rainfall events are frequent, triggering a series of flooding disasters, which threaten ecological and water security locally and in the downstream plains, and cause great losses to local people. From 1990 to 2020, global annual economic losses from floods amounted to tens of billions of US dollars, and thousands of lives were lost yearly [30,31]. As atmospheric temperatures rise and rainfall patterns change, variability in surface runoff processes is intensifying [32,33], particularly, the infiltration and runoff generation in small watersheds on mountain slopes.
The complexity, stochasticity, and uncertainty of hydrological processes in the Taihang Mountains have increased significantly due to the incompleteness, diversity, and spatial heterogeneity of the topsoil and rocks in the mountainous areas, as well as the current climate variability. Previous rainfall-runoff studies predominantly relied on daily-resolution models, including SWAT [34], SCS-CN [35], or short-term monitoring datasets [36], this investigation systematically analyzes synchronous hourly measurements, capturing sub-daily hydrological processes (e.g., 3-h runoff hysteresis) often obscured in conventional approaches. Therefore, the objectives of this paper are to (1) elucidate the processes and characteristics of surface runoff process under different heavy rainfall events in a small watershed of the Taihang Mountains with simultaneous hourly measured rainfall and runoff data, (2) investigate how the surface runoff process has been altered under extreme rainfall conditions, and (3) discuss strategies for ensuring water resources security in the Beijing-Tianjin-Hebei region of China. The results of this study aim to provide new insights into hydrological processes in soil and rocky mountainous areas and to offer a scientific basis for enhancing water conservation in the Taihang Mountains and ensuring water security in the North China Plain.

2. Materials and Methods
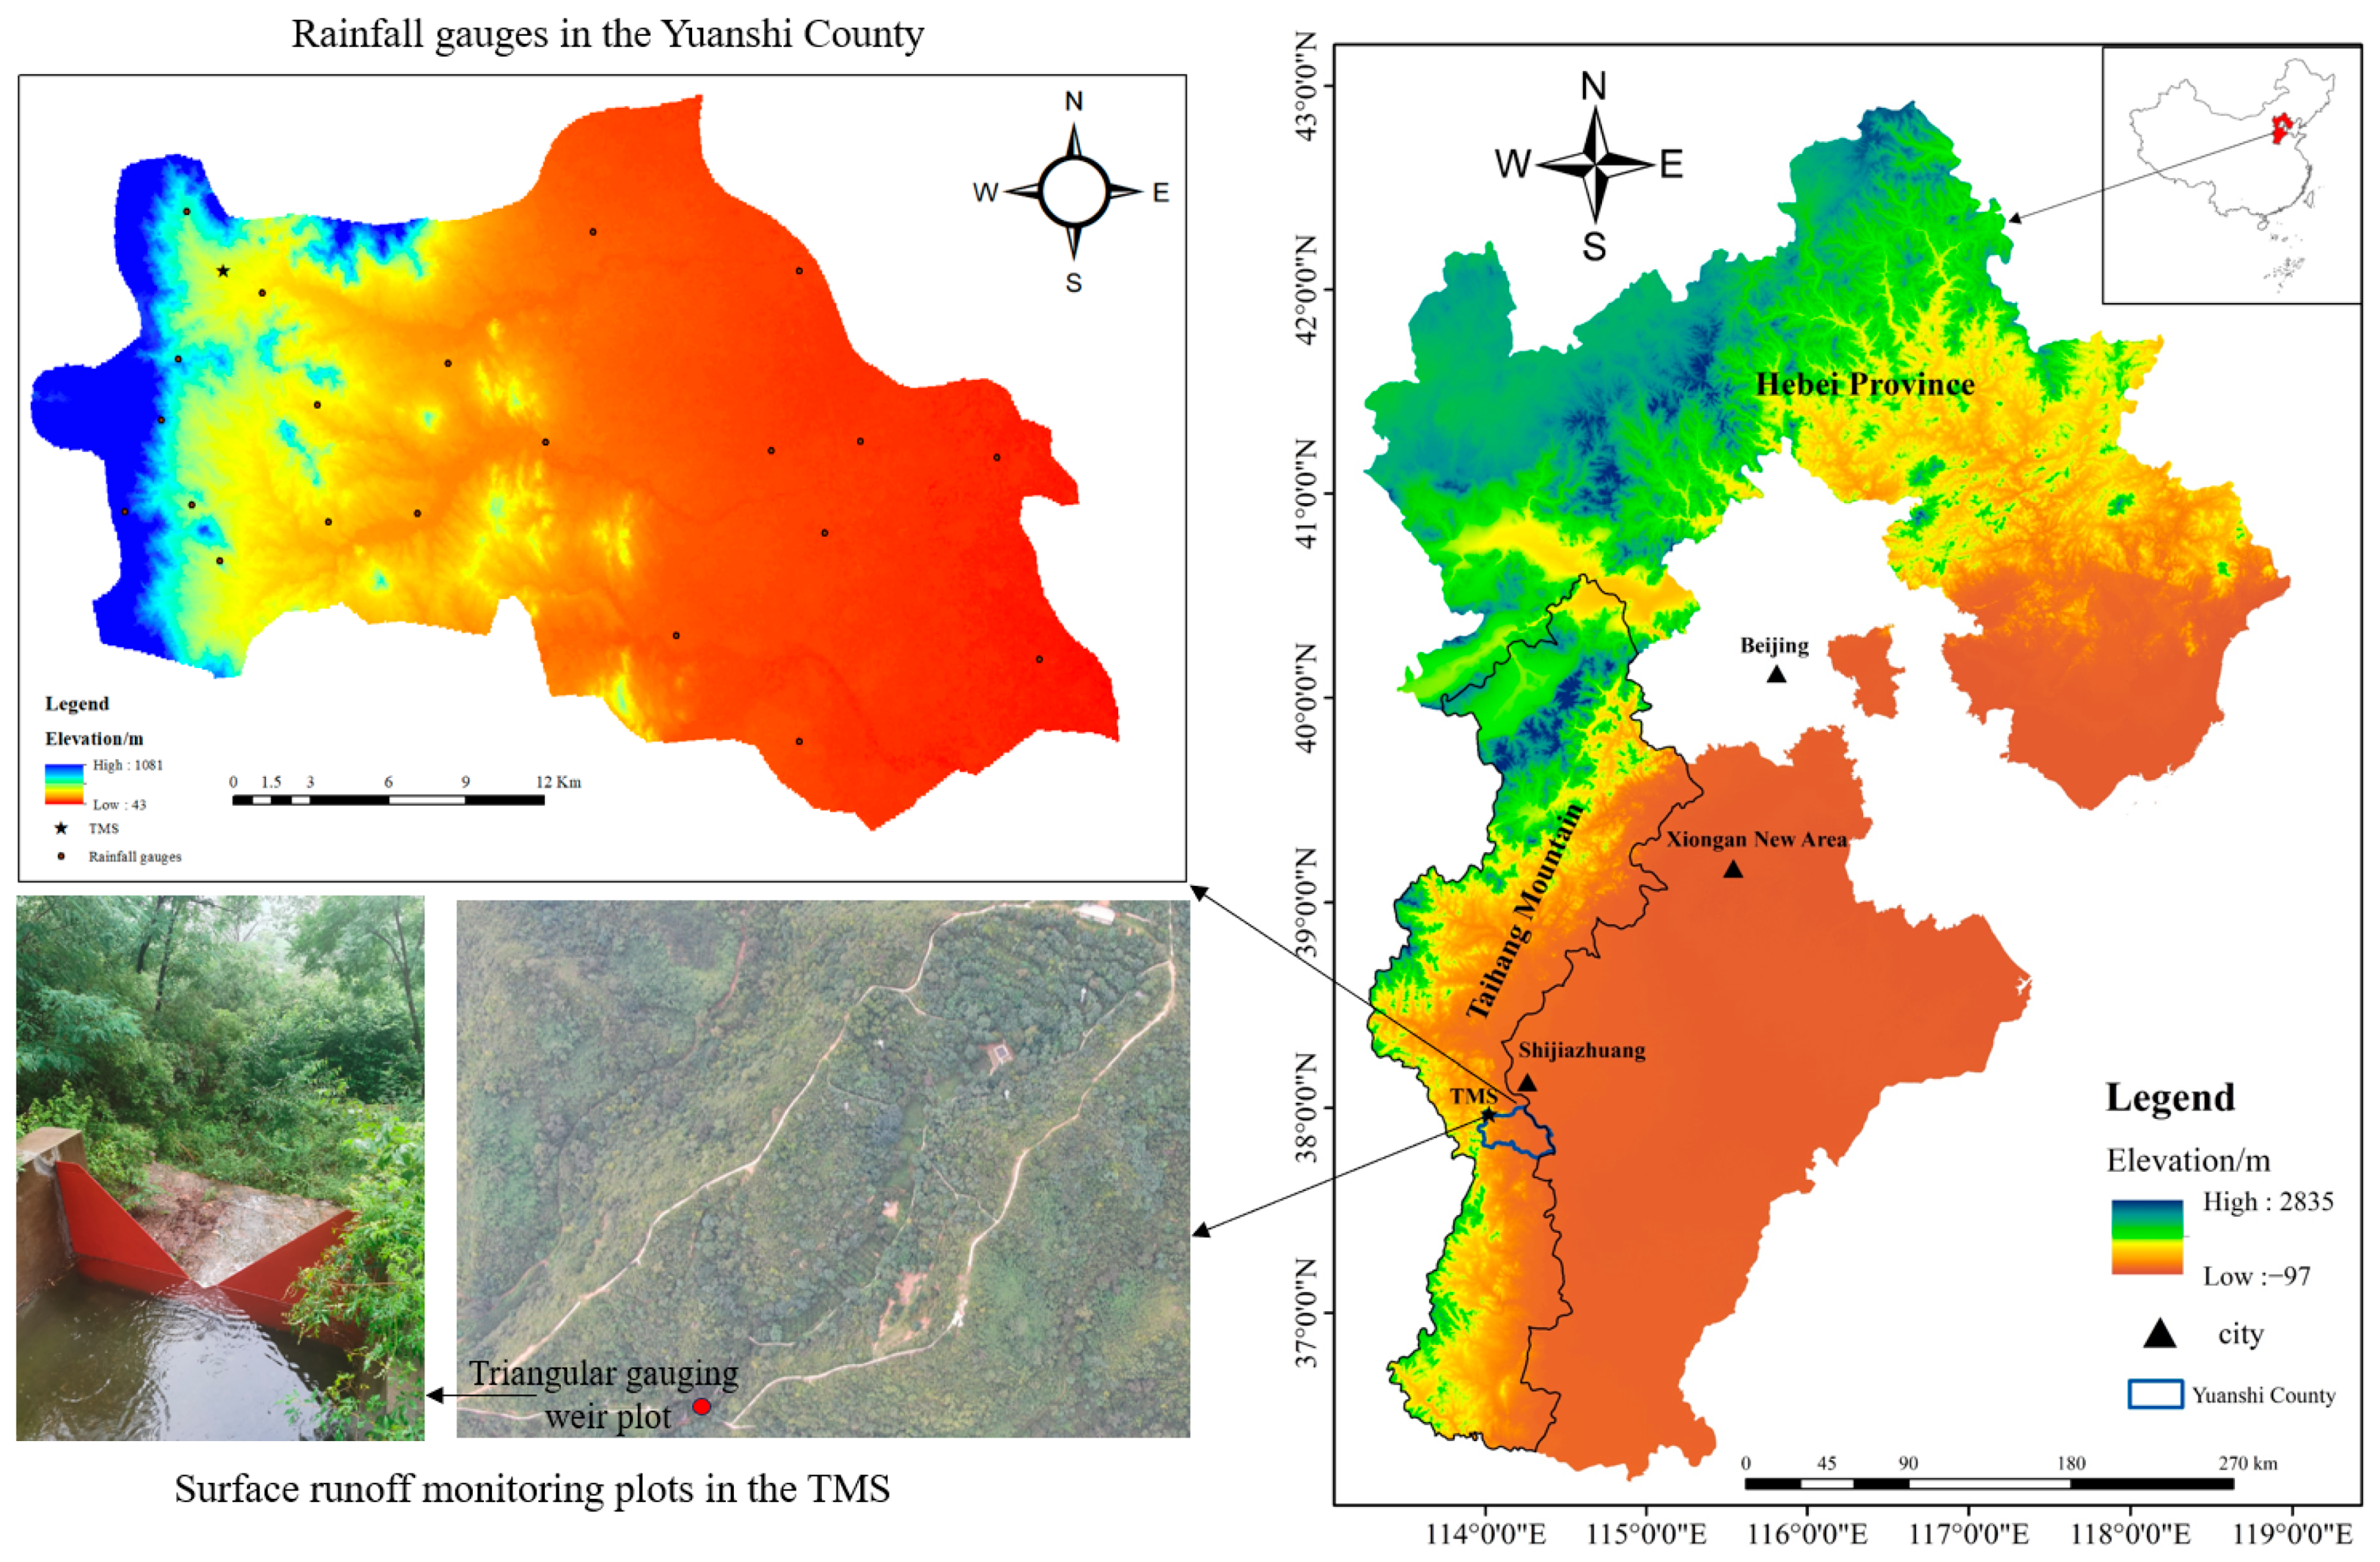
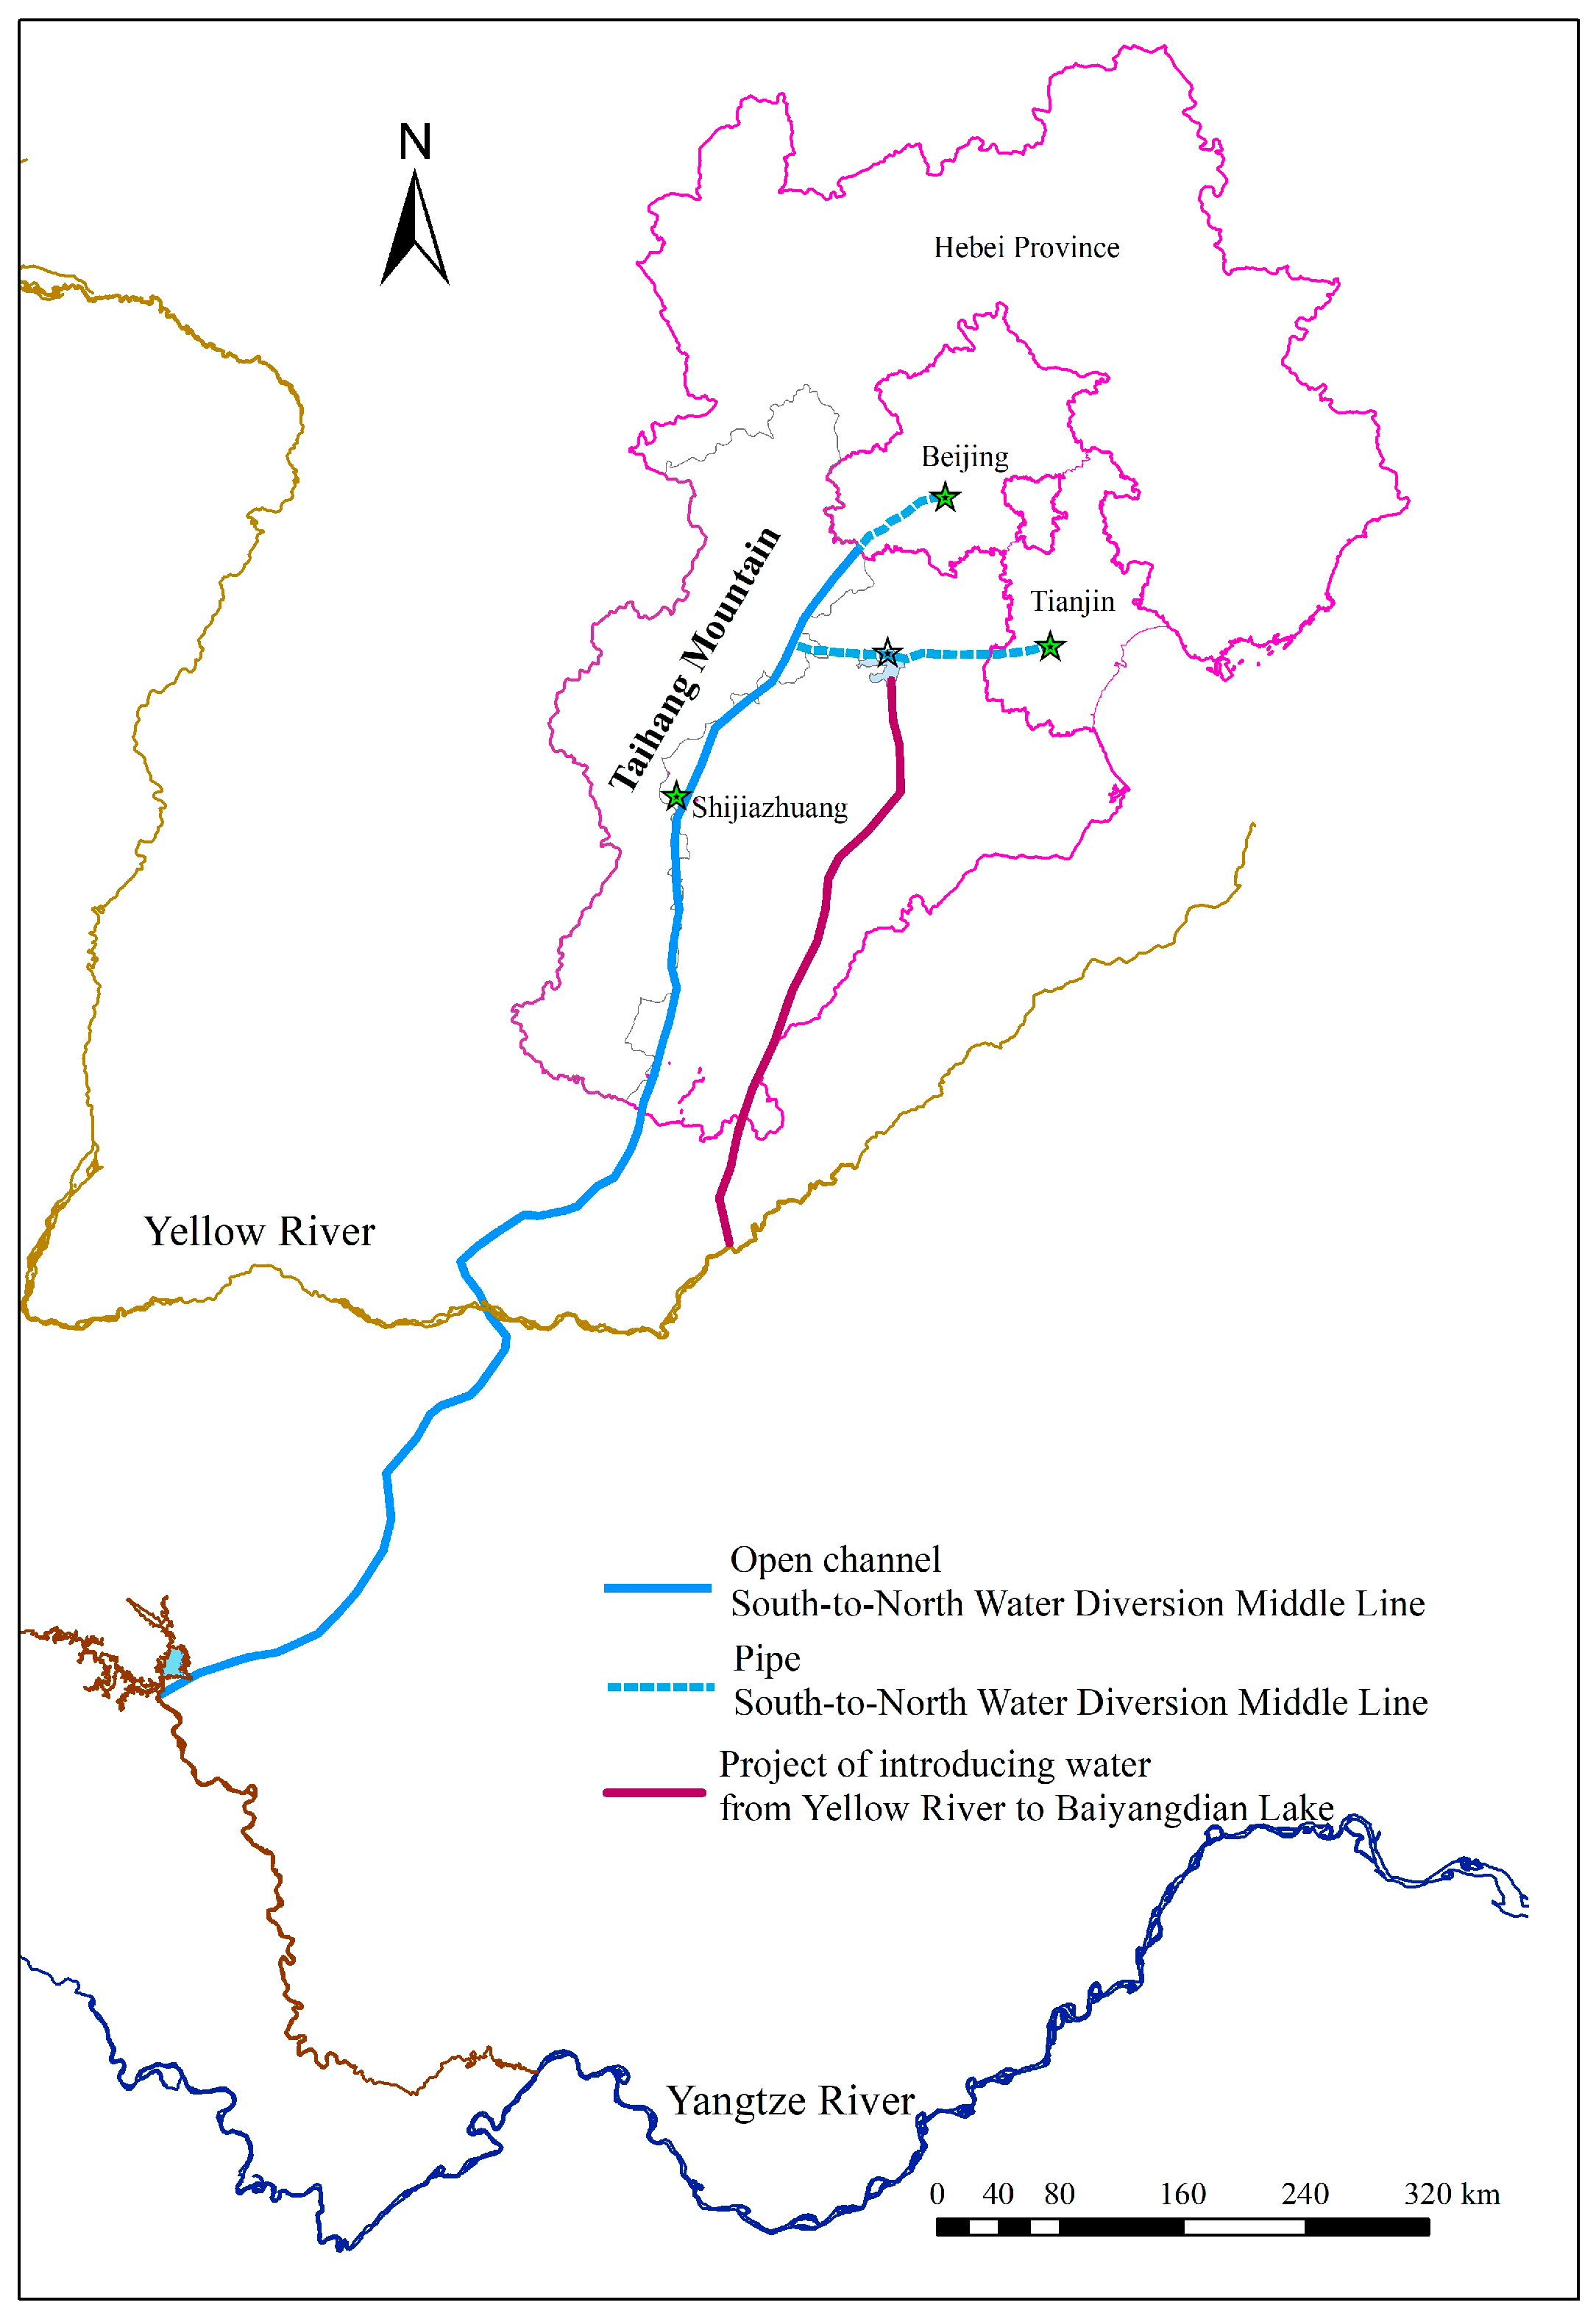
2.1. Study Area

This study was carried out at the Taihang Mountain Ecological Experimental Station (TMS) of the Chinese Academy of Sciences, China. The TMS (114°15′50″ E, 37°52′44″ N) with an altitude of 350 m, is located in the mountainous areas upstream of the Xiongan New Area, China and belongs to the middle of the eastern Taihang Mountains in Yuanshi County, Shijiazhuang City, Hebei Province, northern China (Figure 1). The study area has a semi-arid continental monsoon climate with an annual average temperature of 13.0 °C, and the water surface evaporation is 1200 mm. The average annual precipitation for the long-term period (1987–2023) is 547 mm, with more than 70% of the precipitation concentrated from June to September. The typical vegetation type is mainly 20-year-old secondary forest and scrub. The secondary forest is primarily composed of Robinia pseudoacacia L., and the shrubs are mainly Vervain Family and wild jujube [37]. The hill slopes are composed of strata characterized by “overlying soil and underlying rock”. The overlying soil layer is thin, with a thickness of 20–50 cm, and mainly consists of gravel. The thickness of the underlying rock layer, which is mainly a weathered layer of gneiss full of fissures, is 0.5–10 m [38].

2.2. Data Sources

The data used in this paper include rainfall data and surface runoff flow data, which were collected from the monitoring data of the TMS. Apart from the rainfall gauge of the TMS, there were additional 21 rainfall gauges in Yuanshi County (Figure 1) obtained from the Yuanshi County Meteorological Bureau.

2.2.1. Rainfall Monitoring

A self-recording tipping bucket rain gauge (Rain Collector II, Davis Instruments Corp., Hayward, CA, USA) was installed in the TMS to measure rainfall with a resolution of 0.25 mm (Figure 1). The time interval for data recording was set at 1 h. Different daily rainfall intensities were derived from these monitoring data. According to the classification of 24-h rainfall amounts by the China Meteorological Administration, rainfall is categorized as follows: less than 10 mm is considered light rain, 10 to 24.9 mm is considered moderate rain, 25 to 49.9 mm is considered heavy rain, and 50 mm or more is considered a rainstorm. Based on the measured rainfall data, we calculated the proportion of total rainfall with intensities greater than 10 mm/24 h (I10) and 25 mm/24 h (I25) relative to the annual rainfall from 1987 to 2023.

2.2.2. Surface Runoff Monitoring

A self-recording water level gauge (HOBO U20-001-04, Onset Computer Corporation, Bourne, MA, USA) was installed in a triangular gauging weir plot within the small watershed of the TMS in 2014 (Figure 1) to monitor the water level above the weir. Measurements were taken every hour. Additionally, manual water level measurements were conducted during each runoff generation process to calibrate the data recorded by the self-recording water gauge. The triangular gauging weir plot is a right-angled water-measuring weir. According to Chen et al. [39], the flow rate in the small watershed of the TMS was calculated using the water level above the weir with the following formula:
Q = 1.4 H2.5
where Q and H are the flow rate at the small watershed outlet (L/s) and the water level above the weir (m), respectively.
The following formula was used to calculate the surface runoff depth of the small watershed of the TMS:
R = Q × t A
where R, t, and A are the surface runoff depth during 1 h at the watershed outlet (mm), the time duration of 1 h, and the area of the small watershed (0.02625 km2), respectively.

2.3. Homogeneity and Trend Test

Homogeneous time series are extremely important for trend analysis studies of hydro-meteorological variables because the trends in them result from the changes in climate and air [40]. Non-climatic changes may disrupt the homogeneity of the time series, and therefore, a homogeneity test is required before trend analysis. Before the trend analysis, a homogeneity test for rainfall data is applied to determine the homogeneity of the data at a 5% significance level with the following formula [41]:
Z R = R n 2 N 1 N 2 N 1 + N 2 + 1 2 N 1 N 2 ( 2 N 1 N 2 N ) N 2 ( N 1 )
where ZR is the run homogeneity test result, N is the number of data, Rn is the run number, N1 (N2) is the number of values lower (higher) than the median.
If the calculated run homogeneity test result ZR value corresponds to a 5% significance level or below, the data are non-homogeneous. Herein, only homogeneous data are used to identify trend conditions [11].
The non-parametric Mann–Kendall (MK) trend test is widely used to assess the significance of monotonic trends in hydro-meteorological time series [42]. In order to write increasing or decreasing expressions, the Mann–Kendall positive or negative ZMK value is taken into consideration [43,44]. If |ZMK | ≥ 2.576, 1.96, 1.645, or 1.282, the null hypothesis of no trend is rejected at the 1%, 5%, 10%, or 20% significance level, respectively [11,45]. The MK trend test was performed using MATLAB R2014a.

2.4. Runoff Analysis

The runoff coefficient is a measure of the ability of a watershed to generate runoff [46]. The runoff coefficient was calculated using the following formula:
RC = (R/P) × 100%
where RC and P are the runoff coefficient of the small watershed (%) and precipitation (mm), respectively.
Based on the measured data from the triangular gauging weir, only four surface runoff generating processes occurred in the small watershed of the TMS since 2014: 19 to 24 July 2016; 20 to 25 July 2021; 3 to 10 October 2021; and 29 July to 4 August 2023. Therefore, the analysis period of rainfall spatial characterization is the period of these four surface runoff generating events. Using the location of the rainfall gauges, ordinary kriging spatial interpolation in Arc GIS 10.5 was applied to calculate the spatial distribution of rainfall in Yuanshi County, where the TMS is located.
The double mass curve method is used to analyze the relationship between two related cumulative variables, primarily to detect consistency and trends in long-term hydro-meteorological data [47]. The linear regression equation for the baseline period double mass curve is established and then used to construct the equation for the change period. The relationship between observed cumulative runoff R b   and cumulative precipitation P b in the baseline period can be expressed as [48]:
R b = a 1 P b + b 1
The relationship between observed cumulative runoff R c and cumulative precipitation P c   in the changing period can be expressed as:
R c = a 2 P c + b 2
The runoff in the changing period R a   can be modeled as:
R a = a 1 P c + b 1
where the parameters a1 and a2 are the rates of change in cumulative runoff with the change of accumulated precipitation, and b1 and b2 are the intercept values.
The contributions of precipitation to runoff ( P , %) can be determined as follows:
P = R b ¯ R a ¯ R b ¯ R c ¯ 100
R a ¯ = R a T c   ,   R b ¯ = R b T b   ,   R c ¯ = R c T c
where R b ¯ and R c ¯   represent observed mean annual run-off for a certain time Tb and Tc in the baseline and changing period; R a ¯ is modeled mean annual runoff for a certain time Tc in the changing period.
In this study, the period from 19 to 24 July 2016, was set as the baseline period, the following three runoff processes were considered as the change period to determine the contribution of rainfall to runoff.

2.5. Statistical Analysis

The Pearson-III distribution [49] was utilized to analyze their frequency distribution. Depending on the p-value, the annual rainfall patterns can be determined [10]. Specifically, wet years were defined as those with precipitation greater than or equal to p = 25 %, dry years were defined as those with precipitation less than or equal to p = 75 %, and normal years were defined as those when precipitation occurs between wet and dry years [50].
Statistical analyses were carried out using IBM SPSS Statistics 20. The plotting of the Pearson-III frequency curve, which was used to determine annual rainfall patterns [10], as well as other data processing, analysis, and related graphing, were performed in Microsoft Excel 2016.

3. Results

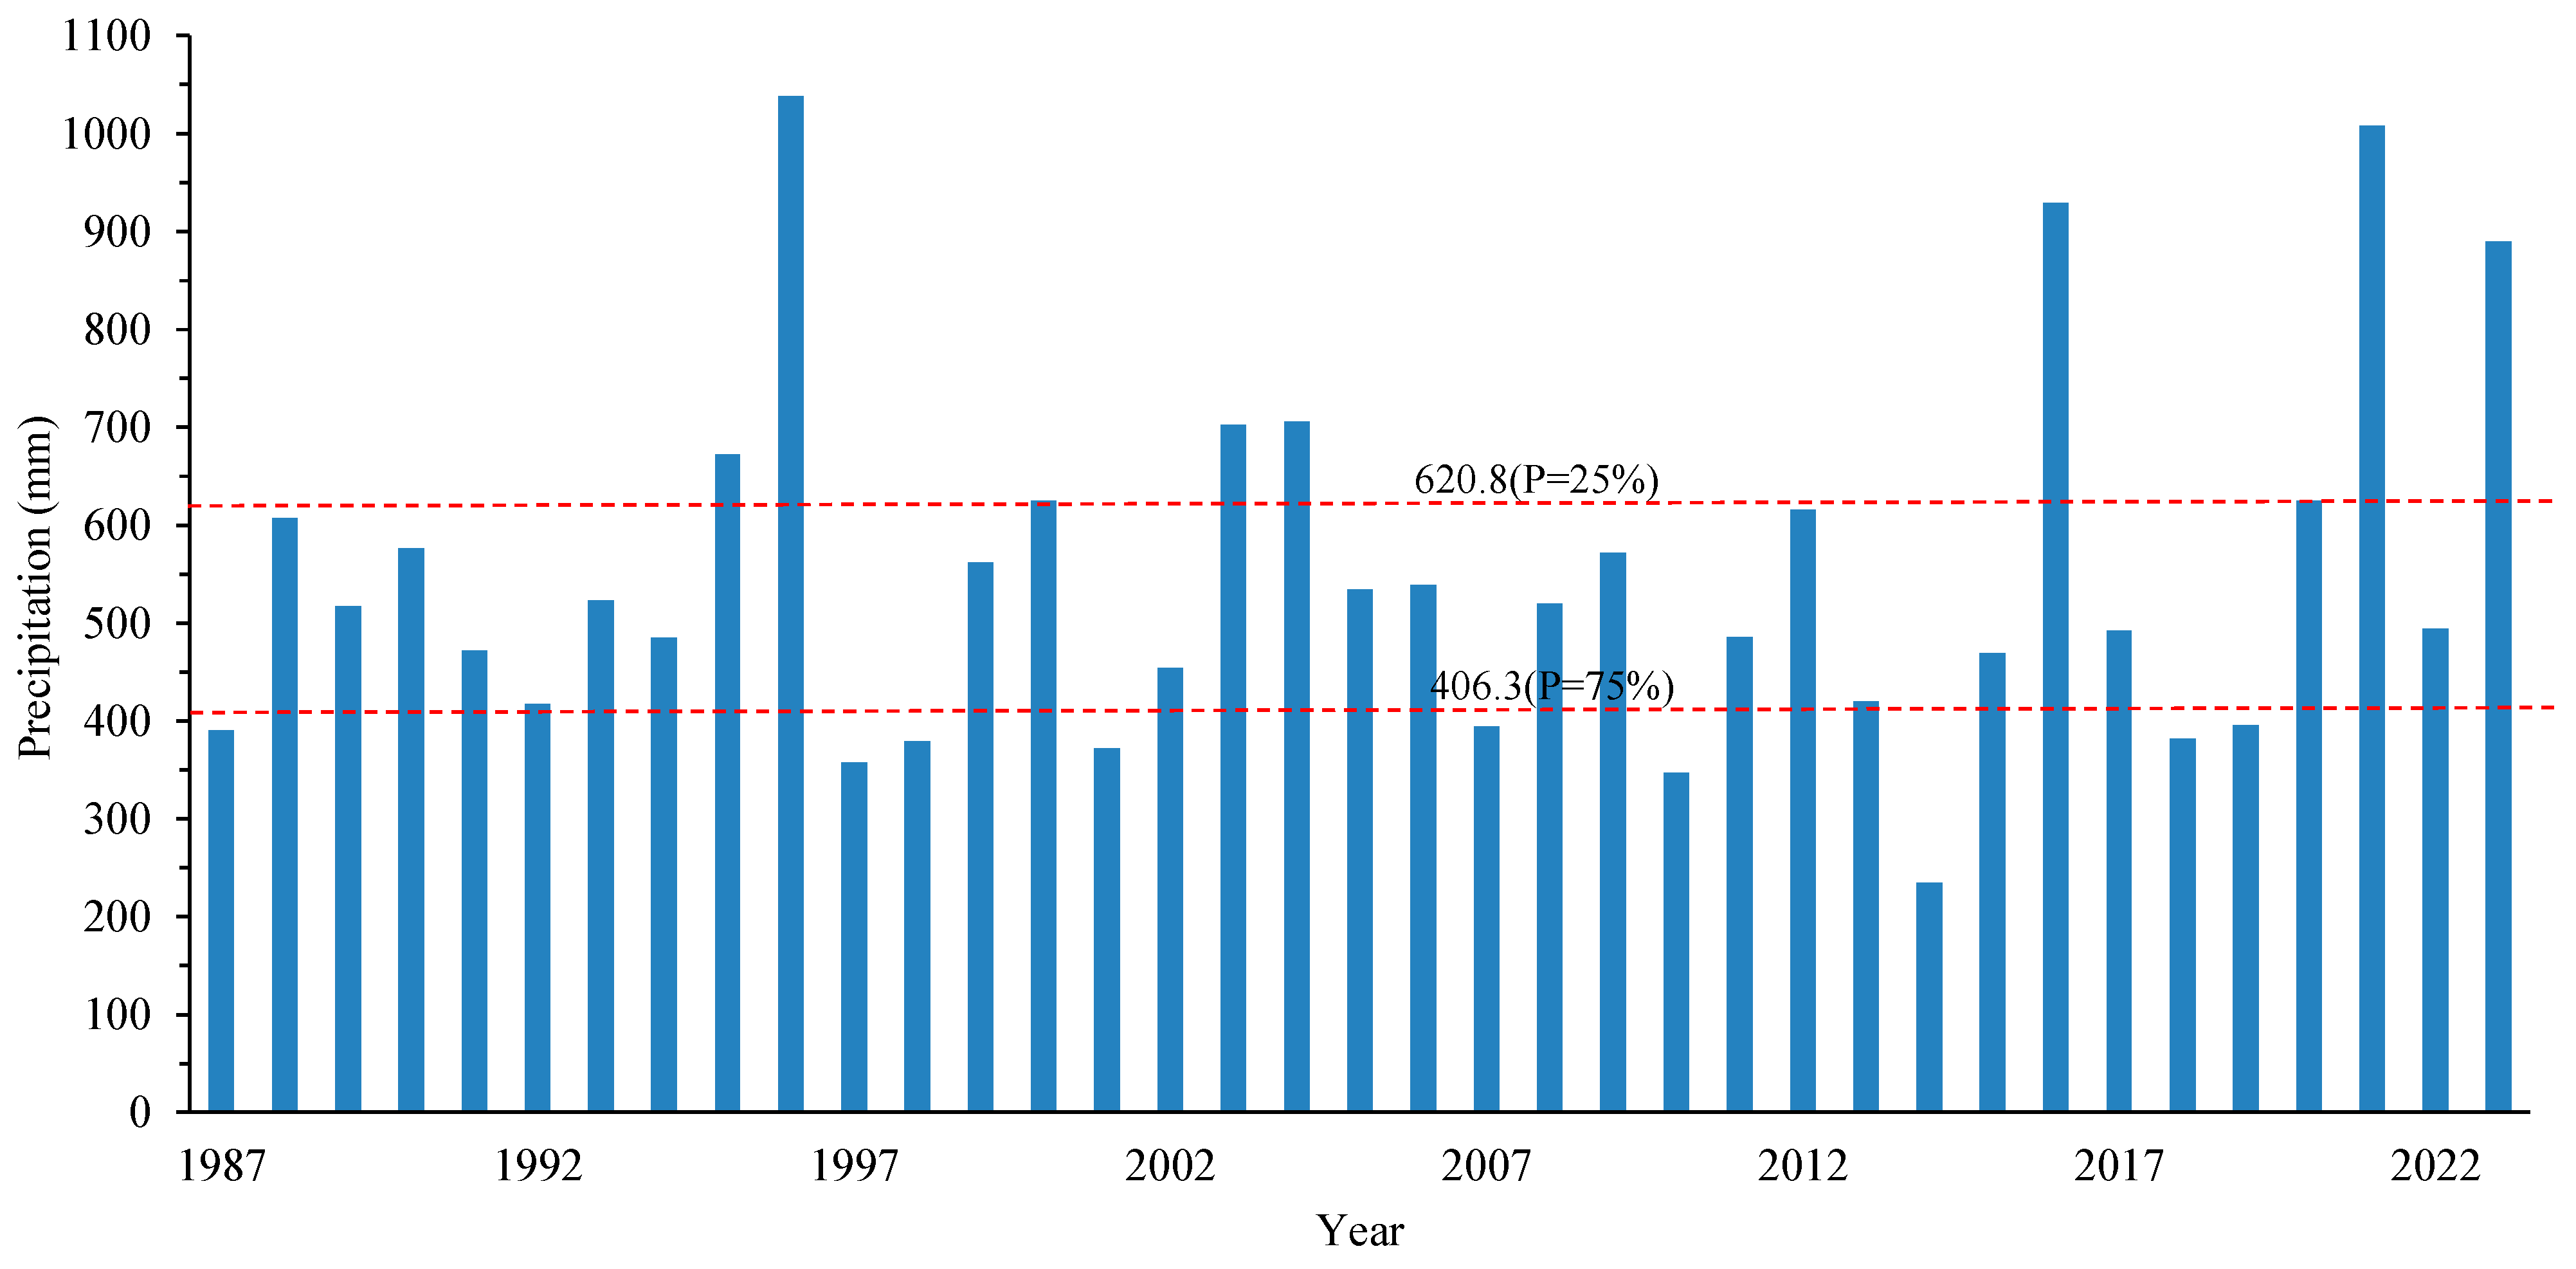
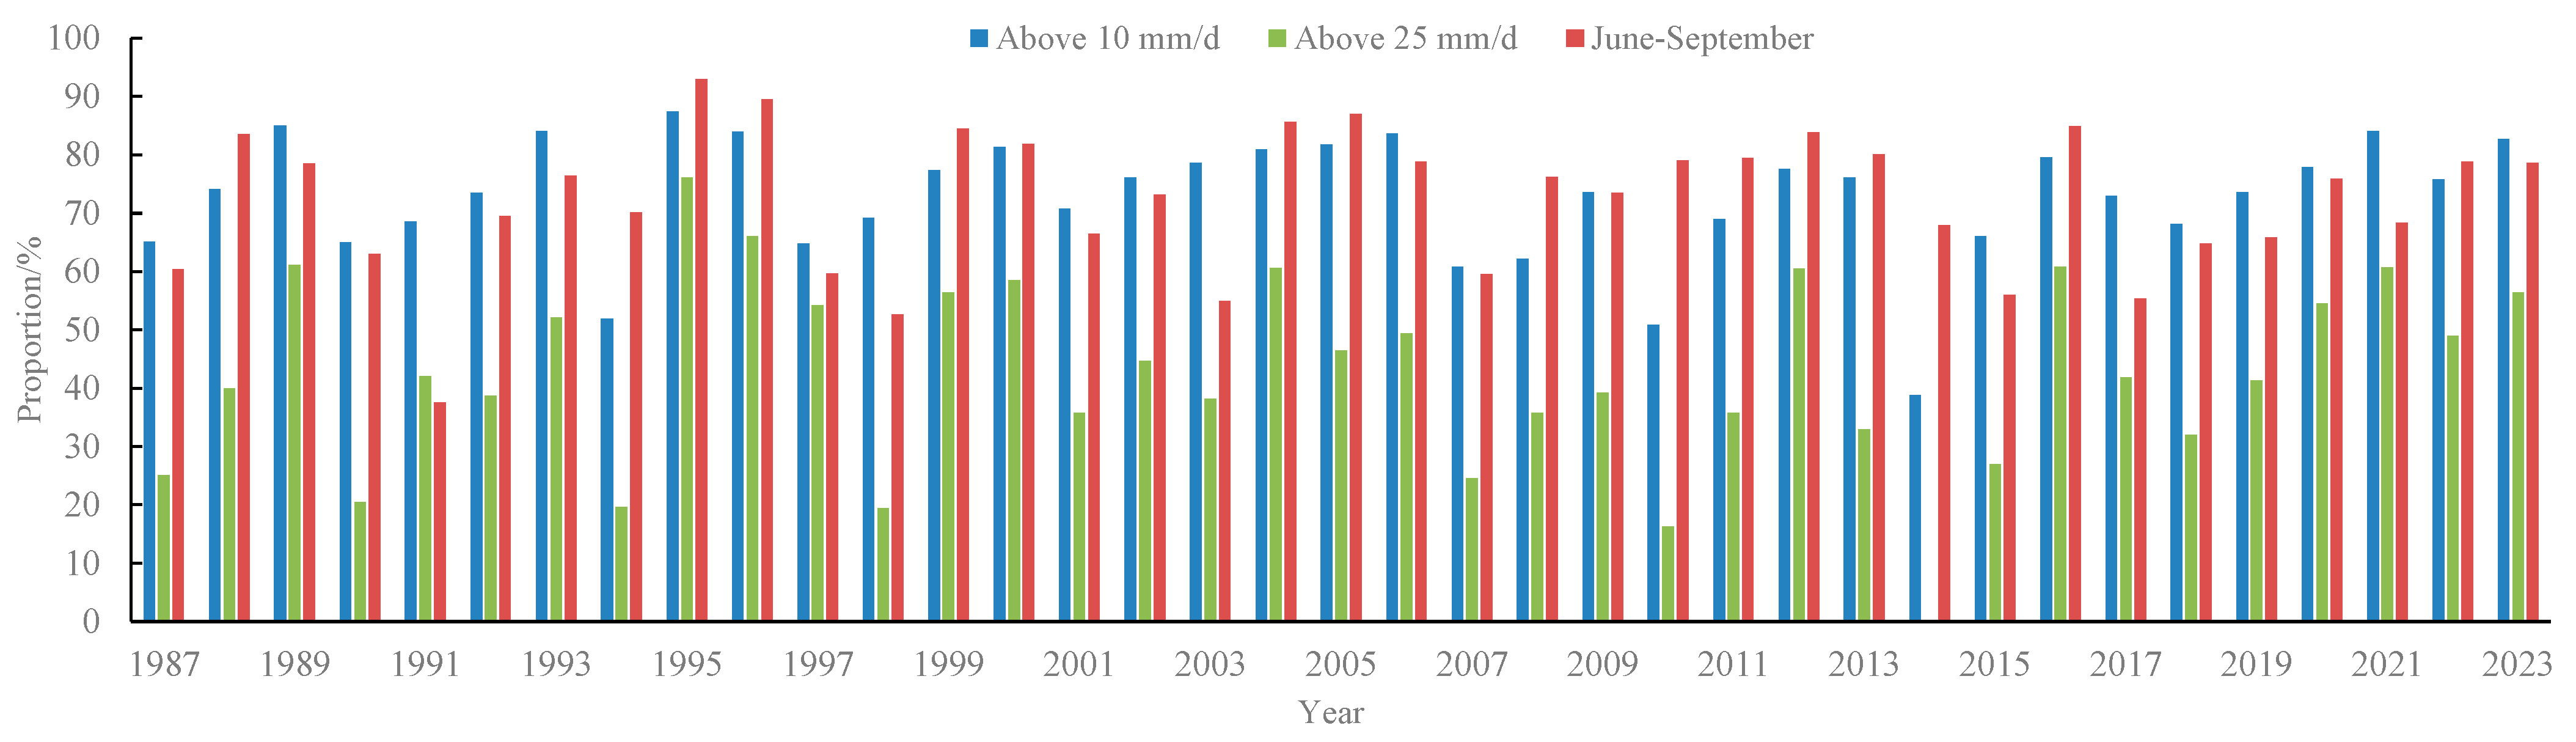
3.1. Annual Rainfall Characteristics

As shown in Figure 2, the annual variation in precipitation in the TMS from 1987 to 2023 exhibits significant variability, with over 70% of precipitation concentrated between June and September. The average annual precipitation is 546.1 mm. The driest year was 2014 (234.7 mm), while the wettest year was 1996 (1038.5 mm), followed by 2021 (1008.1 mm) and 2016 (929.2 mm).
Using the Pearson-III frequency curve, wet years are defined as having ≥620.8 mm of precipitation, and dry years as ≤406.3 mm. Wet years include 1995, 1996, 2000, 2003, 2004, 2016, 2020, 2021, and 2023, while dry years are 1987, 1997, 1998, 2001, 2007, 2010, 2014, 2018, and 2019. The remaining 19 years are classified as normal. Approximately 51.4% of the years fall within the normal range. For the last decade (2014–2023), wet and dry years account for 40% and 30%, respectively, indicating a heightened frequency of extreme weather events in recent years.
Further, precipitation from June to September is plotted as a proportion of annual precipitation, as well as precipitation with daily precipitation intensity greater than I10 and I25 as a proportion of annual precipitation in the TMS from 1987 to 2023 (Figure 3). June-September precipitation proportion averaged 72.3% ± 6.2% of annual totals, peaking at 83.1% (during the 1998 El Niño year) and reaching a minimum of 58.9% (2013 drought). Events > 10 mm/day contributed 72.8% ± 5.7% of annual precipitation, showing a significant positive trend (p = 0.03, +0.38%/yr). Events > 25 mm/day comprised 50.5% ± 8.1% with strong interannual variability (CV = 16.1%), demonstrating threshold-dependent sensitivity to monsoon intensity.
The homogeneity test (Equation (3)) applied to the 1987–2023 dataset yielded ZR values ranging from 0.06 to 0.27. All values exceeded the 0.05 significance threshold, confirming the homogeneity of the data.
Trend analysis using the MK test was conducted for two periods (1987–2023 and 2014–2023) to evaluate total rainfall and rainfall associated with daily intensities exceeding the I10 and I25 thresholds. The resulting ZMK statistics are summarized in Table 1. While all datasets exhibited upward trends, only the 2014–2023 period demonstrated statistically significant increases: rainfall above the I10 threshold showed significance at the 5% level, and rainfall above the I25 threshold at the 10% level. This indicates a notable rise in the frequency of moderate (I10) and heavy (I25) rainfall events during the recent decade (2014–2023).

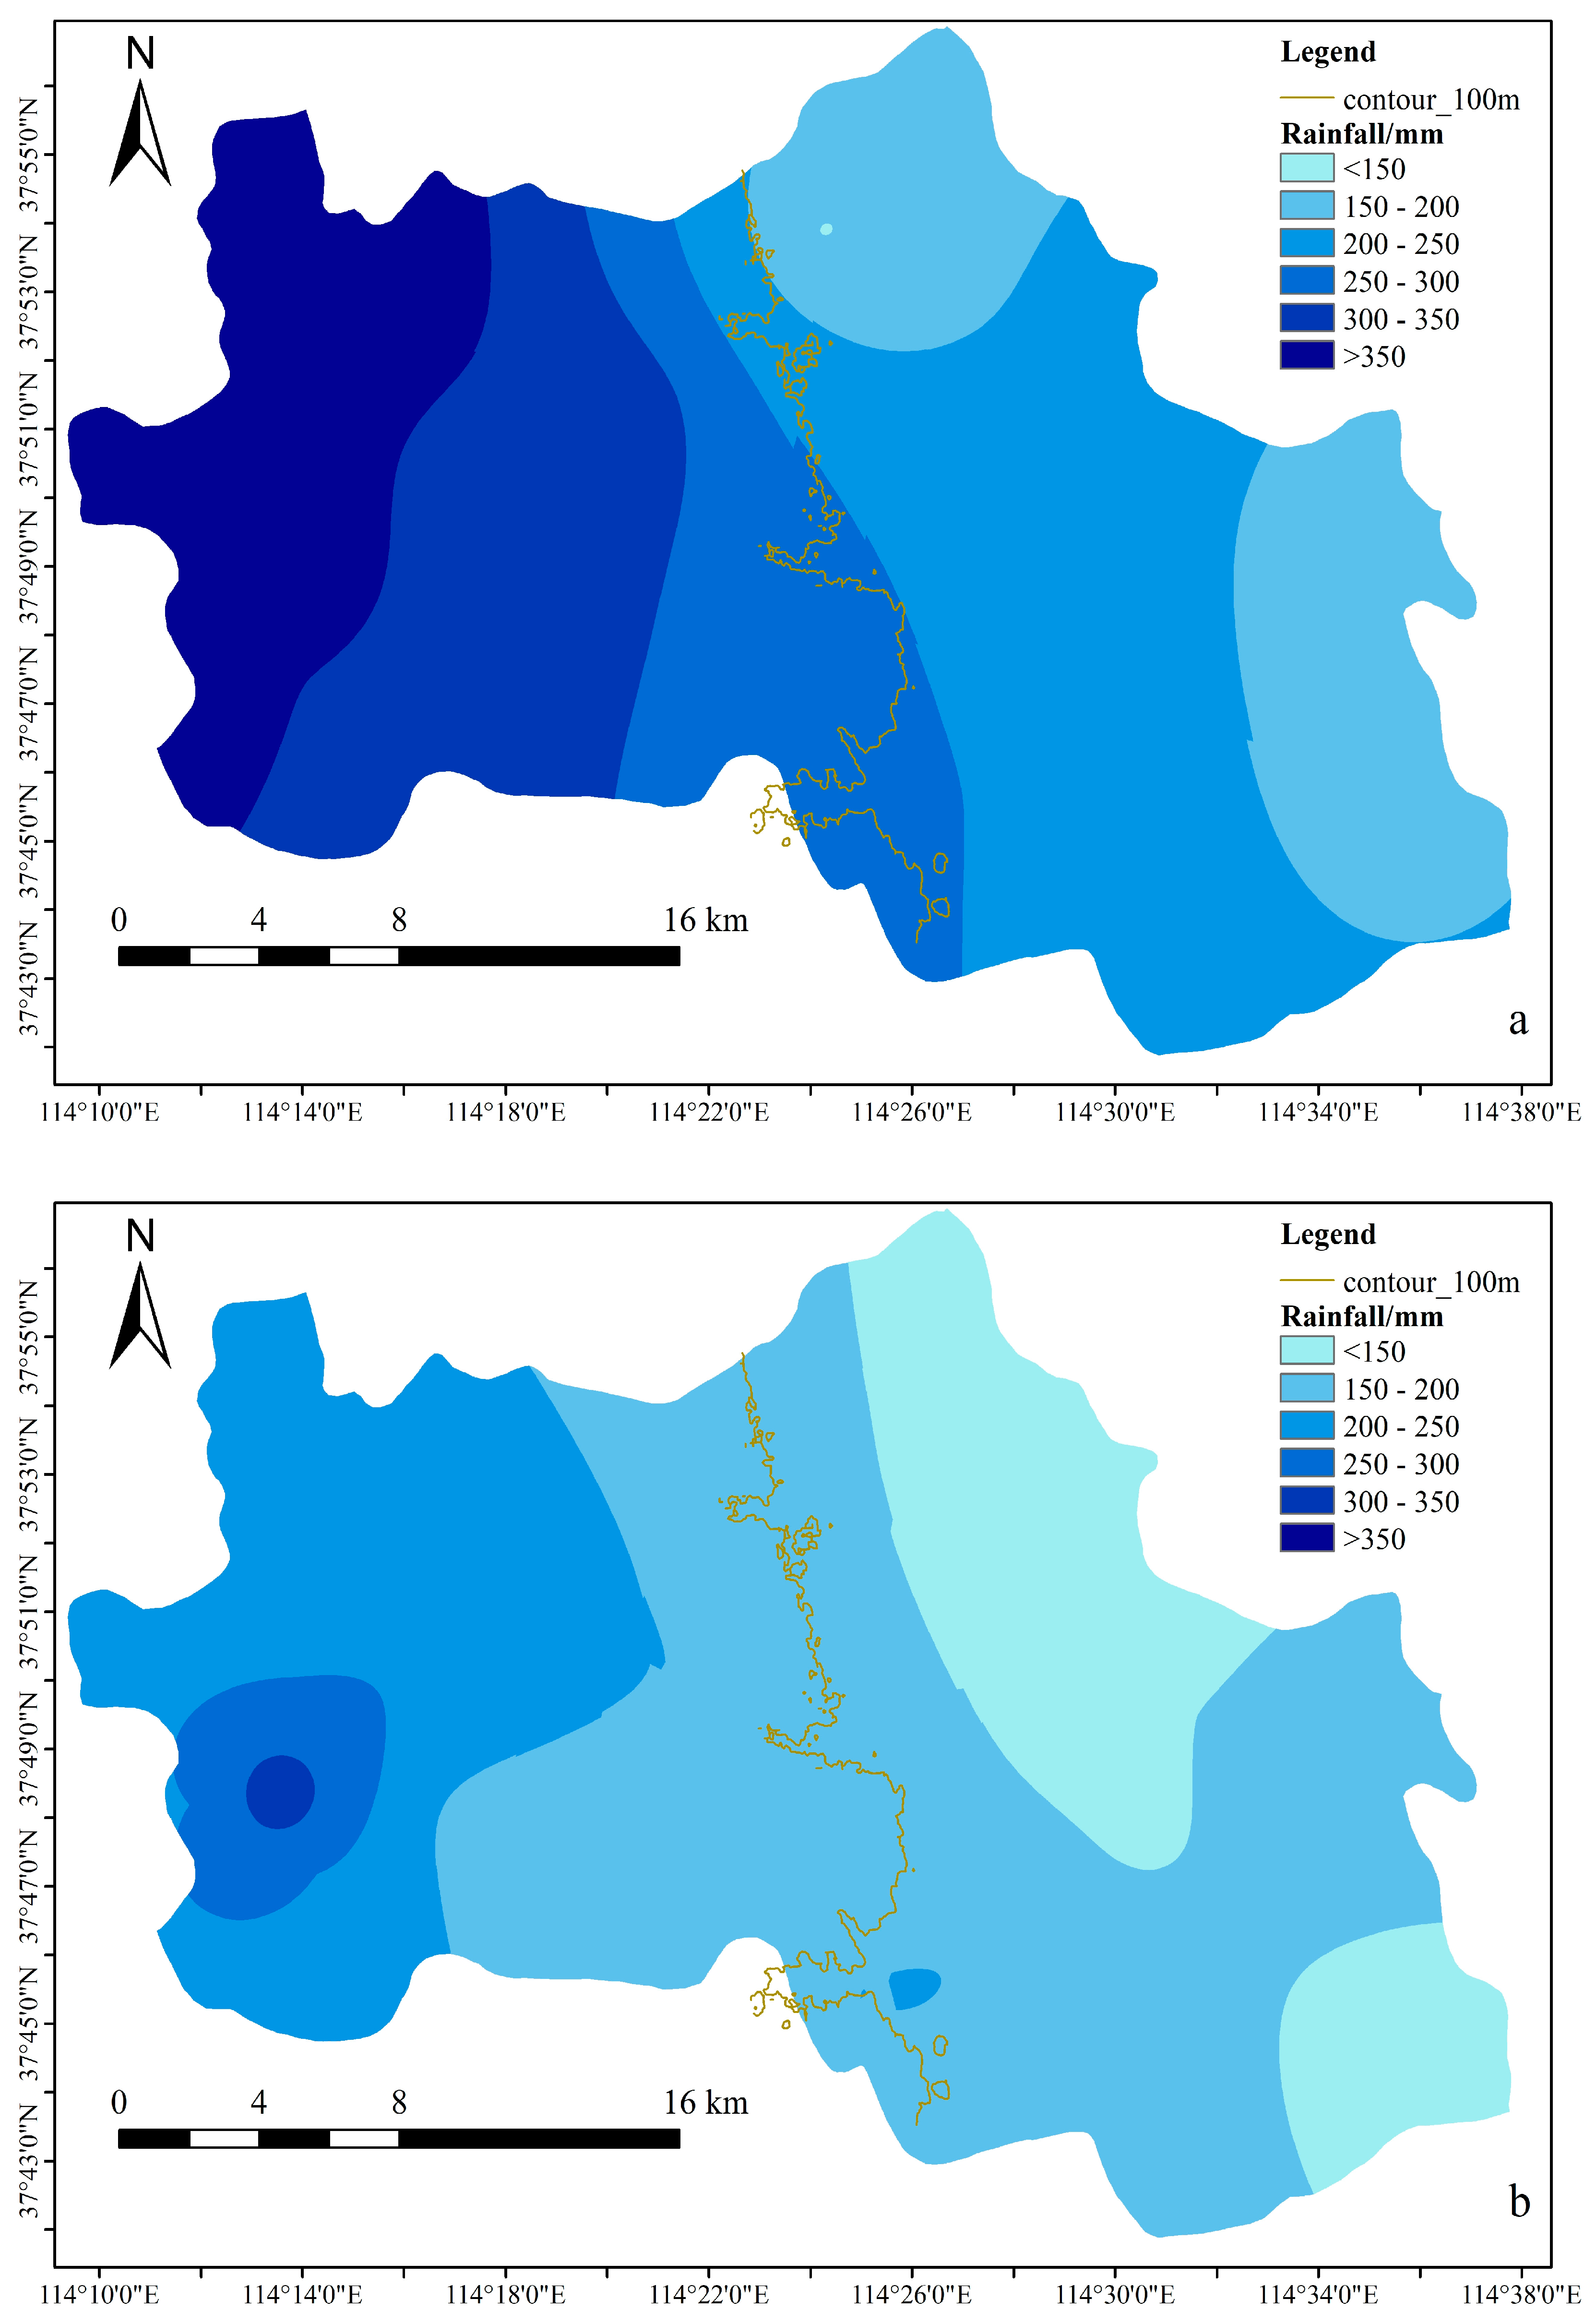
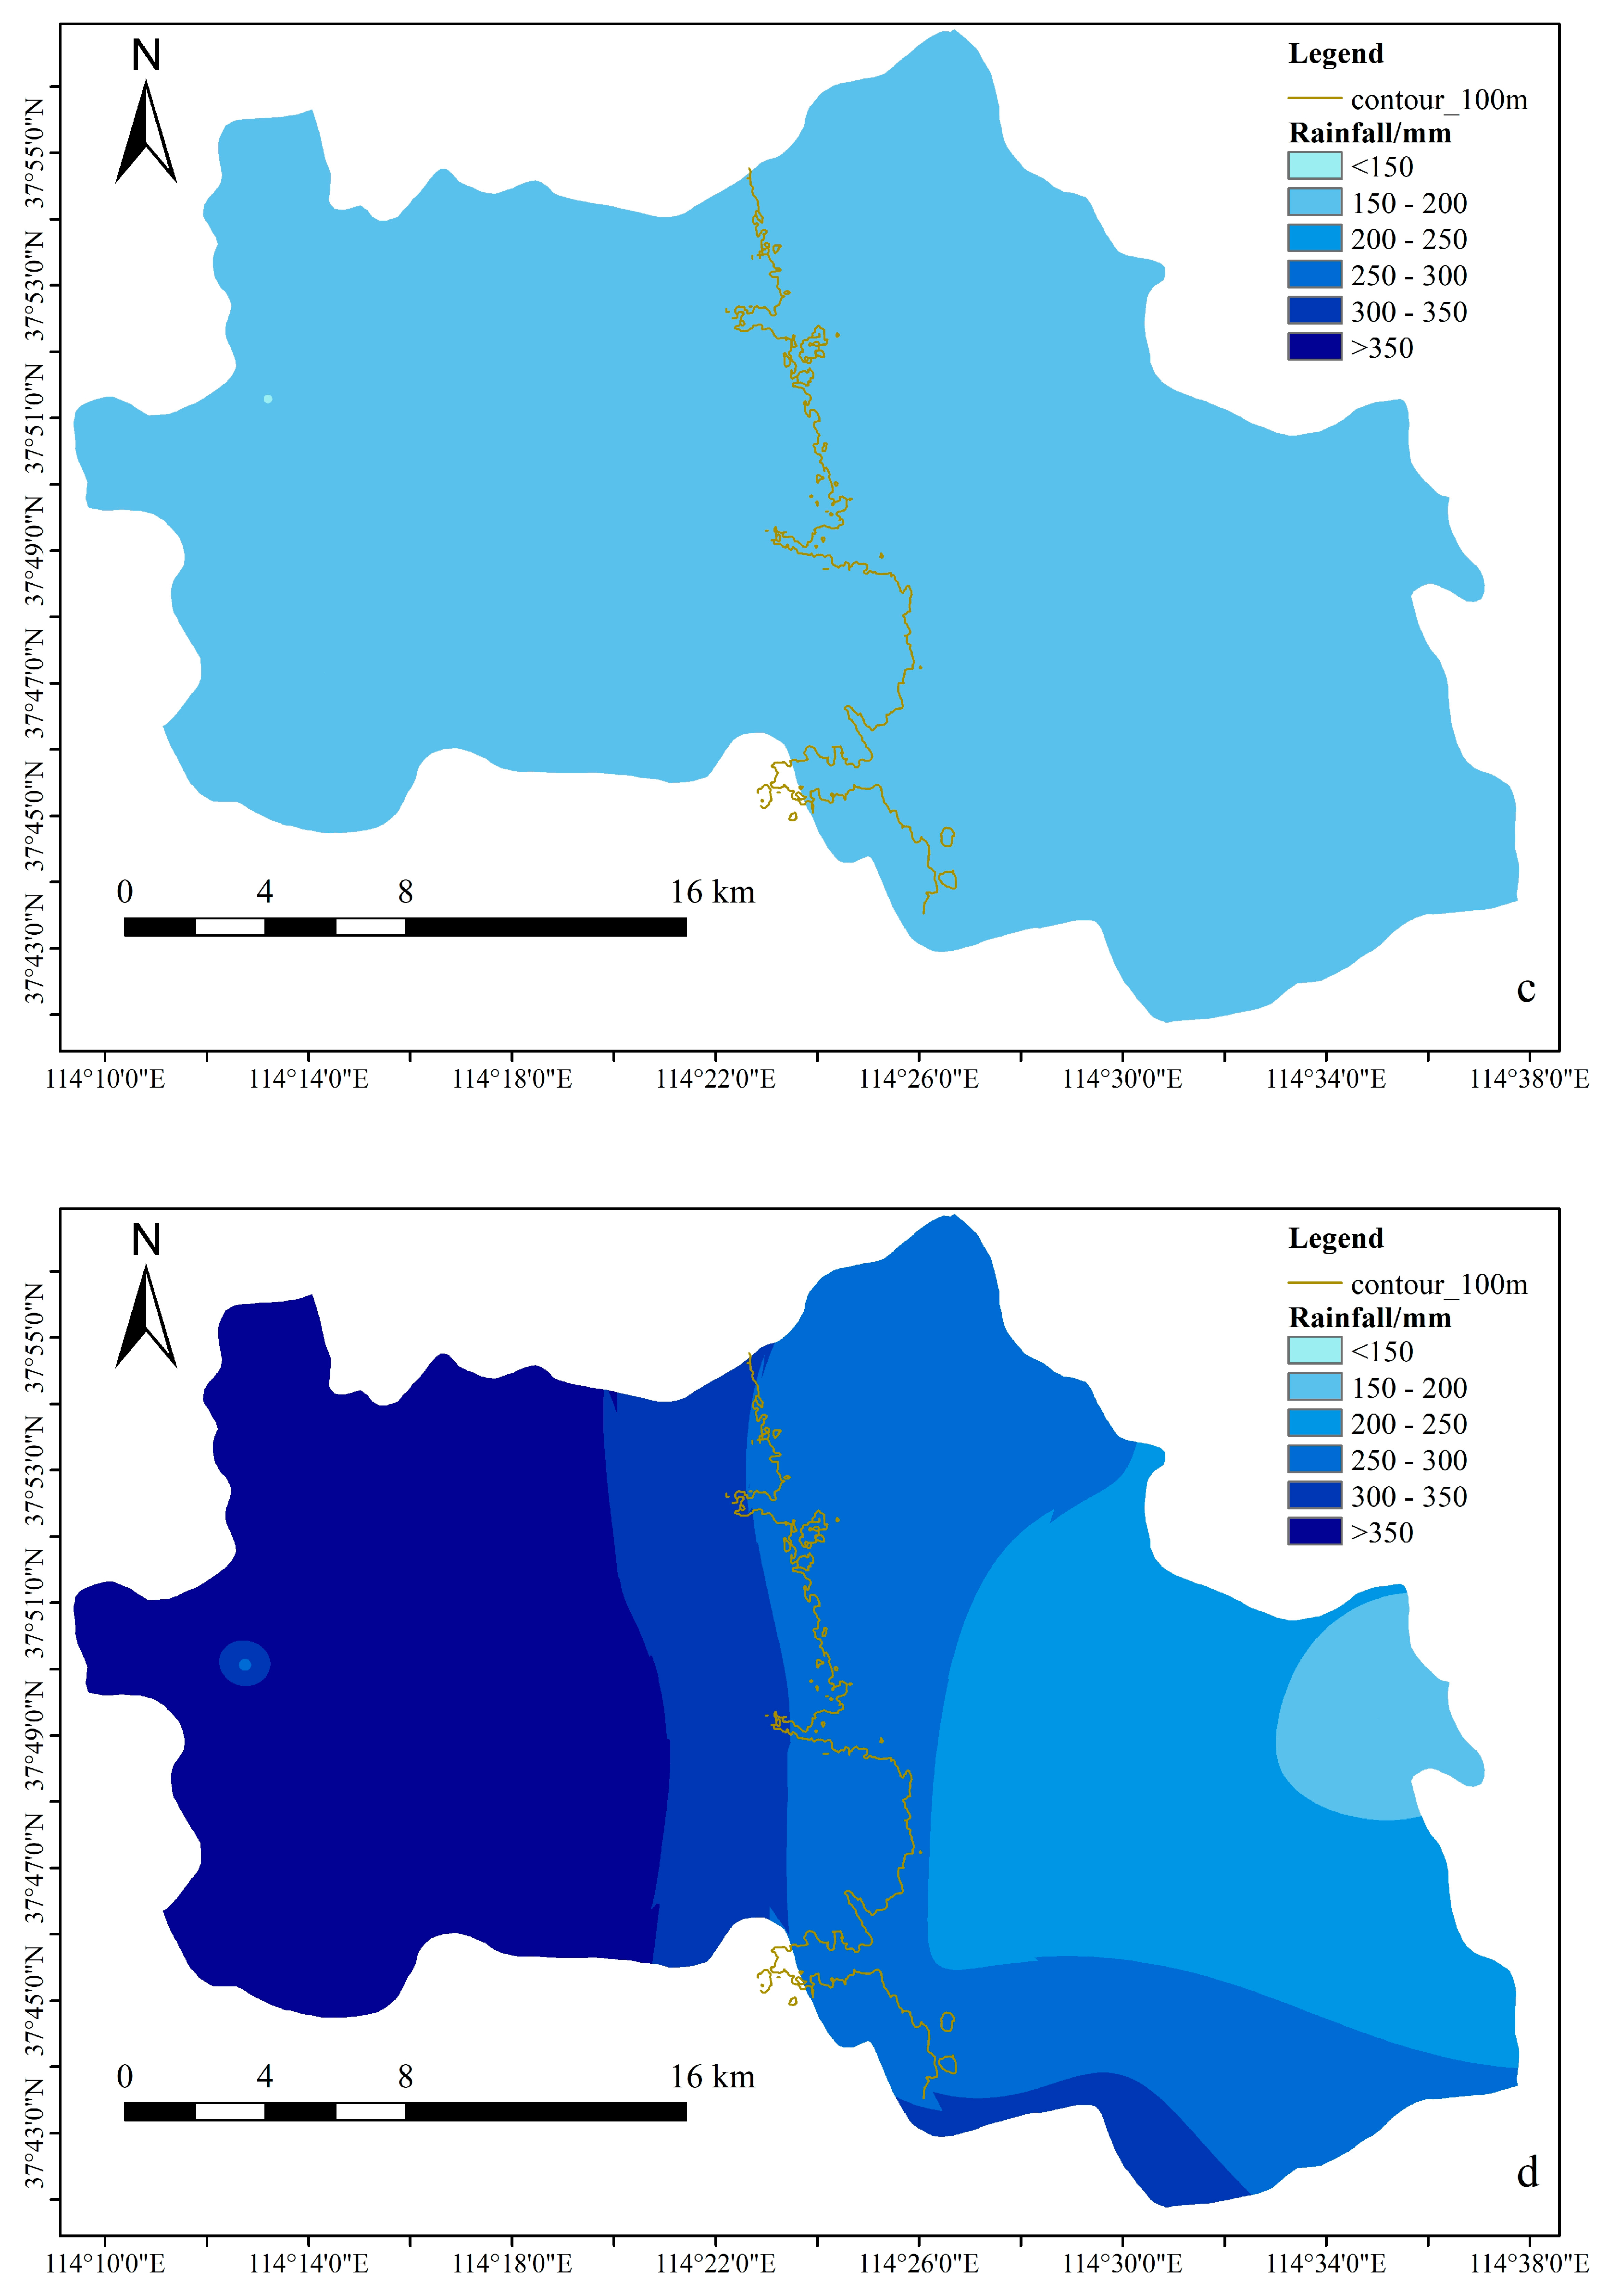
3.2. Rainfall Spatial Characteristics

From the above, only four surface runoff-generating processes occurred in the TMS small watershed during 2014–2023. Therefore, we further examined the rainfall spatial distributions of these four runoff generating events. As shown in Figure 4, three of the four runoff events (excluding the 3–10 October 2021 event) exhibited pronounced spatial variability. The coefficient of variation (CV) for total rainfall across gauges during the 3–10 October 2021 event was 5.96%, whereas the other three events displayed significantly higher variability (CV > 30%). Notably, two events, including 9–24 July 2016 and 29 July–4 August 2023—demonstrated strong orographic controls: the 200 mm isohyet (2016) and 250 mm isohyet (2023) closely aligned with the 100 m elevation contour, indicating topographic modulation of rainfall.
Further analysis of the relationship between elevation and rainfall at each gauge for the four rainfall events revealed that three events (19–24 July 2016, 20–25 July 2021, and 29 July–4 August 2023) exhibited significant positive correlations between rainfall and elevation (R = 0.88, 0.68, and 0.68, respectively; p < 0.001), whereas the event from 3–10 October 2021 showed no significant correlation (R = 0.096, p > 0.05) (Figure 5). The lack of correlation in the October 2021 event may suggest weaker topographic uplifting effects during certain meteorological conditions, potentially linked to lower rainfall intensity or synoptic-scale dominance. This implies that spatial rainfall variability in mountainous areas is more pronounced during heavy precipitation episodes when orographic enhancement is stronger.
Based on the rainfall duration of the four rainfall events, their average rainfall intensities were calculated and converted into 24 h rainfall amounts to show that the spatial variability of rainfall in the Taihang Mountains and the influence of elevation are both smaller when the rainfall during 24 h is lower than 50 mm.

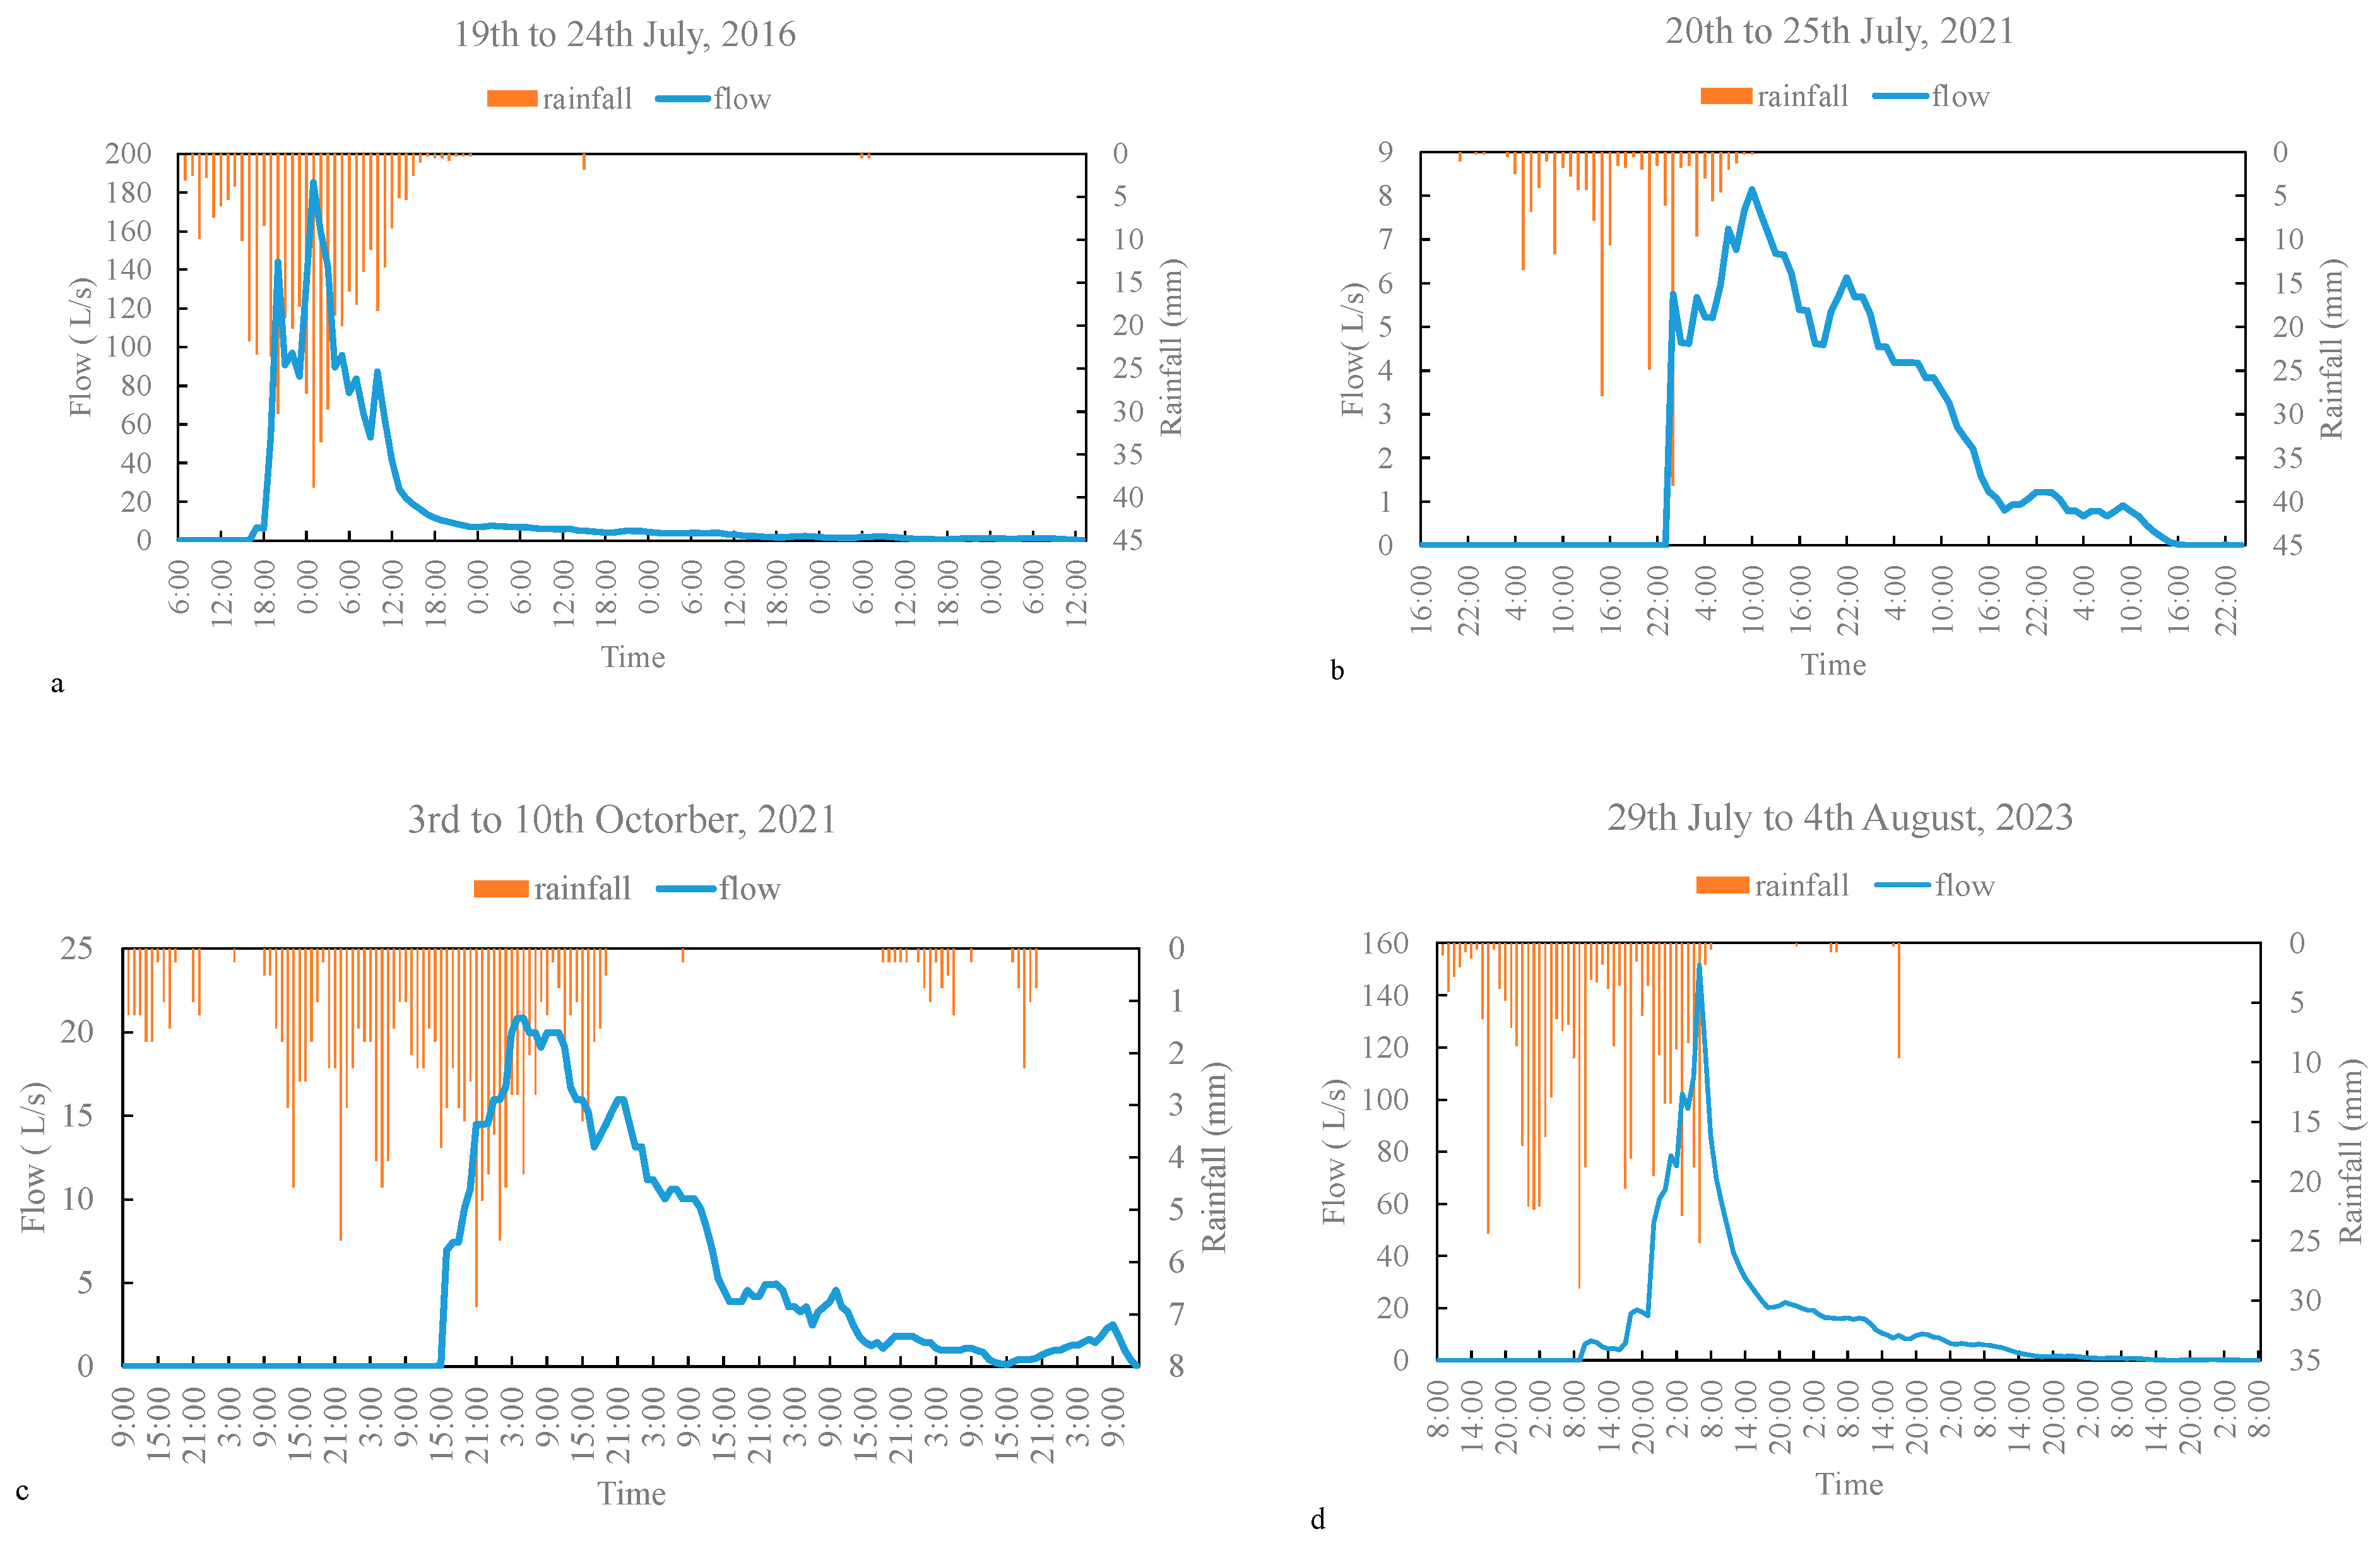
3.3. Surface Runoff Generating Processes

The surface runoff generating processes for four rainfall events are plotted against rainfall variations in Figure 6. During the 19–24 July 2016 event (Figure 6a), the rainfall started at 06:00 on 19 July and after 12 h of continuous rainfall, by 17:00 on 19 July, the rainfall accumulated to 100.3 mm, with an intensity of 8.36 mm/h, and surface runoff began to generate, with a flow of 6.44 L/s and then reached a maximum flow of 185.33 L/s at 01:00 on 20 July. Followed by 23:00 on 20 July, the rainfall stopped, at which time the accumulated rainfall was 504 mm, lasting 42 h, with an average rainfall intensity of 12.0 mm/h. However, the surface runoff continued to generate, by 13:00 on 24 July, the surface runoff ended, lasting 86 h after the rainfall stopped. The surface runoff generating process lasted a total of 117 h, with an average flow of 18.41 L/s, and cumulative runoff amounted to 7753 m3. From 06:00 on 19 July to 23:00 on 24 July 2016, the cumulative rainfall was 506.8 mm. The runoff coefficient was 0.58.
For the 20–25 July 2021 event (Figure 6b), the rainfall began at 16:00 on 20 July and after 32 h of continuous rainfall, by 23:00 on 21 July, the rainfall accumulated to 147.3 mm, and surface runoff began to generate, with a flow of 5.76 L/s, and by 10:00 on 22 July, the flow reached a maximum value of 8.14 L/s. At the same time, the rainfall stopped and the total accumulated rainfall at this time was 215.4 mm, lasting for 43 h, with an average rainfall intensity of 5.0 mm/h. While the surface runoff continued to generate, to 24:00 on 25 July, the surface runoff ended, lasting 62 h after the rainfall stopped. The surface runoff generating process lasted a total of 73 h, the average flow was 3.07 L/s and cumulative runoff amounted to 806 m3. From 16:00 on 20 July to 24:00 on 25 July 2021, the cumulative rainfall was 215.4 mm. The runoff coefficient was 0.14.
For the 3–10 October 2021 event (Figure 6c), the rainfall started at 09:00 on 3 October, and after 55 h of continuous rainfall, by 15:00 on 5 October, the rainfall accumulated to 85.3 mm, and surface runoff began to generate with a flow of 0.07 L/s, and then at 04:00 on 6 October, the flow reached a maximum value of 20.82 L/s, and then by 19:00 the rainfall stopped, and the total accumulated rainfall at this time was 162.1 mm, which lasted for 83 h, and the average rainfall intensity was 1.95 mm/h, but the runoff continued to generate, and by 15:00 on 10th October, 2021, the flow ended and lasted 90 h after the rainfall stopped. The surface runoff generating process lasted a total of 119 h, the average flow was 6.67 L/s, and the cumulative runoff amounted to 2859 m3. From 09:00 on 3 October to 15:00 on 10 October 2021, the cumulative rainfall was 173.7 mm. The runoff coefficient was 0.63.
For the 29 July–4 August 2023 event (Figure 6d), the rainfall started at 08:00 on 29 July, and after 27 h of continuous rainfall, by 10:00 on 30 July, the rainfall accumulated to 259.1 mm, and flow began to produce with a value of 6.20 L/s, and then at 06:00 on 3 July, the flow reached a maximum of 151.43 L/s, and then by 09:00, the rainfall stopped, and by this time, the cumulative rainfall amounted to 475.3 mm, which lasted for 49 h. The average rainfall intensity was 9.7 mm/h, but the basin continued to produce flow, and by 8:00 on 4 August, the runoff ended, lasting 96 h after the rainfall stopped. The surface runoff generating process lasted a total of 119 h, with an average flow of 17.14 L/s and cumulative runoff volume of 7342 m3. From 08:00 on 29 July to 08:00 on 4 August 2023, the cumulative rainfall was 487 mm, and the runoff coefficient was 0.57.

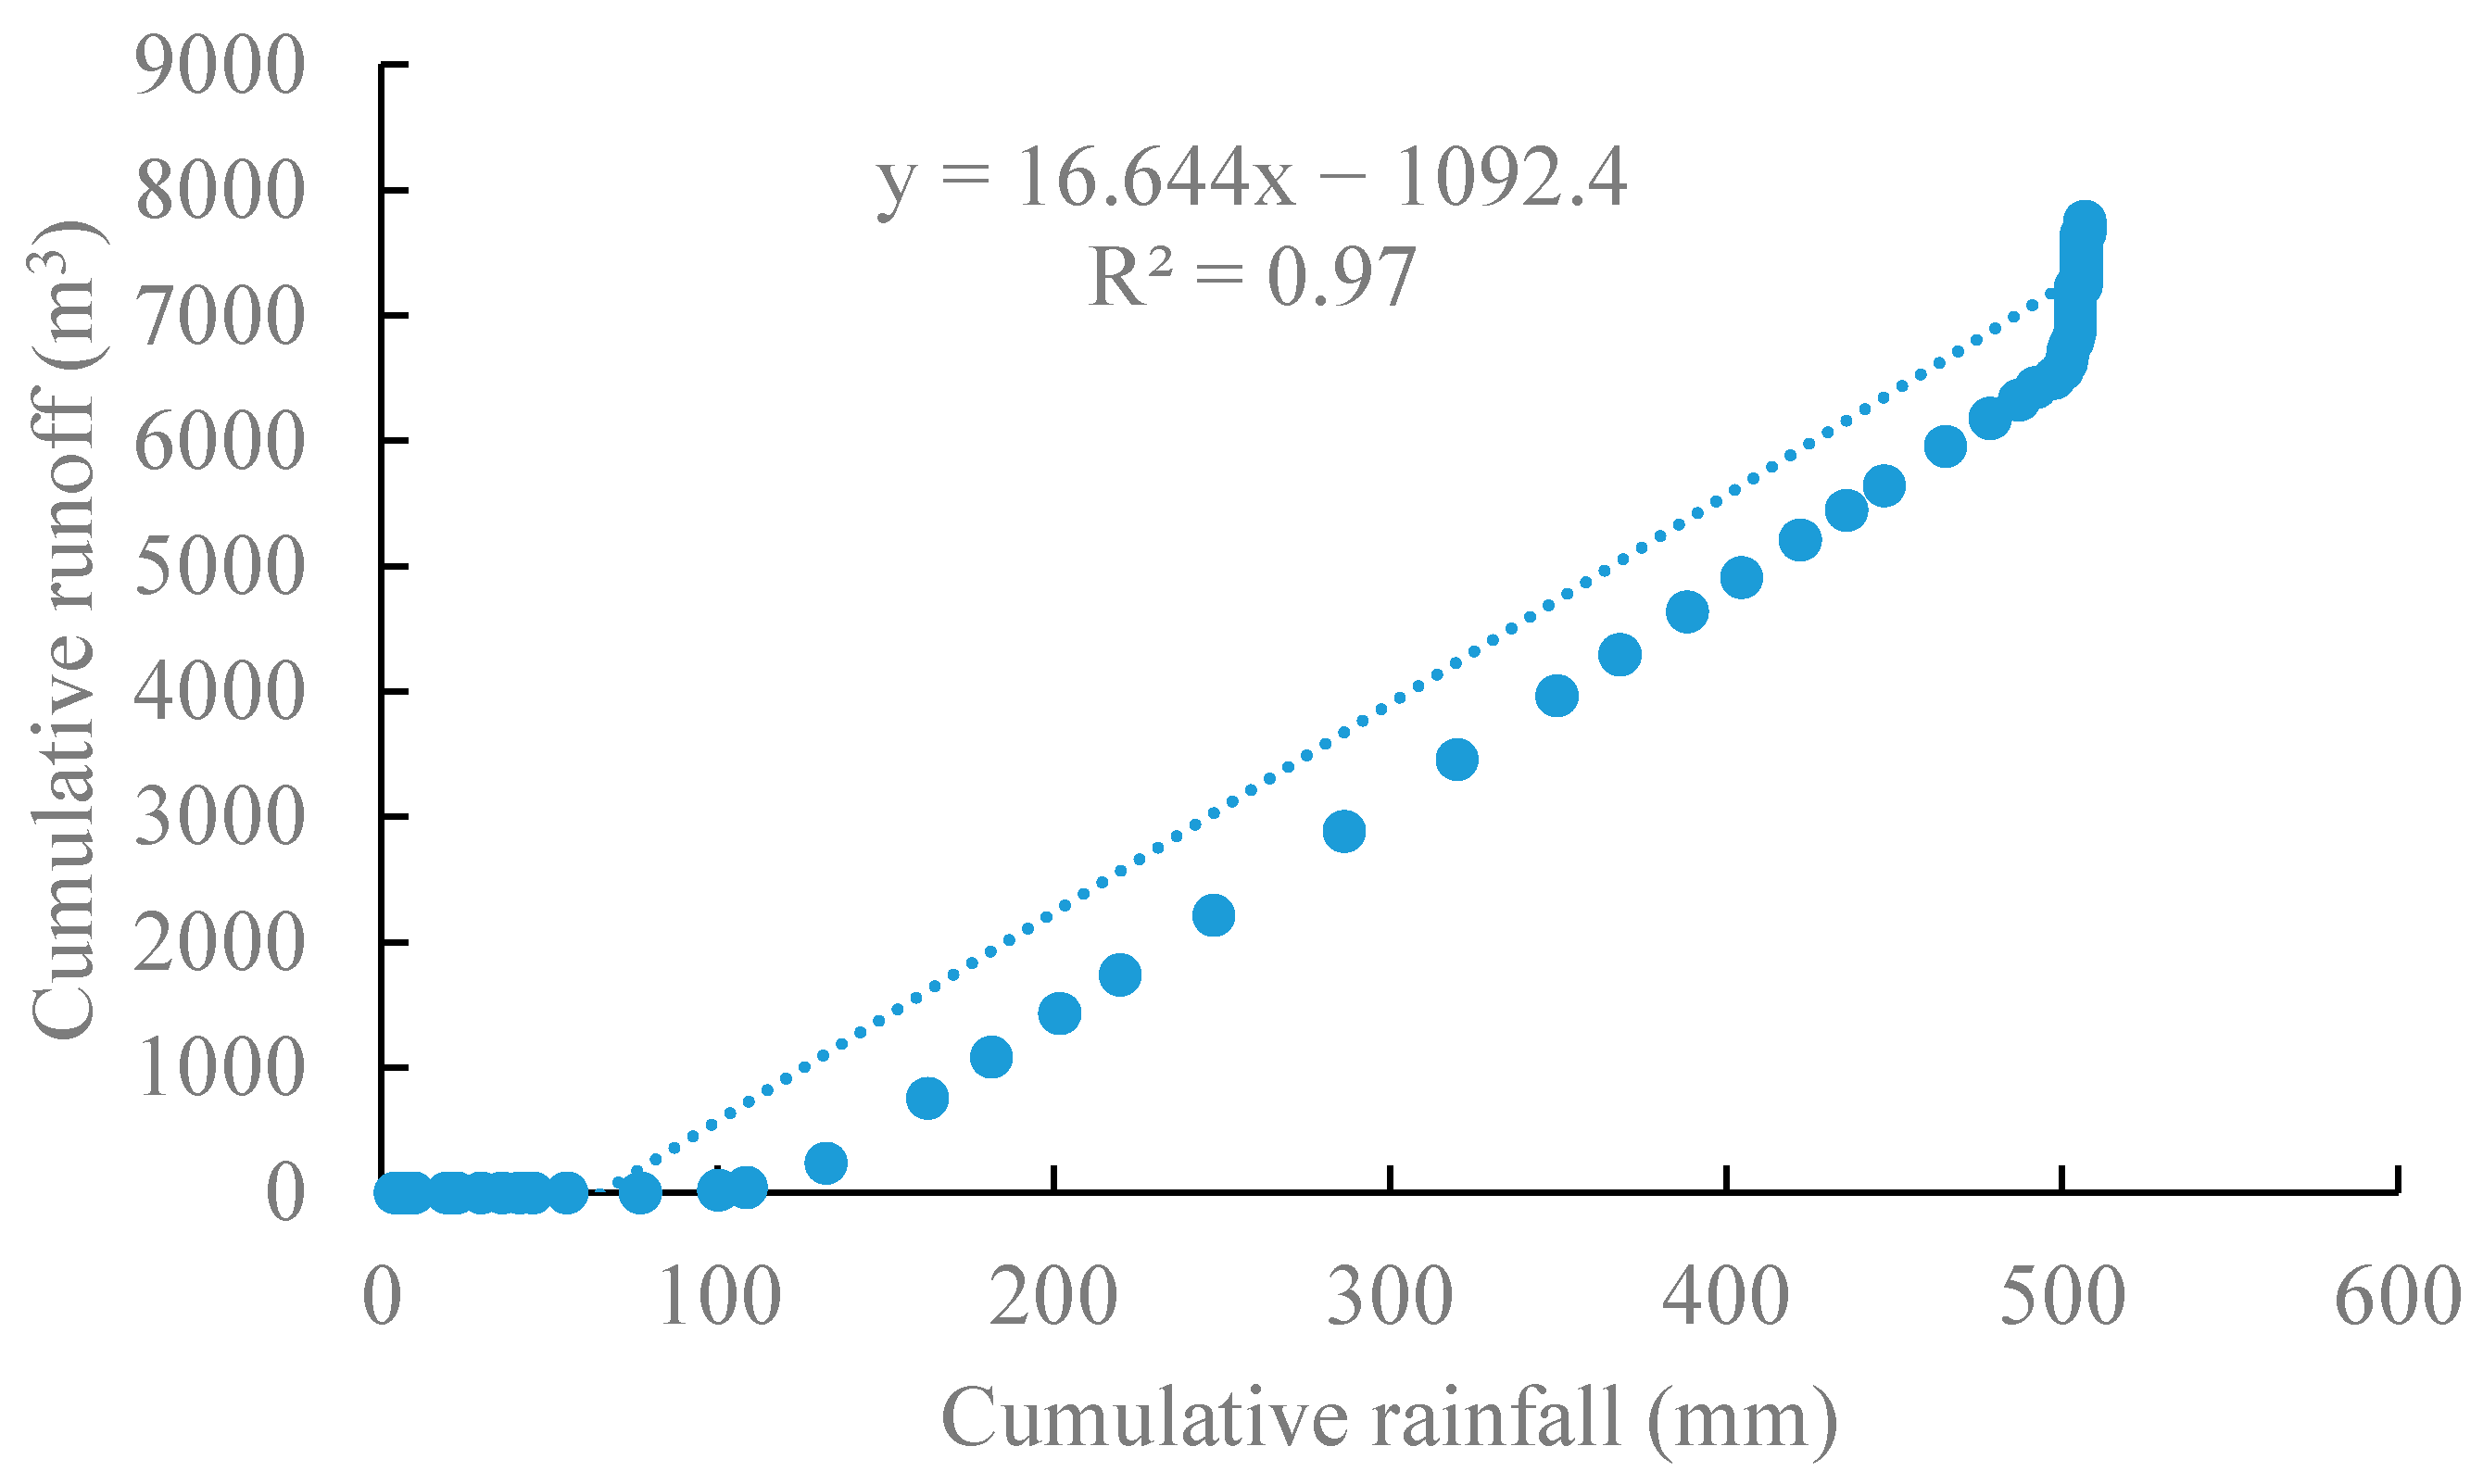
3.4. Contributions of Precipitation on Variation in Runoff

We selected the surface runoff generating process during 19–24 July 2016 as the baseline period (Figure 7), quantifying the effect of rainfall on changes in runoff with the double cumulative curve method (Table 2). The analysis revealed that the effect of rainfall was more than 100% in both the 3–10 October 2021 and 29 July–4 August 2023 events, indicating these two surface runoff generating processes were entirely determined by rainfall and all other factors had a negative effect on runoff. For the 20–25 July 2021 event, the effect of rainfall was only 58.17%, while 41.83% of the effect came from factors other than rainfall. The preliminary inference is the water-holding properties of the soil and rock.

4. Discussion

4.1. Forms of Surface Runoff Generating

Runoff generation refers to the process where rainfall losses are subtracted to form net rainfall. These losses include vegetation interception, infiltration, soil storage, and evapotranspiration, with infiltration being the predominant factor. Generally, runoff generation mechanisms are fundamentally categorized into two types: (1) Runoff resulted from excess rain (formally termed Hortonian overland flow) [51]. Infiltration-excess runoff manifests when rainfall intensity surpasses soil infiltration capacity. This mechanism predominates under two distinct hydroclimatic regimes in China: northern regions during monsoon periods experiencing intense convective storms and southern humid regions during seasonal drought intervals where hardened surface layers develop reduced infiltration rates [52]. (2) Runoff generation under saturated conditions (formally termed Dunne overland flow) [53]. Saturation-excess runoff generation requires complete saturation of both the vadose zone and phreatic zone, a process predominantly observed in humid/semi-humid regions of southern China where annual precipitation exceeds 800 mm [54]. This mechanism initiates when high pre-storm soil moisture (>70% field capacity) from antecedent rainfall combines with prolonged precipitation events [55]. Under these conditions, subsequent rainfall directly converts to surface runoff as storage deficits diminish to negligible levels, with the threshold saturation state typically being achieved when cumulative infiltration reaches 90–95% of total soil water holding capacity [56].
Obviously, the four monitored surface runoff processes, the two surface runoff processes in 2016 and 2023 occurred after 12 h and 27 h of continuous rainfall, respectively, and were typical runoff resulted from excess rain, with the maximum instantaneous flow amounting to 185.33 L/s and 151.43 L/s, respectively, and the average flow amounting to 18.41 L/s and 17.14 L/s, and the duration of the continuous rainfall were 42 h and 49 h, with the average rainfall intensity 12.0 mm/h and 9.7 mm/h. The rainfall duration was short and the intensity was high, which belonged to the storm runoff. According to the rainfall data for 2016 and 2023, the cumulative rainfall of these two surface runoff processes accounted for 54.5% and 54.8% of the annual rainfall, respectively. Before these two surface runoff processes, the cumulative rainfall from 1 January to 18 July 2016 was 207.3 mm, and from 1 January to 28 July 2023 was 284.2 mm, which means that the soil moisture content should have been at a very low level before these two surface runoff processes in 2016 and 2023. Although the runoff coefficient was about 0.6, this form of runoff did not have any effective supplementation of the soil moisture and subsurface runoff and did not form effective water resources downstream, which was not very significant for maintaining the local soil water conservation capacity. For semi-arid regions, where rainfall is unevenly distributed over the seasons, more soil water is needed to maintain local and downstream water demand during the non-rainy season.
For the two surface runoff processes in 2021, we inferred that both were runoff generation under saturated conditions. Especially the surface runoff process from 3–10 October 2021, occurred after an earlier process from 20–25 July 2021, the cumulative rainfall between 26 July and 2 October was 307.8 mm, it can be assumed that soil moisture content should be high at this time. Although runoff generation occurred after 55 h of continuous rainfall, the duration of continuous rainfall was 83 h. The average rainfall intensity was 1.95 mm/h, while the runoff coefficient was 0.63, which is typical runoff generation under saturated conditions. This type of runoff occurs when the topsoil layer becomes saturated, enabling subsurface flow through the soil matrix. This explains why, although the rainfall was only 173.7 mm, runoff continued after the rainfall stopped, and the runoff generation duration was comparable to that of the two runoff generation processes in 2016 and 2023 when the rainfall was 506.8 mm and 487 mm. The primary reason lies in the July 2021 runoff event: rainfall during this period (215.4 mm) primarily replenished soil moisture via infiltration, resulting in a low runoff coefficient (0.14) and an average flow rate of 3.07 L/s. From this, we deduce that in semi-arid areas, rainfall patterns and the moisture content of the rock and soil are the main factors determining runoff generation. Given that rainfall conditions cannot be altered, enhancing water conservation in rocky mountainous areas requires improving soil structure to increase water retention. Strategies include reducing surface runoff, increasing the infiltration capacity of soil moisture, improving soil structure, and elevating the content of soil organic matter. These measures can realize the enhancement of water conservation functions in mountainous areas.

4.2. Indications of Surface Runoff Generating Processes

The water scarcity crisis in North China, characterized by a significant attenuation of river runoff and an obvious decline in the groundwater table, has been alleviated in the context of the South-to-North Water Transfer Project and the Yellow River Diversion and Replenishment of Hebei province (Figure 8). As documented in the Haihe River Basin Water Resources Bulletin, external water transfers now constitute 48.7 ± 2.3% of surface water supplies (2016–2021), with the transfer-to-total-supply ratio increasing from 17.6% to 30.2% [57]. However, these engineering solutions have inadvertently heightened hydrological vulnerability. The disasters caused by unpredictable rainstorm weather, like torrential floods, flash floods, geologic disasters, and urban waterlogging, etc., are immeasurable. Taking 19 July 2016 as an example, this rainstorm weather led to 7.433 million affected populations across 142 counties in Hebei Province, 6 fatalities, 77 missing persons, 6041 km2 damaged cropland (including 181 km2 total loss), and RMB 8.973 billion direct economic losses [58]. Such events underscore the urgent need for adaptive water management strategies that simultaneously address scarcity and flood risks. Changes in rainfall patterns directly lead to changes in runoff generation of small mountain watersheds. When extreme rainfall events occur, only preventing is unable to ensure the ecological security of the downstream plains and water security, but also needs to be managed from the source, people should pay attention to further clarification of the intrinsic mechanisms of hydrological processes in mountainous areas and the importance of the factors that influence them as a whole, including the surface runoff generation process, the soil and rock infiltration process, and the subsurface runoff generation process, and so on. From the perspective of the Earth’s critical zone, a comprehensive approach should be taken into consideration, in order to give full play to the important ecological function of the mountainous areas of the water and soil conservation and maintenance of the water source.

5. Conclusions

In this study, the surface runoff generation processes exhibited variations among different heavy rainfall events in the Taihang Mountains. The frequency of extreme weather years was dominant from 2014 to 2023. Heavy rainfall displayed a distinct spatial distribution, with the line of rainfall greater than 200 mm basically coinciding with the 100 m contour line. Both the spatial variability of rainfall in the Taihang Mountains and the influence of elevation were less pronounced when the rainfall during 24 h was below 50 mm.
The 2016 and 2023 surface runoff events were typical runoff resulting from excess rain, which belonged to the storm runoff. The 2021 runoff events were runoff generation under saturated conditions. For runoff generation under saturated conditions, the contribution of rainfall was only 58.17%. When the runoff coefficient exceeded 0.5, the surface runoff generating processes were entirely determined by rainfall. In semi-arid regions with pronounced seasonal rainfall variability, greater soil moisture retention is required to sustain local and downstream water demands during the non-rainy season. To enhance the water-holding capacity of rocky mountainous soils, strategies such as reducing surface runoff, improving the infiltration capacity of soil moisture, optimizing soil structure, and increasing the content of soil organic matter are critical. The result of this study is so of great significance for realizing the enhancement of water conservation functions in mountainous areas of north China.

Author Contributions

Writing—original draft and Funding acquisition, X.H.; Conceptualization and Supervision, J.C.; Writing—review and editing, Data curation and Investigation, H.Y. All authors have read and agreed to the published version of the manuscript.

Funding

This work was supported by the Pilot Project of Basic Research Operating Expenses System of Hebei Academy of Sciences, China (2025PF05), the Science &Technology Fundamental Resources Investigation Program (2022FY100104), and the National Natural Science Foundation of China (42371048).

Data Availability Statement

Data will be made available on the request.

Conflicts of Interest

The authors declare no conflict of interest.

References

  1. Fei, K.; Deng, L.; Zhang, L.; Sun, T.; Wu, Y.; Fan, X.; Dong, Y. Lateral transport of soil total carbon with slope runoff and interflow: Effects of rainstorm characteristics under simulated rainfall. Catena 2019, 179, 39–48. [Google Scholar] [CrossRef]
  2. Jing, X.; Li, L.; Chen, S.; Shi, Y.; Xu, M.; Zhang, Q. Straw returning on sloping farmland reduces the soil and water loss via surface flow but increases the nitrogen loss via interflow. Agric. Ecosyst. Environ. 2022, 339, 108154. [Google Scholar] [CrossRef]
  3. Fu, T.; Liu, J.; Gao, H.; Qi, F.; Wang, F.; Zhang, M. Surface and subsurface runoff generation processes and their influencing factors on a hillslope in northern China. Sci. Total. Environ. 2023, 906, 167372. [Google Scholar] [CrossRef] [PubMed]
  4. Maier, F.; van Meerveld, I.; Weiler, M. Long-term changes in runoff generation mechanisms for two proglacial areas in the Swiss Alps II: Subsurface flow. Water Resour. Res. 2021, 57, e2021WR030223. [Google Scholar] [CrossRef]
  5. Martínez-Mena, M.; Carrillo-Lopez, E.; Boix-Fayos, C.; Almagro, M.; García Franco, N.; Díaz-Pereira, E.; Montoya, I.; de Vente, J. Long-term effectiveness of sustainable land management practices to control runoff, soil erosion, and nutrient loss and the role of rainfall intensity in Mediterranean rainfed agroecosystems. Catena 2020, 187, 104352. [Google Scholar] [CrossRef]
  6. Ran, Q.; Su, D.; Li, P.; He, Z. Experimental study of the impact of rainfall characteristics on runoff generation and soil erosion. J. Hydrol. 2012, 424–425, 99–111. [Google Scholar] [CrossRef]
  7. Wei, W.; Jia, F.; Yang, L.; Chen, L.; Zhang, H.; Yu, Y. Effects of surficial condition and rainfall intensity on runoff in a loess hilly area, China. J. Hydrol. 2014, 513, 115–126. [Google Scholar] [CrossRef]
  8. Mohamadi, M.A.; Kavian, A. Effects of rainfall patterns on runoff and soil erosion in field plots. Int. Soil Water Conserv. Res. 2015, 3, 273–281. [Google Scholar] [CrossRef]
  9. Chen, H.; Zhang, X.; Abla, M.; Lü, D.; Yan, R.; Ren, Q.; Ren, Z.; Yang, Y.; Zhao, W.; Lin, P.; et al. Effects of vegetation and rainfall types on surface runoff and soil erosion on steep slopes on the Loess Plateau, China. Catena 2018, 170, 141–149. [Google Scholar] [CrossRef]
  10. Zhao, J.; Zhang, J.; Hu, Y.; Li, Y.; Tang, P.; Gusarov, A.V.; Yu, Y. Effects of land uses and rainfall regimes on surface runoff and sediment yield in a nested watershed of the Loess Plateau, China. J. Hydrol. Reg. Stud. 2022, 44, 404277. [Google Scholar] [CrossRef]
  11. Güçlü, Y.S. Improved visualization for trend analysis by comparing with classical Mann-Kendall test and ITA. J. Hydrol. 2020, 584, 124674. [Google Scholar]
  12. Liu, G.; Wang, G. Insight into runoff decline due to climate change in China’s Water Tower. Water Supply 2012, 12, 352–361. [Google Scholar] [CrossRef]
  13. Yoon, J.-H.; Wang, S.-Y.S.; Gillies, R.R.; Kravitz, B.; Hipps, L.; Rasch, P.J. Increasing water cycle extremes in California and in relation to ENSO cycle under global warming. Nat. Commun. 2015, 6, 8657. [Google Scholar]
  14. Zheng, H.; Chiew, F.H.; Charles, S.; Podger, G. Future climate and runoff projections across South Asia from CMIP5 global climate models and hydrological modelling. J. Hydrol. Reg. Stud. 2018, 18, 92–109. [Google Scholar]
  15. Ju, X.; Li, W.; Li, J.; He, L.; Mao, J.; Han, L. Future climate change and urban growth together affect surface runoff in a large-scale urban agglomeration. Sustain. Cities Soc. 2023, 99, 104970. [Google Scholar]
  16. Shi, P.; Li, P.; Li, Z.; Sun, J.; Wang, D.; Min, Z. Effects of grass vegetation coverage and position on runoff and sediment yields on the slope of Loess Plateau, China. Agric. Water Manag. 2022, 259, 107231. [Google Scholar] [CrossRef]
  17. Zhang, X.; Yu, Y.; Hu, C.; Ping, J. Study on the influence of vegetation change on runoff generation mechanism in the Loess Plateau, China. Water Supply 2020, 21, 683–695. [Google Scholar]
  18. Astuti, I.S.; Sahoo, K.; Milewski, A.; Mishra, D.R. Impact of land use land cover (LULC) change on surface runoff in an increasingly urbanized tropical watershed. Water Resour. Manag. 2019, 33, 4087–4103. [Google Scholar]
  19. Du, J.K.; Jia, Y.W.; Hao, C.P.; Li, X.X.; Qiu, Y.Q.; Niu, C.W. Evolution law and attribution analysis of vertical distribution of blue water and green water in Taihang Mountain region. South—North Water Transf. Water Sci. Technol. 2018, 16, 64–73, (In Chinese with English abstract). [Google Scholar]
  20. Qi, F.; Liu, J.; Gao, H.; Fu, T.; Wang, F. Characteristics and spatial–temporal patterns of supply and demand of ecosystem services in the Taihang Mountains. Ecol. Indic. 2023, 147, 109932. [Google Scholar]
  21. Yang, Y. Evolution of habitat quality and association with land-use changes in mountainous areas: A case study of the Taihang Mountains in Hebei Province, China. Ecol. Indic. 2021, 129, 107967. [Google Scholar]
  22. Wang, J.; Chen, W.W.; Qi, S.L.; Zhou, C.H.; Zhang, W.J. Spatial analysis of soil and water loss sensitivity based on USLE and GIS—A case study of Taihang Mountain area in Hebei Province. Geogr. Res. 2014, 33, 614–624, (In Chinese with English abstract). [Google Scholar]
  23. Geng, S.; Shi, P.; Zong, N.; Zhu, W. Using soil survey database to assess soil quality in the heterogeneous Taihang mountains, North China. Sustainability 2018, 10, 3443. [Google Scholar] [CrossRef]
  24. Zhang, N.; Ge, Y.; Li, Y.; Li, B.; Zhang, R.; Zhang, Z.; Fan, B.; Zhang, W.; Ding, G. Modern pollen-vegetation relationships in the Taihang Mountains: Towards the quantitative reconstruction of land-cover changes in the North China Plain. Ecol. Indic. 2021, 129, 107928. [Google Scholar]
  25. Sakakibara, K.; Tsujimura, M.; Song, X.; Zhang, J. Spatiotemporal variation of the surface water effect on the groundwater recharge in a low-precipitation region: Application of the multi-tracer approach to the Taihang Mountains, North China. J. Hydrol. 2017, 545, 132–144. [Google Scholar]
  26. Yang, H.; Hou, X.; Cao, J. Identifying the driving impact factors on water yield service in mountainous areas of the Beijing-Tianjin-Hebei Region in China. Remote Sens. 2023, 15, 727. [Google Scholar] [CrossRef]
  27. Jia, Y.W.; Hao, C.P.; Niu, C.W.; Qiu, Y.Q.; Du, J.K.; Xu, F.; Liu, H. Spatial-temporal variations of precipitation and runoff and analyses of water-heat-human-land matching characteristics in a typical mountainous area of China. Acta Geogr. Sin. 2019, 74, 2288–2302, (In Chinese with English abstract). [Google Scholar]
  28. Xia, J.; Zhang, Y.Y. Water resource and pollution safeguard for Xiongan New Area construction and its sustainable development. Bull. Chin. Acad. Sci. 2017, 32, 1199–1205, (In Chinese with English abstract). [Google Scholar]
  29. Geng, S.; Shi, P.; Song, M.; Zong, N.; Zu, J.; Zhu, W. Diversity of vegetation composition enhances ecosystem stability along elevational gradients in the Taihang Mountains, China. Ecol. Indic. 2019, 104, 594–603. [Google Scholar]
  30. Hirabayashi, Y.; Mahendran, R.; Koirala, S.; Konoshima, L.; Yamazaki, D.; Watanabe, S.; Kim, H.; Kanae, S. Global flood risk under climate change. Nat. Clim. Change 2013, 3, 816–821. [Google Scholar]
  31. Najafi, M.R.; Zhang, Y.; Martyn, N. A flood risk assessment framework for interdependent infrastructure systems in coastal environments. Sustain. Cities Soc. 2021, 64, 102516. [Google Scholar] [CrossRef]
  32. Huntington, T.G. Evidence for intensification of the global water cycle: Review and synthesis. J. Hydrol. 2006, 319, 83–95. [Google Scholar] [CrossRef]
  33. Pour, S.H.; Wahab, A.K.A.; Shahid, S.; Asaduzzaman; Dewan, A. Low impact development techniques to mitigate the impacts of climate-change-induced urban floods: Current trends, issues and challenges. Sustain. Cities Soc. 2020, 62, 102373. [Google Scholar] [CrossRef]
  34. Xie, K.; Liu, P.; Zhang, J.; Libera, D.A.; Wang, G.; Li, Z.; Wang, D. Verification of a new spatial distribution function of soil water storage capacity using conceptual and SWAT models. J. Hydrol. Eng. 2020, 25, 04020007. [Google Scholar] [CrossRef]
  35. Guo, D.; Johnson, F.; Marshall, L. Assessing the Potential Robustness of Conceptual Rainfall-Runoff Models Under a Changing Climate. Water Resour. Res. 2018, 54, 5030–5049. [Google Scholar] [CrossRef]
  36. Tajiki, M.; Schoups, G.; Franssen, H.J.H.; Najafinejad, A.; Bahremand, A. recursive bayesian estimation of conceptual rainfall-runoff model errors in real-time prediction of streamflow. Water Resour. Res. 2020, 56, e2019WR025237. [Google Scholar] [CrossRef]
  37. Cao, J.; Yang, H.; Zhao, Y. Experimental analysis of infiltration process and hydraulic properties in soil and rock profile in the Taihang Mountains, North China. Water Supply 2021, 22, 1691–1703. [Google Scholar] [CrossRef]
  38. Cao, J.; Liu, C.; Zhang, W.; Han, S. Using temperature effect on seepage variations as proxy for phenological processes of basin-scale vegetation communities. Hydrol. Process. 2013, 27, 360–366. [Google Scholar] [CrossRef]
  39. Chen, J.X.; Zou, G.R.; Yin, W.S.; Zheng, H.R. Irrigation District Water Measurement Workbook; Water Resources and Hydropower Press: Beijing, China, 1984. (In Chinese) [Google Scholar]
  40. Conrad, V.; Pollak, C. Methods in Climatology; Harvard University Press: Cambridge, UK, 1950. [Google Scholar]
  41. Swed, F.S.; Eisenhart, C. Tables for testing randomness of grouping in a sequence of alternatives. Ann. Math. Stat. 1943, 14, 66–87. [Google Scholar] [CrossRef]
  42. da Silva, R.M.; Santos, C.A.G.; Moreira, M.; Corte-Real, J.; Silva, V.C.L.; Medeiros, I.C. Rainfall and river flow trends using Mann–Kendall and Sen’s slope estimator statistical tests in the Cobres River basin. Nat. Hazards 2015, 77, 1205–1221. [Google Scholar] [CrossRef]
  43. Mann, H.B. Nonparametric tests against trend. Econometrica 1945, 13, 245. [Google Scholar]
  44. Kendall, M.G. Rank Correlation Methods; Charles Griffin: London, UK, 1975. [Google Scholar]
  45. Gocic, M.; Trajkovic, S. Analysis of changes in meteorological variables using Mann-Kendall and Sen’s slope estimator statistical tests in Serbia. Glob. Planet. Change 2013, 100, 172–182. [Google Scholar]
  46. Zheng, H.; Miao, C.; Zhang, G.; Li, X.; Wang, S.; Wu, J.; Gou, J. Is the runoff coefficient increasing or decreasing after ecological restoration on China’s Loess Plateau? Int. Soil Water Conserv. Res. 2021, 9, 333–343. [Google Scholar] [CrossRef]
  47. Cheng, S.; Yu, X.; Li, Z.; Xu, X.; Ding, M. Using four approaches to separate the effects of climate change and human activities on sediment discharge in karst watersheds. Catena 2022, 212, 106118. [Google Scholar]
  48. Gao, P.; Li, P.; Zhao, B.; Xu, R.; Zhao, G.; Sun, W.; Mu, X. Use of double mass curves in hydrologic benefit evaluations. Hydrol. Process. 2017, 31, 4639–4646. [Google Scholar]
  49. Singh, V.P. Log-Pearson Type III Distribution BT—Entropy-Based Parameter Estimation in Hydrology; Springer: Cham, Switzerland, 1998. [Google Scholar]
  50. Li, L.; Song, X.; Xia, L.; Fu, N.; Feng, D.; Li, H.; Li, Y. Modelling the effects of climate change on transpiration and evaporation in natural and constructed grasslands in the semi-arid Loess Plateau, China. Agric. Ecosyst. Environ. 2020, 302, 107077. [Google Scholar]
  51. Horton, R.E. The role of infiltration in the hydrologic cycle. Trans. Am. Geophys. Union 1933, 14, 446–460. [Google Scholar]
  52. Zhao, R.J. The Xinanjiang model applied in China. J. Hydrol. 1992, 135, 371–381. [Google Scholar]
  53. Dunne, T.; Price, A.G.; Colbeck, S.C. The generation of runoff from subarctic snowpacks. Water Resour. Res. 1976, 12, 677–685. [Google Scholar]
  54. Ye, S.; Liu, L.; Li, J.; Pan, H.; Li, W.; Ran, Q. From rainfall to runoff: The role of soil moisture in a mountainous catchment. J. Hydrol. 2023, 625, 130060. [Google Scholar] [CrossRef]
  55. Dunne, T.; Black, R.D. An experimental investigation of runoff production in permeable soils. Water Resour. Res. 1970, 6, 478–490. [Google Scholar] [CrossRef]
  56. Hillel, D. Environmental Soil Physics: Fundamentals, Applications, and Environmental Considerations; Academic Press: San Diego, CA, USA, 1998. [Google Scholar]
  57. Haihe River Water Conservancy Commission, MWR. Haihe River Water Resources Bulletin 2021; Haihe River Water Conservancy Commission, MWR: Beijing, China, 2022. (In Chinese)
  58. Zhu, Z.W. Analysis of the July 18–19, 2016 heavy rain process in Hebei Province. Pract. Rural. Technol. 2019, 3, 17. (In Chinese) [Google Scholar]
Figure 1. Location of the study area.
Water 17 00970 g001
Figure 2. Annual precipitation change in the TMS from 1987 to 2023.
Water 17 00970 g002
Figure 3. Proportion of precipitation from June to September, daily precipitation intensity above I10 and I25 of annual precipitation in the TMS from 1987 to 2023.
Water 17 00970 g003
Figure 4. Spatial distribution of rainfall during (a) 19–24 July 2016, (b) 20–25 July 2021, (c) 3–10 October 2021, and (d) 29 July–4 August 2023.
Water 17 00970 g004aWater 17 00970 g004b
Figure 5. Correlation analysis between elevation and rainfall during 19–24 July 2016, 20–25 July 2021, 3–10 October 2021, and 29 July–4 August 2023.
Water 17 00970 g005
Figure 6. Surface runoff generating processes during 19–24 July 2016 (a), 20–25 July 2021 (b), 3–10 October 2021 (c), and 29 July–4 August 2023 (d).
Water 17 00970 g006
Figure 7. The double mass curve of surface runoff generating process during 19–24 July 2016.
Water 17 00970 g007
Figure 8. Schematic diagram of different water transfer projects in the North China Plain.
Water 17 00970 g008
Table 1. The values ZMK of total rainfall, total rainfall with daily rainfall intensity greater than I10 and I25 for the years 1987–2023, and total rainfall, total rainfall with daily rainfall intensity greater than I10 and I25 for the years 2014–2023.
Test ItemTotal Rainfall from 1987–2023Above I10 from 1987–2023Above I25 from 1987–2023Total Rainfall from 2014–2023Above I10 from 2014–2023Above I25 from 2014–2023
ZMK0.4050.1960.03921.612.33 **1.79 *
Note: ** Statistically significant trends at the 5% significance level. * Statistically significant trends at the 10% significance level.
Table 2. Effect of rainfall to changes in runoff of four surface runoff generating processes during, 20–25 July 2021, 3–10 October 2021, and 29 July–4 August 2023.
Baseline PeriodChanging Period R b ¯ /m3 R c ¯ /m3Tb/hTc/h R a ¯ /m3 P /%
19th to 24th July, 2016 66.27-117---
20th to 25th July, 2021-11.04-7334.1458.17
3rd to 10th October, 2021-24.03-11915.12121.09
29th July to 4th August, 2023-61.70-11958.92160.70
Disclaimer/Publisher’s Note: The statements, opinions and data contained in all publications are solely those of the individual author(s) and contributor(s) and not of MDPI and/or the editor(s). MDPI and/or the editor(s) disclaim responsibility for any injury to people or property resulting from any ideas, methods, instructions or products referred to in the content.

