
Spatio-Temporal Variation Characteristics of Grassland Water Use Efficiency and Its Response to Drought in China


Abstract
:1. Introduction
2. Materials and Methods
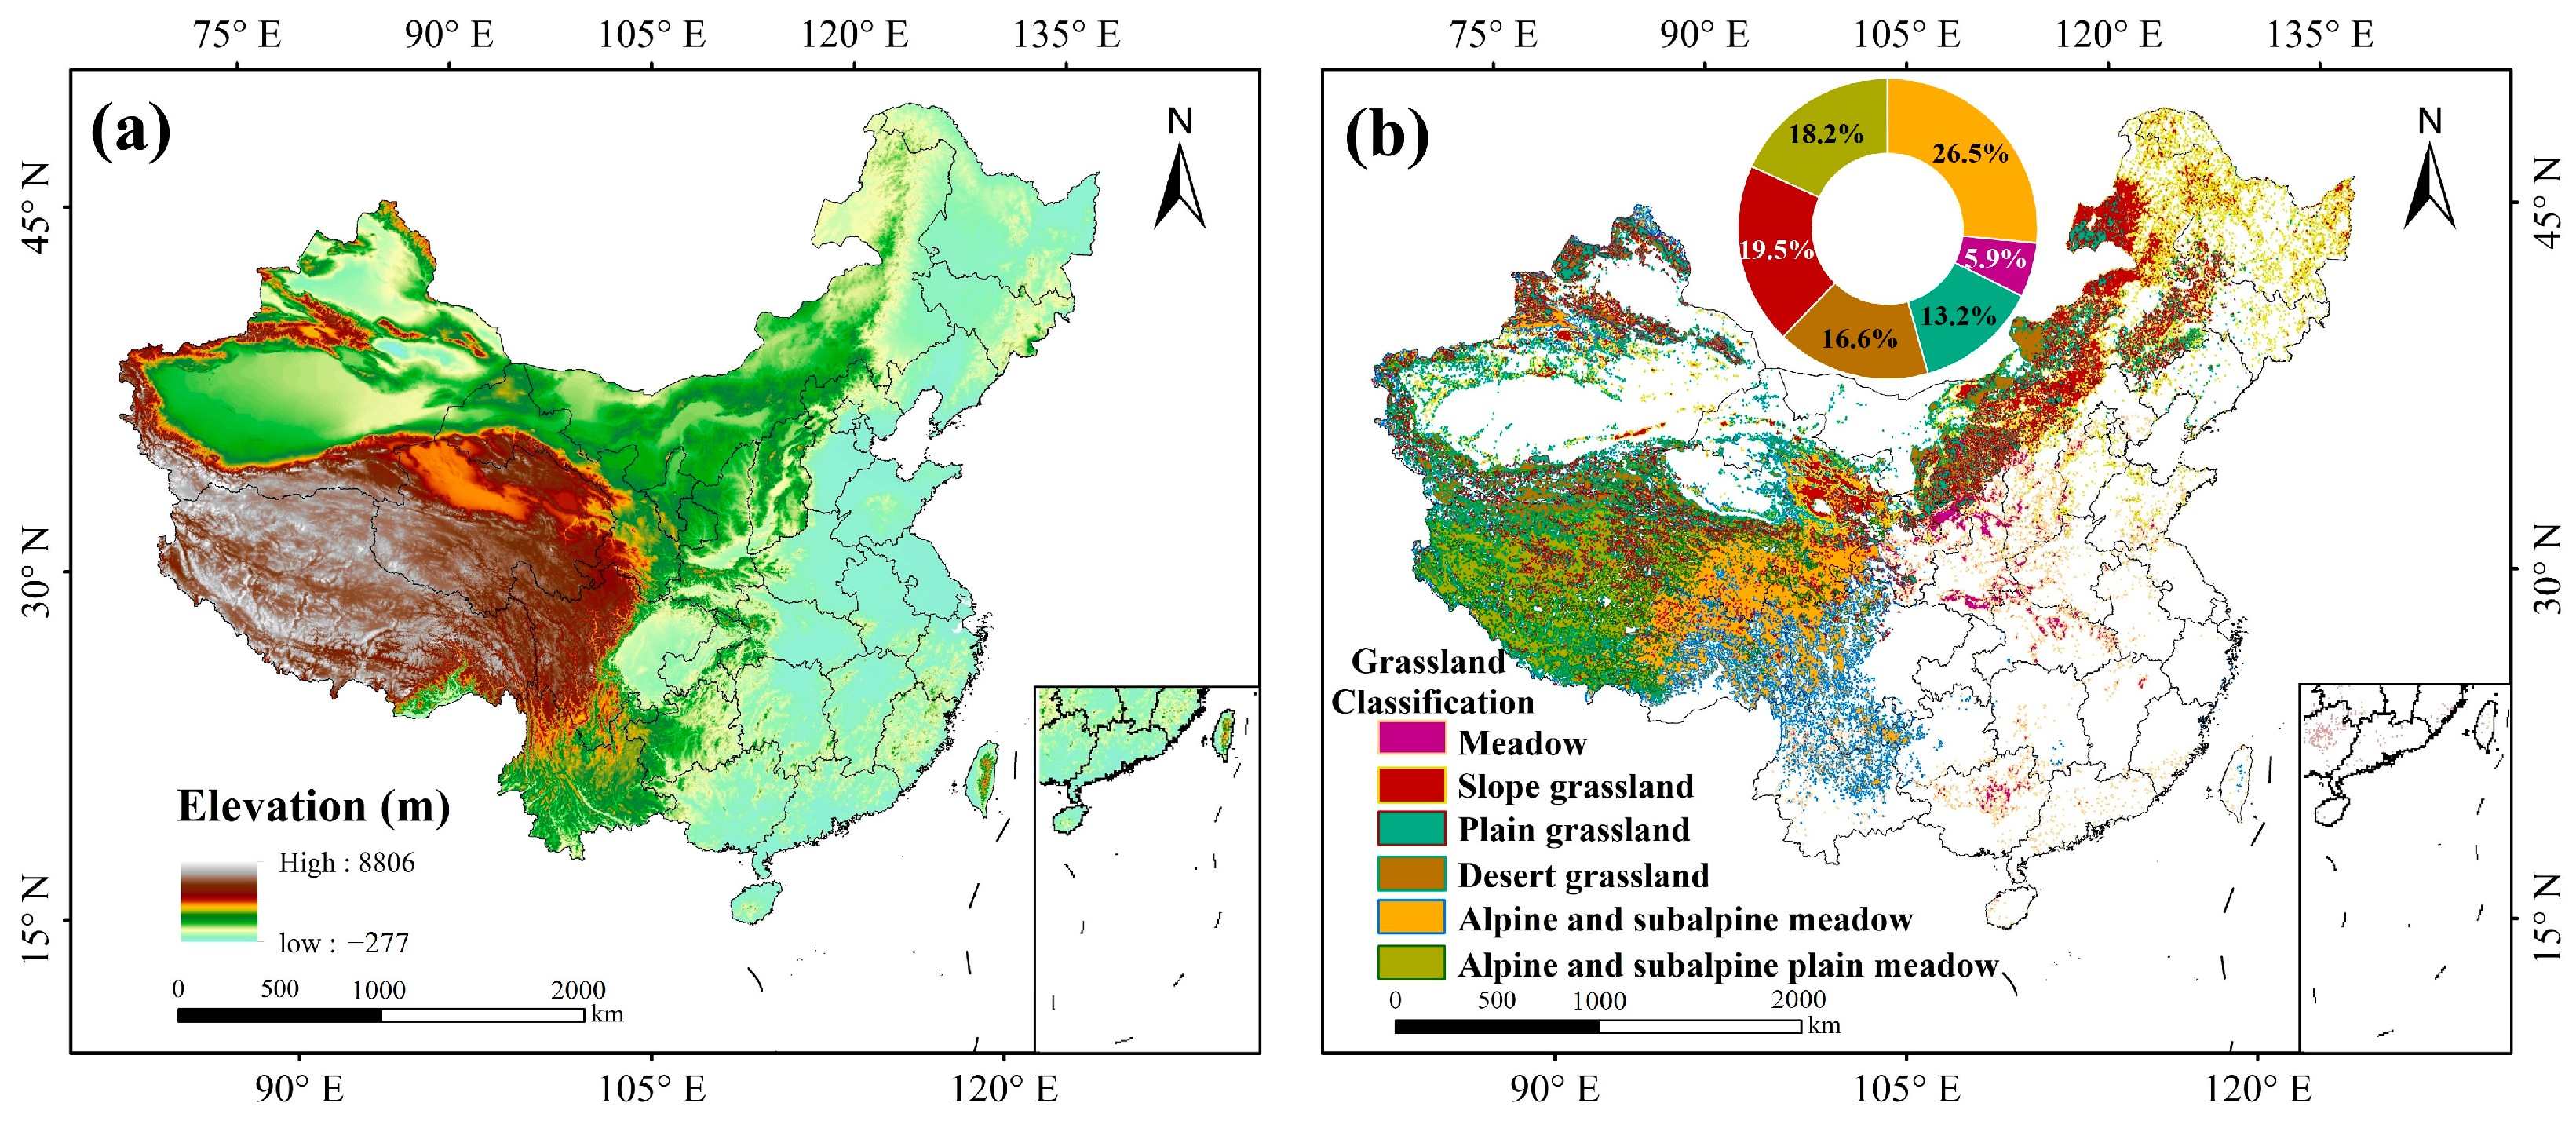
2.1. Study Area
2.2. Data
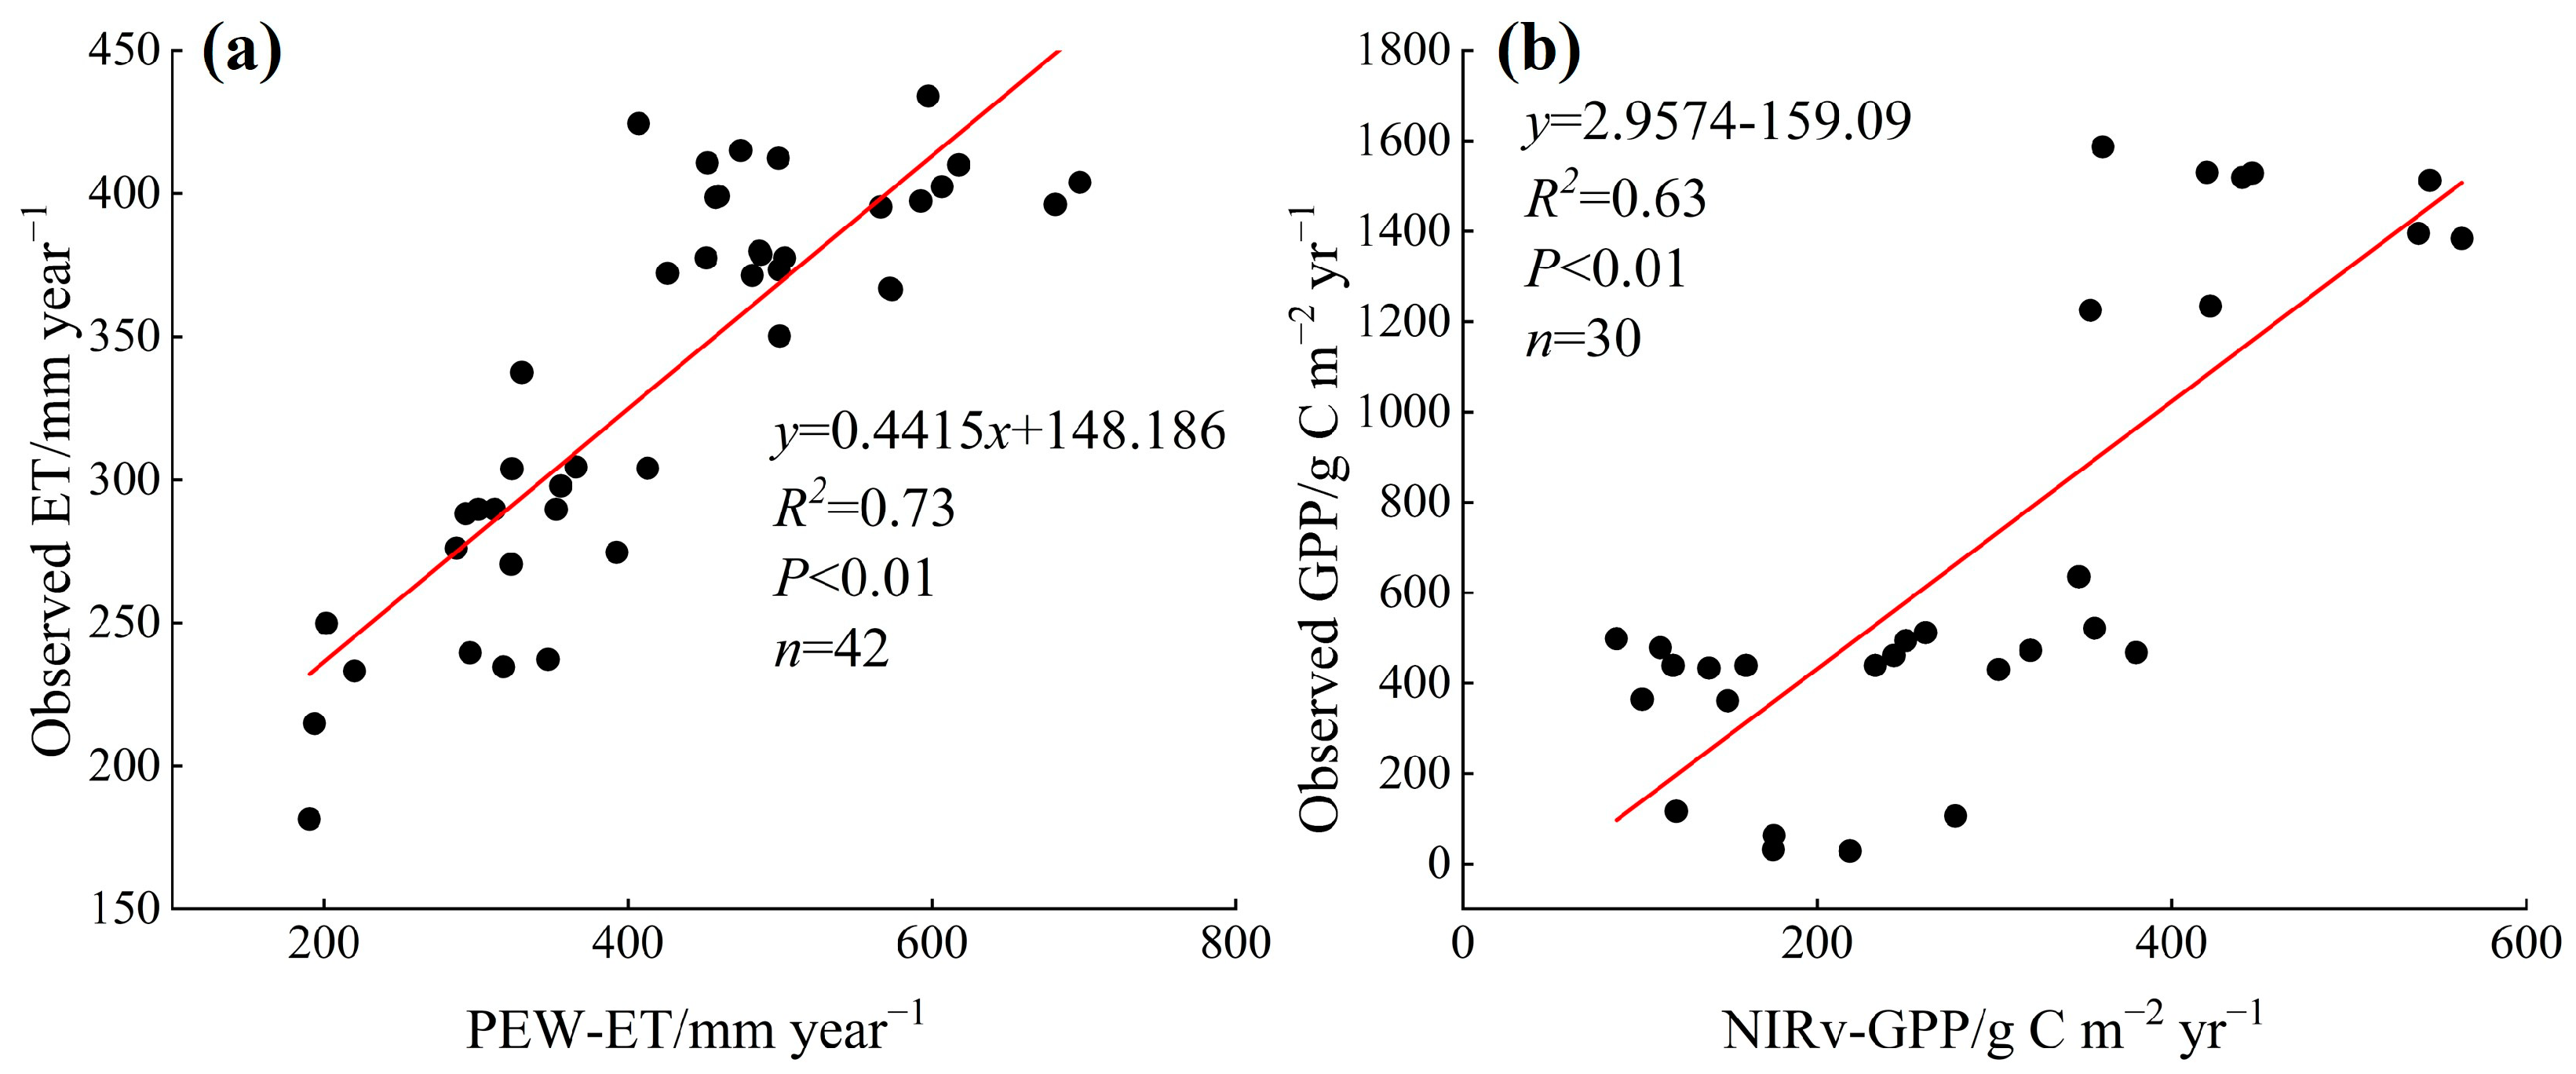
2.3. Data Validation
2.4. Method
2.4.1. Estimation of WUE
2.4.2. Calculating the Cumulative Effect of Drought on Water Use Efficiency
2.4.3. Calculating the Lagged Effect of Drought on Water Use Efficiency
2.4.4. Trend Analysis
3. Results
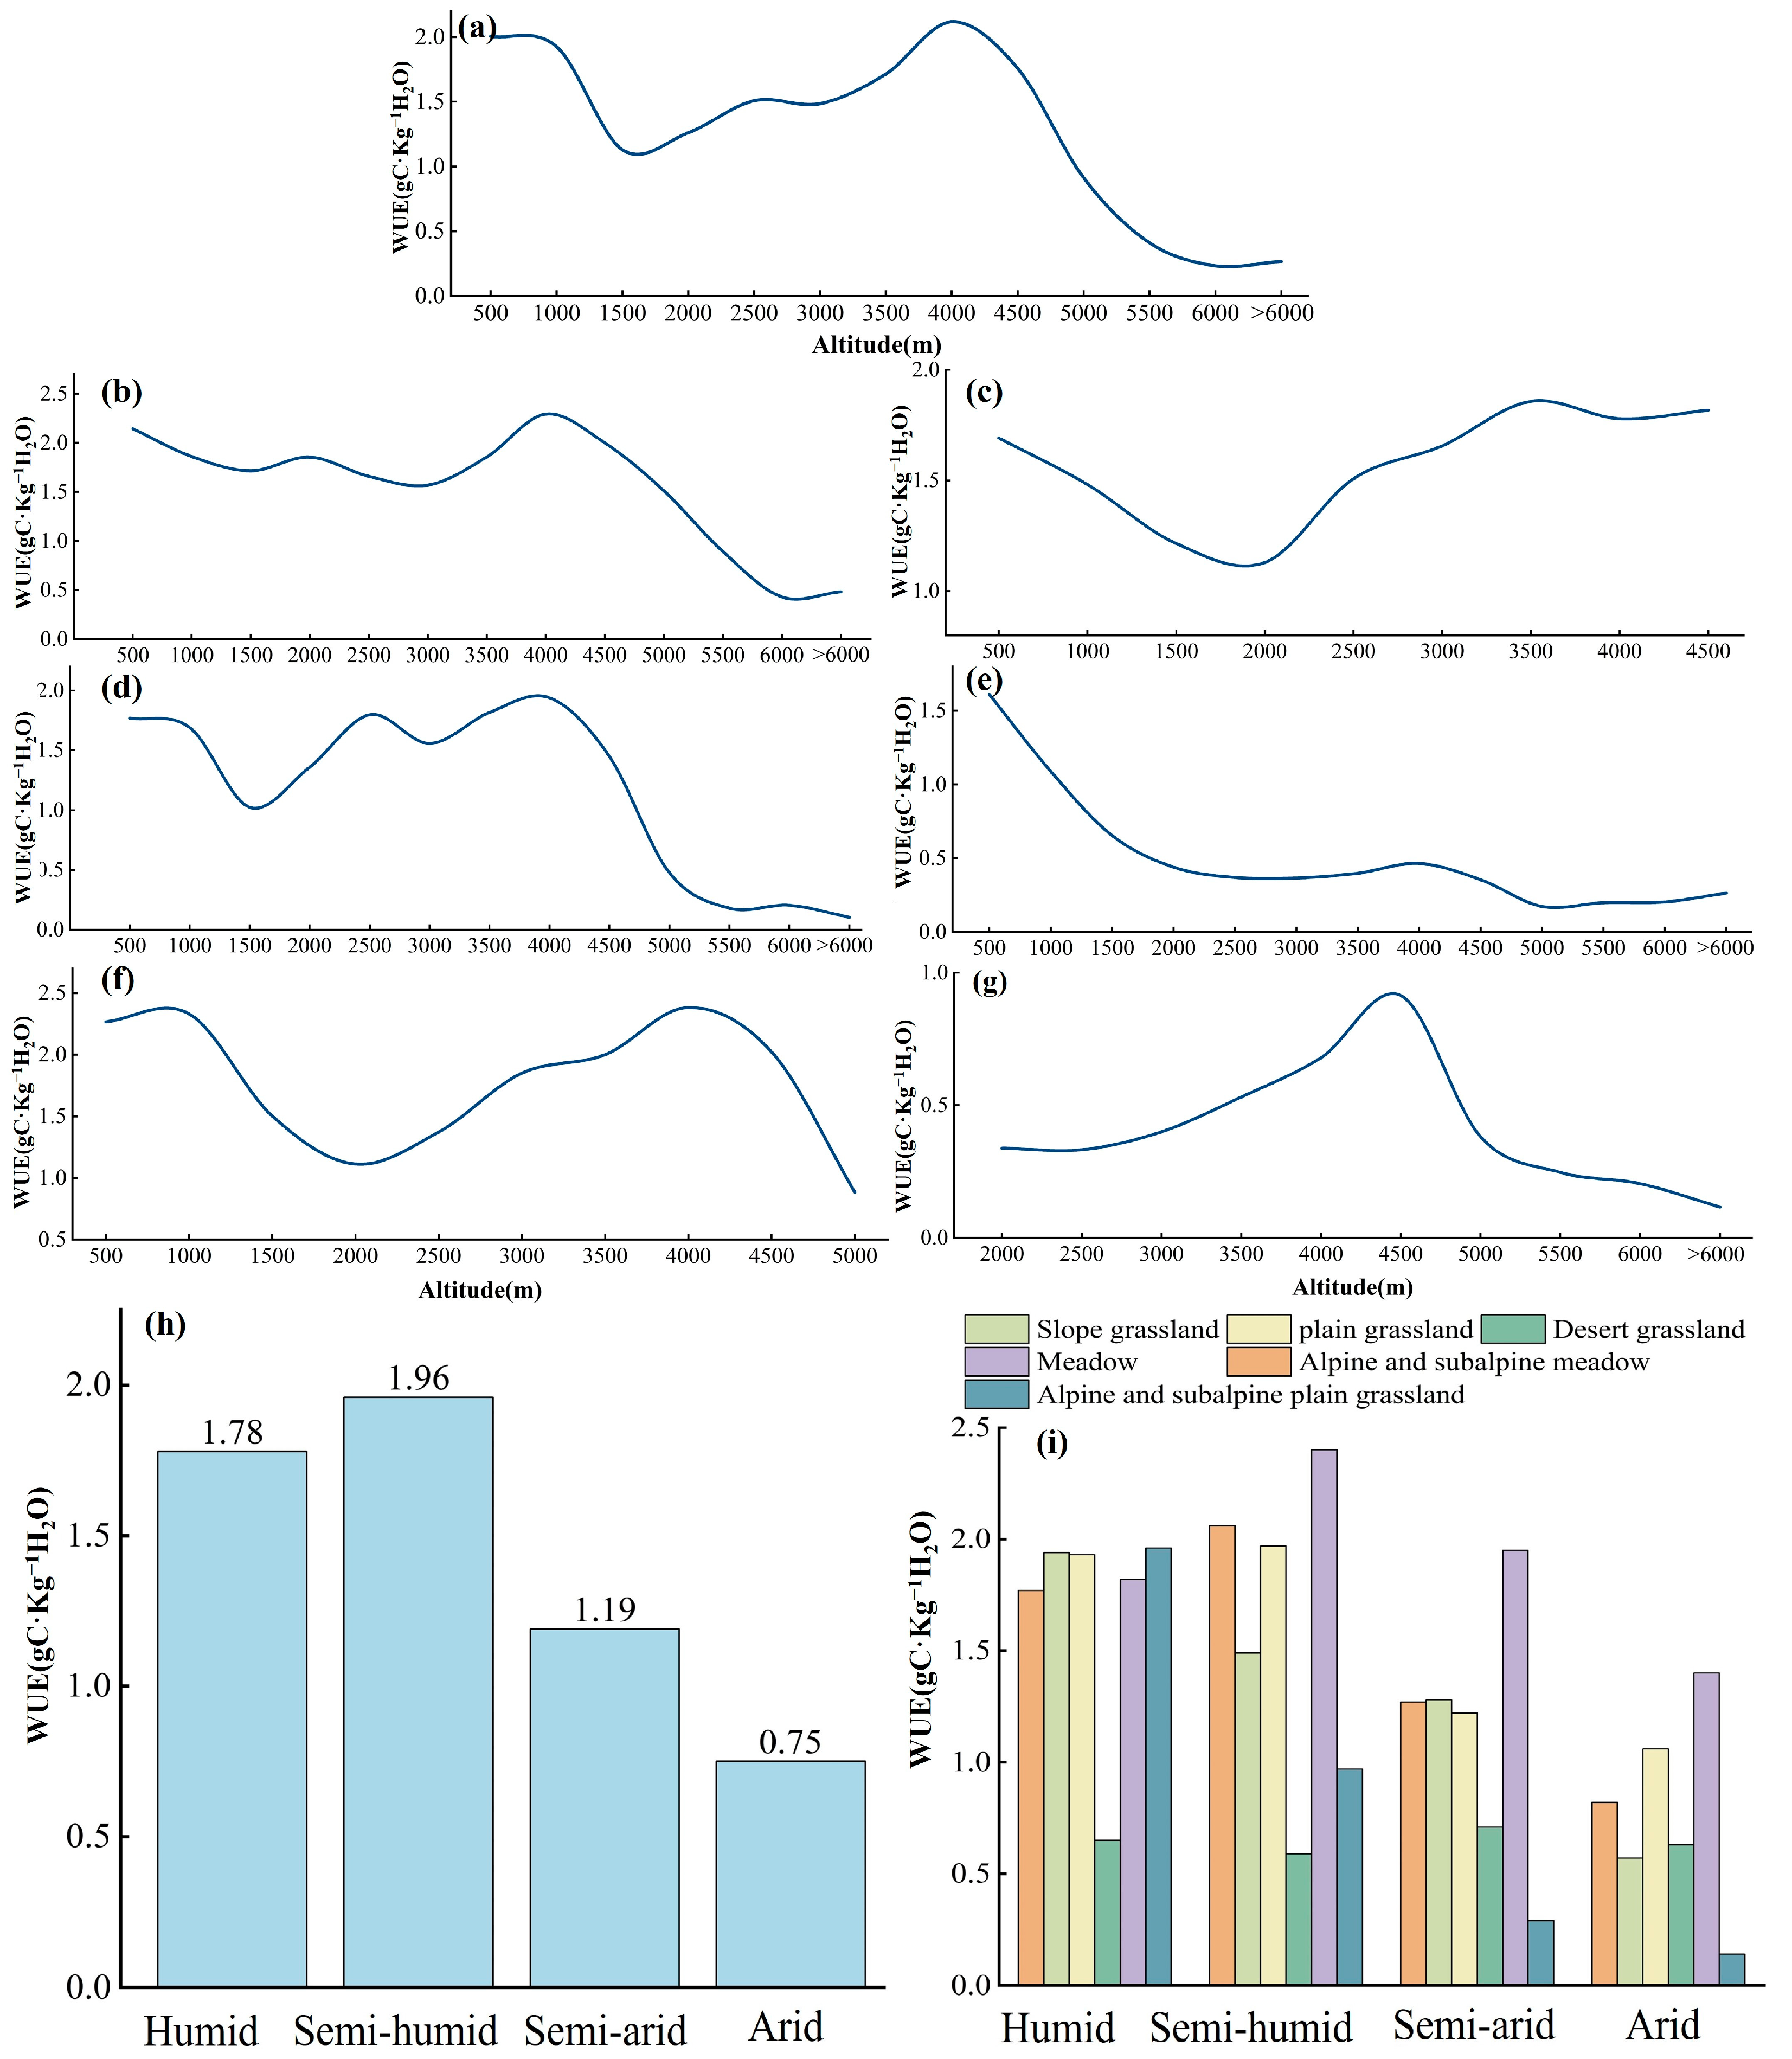
3.1. Spatial and Temporal Variation in Grassland WUE
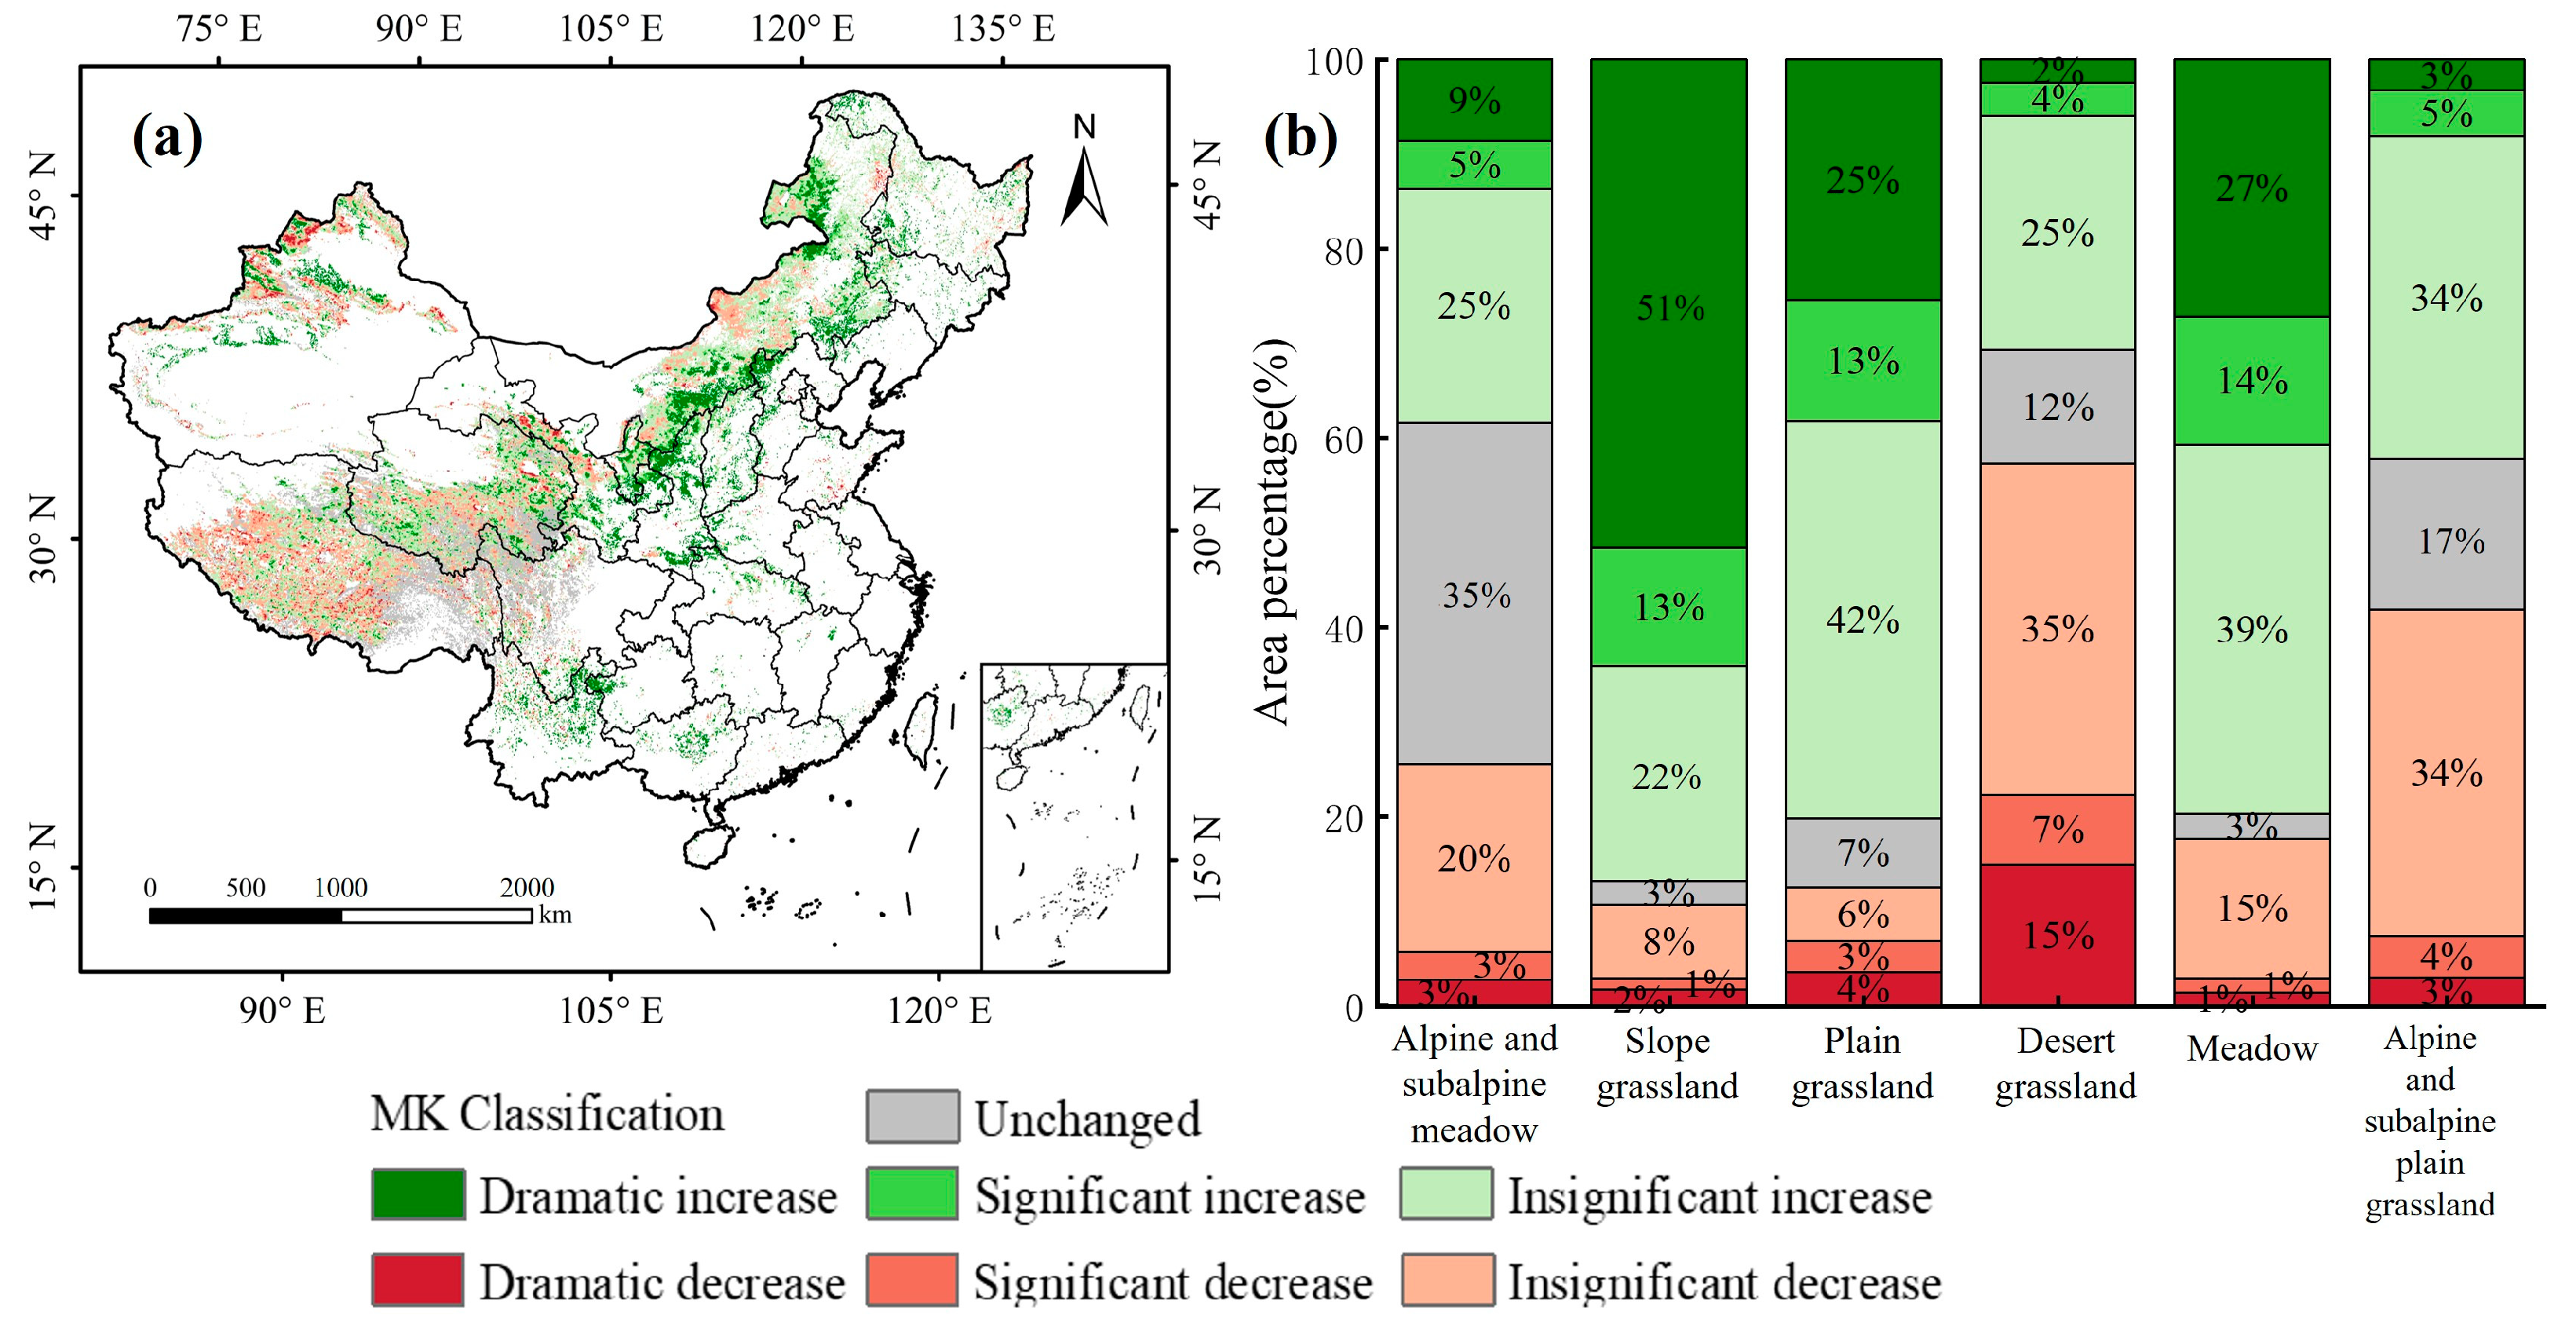
3.2. Spatial Distribution of Grassland WUE Trends
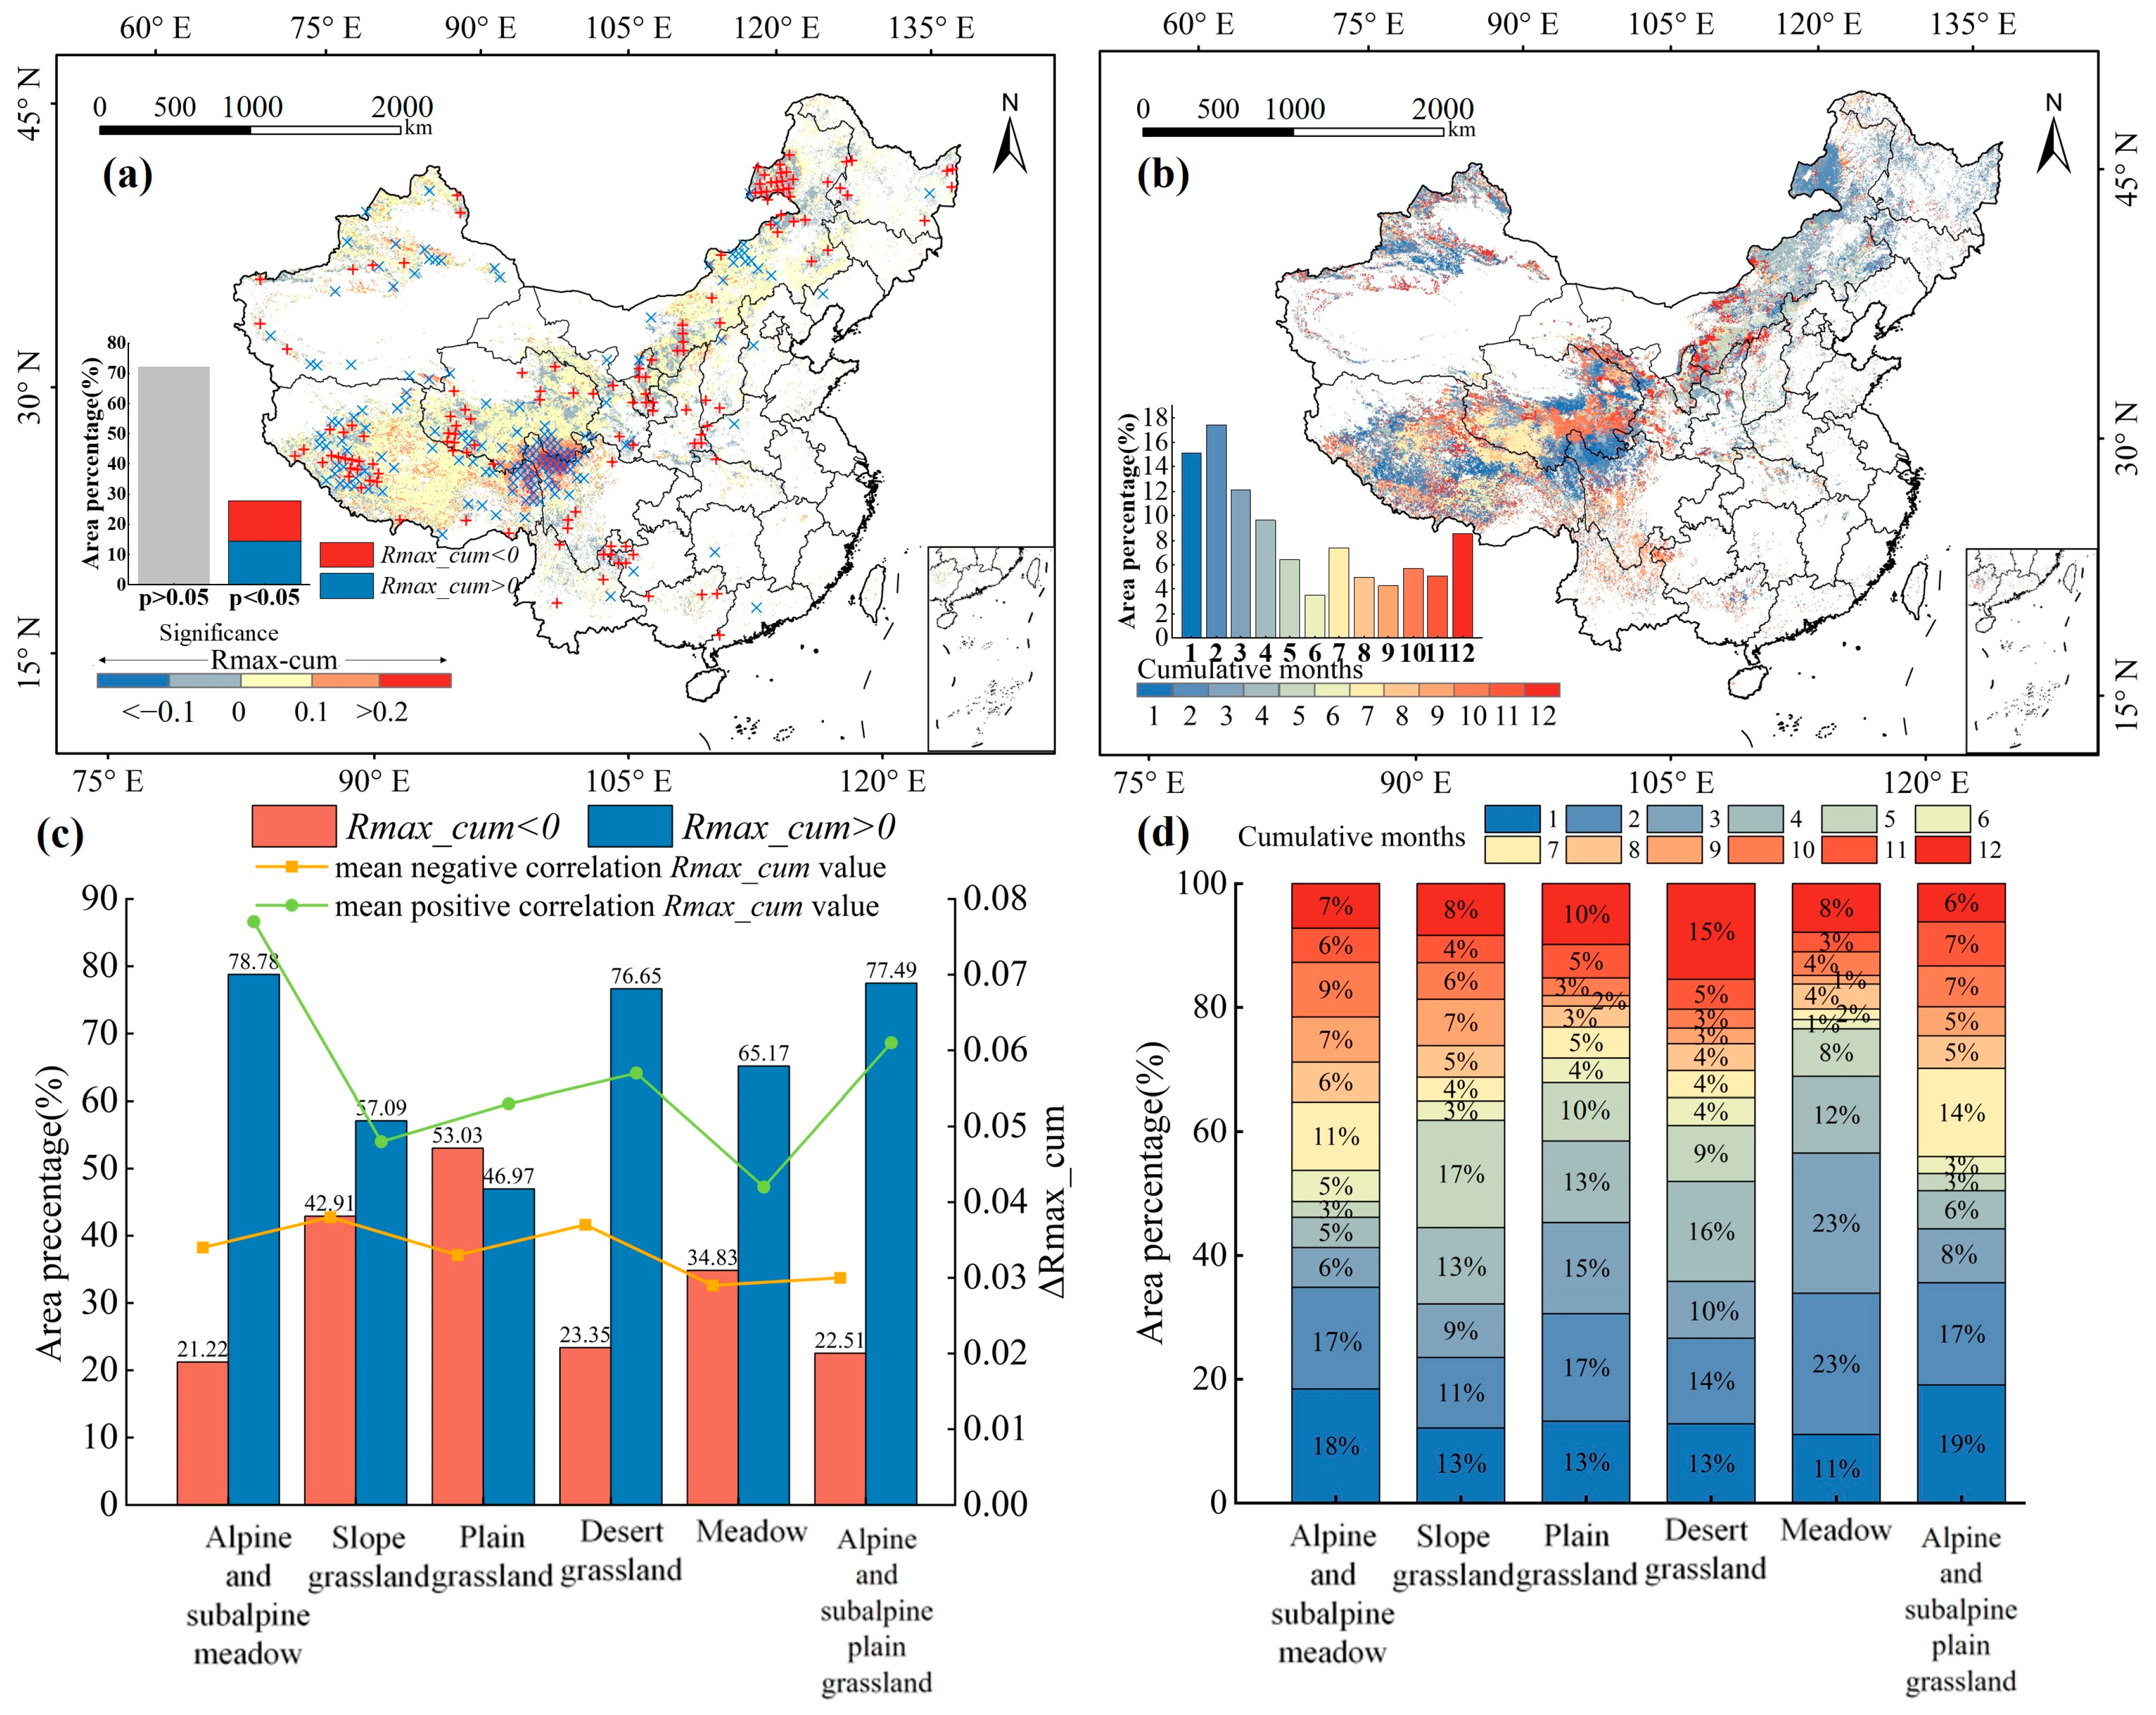
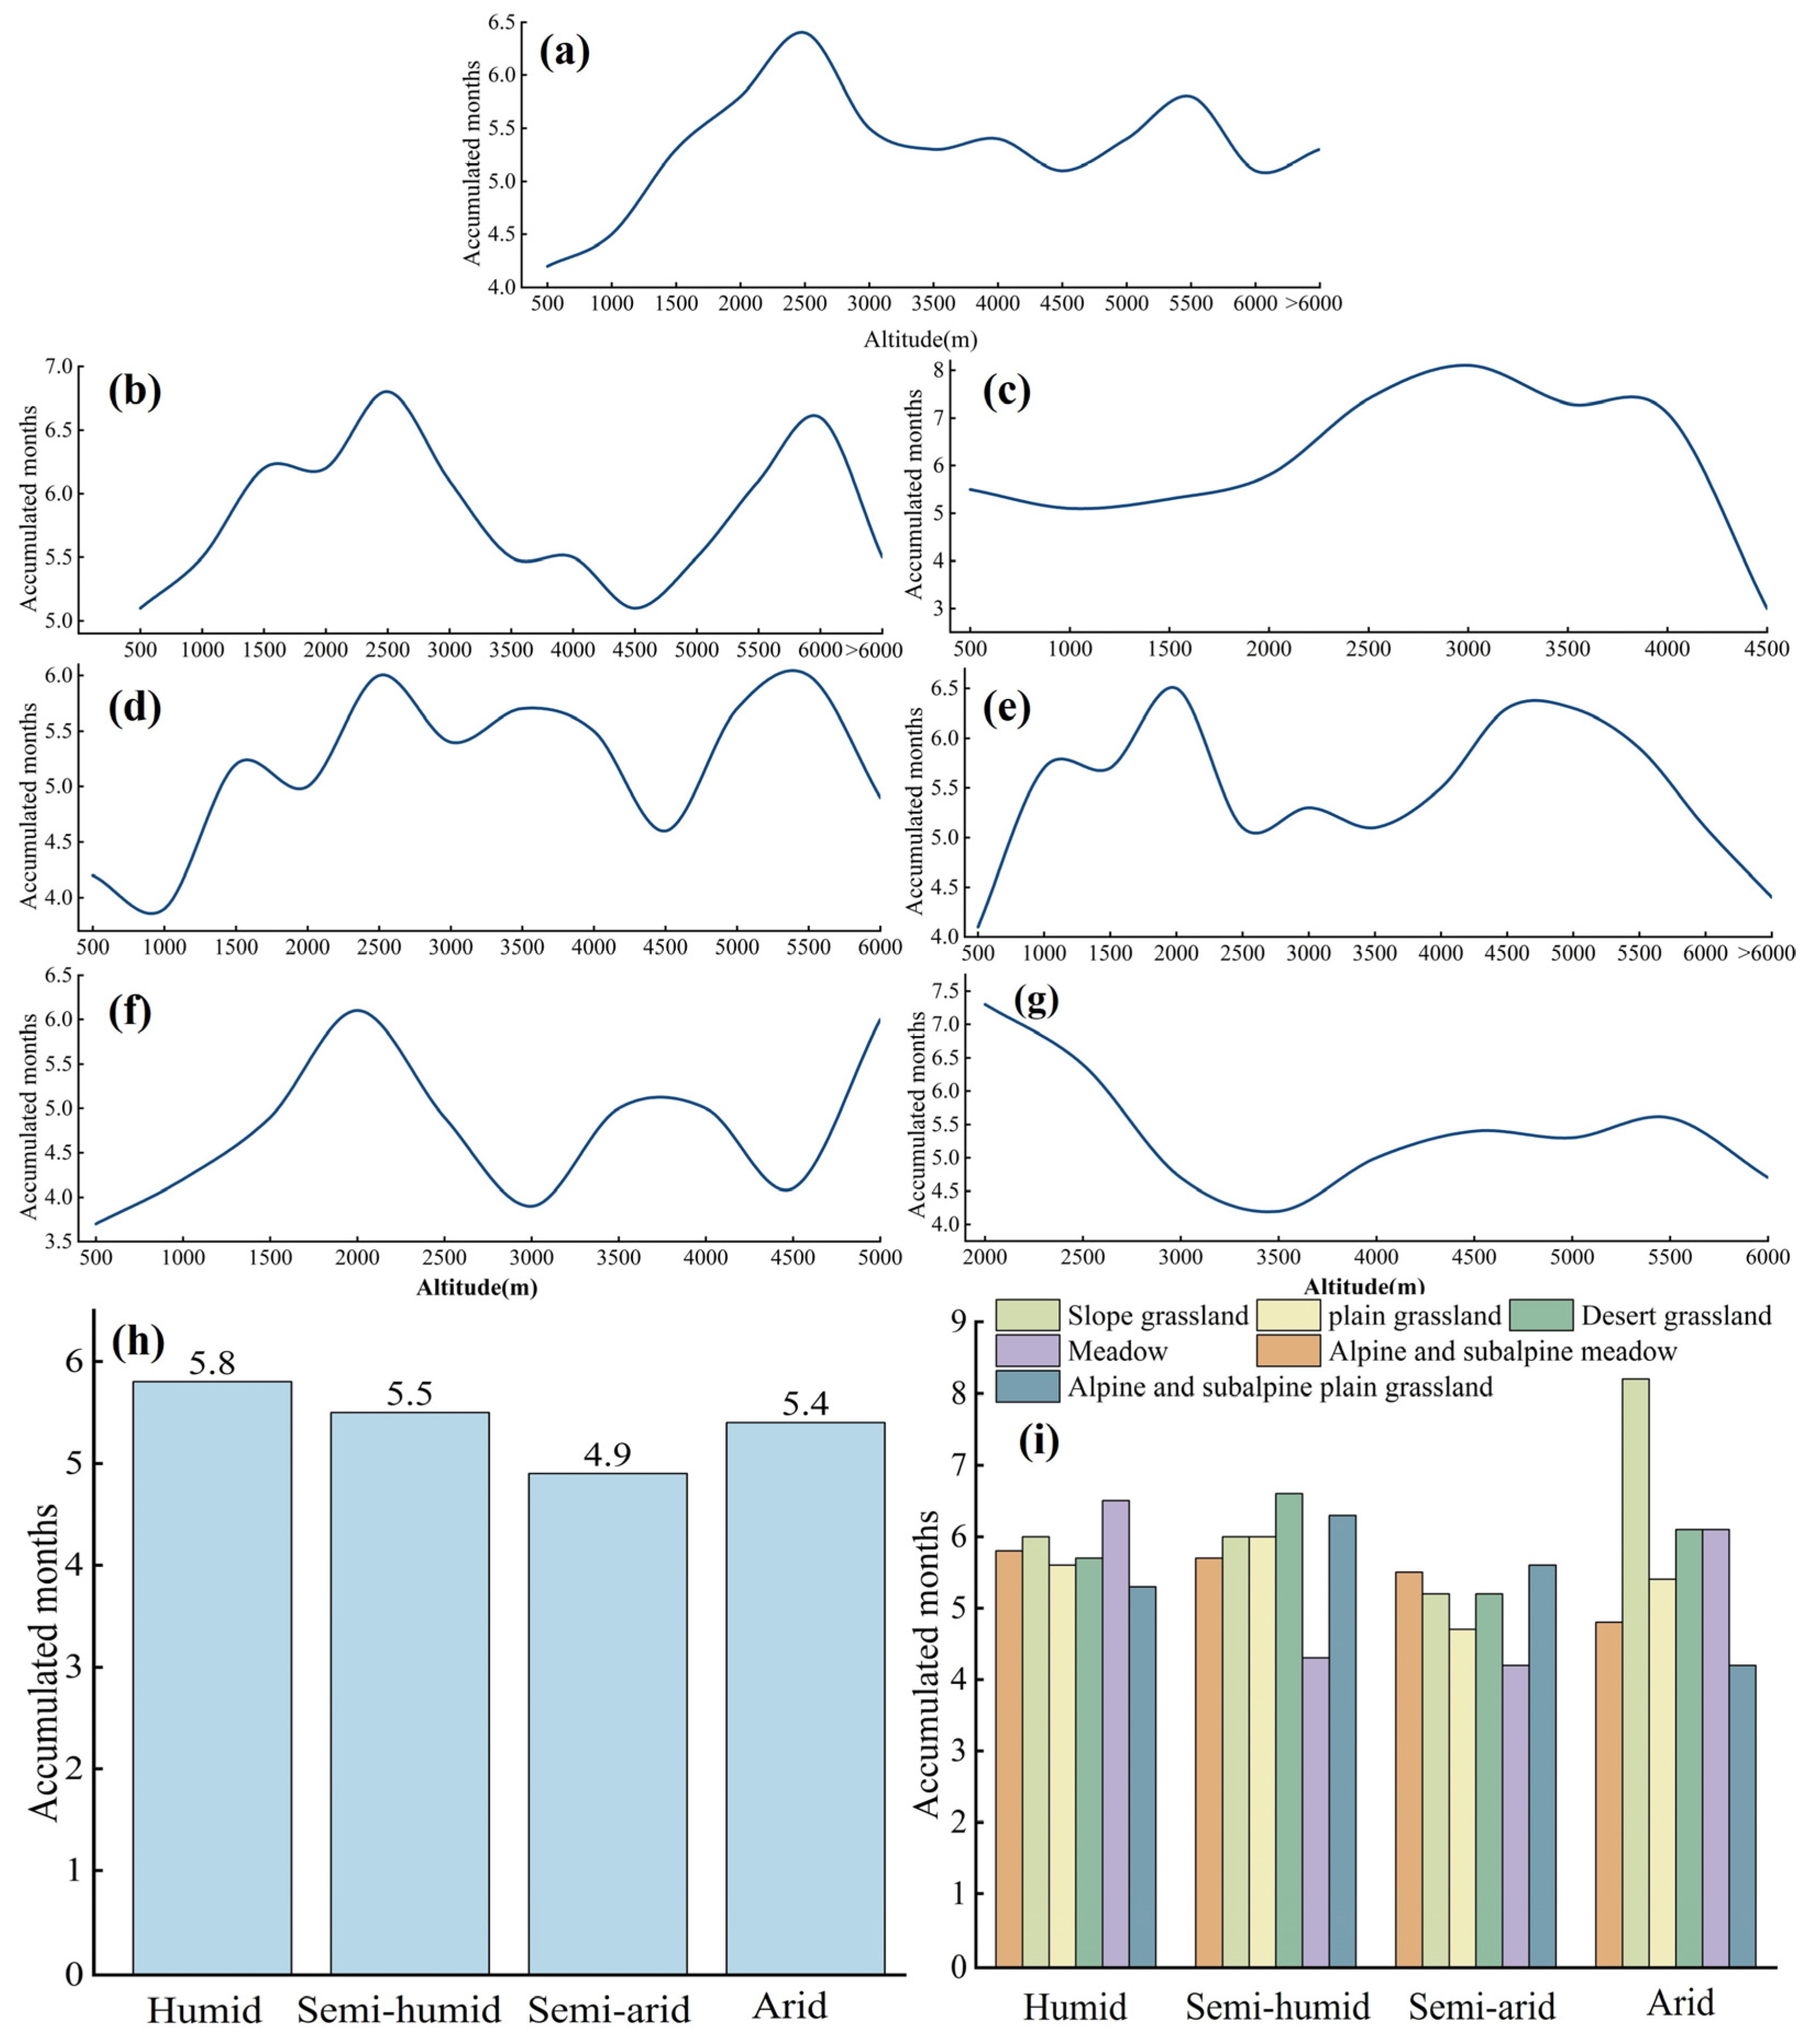
3.3. Spatial Distribution of Cumulative Effects of Drought on Grassland WUE
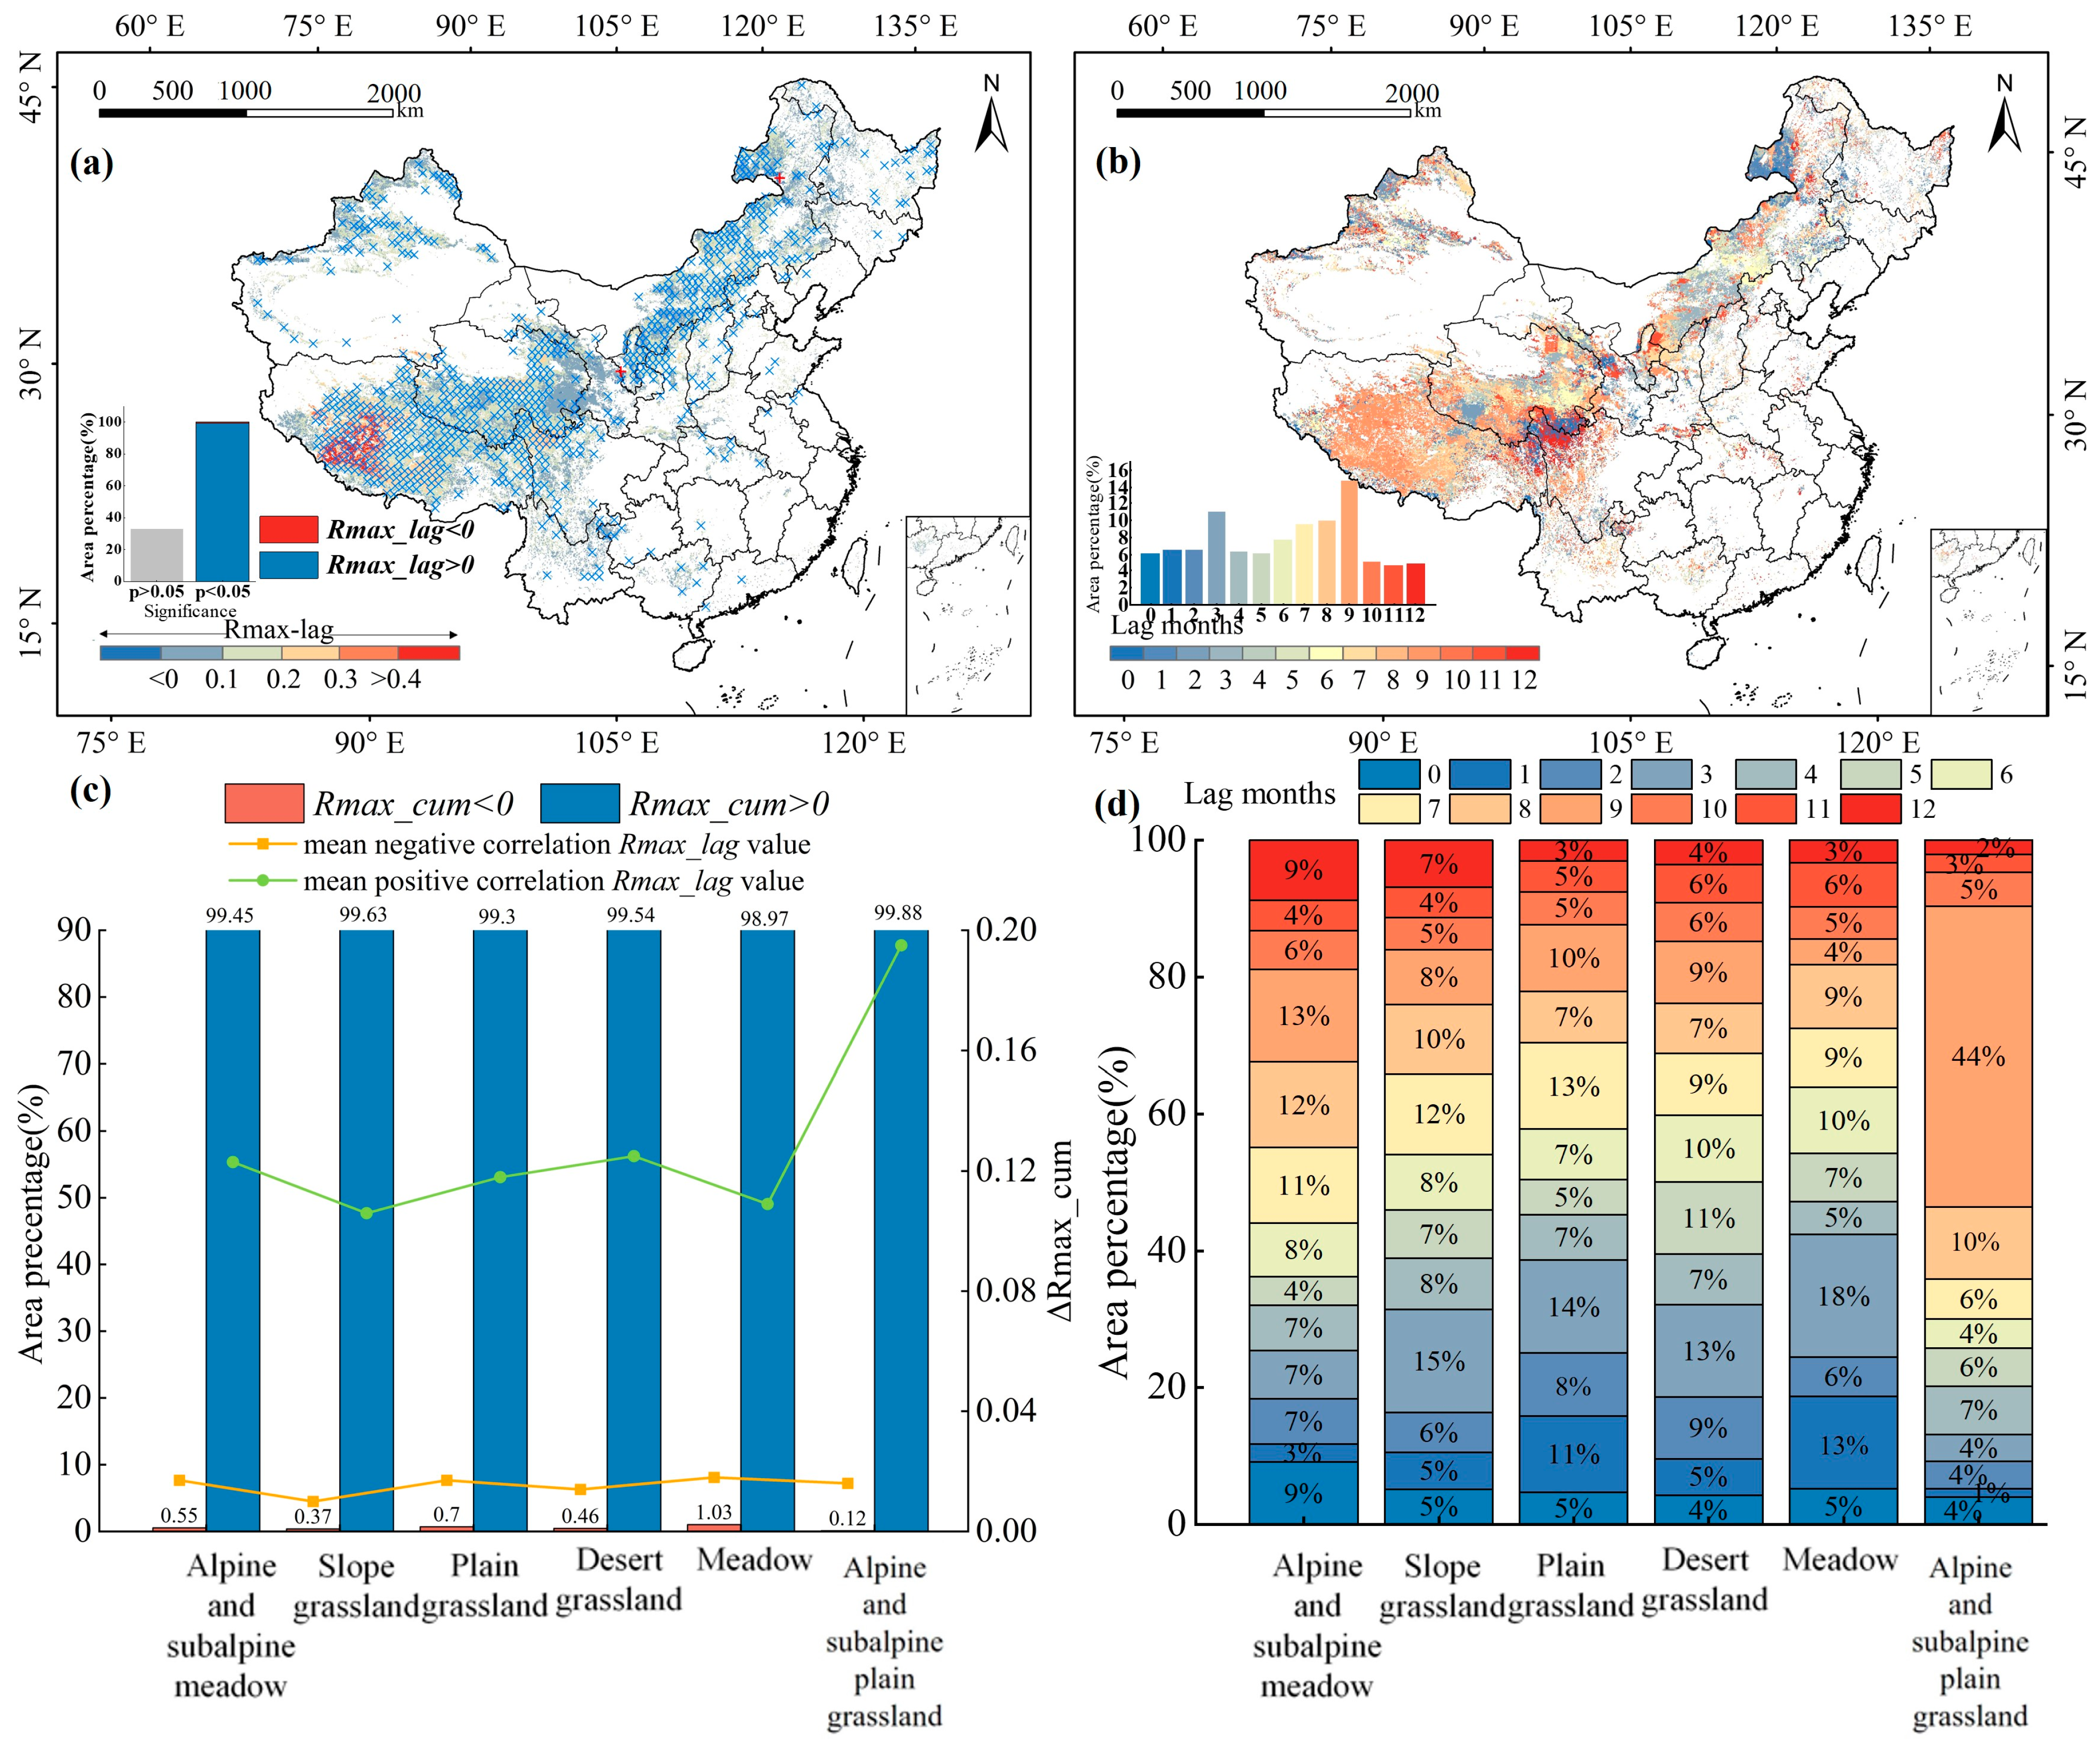
3.4. Spatial Distribution of Lagged Effects of Drought on Grassland WUE
3.5. Compared with the Cumulative Effect, the Lagged Effects of Drought Dominate Grassland WUE in China
4. Discussion
4.1. Cumulative and Lagged Effects of Drought on Grassland WUE
4.2. Response of Grassland WUE to Drought in China Under Different Influencing Factors
4.3. Lagged Effects of Drought Dominate Grassland WUE in China
4.4. Uncertainty Analysis
5. Conclusions
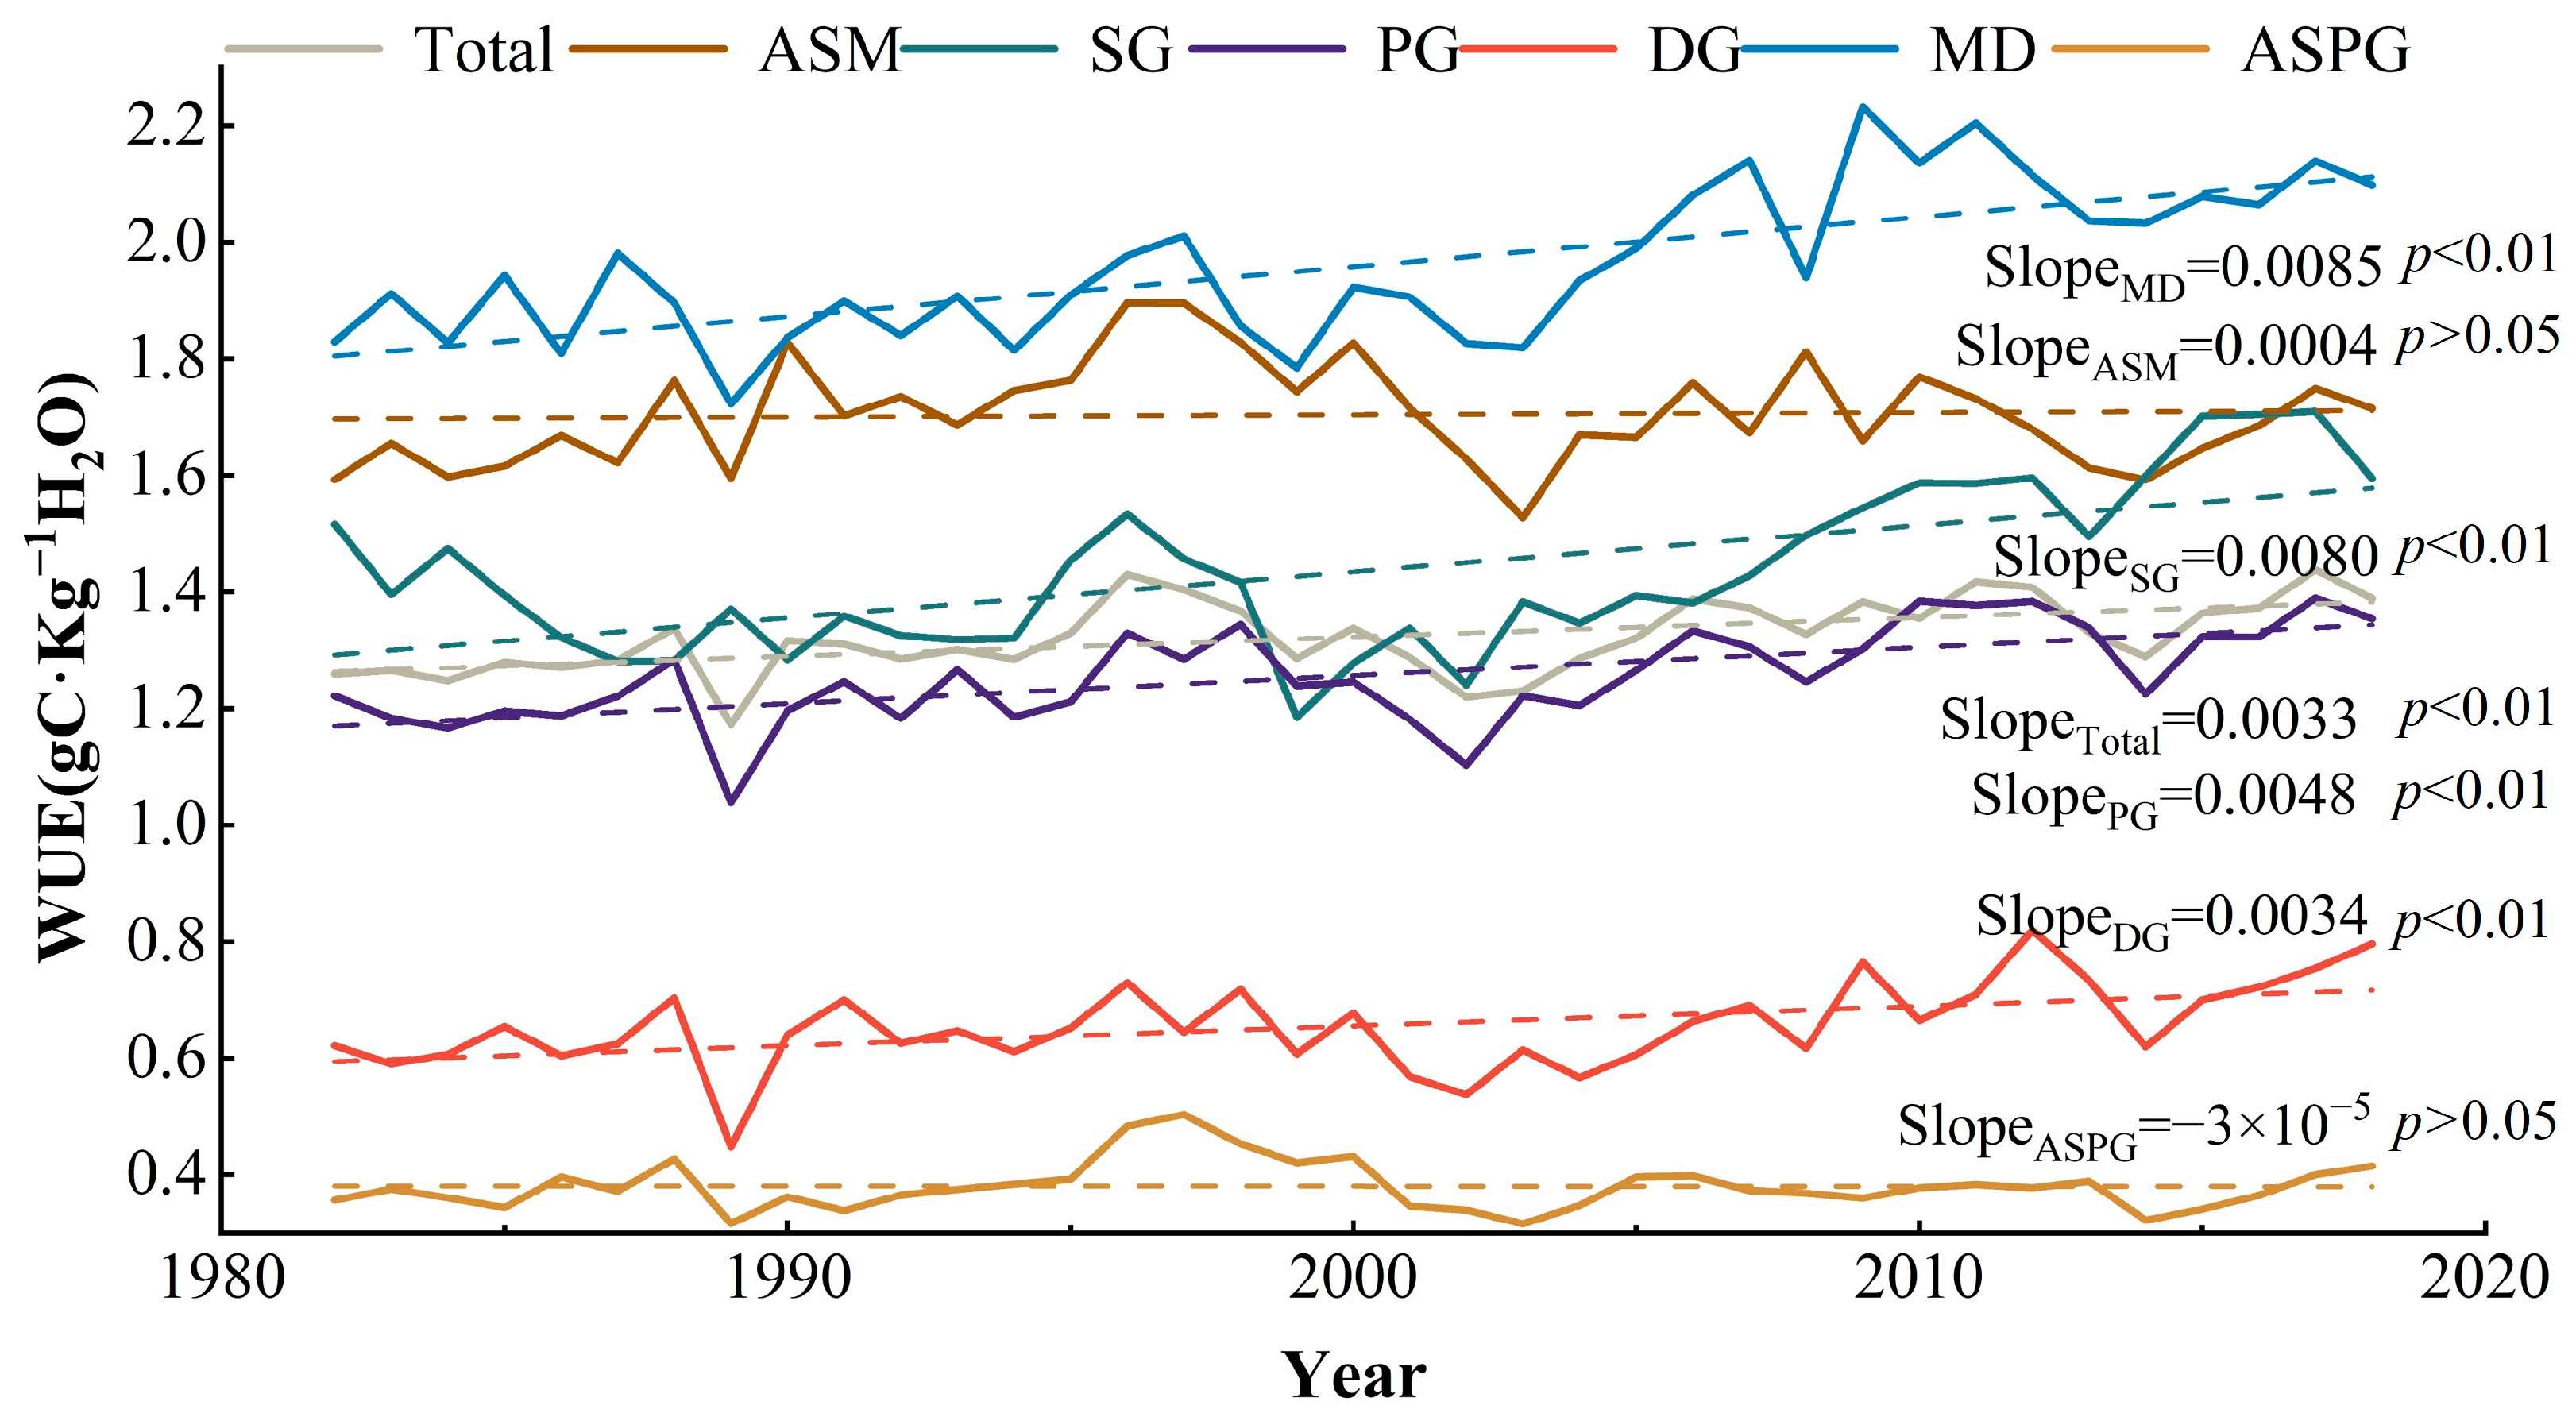
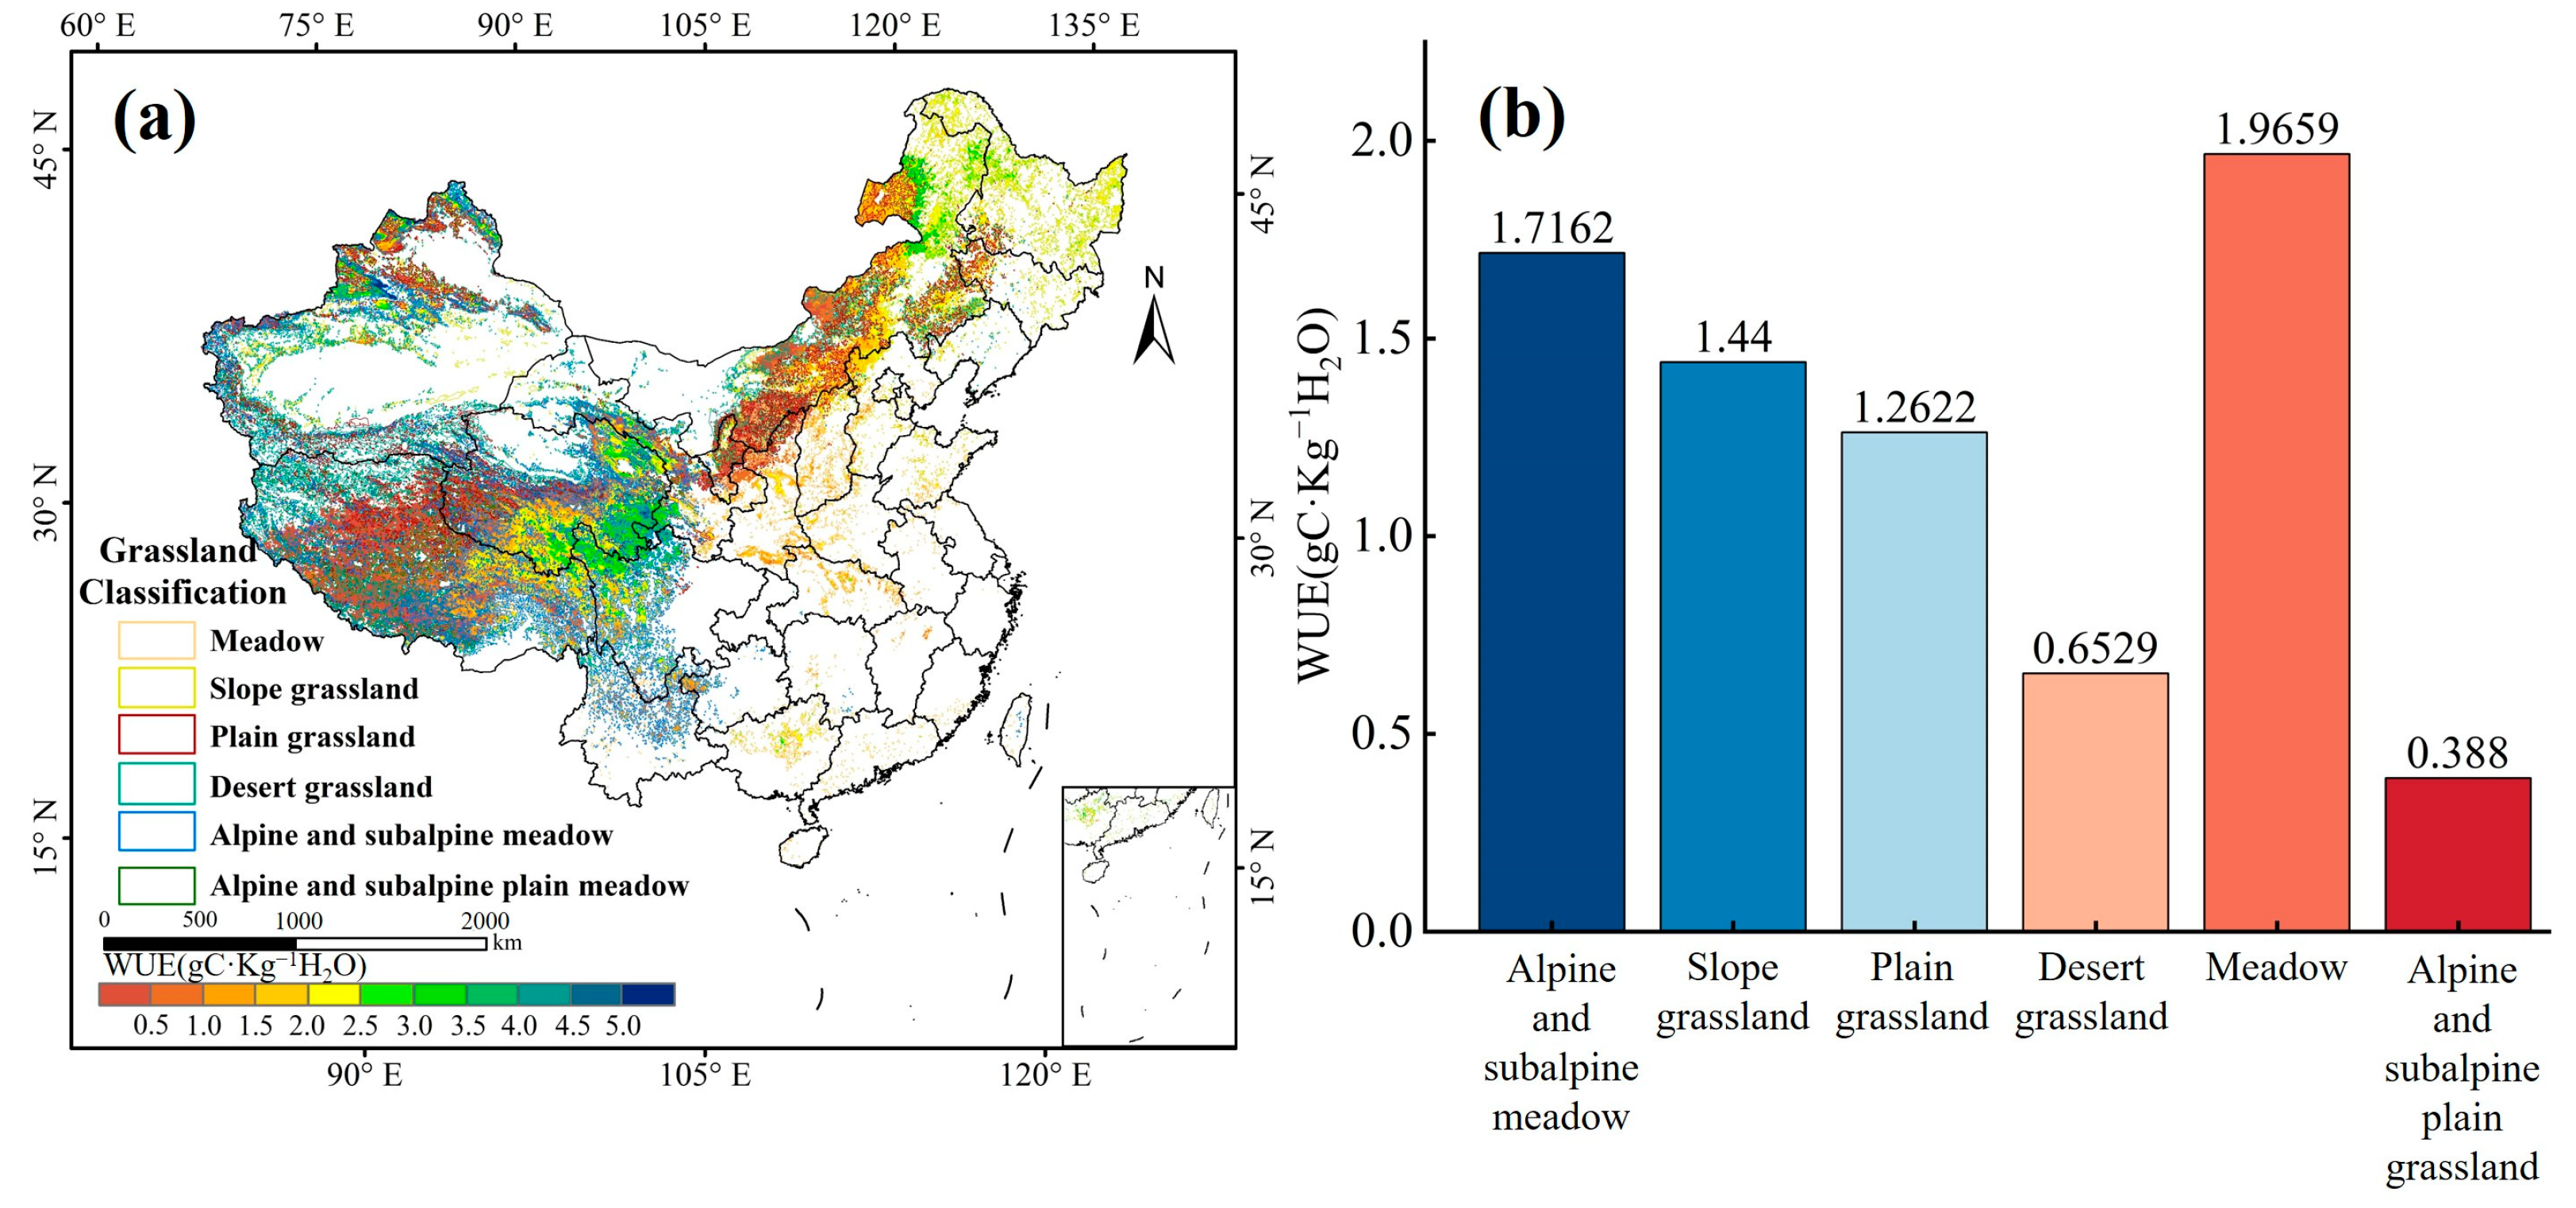
- (1)
- Temporal analysis indicated that the annual WUE of grassland showed an increasing trend (0.0033 gC·kg−1H2O·a−1), with all grassland types showing upward trends, particularly MD, which increased the fastest. Spatially, WUE values gradually increased from west to east, decreasing with altitude;
- (2)
- The average cumulative and lagged effects of drought on grassland WUE lasted 5.2 and 6.1 months, respectively. For different grassland types, cumulative effects lasted 5.6 months for ASM, SG, and DG, while ASPG had a lagged time of 9 months. Both cumulative and lagged effects’ duration increased with altitude. The cumulative and lagged effects of drought on WUE across different grassland types under different AI zones showed a similar trend to that of grasslands as a whole;
- (3)
- We found that the response of WUE to drought was dominated by lagged effects (more than 95%) in Chinese grasslands and different grassland types except for ASM.
Author Contributions
Funding
Data Availability Statement
Acknowledgments
Conflicts of Interest
References
- Song, X.; Chen, H.; Chen, T.; Huang, Q.; Deng, S.; Yang, N. Spatial and temporal variations of spring drought in Southwest China and its possible teleconnection with the global climate events. J. Hydrol. Reg. Stud. 2024, 51, 101655. [Google Scholar] [CrossRef]
- Zhang, T.; Quan, W.; Tian, J.; Li, J.; Feng, P. Spatial and temporal variations of ecosystem water use efficiency and its response to soil moisture drought in a water-limited watershed of northern China. J. Environ. Manag. 2024, 355, 120251. [Google Scholar] [CrossRef] [PubMed]
- Liu, W.; Sun, F.; Lim, W.H.; Zhang, J.; Wang, H.; Shiogama, H.; Zhang, Y. Global drought and severe drought-affected populations in 1.5 and 2 °C warmer worlds. Earth Syst. Dyn. 2018, 9, 267–283. [Google Scholar] [CrossRef]
- Naeem, S.; Zhang, Y.; Zhang, X.; Rehman, A.U.; Tang, Z.; Xu, Z.; Li, C.; Azeem, T. Recent change in ecosystem water use efficiency in China mainly dominated by vegetation greening and increased CO2. Remote Sens. Environ. 2023, 298, 113811. [Google Scholar] [CrossRef]
- Yang, S.; Zhang, J.; Han, J.; Wang, J.; Zhang, S.; Bai, Y.; Cao, D.; Xun, L.; Zheng, M.; Chen, H.; et al. Evaluating global ecosystem water use efficiency response to drought based on multi-model analysis. Sci. Total Environ. 2021, 778, 146356. [Google Scholar] [CrossRef]
- Hou, Q.; Pei, T.; Yu, X.; Chen, Y.; Ji, Z.; Xie, B. The seasonal response of vegetation water use efficiency to temperature and precipitation in the Loess Plateau, China. Glob. Ecol. Conserv. 2022, 33, e01984. [Google Scholar] [CrossRef]
- Chen, T.; Wang, Y.; Peng, L. Advanced time-lagged effects of drought on global vegetation growth and its social risk in the 21st century. J. Environ. Manag. 2023, 347, 119253. [Google Scholar] [CrossRef]
- Yao, Y.; Ren, H. Estimation of grassland aboveground biomass in northern China based on topography-climate-remote sensing data. Ecol. Indic. 2024, 165, 112230. [Google Scholar] [CrossRef]
- Zhang, W.; Luo, G.; Hamdi, R.; Ma, X.; Termonia, P.; De Maeyer, P. Drought changes the dominant water stress on the grassland and forest production in the northern hemisphere. Agric. For. Meteorol. 2024, 345, 109831. [Google Scholar] [CrossRef]
- Li, M.; Wu, P.; Ma, Z.; Liu, J. Climate change reshapes bioclimatic environments in China’s dry–wet transition zones. J. Hydrol. 2024, 634, 131122. [Google Scholar] [CrossRef]
- Huang, M.; Zhai, P.; Piao, S. Divergent responses of ecosystem water use efficiency to drought timing over Northern Eurasia. Environ. Res. Lett. 2021, 16, 045016. [Google Scholar] [CrossRef]
- Liu, L.; Zheng, J.; Guan, J.; Han, W.; Liu, Y. Grassland cover dynamics and their relationship with climatic factors in China from 1982 to 2021. Sci. Total Environ. 2023, 905, 167067. [Google Scholar] [CrossRef] [PubMed]
- Xu, S.; Wang, Y.; Liu, Y.; Li, J.; Qian, K.; Yang, X.; Ma, X. Evaluating the cumulative and time-lag effects of vegetation response to drought in Central Asia under changing environments. J. Hydrol. 2023, 627, 130455. [Google Scholar] [CrossRef]
- Wang, S.; Zhou, Q.; Wu, Y.; Wang, F.; Li, M.; Zhang, Y. Drought lag and its cumulative effects on vegetation dynamics and response to atmospheric circulation factors in Yinshanbeilu, Inner Mongolia. Glob. Ecol. Conserv. 2024, 54, e03087. [Google Scholar] [CrossRef]
- Li, P.; Wang, J.; Liu, M.; Xue, Z.; Bagherzadeh, A.; Liu, M. Spatio-temporal variation characteristics of NDVI and its response to climate on the Loess Plateau from 1985 to 2015. Catena 2021, 203, 105331. [Google Scholar] [CrossRef]
- Wei, X.; He, W.; Zhou, Y.; Ju, W.; Xiao, J.; Li, X.; Liu, Y.; Xu, S.; Bi, W.; Zhang, X.; et al. Global assessment of lagged and cumulative effects of drought on grassland gross primary production. Ecol. Indic. 2022, 136, 108646. [Google Scholar] [CrossRef]
- Zhan, C.; Liang, C.; Zhao, L.; Jiang, S.; Niu, K.; Zhang, Y. Drought-related cumulative and time-lag effects on vegetation dynamics across the Yellow River Basin, China. Ecol. Indic. 2022, 143, 109409. [Google Scholar] [CrossRef]
- Ji, Y.; Li, Y.; Yao, N.; Biswas, A.; Zou, Y.; Meng, Q.; Liu, F. The lagged effect and impact of soil moisture drought on terrestrial ecosystem water use efficiency. Ecol. Indic. 2021, 133, 108349. [Google Scholar] [CrossRef]
- Su, J.; Fan, L.; Yuan, Z.; Wang, Z.; Wang, Z. Quantifying the drought sensitivity of grassland under different climate zones in Northwest China. Sci. Total Environ. 2024, 910, 168688. [Google Scholar] [CrossRef]
- Zhao, Y.; Xiong, L.; Yin, J.; Zha, X.; Li, W.; Han, Y. Understanding the effects of flash drought on vegetation photosynthesis and potential drivers over China. Sci. Total Environ. 2024, 931, 172926. [Google Scholar] [CrossRef]
- Huang, F.; Liu, L.; Gao, J.; Yin, Z.; Zhang, Y.; Jiang, Y.; Zuo, L.; Fang, W. Effects of extreme drought events on vegetation activity from the perspectives of meteorological and soil droughts in southwestern China. Sci. Total Environ. 2023, 903, 166562. [Google Scholar] [CrossRef] [PubMed]
- Kwon, H.; Law, B.E.; Thomas, C.K.; Johnson, B.G. The influence of hydrological variability on inherent water use efficiency in forests of contrasting composition, age, and precipitation regimes in the Pacific Northwest. Agric. For. Meteorol. 2018, 249, 488–500. [Google Scholar] [CrossRef]
- Hoover, D.L.; Pfennigwerth, A.A.; Duniway, M.C. Drought resistance and resilience: The role of soil moisture–plant interactions and legacies in a dryland ecosystem. J. Ecol. 2021, 109, 3280–3294. [Google Scholar] [CrossRef]
- Liu, L.; Guan, J.; Zheng, J.; Wang, Y.; Han, W.; Liu, Y. Cumulative effects of drought have an impact on net primary productivity stability in Central Asian grasslands. J. Environ. Manag. 2023, 344, 118734. [Google Scholar] [CrossRef]
- Wang, Z.; Cao, S.; Cao, G. The Effect of Vegetative Coverage and Altitude on the Vegetation Water Consumption in the Alpine Inland River Basin of the Northeastern Qinghai–Tibet Plateau. Water 2022, 14, 1113. [Google Scholar] [CrossRef]
- Wang, S.; Zhang, Q.; Yue, P.; Wang, J. Effects of evapotranspiration and precipitation on dryness/wetness changes in China. Theor. Appl. Climatol. 2020, 142, 1027–1038. [Google Scholar] [CrossRef]
- Bartholomé, E.; Belward, A.S. GLC2000: A new approach to global land cover mapping from Earth observation data. Int. J. Remote Sens. 2005, 26, 1959–1977. [Google Scholar] [CrossRef]
- Wang, M.; Ding, Z.; Wu, C.; Song, L.; Ma, M.; Yu, P.; Lu, B.; Tang, X. Divergent responses of ecosystem water-use efficiency to extreme seasonal droughts in Southwest China. Sci. Total Environ. 2021, 760, 143427. [Google Scholar] [CrossRef]
- Fu, J.; Wang, W.; Shao, Q.; Xing, W.; Cao, M.; Wei, J.; Chen, Z.; Nie, W. Improved global evapotranspiration estimates using proportionality hyp othesis-based water balance constraints. Remote Sens. Environ. 2022, 279, 113140. [Google Scholar] [CrossRef]
- Vicente-Serrano, S.M.; Beguería, S.; López-Moreno, J.I. A Multiscalar Drought Index Sensitive to Global Warming: The Standardized Precipitation Evapotranspiration Index. J. Clim. 2010, 23, 1696–1718. [Google Scholar] [CrossRef]
- Beguería, S.; Serrano, S.M.V.; Reig-Gracia, F.; Garcés, B.L. SPEIbase, v.2.8 [Dataset]. 2023. Available online: http://hdl.handle.net/10261/288226 (accessed on 20 June 2024).
- Kimura, R.; Moriyama, M. Recent Trends of Annual Aridity Indices and Classification of Arid Regions with Satellite-Based Aridity Indices. Remote Sens. Earth Syst. Sci. 2019, 2, 88–95. [Google Scholar] [CrossRef]
- Peng, S. 1 km Annual Arid Index Dataset in China (1901–2022). 2023. Available online: https://data.tpdc.ac.cn/en/data/b7a5c363-3f63-4921-b657-8a4229476ec1 (accessed on 14 March 2024).
- Xue, Y.; Bai, X.; Zhao, C.; Tan, Q.; Li, Y.; Luo, G.; Wu, L.; Chen, F.; Li, C.; Ran, C.; et al. Spring photosynthetic phenology of Chinese vegetation in response to climate change and its impact on net primary productivity. Agric. For. Meteorol. 2023, 342, 109734. [Google Scholar] [CrossRef]
- Zarei, A.; Chemura, A.; Gleixner, S.; Hoff, H. Evaluating the grassland NPP dynamics in response to climate change in Tanzania. Ecol. Indic. 2021, 125, 107600. [Google Scholar] [CrossRef]
- Zheng, H.; Yu, G.R.; Zhu, X.J.; Wang, X.F.; Zhang, L.M.; Chen, Z.; Sun, X.M.; He, H.L.; Su, W.; Wang, Y.F.; et al. Datasets on actual evapotranspiration and water use efficiency of typical terrestrial ecosystems in China, 2000–2010. Chin. Sci. Data 2019, 4, 55–68. [Google Scholar] [CrossRef]
- Liu, Y.; Xiao, J.; Ju, W.; Zhou, Y.; Wang, S.; Wu, X. Water use efficiency of China’s terrestrial ecosystems and responses to drought. Sci. Rep. 2015, 5, 13799. [Google Scholar] [CrossRef] [PubMed]
- Guo, X.; Arshad, M.U.; Zhao, Y.; Gong, Y.; Li, H. Effects of climate change and grazing intensity on grassland productivity-A case study of Inner Mongolia, China. Heliyon 2023, 9, e17814. [Google Scholar] [CrossRef]
- Sen, P.K. Estimates of the Regression Coefficient Based on Kendall’s Tau. J. Am. Stat. Assoc. 1968, 63, 1379–1389. [Google Scholar] [CrossRef]
- Wang, M.; Zhao, J.; Zhang, H.; Zhang, Z.; Guo, X.; Zhang, T.; Wu, R. Detecting the response characteristics and thresholds of grassland spring phenology to climatic factors in the Mongolian Plateau. Ecol. Indic. 2023, 153, 110440. [Google Scholar] [CrossRef]
- Kendall, M.G. Rank Correlation Methods; APA: Washington, DA, USA, 1949. [Google Scholar]
- Mann, H.B. Nonparametric Tests Against Trend. Econom. J. Econom. Soc. 1945, 13, 245–259. [Google Scholar] [CrossRef]
- Gao, X.; Sun, S.; Meng, P.; Cai, J.; Pei, S.; Huang, H.; Zhang, J. Carbon fluxes and water-use efficiency in a Pinus tabuliformis plantation in Northeast China and their relationship to drought. Sci. Total Environ. 2024, 946, 174258. [Google Scholar] [CrossRef]
- Strmberg, C.; Staver, A.J.S. The history and challenge of grassy biomes. Science 2022, 377, 592–593. [Google Scholar] [CrossRef] [PubMed]
- Zhang, Z.; Zhang, F.; Wang, L.; Lin, A.; Zhao, L. Biophysical climate impact of forests with different age classes in mid- and high-latitude North America. For. Ecol. Manag. 2021, 494, 119327. [Google Scholar] [CrossRef]
- Harrington, J.A., Jr.; Harman, J.R. Climate and Vegetation in Central North America: Natural Patterns and Human Alterations. Great Plains Q. 1991, 11, 103–112. [Google Scholar]
- Ippolito, J.A.; Blecker, S.W.; Freeman, C.L.; McCulley, R.L.; Blair, J.M.; Kelly, E.F. Phosphorus biogeochemistry across a precipitation gradient in grasslands of central North America. J. Arid Environ. 2010, 74, 954–961. [Google Scholar] [CrossRef]
- Lin, S.; Wang, G.; Hu, Z.; Sun, X.; Song, C.; Huang, K.; Sun, J.; Yang, Y. Contrasting response of growing season water use efficiency to precipitation changes between alpine meadows and alpine steppes over the Tibetan Plateau. Agric. Water Manag. 2023, 289, 108571. [Google Scholar] [CrossRef]
- Wu, W.; Sun, R.; Liu, X.; Li, L.; Qi, M.; Zhang, F.; Zhou, G.; Zhu, J.; Xu, Z. Driving mechanisms of community biomass allocation along environmental gradients in different grasslands in China. Ecol. Indic. 2024, 160, 111886. [Google Scholar] [CrossRef]
- Liu, Y.; Ding, Z.; Chen, Y.; Yan, F.; Yu, P.; Man, W.; Liu, M.; Li, H.; Tang, X. Restored vegetation is more resistant to extreme drought events than natural vegetation in Southwest China. Sci. Total Environ. 2023, 866, 161250. [Google Scholar] [CrossRef]
- Du, Q.; Guan, Q.; Sun, Y.; Wang, Q.; Zhang, J.; Xiao, X.; Liu, H.; Yang, X.; Zhang, E. Legacy effects of extreme drought and wetness events on mountain grassland ecosystems and their elevation dependence. J. Hydrol. 2024, 630, 130757. [Google Scholar] [CrossRef]
- Zhang, Z.; Ju, W.; Zhou, Y.; Li, X. Revisiting the cumulative effects of drought on global gross primary productivity based on new long-term series data (1982–2018). Glob. Change Biol. 2022, 28, 3620–3635. [Google Scholar] [CrossRef]
- Barnes, M.L.; Moran, M.S.; Scott, R.L.; Kolb, T.E.; Ponce-Campos, G.E.; Moore, D.J.P.; Ross, M.A.; Mitra, B.; Dore, S. Vegetation productivity responds to sub-annual climate conditions across semiarid biomes. Ecosphere 2016, 7, e01339. [Google Scholar] [CrossRef]
- Tang, J.; Niu, B.; Hu, Z.; Zhang, X. Increasing susceptibility and shortening response time of vegetation productivity to drought from 2001 to 2021. Agric. For. Meteorol. 2024, 352, 110025. [Google Scholar] [CrossRef]
- Bai, Y.; Li, S. Growth peak of vegetation and its response to drought on the Mongolian Plateau. Ecol. Indic. 2022, 141, 109150. [Google Scholar] [CrossRef]
- Xu, H.-J.; Wang, X.-P.; Zhao, C.-Y. Drought sensitivity of vegetation photosynthesis along the aridity gradient in northern China. Int. J. Appl. Earth Obs. Geoinf. 2021, 102, 102418. [Google Scholar] [CrossRef]
- Tang, X.; Li, H.; Desai, A.R.; Nagy, Z.; Luo, J.; Kolb, T.E.; Olioso, A.; Xu, X.; Yao, L.; Kutsch, W.; et al. How is water-use efficiency of terrestrial ecosystems distributed and changing on Earth? Sci. Rep. 2014, 4, 7483. [Google Scholar] [CrossRef] [PubMed]
- Li, Q.; Gao, X.; Li, J.; Yan, A.; Chang, S.; Song, X.; Lo, K. Nonlinear time effects of vegetation response to climate change: Evidence from Qilian Mountain National Park in China. Sci. Total Environ. 2024, 933, 173149. [Google Scholar] [CrossRef] [PubMed]
- Li, W.; Shen, Y.; Wang, G.; Ma, H.; Yang, Y.; Li, G.; Huo, X.; Liu, Z. Plant species diversity and functional diversity relations in the degradation process of desert steppe in an arid area of northwest China. J. Environ. Manag. 2024, 365, 121534. [Google Scholar] [CrossRef] [PubMed]
- Zhang, Q.; Wang, Z.; Xia, S.; Zhang, G.; Li, S.; Yu, D.; Yu, X. Hydrologic-induced concentrated soil nutrients and improved plant growth increased carbon storage in a floodplain wetland over wet-dry alternating zones. Sci. Total Environ. 2022, 822, 153512. [Google Scholar] [CrossRef]
- Alsafadi, K.; Bashir, B.; Mohammed, S.; Abdo, H.G.; Mokhtar, A.; Alsalman, A.; Cao, W. Response of Ecosystem Carbon–Water Fluxes to Extreme Drought in West Asia. Remote Sens. 2024, 16, 1179. [Google Scholar] [CrossRef]
- Zhang, J.; Fang, S.; Liu, H. Estimation of alpine grassland above-ground biomass and its response to climate on the Qinghai-Tibet Plateau during 2001 to 2019. Glob. Ecol. Conserv. 2022, 35, e02065. [Google Scholar] [CrossRef]
- Liu, L.; Gudmundsson, L.; Hauser, M.; Qin, D.; Li, S.; Seneviratne, S.I. Soil moisture dominates dryness stress on ecosystem production globally. Nat. Commun. 2020, 11, 4892. [Google Scholar] [CrossRef]
- Zhao, J.; Feng, H.; Xu, T.; Xiao, J.; Guerrieri, R.; Liu, S.; Wu, X.; He, X.; He, X. Physiological and environmental control on ecosystem water use efficiency in response to drought across the northern hemisphere. Sci. Total Environ. 2021, 758, 143599. [Google Scholar] [CrossRef]
- Domec, J.C.; King, J.S.; Noormets, A.; Treasure, E.; Gavazzi, M.J.; Sun, G.; McNulty, S.G. Hydraulic redistribution of soil water by roots affects whole-stand evapotranspiration and net ecosystem carbon exchange. New Phytol. 2010, 187, 171–183. [Google Scholar] [CrossRef]
- Szejgis, J.; Nielsen, U.N.; Dijkstra, F.A.; Carrillo, Y. Prolonged drought moderates flood effects on soil nutrient pools across a rainfall gradient. Soil Biol. Biochem. 2024, 193, 109404. [Google Scholar] [CrossRef]


| Data Type | Name | Time Scale | Spatial-Temporal Resolution | Data Website |
|---|---|---|---|---|
| NIRv-GPP dataset | Gross Primary Production (GPP) | 19822018 | 0.05° × 0.05°, Monthly | https://doi.org/10.6084/m9.figshare.12981977.v2 (accessed on 15 July 2024) |
| PEW-ET dataset | Evapotranspiration (ET) | 19822018 | 0.1° × 0.1°, Monthly | https://doi.org/10.11888/Terre.tpdc.272874 (accessed on 13 July 2024) |
| Drought dataset | Standardized Precipitation Evapotranspiration Index (SPEI) | 19812018 | 0.5° × 0.5°, Monthly | http://hdl.handle.net/10261/288226 (accessed on 20 June 2024) |
| Wet and dry dataset | Aridity index (AI) | 19822018 | 0.00833° × 0.00833°, Yearly | https://doi.org/10.11888/Atmos.tpdc.300560 (accessed on 14 March 2024) |
| Grassland dataset | Global Land Cover 2000 | 2000 | 1 km × 1 km, Yearly | https://forobs.jrc.ec.europa.eu (accessed on 3 January 2024) |
| Elevation dataset | ASTER GDEM V3 | 30 m × 30 m | https://www.gscloud.cn/sources/accessdata/310?pid=302 (accessed on 13 July 2024) | |
| China grassland carbon fluxes dataset | Observed ET and GPP | 2000–2010 | Yearly | https://www.nesdc.org.cn/sdo/detail?id=5fa53684042ebb70d0c833ff&subjectCode=5fa53cea042ebb70d0c8340f (accessed on 13 July 2024) |
Disclaimer/Publisher’s Note: The statements, opinions and data contained in all publications are solely those of the individual author(s) and contributor(s) and not of MDPI and/or the editor(s). MDPI and/or the editor(s) disclaim responsibility for any injury to people or property resulting from any ideas, methods, instructions or products referred to in the content. |
© 2025 by the authors. Licensee MDPI, Basel, Switzerland. This article is an open access article distributed under the terms and conditions of the Creative Commons Attribution (CC BY) license (https://creativecommons.org/licenses/by/4.0/).
Share and Cite
Xing, M.; Liu, L.; Zheng, J.; Wang, X.; Li, W. Spatio-Temporal Variation Characteristics of Grassland Water Use Efficiency and Its Response to Drought in China. Water 2025, 17, 1134. https://doi.org/10.3390/w17081134
Xing M, Liu L, Zheng J, Wang X, Li W. Spatio-Temporal Variation Characteristics of Grassland Water Use Efficiency and Its Response to Drought in China. Water. 2025; 17(8):1134. https://doi.org/10.3390/w17081134
Chicago/Turabian StyleXing, Mengxiang, Liang Liu, Jianghua Zheng, Xinwei Wang, and Wei Li. 2025. "Spatio-Temporal Variation Characteristics of Grassland Water Use Efficiency and Its Response to Drought in China" Water 17, no. 8: 1134. https://doi.org/10.3390/w17081134
APA StyleXing, M., Liu, L., Zheng, J., Wang, X., & Li, W. (2025). Spatio-Temporal Variation Characteristics of Grassland Water Use Efficiency and Its Response to Drought in China. Water, 17(8), 1134. https://doi.org/10.3390/w17081134