Abstract
Water and energy use, along with wastewater reuse, are critical for sustainable industrial production. This study develops a decision support framework (DSF) to assess wastewater treatment and reuse, incorporating Water and Carbon Footprint indicators. The framework is applied to a Greek brewery producing 1.4 × 10⁶ hL of beer annually, with a total water consumption of 5.6 hL per hL of beer and an in-house wastewater treatment plant (WWTP). The WWTP consumes over 40% more energy than expected, indicating a need for efficiency improvements. An advanced wastewater treatment method is proposed, capable of treating 43% of the total wastewater volume, with 3% covering the brewery’s utility water demand and the rest allocated to restricted irrigation. This reduces the operational Water Footprint by 12% and the supply chain Water Footprint by 1%, while increasing energy use by 3%. The optimal scenario, integrating water reuse and energy efficiency improvements, results in a 35% reduction in the Carbon Footprint, a 10% decrease in the operational Water Footprint, and a 1% reduction in the supply chain Water Footprint. The DSF provides a structured approach for industries to optimize sustainability by balancing water reuse with energy efficiency.
1. Introduction
Water availability and sustainable management were included in the 2030 Agenda for Sustainable Development [1] under Sustainable Development Goal no. 6 (SDG6), with relevant actions programmed all over the world in a global partnership. All economic sectors were asked to increase their water use efficiency (WUE), and results on the data available since 2015 should provide an overall picture of the change in WUE globally [2].
Recent reports show increases in all economic sectors, however with marked regional differences. Global water use data from 2015 to 2021 indicate a marginal decrease, while industrial water use has declined by 6.5 percent, attributed to technology adaptations and heightened environmental regulation and awareness [3]. Within industry, the manufacturing sector accounts for approximately 40% of total water extractions in Europe [4] and represents over 70% of total industrial water use in many European countries [5]. This demand adds to the depletion of underground water resources, reducing the flow of rivers and lakes, escalating water pollution, and endangering the sustainability of aquatic ecosystems.
WUE within a production unit can be evaluated using the Water Footprint (WF), a multidimensional indicator of volumetric water use and pollution [6]. The WF of an industry is defined as the total volume of fresh water used, directly and indirectly, to produce its products and services. It consists of the operational WF, focusing on industrial processes, i.e., manufacturing and packaging, and the supply chain WF, focusing on the raw materials used in the production line [7]. Both direct and indirect water use are included in the indicator, representing water consumption and pollution throughout the full production cycle from the supply chain to the end-user. Finally, based on the water source, the total WF is the sum of blue (freshwater use), green (rainwater use), and grey (wastewater disposal) WFs [6].
While industry accounts for 20% of global blue water withdrawals, its blue WF accounts for only 4% of the global total, while its grey WF is responsible for probably more than 26% of the gross total grey WF, since its withdrawn water is often largely returned, often insufficiently or not treated. On the other hand, in many cases, its indirect WF is much larger than its direct WF, especially in the presence of an agricultural supply chain, i.e., the food and beverage industries [8].
Water efficiency in an industrial unit can be reached through the use of alternative water sources (i.e., rainwater, storm water, or reclaimed water from wastewater), using alternative materials/technologies, optimizing production processes, implementing leak detection and repair programs, and implementing efficient management systems [9,10,11,12,13]. Among all these methods, wastewater reuse provides dual benefits: besides lowering freshwater use, due to reclaimed water use, and reducing reliance on external freshwater supplies, it also lowers wastewater disposal, reducing the environmental impact of industrial wastewater discharges and promoting sustainable practices. Thus, it mitigates both blue and grey footprints.
In order for industries to comply with wastewater discharge regulations either within industrial zones or directly to a water recipient, they often have on-site wastewater treatment plants (WWTPs) within the respective industrial production unit. While WWTPs help to improve the quality of treated wastewater, enabling regulatory compliance for reuse, they require large amounts of energy to operate. Energy consumption can be interpreted in terms of an impact assessment indicator, i.e., the Carbon Footprint (CF). The CF represents the total greenhouse gas (GHG) emissions, expressed in CO2-equivalents, associated with the energy consumed throughout the wastewater treatment and reuse process. For the estimation of the CF, both direct GHG emissions (generated by the biological processes of the WWTP) and indirect GHG emissions (generated by the production of the electricity consumed by the WWTP) are required [14,15]. Since energy production often relies on fossil fuels, higher energy consumption directly translates to an increased CF due to emissions from electricity generation and fuel combustion. Conversely, optimizing energy efficiency in wastewater treatment can significantly reduce the CF, making it a crucial parameter in sustainability assessments.
In WWTPs, the quality of wastewater is improved, sometimes reaching the legal limits for water reuse, thus reducing the use of fresh water in production but significantly increasing energy consumption [16]. Even if they are designed to comply with specific effluent requirements, their operation is often not energy-efficient [17]. WWTPs are often ranked as the top single-energy consumers, and it is reported that approximately 25–40% of the operating costs of a conventional WWTP are used to cover energy needs [18]. In developed countries, wastewater treatment accounts for approximately 3% of the total electricity consumption [19].
Typical energy use in WWTPs treating either municipal or food and beverage wastewater (classifiable as municipal due to its composition and BOD/COD ratio) ranges between 0.128 and 1.65 KWh/m3 [17,20,21,22,23,24,25] and is dependent on the plant’s capacity, expressed as either m3 of treated wastewater or the population equivalent (p.e.), as well as on the wastewater treatment method and level and, eventually, energy recovery within the plant. Aeration is unanimously recognized as the major energy-consuming step.
Energy consumption in WWTPs can be largely mitigated through the use of renewable energy sources for electricity, applying energy recovery from biogas, operational modifications, advanced treatment technologies, and product valorization [22,23,26,27,28,29]. The assessments are conducted using WF and/or CF for the evaluation of different scenarios. Furthermore, an eco-environmental impact evaluation is reported, adding toxicity and economic assessments [30]. Finally, WWTPs as well as urban water systems are assessed in terms of the water–energy nexus, emphasizing sustainable energy consumption within the water cycle [31,32]. The assessment of the energy consumption of a WWTP and the selection of water reuse applications should be considered comprehensively as they are influenced by various factors (e.g., WWTP capacity, type of industry, national legislation, and available land) [33] and there is no single, holistic, available solution. Decision support systems (DSSs) for WWTPs are a valuable tool for selecting the most appropriate solutions (e.g., installation configuration, operating conditions, etc.) for a given situation or scenario under study. In DSSs, there are many critical steps for the selection and environmental assessment of reuse methods, from the selection of appropriate applications/technologies to the design of the system and the assessment of potential environmental benefits or impacts from reuse [34].
Water-saving practices should then be evaluated using appropriate assessment methods, taking energy consumption at sustainable levels into consideration. The impact of water reuse within a production unit could be evaluated using both water- and energy-relevant indexes, namely WF and CF.
The aim of this paper is to propose a decision support framework (DSF) for the mitigation of the WF of an industrial unit through the reuse of treated wastewater, taking into account the resulting CF due to additional energy requirements. Τhe framework proposed is a step-by-step approach incorporating both the physical structure of the system and the rules governing its operation. Many DSSs have been proposed in the international literature for selecting wastewater treatment processes [16,35,36,37,38,39,40,41,42,43]. However, a comprehensive framework that holistically addresses industrial wastewater treatment and reuse while also evaluating the environmental impacts of such reuse applications has yet to be developed. The DSF developed in this study addresses this gap, helping manufacturing industries to select reuse applications for their treated wastewater and environmentally assess a new system (either a new-built or an extension of an existing WWTP), emphasizing the water–energy nexus, and using indicators such as the WF and Carbon Footprint (CF). The developed DSF is implemented in a large brewery plant with an in-house WWTP. Breweries are water-intensive manufacturing industries, as water is not only incorporated into the final product but also extensively used throughout production and cleaning processes. Water reuse within the beverage industry is gaining importance: Beverage Industry Environmental Roundtable (BIER), formed in 2006 [44], produces annual reports on water accounting and recounts success stories of closed-circuit technologies, recycled water use for cleaning, wastewater on-site reuse, excess reclaimed water discharge to local surface waters, and even advanced treatment of reclaimed wastewater to achieve drinking water quality standards [45,46]. Furthermore, as a standard for corporate best practices for the beverage industries, sustainable water practices are proposed [47,48].
2. Materials and Methods
2.1. Decision Support Systems for Wastewater Treament Technologies
Several DSSs for WWTPs have been published in the international literature, supporting the following fields: the design of a WWTP [15,35,36]; energy consumption [37]; operational optimization [38,39]; improving the quality of the treated wastewater effluents [40,41]; and environmental impact assessments [42,43].
Four main types of DSS exist in the literature based on i. life cycle assessments (LCAs); ii. mathematical models (MMs); iii. multi-criteria decision-making (MCDM); and iv. intelligent decision support systems (IDSSs) [34]. In decision-making systems for the selection of treatment technologies in WFDs and reuse applications, the multi-criteria method is mainly used [49].
Multi-criteria decision-making (MCDM) tools for selecting the optimal technology for a given scenario have been well developed in the literature [50,51,52]. Depending on the application, the objectives of the assessment influence the indicators and criteria used to constrain the decision-making process and the final outcome. The criteria for selecting treatment processes or trains usually fall into four main categories: (1) technical, (2) economic, (3) environmental, and (4) social. Researchers very often select criteria belonging to these categories; however, a significant gap remains in terms of aligning these indicators with central sustainability goals such as energy neutrality and a holistic assessment of water reuse applications [49].
The selection of indicators under the aforementioned criteria for DSSs in wastewater treatment technology selection is subjective, as it depends on the specific objectives of the study, local conditions, and stakeholder priorities. Various frameworks and methodologies have been proposed to structure this selection process, including MCDM approaches such as the analytical hierarchy process (AHP) and the Technique for Order Preference by Similarity to Ideal Solution (TOPSIS) [53]. However, given the complexity of wastewater treatment systems, hybrid methodologies that combine qualitative and quantitative assessment tools, such as the Entropy Weight Method (EWM) and Self-Organizing Maps (SOM), have been increasingly employed to enhance decision-making robustness [54]. The integration of objective weighting methods, such as EWM, can reduce the subjectivity associated with expert-based weighting, thereby improving the reliability of indicator selection. The chosen indicators typically reflect economic, technical, environmental, and social aspects, but their relative importance varies across studies depending on regional policies, available resources, and technological advancements [55,56].
Despite efforts to standardize DSS frameworks, the weighting and prioritization of indicators remain highly context-dependent. For example, while energy efficiency and greenhouse gas (GHG) emissions may be critical in regions with stringent climate policies, cost-effectiveness and ease of implementation may take precedence in developing countries with limited financial resources [57]. Furthermore, stakeholder engagement plays a crucial role in defining indicator relevance, as perspectives from policymakers, industry experts, and local communities shape decision-making priorities [38]. Given this subjectivity, DSS methodologies must be flexible enough to accommodate diverse evaluation criteria while maintaining scientific transparency in their application.
2.2. The Decision Support Framework Developed for Industrial Wastewater Treatment and Reuse
The DSF developed follows a holistic approach, trying to cover, to a greater or lesser extent, all fields (design, energy consumption, operational optimization, improvement of the quality of the treated waste effluent, and environmental assessment) [15,35,36,37,38,39,40,41,42,43] that have been examined in individual DSSs in the international literature, aiming for environmentally sustainable, in terms of water and energy, water reuse in industry.
Furthermore, it is based on multi-criteria decision-making tools with the selection of specific criteria at each step. The developed framework also tries to fill the existing gaps in multi-criteria decision-making systems through the selection of appropriate indicators that are consistent with the sustainability goals of the industry (e.g., energy savings) and a holistic environmental assessment of the possible solutions/technologies that are selected.
The DSF follows a step-wise approach and comprises five steps. Each step consists of individual decision trees with the following goals:
- Step 1 (if applicable): Evaluation of existing energy consumption, in case the industrial unit has an in-house WWTP;
- Step 2: Selection of the appropriate reuse application;
- Step 3: Selection of the treatment method/process or processes;
- Step 4: Design of the additional process for plants with an existing WWTP or the entire treatment train for industrial plants without a WWTP;
- Step 5: Environmental impact assessment and evaluation of the overall water recovery system.
2.3. Analysis of the DSF Steps’ Decision Trees
In the steps below and at each stage of each decision tree, there is a color differentiation: light blue boxes represent the necessary stages of each tree, yellow boxes represent criteria to be considered, and green boxes mark the final stage/output of each step.
- Step 1 (if applicable): Evaluation of existing energy consumption, in case the industrial unit has an in-house WWTP
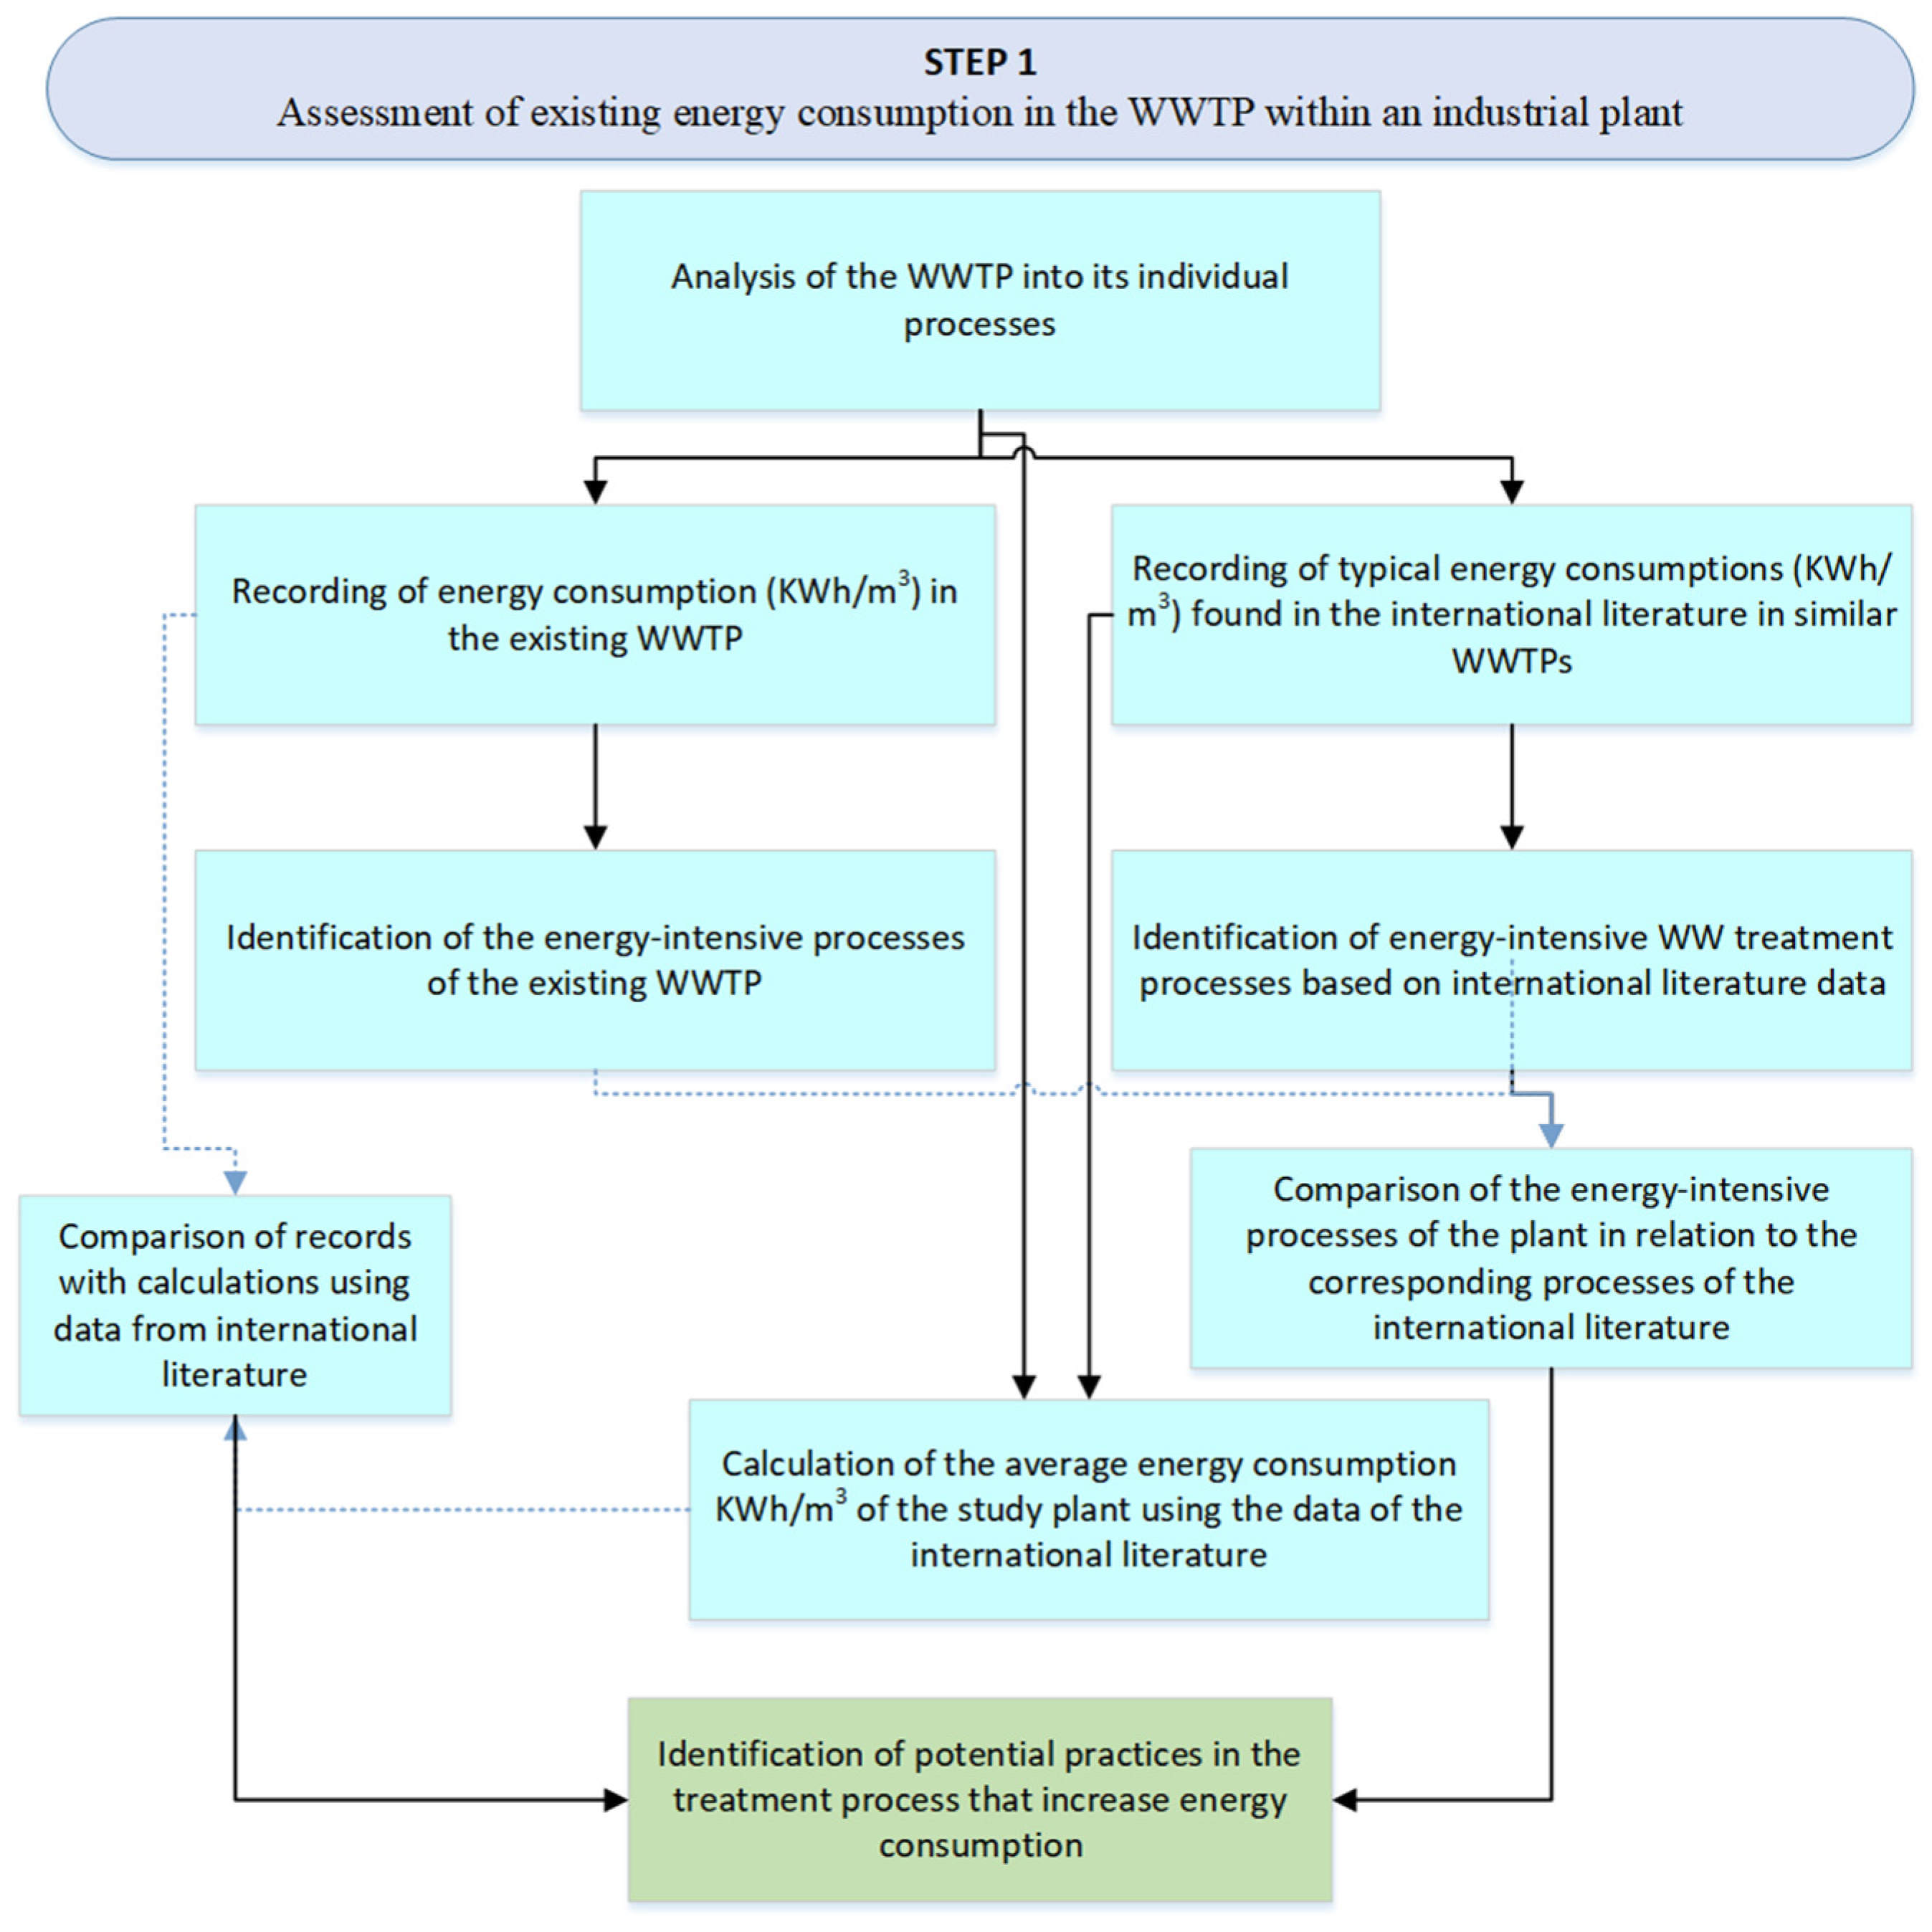
The first step of the DSF is only applicable if the industry has an existing in-house WWTP. It consists of two decision trees, leading to the calculation of the industrial WWTP average energy consumption in kWh/m3 using in-house measurements and data from the international literature, and the identification of potential practices in wastewater treatment that increase energy consumption (Figure 1).
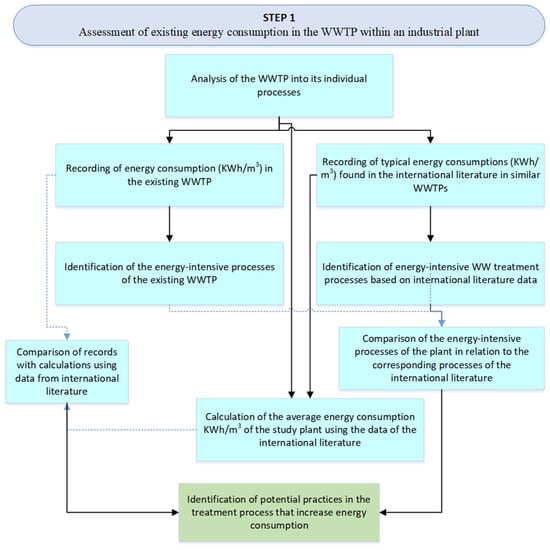
Figure 1.
Decision tree of Step 1 of the DSF.
The WWTP’s treatment processes are first screened to identify those requiring energy, and energy consumption is recorded in kWh/m3. Average energy consumption data from similar plants in the international literature are compared to the WWTP’s actual usage. Any discrepancies help detect operational practices that may be increasing energy consumption. The WWTP’s average energy use is then calculated using literature values and processed volume, allowing for further comparison to identify potential areas for improvement.
- Step 2: Selection of the appropriate reuse application
The second step of the DSF focuses on the selection of a reuse application for the treated industrial wastewater, and it is based on two main criteria: the type of industry and the regulatory framework. This step consists of two main decision trees, as shown in Figure 2. The type of industry is crucial for selecting a water reuse application. Non-food industries can reuse water within the plant or outside (e.g., irrigation and groundwater recharge). Food industries can only reuse treated wastewater outside production processes (e.g., cleaning and fire protection) or outside the plant. Regulatory limits proposed by National legislation also impact the choice of reuse applications. National legislation dictates these limits, affecting both internal and external water reuse. Stricter limits necessitate more advanced treatment.
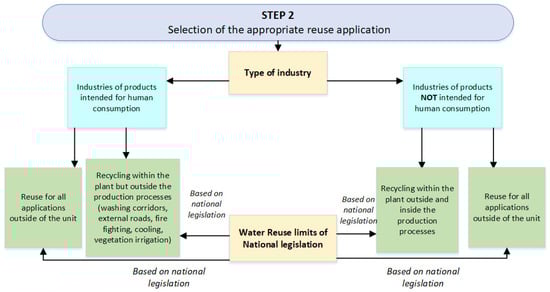
Figure 2.
Decision tree of Step 2 of the DSF.
- Step 3: Selection of the treatment method/process or processes
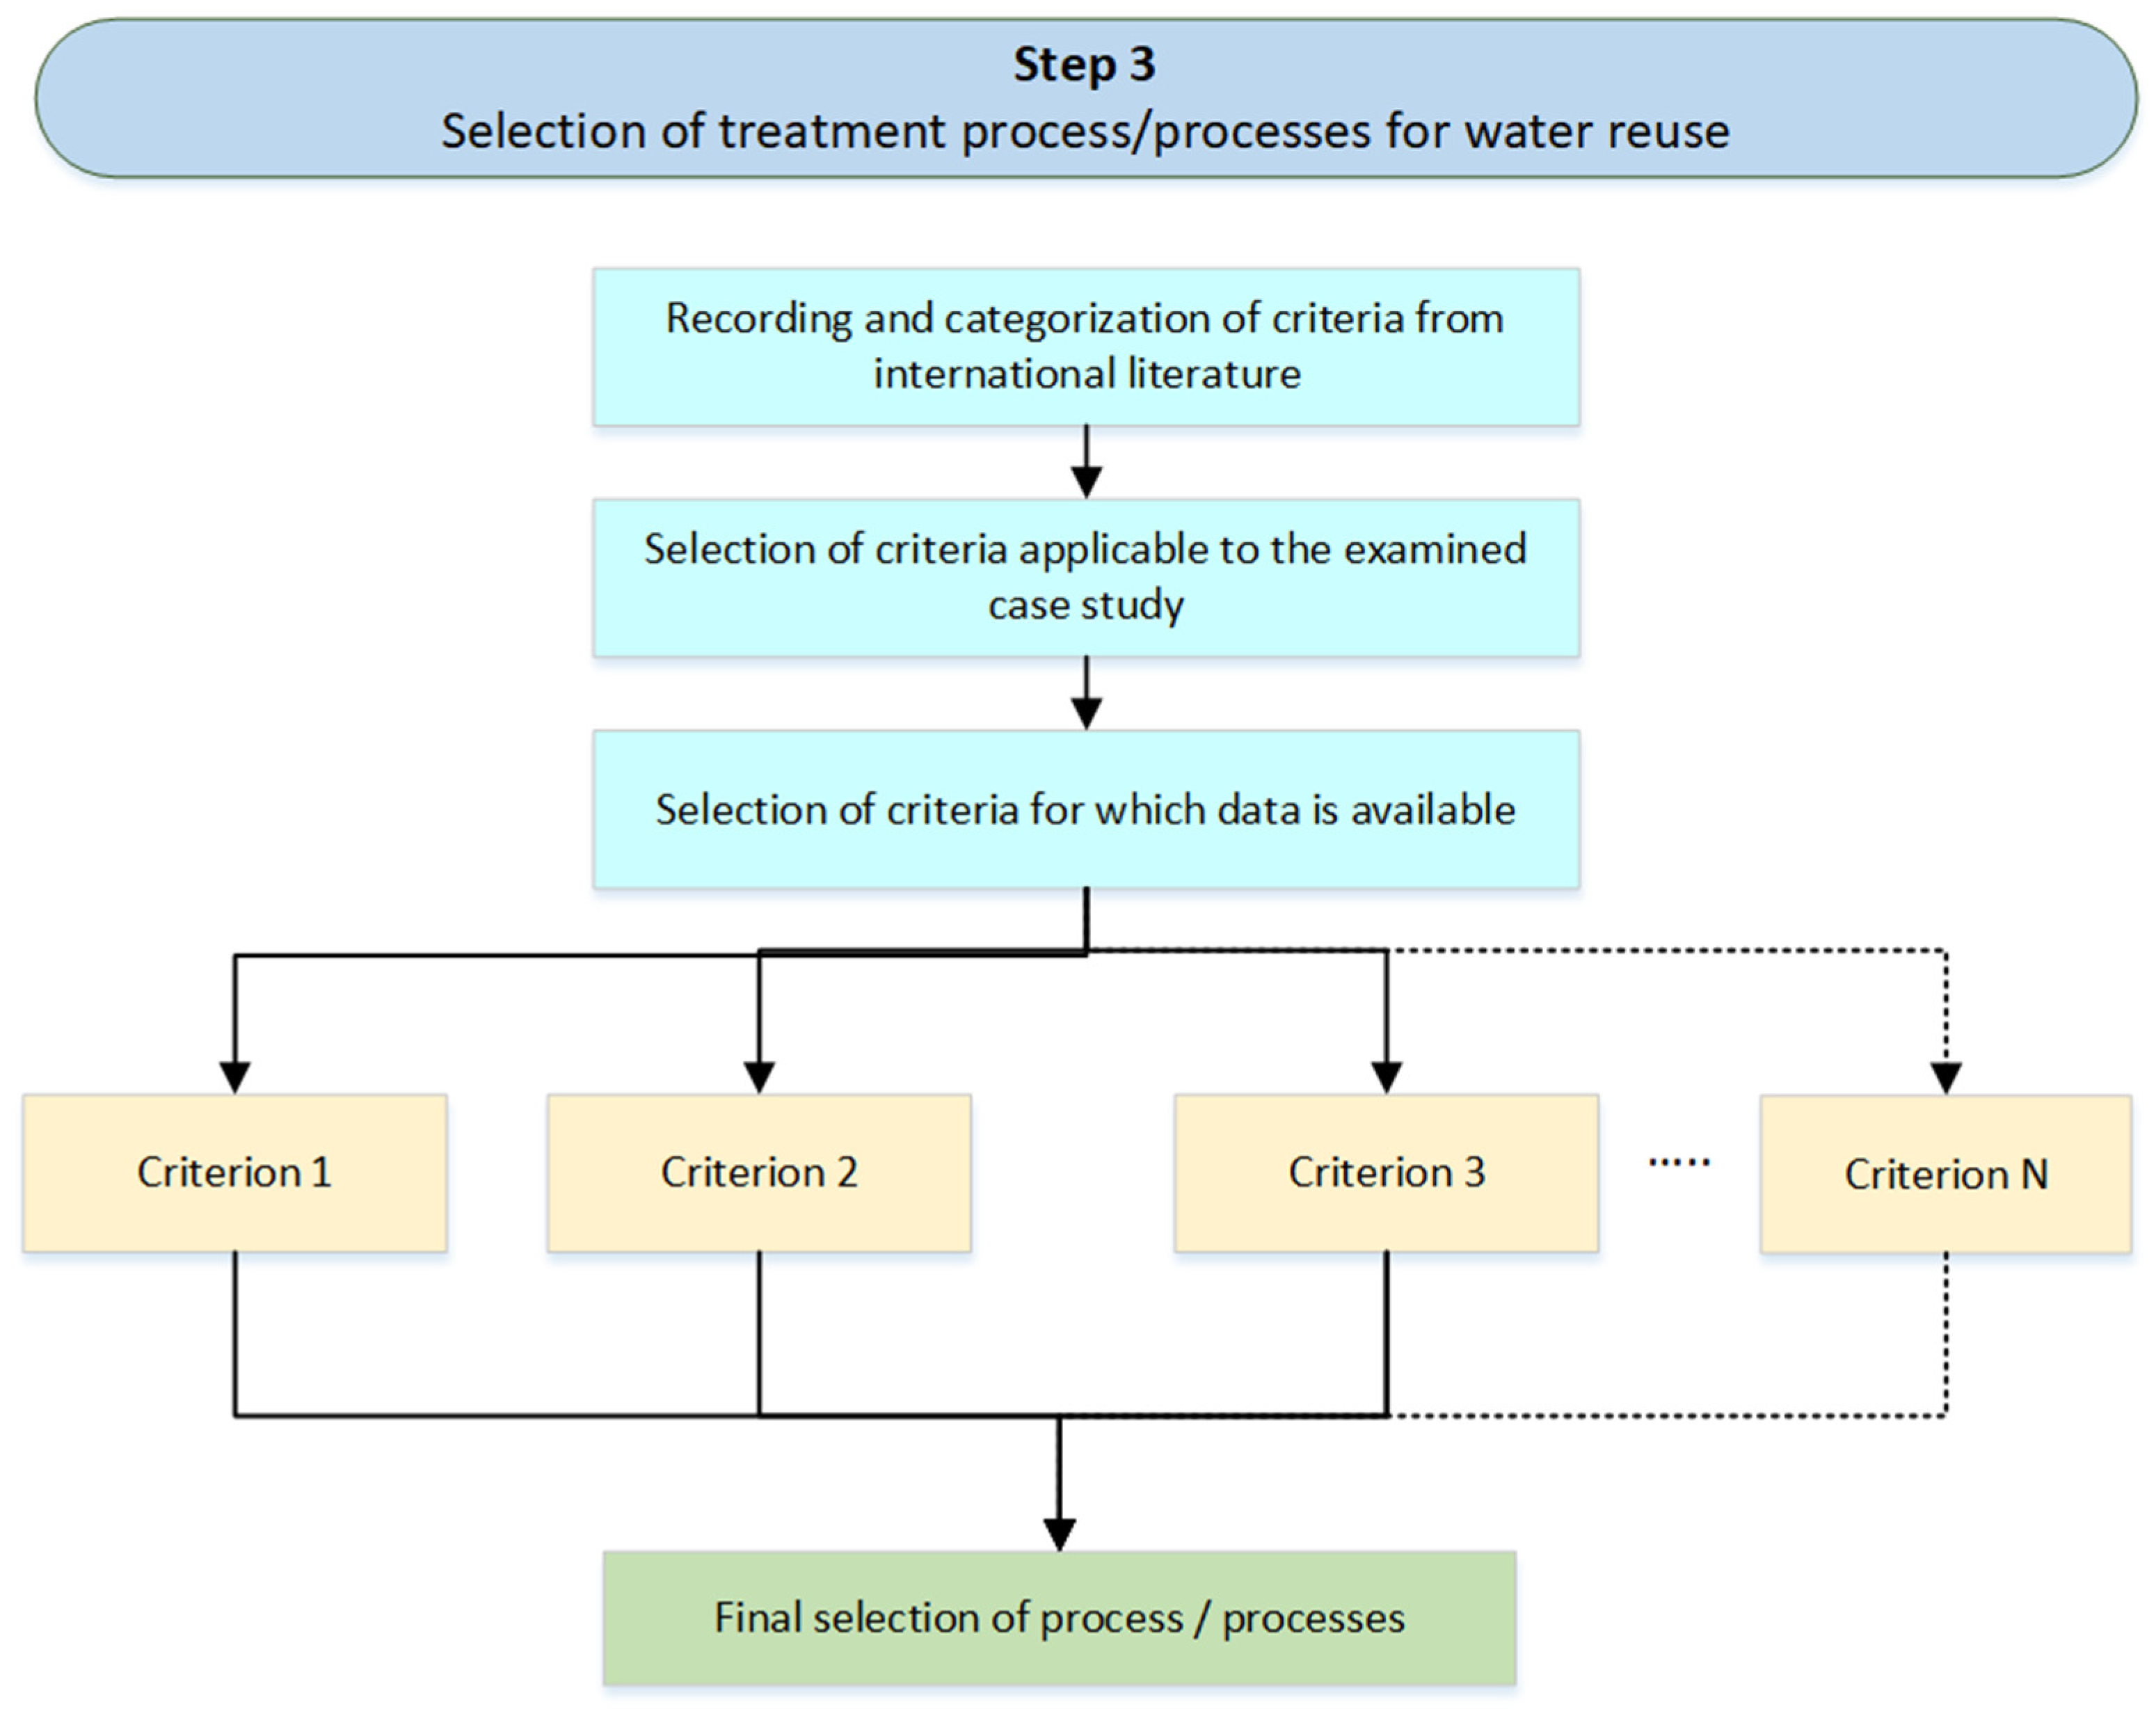
The third step of the DSF (Figure 3) focuses on selecting the most suitable water reuse process for the reuse application selected in Step 2, by identifying and applying relevant criteria to each case study. The criteria for selecting a treatment process are widely used in the international literature [50,58,59,60]. For the specific WWTP and industry, applicable criteria are first identified, and among them, only those with available data are considered. This ensures that the selected treatment process aligns with the case study’s unique characteristics and operational needs.
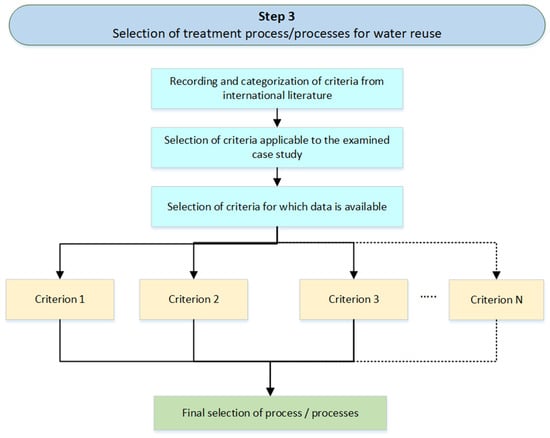
Figure 3.
Decision tree of Step 3 of the DSF.
- Step 4: Design of an additional process for plants with an existing WWTP or the entire treatment train for industrial plants without a WWTP
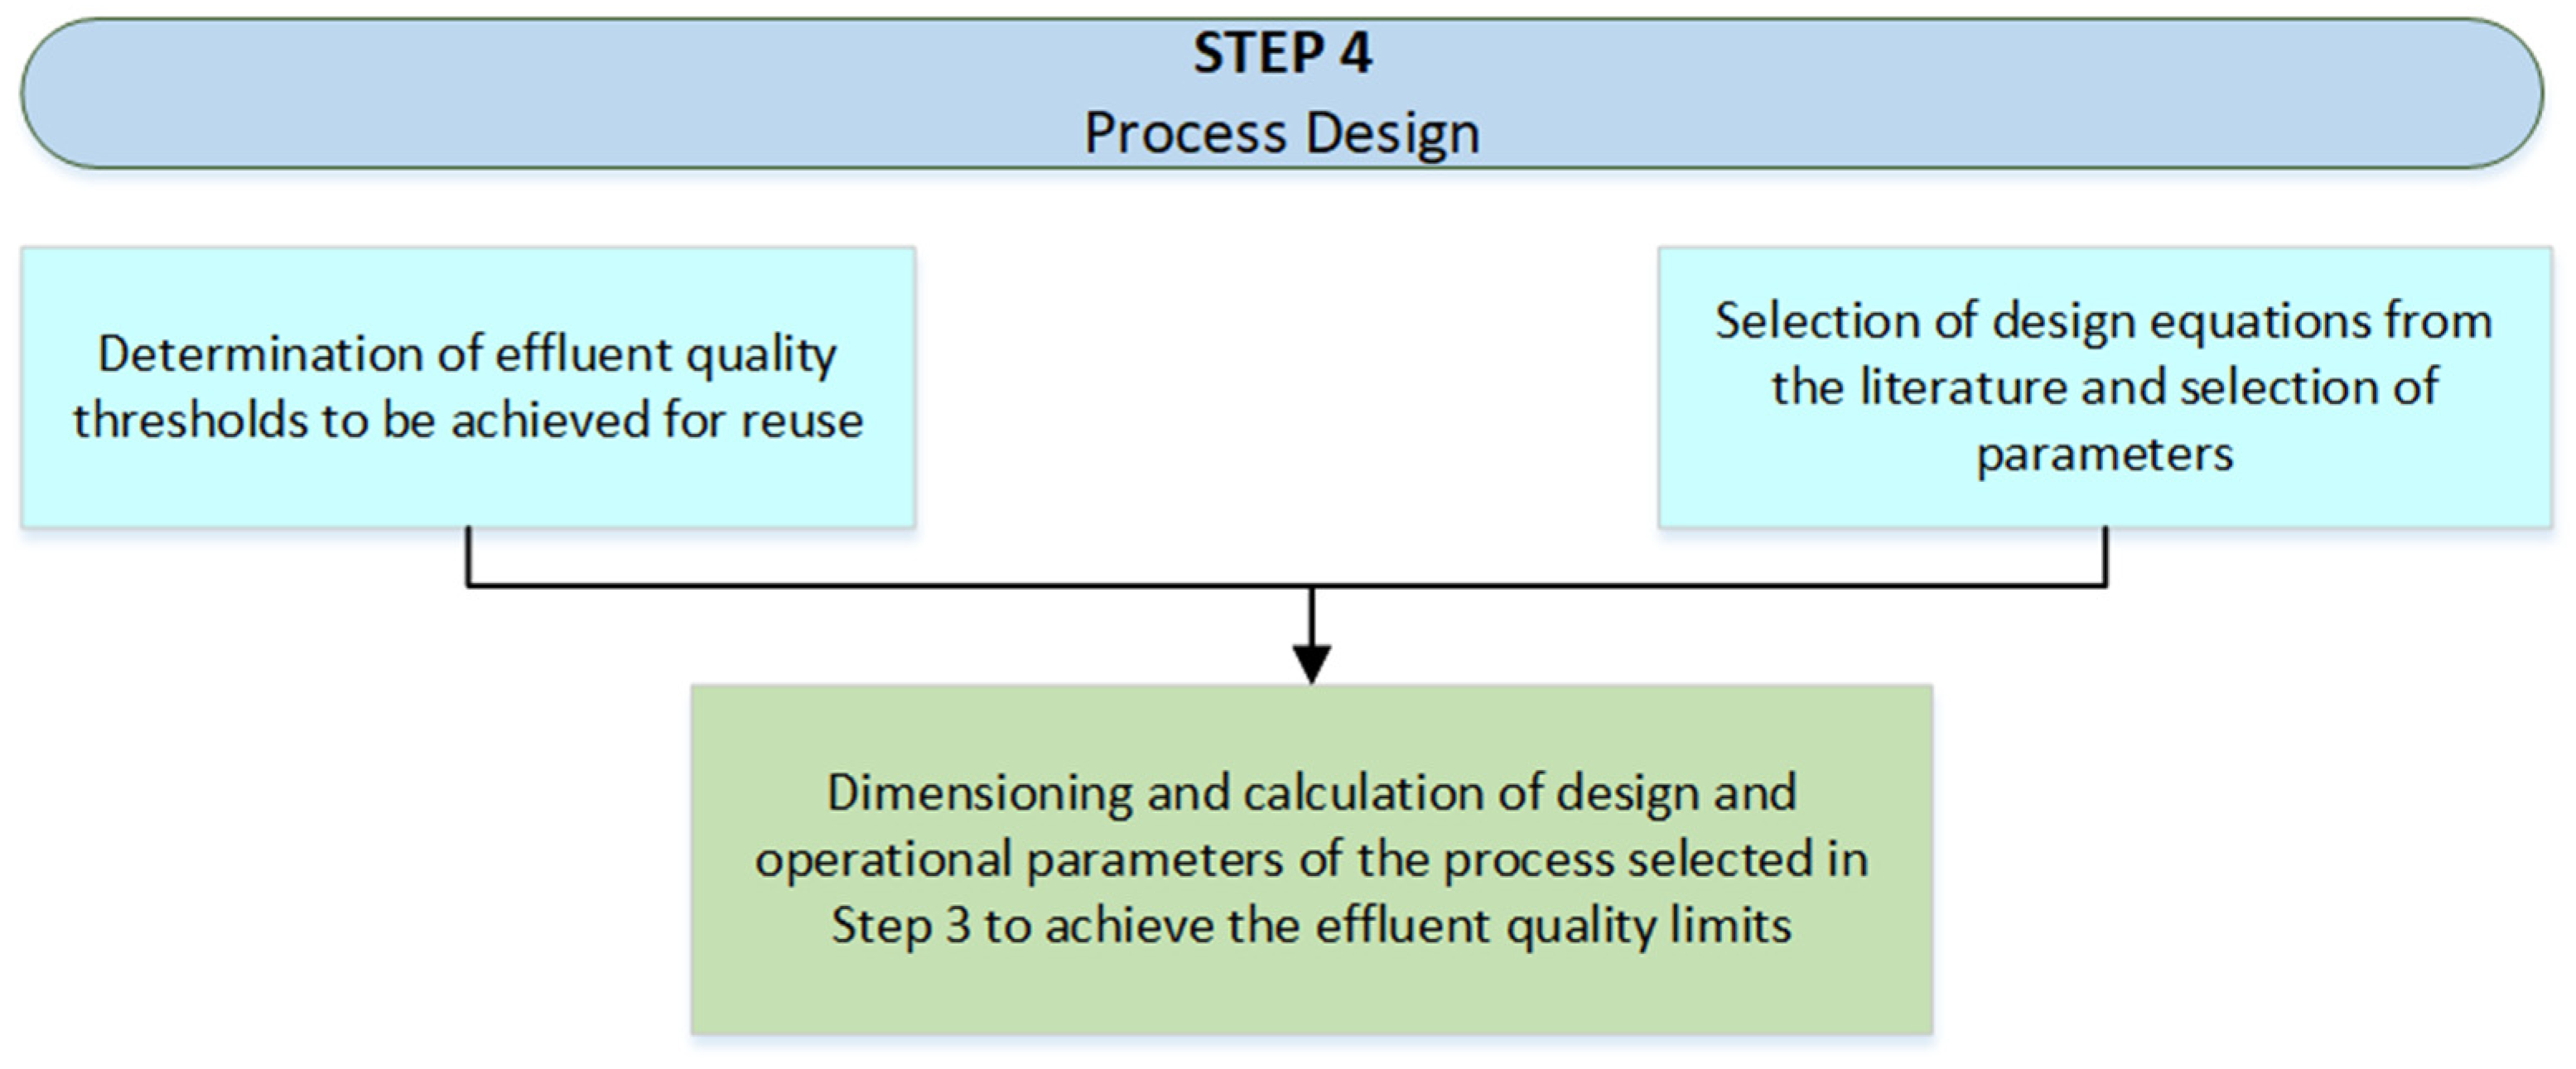
In the fourth step of the DSF, the design of the process or processes selected in Step 3 is carried out, taking into account the reuse application chosen in Step 2, with the goal of water reuse. Two key actions are required to complete Step 4, as shown in Figure 4. First, it is necessary to define the effluent quality limits of the designed process to ensure compliance with reuse standards. Based on the reuse application selected in Step 2, the required quality parameters are determined according to the reuse application, wastewater characteristics, and current regulations. Simultaneously, for the process selected in Step 3, the appropriate design equations and necessary design parameters are chosen from the literature. Finally, the process is sized, and the design and operational parameters are established to meet the effluent quality limits.
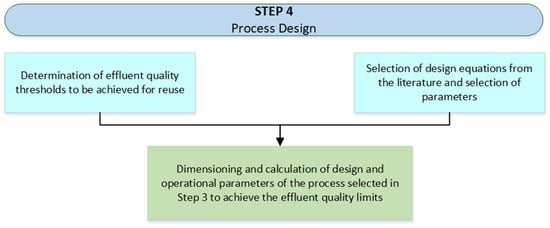
Figure 4.
Decision tree of Step 4 of the DSF.
- Step 5: Environmental impact assessment and evaluation of the overall water recovery system
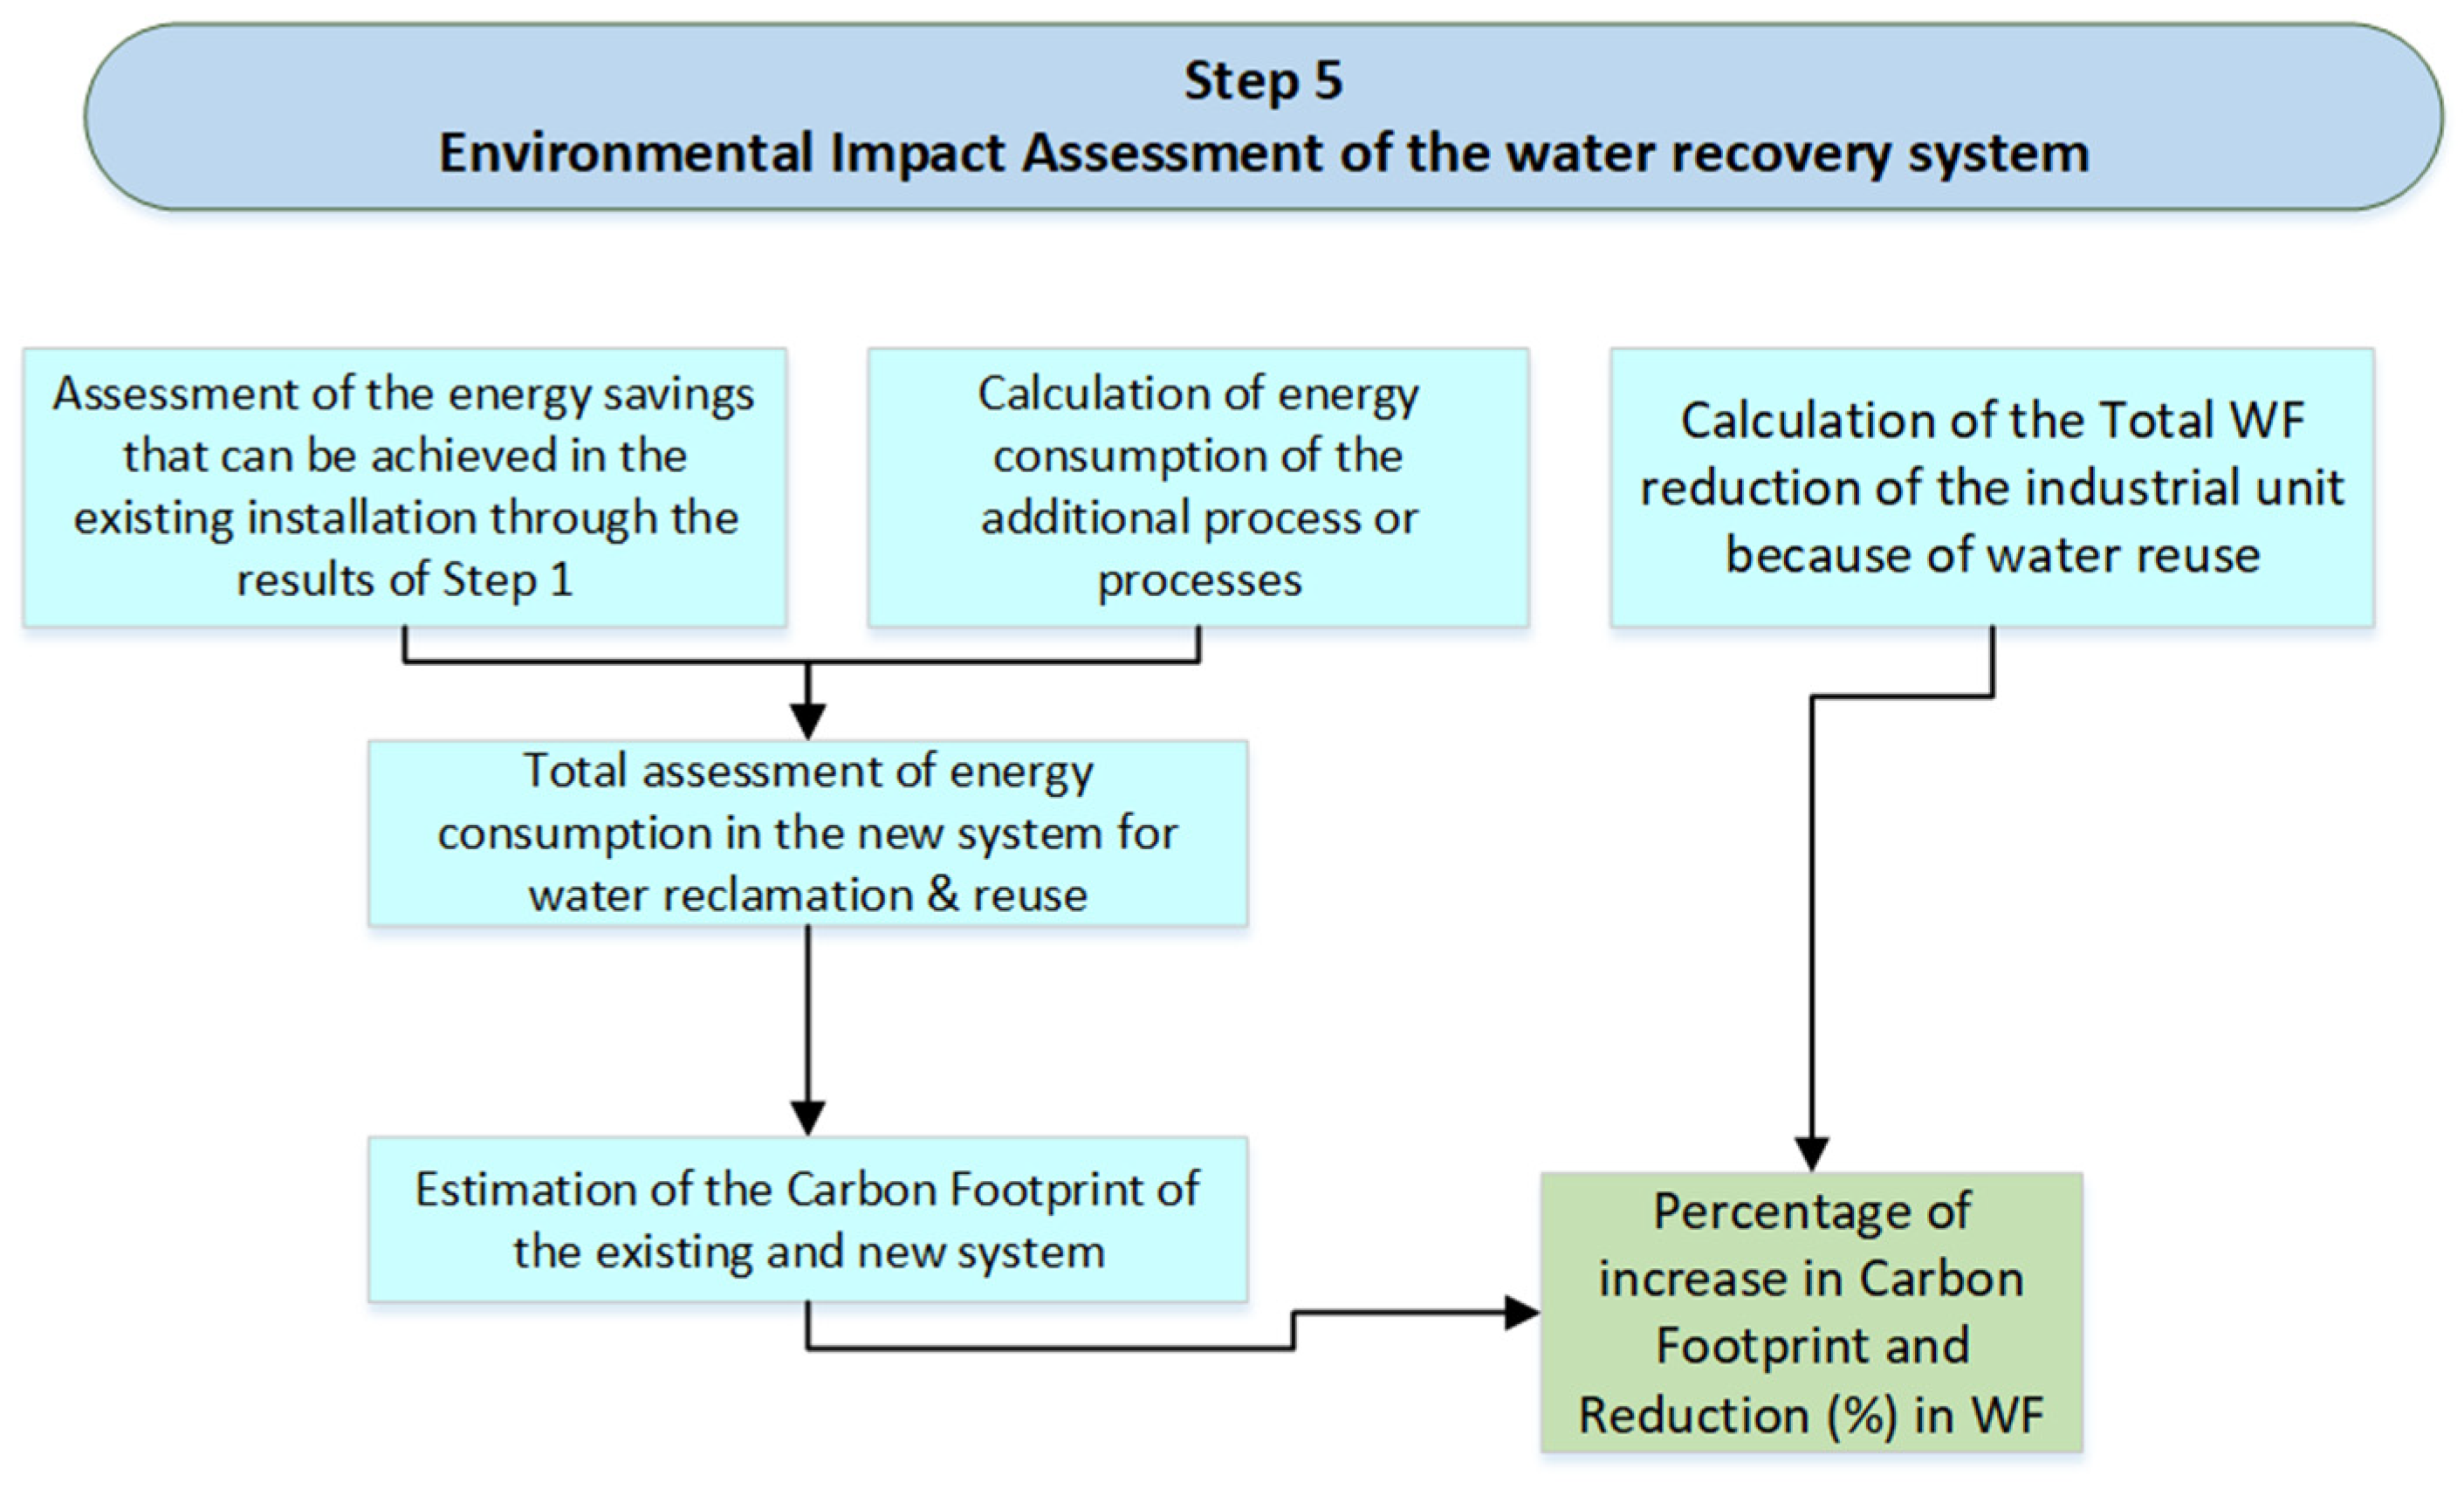
The fifth and final step of the DSF focuses on the environmental impact assessment and evaluation of the overall water recovery. This involves assessing the overall energy consumption of the new system selected in Step 4 and the reduction in WF due to reuse, and comparing the increase in energy consumption and CF with the simultaneous reduction in WF. This step consists of two parallel decision trees: one focusing on energy consumption and the other on water savings and reduction in WF, as shown in Figure 5. If the industry does not employ an in-house WWTP, the first step of the first decision tree (assessment of energy savings that can be achieved in the existing installation) is not applicable.
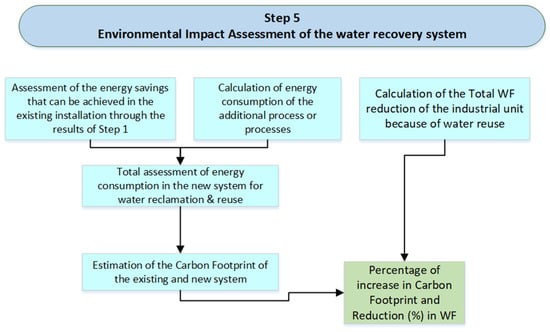
Figure 5.
Decision tree of Step 5 of the DSF.
The energy consumption assessment tree consists of three main stages. The first stage concerns the assessment of the energy savings that can be achieved through modifications to the existing WWTP, where applicable, based on the results of Step 1. The second stage concerns the calculation of the energy consumption of the process that have been added (based on Step 4). Τhe amounts of energy that can be saved in the existing WWTP and the additional energy required to operate the advanced process or the new treatment system lead to the overall energy assessment of the new wastewater treatment system, aiming for water recovery and reuse. The third step concerns the interpretation of energy consumption in terms of impact assessment indicators on energy consumption, i.e., the Carbon Footprint (CF). The CF represents the total greenhouse gas (GHG) emissions, expressed in CO2-equivalents, associated with the energy consumed throughout the wastewater treatment and reuse process. Since energy production often relies on fossil fuels, higher energy consumption directly translates to increased CF due to emissions from electricity generation and fuel combustion. Conversely, optimizing energy efficiency in wastewater treatment can significantly reduce CF, making it a crucial parameter in sustainability assessments. Among the available methods and tools for CF assessments, the UNFCCC GHG Emissions Calculator for indirect emissions [15] and IPCC [41] for direct emissions are used in this study.
The second decision tree concerns the assessment of water savings and the calculation of WF reduction due to wastewater treatment and reuse in the industrial unit. In the second and third steps of the tree, the increases (%) in energy consumption and CF due to the addition of the process and the parallel reduction (%) in WF due to reuse are compared, aiming for a holistic environmental assessment of the water recovery system. Among the available methods for WF assessments, the one proposed by Gerbens-Leenes and Hoekstra [7] is followed for this study as it was adapted and customized for the brewery case study examined [61].
2.4. Brewery Case Study
The proposed DSF is applied to the in-house WWTP of an industrial brewery plant located in an industrial park in Greece [61]. Additionally, as part of the food and beverage sector, breweries require significant water resources for the cultivation of raw materials, particularly barley, which is a key ingredient in beer production [62].
The brewery primarily uses water from the public supply and supplements it with groundwater when necessary. Due to the high-quality standards required, extensive treatment processes are implemented before the water enters production, across different stages, including malting, mashing, lautering, beer filtration, and packaging. The plant has already implemented a water-saving measure by recycling water from wort cooling to heated water tanks, achieving savings of up to 28%. A previous study [61] has detailed the plant’s production processes and estimated both its blue water footprint (freshwater consumption) at 4.41 hL water/hL beer for 2019 and grey water footprint (wastewater treatment and discharge) at 18.8 hL water/hL beer for COD as the main pollutant.
The brewery has an average annual production capacity of 1,374,440 hL of beer, with a total water consumption of 5.59 hL per hL of beer produced. This includes water used in production processes and equipment cleaning. Wastewater generated from industrial activities undergoes multi-stage treatment in the in-house WWTP to reduce pollutant loads before discharge. Since the brewery’s wastewater originates solely from production processes, municipal wastewater from office facilities is excluded from the DSF application.
3. Results
3.1. Implementation of the DSF—Step 1
Analysis of the WWTP’s individual processes
The in-house WWTP includes the primary, secondary, and tertiary treatment of wastewater, as well as sludge treatment processes. The relevant flow diagram is presented in Figure 6. The red asterisk (*) indicates processes that are known to consume energy. The main energy-consuming processes are screening, activated sludge tanks, and sludge thickening, with aeration being a critical energy-consuming process, accounting for up to 60% of the total energy consumption [63].
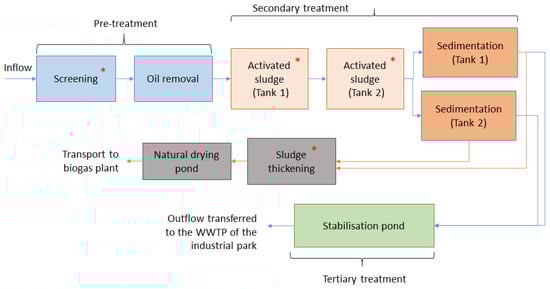
Figure 6.
Process flow diagram of brewery WWTP.
Recording of energy consumption (KWh/m3) in the existing WWTP and identification of the energy-intensive processes of the existing WWTP
The WWTP’s consumption for 2019 was 1.56 kWh/m3. The total energy consumption and treatment capacity of the WWTP for 2019 is presented in Table 1. The energy-intensive processes identified by the WWTP operators are the aeration tanks and sludge thickening.

Table 1.
Energy consumption and treatment capacity of the brewery WWTP.
Recording of typical energy consumptions found in the international literature in similar WWTPs and identification of energy-intensive WW treatment processes based on international literature data
Wastewater derived from brewery operations falls into the category of food and beverage industry wastewater effluents, but it can also be classified as municipal wastewater due to its composition and BOD/COD ratio. Therefore, the review of energy consumption records was based on data from municipal WWTPs. In the following Table 2, relevant data from the literature are reported.
Table 2.
Literature review on energy consumption in municipal WWTP.
In Table 2, it can be seen that average energy consumption is clearly capacity-dependent. In the present study, emphasis was placed on WWTPs operating in Greece so that the results can be more reliably compared. For comparison, energy uses from world-wide WTTPs are included. The main energy-intensive process, both in the literature [63] and in the examined WWTP, is the aeration of wastewater in the activated sludge process.
Calculation of the average energy consumption, in KWh/m3, of the study plant using data from the international literature and a comparison of records with calculations using data from the international literature
The calculation of energy consumption in the brewery WWTP is carried out by using average values from the literature (KWh/m3), based on the data from [17,20,21] and the volume of m3 wastewater processed by the WWTP. The results are shown in Table 3.
Table 3.
Energy consumption in the WWTP (for 2019) using literature rates.
Identification of potential practices in the treatment process that increase energy consumption
A comparison between theoretical (from literature) and actual energy consumption in the WWTP reveals a discrepancy of over 40%, indicating that operational inefficiencies significantly contribute to increased energy usage. Aeration tanks, identified as the primary energy-consumer identified in Stage 2, suggest that the most probable source of inefficiencies lies within the activated sludge process.
Therefore, in Step 1, energy use inefficiencies are depicted. In this case study, the most probable source of the marked energy use inefficiency is the aeration step.
3.2. Implementation of the DSF—Step 2
Type of industry
The brewery is classified under the food and beverage industries, so the relevant decision tree for products intended for human consumption is followed.
Water reuse limits of national legislation
Legislative limits play a crucial role in determining reuse applications, with stricter limits necessitating more advanced treatment processes. In Greece, there are no specific quality standards for recycling treated wastewater within industrial plants for non-production purposes, such as equipment washing, firefighting, or irrigation. However, reuse outside the industrial facility is regulated under Joint Ministerial Decision 145114/2011, which sets the required quality standards. In the case of a brewery, treated wastewater is reused for on-site, non-production applications, including washing corridors and external roads, firefighting, and garden irrigation, and off-site for the restricted irrigation of crops. For restricted irrigation, the outflow of the WWTP (based on JMD 145114/2011) should be the following (Table 4).
Table 4.
JMD 145114/2011 water reuse limits for restricted irrigation.
Based on the available characteristics of the brewery wastewater and the production processes. only the BOD5 limit needs to be met during the design phase.
Therefore, in Step 2, water reuse applications are selected, with the following selected for this case study:
- Reuse for on-site, non-production applications, including washing corridors, external roads, etc.
- Reuse off-site for restricted irrigation of crops (BOD limit of ≤ 25 mg/L should be met).
3.3. Implementation of the DSF—Step 3
Recording and categorization of criteria from the international literature
Both the definition of the categories and the mapping of each indicator to the respective category (Table 5) were based on respective DSS for the selection of technologies for wastewater treatment and/or reuse [50,51,52].
Table 5.
Criteria for the selection of wastewater treatment methods/technologies.
Selection of criteria applicable to the examined case study
The criteria not applicable to the case study, given its nature and site-specific characteristics, are presented in Table 6 below.
Table 6.
Criteria not applicable to the case study.
Data availability from the brewery is quite limited. Therefore, Table 7 below shows the criteria selected in the first stage of Step 3 for which no data are available.
Table 7.
Criteria rejected due to lack of data from industry.
Selection of criteria for which data are available
The final number of criteria that can be applied to the case study are 15. Their prioritization was performed by using the results of previous studies in the international literature, and the analytical hierarchy process (AHP) and other methods to determine the relative importance of each criterion for wastewater treatment technology selection [50,59]. In these studies, expert opinions were used to assign weights to the economic, technical, environmental, and social criteria, with economic factors receiving the highest priority, followed by technical and environmental considerations, and finally social aspects.
In the present study, to streamline the selection process, only the highest-ranking criteria were considered. Based on the prioritization established by [50,59], the two top-ranked criteria within each category were selected, ensuring a focused yet comprehensive evaluation. All social criteria had been excluded in previous steps due to their limited relevance to the case study. The final criteria for each category are presented in Table 8, ranked in order of priority.
Table 8.
Criteria examined in the brewery case study.
Final process selection
The goal of Step 3 of the DSF is to upgrade the effluent of the WWTP, i.e., to reduce the organic load (BOD and COD), through the addition of a tertiary treatment process. Applied on the selected criteria of the previous stage, a final selection step follows among the engineered (e.g., membranes and bioreactors) and natural (e.g., constructed wetlands and stabilization ponds) treatment processes, based on findings in the international literature [64,65,66,67,68] and is presented in Table 9. The symbols “+” and “−” are used to indicate the contribution of each system type to the respective criteria, highlighting their advantages and limitations. For example, natural treatment systems generally have lower investment costs, so a “+” is assigned to reflect this benefit.
Table 9.
Comparison of engineered-to-natural treatment systems for the selected criteria.
Based on the evaluation in Table 9, a natural treatment system is selected as the tertiary treatment process. Among the available natural treatment options, constructed wetlands (CWs) are chosen due to their widespread use in municipal wastewater treatment in Greece [64,66]. In addition to the parameters examined in the previous stages, available land and climatic conditions are critical parameters in the application of CWs. The available area in the WWTP campus is 3000 m2, making it suitable for the application of a wetland, and the climate is Mediterranean with mild winters and warm summers, facilitating the development and functioning of the system [69].
Therefore, in Step 3, the criteria are selected following a step-wise method and an additional treatment system is selected. For this case study, among the possible criteria, six are selected, and a comparative assessment of the engineered-to-natural treatment systems points to the selection of CWs as a tertiary treatment process.
3.4. Implementation of the DSF—Step 4
Determination of effluent quality thresholds to be achieved for reuse
Based on Step 2, there are no specific legislative limits for the type of recycling of treated wastewater that is selected. For restricted irrigation and based on the characteristics of the brewery wastewater, the BOD5 in the outflow of the WWTP should meet the limit presented in Table 4.
Selection of design equations from the literature and parameters, and dimensioning and calculation of the design and operational parameters of the process selected in Step 3 to achieve the effluent quality limits
The objective of this stage is to design a new process while determining the quantity of wastewater that will be reused. The key design parameter for sizing constructed wetland (CW) systems is land availability, as large areas are required to ensure adequate retention time (hydraulic load rates of <0.5 m3/m2/d) [70], which is crucial for achieving the desired pollutant concentration at the WWTP outlet. To optimize land use efficiency, sub-surface flow (SSF) CWs were selected, as they require less space while maintaining effective pollutant removal performance [71].
The design equation is based on first-order kinetics [67,70] applied to each pollutant considered, i.e., BOD5 in the present study. The known parameters include the inflow concentration of BOD5 (85.5 mg/L), the maximum allowable outflow concentration of BOD5 (25 mg/L) as per national legislation for restricted irrigation, and the maximum available land (about 3000 m2) at the brewery’s WWTP. However, the inlet flow rate and specific CW system characteristics remain unknown due to limited data on local soil types, materials, vegetation, and operating temperatures. To address these gaps, relevant parameters are sourced from the international literature [70]. The inlet and outlet of the process as well as the parameters used are presented in Table 10.
Table 10.
The inlet and outlet of the process as well as the parameters.
The final output of the first-order kinetics model determines the maximum inlet flow rate (i.e., Q = 1129 m3/d) that can be accommodated within the available land while ensuring compliance with the required BOD5 effluent concentration limits.
Of the maximum total volume of wastewater (2686.6 m3/d), 1129 m3/d (43% of the total volume) is redirected for reuse. From the 1129 m3/d, 40.1 m3/d fully covers the volume of water required by the utilities of the brewery plant. The rest 1088.9 m3/d can be reused for restricted irrigation (selected in Step 2), either balancing the overall water flow balance derived from the water needs for irrigation of the raw materials, in particular barley (5301.5 m3/d), if applicable, or used by other industries, green spaces, or farmers for irrigation purposes, essentially supporting circular economy in the area.
Therefore, in Step 4, the preliminary design for the system selected is performed and water reuse options are proposed. For this case study, to achieve the required effluent quality, 3000 m2 will be needed for the CW, 40.1 m3/d of the inlet fully covers the volume of water required by the utilities, and the remaining 1088.9 m3/d can be reused for restricted irrigation.
3.5. Implementation of the DSF—Step 5
Assessment of the energy savings that can be achieved in the existing installation through the results of Step 1
The existing brewery’s WWTP has very high energy consumption compared to that in the international literature (about 40% higher), as shown in Table 3. Such high energy consumption is expected in the activated sludge system, due to the absence of the at-source collection of discharged diatomaceous earth from the final filtration process [72]. As a result, it is carried to aeration tanks, leading to deposits on the blowers. This accumulation increases the energy required to maintain adequate aeration performance. If the discharged diatomaceous earth was collected separately after filtration, significant energy savings could be achieved, i.e., up to 500,000 kWh/year, as indicated in Step 1, based on comparisons with literature studies on energy consumption [17,20,21].
Calculate the energy consumption of the additional process or processes
SSF CWs are not energy-intensive, ranging from 0 to 0.12 kWh/m3 [73]. Considering the maximum energy consumption per unit volume of the process, the daily and monthly energy consumption of the CW system at the WWTP is as follows:
Energy consumption = 0.12 KWh/m3 × 800 m3/d = 95 Kwh/d = 2880 KWh/m,
Therefore, the monthly energy consumption of the CW system is 2880 KWh/m. The potential inclusion of an at-source collection/sedimentation unit has a negligible impact on additional energy consumption and is therefore not considered in the assessment [74].
Total assessment of energy consumption in the new system for water reclamation and reuse
Based on the results from previous steps, modifications (inclusion of the at-source collection of diatomaceous earth) to the existing WWTP could save approximately 500,000 kWh/year. The energy requirements for the added CW process are about 34,680 kWh/year. Therefore, the energy consumption in the WWTP is derived by summing the current energy consumption with the CW energy needs and removing the amount of energy that can be saved. The new total energy consumption in the WWTP is about 785 × 103 kWh/year, which is 37% lower than the current energy consumption. If no modifications are made to the existing WWTP and only the CWs are added, the energy consumption in the WWTP will increase by 0.03% and that in the whole manufacturing plant by 0.003%.
Estimation of the Carbon Footprint of the existing and new system
As outlined in Section 2.3 of the Materials and Methods section, the Carbon Footprint (CF) is estimated using the UNFCCC GHG Emissions Calculator for indirect emissions from energy consumption [15] and the IPCC methodology [41] for direct emissions from vertical subsurface flow constructed wetlands (CWs).
The CF is calculated for three scenarios:
- Baseline scenario: No modifications to the existing wastewater treatment plant (WWTP).
- Scenario ii: Addition of a CW system without implementing an at-source collection system for diatomaceous earth, thus without energy savings.
- Scenario iii: Addition of a CW system along with an at-source collection system for diatomaceous earth, resulting in energy savings.
In the baseline scenario, CF is estimated only for emissions from energy consumption, as the BOD concentration in the WWTP inflow is not available. For Scenario ii and Scenario iii, CF accounts for both energy-related emissions and direct emissions from the CW process.
The WWTP is powered by electricity from the national grid. To estimate CF from energy consumption, constant energy consumption and WWTP inflow over the years are assumed. The energy mix of Greece for 2023 [75] is used in the calculations, with its composition detailed in Table S1.
After the implementation of the CW system in the WWTP, methane (CH₄) and nitrous oxide (N2O) emissions were considered in the assessment of the CF [64]. The detailed analysis, method, and equations used for the estimation of the emissions derived from the CW process is available in the Supplementary Materials.
The results of the CF assessment for each scenario as well as the comparative analysis against the baseline scenario are presented in Figure 7. For the comparative analysis, the total CF (derived from both energy consumption and process emissions) is compared to the CF of the baseline scenario (derived solely from energy consumption) with the process emissions of CW estimated to be minimal (i.e., 6000 kg CO2 eq/y).
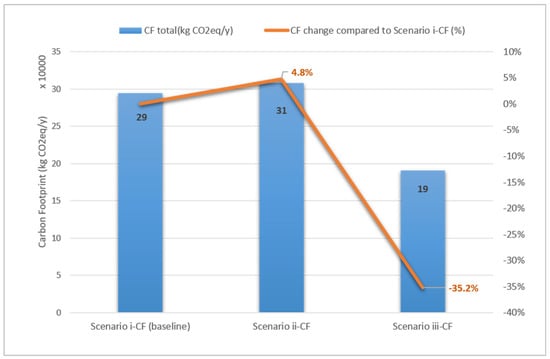
Figure 7.
Results of CF assessment for each scenario and comparative analysis.
Calculation of the total WF reduction in the industrial unit because of water reuse
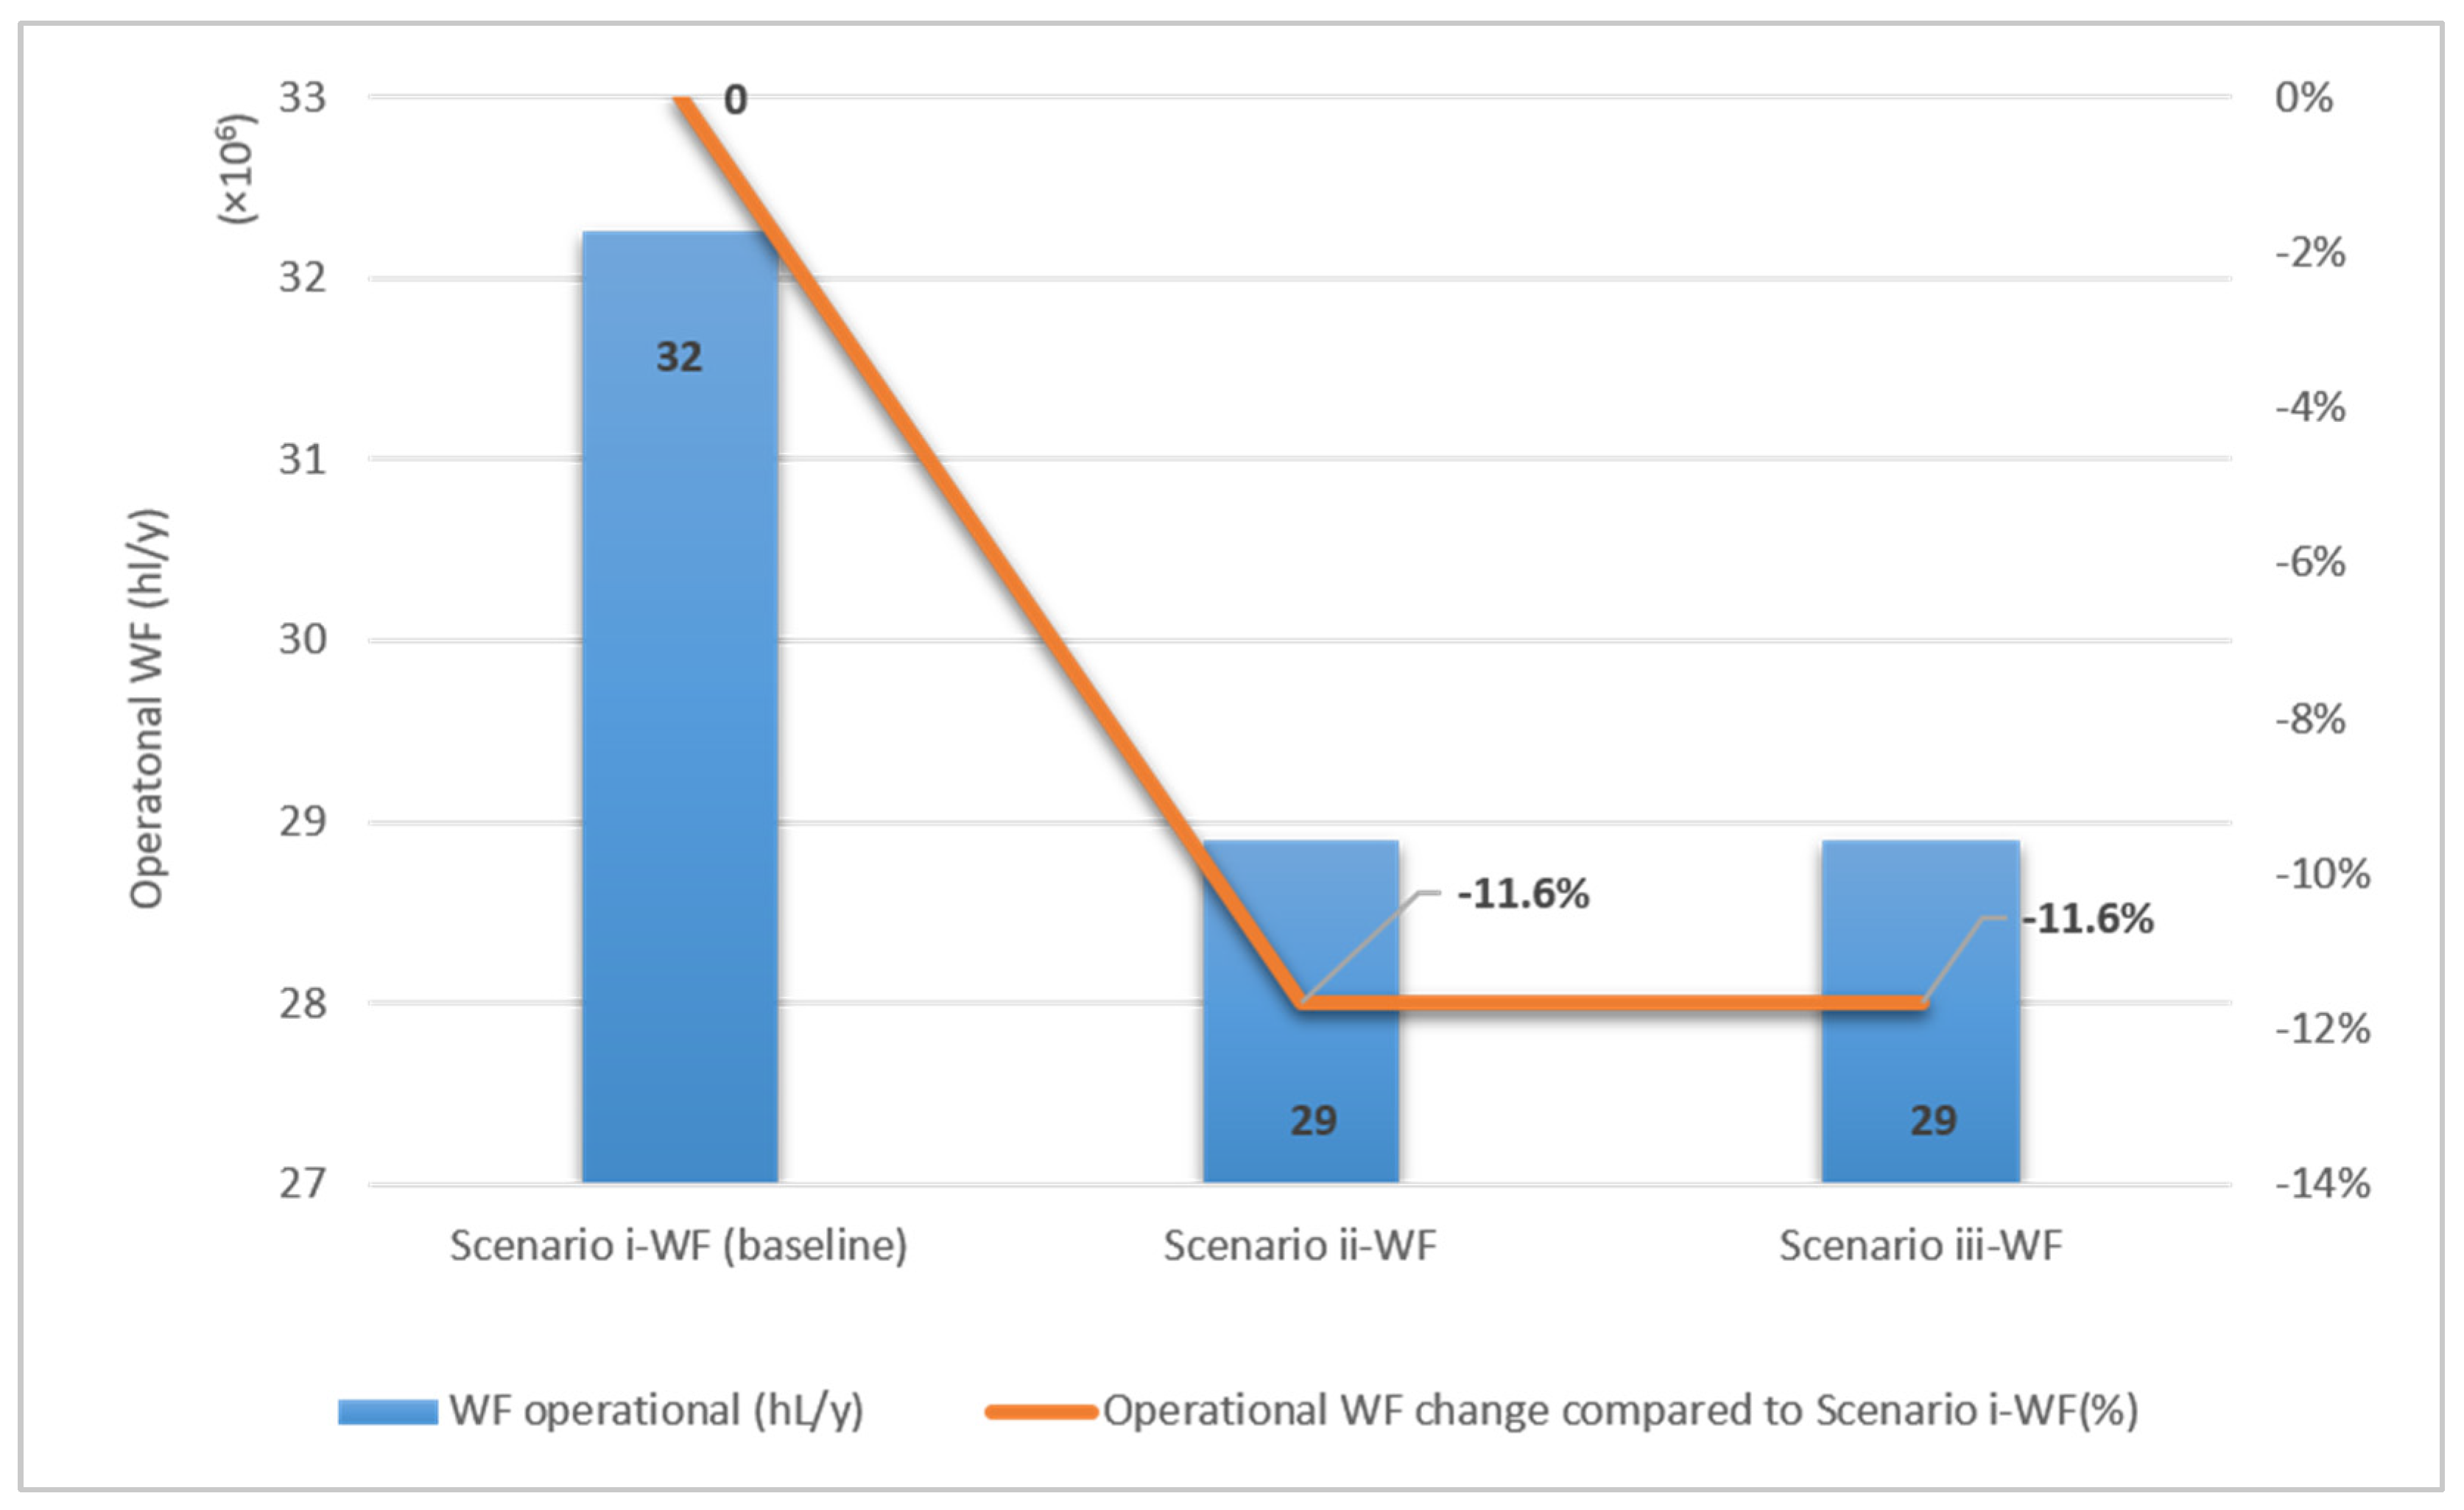
The WF is estimated for three scenarios: (i) current operational and supply chain WF of the plant (baseline); (ii) water reuse in the utilities and irrigation of barley; and (iii) water reuse in the utilities and other irrigation activities carried out by industries, farmers, or regional authorities for green spaces. The results are presented in Figure 8 and Figure 9.

Figure 8.
Comparison of operational WF of the brewery before and after water reuse.
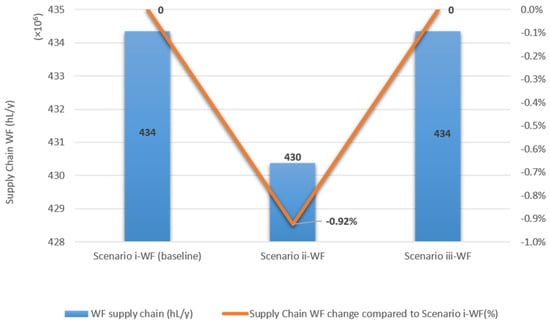
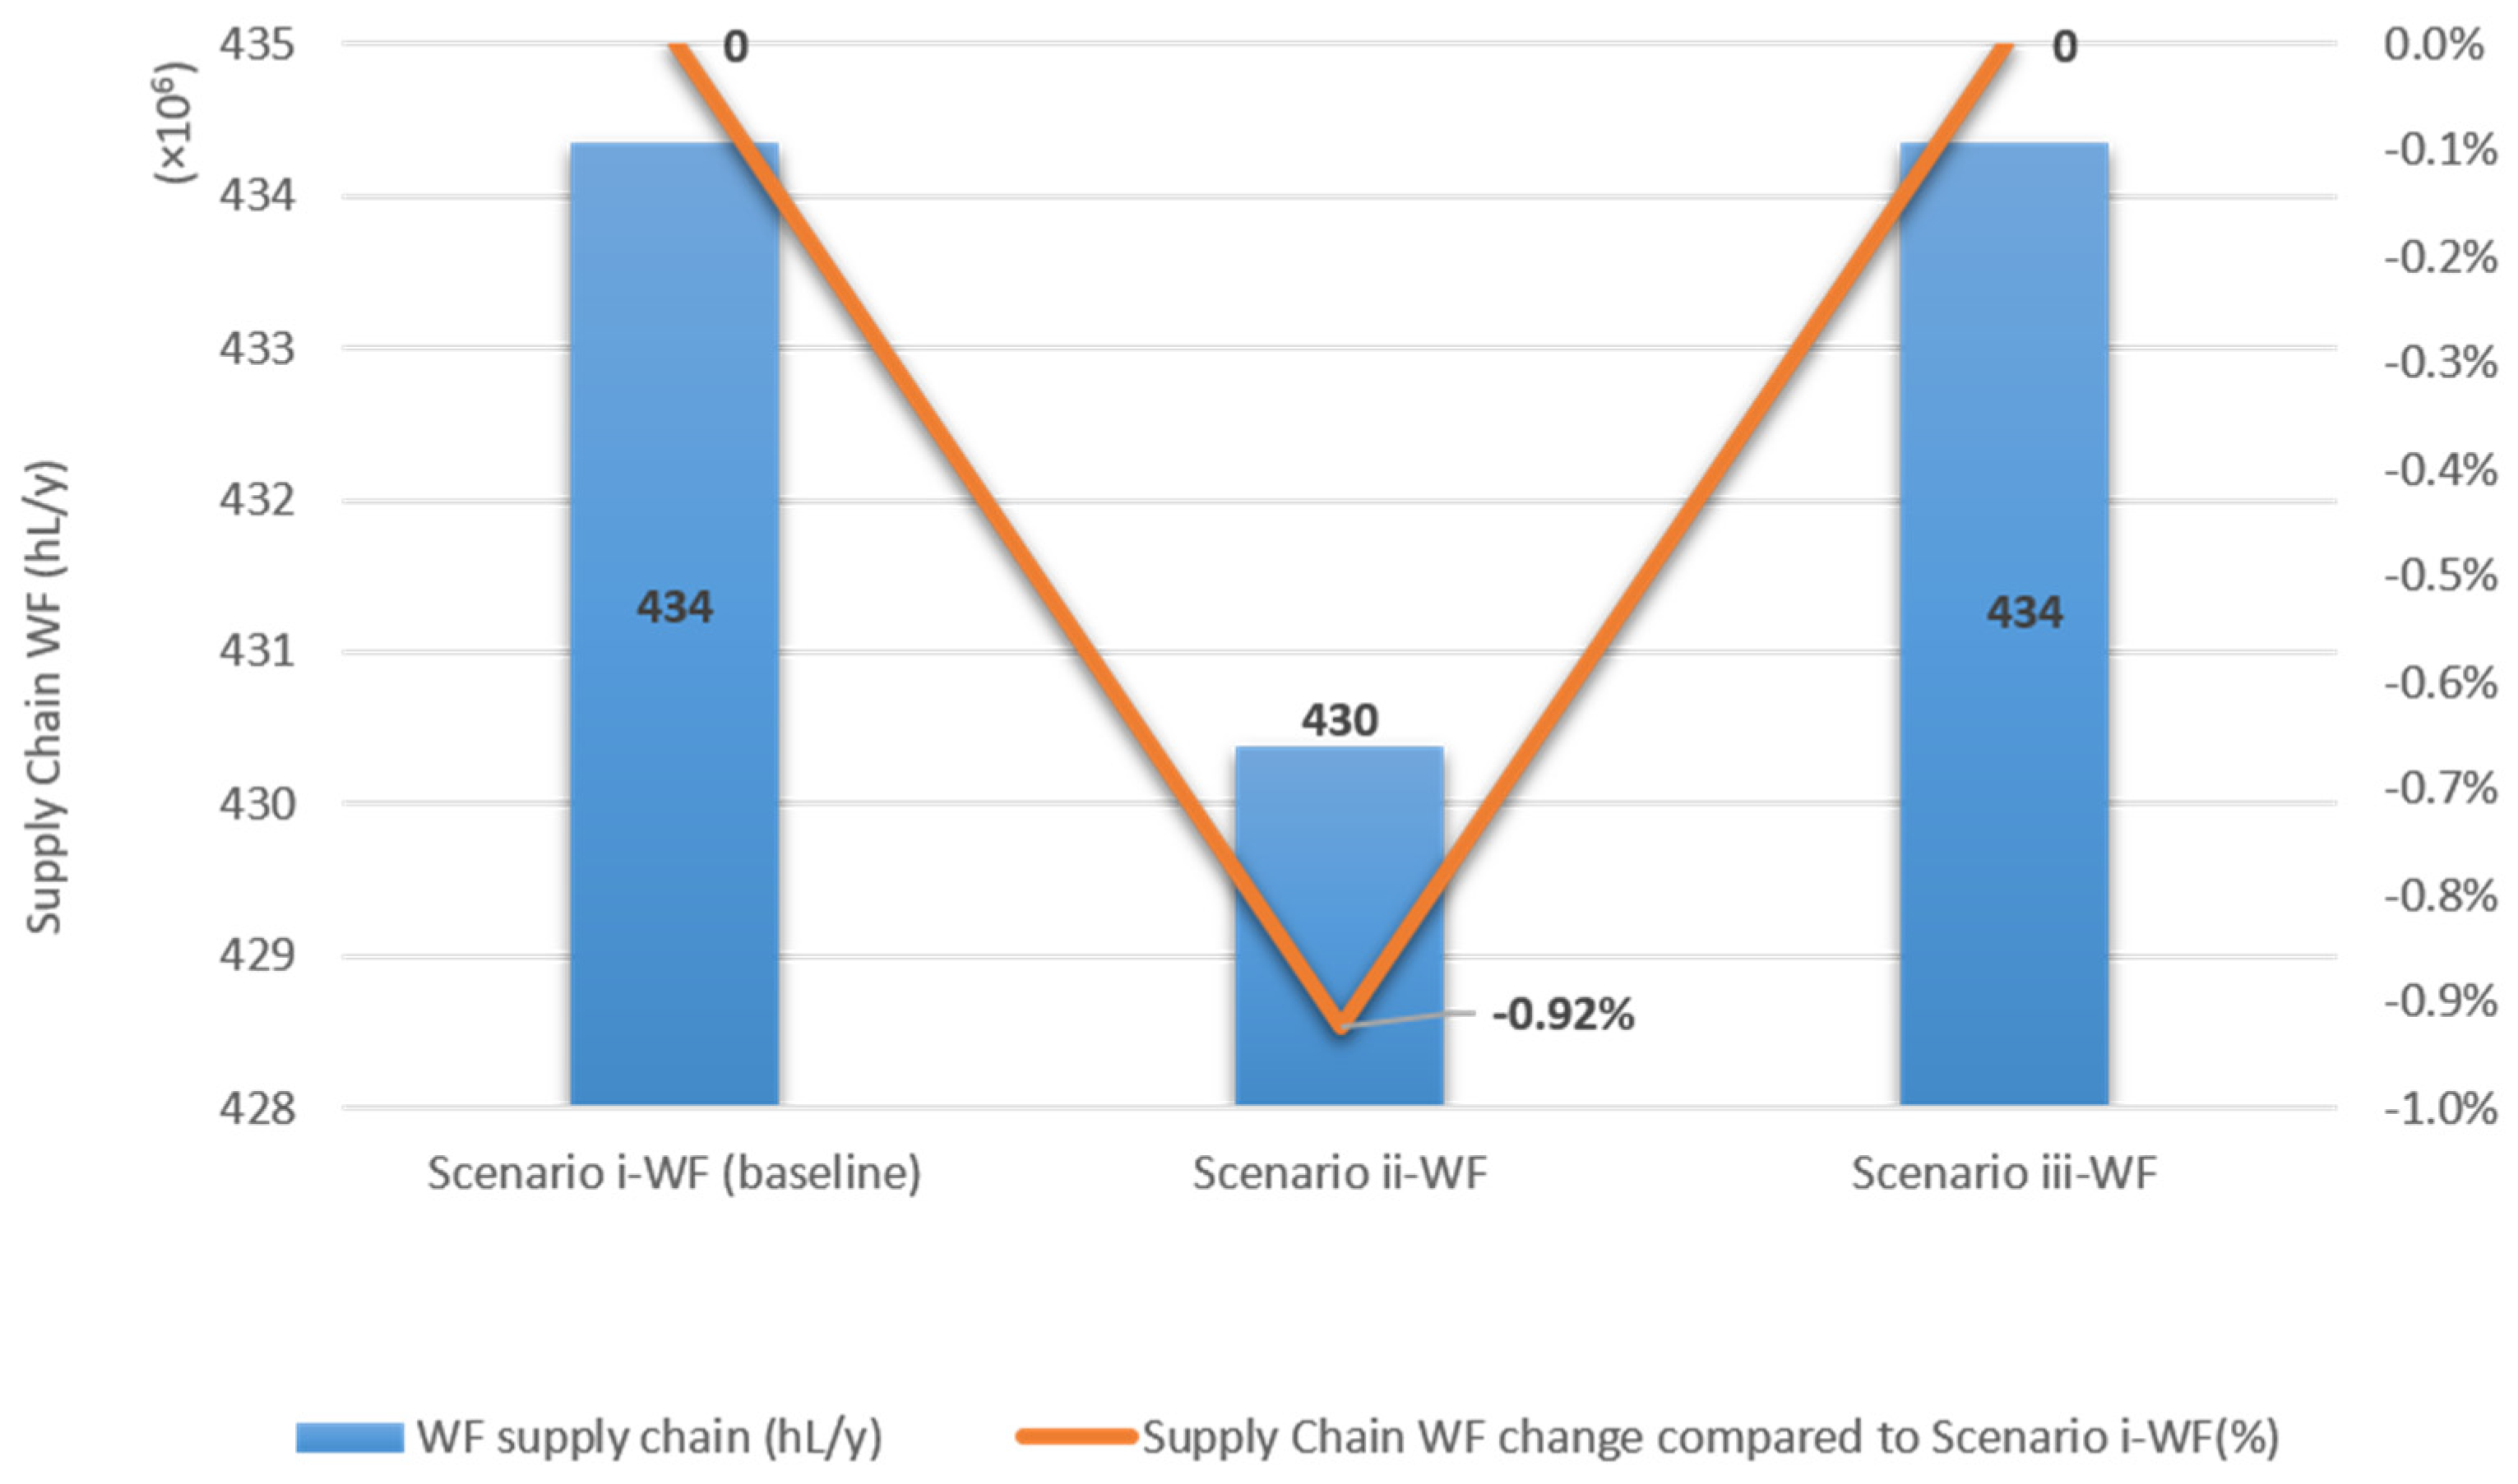
Figure 9.
Comparison of supply chain WF of the brewery before and after water reuse.
In 2019, the brewery’s total water consumption, as measured at the plant, was 618,257 m3. This study builds upon previous research [61] which estimated the plant’s operational WF for 2019 at 32,261,000 hL The supply chain WF, primarily related to barley cultivation, was estimated at 434,354,000 hL for 2019 [76,77] (Scenario i-WF baseline) (additional information is provided in the supply chain WF estimation in Table S2 of the Supplementary Materials).
With the integration of CWs, 40.1 m3 per day will be reused within the plant to meet the utility water demands (Scenario ii-WF). This will lead to annual savings of 14,636 m3, reducing the brewery’s total water consumption by 2.4%. Since all water required for utilities will be recycled, the WF for utilities will be zero, resulting in a 0.45% decrease in the brewery’s overall operational WF. In addition, part of the treated wastewater from the WWTP (1088.9 m3/d) is reused for restricted irrigation of barley. Therefore, 3,974,000 hL of the grey WF of the plant (part of the operational WF) is offset. Thus, the grey WF is reduced to 16,151,000 hL [61], resulting in a further reduction in the operational WF at 28,895,000 hL (adding a 10% decrease to the reduction through recycling in utilities). Furthermore, since barley is the main raw material of the brewery, 3,974,000 hL of the supply chain WF is offset. Consequently, the supply chain WF is reduced to 430,380,000 hL, representing a 0.91% decrease.
For Scenario iii-WF, the operational WF is the same as that for Scenario ii-WF since the treated wastewater is reused in the utilities, and the grey WF is reduced through reclaimed water recycling in circular economy applications.
Percentage of increase in CF and reduction in WF
Based on the results of the previous stages, implementing all proposed measures leads to a reduction in both CF (Figure 8) and WF (Figure 9) at the plant. Comparing the worst-case scenarios in both assessments (increase in CF and minimum reduction in WF), for Scenario ii-CF, CF is increased by 4.8%, while for Scenario iii-WF, total WF is reduced by 10.45%. In contrast, the best-case combination scenarios (Scenario iii-CF and Scenario ii-WF) result in a 35.2% decrease in CF, a 10.45% reduction in operational WF, and a 0.91% reduction in supply chain WF, demonstrating the effectiveness of integrated water reuse and energy efficiency strategies. The results are reported in Table 11.
Table 11.
Combination of scenarios for CF and WF changes compared to the baseline.
Therefore, in Step 5, scenarios relevant to the water reuse options pointed out in Step 4 and the energy use inefficiencies determined in Step 1 are proposed, and WF and CF indicators are estimated and compared to the actual industry operation. In this case study, alternative scenarios are proposed and best- and worst-case combinations of actions related to CF and WF are assessed. The plant’s CF is significantly reduced when all proposed solutions are implemented (Scenario iii-CF). Additionally, the WF decreases across all scenarios. Consequently, both the worst-case and best-case scenario combinations demonstrate environmental benefits in terms of both water and energy consumption, confirming that the proposed modifications and additions are environmentally sustainable for the brewery.
4. Discussion
The step-wise framework developed in this study addresses the gap in holistic evaluations by combining both water use and related energy impacts, bringing novelty to flexible solutions for industrial water reuse practices by combining process innovations and circular practices. It also tries to address the subjectivity of the selection of indicators (criteria) to be used in multi-criteria decision-making systems through the logical sequence proposed for their selection. It is true that the major limitation for evaluating a given system is the scarcity of data relevant to the criteria to be used, even more pronounced in the case of industries. On the other hand, given the specificity of industry types and operation modes combined with their location, experts’ experience and judgment are valuable tools balancing subjectivity while choosing indicators and attributing specific weights to them during evaluation.
The application of a methodological framework can lead to better informed decision making towards improvements in the environmental performance of the system. Industrial partners can exploit the outcomes of this study to lead the way towards sustainability depending on the industrial case’s peculiarities, a challenging task in the presence of both technical and legal requirements.
The findings demonstrate that while numerous solutions exist for enhancing operational efficiency, a systematic approach ensures that key intervention points are identified and prioritized. In this study, literature comparisons and scenario-based assessments validate the proposed framework’s effectiveness in guiding decision-making.
Several previous studies have emphasized the value of DSS in wastewater treatment technology selection, particularly in balancing economic, environmental, and technical criteria [15,35,36,37,38,39,40,41,42,43]. Compared to such frameworks, our proposed DSF expands this approach by integrating WF and energy consumption as primary assessment steps, which are particularly relevant for water-intensive industries like brewing. Moreover, while previous systems often provided a ranked list of technologies, our framework supports scenario-based customization, enabling users to prioritize reuse goals or WF reductions depending on specific site conditions.
This study clearly demonstrates that conventional WWTPs, especially those using activated sludge, are significant energy consumers, often exceeding values reported in the literature [17,20,21,22,23,24,25] due to operational inefficiencies. On the other hand, natural treatment systems, like CWs, provide a low-energy, low-CF alternative suitable for tertiary treatment and reuse, in line with the findings of other research studies [64,66]. The brewery’s case showcases how combining source control (e.g., diatomaceous earth removal) with nature-based solutions can not only optimize energy performance but also promote circular water use and sustainability in industrial settings.
From a CF perspective, the baseline scenario of the brewery WWTP results in emissions from an energy consumption of approximately 0.36 kg CO2-eq/m3, which, although lower than the values reported for other plants such as the Starogard WWTP in Poland (0.54 kg CO2-eq/m3) [22], still indicates potential for optimization. Additionally, when compared to marginal emissions for electricity production in Europe, reported in the range of 0.75–0.90 kg CO2-eq/kWh [22], the brewery’s current CF appears relatively moderate, due in part to the national grid mix and the relatively low share of fossil-intensive electricity. Nonetheless, the implementation of energy-saving measures combined with CW integration brings the CF down by 35%, underscoring the effectiveness of coupling energy efficiency strategies with nature-based solutions to enhance sustainability in industrial wastewater management.
Ultimately, the outcome of this study gives valuable insights and recommendations to the scientific community and industrial stakeholders to identify excess energy consumption due to inefficiencies in wastewater treatment and design additional treatment processes, as well as assess their environmental impacts in terms of WF and CF, therefore enhancing water circularity and sustainability within the process industry.
In this study, the developed DSF was applied to a water- and energy-consuming industry with an in-house wastewater treatment system, and the outcomes point to an enhancement of water use efficiency, without excessive energy use increase. Energy use inefficiencies of the WWTP were depicted and attributed to aeration tank operation. The probable source of excess energy use was identified, which can help stakeholders to take relevant mitigating actions.
Given the industry type and location, alternative water reuse options were selected and an assessment of the needed wastewater treatment upgrading was performed based on criteria produced through the DSF. Since assessments are necessarily data-driven, the need for obtaining reliable relevant data should be of primary importance and this could help stakeholders to be able to make better decisions, with minor interventions, such as, among others, about metering devices’ addition at specific locations.
The selected plant-upgrade option improves water use efficiency within the industrial unit; however, it also increases overall energy consumption. To ensure a balanced assessment, through the DSF, multiple scenarios were evaluated that integrate energy use mitigation strategies with reclaimed wastewater reuse while accounting for the energy required for WWTP upgrades. The results indicate that all scenarios enhance water efficiency, but not all lead to energy savings. Notably, the optimal scenario successfully improves both water and energy use, demonstrating that achieving sustainability in industrial operations requires a holistic evaluation that considers both CF and WF. This study aligns with established best practices for sustainable water management in industry, including the recommendations set forth by BIER.
The proposed framework could be applied to all industrial WTTPs, with pertinent modifications depending on industry type. Moreover, it could be applied to industrial units without on-site wastewater treatment. In this case, Step 1 would be non-applicable, and in Steps 3 and 4, an appropriate WTTP would be designed ab initio. Furthermore, the proposed framework could be extended to the industrial unit itself, where in Step 1, a second branch identical to the existing one should be included for the industry itself, and the combined assessment of the industrial unit with its wastewater treatment plant would be performed based on the same indicators.
5. Conclusions
Sustainable industrial production requires the efficient management of water and energy resources, as well as the effective reuse of wastewater, a priority emphasized in numerous studies. However, a comprehensive evaluation framework that simultaneously assesses water- and energy-related indicators, specifically WF and CF, remains largely absent from industrial wastewater treatment and reuse planning. This study addresses this gap by developing a stepwise DSF, which is applied to a brewery equipped with an in-house WWTP to optimize water reuse and energy efficiency.
The proposed framework identifies excess energy consumption hotspots, revealing that the existing WWTP consumes over 40% more energy than expected, highlighting significant potential for improvement. Given the industry type and regulatory constraints, feasible wastewater reuse options include on-site reuse in utilities and restricted irrigation. The selected advanced wastewater treatment approach, determined through the DSF, ensures that the treated wastewater meets reuse quality standards but increases energy consumption by approximately 5%. Despite this, it enables the treatment of 43% of the total wastewater volume, with 3% fully covering utility water demand, while the remaining treated effluent can be allocated to restricted irrigation. This irrigation can either support barley cultivation, the primary feedstock of the brewery, reducing the industrial supply chain WF by 1%, or serve other irrigation purposes. In both cases, the industrial operational WF is reduced by 12%, as 20% of the grey WF is eliminated.
By combining water reuse strategies and energy efficiency improvements in the WWTP’s most energy-intensive stages, the optimal scenario, as identified by the DSF, demonstrates a significant reduction in environmental impact. This scenario simultaneously achieves a 35% decrease in CF, a 10% reduction in operational WF, and a 1% reduction in supply chain WF, proving that integrated water-energy management is key to achieving sustainability in industrial processes.
These findings emphasize the critical role of holistic assessment methodologies in guiding industries toward sustainable resource management. The DSF not only provides a structured approach to evaluating WWTP efficiency and water reuse potential but also offers quantifiable insights into the environmental benefits of integrating water and energy-saving strategies. The framework’s flexibility allows for its application across diverse industrial sectors, enabling companies to make data-driven decisions that align with both environmental objectives and operational feasibility. Additionally, fostering collaboration between industry stakeholders and policymakers can accelerate the adoption of water reuse initiatives, driving systemic improvements in industrial sustainability.
Supplementary Materials
The following supporting information can be downloaded at: https://www.mdpi.com/article/10.3390/w17081179/s1, Table S1. Energy mix in Greece 2023 [75]. Table S2. GWP values relevant to CO2 used in calculations [14]. Table S3. WF of barley production in the Municipal Unit of Larissa using the Blaner-Criddle and Penman-Monteith methods [76].
Author Contributions
Conceptualization, I.N. and H.G.; methodology, I.N. and H.G; formal analysis, I.N. and H.G.; data curation, I.N.; writing—original draft preparation, I.N. and H.G; writing—review and editing, I.N. and H.G; supervision, H.G. All authors have read and agreed to the published version of the manuscript.
Funding
This research received no external funding.
Data Availability Statement
The original contributions presented in this study are included in the article/Supplementary Materials. Further inquiries can be directed to the corresponding authors.
Acknowledgments
The authors thank the brewery for providing the production data for this research.
Conflicts of Interest
The authors declare no conflicts of interest.
Abbreviations
The following abbreviations are used in this manuscript:
| AHP | Analytical Hierarchy Process |
| BOD5 | Biochemical Oxygen Demand |
| CF | Carbon Footprint |
| COD | Chemical Oxygen Demand |
| CW | Constructed Wetlands |
| DSF | Decision Support Framework |
| DSS | Decision Support Systems |
| GHG | Greenhouse Gas |
| IDSS | Intelligent Decision Support Systems |
| JMD | Joint Ministerial Decision |
| LCA | Life Cycle Assessment |
| MCDM | Multi-Criteria Decision-Making |
| p.e. | Population Equivalent |
| SSF CW | Sub-Surface Flow Constructed Wetlands |
| SS | Suspended Solids |
| WF | Water Footprint |
| WWTPs | Wastewater Treatment Plants |
References
- The 17 Goals. Available online: https://sdgs.un.org/goals (accessed on 15 March 2025).
- Food and Agriculture Organization of the United Nations. Progress on Change in Water-Use Efficiency. Global Status and Acceleration Needs for SDG Indicator 6.4.1; Food and Agriculture Organization of the United Nations: Rome, Italy, 2021. [Google Scholar]
- Food and Agriculture Organization of the United Nations. Progress on Change in Water-Use Efficiency. Mid-Term Status of SDG Indicator 6.4.1 and Acceleration Needs, with Special Focus on Food Security and Climate Change; Food and Agriculture Organization of the United Nations: Rome, Italy, 2024. [Google Scholar]
- Capa, S.; Ozdemir, A.; Gunkaya, Z.; Ozkan, A.; Banar, M. An environmental and economic assessment based on life cycle approaches for industrial wastewater treatment and water recovery. J. Water Process Eng. 2022, 49, 103002. [Google Scholar] [CrossRef]
- Eurostat. Water Statistics. Available online: https://ec.europa.eu/eurostat/statistics-explained/index.php?title=Water_statistics (accessed on 4 August 2024).
- Hoekstra, A.Y.; Chapagain, A.K.; Aldaya, M.M.; Mekonnen, M.M. The Water Footprint Assessment Manual; Taylor & Francis: Washington, DC, USA, 2011. [Google Scholar]
- Gerbens-Leenes, P.-W.; Hoekstra, A.Y. Business Water Footprint Accoutning: A Tool to Assess How Production of Goods and Services Impacts on Freshwater Resources Worldwide; UNESCO-IHE Institute for Water Education: Delft, The Netherlands, 2008. [Google Scholar]
- Zhang, G.P.; Hoekstra, A.Y.; Mathews, R.E. Water Footprint Assessment (WFA) for better water governance and sustainable development. Water Resour. Ind. 2013, 1–2, 1–6. [Google Scholar] [CrossRef]
- Karkou, E.; Teo, C.; Savvakis, N.; Poinapen, J.; Arampatzis, G. Industrial circular water use practices through the application of a conceptual water efficiency framework in the process industry. J. Environ. Manag. 2024, 370, 122596. [Google Scholar] [CrossRef]
- Lazarova, V.; Levine, B.; Sack, J.; Cirelli, G.; Jeffrey, P.; Muntau, H.; Salgot, M.; Brissaud, F. Role of water reuse for enhancing integrated water management in Europe and Mediterranean countries. Water Sci. Technol. 2001, 43, 25–33. [Google Scholar] [CrossRef] [PubMed]
- Hidalgo, D.; Irusta, R.; Martinez, L.; Fatta, D.; Papadopoulos, A. Development of a multi-function software decision support tool for the promotion of the safe reuse of treated urban wastewater. Desalination 2007, 215, 90–103. [Google Scholar] [CrossRef]
- Kumar, A.; Thakur, A. Industrial water conservation by water footprint and Sustainable Development Goals. In Water Footprints and Sustainable Development; Elsevier: Amsterdam, The Netherlands, 2024. [Google Scholar] [CrossRef]
- Weerasooriya, R.R.; Liyanage, L.P.K.; Rathnappriya, R.H.K.; Bandara, B.; Perera, T.A.; Gunarathna, M.H.; Jayasinghe, G. Industrial water conservation by water footprint and sustainable development goals: A review. Environ. Dev. Sustain. 2021, 23, 12661–12709. [Google Scholar] [CrossRef]
- IPCC. Intergovernmental Panel of Climate Change: Climate Change: Synthesis Report. Contribution of Working Groups I, II and III to the Fifth Assessment Report of the IPCC; Core Writing Team, Pachauri, R.K., Meyer, L.A., Eds.; IPCC: Geneva, Switzerland, 2014. [Google Scholar]
- UNFCCC Greenhouse Gas Emissions Calculator. Available online: https://unfccc.int/documents/271269 (accessed on 16 February 2025).
- Arroyo, P.; Molinos-Senante, M. Selecting appropriate wastewater treatment technologies using a choosing-by-advantages approach. Sci. Total Environ. 2018, 625, 819–827. [Google Scholar] [CrossRef]
- Siatou, A.; Manali, A.; Gikas, P. Energy Consumption and Internal Distribution in Activated Sludge Wastewater Treatment Plants of Greece. Water 2020, 12, 1204. [Google Scholar] [CrossRef]
- Panepinto, D.; Fiore, S.; Zappone, M.; Genon, G.; Meucci, L. Evaluation of the energy efficiency of a large wastewater treatment plant in Italy. Appl. Energy 2016, 161, 404–411. [Google Scholar] [CrossRef]
- Molinos-Senante, M.; Maziotis, A. Evaluation of energy efficiency of wastewater treatment plants: The influence of the technology and aging factors. Appl. Energy 2022, 310, 118535. [Google Scholar] [CrossRef]
- Goliopoulos, N.; Mamais, D.; Noutsopoulos, C.; Dimopoulou, A. Energy consumption and carbon footprint of greek wastewater treatment plants. Water 2022, 14, 320. [Google Scholar] [CrossRef]
- Dimopoulou, A. Comparative Assessment of Energy Consumption and GHG Emissions in Wastewater Treatment Plants (WTP). Master’s Thesis, National Technical University of Athens, Athens, Greece, 2011. [Google Scholar]
- Maktabifard, M.; Zaborowska, E.; Makinia, J. Evaluating the effect of different operational strategies on the carbon footprint of wastewater treatment plants—Case studies from northern Poland. Water Sci. Technol. 2019, 79, 11. [Google Scholar]
- Presura, E.; Robescu, L.D. Energy use and carbon footprint for potable water and wastewater treatment. In Proceedings of the 11th International Conference on Business Excellence, Bucharest, Romania, 23–25 March 2017; pp. 191–198. [Google Scholar]
- Wang, X.; Dong, Y.; Yu, S.; Mu, G.; Qu, H.; Li, Z.; Bian, D. Analysis of the Electricity Consumption in Municipal Wastewater Treatment Plants in Northeast China in Terms of Wastewater Characteristics. Int. J. Environ. Res. Public Health 2022, 19, 14398. [Google Scholar] [CrossRef] [PubMed]
- Vaccari, M.; Foladori, P.; Nembrini, S.; Vitali, F. Benchmarking of energy consumption in municipal wastewater treatment plants—A survey of over 200 plants in Italy. Water Sci. Technol. 2018, 77, 2242–2252. [Google Scholar]
- Robescu, L.D.; Presura, E. Reducing carbon footprint of a wastewater treatment plant using advanced treatment and renewable energy sources. Environ. Eng. Manag. J. 2017, 16, 1055–1062. [Google Scholar] [CrossRef]
- Maktabifard, M.; Awaitey, A.; Merta, E.; Haimi, H.; Zaborowska, E.; Mikola, A.; Mąkinia, J. Comprehensive evaluation of the carbon footprint components of wastewater treatment plants located in the Baltic Sea region. Sci. Total Environ. 2022, 806, 150436. [Google Scholar]
- Zaborowska, E.; Czerwionka, K.; Makinia, J. Integrated plant-wide modelling for evaluation of the energy balance and greenhouse gas footprint in large wastewater treatment plants. Appl. Energy 2021, 282, 1161. [Google Scholar]
- Chen, K.-H.; Wang, H.-C.; Han, J.-L.; Liu, W.-Z.; Cheng, H.-Y.; Liang, B.; Wang, A.-J. The application of footprints for assessing the sustainability of wastewater treatment plants: A review. J. Clean. Prod. 2020, 277, 124053. [Google Scholar] [CrossRef]
- Abyar, H.; Nowrouzi, M. A comprehensive framework for eco-environmental impact evaluation of wastewater treatment plants: Integrating carbon footprint, energy footprint, toxicity, and economic assessments. J. Environ. Manag. 2023, 348, 119255. [Google Scholar]
- He, X.; Li, Z.; Xing, C.; Li, Y.; Liu, M.; Gao, X.; Ding, Y.; Lu, L.; Liu, C.; Li, C.; et al. Carbon footprint of a conventional wastewater treatment plant: An analysis of water-energy nexus from life cycle perspective for emission reduction. J. Clean. Prod. 2023, 429, 139562. [Google Scholar]
- Lee, M.; Keller, A.A.; Chiang, P.-C.; Den, W.; Wang, H.; Hou, C.-H.; Wu, J.; Wang, X.; Yan, J. Water-energy nexus for urban water systems: A comparative review on energy intensity and environmental impacts in relation to global water risks. Appl. Energy 2017, 205, 589–601. [Google Scholar] [CrossRef]
- Arampatzis, G.; Stathatou, P.-M.; Scaloubakas, P.; Assimacopoulos, D. Supporting decisions for the application of combined natural and engineered systems for water treatment and reuse. Int. J. Decis. Support Syst. 2019, 4, 2. [Google Scholar] [CrossRef]
- Ye, X.; Chen, B.; Jing, L.; Zhang, B.; Liu, Y. Multi-agent hybrid particle swarm optimization (MAHPSO) for wastewater treatment network planning. J. Environ. Manag. 2019, 234, 525–536. [Google Scholar] [CrossRef]
- Torregrossa, D.; Hernández-Sancho, F.; Hansen, J.; Cornelissen, A.; Popov, T.; Schutz, G. Energy saving in wastewater treatment plants: A plant-generic cooperative decision support system. J. Clean. Prod. 2017, 167, 601–609. [Google Scholar] [CrossRef]
- Díaz-Madroñero, M.; Pérez-Sánchez, M.; Satorre-Aznar, J.R.; Mula, J.; López-Jiménez, P.A. Analysis of a wastewater treatment plant using fuzzy goal programming as a management tool: A case study. J. Clean. Prod. 2018, 180, 20–30. [Google Scholar] [CrossRef]
- Torregrossa, D.; Marvuglia, A.; Leopold, U. A novel methodology based on LCA + DEA to detect eco-efficiency shifts in wastewater treatment plants. Ecol. Indic. 2018, 94, 7–15. [Google Scholar] [CrossRef]
- Bisinella de Faria, A.B.; Spérandio, M.; Ahmadi, A.; Tiruta-Barna, L. Evaluation of new alternatives in wastewater treatment plants based on dynamic modelling and life cycle assessment (DM-LCA). Water Res. 2015, 84, 99–111. [Google Scholar] [CrossRef]
- Zeng, S.; Chen, X.; Dong, X.; Liu, Y. Efficiency assessment of urban wastewater treatment plants in china: Considering greenhouse gas emissions. Resour. Conserv. Recycl. 2017, 120, 157–165. [Google Scholar] [CrossRef]
- Oprea, M. A knowledge modelling framework for intelligent environmental decision support systems and its application to some environmental problems. Environ. Model. Softw. 2018, 110, 72–94. [Google Scholar] [CrossRef]
- IPCC. Intergovernmental Panel of Climate Change. Constructed Wetlands for Wastewater Treatment. Supplement to the 2006 IPCC Guidelines for National Greenhouse Gas Inventories: Wetlands. 2013. Available online: https://www.ipcc.ch/publication/2013-supplement-to-the-2006-ipcc-guidelines-for-national-greenhouse-gas-inventories-wetlands/ (accessed on 1 April 2025).
- Gu, Y.; Dong, Y.; Wang, H.; Keller, A.; Xu, J.; Chiramba, T.; Li, F. Quantification of the water, energy and carbon footprints of wastewater treatment plants in China considering a water–energy nexus perspective. Ecol. Indic. 2016, 60, 402–409. [Google Scholar] [CrossRef]
- Gémar, G.; Gómez, T.; Molinos-Senante, M.; Caballero, R. Assessing changes in eco-productivity of wastewater treatment plants: The role of costs, pollutant removal efficiency and greenhouse gas emissions. Environ. Impact Assess. Rev. 2018, 69, 24–31. [Google Scholar] [CrossRef]
- BIER. A Practical Perspective on Water Accounting in the Beverage Sector. December 2011. Version 1.0. Available online: https://shift.tools/resources/776 (accessed on 1 April 2025).
- BIER. Water-Use Benchmarking in the Beverage Industry, Trends and Observations. Available online: https://www.bieroundtable.com/wp-content/uploads/BIER-Benchmarking-Publication-2010.pdf (accessed on 1 April 2025).
- BIER. Water Circularity Good Practices Guide. Available online: https://www.bieroundtable.com/wp-content/uploads/Water-Circularity-Good-Practices-Guide.pdf (accessed on 1 April 2025).
- Azizov, F.; Tahiri, T. Water Stewardship in the Beverage Industry: Corporate Best Practices. 2025. Available online: https://www.researchgate.net/publication/389043761 (accessed on 1 April 2025).
- Water Reuse Association. Advancing Water Reuse Within the Beverage Industry. Available online: https://watereuse.org/wp-content/uploads/2024/02/Advancing-Water-Reuse-Within-the-Beverage-Industry_v6.pdf (accessed on 1 April 2025).
- Renfrew, D.; Vasilaki, V.; Katsou, E. Indicator based multi-criteria decision support systems for wastewater treatment plants. Sci. Total Environ. 2024, 915, 169903. [Google Scholar] [CrossRef] [PubMed]
- Eseoglu, G.; Yapsakli, K.; Tozan, H.; Vayvay, O. A novel fuzzy framework for technology selection of sustainable wastewater treatment plants based on TODIM methodology in developing urban areas. Sci. Rep. 2022, 12, 8800. [Google Scholar] [CrossRef]
- Južnič-Zonta, Ž.; Guisasola, A.; Baeza, J. Smart-plant decision support system (SP-DSS): Defining a multi-criteria decision-making framework for the selection of WWTP configurations with resource recovery. J. Clean. Prod. 2022, 367, 132873. [Google Scholar] [CrossRef]
- Sucu, S.; van Schaik, M.O.; Esmeli, R.; Ouelhadj, D.; Holloway, T.; Williams, J.B.; Cruddas, P.; Martinson, D.B.; Chen, W.-S.; Cappon, H.J. A conceptual framework for a multi-criteria decision support tool to select technologies for resource recovery from urban wastewater. J. Environ. Manag. 2021, 300, 113608. [Google Scholar] [CrossRef] [PubMed]
- Singh, R.K.; Murty, H.R.; Gupta, S.K.; Dikshit, A.K. An overview of sustainability assessment methodologies. Ecol. Indic. 2016, 15, 281–299. [Google Scholar] [CrossRef]
- Qian, Y.; Zhao, Y.; Qian, H.; Xiang, J.; Chen, C.; Su, L.; Cai, C. Evaluation of Industrial Water Use Efficiency on an Enterprise Scale Based on Analytic Hierarchy Method and Self-Organizing Map: A Case Study in Zhejiang, China. Water 2025, 17, 901. [Google Scholar] [CrossRef]
- Muga, H.E.; Mihelcic, J.R. Sustainability of wastewater treatment technologies. J. Environ. Manag. 2008, 88, 437–447. [Google Scholar] [CrossRef]
- Molinos-Senante, M.; Gómez, T.; Garrido-Baserba, M.; Caballero, R.; Sala-Garrido, R. Assessing the sustainability of small wastewater treatment systems: A composite indicator approach. Sci. Total Environ. 2014, 497–498, 497–498. [Google Scholar] [CrossRef]
- Castellet, L.; Molinos-Senante, M. Efficiency assessment of wastewater treatment plants: A data envelopment analysis approach integrating technical, economic, and environmental issues. J. Environ. Manag. 2016, 167, 160–166. [Google Scholar] [CrossRef]
- Karimi, A.R.; Mehrdadi, N.; Hashemian, S.J.; Bidhendi, G.R.N.; Moghaddam, R.T. Selection of wastewater treatment process based on the analytical hierarchy process and fuzzy analytical hierarchy process methods. Int. J. Environ. Sci. Technol. 2011, 8, 267–280. [Google Scholar] [CrossRef]
- Lizot, M.; Goffi, A.; Thesari, S.; Trojan, F.; Afonso, P.S.L.P.; Ferreira, P.F.V. Multi-criteria methodology for selection of wastewater treatment systems with economic, social, technical and environmental aspects. Environ. Dev. Sustain. 2021, 23, 9827–9851. [Google Scholar] [CrossRef]
- Ćetković, J.; Knežević, M.; Vujadinović, R.; Tombarević, E.; Grujić, M. Selection of Wastewater Treatment Technology: AHP Method in Multi-Criteria Decision Making. Water 2023, 15, 1645. [Google Scholar] [CrossRef]
- Nydrioti, I.; Moutsaki, M.M.; Leounakis, N.; Grigoropoulou, H. Implementation of the water footprint as a water performance indicator in industrial manufacturing units located in Greece: Challenges and prospects. Environ. Sci. Pollut. Res. 2024, 31, 803–819. [Google Scholar] [CrossRef]
- Olajire, A. The brewing industry and environmental challenges. J. Clean. Prod. 2020, 256, 102817. [Google Scholar] [CrossRef]
- Ghimire, U.; Sarpong, G.; Gude, V.G. Transitioning wastewater treatment plants toward circular economy and energy sustainability. ACS Omega 2021, 6, 11794–11803. [Google Scholar] [CrossRef]
- Stathatou, P.-M.; Dedousis, P.; Arampatzis, G.; Grigoropoulou, H.; Assimacopoulos, D. Energy savings and reduced emissions in combined natural and engineered systems for wastewater treatment and reuse: The WWTP of Antiparos Island, Greece. Desalination Water Treat. 2019, 159, 13–23. [Google Scholar] [CrossRef]
- Ho, L.; Van Echelpoel, W.; Charalambous, P.; Gordillo, A.P.L.; Thas, O.; Goethals, P. Statistically-Based Comparison of the Removal Efficiencies and Resilience Capacities between Conventional and Natural Wastewater Treatment Systems: A Peak Load Scenario. Water 2018, 10, 328. [Google Scholar] [CrossRef]
- Tsihrintzis, V.A.; Gikas, G.D. Constructed wetlands for wastewater and activated sludge treatment in north Greece: A review. Water Sci Techno. 2010, 61, 2653–2672. [Google Scholar] [CrossRef]
- Galanopoulos, C.; Sazakli, E.; Leotsinidis, M.; Lyberatos, G. Dynamic model extension for the design of full-scale artificial free superficial flow wetland systems. J. Environ. Chem. Eng. 2014, 4, 2129–2135. [Google Scholar] [CrossRef]
- Foglia, A.; González-Camejo, J.; Radini, S.; Sgroi, M.; Li, K.; Eusebi, A.L.; Fatone, F. Transforming wastewater treatment plants into reclaimed water facilities in water-unbalanced regions. An overview of possibilities and recommendations focusing on the Italian case. J. Clean. Prod. 2023, 410, 137264. [Google Scholar] [CrossRef]
- Stefanakis, A. Constructed Wetlands for Wastewater Treatment in Hot and Arid Climates; Springer Nature: Cham, Switzerland, 2022. [Google Scholar]
- Crites, W.R.; Middlebrooks, J.; Reed, C.S. Natural Treatment Systems; CRC Press: London, UK, 2006. [Google Scholar]
- Wang, J.; Yu, X.; Lin, H.; Wang, J.; Chen, L.; Ding, Y.; Feng, S.; Zhang, J.; Ye, B.; Kan, X.; et al. The efficiency of full-scale subsurface constructed wetlands with high hydraulic loading rates in removing pharmaceutical and personal care products from secondary effluent. J. Hazard. Mater. 2023, 451, 131095. [Google Scholar] [CrossRef] [PubMed]
- Dessalew, G.; Beyene, A.; Nebiyu, A.; Ruelle, M.L. Use of industrial diatomite wastes from beer production to improve soil fertility and cereal yields. J. Clean. Prod. 2017, 157, 22–29. [Google Scholar] [CrossRef]
- Stefanakis, A. Constructed Wetlands Technology for Sustainable Wastewater Treatment. In Proceedings of the 4th Distance Education e-Learning Summer School “Wastewater & Biosolids Mangaement”, Athens, Greece, 18–23 July 2018. [Google Scholar]
- Gori, R.; Giaccherini, F.; Jiang, L.-M.; Sobhani, R.; Rosso, D. Role of primary sedimentation on plant-wide energy recovery and carbon footprint. Water Sci. Technol. 2013, 68, 870–878. [Google Scholar] [CrossRef]
- Power Production Breakdown in Greece 2023. Available online: https://www.statista.com/statistics/1494135/electricity-mix-greece/ (accessed on 16 February 2025).
- Lazarou, M. Water Footprint Assessment of Crops in the Municipal Unit of Larissa. Diploma Thesis, National Technical University of Athens, Athens, Greece, 2012. [Google Scholar]
- Islam, S.; Rashidul Alam, A. Performance evaluation of FAO Penman-Monteith and best alternative models for estimating reference evapotranspiration in Bangladesh. Heliyon 2021, 7, e07487. [Google Scholar] [CrossRef]


Disclaimer/Publisher’s Note: The statements, opinions and data contained in all publications are solely those of the individual author(s) and contributor(s) and not of MDPI and/or the editor(s). MDPI and/or the editor(s) disclaim responsibility for any injury to people or property resulting from any ideas, methods, instructions or products referred to in the content. |
© 2025 by the authors. Licensee MDPI, Basel, Switzerland. This article is an open access article distributed under the terms and conditions of the Creative Commons Attribution (CC BY) license (https://creativecommons.org/licenses/by/4.0/).