
Modeling Hydrocarbon Plume Dynamics in Shallow Groundwater of the Rey Industrial Area, Iran: Implications for Remediation Planning


 , and
, and 
Abstract
:1. Introduction
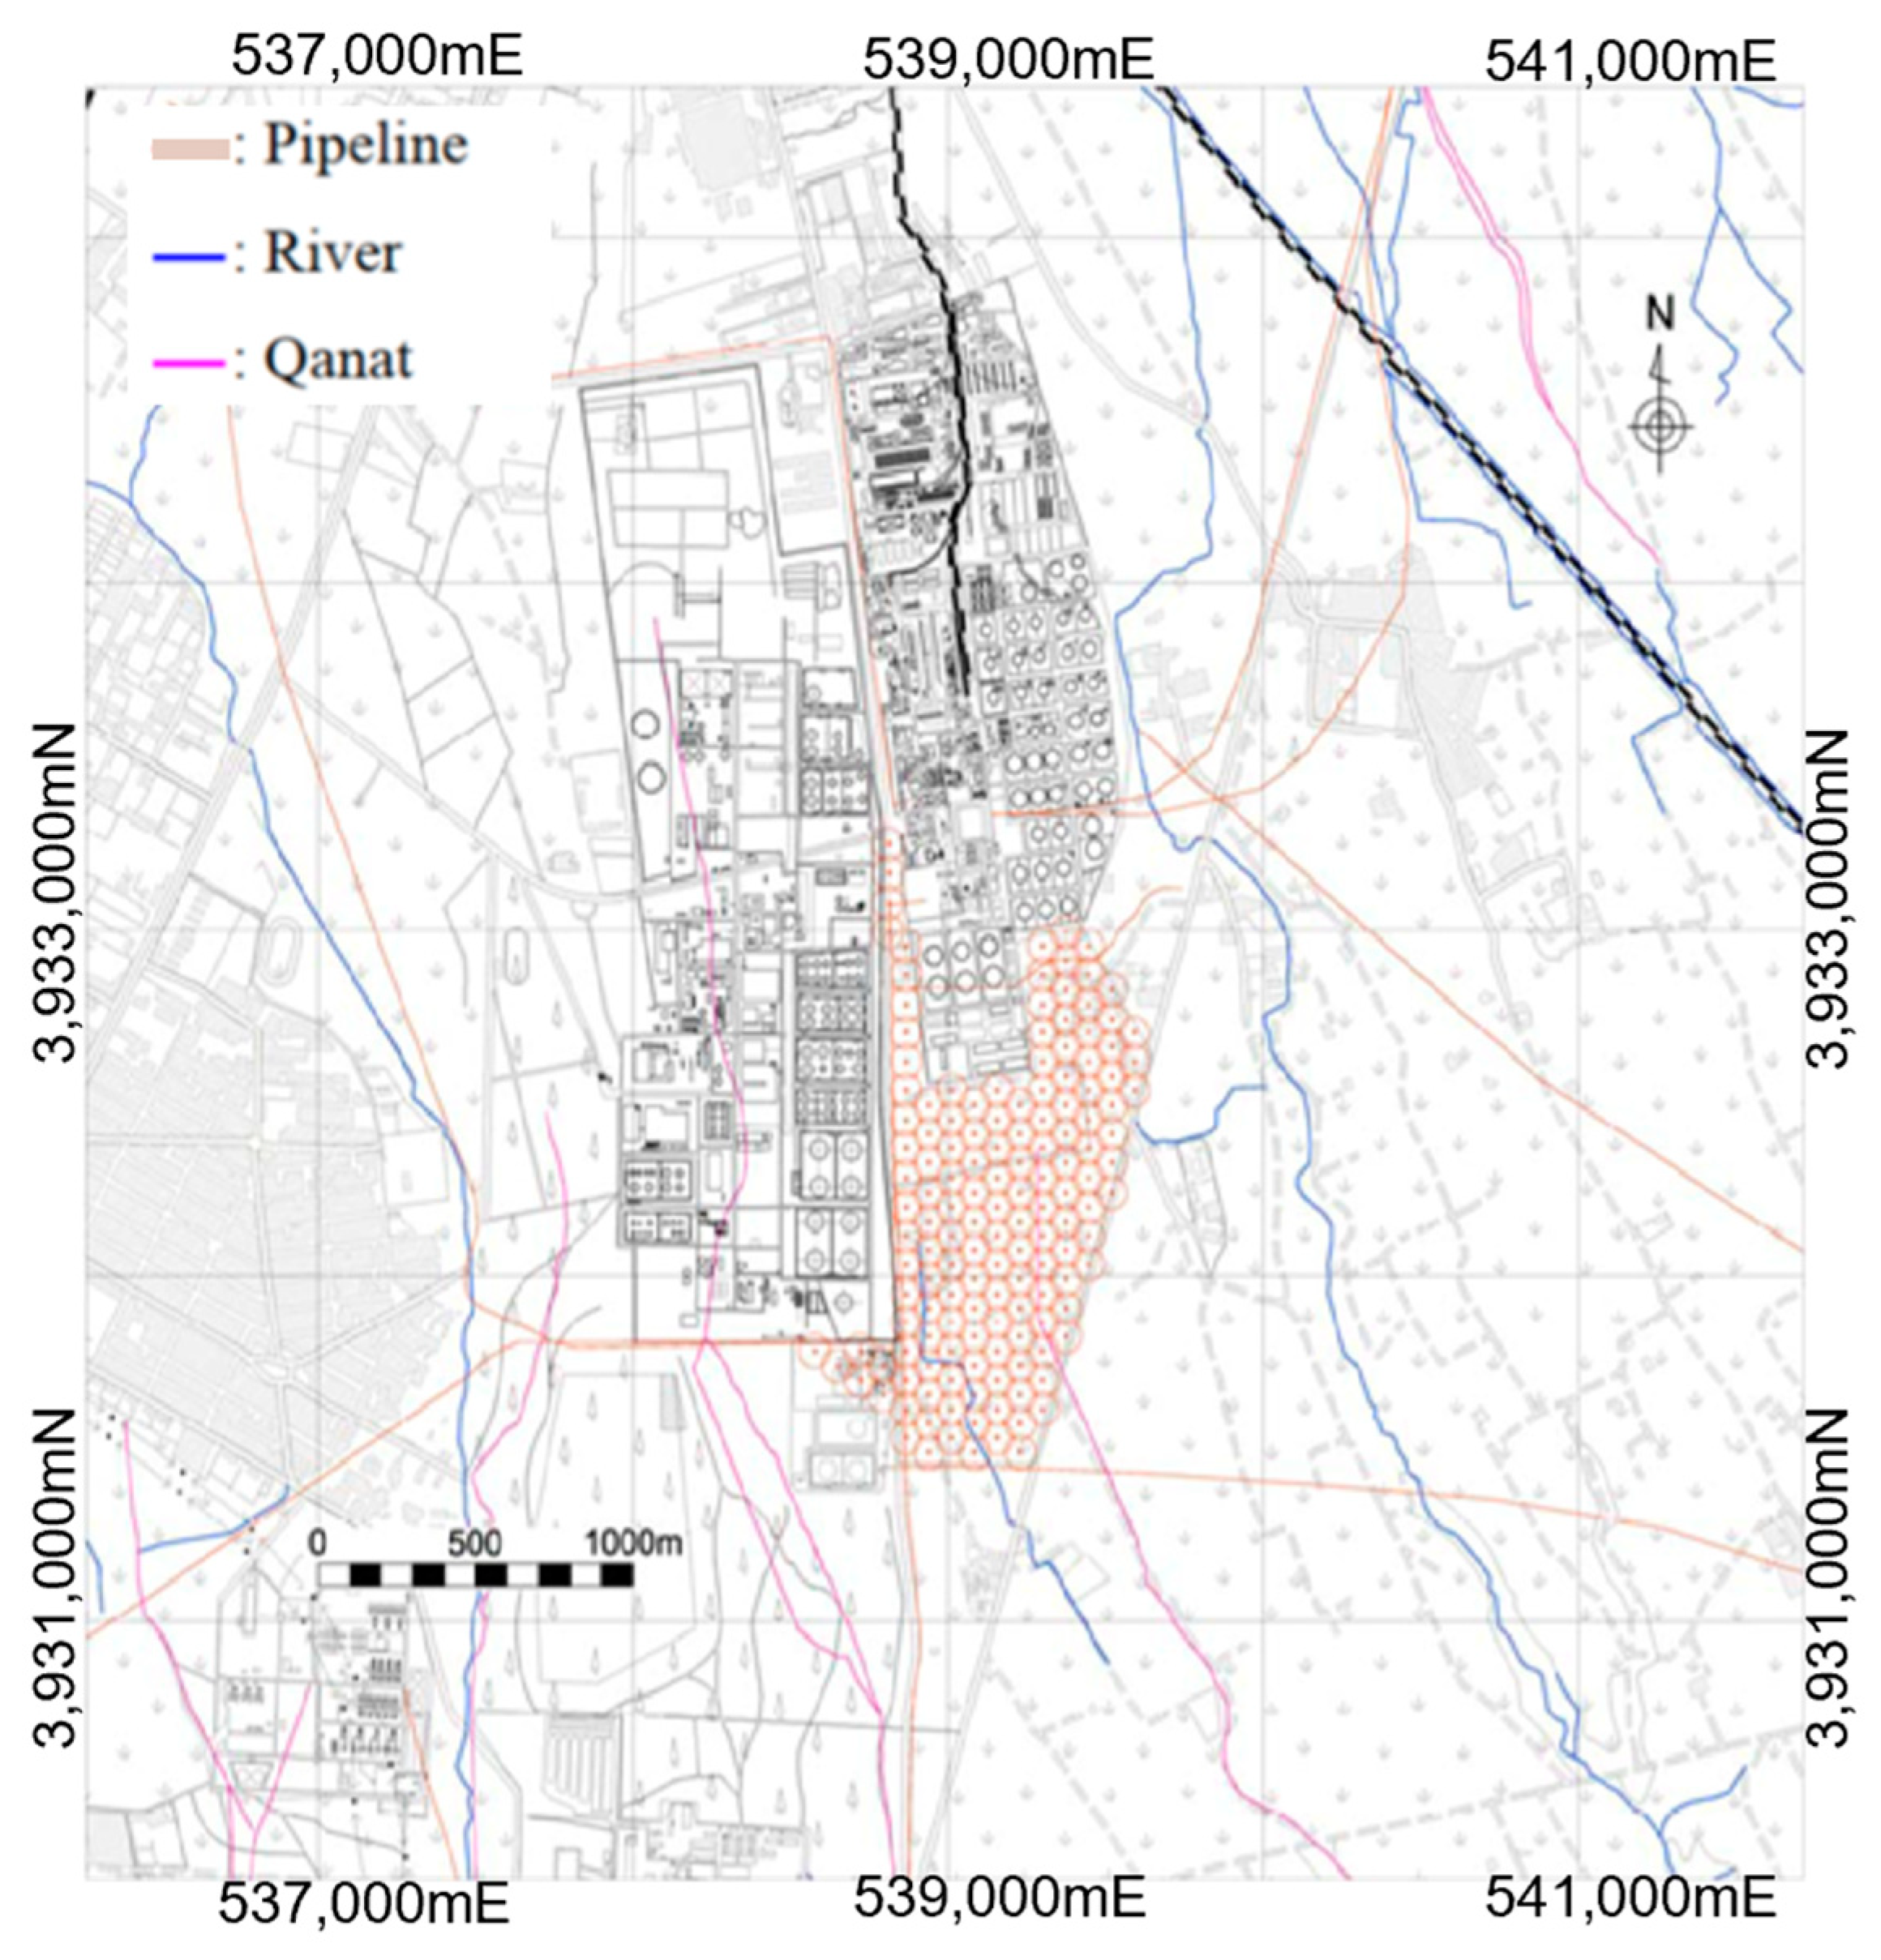
2. Study Area
2.1. Geological and Hydrogeological Setting
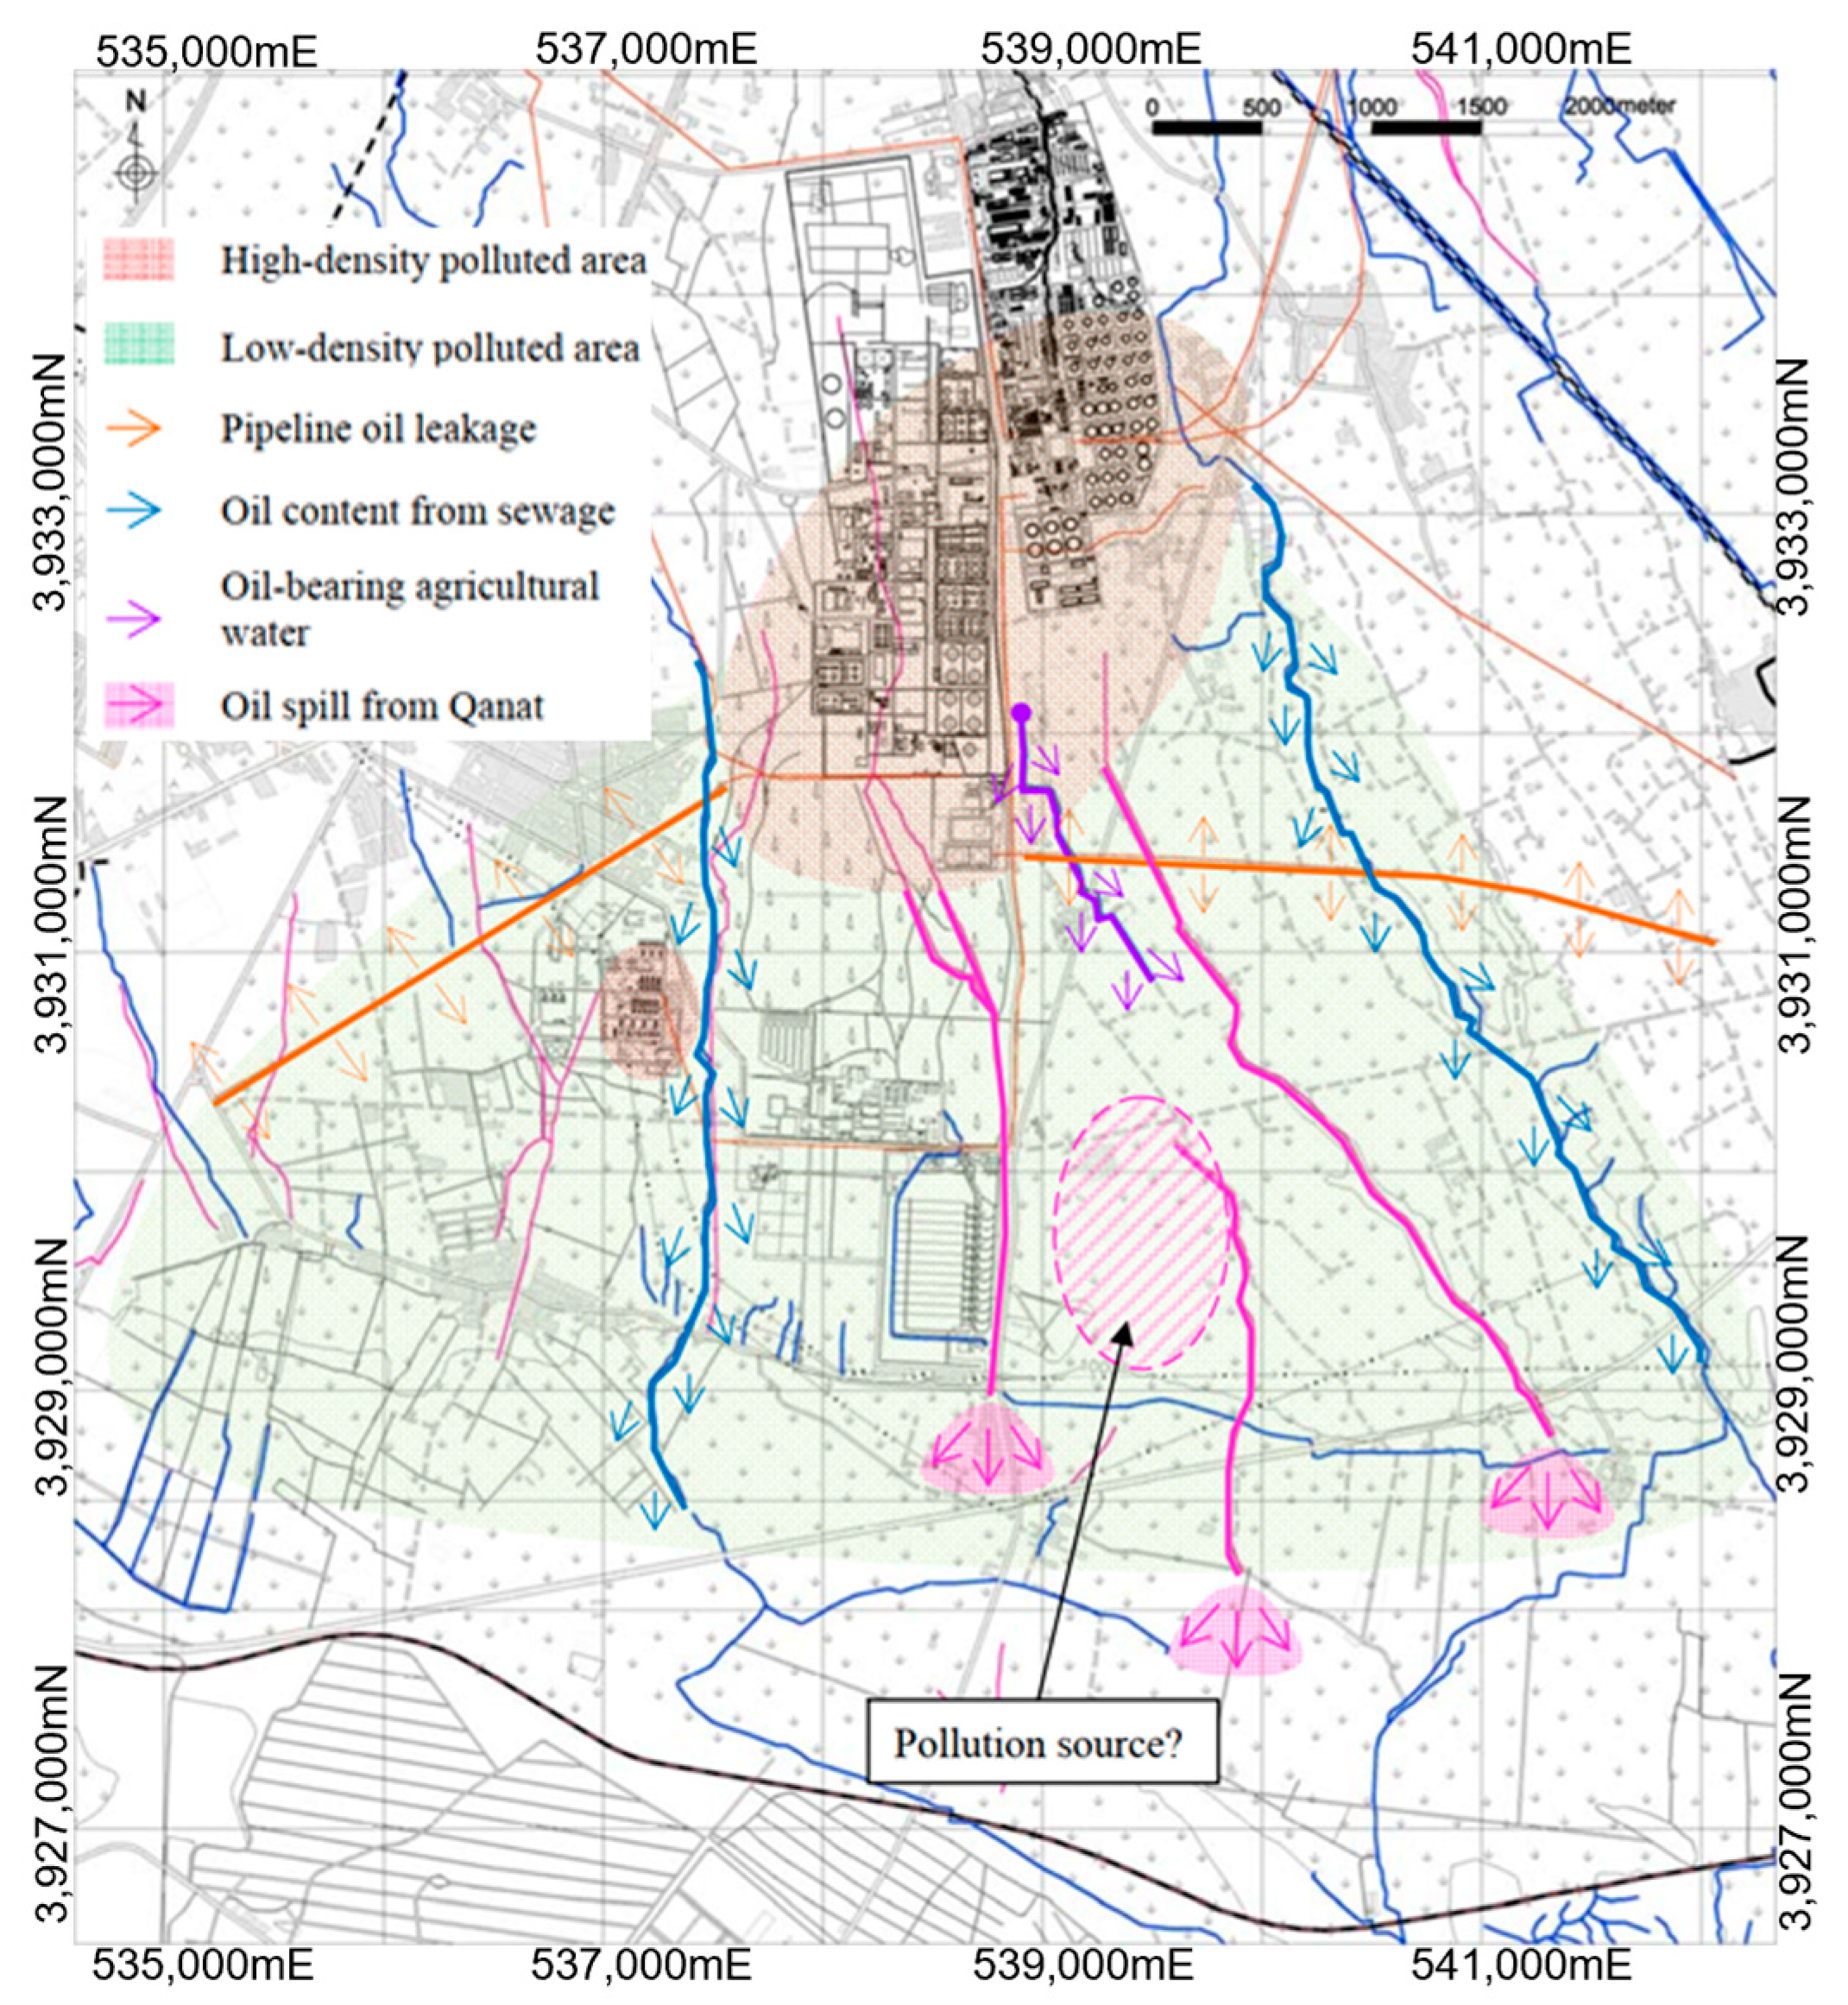
2.2. Oil Contamination Background
3. Methodology
3.1. Numerical Modeling
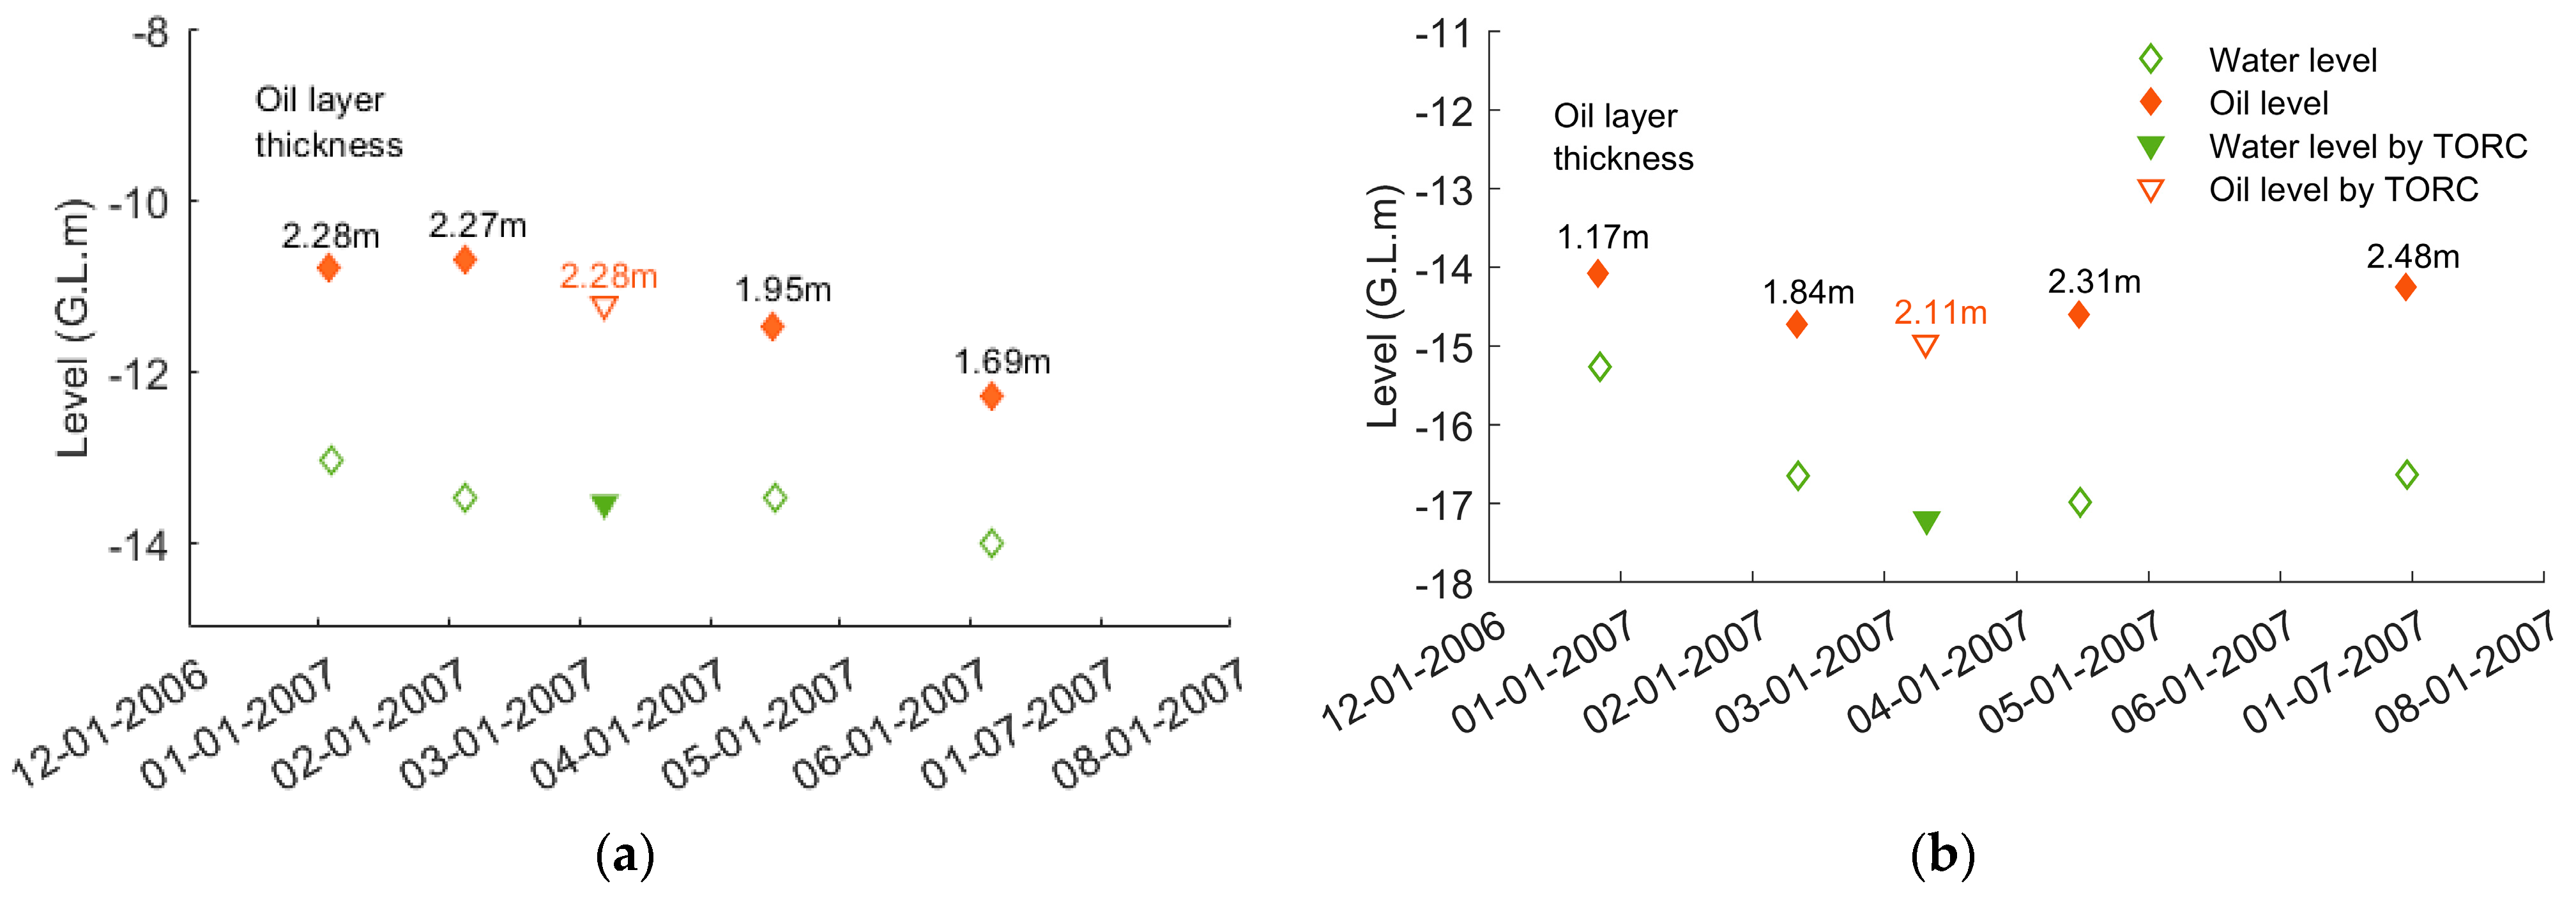
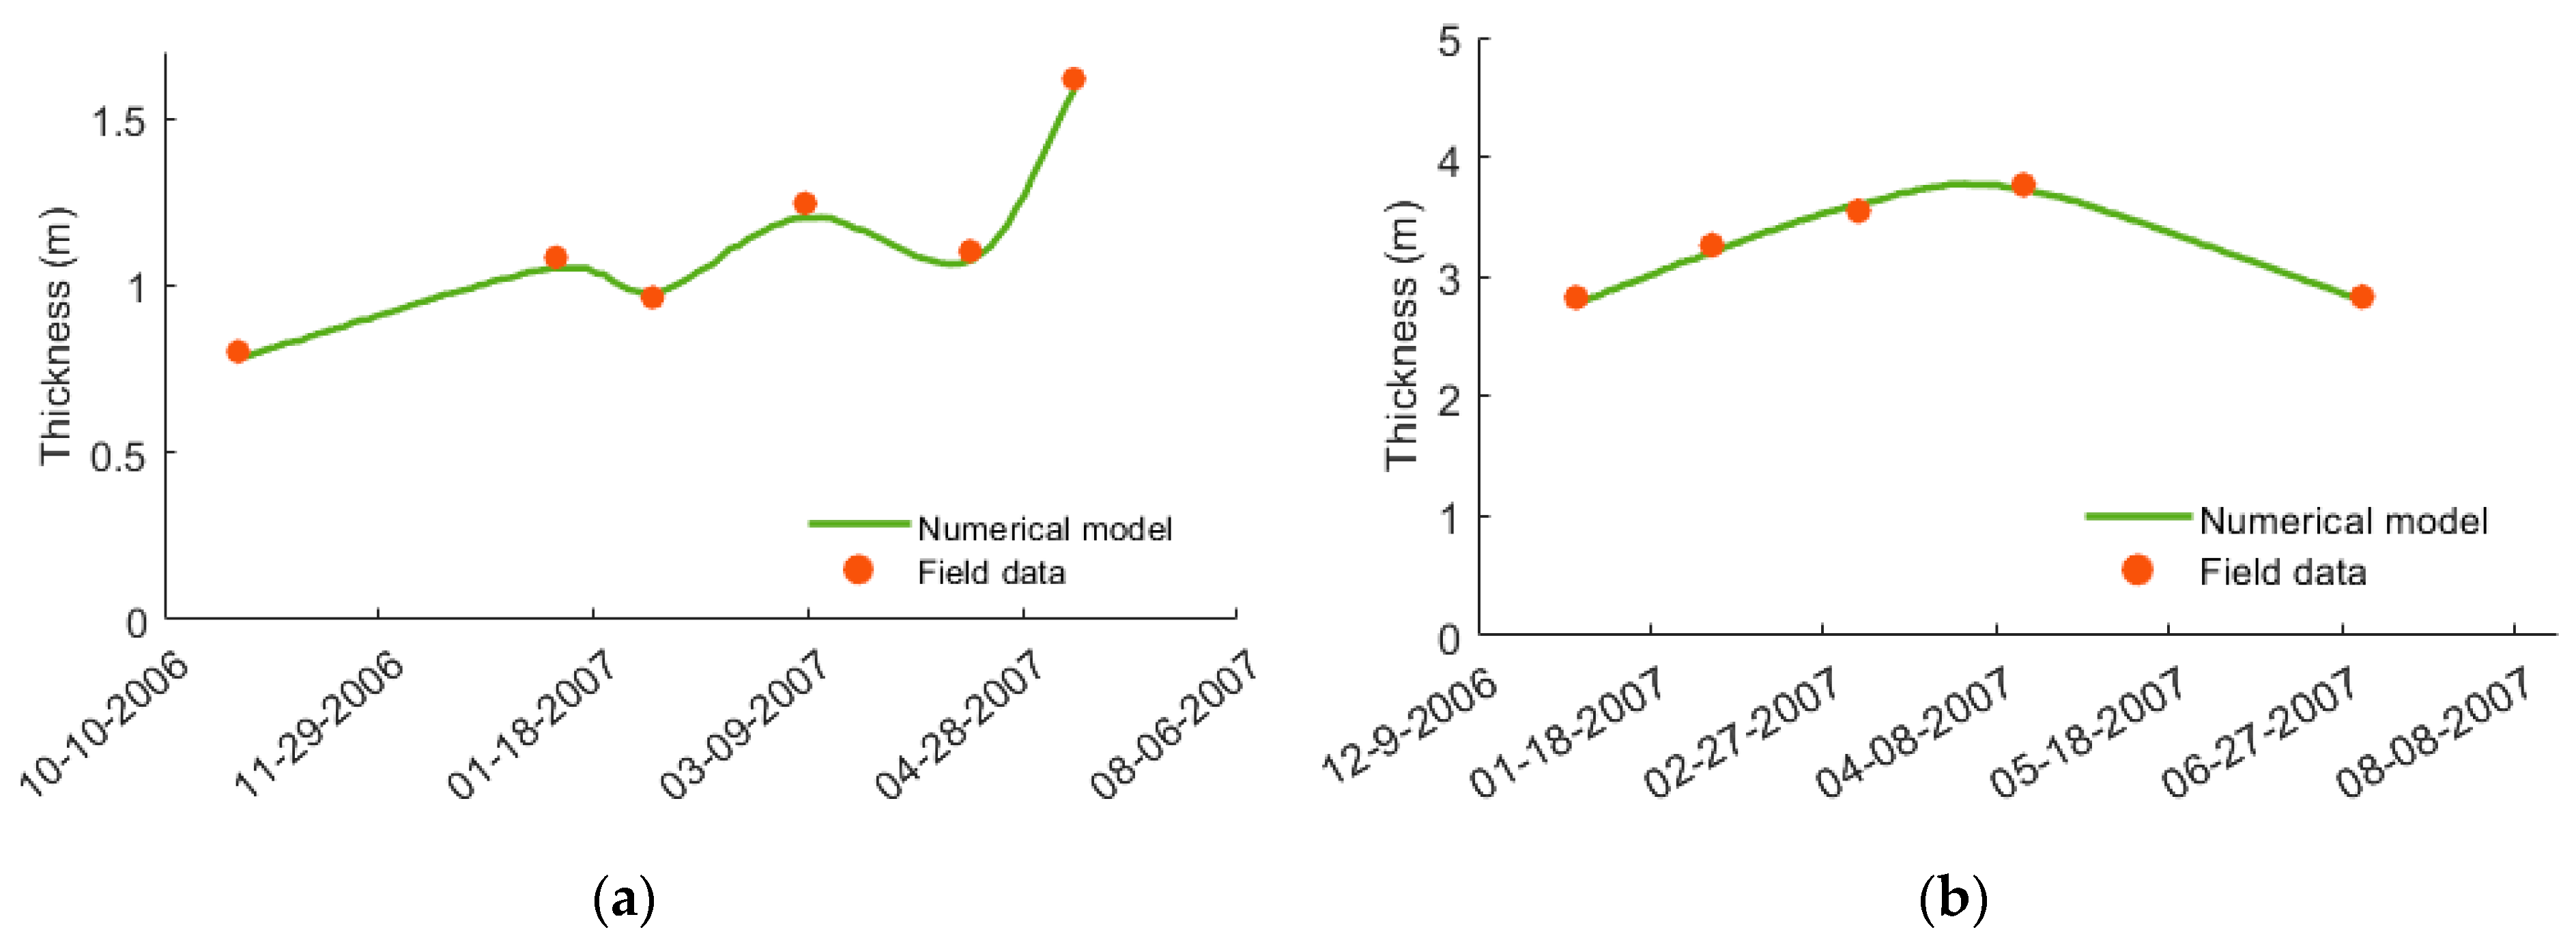
3.2. Model Validation
3.3. Numerical Implementation
3.4. Material Properties
3.5. Boundary and Initial Conditions
4. Results
5. Discussion
6. Separation of Contaminated Zones and Proposing Remediation Strategies
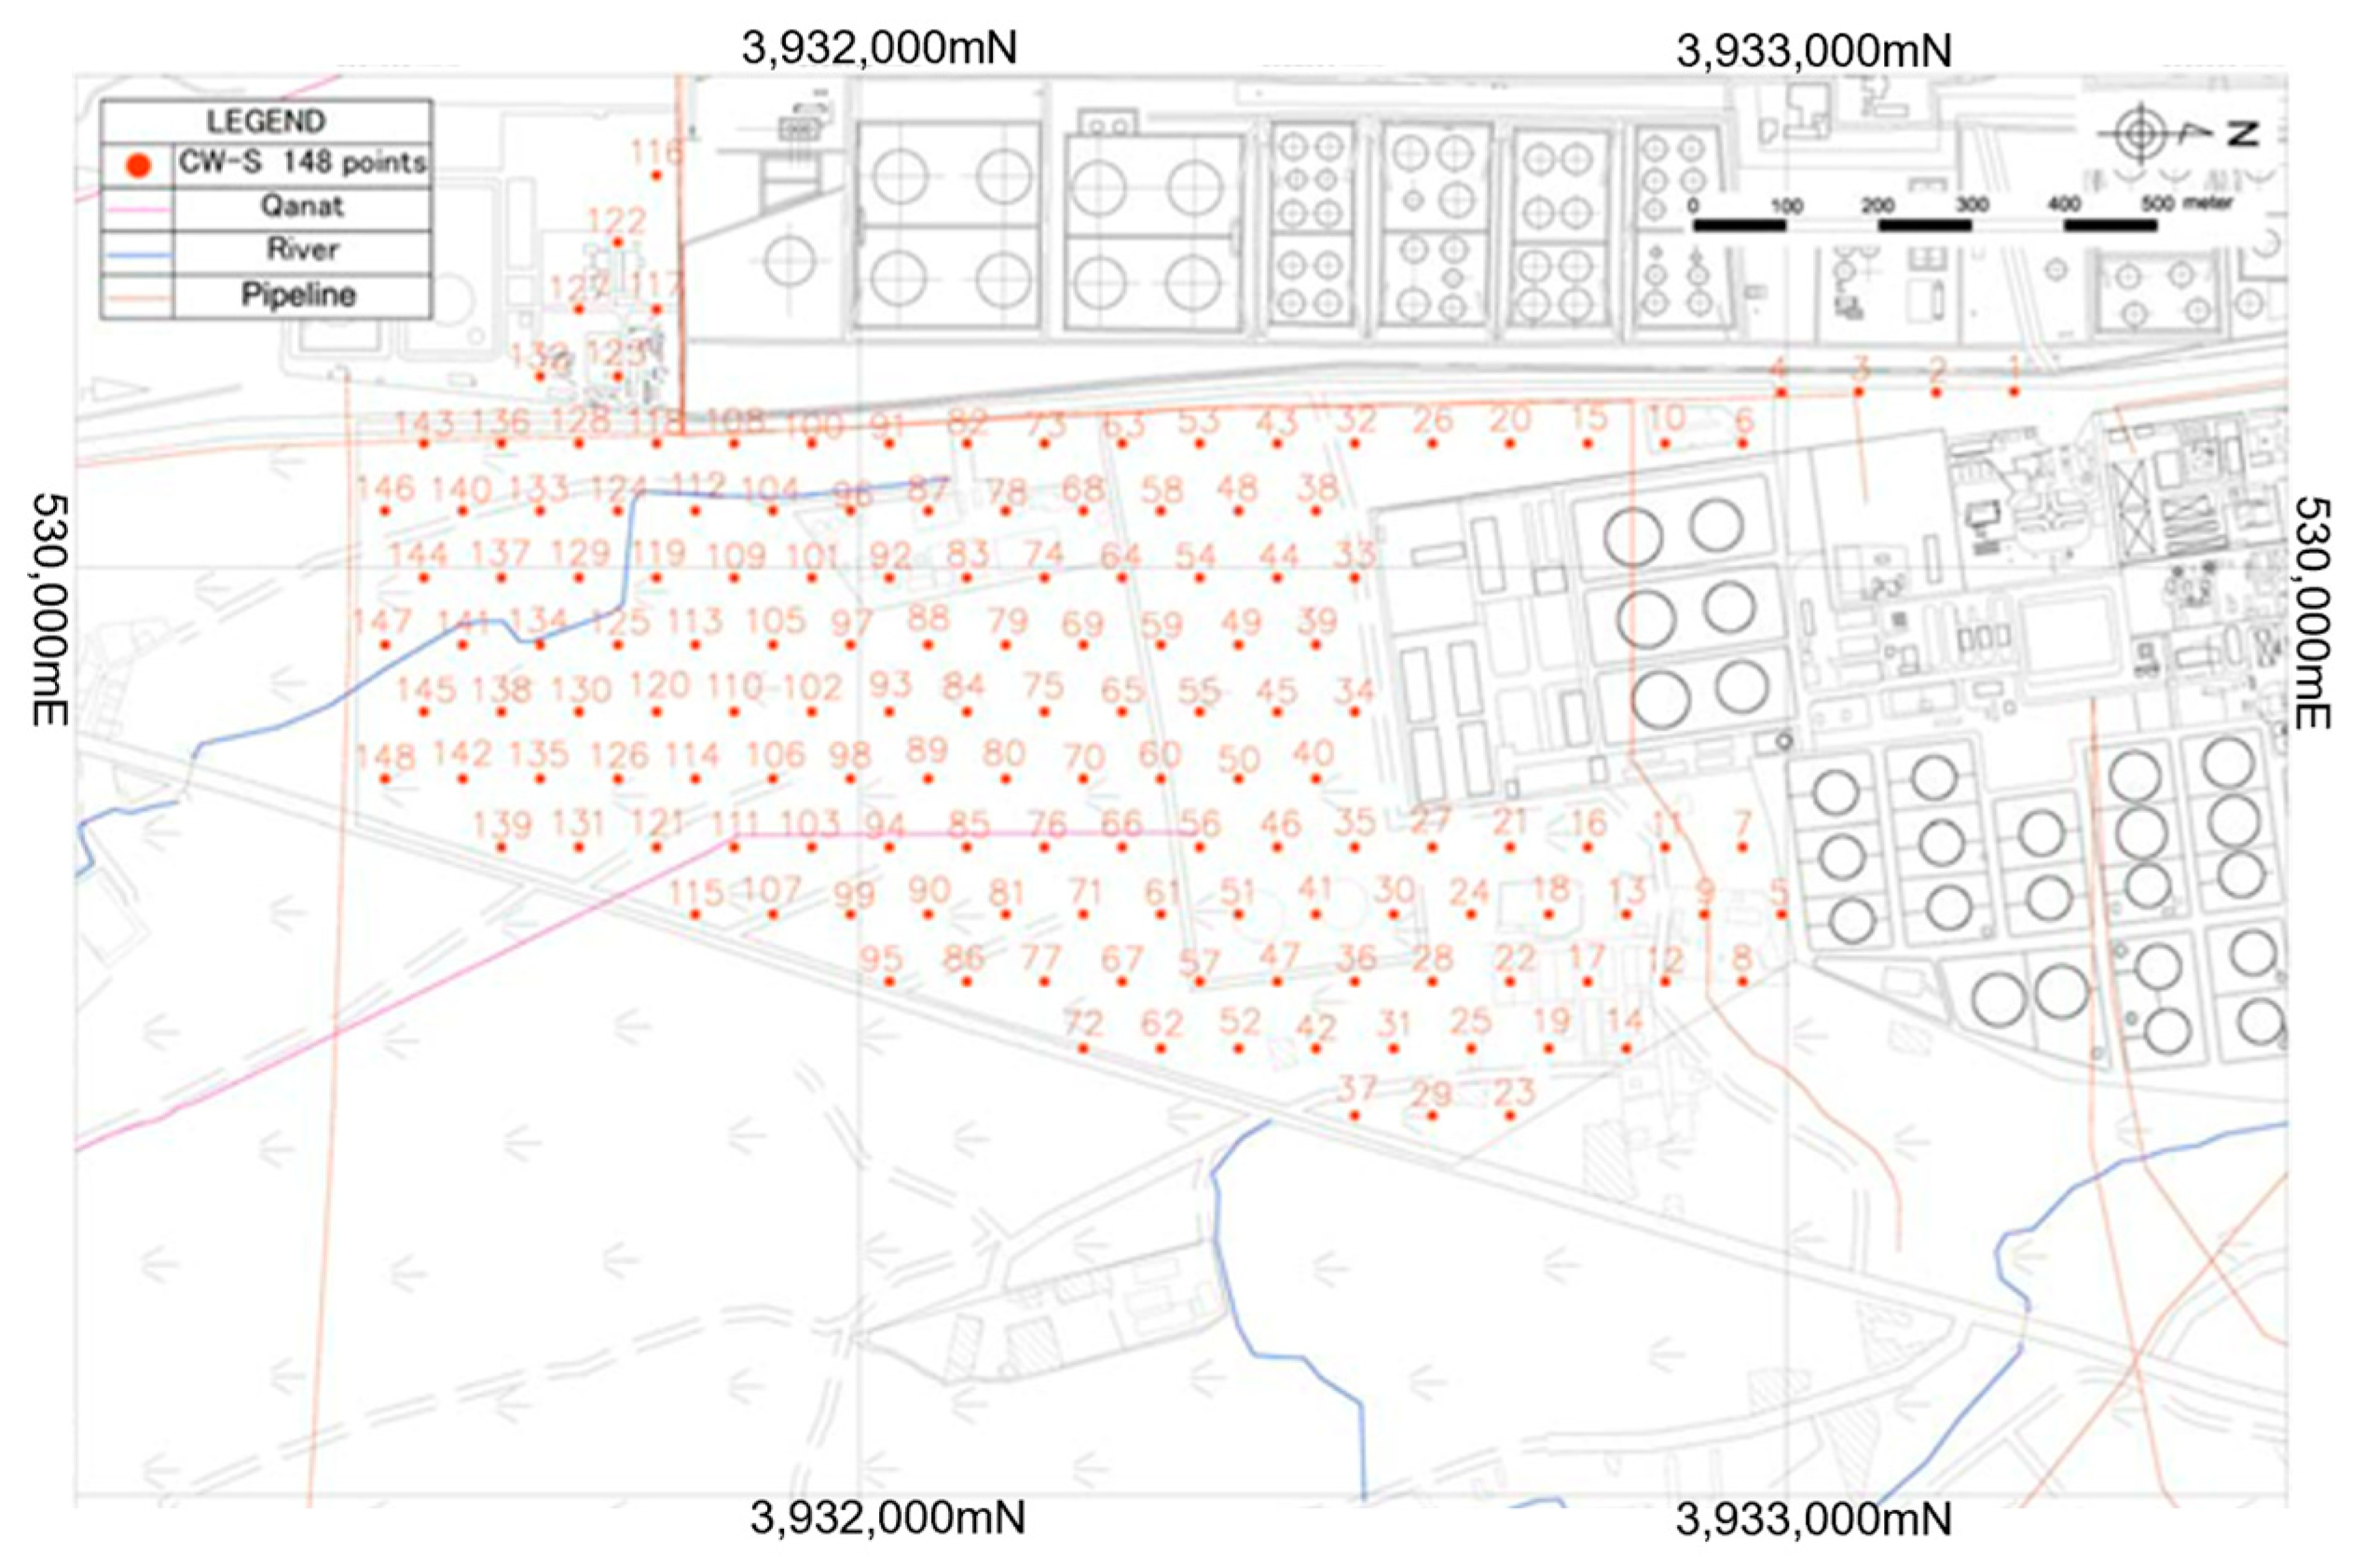
6.1. Oil Collection Well Installation Plan in the Southern Area of REY7
6.2. Pollution Measures in Whole Rey Area
- Agricultural fields: The replacement of contaminated soil with new fertile soil seems practical. The application of any in situ methods is very difficult because of the frequent irrigation that change many remediation parameters. However, the in situ thermal method can be used only in the non-cultivation seasons.
- TORC’s forest: In situ bioremediation is the best choice. Specifically, the existence of the rhizosphere provides an appropriate condition for soil bioremediation.
- Residential and industrial buildings: A controlled and limited in situ bioremediation system can be implemented for residential areas.
- Oil sludge pit fields: In these lands, which include the oil sludge disposal and evaporation ponds, the first action is to improve the waste handling method. Possible leakages from evaporation ponds must be resolved, and further oil sludge disposal in these lands must be prevented.
7. Conclusions
Author Contributions
Funding
Data Availability Statement
Conflicts of Interest
References
- Sun, Y.; Yue, G.; Ma, J. Transport and natural attenuation of benzene vapor from a point source in the vadose zone. Chemosphere 2023, 323, 138222. [Google Scholar] [CrossRef] [PubMed]
- Srivastava, A.; Valsala, R. Numerical modeling to assess the effect of soil texture on transport and attenuation of petroleum hydrocarbons in unsaturated zone. Environ. Sci. Pollut. Res. 2023, 30, 46132–46146. [Google Scholar] [CrossRef] [PubMed]
- Shen, H.; Huang, Y.; Illman, W.A.; Su, Y.; Miao, K. Migration behaviour of LNAPL in fractures filled with porous media: Laboratory experiments and numerical simulations. J. Contam. Hydrol. 2023, 253, 104118. [Google Scholar] [CrossRef] [PubMed]
- Ayass, R.; Mustapha, S.; Salam, D. Quantification of Hydrocarbon Contamination in Soil Using Hyperspectral Data and Deep Learning. In Proceedings of the 8th World Congress on Civil, Structural, and Environmental Engineering (CSEE’23), Lisbon, Portugal, 29–31 March 2023. [Google Scholar] [CrossRef]
- Eldos, H.I.; Zouari, N.; Saeed, S.; Al-Ghouti, M. A Recent advances in the treatment of PAHs in the environment: Application of nanomaterial-based technologies. Arab. J. Chem. 2022, 15, 103918. [Google Scholar] [CrossRef]
- Lakhmanov, D.E.; Kozhevnikov, A.Y.; Pokryshkin, S.A.; Semiletov, I.P.; Kosyakov, D.S. Polycyclic aromatic hydrocarbons in the Siberian Arctic seas sediments. Mar. Pollut. Bull. 2022, 180, 113741. [Google Scholar] [CrossRef]
- Gupta, P.K.; Gandhi, M. Bioremediation of Organic Pollutants in Soil–Water System: A Review. BioTech 2023, 12, 36. [Google Scholar] [CrossRef] [PubMed]
- Guleriaa, A.; Gupta, P.K.; Chakmaa, S.; Yadav, B.K. Temporal moment-based approach to understand the dissolved-phase LNAPL recovery and associated characteristics in the porous system under dynamic groundwater table conditions, AQUA. Water Infrastruct. Ecosyst. Soc. 2023, 72, 479. [Google Scholar] [CrossRef]
- Gupta, P.K.; Yadav, B.; Yadav, B.K. Assessment of LNAPL in subsurface under fluctuating groundwater table using 2D sand tank experiments. J. Environ. Eng. 2019, 145, 04019048. [Google Scholar] [CrossRef]
- Basu, S.; Yadav, B.K.; Mathur, S.; Gupta, P.K. In Situ Bioremediation of Toluene-Polluted Vadose Zone: Integrated Column and Wetland Study. Clean Soil Air Water 2020, 48, 2000118. [Google Scholar] [CrossRef]
- Pishgar, R.; Hettiaratchi, J.P.; Chu, A. Natural source zone depletion (NSZD) quantification techniques: Innovations and future directions. Sustain 2022, 14, 7027. [Google Scholar] [CrossRef]
- Taherdangkoo, R.; Tatomir, A.; Sauter, M. Modeling of methane migration from gas wellbores into shallow groundwater at basin scale. Environ. Earth Sci. 2020, 79, 432. [Google Scholar] [CrossRef]
- Tatomir, A.; McDermott, C.; Bensabat, J.; Class, H.; Edlmann, K.; Taherdangkoo, R.; Sauter, M. Conceptual model development using a generic Features, Events, and Processes (FEP) database for assessing the potential impact of hydraulic fracturing on groundwater aquifers. Adv. Geosci. 2018, 45, 185–192. [Google Scholar] [CrossRef]
- Agah, A.; Doulati Ardejani, F.; Ghoreishi, H. An Assessment of Factors Affecting Reactive Transport of Biodegradable BTEX in an Unconfined Aquifer System, Tehran Oil Refinery, Iran. Int. J. Min. Geo-Eng. 2012, 46, 193–208. [Google Scholar]
- Agah, A.; Doulati Ardejani, F.; Azinfar, M.J. 2D simulation of dynamic transportation of volatile hydrocarbons in vadose zone of tehran oil refinery and industrial area of Ray, Tehran, Iran. J. Min. Environ. 2022, 13, 809–820. [Google Scholar]
- FusioneTechno Solutions Co. Oil Pollution Investigation in the Whole REY Area; FusioneTechno Solutions Co.: Tehran, Iran, 2006. [Google Scholar]
- Corapcioglu, M.Y.; Tuncay, K.; Lingarn, R.; Kambham, K.K. Analytical expressions to estimate the free product recovery in oil-contaminated aquifers. Water Resour. Res. 1994, 30, 3301–3311. [Google Scholar] [CrossRef]
- Lingam, R.; Corapcioglu, M.Y. Two-dimensional analytical solutions for a two-pump free product recovery system. Waste Manag. 1995, 15, 315–323. [Google Scholar] [CrossRef]
- Taherdangkoo, R.; Tatomir, A.; Anighoro, T.; Sauter, M. Modeling fate and transport of hydraulic fracturing fluid in the presence of abandoned wells. J. Contam. Hydrol. 2019, 221, 58–68. [Google Scholar] [CrossRef]
- Gao, H.; Abdullah, H.; Tatomir, A.B.; Karadimitriou, N.K.; Steeb, H.; Zhou, D.; Liu, Q.; Sauter, M. Pore-scale study of the effects of grain size on the capillary-associated interfacial area during primary drainage. J. Hydrol. 2024, 632, 130865. [Google Scholar] [CrossRef]
- Tatomir, A.; Gao, H.; Abdullah, H.; Pötzl, C.; Karadimitriou, N.; Steeb, H.; Licha, T.; Class, H.; Helmig, R.; Sauter, M. Estimation of capillary-associated NAPL-water interfacial areas for unconsolidated porous media by kinetic interface sensitive (KIS) tracer method. Water Resour. Res. 2023, 59, e2023WR035387. [Google Scholar] [CrossRef]


| Parameter | Symbol | Value |
|---|---|---|
| Oil permeability coefficient | Kij | 2.14 × 10⁻⁴ cm/s |
| Void ratio | n | 0.4194 |
| Saturation fraction | S | 80.7% |
| Initial elevation of water table | ηo | 12 m |
| Initial thickness of the oil lens at the well | Lo | 3 m |
| Property | Unit | Value |
|---|---|---|
| Soil porosity () | - | 0.42 |
| Hydraulic conductivity of the water phase () | cm/s | 1.19 × 10⁻⁸ |
| Hydraulic conductivity of the water phase () | cm/s | 8.07 × 10⁻⁶ |
| Diffusion coefficient | m2/s | 1 × 10⁻⁹ |
| Initial elevation of water table () | m | 12 |
| Initial thickness of the oil lens at the well () | m | 3 |
| Oil viscosity () | Pa·s | 0.6 |
| Oil density () | kg/m3 | 800 |
| Water viscosity () | Pa·s | 0.001 |
| Water density () | kg/m3 | 1000 |
| The saturation of non-aqueous phase liquid (NAPL) in the NAPL lens () | - | 0.85 |
| The residual saturation of water () | - | 0.15 |
| The residual saturation of NAPL () | - | 0.05 |
Disclaimer/Publisher’s Note: The statements, opinions and data contained in all publications are solely those of the individual author(s) and contributor(s) and not of MDPI and/or the editor(s). MDPI and/or the editor(s) disclaim responsibility for any injury to people or property resulting from any ideas, methods, instructions or products referred to in the content. |
© 2025 by the authors. Licensee MDPI, Basel, Switzerland. This article is an open access article distributed under the terms and conditions of the Creative Commons Attribution (CC BY) license (https://creativecommons.org/licenses/by/4.0/).
Share and Cite
Agah, A.; Doulati Ardejani, F.; Shehab, M.; Butscher, C.; Taherdangkoo, R. Modeling Hydrocarbon Plume Dynamics in Shallow Groundwater of the Rey Industrial Area, Iran: Implications for Remediation Planning. Water 2025, 17, 1180. https://doi.org/10.3390/w17081180
Agah A, Doulati Ardejani F, Shehab M, Butscher C, Taherdangkoo R. Modeling Hydrocarbon Plume Dynamics in Shallow Groundwater of the Rey Industrial Area, Iran: Implications for Remediation Planning. Water. 2025; 17(8):1180. https://doi.org/10.3390/w17081180
Chicago/Turabian StyleAgah, Azadeh, Faramarz Doulati Ardejani, Muntasir Shehab, Christoph Butscher, and Reza Taherdangkoo. 2025. "Modeling Hydrocarbon Plume Dynamics in Shallow Groundwater of the Rey Industrial Area, Iran: Implications for Remediation Planning" Water 17, no. 8: 1180. https://doi.org/10.3390/w17081180
APA StyleAgah, A., Doulati Ardejani, F., Shehab, M., Butscher, C., & Taherdangkoo, R. (2025). Modeling Hydrocarbon Plume Dynamics in Shallow Groundwater of the Rey Industrial Area, Iran: Implications for Remediation Planning. Water, 17(8), 1180. https://doi.org/10.3390/w17081180