Abstract
Lentic ecosystems are highly vulnerable to anthropogenic disturbances, which can lead to ecological imbalances with the loss of native biodiversity. This research evaluated the impact of anthropogenic activities on water quality and the trophic status of the Pacucha Lagoon, Andahuaylas, Apurimac. Seasonal sampling was conducted at six strategic points on the surface and bottom of the lake, following standardized protocols, during both the dry and rainy seasons. Physical and chemical parameters, metal ions, chlorophyll-a, and trophic status were determined using the Carlson indices, and water quality was assessed through the WQI-PE. The quantification of anthropogenic impacts was performed using the Leopold matrix. Statistical analysis included descriptive methods, ANOVA, Pearson correlation, and PCA at 5% significance. The results classify the lake as having “Regular” water quality according to WQI-PE. Physical and chemical parameters remain within the Environmental Quality Standards (ECA-Peru), while heavy metal ions exceed the limits in both seasons. The system exhibits mesotrophic conditions that tend to become eutrophic during the rainy season, suggesting a favorable nutrient balance for biological productivity. Activities with the most significant adverse impacts include agricultural practices that involve the intensive use of agrochemicals, morphological alterations to the surrounding area, and unregulated aquaculture. The lack of effective regulatory mechanisms and a lack of commitment to conservation suggest a high risk of irreversible degradation of the Pacucha Lagoon ecosystem.
1. Introduction
Water is a fundamental resource that integrates the three pillars of sustainable development: social, economic, and environmental. It is essential for achieving social well-being, stimulating economic growth, and preserving natural ecosystems. To manage this resource effectively, it is necessary to go beyond isolated sectoral approaches and adopt an integrated vision that holistically addresses water challenges [1,2,3].
The quality of surface water, particularly in lakes and reservoirs, is significantly impaired by the process of eutrophication. This phenomenon, primarily caused by excess nutrients from agricultural fertilizers and wastewater, has several adverse effects on aquatic ecosystems [4,5]. Among the most severe consequences are the unchecked growth of algae, the decline in dissolved oxygen levels, and the resulting mortality of aquatic organisms. These changes not only alter the natural balance of ecosystems but also compromise the quality of water for human and animal consumption [6,7,8].
Peru has 12,202 lake systems, which are heterogeneously distributed among its hydrographic basins: Atlantic (61%), Pacific (32%), and Titicaca (7%), representing a significant water resource for national development [9]. However, the efficient management of these ecosystems is limited by the lack of a systematized national inventory and the asymmetric distribution of research efforts. These water bodies face multiple anthropogenic pressures that threaten their ecological integrity, demonstrating the need to implement integrated management strategies based on scientific evidence [10,11].
The Pacucha Lagoon, a high-altitude lake located in the Andahuaylas Province at an elevation of 3200 m, is an ecosystem experiencing increasing anthropogenic pressure due to the development of tourism and recreational activities, which has led to the proliferation of commercial infrastructure around its perimeter. This body of water serves as a significant biological corridor for migratory species, mainly native avifauna, whose diversity has shown alterations in composition, possibly associated with habitat modifications and climatic variations. In addition, aquaculture involving the breeding of trout (Oncorhynchus mykiss) in floating systems and the deliberate introduction of Cyprinus carpio makes a significant contribution to organic matter, which is one of the factors that induce eutrophication processes that affect native aquatic biodiversity.
The basin of influence of the Pacucha Lagoon is characterized by intense agricultural activity, predominantly potato cultivation (Solanum tuberosum), with the intensive use of agrochemicals, without standardized technical protocols. The implementation of irrigation systems has intensified annual agricultural production, increasing the risk of lake body contamination through surface runoff. Although the municipality of Pacucha has implemented environmental management measures, including basic sanitation systems in critical areas and regulations for recreational activities, there is a notable absence of policies governing the control of agrochemicals. There are also mining sites where minerals are extracted legally, formally, illegally, and informally. These activities alter the natural conditions of the soils and lotic water systems, which harm the lake by modifying its qualities, including organic matter, mineral and heavy metal content, physical and chemical properties, and ultimately, the trophic state. This situation has motivated several limnological studies aimed at establishing water quality indices that enable a systematic evaluation of the lake’s ecological status, thereby providing a scientific basis for its sustainable management.
This research was motivated by the increase in anthropogenic activities in the Pacucha Lagoon ecosystem and its surrounding area, including agricultural intensification, the development of diverse economic activities, landscape modification, and the exploitation of natural resources. These environmental pressures affect the physical and chemical quality, as well as the trophic status, of the system, which could compromise the ecological integrity of the ecosystem and its native biodiversity. Therefore, the objective of this study was to evaluate the impact of anthropogenic activities on the water quality of the Pacucha Lagoon during both the rainy and dry seasons.
2. Materials and Methods
2.1. Study Area
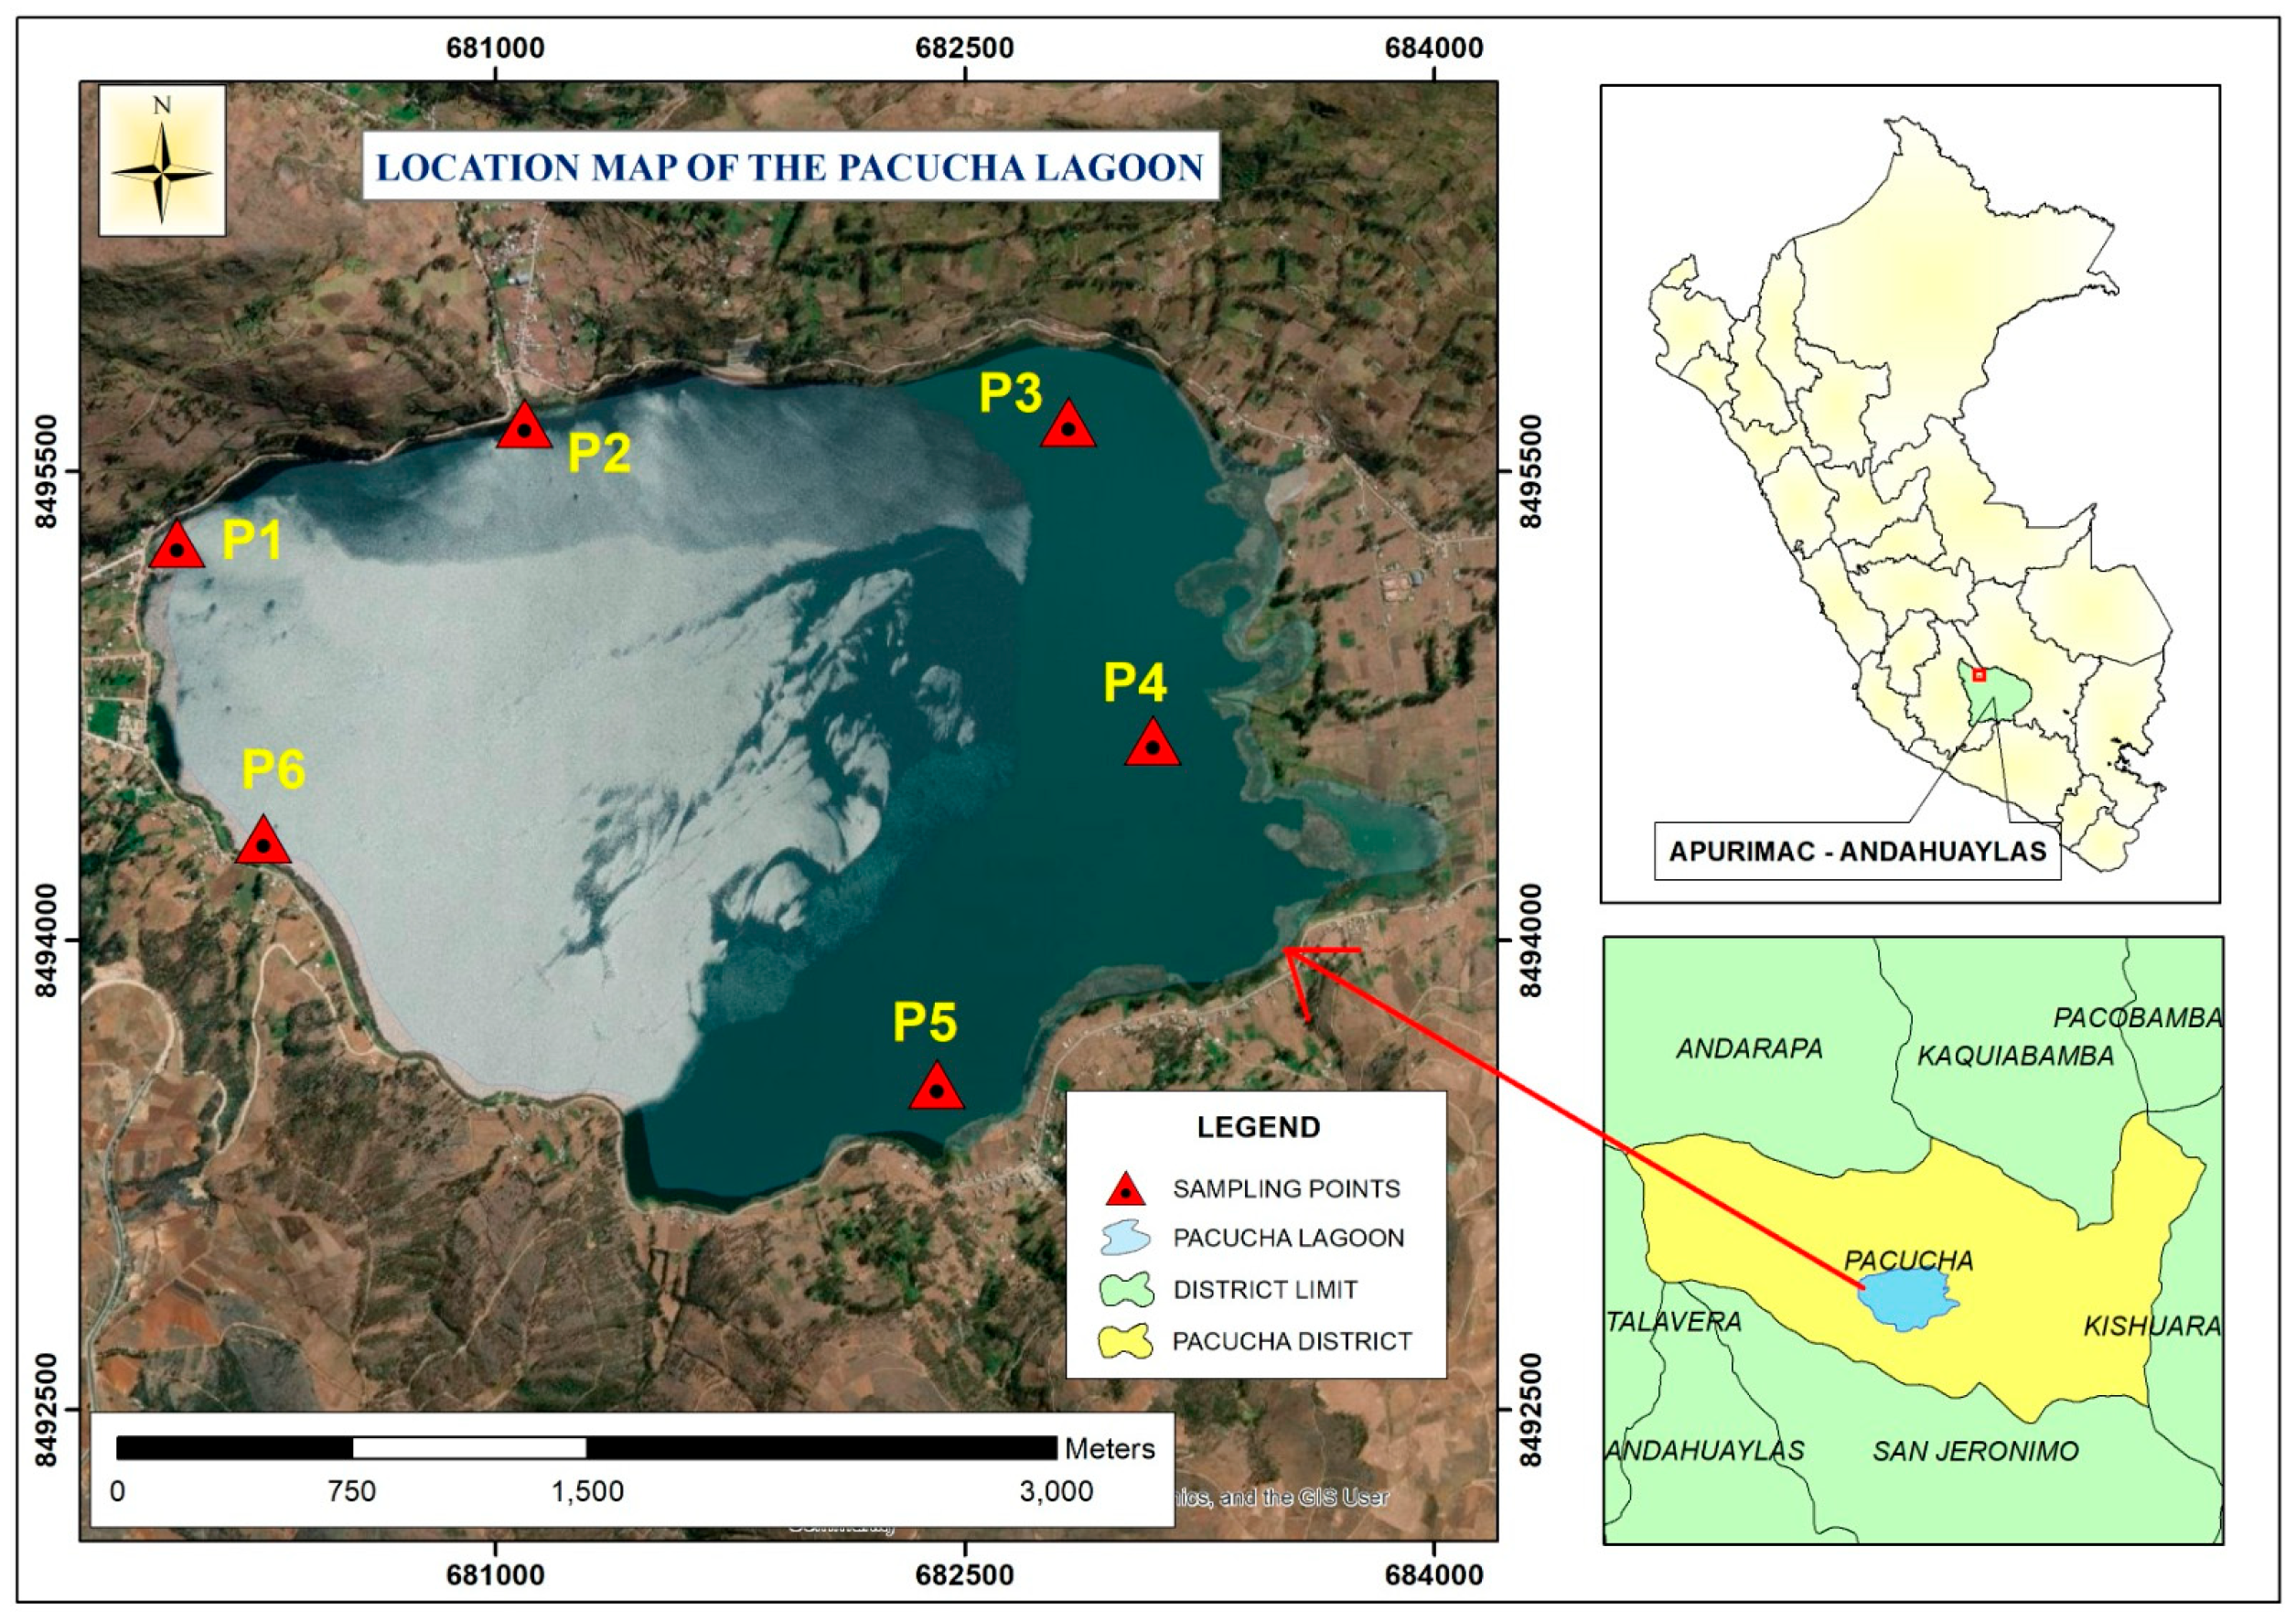
The Pacucha Lagoon, situated in the Pacucha district at a Latitude of −13.609341 and longitude of −73.343893, at an altitude of 3125 m, is located 15 km from the city of Andahuaylas in the Apurimac region, Peru (Figure 1). This lake is characterized by a temperate-cold mountain climate (Cwb according to Köppen), typical of the Peruvian highlands, with an average annual temperature ranging from 5 to 20 °C and cold weather between June and July. It experiences a dry season from May to October and rainfall from November to April, with an average annual rainfall of between 500 and 700 mm. The lake, with a depth ranging from 7.31 to 18.33 m, hosts a variety of native birds and fish, including silversides (Odontesthes bonariensis), as well as introduced species such as trout (Oncorhynchus mykiss) and carp (Cyprinus carpio). It is characterized by its natural beauty and landscape, serving as a center of recreation and leisure for the area’s inhabitants.

Figure 1.
Geographic location of the study area and sampling points.
The study included six sampling points, reflecting the lake’s diverse characteristics (Table 1).

Table 1.
Sampling point description.
2.2. Water Sample Collection
Water samples were collected from the surface and bottom, according to the protocols established by the National Water Authority of Peru [12], during the dry season (September 2024) and the rainy season (December 2024).
2.3. Water Quality Parameter Measurements
Physical and chemical parameters were determined and are listed in Table 2.
Table 2.
Description of water analysis methods.
2.4. Water Quality Index (WQI-PE) Determination
The procedure was carried out according to the methodology proposed by the National Water Authority of Peru [14], which is based on the Canadian method, which allows the free use of water quality parameters. The scope factor F1 (which calculates the ratio between the number of quality parameters that do not meet the values established in the ECA-Peru for category 4 water [15] and the total number of parameters to be evaluated) was determined. Frequency factor F2 (relates the amount of data that does not comply with environmental regulations and the total data of the parameters to be evaluated) and F3 (measures the deviation that exists in the data, determined by the normalized sum of exceedances), according to Equations (1)–(3), respectively.
The normalized sum of surplus (NSS) is determined:
The surplus was determined when the value obtained is greater and/or less than the value established by the ECA-Peru. The WQI-PE was determined by Equation (5), ranging from 0 to 100, and was classified according to the criteria in Table 3.
Table 3.
WQI-PE classification and criteria.
2.5. Chlorophyll Determination
Method 10200H APHA [13] was applied. The samples were homogenized and filtered through a glass filter until saturation, and the filtered volume was noted. The saturated filter was transferred to 10 mL of 90% acetone and stirred until the filter became discolored. The sample was then centrifuged at 4000 rpm for 10 min, followed by wrapping in aluminum foil and storage at 4 °C for 24 h. An aliquot of the supernatant was taken to a UV-Vis spectrophotometer, model UV-1800, Shimadzu (Kyoto, Japan), and readings were made, (i) at 664 and 750 nm, and the absorbance was reported, then, (ii) 300 µL of 0.1 M HCl was added, and mixed by inversion one time, after 3 min, the absorbance reading was made at 665 and 750 nm. Chlorophyll content through Equation (6).
2.6. Trophic State Index (TE) Calculation
To determine the trophic state, the criteria cited in Table 4 were applied, using Equations (7)–(10).
Table 4.
Carlson levels of trophic status in water bodies.
2.7. Evaluation of Environmental Impacts in the Lake
The Leopold matrix was applied, which consisted of four phases [16,17,18].
Phase 1. Preparatory phase: This consisted of identifying four experts in water resources issues to carry out the identification and assessment of risks and impacts on the Pacucha Lagoon.
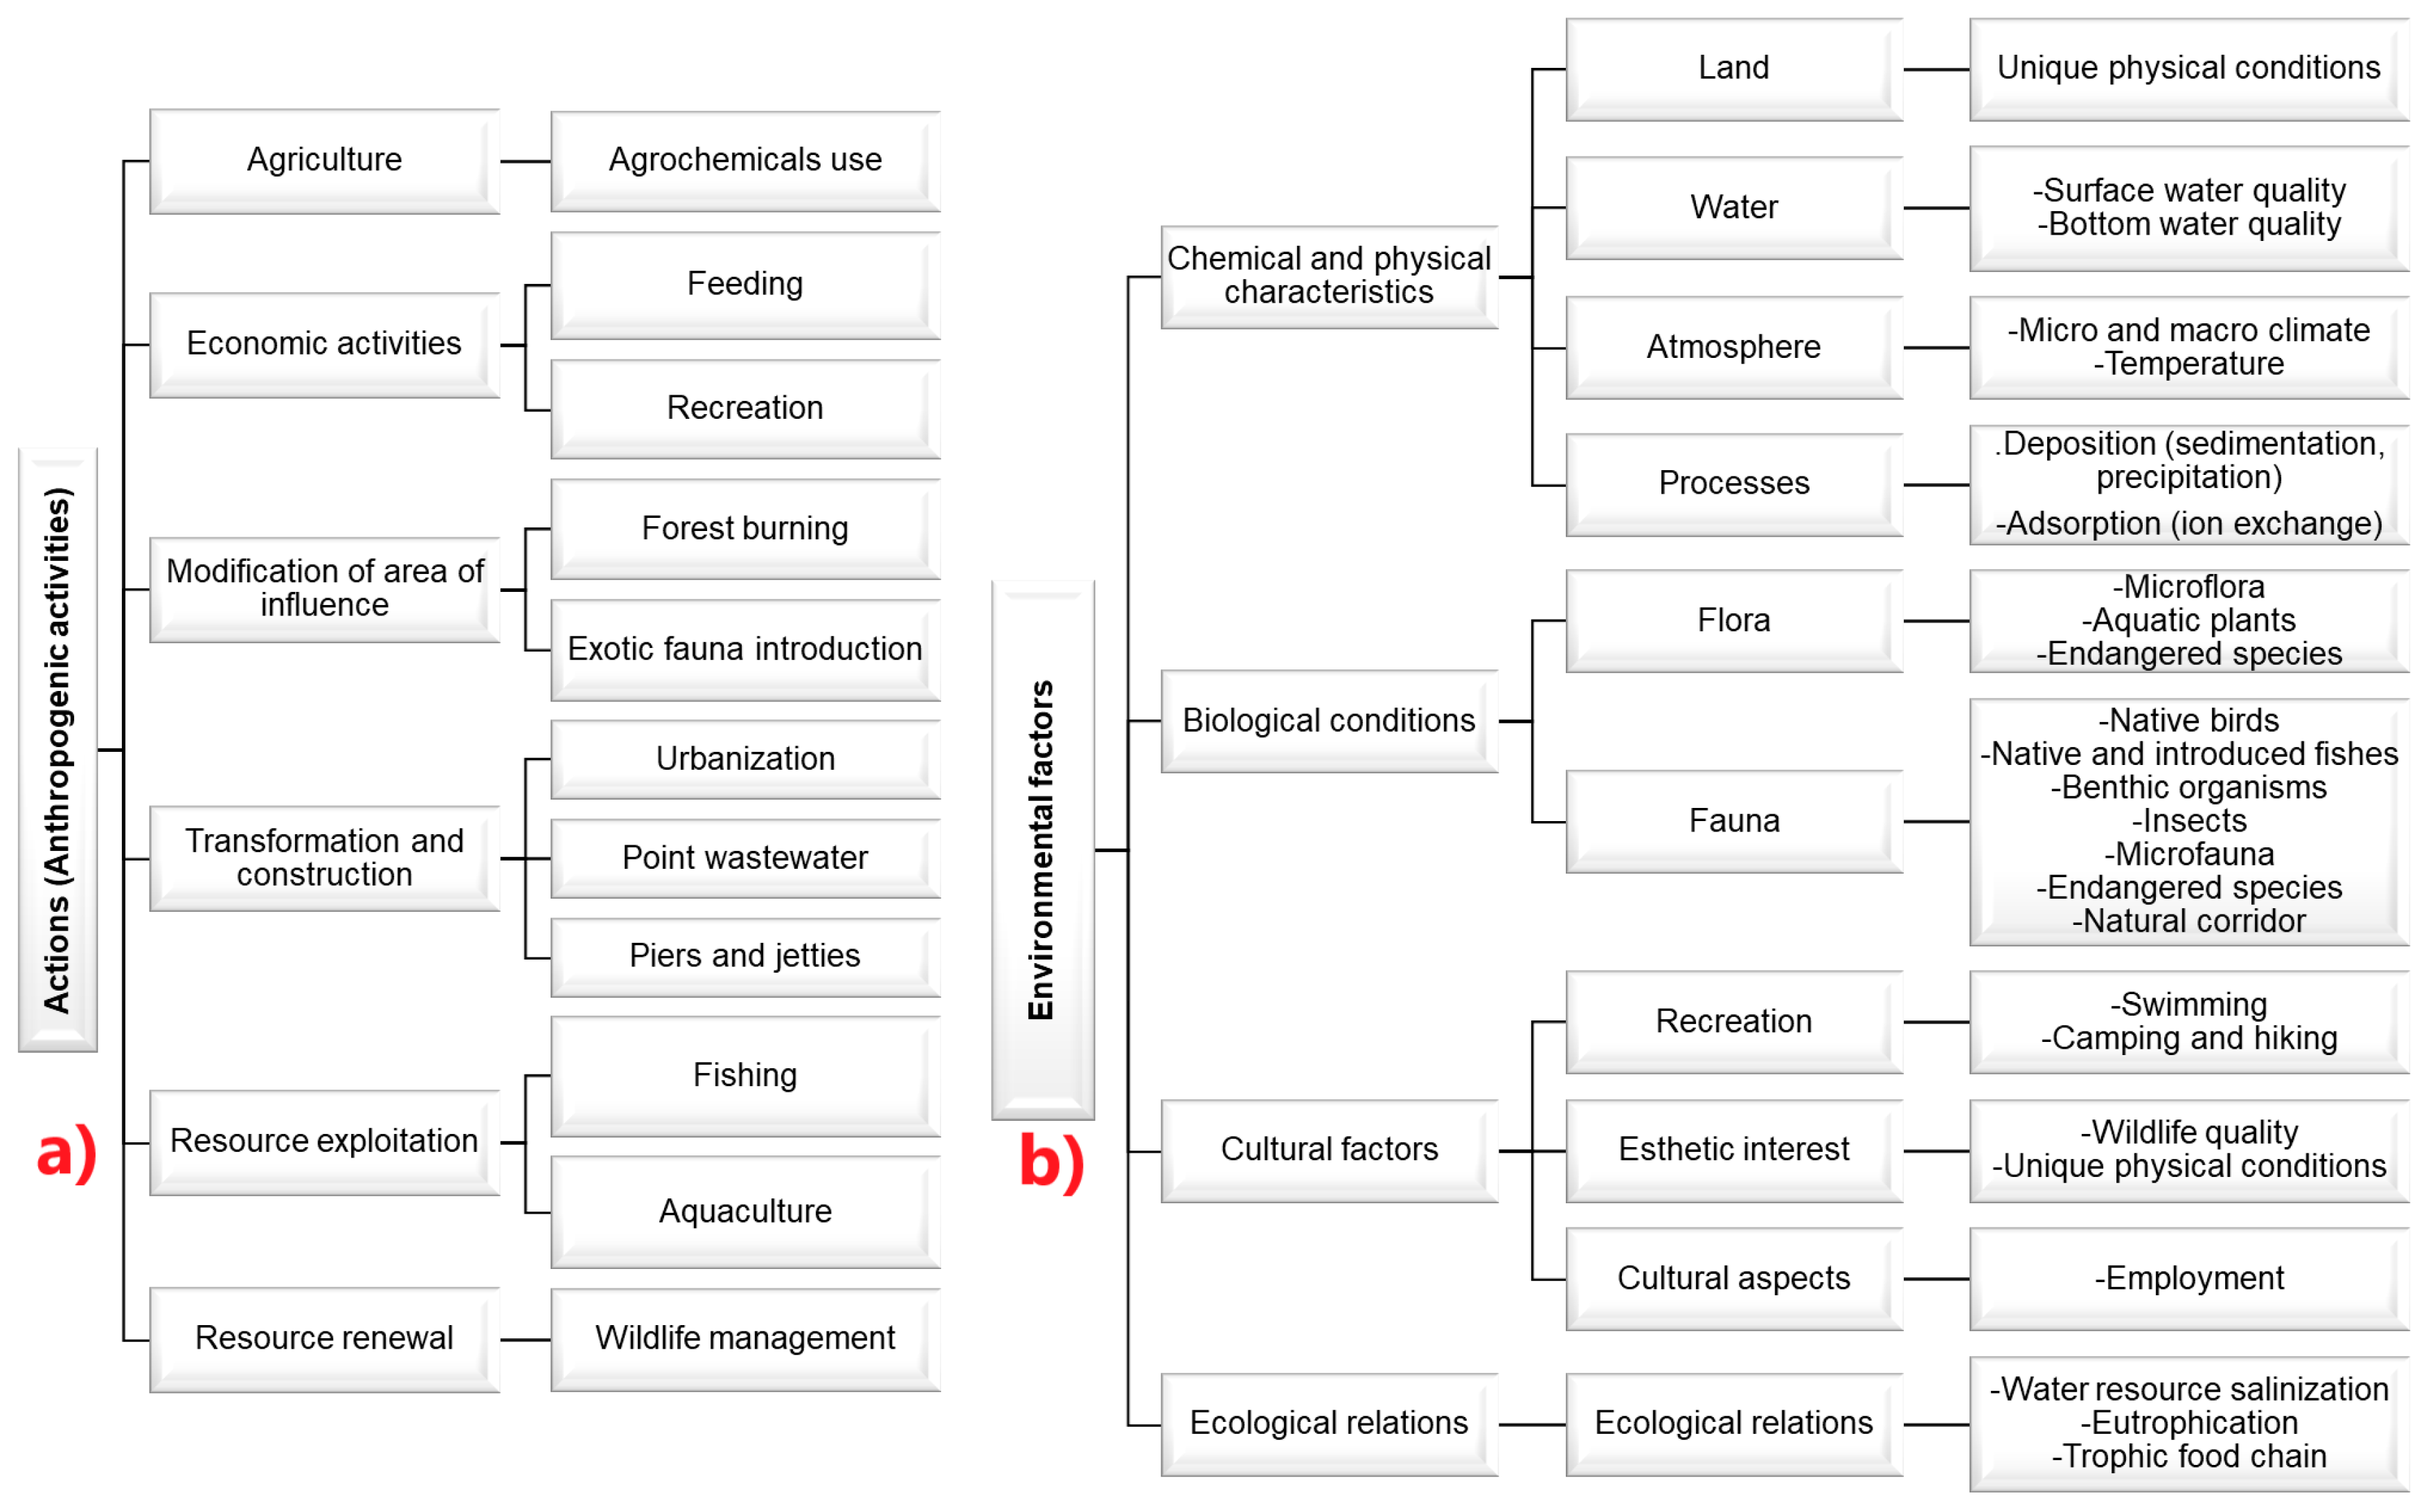
Phase 2. Identification of Causes and Factors: Following an analysis of the causes and factors by experts, the causes or actions of anthropogenic activities (Figure 2a) and relevant environmental factors of Pacucha Lagoon (Figure 2b) were identified and defined, enabling the assessment of environmental impacts.
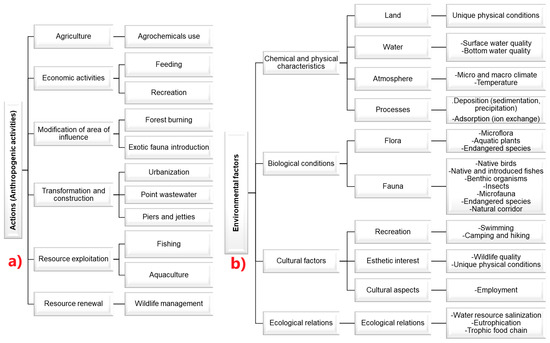
Figure 2.
Identification of (a) actions of anthropogenic activities and (b) environmental factors in the Pacucha Lagoon.
Phase 3. Impact valuation: A calibration of the criteria was conducted with the participation of experts to standardize all aspects of the evaluation of actions and factors, using the Impact Magnitude Score (scale: −10 to +10) and Impact Importance (scale: 1 to 10).
Phase 4. Analysis and evaluation process: The Leopold matrix collects the magnitude and importance of the causes and factors. The results of the environmental impact were determined through Equations (11) and (12).
where M is the magnitude; I is the importance; EIV is the environmental impact value.
2.8. Data Analysis Techniques
Data collection was performed in triplicate and represented through the arithmetic mean, standard deviation, and coefficient of variability, as shown in dynamic tables and graphs. Excel spreadsheets, MINITAB V17, and Origin 2024b statistical software were used. The correlation between physical and chemical parameters was calculated using the Pearson coefficient and analyzed using the CIRCOS graph (https://mk.bcgsc.ca/tableviewer/visualize/, accessed on 15 February 2025), and principal components analysis (PCA) was also performed on the categorized data.
3. Results and Discussion
3.1. Analysis of the Physical and Chemical Parameters of the Lake Water
It was found that the transparency (SD) at the sampling points ranges from 3.61 to 4.81 m in the dry season and in the rainy season between 2.61 and 3.81 m (Table 5), while the turbidity was lower in the dry season, ranging from 1.30 to 2.90 NTU, and in rainy season this increased significantly (p-value < 0.05) ranging from 3.33 to 11.87. Likewise, the TDS decreased considerably in the rainy season (p-value < 0.05). The variation in these parameters has been observed from one season to the next. The punctual and diffuse input of runoff water, containing particulate matter mainly consisting of silt and organic matter, alters the condition of the lake. However, this process is beneficial for the water body in conditions of ecological balance because it provides minerals and nutrients for aquatic life, the excess has adverse effects, because it increases turbidity and TDS and decreases transparency [19,20]. Although the levels found indicate a good state of the Pacucha Lagoon, transparency between 2 and 4 m and turbidity less than 74 NTU are recommended [19,21,22,23]. While for TDS, according to the ECA for category 4, the maximum limit established is 1000 mg/L, higher levels can cause limitations in photosynthetic development, mainly due to humic and fulvic acids derived from the decomposition of aquatic vegetation and runoff, as well as decomposing biogenic compounds, limiting the development of primary organisms [24,25]. However, some legislations tolerate up to 500 mg/L [26,27]. However, low levels of TDS and turbidity, as well as high transparency, may indicate a lack of essential nutrients for the development of aquatic organisms and phytoplankton, resulting in low primary productivity, which negatively affects the food chain, biodiversity, and dependent species, and generally poor lagoon dynamics [7,20].
Electrical conductivity (EC), influenced by the presence of dissolved ions, primarily calcium, magnesium, and nitrates, has a direct impact on aquatic ecosystems. EC was higher during the dry season due to low or no water exchange in the lake. High EC indicates pollution or nutrient loading, which can lead to algal blooms that impact the health of aquatic organisms in the lake [28,29]. According to the ECA, these should not exceed 1000 µS/cm [30], indicating that the Pacucha Lagoon is within the limits set by Peruvian regulations.
On the other hand, the apparent color (AC) of the water was low in the dry season, reaching undetectable values (Table 6), while in the rainy season, it increased to values between 15.67 and 29.67 PCU. This fact is attributed to the presence of dissolved substances (humic and fulvic acids) and suspended particles (dissolved organic matter, phytoplankton, suspended sediments, and even dissolved pollutants), which are found in more significant quantities at the lake’s bottom due to their specific weight [25]. Values above 100 PCU could significantly affect phytoplankton dynamics, aquatic life, and photosynthesis, although this limit has not been established in Peru. The values found suggest that the water of Pacucha is adequate, with a normal balance of suspended and dissolved solids and minimal decomposition of organic matter [25,31].
Table 5.
Values of physical, chemical, TE, and WQI-PE parameters.
Table 5.
Values of physical, chemical, TE, and WQI-PE parameters.
| Season | SD | Tu | TDS | EC | AC | pH | DO | NH4 | NO2− | NO3− | PT | Chlo | TE | WQI-PE | ||
|---|---|---|---|---|---|---|---|---|---|---|---|---|---|---|---|---|
| Surface | Dry | Max | 4.81 | 2.90 | 92.06 | 183.50 | <DL | 7.90 | 5.39 | 1.18 | <DL | <DL | <DL | 6.68 | 44.83 | 59.37 |
| Min | 3.61 | 1.60 | 86.38 | 171.63 | 7.30 | 4.80 | 0.13 | 1.25 | 39.79 | 55.26 | ||||||
| 4.26 | 1.94 | 89.57 | 179.82 | 7.73 | 5.13 | 0.57 | 3.74 | 42.57 | 57.47 | |||||||
| s (±) | 0.43 | 0.48 | 2.23 | 4.61 | 0.22 | 0.22 | 0.42 | 2.12 | 2.07 | 1.64 | ||||||
| CV | 9.97 | 24.99 | 2.50 | 2.56 | 2.86 | 4.29 | 73.132 | 56.7 | 4.86 | 2.86 | ||||||
| Rain | Max | 3.81 | 11.87 | 35.59 | 98.60 | 25.33 | 8.79 | 6.08 | <DL | <DL | <DL | <DL | 25.28 | 52.13 | 53.73 | |
| Min | 2.61 | 3.43 | 13.81 | 35.33 | 15.67 | 8.45 | 5.22 | 8.99 | 47.10 | 50.77 | ||||||
| 3.00 | 6.18 | 21.10 | 72.55 | 19.67 | 8.59 | 5.71 | 18.05 | 49.85 | 52.52 | |||||||
| s (±) | 0.49 | 3.48 | 7.53 | 23.85 | 3.55 | 0.15 | 0.34 | 7.02 | 2.08 | 1.17 | ||||||
| CV | 16.17 | 56.28 | 35.71 | 32.87 | 18.06 | 1.71 | 5.89 | 38.90 | 4.17 | 2.23 | ||||||
| Bottom | Dry | Max | 4.81 | 2.57 | 92.20 | 184.50 | 7.00 | 7.71 | 5.65 | 2.30 | <DL | <DL | <DL | 6.23 | 44.83 | 60.34 |
| Min | 3.61 | 1.30 | 86.59 | 174.13 | 1.00 | 7.60 | 4.83 | 0.27 | 0.89 | 39.79 | 54.17 | |||||
| 4.26 | 1.66 | 90.18 | 181.11 | 3.28 | 7.67 | 5.24 | 0.90 | 3.00 | 42.57 | 56.66 | ||||||
| s (±) | 0.43 | 0.47 | 2.06 | 3.78 | 2.78 | 0.05 | 0.30 | 0.76 | 1.99 | 2.07 | 2.18 | |||||
| CV | 9.97 | 28.31 | 2.29 | 2.09 | 84.94 | 0.61 | 5.74 | 84.42 | 66.44 | 4.86 | 3.85 | |||||
| Rain | Max | 3.81 | 10.90 | 41.97 | 107.05 | 29.67 | 8.66 | 6.08 | 0.09 | <DL | <DL | <DL | 23.85 | 52.13 | 52.80 | |
| Min | 2.61 | 3.33 | 12.64 | 63.72 | 18.00 | 7.72 | 5.30 | 0.01 | 7.83 | 47.10 | 50.32 | |||||
| 3.00 | 5.70 | 21.37 | 87.88 | 22.94 | 8.42 | 5.73 | 0.03 | 16.47 | 49.85 | 51.75 | ||||||
| s (±) | 0.49 | 3.17 | 10.92 | 15.16 | 4.39 | 0.36 | 0.30 | 0.03 | 6.89 | 2.08 | 0.84 | |||||
| CV | 16.17 | 55.61 | 51.10 | 17.25 | 19.13 | 4.29 | 5.28 | 125.0 | 41.83 | 4.17 | 1.61 | |||||
| DL | --- | 0.10 | 1.00 | 1.00 | 1.00 | 0.01 | 0.10 | 0.01 | 0.001 | 0.10 | 0.01 | --- | Mesotrophic | Regular | ||
| ECA | --- | 100 | 1000 | 1000 | 20.0 | 6.5 | 5.0 | 2.2 | 10.0 | 13.0 | 0.035 | 8.00 | ||||
| Category * | --- | 1.B | 1.B | 4 | 4 | 4 | 4 | 4 | 3.D2 | 4 | 4 | 4 | ||||
Note: Where SD, Secchi disk transparency; Tu, turbidity; TDS, total dissolved solids; EC, electrical conductivity; AC, apparent color; DO, dissolved oxygen; PT, total phosphorus; Chlo, chlorophyll a; TE, trophic state; WQI-PE, water quality index in Peru; Max, maximum value; Min, minimum value; , arithmetic mean; s, standard deviation; CV, coefficient of variability; DL, detection limit; ECA, water quality standard. * Referring to the category to which it belongs according to the ECA [30].
Table 6.
Ion values in lake water.
Table 6.
Ion values in lake water.
| Season | Metal Ion | Mineral Ion | Heavy Metal Ion | ||||||||||||||||
|---|---|---|---|---|---|---|---|---|---|---|---|---|---|---|---|---|---|---|---|
| Al | Cu | Ba | Be | Mn | V | Ca | Mg | K | Na | Si | As | B | Pb | Sb | Se | Tl | |||
| Surface | Dry | Max | 0.195 | 0.016 | 0.013 | 0.002 | 0.141 | 0.013 | 15.81 | 2.70 | 1.357 | 2.789 | 0.714 | 0.161 | 0.030 | 0.050 | 0.140 | 0.160 | 0.021 |
| Min | 0.168 | 0.011 | 0.010 | 0.001 | 0.134 | 0.006 | 14.90 | 2.49 | 1.235 | 2.386 | 0.152 | 0.141 | 0.025 | 0.043 | 0.113 | 0.127 | 0.009 | ||
| 0.178 | 0.013 | 0.012 | 0.002 | 0.137 | 0.009 | 15.29 | 2.63 | 1.290 | 2.514 | 0.375 | 0.149 | 0.027 | 0.048 | 0.126 | 0.143 | 0.014 | |||
| s (±) | 0.010 | 0.002 | 0.001 | 0.001 | 0.003 | 0.003 | 0.35 | 0.09 | 0.048 | 0.156 | 0.235 | 0.007 | 0.002 | 0.003 | 0.009 | 0.012 | 0.005 | ||
| CV | 5.39 | 13.69 | 9.30 | 31.46 | 1.90 | 27.29 | 2.29 | 3.26 | 3.69 | 6.19 | 62.62 | 4.78 | 6.058 | 5.696 | 7.174 | 8.056 | 38.66 | ||
| Rain | Max | 1.135 | 0.023 | 0.194 | <DL | 0.298 | 0.010 | 41.34 | 9.63 | 4.713 | 6.200 | 1.344 | 0.298 | 0.046 | 0.077 | 0.280 | 0.283 | 0.035 | |
| Min | 0.464 | 0.016 | 0.052 | 0.266 | 0.008 | 38.97 | 9.17 | 4.291 | 5.892 | 0.950 | 0.262 | 0.040 | 0.063 | 0.240 | 0.257 | 0.004 | |||
| 0.581 | 0.020 | 0.077 | 0.284 | 0.009 | 40.13 | 9.33 | 4.473 | 6.028 | 1.143 | 0.279 | 0.042 | 0.073 | 0.258 | 0.267 | 0.018 | ||||
| s (±) | 0.271 | 0.003 | 0.057 | 0.012 | 0.001 | 0.913 | 0.17 | 0.151 | 0.126 | 0.139 | 0.013 | 0.002 | 0.005 | 0.013 | 0.009 | 0.011 | |||
| CV | 46.69 | 15.03 | 73.86 | 4.19 | 10.97 | 2.27 | 1.77 | 3.38 | 2.08 | 12.18 | 4.55 | 4.734 | 6.742 | 5.019 | 3.446 | 63.54 | |||
| Bottom | Dry | Max | 0.189 | 0.015 | 0.013 | 0.002 | 0.138 | 0.012 | 15.34 | 2.67 | 1.338 | 2.723 | 0.733 | 0.161 | 0.033 | 0.063 | 0.145 | 0.168 | 0.025 |
| Min | 0.169 | 0.013 | 0.010 | 0.001 | 0.132 | 0.007 | 14.98 | 2.54 | 1.228 | 2.149 | 0.207 | 0.146 | 0.027 | 0.053 | 0.133 | 0.132 | 0.003 | ||
| 0.181 | 0.014 | 0.012 | 0.002 | 0.135 | 0.010 | 15.19 | 2.62 | 1.298 | 2.408 | 0.485 | 0.152 | 0.029 | 0.057 | 0.138 | 0.150 | 0.014 | |||
| s (±) | 0.007 | 0.001 | 0.001 | 0.001 | 0.003 | 0.002 | 0.157 | 0.06 | 0.039 | 0.228 | 0.184 | 0.006 | 0.002 | 0.004 | 0.004 | 0.015 | 0.008 | ||
| CV | 4.07 | 7.38 | 6.44 | 33.28 | 2.01 | 21.91 | 1.04 | 2.17 | 3.00 | 9.45 | 37.91 | 4.14 | 6.59 | 6.81 | 3.08 | 10.30 | 58.56 | ||
| Rain | Max | 1.622 | 0.021 | 0.205 | <DL | 0.285 | 0.012 | 40.61 | 9.65 | 4.558 | 6.151 | 1.397 | 0.289 | 0.044 | 0.077 | 0.273 | 0.287 | 0.040 | |
| Min | 0.455 | 0.017 | 0.053 | 0.273 | 0.007 | 39.08 | 9.13 | 4.411 | 5.853 | 0.955 | 0.270 | 0.040 | 0.067 | 0.240 | 0.250 | 0.014 | |||
| 0.661 | 0.019 | 0.079 | 0.278 | 0.010 | 39.92 | 9.31 | 4.485 | 6.015 | 1.151 | 0.279 | 0.042 | 0.070 | 0.259 | 0.273 | 0.025 | ||||
| s (±) | 0.471 | 0.001 | 0.061 | 0.004 | 0.002 | 0.599 | 0.20 | 0.051 | 0.117 | 0.146 | 0.006 | 0.001 | 0.004 | 0.014 | 0.012 | 0.009 | |||
| CV | 71.33 | 6.80 | 77.26 | 1.44 | 19.69 | 1.50 | 2.16 | 1.14 | 1.95 | 12.69 | 2.25 | 2.93 | 5.22 | 5.44 | 4.53 | 37.19 | |||
| DL | 0.010 | 0.001 | 0.001 | 0.001 | 0.001 | 0.001 | 0.001 | 0.001 | 0.001 | 0.001 | 0.001 | 0.010 | 0.001 | 0.010 | 0.010 | 0.010 | 0.010 | ||
| ECA | 5.00 | 0.10 | 0.70 | 0.10 | 0.20 | 0.10 | --- | 250.0 | --- | --- | --- | 0.150 | 0.75 | 0.003 | 0.640 | 0.005 | 0.001 | ||
| Category * | 3.D2 | 4 | 4 | 3.D2 | 3.D2 | 1.B | --- | 3.D2 | --- | --- | --- | 4 | 2.C4 | 4 | 4 | 4 | 4 | ||
Note: where Max, maximum value; Min, minimum value; , arithmetic mean; s, standard deviation; CV, coefficient of variability; DL, detection limit; ECA, water quality standard. * Referring to the category to which it belongs according to the ECA [30].
The pH levels were found to be between 7.30 and 7.90 during the dry season, while in the rainy season, the pH increased to 8.79 (p-value < 0.05). No significant difference was observed between the pH of the surface and the bottom of the lake (p-value > 0.05) in either season. Values between 6.5 and 9.0 are indicators of a good condition of the water body [15]. Below this interval, it may cause higher solubility of salts and minerals, generating excess ions. In contrast, higher values may cause stress to aquatic fauna and flora due to the decreased availability of essential nutrients such as phosphorus [32].
DO levels during the dry season ranged from 4.80 to 5.65 mg O2/L (Table 5), increasing slightly during rainfall. The levels found suggest that the lake water is in adequate condition for biological productivity such as photosynthesis and respiration of aquatic fauna [33,34].
Regarding total ammonium, higher concentrations were observed during the dry season and at the bottom of the lake. In contrast, during rainfall, the concentration decreased considerably, with most points falling below the detection limit. The same occurred for nitrite, nitrate, and total phosphorus. This indicates a good balance of nitrifying bacteria, aquatic plants, and algae with the organic matter present, which converts all nitrogen sources into protein. It is also an indication of low or no contamination by external agents (sewage, detergents, and agricultural fertilizers), which favors a lower risk of eutrophication, clearer and more transparent waters, better oxygenation of the medium, and reduce proliferation of aquatic plants and algae. However, it may be associated with disadvantages, such as low phytoplankton growth, a reduction in primary productivity, a decrease in biodiversity, and an impact on the aquatic trophic chain [35,36,37].
Chlorophyll a was found between 0.89 and 6.68 µg/L in the dry season and increased considerably in rainfall to 25.28 µg/L (p-value < 0.05) (Table 5); however, levels decreased slightly at the bottom of the lake (hypolimnion), this would be due to the absence or decrease in light, resulting in lower photosynthesis (p-value < 0.05) (Table 6), this condition could cause phytoplankton migration in search of nutrients, leading to changes in species composition and biomass [38,39]. The higher availability of organic matter is due to rainfall, which incorporates nitrogen and phosphorus from the runoff of anthropogenic activities around the lake, including the river (point source-around P4) that enters the lake, crosses villages that have little or no basic sanitation, and whose wastewater is discharged into this river. This parameter serves as a primary indicator of phytoplankton biomass and general water quality while also being linked to trophic chains as a primary producer. The presence and concentration of this parameter are related to the abundance of algae and cyanobacteria [40].
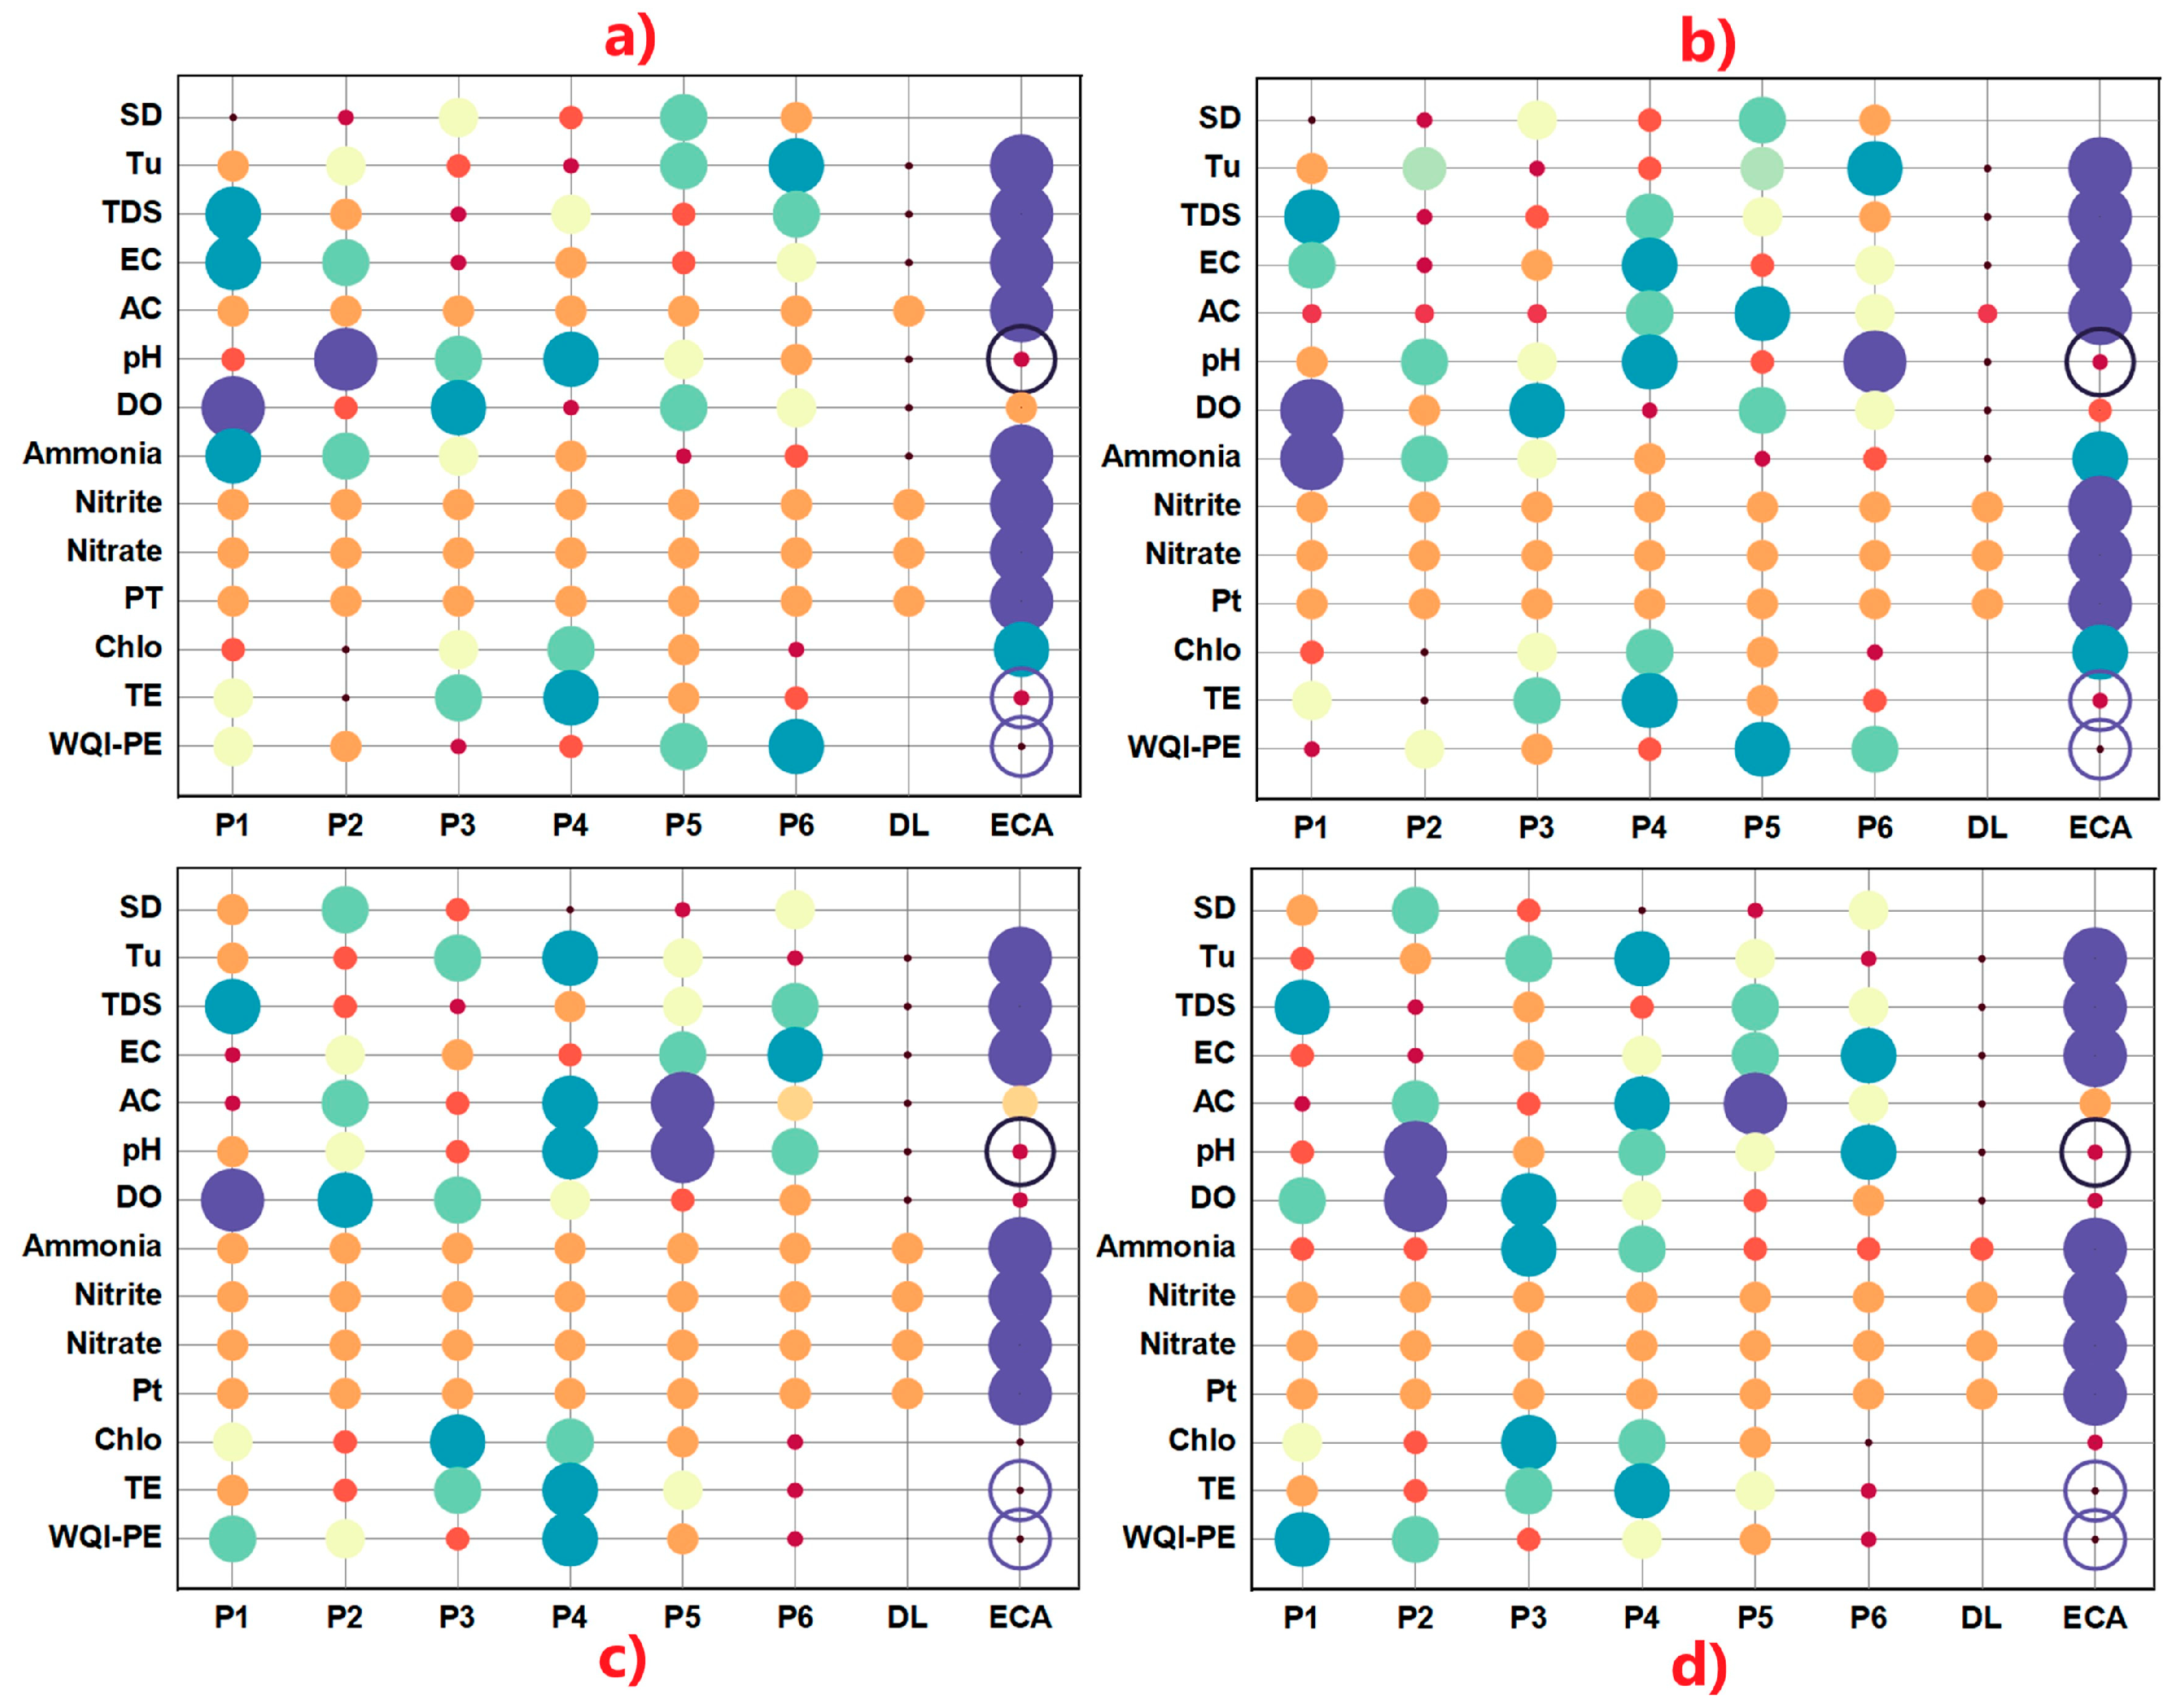
The points with the highest levels of physical and chemical parameters studied are P1, P2, P4, and P5 in the low water season on the surface and bottom (Figure 3a,b), this is due to the different anthropogenic activities that take place around them, such as commerce and recreation (in P1); in P2 there is stagnant water with low depth, high presence of cattails and domestic animals, P4 discharge of the tributary and P5 discharge area of runoff from agricultural fields. At the same time, P4 rainfall is more affected (Figure 3c,d). Understanding the critical and normal values of physical and chemical parameters is essential to monitoring water quality and ensuring the sustainability of the ecosystem [32].

Figure 3.
Variation in the levels of physical and chemical parameters, trophic state, and quality index in the sampling points, (a) surface in the dry season, (b) bottom in the dry season, (c) surface in the rainy season, and (d) bottom in the rainy season. The color and size of the circles indicate the magnitude of the parameter, compared to the ECA.
3.2. Analysis of Metal Ions in the Water
Ca was found at approximately 15 mg/L during the dry season (Table 6), increasing significantly with rainfall to approximately 40 mg/L (p-value < 0.05). Similarly, Mg increased from around 2.5 mg/L to 9.0 mg/L. Likewise, an increase in the minerals K, Na, and Si was observed. These minerals play a crucial role in the health and productivity of aquatic ecosystems, as they are essential for cellular processes, enzymatic functions, and maintaining osmotic balance in aquatic organisms, particularly macroinvertebrates. The ECA does not consider a limit value, it is suggested that acceptable values between 10 and 200 mg/L for Ca, 5–100 mg/L for Mg, 20–500 mg/L for Na, 2–100 mg/L for K, and 1–50 mg/L for Si, for the normal development of aquatic biota [41,42,43,44].
Regarding metal ions, it was observed that Al increased from 0.168 to 0.483 mg/L from dry season to rainfall (Table 6), although no significant differences were observed between sampling points (Figure 4). This increase between seasons would be due to the erosion processes of the soils surrounding the lake, as mining extraction activities are carried out in the basin. The ECA-Peru does not establish limits for this metal; however, values higher than 0.20 mg/L could interfere with the transport of other ions in aquatic organisms and increase the mortality of eggs and larvae [44,45]. As for Cu, it increases slightly from 0.011 to 0.023 mg/L from the dry season to rainfall; these values are well below the ECA (0.10 mg/L). This trace element is an essential micronutrient for phytoplankton, playing a crucial role in electron transport during photosynthesis [45].
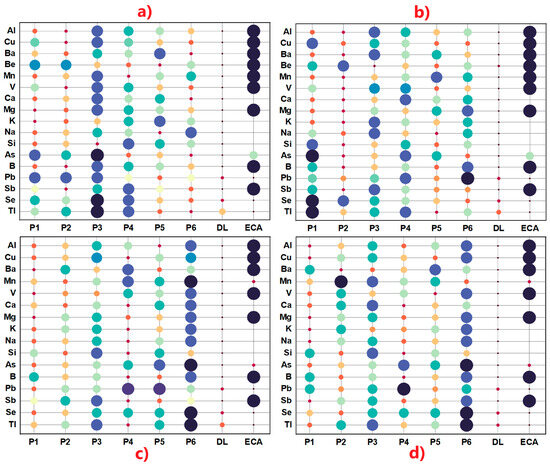
Figure 4.
Variation in the level of metal ions in the sampling points: (a) surface in the dry season, (b) bottom in the dry season, (c) surface in the rainy season, and (d) bottom in the rainy season. The color and size of the circles indicate the magnitude of the parameter, compared to the ECA.
Ba was 0.011 mg/L in the dry season and increased to 0.055 mg/L in the rainy season, not exceeding the limit established by the ECA (0.70 mg/L). This ion is essential for sulfate regulation, influences mineral precipitation processes, and contributes to the biogeochemical cycles of the ecosystem; its excess could affect the nervous system of the fauna [45,46]. Be was observed only in the dry season, with a maximum value of 0.002 mg/L (Table 6). Although it has no significant biological functions, some regulations indicate a maximum reference value of 0.004 mg/L [47,48].
Mn was found at 0.141 mg/L during the dry season, while in the rainy season, it increased to 0.298 mg/L. This trace element is essential for photosynthesis, the activation of numerous enzymes, oxidation–reduction cycles, and the decomposition of organic matter. ECA does not establish a maximum value. However, values above 0.50 mg/L could interfere with water coloration, damage fish gills, and cause developmental problems in the invertebrates [47]. On the other hand, V was found at 0.006 mg/L during the dry season and increased to 0.012 mg/L during the rainy season; this ion is involved in biological nitrogen fixation, primarily in algae, and lipid metabolism in certain organisms. The ECA does not establish nominal values; however, levels higher than 0.10 mg/L could cause alterations in lipid metabolism and inhibit growth [44,46,47].
The levels of heavy metal ions As, B, Pb, Sb, Se, and Tl increased significantly during the rainy season; these values exceed the nominal values established by ECA-Peru [15], except for Sb, which does not exceed them. These ions perform essential functions in biological systems at levels below the nominal. Se is indispensable to antioxidant functions, As participates in biogeochemical cycles, and B participates in carbohydrate metabolism. However, in excess, these ions are not only toxic but also bioaccumulative, causing problems in the trophic chain, alterations in the biochemistry of the water body, tissue damage, reproductive decline, and genetic changes in the biota [49]. This excess in the Pacucha Lagoon is due to the runoff of leachate eroded from the soils surrounding the lake since the area of influence of the Pacucha basin is eminently mining, composed mainly of iron and copper, and these minerals are associated with heavy metal ions, as well as the residues of agrochemicals used indiscriminately [29,45,50,51,52].
On the other hand, the metal ions Ag, Be, Cd, Co, Cr, Fe, Hg, Mo, Ni, Ti, and Zn, as well as P (non-metal), were found below the detection limits (DL = 0.0010 mg/L). Although P, Fe, Zn, Mo, and Co ions are essential for the development of aquatic biota, Hg, Cd, Cr, Ni, and Ag ions are highly toxic to them. However, the proper balance of these ions is key to the health of a lake [50,53].
Points P3 and P4, located at the surface and bottom, respectively, during the dry season, exhibited higher concentrations of metal ions, as did P6 at the bottom (Figure 4a,b). During the rainy season, they were at P3 and P6 (Figure 4c,d). In P3, waters with low waves, low currents, and greater depth are observed, so there would be less removal or water turnover. In contrast, P4 and P6 have a high influence on anthropogenic activities.
3.3. Trophic State (TE) and Quality Index (WQI-PE)
TE was reported as mesotrophic for the Pacucha Lagoon during low water and rainfall (Table 6), increasing to eutrophic at points P3, P4, and P5 during the rainy season (Figure 3c,d), this would be due to the punctual and diffuse entry of water by runoff carrying particulate matter, mainly organic matter. While in P2 and P6, an oligotrophic state was manifested during the dry season (Figure 3a,b). This is likely because there are no sources of external water entry at these points.
The average mesotrophic state of the lake indicates a balanced availability of nutrients, favoring aquatic productivity with the presence of algae and aquatic vegetation without reaching overabundance [54,55]. This is primarily due to the adequate levels of dissolved oxygen and pH in the Pacucha Lagoon, which facilitate proper nutrient cycling and the regulation of biota populations.
To determine the WQI-PE, 22 parameters were considered (TDS, EC, CA, pH, DO, Ammonia, Nitrites, Nitrates, PT, Chlo, and metals such as As, Ba, Cu, Pb, Sb, Se, Tl, Cd, Cr, Hg, Ni, and Zn). The ICA-PE score for the sampling points ranged from 54.17 to 60.34 in the dry season, while in the rainy season, it ranged from 50.32 to 53.73, corresponding to its “Regular” status (Table 6 and Figure 3). This indicates that the water quality in the Pacucha Lagoon is occasionally compromised or degraded, and the quality falls far short of the desirable values [14]. Among the parameters evaluated, the ones that stand out the most in terms of decreasing ECA levels are the metallic ions, such as As, Pb, Se, and Tl, which is likely due to the geomorphology of the area. These problems are observed in lakes and those with surrounding anthropogenic activities, even resulting in poor or degraded water quality values [56,57,58].
3.4. Multivariate Data Analysis
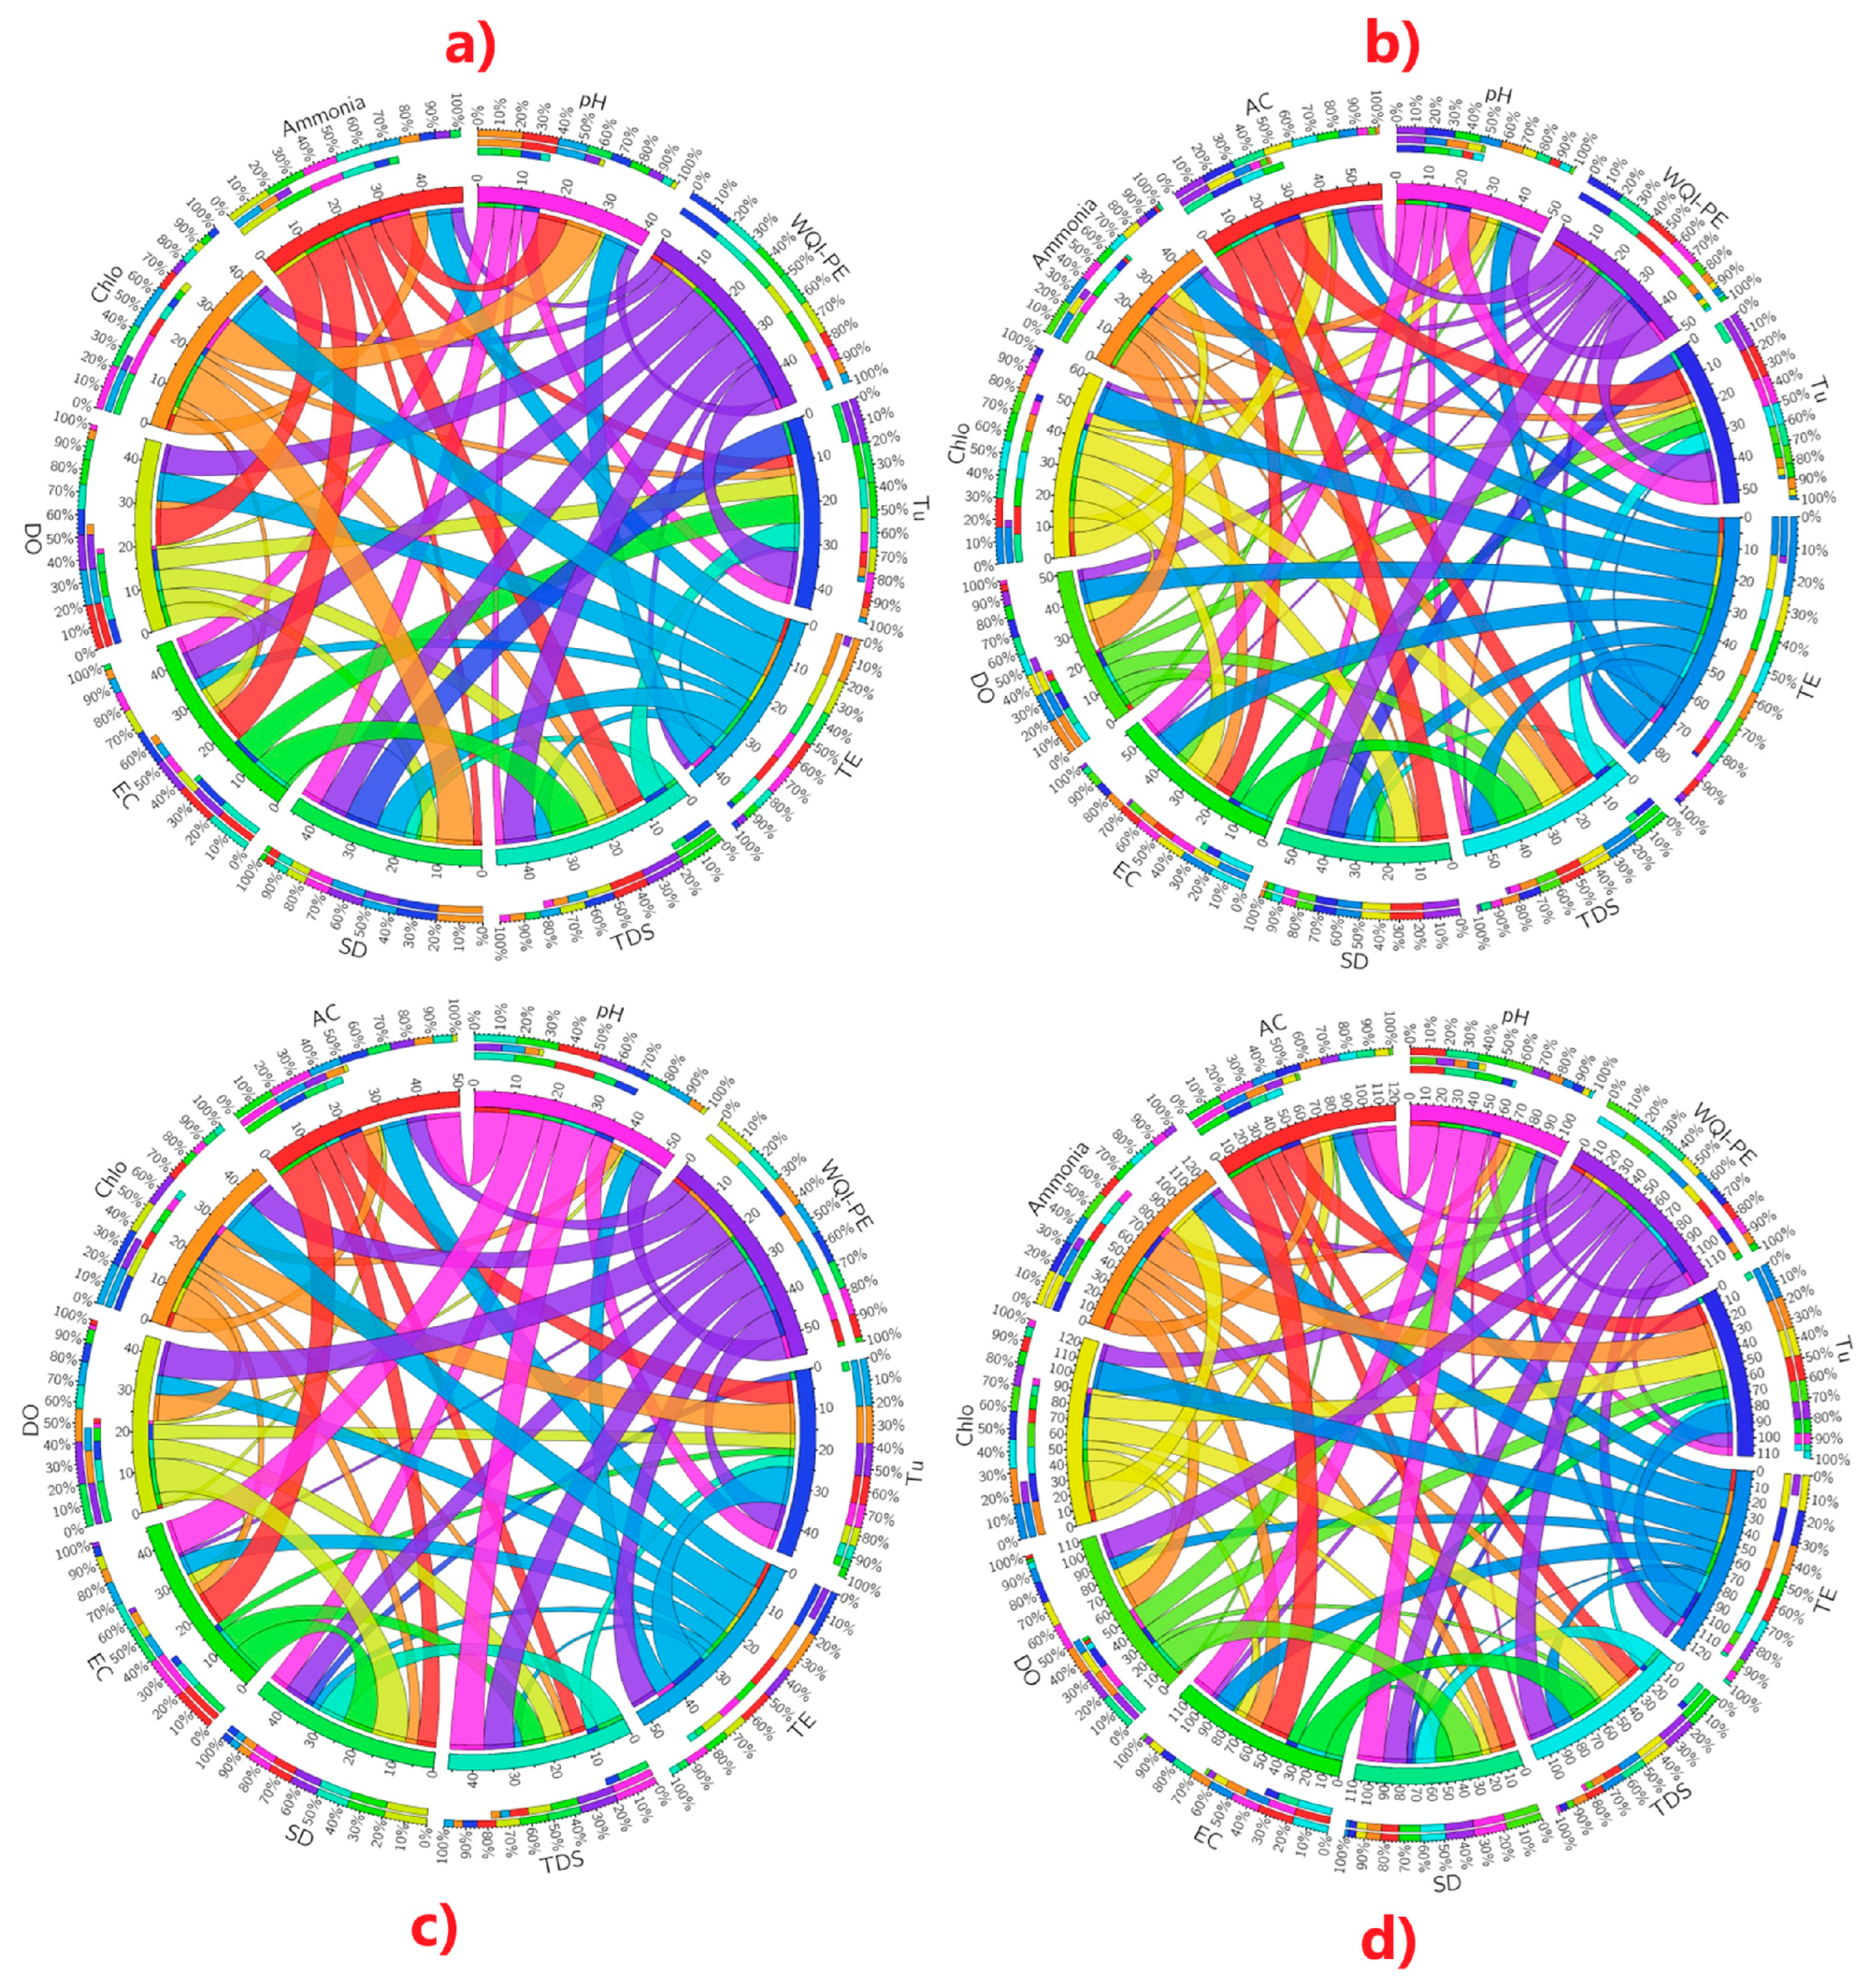
The Circos plot was initially proposed to represent analyses in the field of genomics, although its use has been extended to various fields of environmental science. This graph relates the magnitude and interaction of multiple variables. The outer axis represents the percentage, indicating the magnitude of the variable, while the inner axes indicate the intensity of the relationship between the magnitudes of each variable, represented by the thickness of the ribbon (https://mk.bcgsc.ca/tableviewer/visualize/, accessed on 15 February 2025).
The CIRCOS analysis was used to evaluate the correlation between the physical and chemical parameters and their influence on the sampling points of the lake. Figure 5a shows that the Chlo level is strongly related to pH and SD at the surface for drought, as well as ammonium, with DO, EC, and TDS. Likewise, Tu is strongly associated with SD and EC. WQI-PE shows a high dependence on DO, EC, SD, TDS, and Tu, although it has a low relationship with TE. At the bottom of the lake, WQI-PE is strongly related to SD, Tu, and AC. Likewise, ET is subject to changes in Chlo, DO, EC, and ammonium (Figure 5b). While in the surface rainfall (Figure 5c), WQI-PE is strongly related to DO, TDS, TE, Chlo, and Tu; similar behavior, although with less intensity, is observed for the bottom of the lake (Figure 5d).
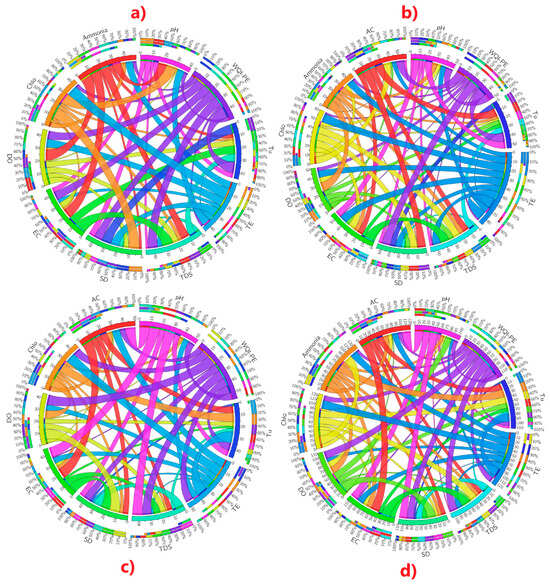
Figure 5.
CIRCOS diagram for the correlation of physical and chemical parameters of water, (a) surface in the dry season, (b) bottom in the dry season, (c) surface in the rainy season, and (d) bottom in the rainy season.
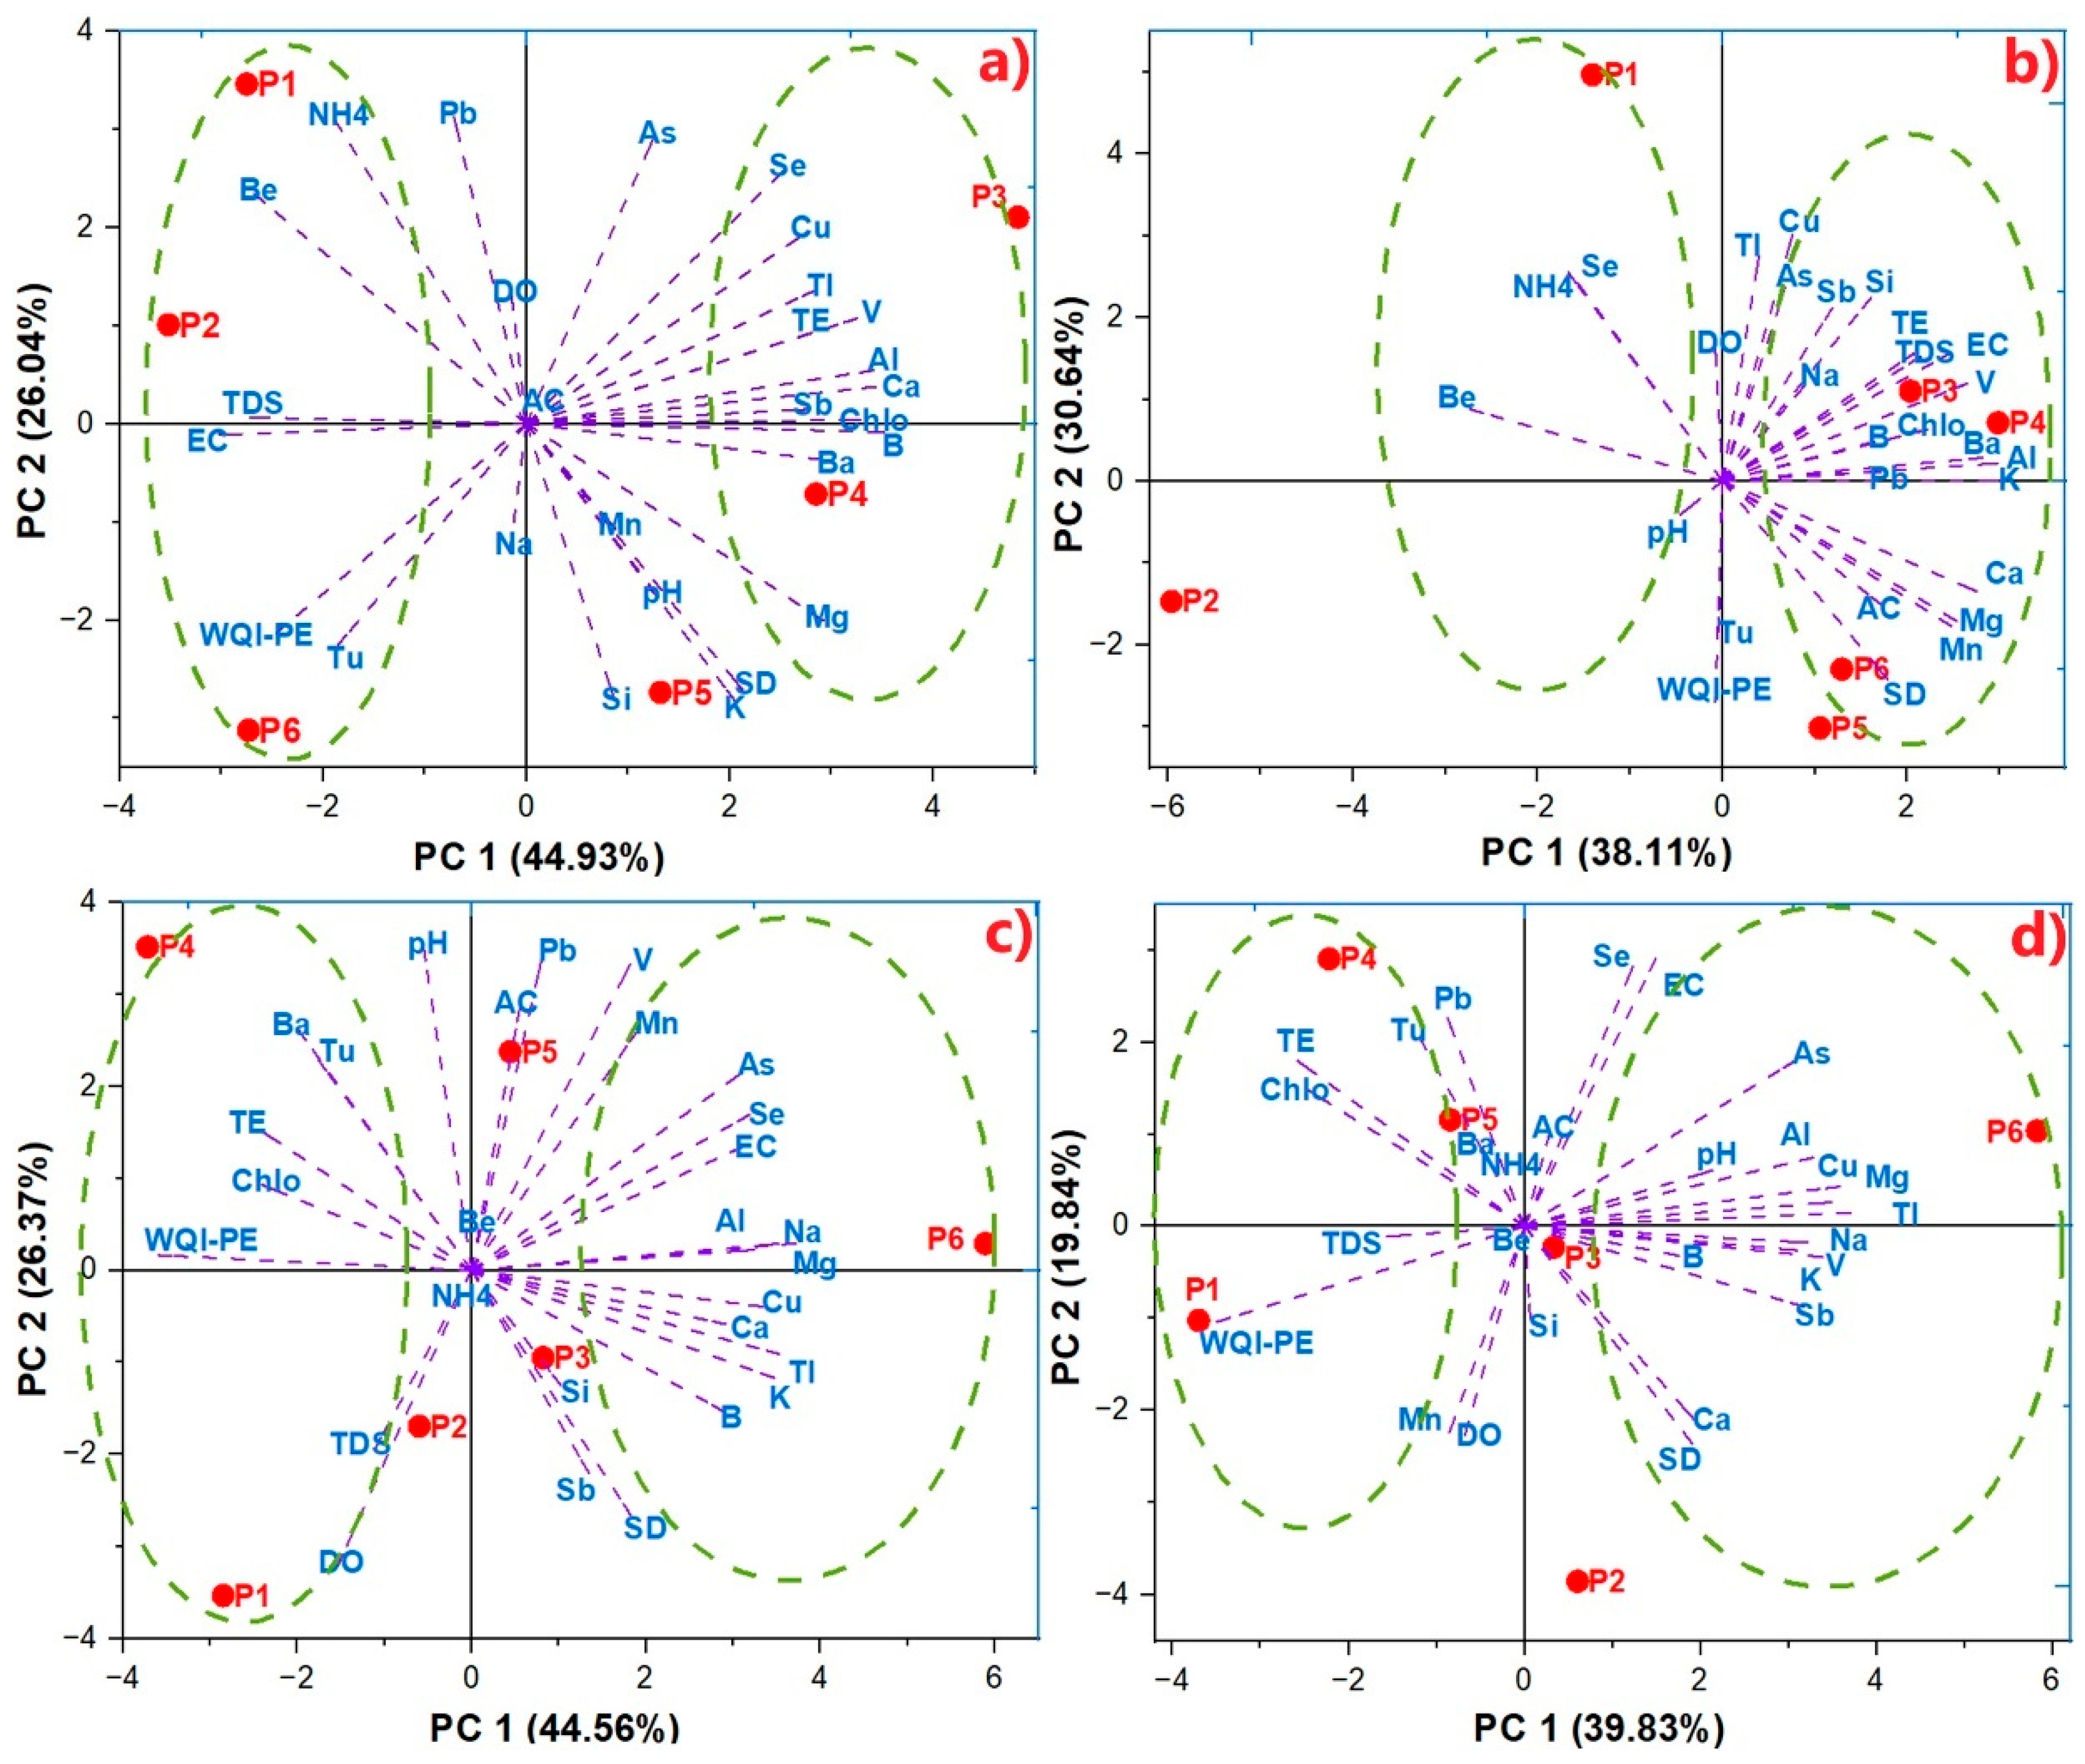
The PCA revealed that points P3 and P4 in the dry season (Figure 6a,b) are primarily influenced by metal ions, likely due to the presence of crops in the surrounding areas and the increased input of point and diffuse loads of runoff water. Points P1 and P2 are mainly influenced by organic matter (NH4) at the bottom, while EC, TDS, and Tu determine the water quality at the surface. In precipitation, the group formed by P1 (near population and commercial centers) and P4 (an area of high grazing density and native birds) is influenced by higher levels of Chlo, TE, TDS, and DO (Figure 6c,d). P6 (an area of low anthropogenic activity) is primarily composed of metal ions. P2, P3, and P5 show moderate levels of physical and chemical parameters.
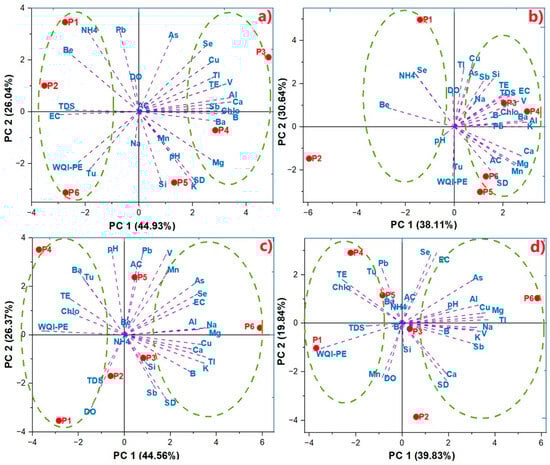
Figure 6.
PCA plot at sampling points, (a) surface in the dry season, (b) bottom in the dry season, (c) surface in the rainy season, and (d) bottom in the rainy season.
3.5. Analysis of the Magnitude of Impacts of Anthropogenic Activities on Pacucha Lagoon
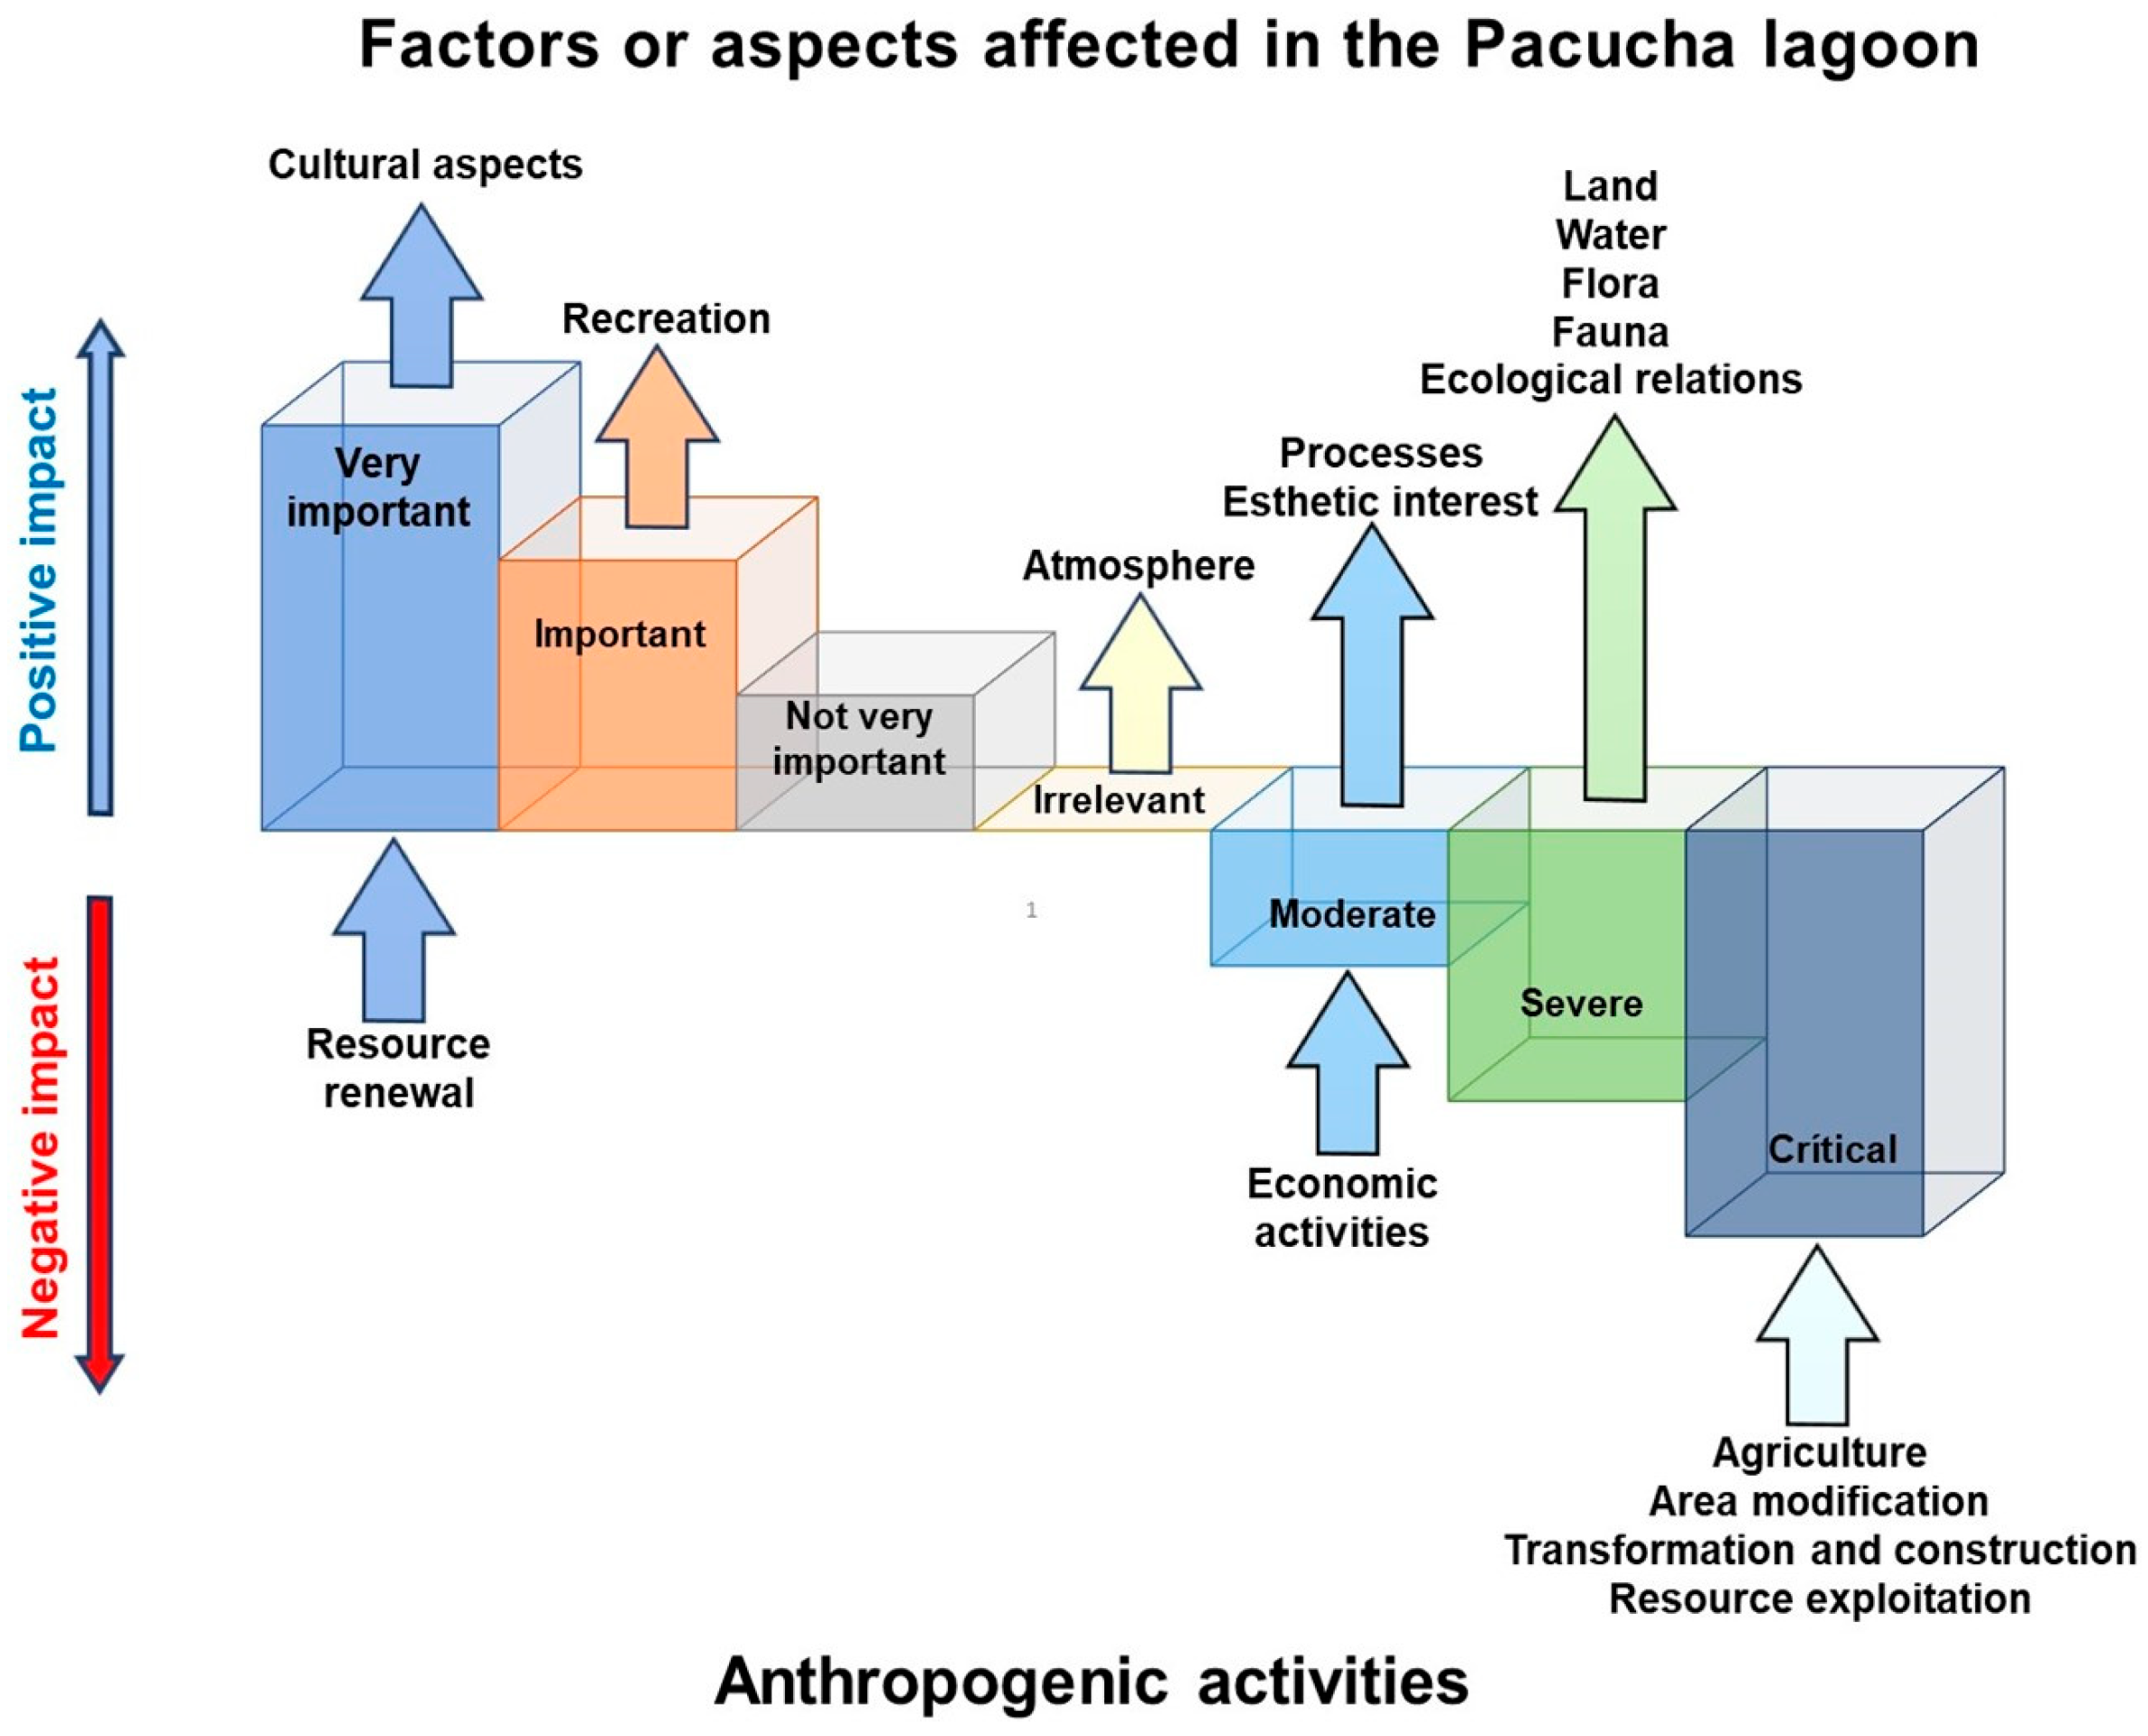
Figure 7 illustrates the positive impacts (up arrow) with intensities ranging from “very important” to “irrelevant” and the negative impacts (down arrow) with intensities ranging from “irrelevant” to “critical”. The lower part shows the flow of anthropogenic activities towards the factors or aspects of the lake (upper part).
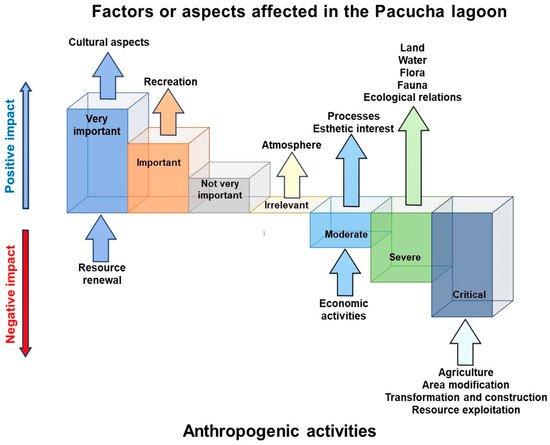
Figure 7.
Relationship between environmental factors and anthropogenic activities.
It was observed that agriculture, transformation and construction, alteration of the area of influence, and resource exploitation are anthropogenic activities that are rated as critically unfavorable (Figure 7). Agricultural activities in the vicinity of the lake are extensive, with the indiscriminate and generalized use of agrochemicals. No training has been observed in the use, dosage, and handling of these products during their application or the handling of residues. Additionally, products are continuously cultivated throughout the year using technical irrigation. This activity has serious consequences for the lake ecosystem, causing changes that are often irreversible [59].
On the other hand, the lake faces several environmental challenges; the extraction of non-mining materials and the development of infrastructure, including houses, docks, and trails, threaten the native flora and fauna, especially waterfowl. Fish farming has a critical impact due to the increase in organic load and the risk of eutrophication [9,56]. Although tourism activities generate local income, they are unregulated and contribute to cumulative pollution. On the positive side, there are specific reforestation initiatives with native species for “water planting” in the highlands.
Anthropogenic impacts analysis revealed severe adverse effects on the physicochemical parameters of water and soil (Figure 7), while sedimentation and ion exchange processes showed moderate adverse effects with limited recovery capacity. Flora, fauna, and ecological interrelationships are highly vulnerable to anthropogenic changes, often resulting in irreversible damage to native biodiversity, as evidenced by the impact on water bodies from urbanized areas [60,61]. Paradoxically, recreational activities and cultural aspects show positive impacts, maintaining the natural attractiveness of the lake ecosystem, although the esthetic value has a moderate negative impact. These factors are particularly attractive in preserved lakes, especially for individuals seeking recreational opportunities [62].
4. Conclusions
The study found that Pacucha Lagoon has “Regular” water quality according to the WQI-PE, which is primarily affected by anthropogenic activities, particularly agriculture. Quality declines during the rainy season due to runoff carrying agricultural pollutants. Physicochemical parameters at the sampling points are within the Environmental Quality Standards (ECA-Peru), but metal ions, especially heavy metals, significantly exceed these standards in both seasons. Slight variations in the parameters studied were observed at the bottom of the lake. The trophic state was found to be between mesotrophic in the dry season and mesotrophic-eutrophic in the rainy season, indicating a nutrient balance that favors aquatic productivity, with an increase in nutrients during the rainy season. Anthropogenic activities have a profoundly negative impact on the ecosystem. Agriculture is the main threat due to the indiscriminate use of agrochemicals. Other harmful activities include physical alteration of the area, resource exploitation, and aquaculture. There are positive aspects, such as reforestation with native species and socio-economic benefits from tourism; however, these activities lack sustainability due to a lack of regulation and inadequate conservation commitments. Without proper management of these activities, water quality will continue to deteriorate, potentially resulting in irreversible damage to the lake ecosystem. The study provides data on a high-altitude lake in the Andes. These data can serve as a basis for monitoring and surveillance of other lentic water bodies.
Author Contributions
Conceptualization, D.E.P.-G., Y.Q.-Q. and D.C.-Q.; methodology, D.E.P.-G., Y.Q.-Q. and E.G.A.-M.; software, Y.Q.-Q. and D.C.-Q.; validation, Y.G.P.-M., Y.F.C.-M., E.G.A.-M. and R.L.R.; formal analysis, Y.Q.-Q., R.H.A. and D.C.-Q.; investigation, E.A.L., D.E.P.-G., Y.Q.-Q., F.T.T., O.C.-C., H.A.-F., R.H.A. and Y.F.C.-M.; resources, F.T.T., M.P.R. and R.L.R.; data curation, D.E.P.-G. and Y.Q.-Q.; writing—original draft preparation, D.E.P.-G., Y.Q.-Q. and D.C.-Q.; writing—review and editing, D.E.P.-G., Y.Q.-Q. and D.C.-Q.; visualization, Y.Q.-Q., Y.G.P.-M. and D.C.-Q.; supervision, D.E.P.-G. and D.C.-Q.; project administration, Y.Q.-Q. and D.E.P.-G. All authors have read and agreed to the published version of the manuscript.
Funding
This research received no external funding.
Data Availability Statement
Data can be requested from the authors.
Acknowledgments
The authors would like to thank for Research of the José María Arguedas National University, Andahuaylas, Perú. Laboratory of the Experimental Center for Ceramics at the National University of San Cristóbal de Huamanga, Ayacucho, Peru.
Conflicts of Interest
The authors declare that they have no conflicts of interest.
References
- Li, P.; Wu, J. Water Resources and Sustainable Development. Water 2023, 16, 134. [Google Scholar] [CrossRef]
- Leitão, M.F.; Cunha, A.; Ferreira, M.M. Water-Education as a Promoter of Education for Sustainable Development: Three Studies in Portuguese-Speaking African Countries. Eur. J. Sustain. Dev. 2020, 9, 192. [Google Scholar] [CrossRef]
- Nagabhatla, N.; Avellán, T.; Pouramin, P.; Qadir, M.; Mehta, P.; Payne, J.; Stefan, C.; Hülsmann, S.; Abrate, T.; Teruggi, G.; et al. Chapter 2: Physical and environmental dimensions. In The United Nations World Water Development Report 2019: Leaving No One Behind; UNESCO: Paris, France, 2019; pp. 1–201. [Google Scholar]
- Preisner, M. Water: The Most Undervalued Resource on Earth. Environ. Res. Eng. Manag. 2022, 78, 5. [Google Scholar] [CrossRef]
- Jahura, S.; Islam, M.S.; Mostafa, M.G. Impact of water scarcity on rural livelihood in the drought-prone region: A review of global perspectives. Indones. J. Soc. Sci. 2024, 16, 1–13. [Google Scholar] [CrossRef]
- OECD. Organisation for Economic, Co-Operation Development. Eutrophication of Waters: Monitoring, Assessment and Control; Final Report; OECD: Paris, France, 1982; p. 154. [Google Scholar]
- Cloutier, R.G.; Sanchez, M. Trophic status evaluation for 154 lakes in Quebec, Canada: Monitoring and recommendations. Water Qual. Res. J. 2007, 42, 252–268. [Google Scholar] [CrossRef]
- Allende, L.; Fontanarrosa, M.S. Addressing the trophic status in urban ponds: An evaluation of current trophic state indexes. Austral Ecol. 2023, 48, 1828–1847. [Google Scholar] [CrossRef]
- Romero-Mariscal, G.; Garcia-Chevesich, P.A.; Morales-Paredes, L.; Arenazas-Rodriguez, A.; Ticona-Quea, J.; Vanzin, G.; Sharp, J.O. Peruvian Wetlands: National Survey, Diagnosis, and Further Steps toward Their Protection. Sustainability 2023, 15, 8255. [Google Scholar] [CrossRef]
- Guevara-Pérez, E. Planning of applied research in water development projects in Peru. Int. J. Hydrol. 2018, 2, 266–276. [Google Scholar]
- Maldonado-Fonkén, M.; Chuquillanqui, H.; Vildoso, B.; Linares-Palomino, R. Plant communities of high-Andean bofedal wetlands across a trans-Andean transect in southern Peru. Veg. Classif. Surv. 2024, 5, 203–218. [Google Scholar] [CrossRef]
- ANA. National Protocol for the Monitoring of Surface Water Resources Quality; Autoridad Nacional del Agua, Ministerio de Desarrollo Agrario y Riego: Lima, Perú, 2016. [Google Scholar]
- Eaton, A.D.; Greenberg, A.E.; Clesceri, L.S.; Franson, M. Standard Methods for the Examination of Water and Wastewater, 23rd ed.; American Public Health Association: Washington, DC, USA, 2017. [Google Scholar]
- ANA. Methodology for Determining the ICA-PE Water Quality Index Applied to Surface Continental Water Bodies; Autoridad Nacional del Agua, Ministerio de Desarrollo Agrario y Riego: Lima, Perú, 2018. [Google Scholar]
- MINAM. Estándares de Calidad Ambiental (ECA) Para Agua. Decreto Supremo N° 004-2017-MINAM; Ministerio del Ambiente: Lima, Perú, 2017. [Google Scholar]
- Carlson, R.E. A trophic state index for lakes 1. Limnol. Oceanogr. 1977, 22, 361–369. [Google Scholar] [CrossRef]
- Clark, B.D.; Gilad, A.; Bisset, R.; Tomlinson, P. Perspectives on Environmental Impact Assessment: Proceedings of the Annual WHO Training Courses on Environmental Impact Assessment, Centre for Environmental Management and Planning, University of Aberdeen, Scotland, 1980–1983; Springer Science & Business Media: Berlin/Heidelberg, Germany, 2012. [Google Scholar]
- Abbas, M.D.; Al-Kasser, M.K. The Environmental Impact Assessment of the Spent Engine Oil Recycling Plant by using Leopold Matrix: Case Study Recycling Plant in Al-Diwaniyah City–Iraq. Al-Qadisiyah J. Pure Sci. 2021, 26, 221–230. [Google Scholar] [CrossRef]
- Leopold, L.B. A Procedure for Evaluating Environmental Impact; Department of the Interior: Washington, DC, USA, 1971; p. 645. [Google Scholar]
- Çako, V.; Zhuri, E.; Babani, F.; Karaja, T. Water Transparency as One as of Trophic State Indices in Narta Lagoon. IOSR J. Eng 2014, 4, 15–22. [Google Scholar] [CrossRef]
- Kader, S.; Raimi, M.O.; Spalevic, V.; Iyingiala, A.-A.; Bukola, R.W.; Jaufer, L.; Butt, T.E. A concise study on essential parameters for the sustainability of Lagoon waters in terms of scientific literature. Turk. J. Agric. For. 2023, 47, 288–307. [Google Scholar] [CrossRef]
- Kpidi, Y.H.; Koné, M.G.-R.; Ballet, T.G.N.; Ouattara, L.; Yapo, O.B.; Ziao, N. Modeling of the Dynamics and Prediction of Transparency of a Meotropic Tropical Lake: Bakré Lake (Abidjan, Côte d’Ivoire). Resour. Environ. 2018, 8, 174–183. [Google Scholar]
- Caballero, C.B.; Guedes, H.A.S.; Fraga, R.d.S.; Mendes, K.G.P.; Fonseca, E.H.d.; Martins, V.S.; Mensch, M.d.S. Predictive model for monitoring water turbidity in a subtropical lagoon using Sentinel-2A/B MSI images. RBRH 2023, 28, e5. [Google Scholar] [CrossRef]
- Çako, V.; Baci, S.; Shena, M. Water turbidity as one of the trophic state indices in Butrinti Lake. J. Water Resour. Prot. 2013, 05, 1144–1148. [Google Scholar] [CrossRef]
- Specchiulli, A.; Cilenti, L.; D’Adamo, R.; Fabbrocini, A.; Guo, W.; Huang, L.; Lugliè, A.; Padedda, B.M.; Scirocco, T.; Magni, P. Dissolved organic matter dynamics in Mediterranean lagoons: The relationship between DOC and CDOM. Mar. Chem. 2018, 202, 37–48. [Google Scholar] [CrossRef]
- Lebret, K.; Langenheder, S.; Colinas, N.; Östman, Ö.; Lindström, E.S. Increased water colour affects freshwater plankton communities in a mesocosm study. Aquat. Microb. Ecol. 2018, 81, 1–17. [Google Scholar] [CrossRef]
- Boyd, C.E. Water quality protection. In Water Quality: An Introduction; Springer: Cham, Switzerland, 2020; pp. 379–409. [Google Scholar]
- Adjovu, G.E.; Stephen, H.; James, D.; Ahmad, S. Measurement of total dissolved solids and total suspended solids in water systems: A review of the issues, conventional, and remote sensing techniques. Remote Sens. 2023, 15, 3534. [Google Scholar] [CrossRef]
- Maansi; Jindal, R.; Wats, M. Evaluation of surface water quality using water quality indices (WQIs) in Lake Sukhna, Chandigarh, India. Appl. Water Sci. 2022, 12, 1–14. [Google Scholar] [CrossRef]
- Ramos-Pacheco, B.S.; Choque-Quispe, D.; Ligarda-Samanez, C.A.; Solano-Reynoso, A.M.; Choque-Quispe, Y.; Aguirre Landa, J.P.; Agreda Cerna, H.W.; Palomino-Rincón, H.; Taipe-Pardo, F.; Zamalloa-Puma, M.M. Water Pollution Indexes Proposal for a High Andean River Using Multivariate Statistics: Case of Chumbao River, Andahuaylas, Apurímac. Water 2023, 15, 2662. [Google Scholar] [CrossRef]
- Blanchard, D.; Aherne, J.; Makar, P. Dissolved Organic Carbon in Lakes of the Athabasca Oil Sands Region: Is Color an Indicator of Acid Sensitivity? Environ. Sci. Technol. 2021, 55, 6791–6803. [Google Scholar] [CrossRef]
- Wang, J.; Fu, Z.; Qiao, H.; Liu, F. Assessment of eutrophication and water quality in the estuarine area of Lake Wuli, Lake Taihu, China. Sci. Total Environ. 2019, 650, 1392–1402. [Google Scholar] [CrossRef]
- Liu, J.; Zhang, C.; An, D.; Wei, Y. Development and application of an innovative dissolved oxygen prediction fusion model. Comput. Electron. Agric. 2024, 227, 109496. [Google Scholar] [CrossRef]
- Testa, J.M.; Kemp, W.M. Oxygen–Dynamics and biogeochemical consequences. Treatise Estuar. Coast. Sci. 2011, 5, 163–199. [Google Scholar]
- Sodeinde, K.O.; Animashaun, S.A.; Adubiaro, H.O. Methods for the detection and remediation of ammonia from aquaculture effluent: A Review. J. Niger. Soc. Phys. Sci. 2023, 854. [Google Scholar] [CrossRef]
- Oladosu, N.; Abayomi, A.; Olayinka, K.; Alo, B. Reverse flow injection techniques for the determination of nitrogen and phosphorus species in estuarine water of the Lagos Lagoon, Nigeria. Int. J. Environ. Anal. Chem. 2022, 102, 4862–4881. [Google Scholar] [CrossRef]
- Savic, R.; Stajic, M.; Blagojević, B.; Bezdan, A.; Vranesevic, M.; Nikolić Jokanović, V.; Baumgertel, A.; Bubalo Kovačić, M.; Horvatinec, J.; Ondrasek, G. Nitrogen and phosphorus concentrations and their ratios as indicators of water quality and eutrophication of the hydro-system Danube–Tisza–Danube. Agriculture 2022, 12, 935. [Google Scholar] [CrossRef]
- Acri, F.; Braga, F.; Aubry, F.B. Long-term dynamics in nutrients, chlorophyll a and water quality parameters in the Lagoon of Venice. Sci. Mar. 2020, 84, 215–225. [Google Scholar] [CrossRef]
- Nunes, P.; Roland, F.; Amado, A.M.; Resende, N.d.S.; Cardoso, S.J. Responses of phytoplanktonic chlorophyll-a composition to inorganic turbidity caused by mine tailings. Front. Environ. Sci. 2022, 9, 605838. [Google Scholar] [CrossRef]
- Hennemann, M.C.; Petrucio, M.M. High chlorophyll a concentration in a low nutrient context: Discussions in a subtropical lake dominated by Cyanobacteria. J. Limnol. 2016, 75. [Google Scholar] [CrossRef]
- Fukushima, T.; Komuro, S.; Kitamura, T.; Nagahama, Y.; Matsushita, B. Long-term changes in water mineral concentrations and their influence on sediment water content in a shallow lake. SN Appl. Sci. 2020, 2, 1319. [Google Scholar] [CrossRef]
- Cronan, C.S. Major Cations (Ca, Mg, Na, K, Al) in Freshwater Systems. In Reference Module in Earth Systems and Environmental Sciences; Elsevier: Amsterdam, The Netherlands, 2014. [Google Scholar]
- Su, Y.P.; Yang, J.; Liu, H.B. Characteristics and variation of major elements Ca, Na, Mg, K, Al in waters and water-bloom-forming cyanobacteria in Nanquan water area of the Taihu lake in China. J. Agro-Environ. Sci. 2011, 30, 539–547. [Google Scholar]
- Blasco, J.; Tovar-Sánchez, A. Marine Analytical Chemistry; Springer: Berlin/Heidelberg, Germany, 2023. [Google Scholar]
- Sibal, L.N.; Espino, M.P.B. Heavy metals in lake water: A review on occurrence and analytical determination. Int. J. Environ. Anal. Chem. 2018, 98, 536–554. [Google Scholar] [CrossRef]
- Kulik, N.; Efremenko, N.; Belkina, N.; Strakhovenko, V.; Gatalskaya, E.; Orlov, A. Fe, Mn, Al, Cu, Zn, and Cr in the sedimentary matter of Lake Onego. Quat. Int. 2023, 644, 134–144. [Google Scholar] [CrossRef]
- Sohrin, Y.; Urushihara, S.; Nakatsuka, S.; Kono, T.; Higo, E.; Minami, T.; Norisuye, K.; Umetani, S. Multielemental determination of GEOTRACES key trace metals in seawater by ICPMS after preconcentration using an ethylenediaminetriacetic acid chelating resin. Anal. Chem. 2008, 80, 6267–6273. [Google Scholar] [CrossRef]
- Choque-Quispe, D.; Froehner, S.; Ligarda-Samanez, C.A.; Ramos-Pacheco, B.S.; Peralta-Guevara, D.E.; Palomino-Rincón, H.; Choque-Quispe, Y.; Solano-Reynoso, A.M.; Barboza-Palomino, G.I.; Taipe-Pardo, F.; et al. Insights from Water Quality of High Andean Springs for Human Consumption in Peru. Water 2021, 13, 2650. [Google Scholar] [CrossRef]
- Choque-Quispe, D.; Ligarda-Samanez, C.A.; Solano-Reynoso, A.M.; Ramos-Pacheco, B.S.; Quispe-Quispe, Y.; Choque-Quispe, Y.; Kari-Ferro, A. Water quality index in the high-Andean micro-basin of the Chumbao River, Andahuaylas, Apurímac, Peru. Tecnol. Cienc. Agua 2021, 12, 37–73. [Google Scholar] [CrossRef]
- Stankevica, K.; Vincevica-Gaile, Z.; Klavins, M.; Kalnina, L.; Stivrins, N.; Grudzinska, I.; Kaup, E. Accumulation of metals and changes in composition of freshwater lake organic sediments during the Holocene. Chem. Geol. 2020, 539, 119502. [Google Scholar] [CrossRef]
- Hu, J.; Long, Y.; Zhou, W.; Zhu, C.; Yang, Q.; Zhou, S.; Wu, P. Influence of different land use types on hydrochemistry and heavy metals in surface water in the lakeshore zone of the Caohai wetland, China. Environ. Pollut. 2020, 267, 115454. [Google Scholar] [CrossRef]
- Choque-Quispe, D.; Froehner, S.; Palomino-Rincón, H.; Peralta-Guevara, D.E.; Barboza-Palomino, G.I.; Kari-Ferro, A.; Zamalloa-Puma, L.M.; Mojo-Quisani, A.; Barboza-Palomino, E.E.; Zamalloa-Puma, M.M. Proposal of a water-quality index for high Andean basins: Application to the Chumbao river, Andahuaylas, Peru. Water 2022, 14, 654. [Google Scholar] [CrossRef]
- Meena, R.A.A.; Sathishkumar, P.; Ameen, F.; Yusoff, A.R.M.; Gu, F.L. Heavy metal pollution in immobile and mobile components of lentic ecosystems—A review. Environ. Sci. Pollut. Res. 2018, 25, 4134–4148. [Google Scholar] [CrossRef] [PubMed]
- Lacoste, É.; Jones, A.; Callier, M.; Klein, J.; Lagarde, F.; Derolez, V. A review of knowledge on the impacts of multiple anthropogenic pressures on the soft-bottom benthic ecosystem in Mediterranean coastal lagoons. Estuaries Coasts 2023, 46, 2190–2207. [Google Scholar] [CrossRef]
- Manzoor, M.; Bhat, K.A.; Khurshid, N.; Yatoo, A.M.; Zaheen, Z.; Ali, S.; Ali, M.N.; Amin, I.; Mir, M.U.R.; Rashid, S.M. Bio-indicator species and their role in monitoring water pollution. In Freshwater Pollution and Aquatic Ecosystems; Apple Academic Press: Palm Bay, FL, USA, 2021; pp. 321–347. [Google Scholar]
- Lukman, L. Anthropogenic Impact on Lake Ecosystem. In Science of Lakes–Multidisciplinary Approach; Assani, A.A., Ed.; IntechOpen: Rijeka, Croatia, 2023. [Google Scholar]
- Hernández-Mira, F.A.; Rosas-Acevedo, J.L.; Reyes-Umaña, M.; Violante-González, J.; Sigarreta-Almira, J.M.; Vakhania, N. Multimetric Index to Evaluate Water Quality in Lagoons: A Biological and Geomorphological Approach. Sustainability 2021, 13, 4631. [Google Scholar] [CrossRef]
- García-Avila, F.; Loja-Suco, P.; Siguenza-Jeton, C.; Jiménez-Ordonez, M.; Valdiviezo-Gonzales, L.; Cabello-Torres, R.; Aviles-Anazco, A. Evaluation of the water quality of a high Andean lake using different quantitative approaches. Ecol. Indic. 2023, 154, 110924. [Google Scholar] [CrossRef]
- Alphonse, M.; Thiagarajan, K.; Nallakaruppan, N.; Raja, W.R.T.; Paul, S.; Jaichandran, S.; Mukundan, A.; Buot, I.E., Jr.; Pillay, M.; Nautiyal, S. Impact of Anthropogenic Compounds on Biodiversity: A Comprehensive Analysis. In Plant Diversity in Biocultural Landscapes; Springer: Berlin/Heidelberg, Germany, 2023; pp. 443–466. [Google Scholar]
- Nazaj, D. The Impact of Biodiversity, Flora and Fauna on Sustainable Development in Vlora Bay. Int. J. Case Stud. 2016, 5. [Google Scholar]
- Chukwuka, A.V.; Adeogun, A.O. Anthropogenic Impacts as Determinants of Tropical Lake Morphology: Inferences for Strategic Conservation of Lake Wetland Biodiversity. In Science of Lakes–Multidisciplinary Approach; Assani, A.A., Ed.; IntechOpen: Rijeka, Croatia, 2023. [Google Scholar]
- Latron, M.; Allies, A.; Argagnon, O.; Bosc, N.; Faure, K.; Fontes, H.; Grillas, P.; Molina, J.; De Wit, R.; Papuga, G. Mediterranean Temporary Lagoon: Proposal for a definition of this endangered habitat to improve its conservation. J. Nat. Conserv. 2022, 68, 126193. [Google Scholar] [CrossRef]

Disclaimer/Publisher’s Note: The statements, opinions and data contained in all publications are solely those of the individual author(s) and contributor(s) and not of MDPI and/or the editor(s). MDPI and/or the editor(s) disclaim responsibility for any injury to people or property resulting from any ideas, methods, instructions or products referred to in the content. |
© 2025 by the authors. Licensee MDPI, Basel, Switzerland. This article is an open access article distributed under the terms and conditions of the Creative Commons Attribution (CC BY) license (https://creativecommons.org/licenses/by/4.0/).