


Three-Dimensional Groundwater and Geochemical Reactive Transport Modeling to Assess Reclamation Techniques at the Quémont 2 Mine, Rouyn-Noranda, Canada


Abstract
1. Introduction
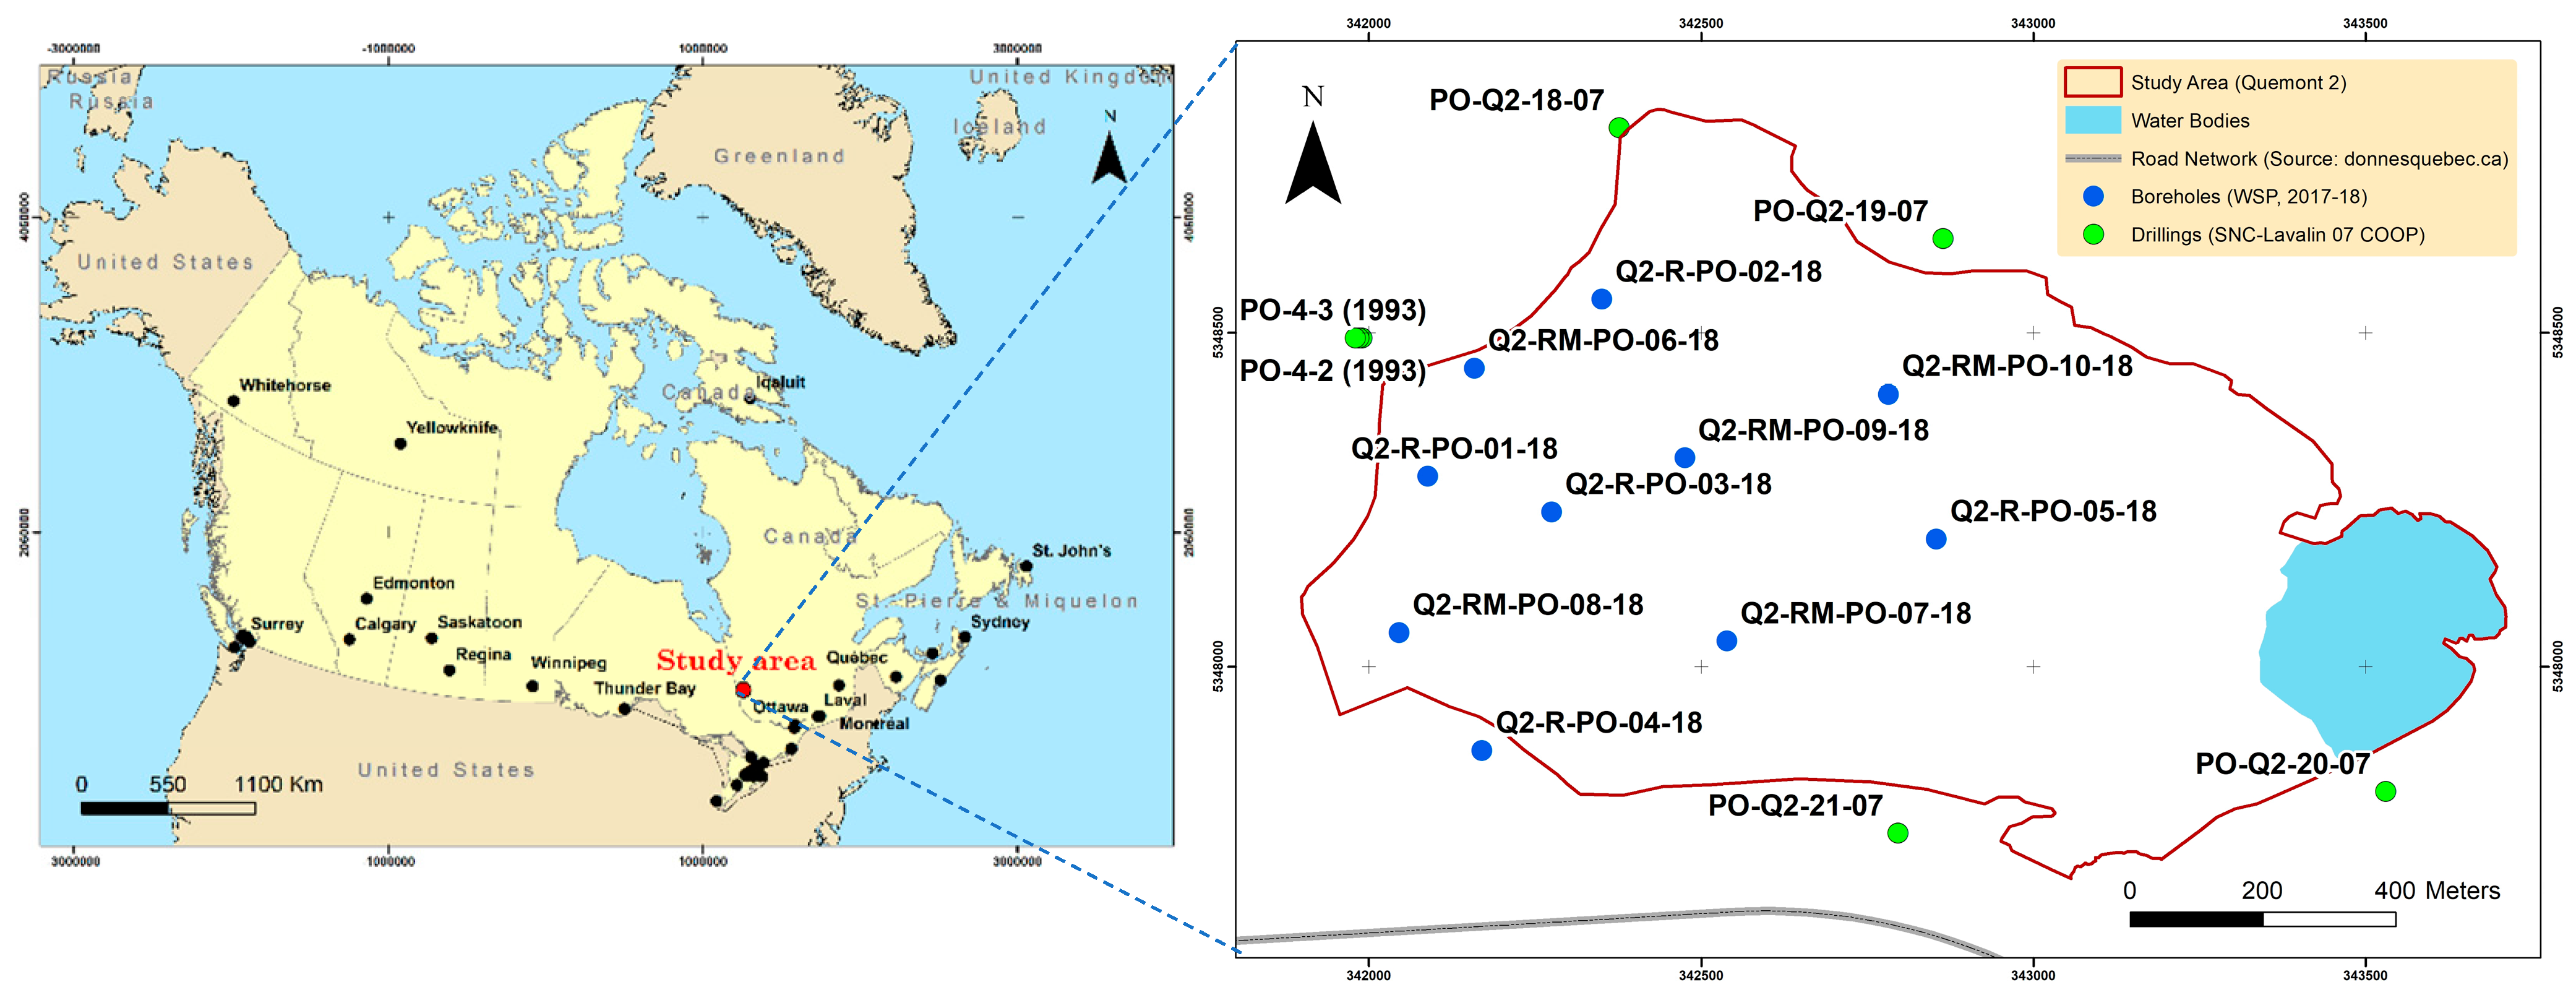
2. Site Description
- Dufault Lake, the main source of drinking water for Rouyn-Noranda;
- Osisko Lake, previously contaminated by smelting activities, mine tailings storage, and municipal wastewater.
3. Methodology
3.1. Data Collection and Field Measurements
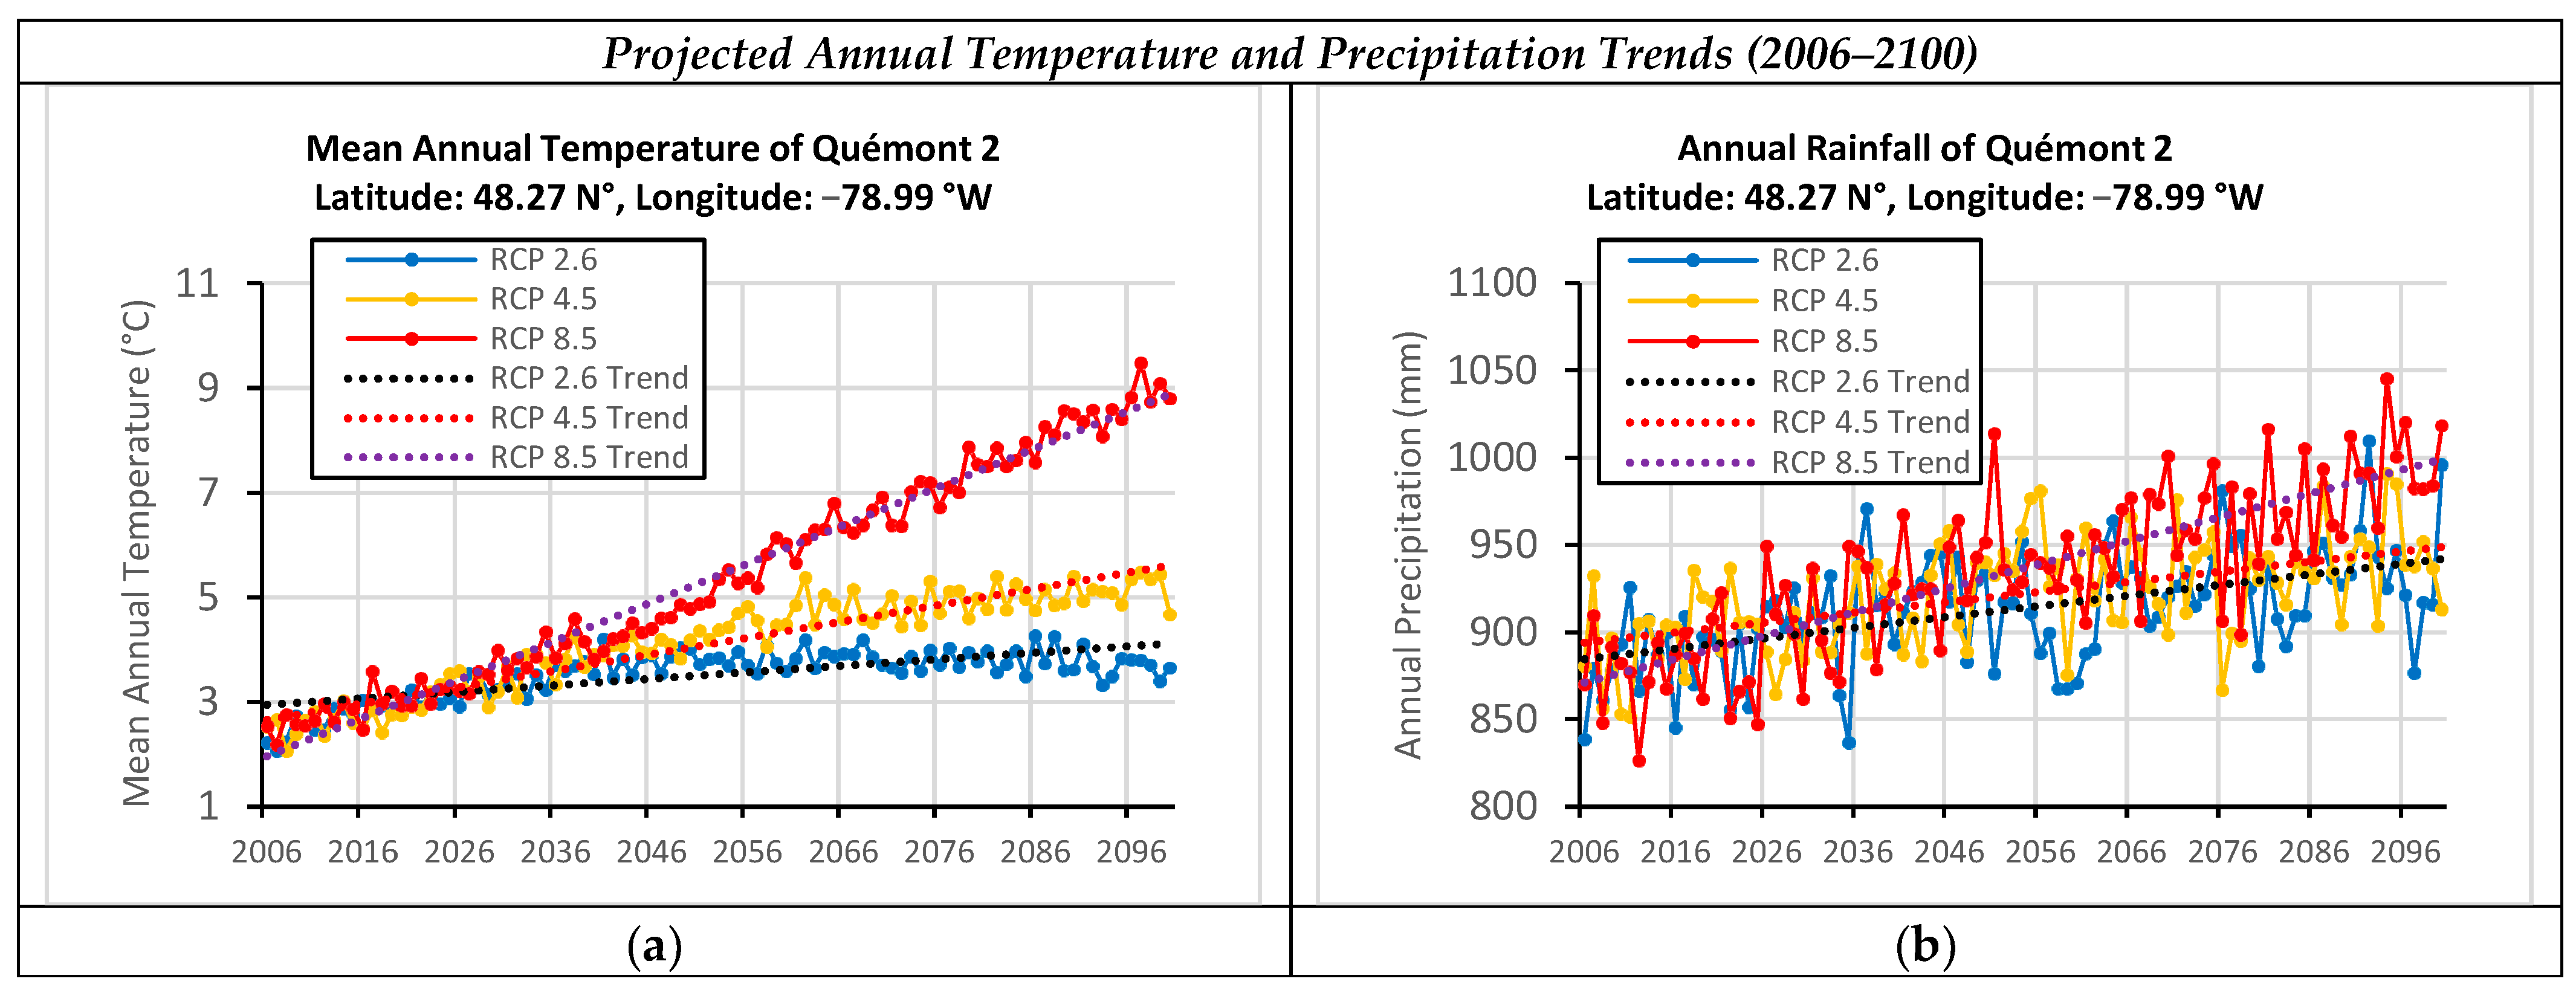
3.2. Climate Data
3.3. Hydrogeological Database
3.4. Hydrogeological Setting
3.4.1. Unit 1 (Rock)
3.4.2. Unit 2 (Glacio-Lacustrine Deposits)
3.4.3. Unit 3 (Mine Tailings)
3.4.4. Unit 4 (Sludge and Slag)
3.5. Hydrodynamic Parameters
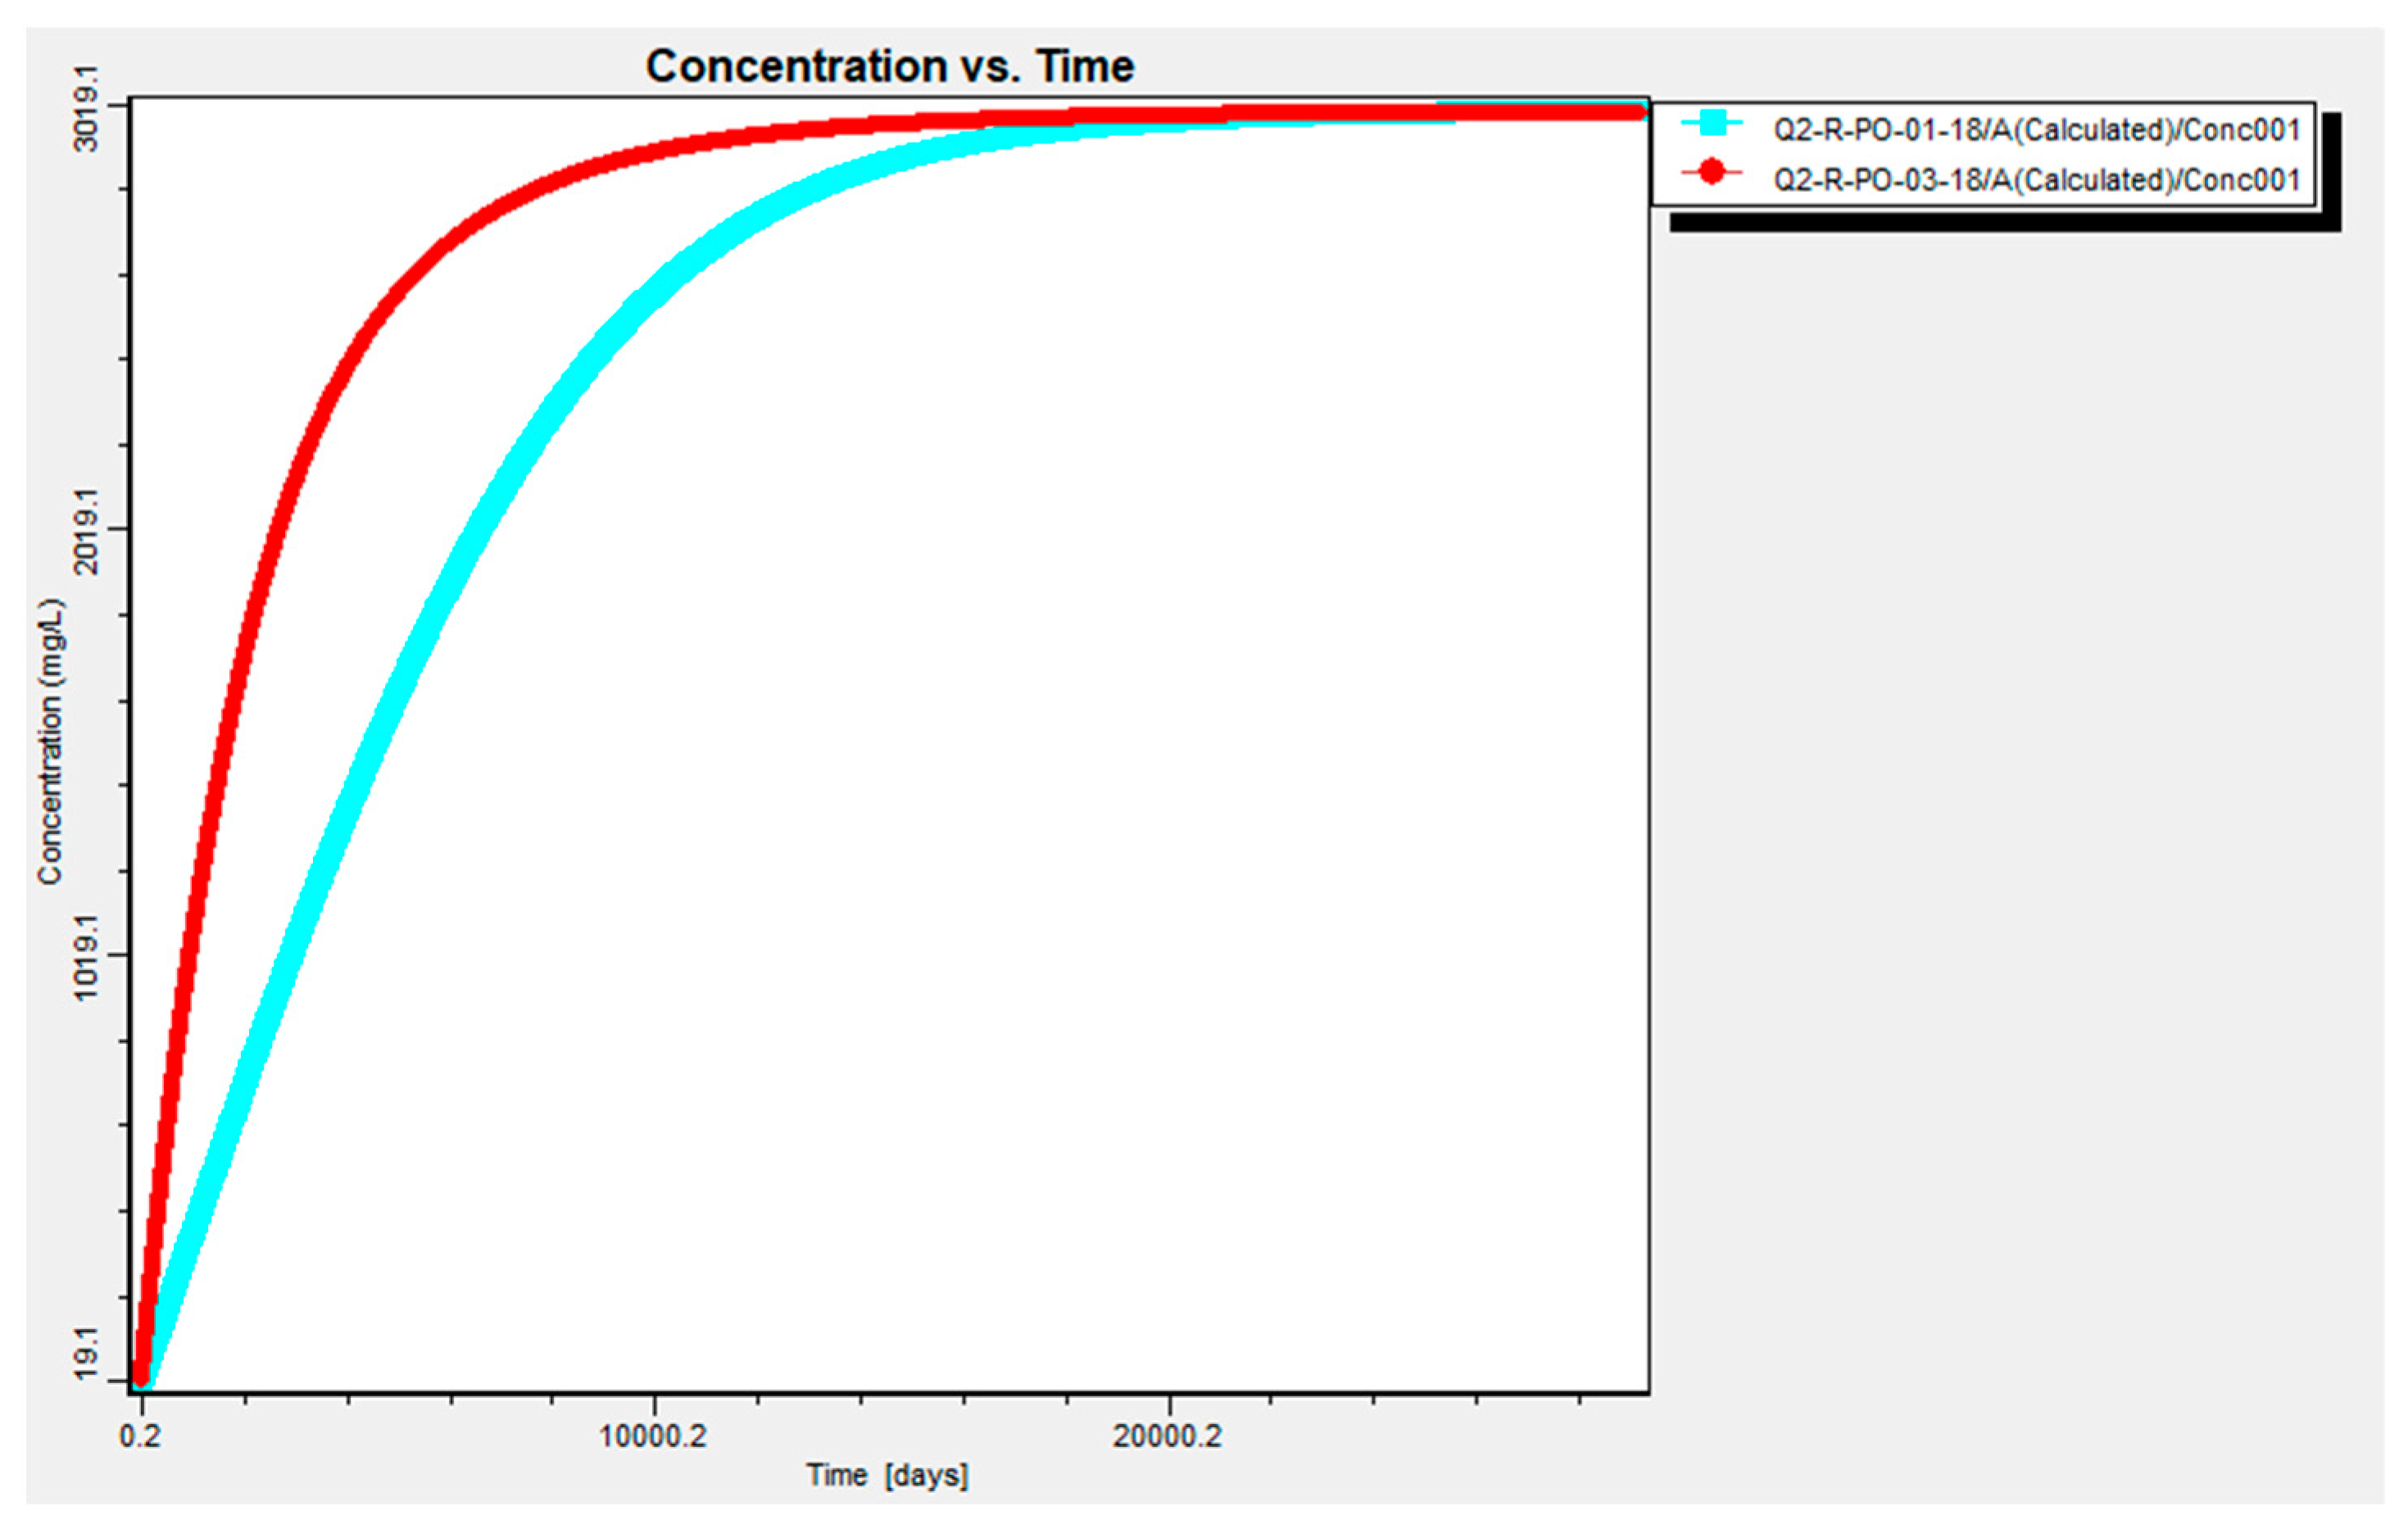
3.6. Kinetic Test Method
3.7. Model Construction and Boundary Conditions
3.8. Groundwater Flows and Contaminant Transport Modeling
4. Modeling Results
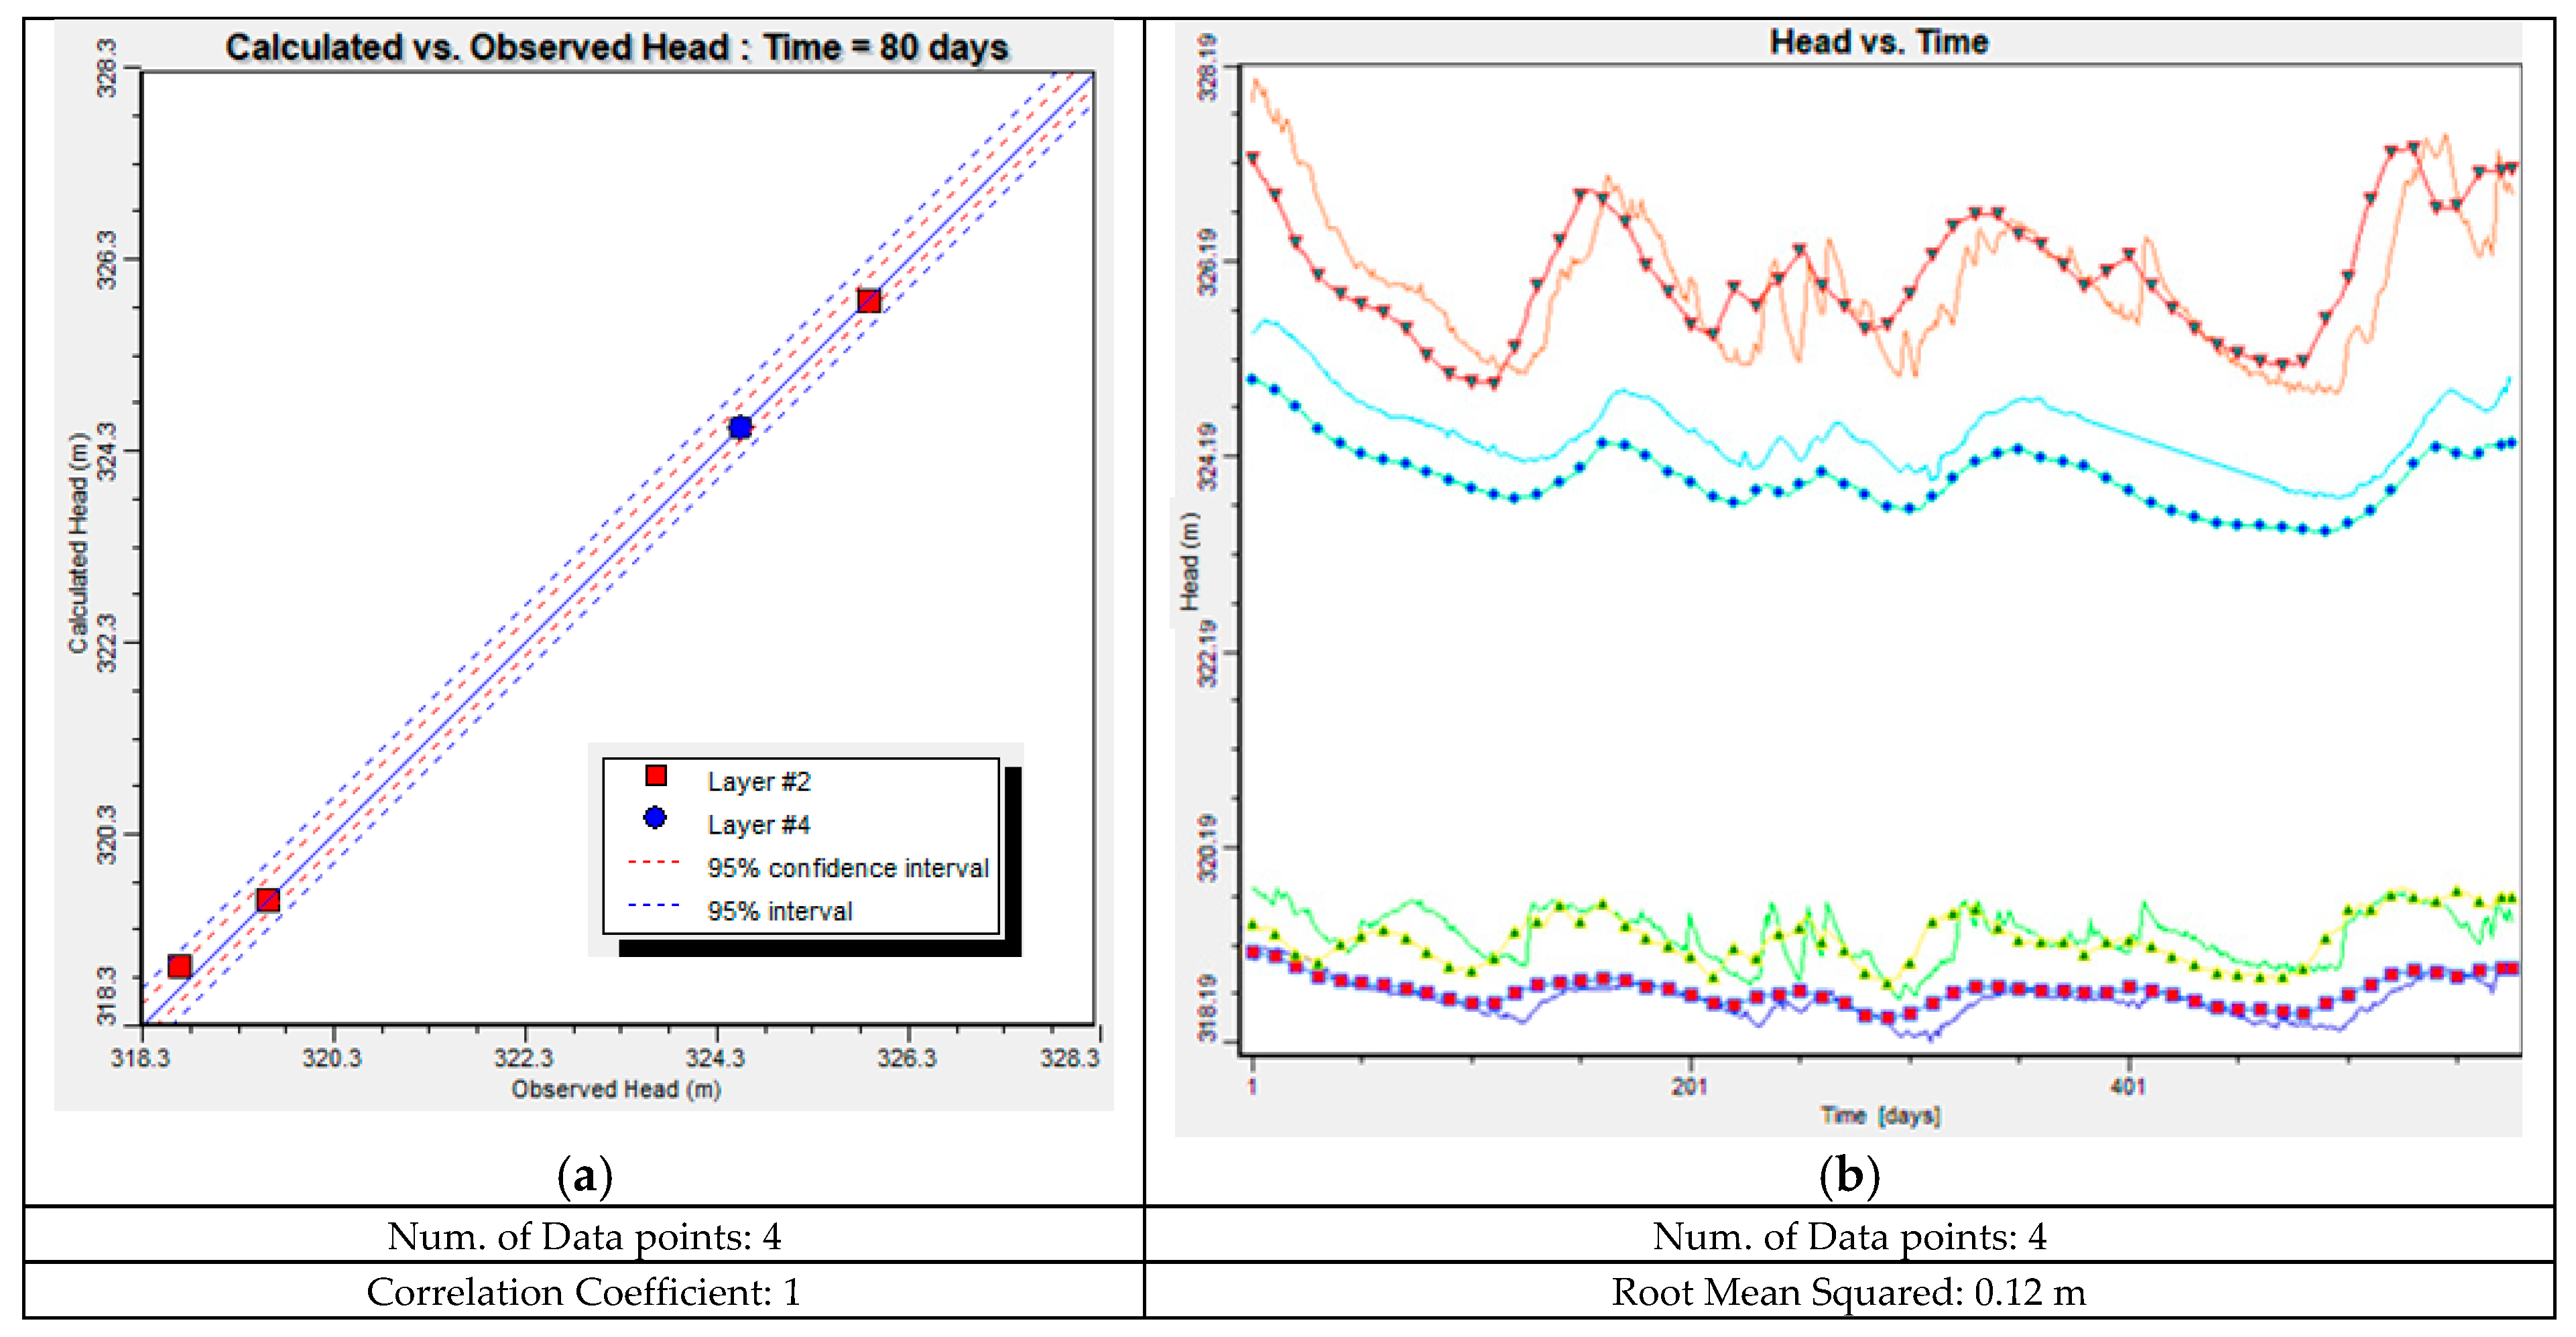
4.1. Steady-State Calibration
4.2. Transient State Calibration
4.3. Climate Change
4.4. Contaminant Transport Using MT3D
4.5. Contaminant Transport Using PHT3D
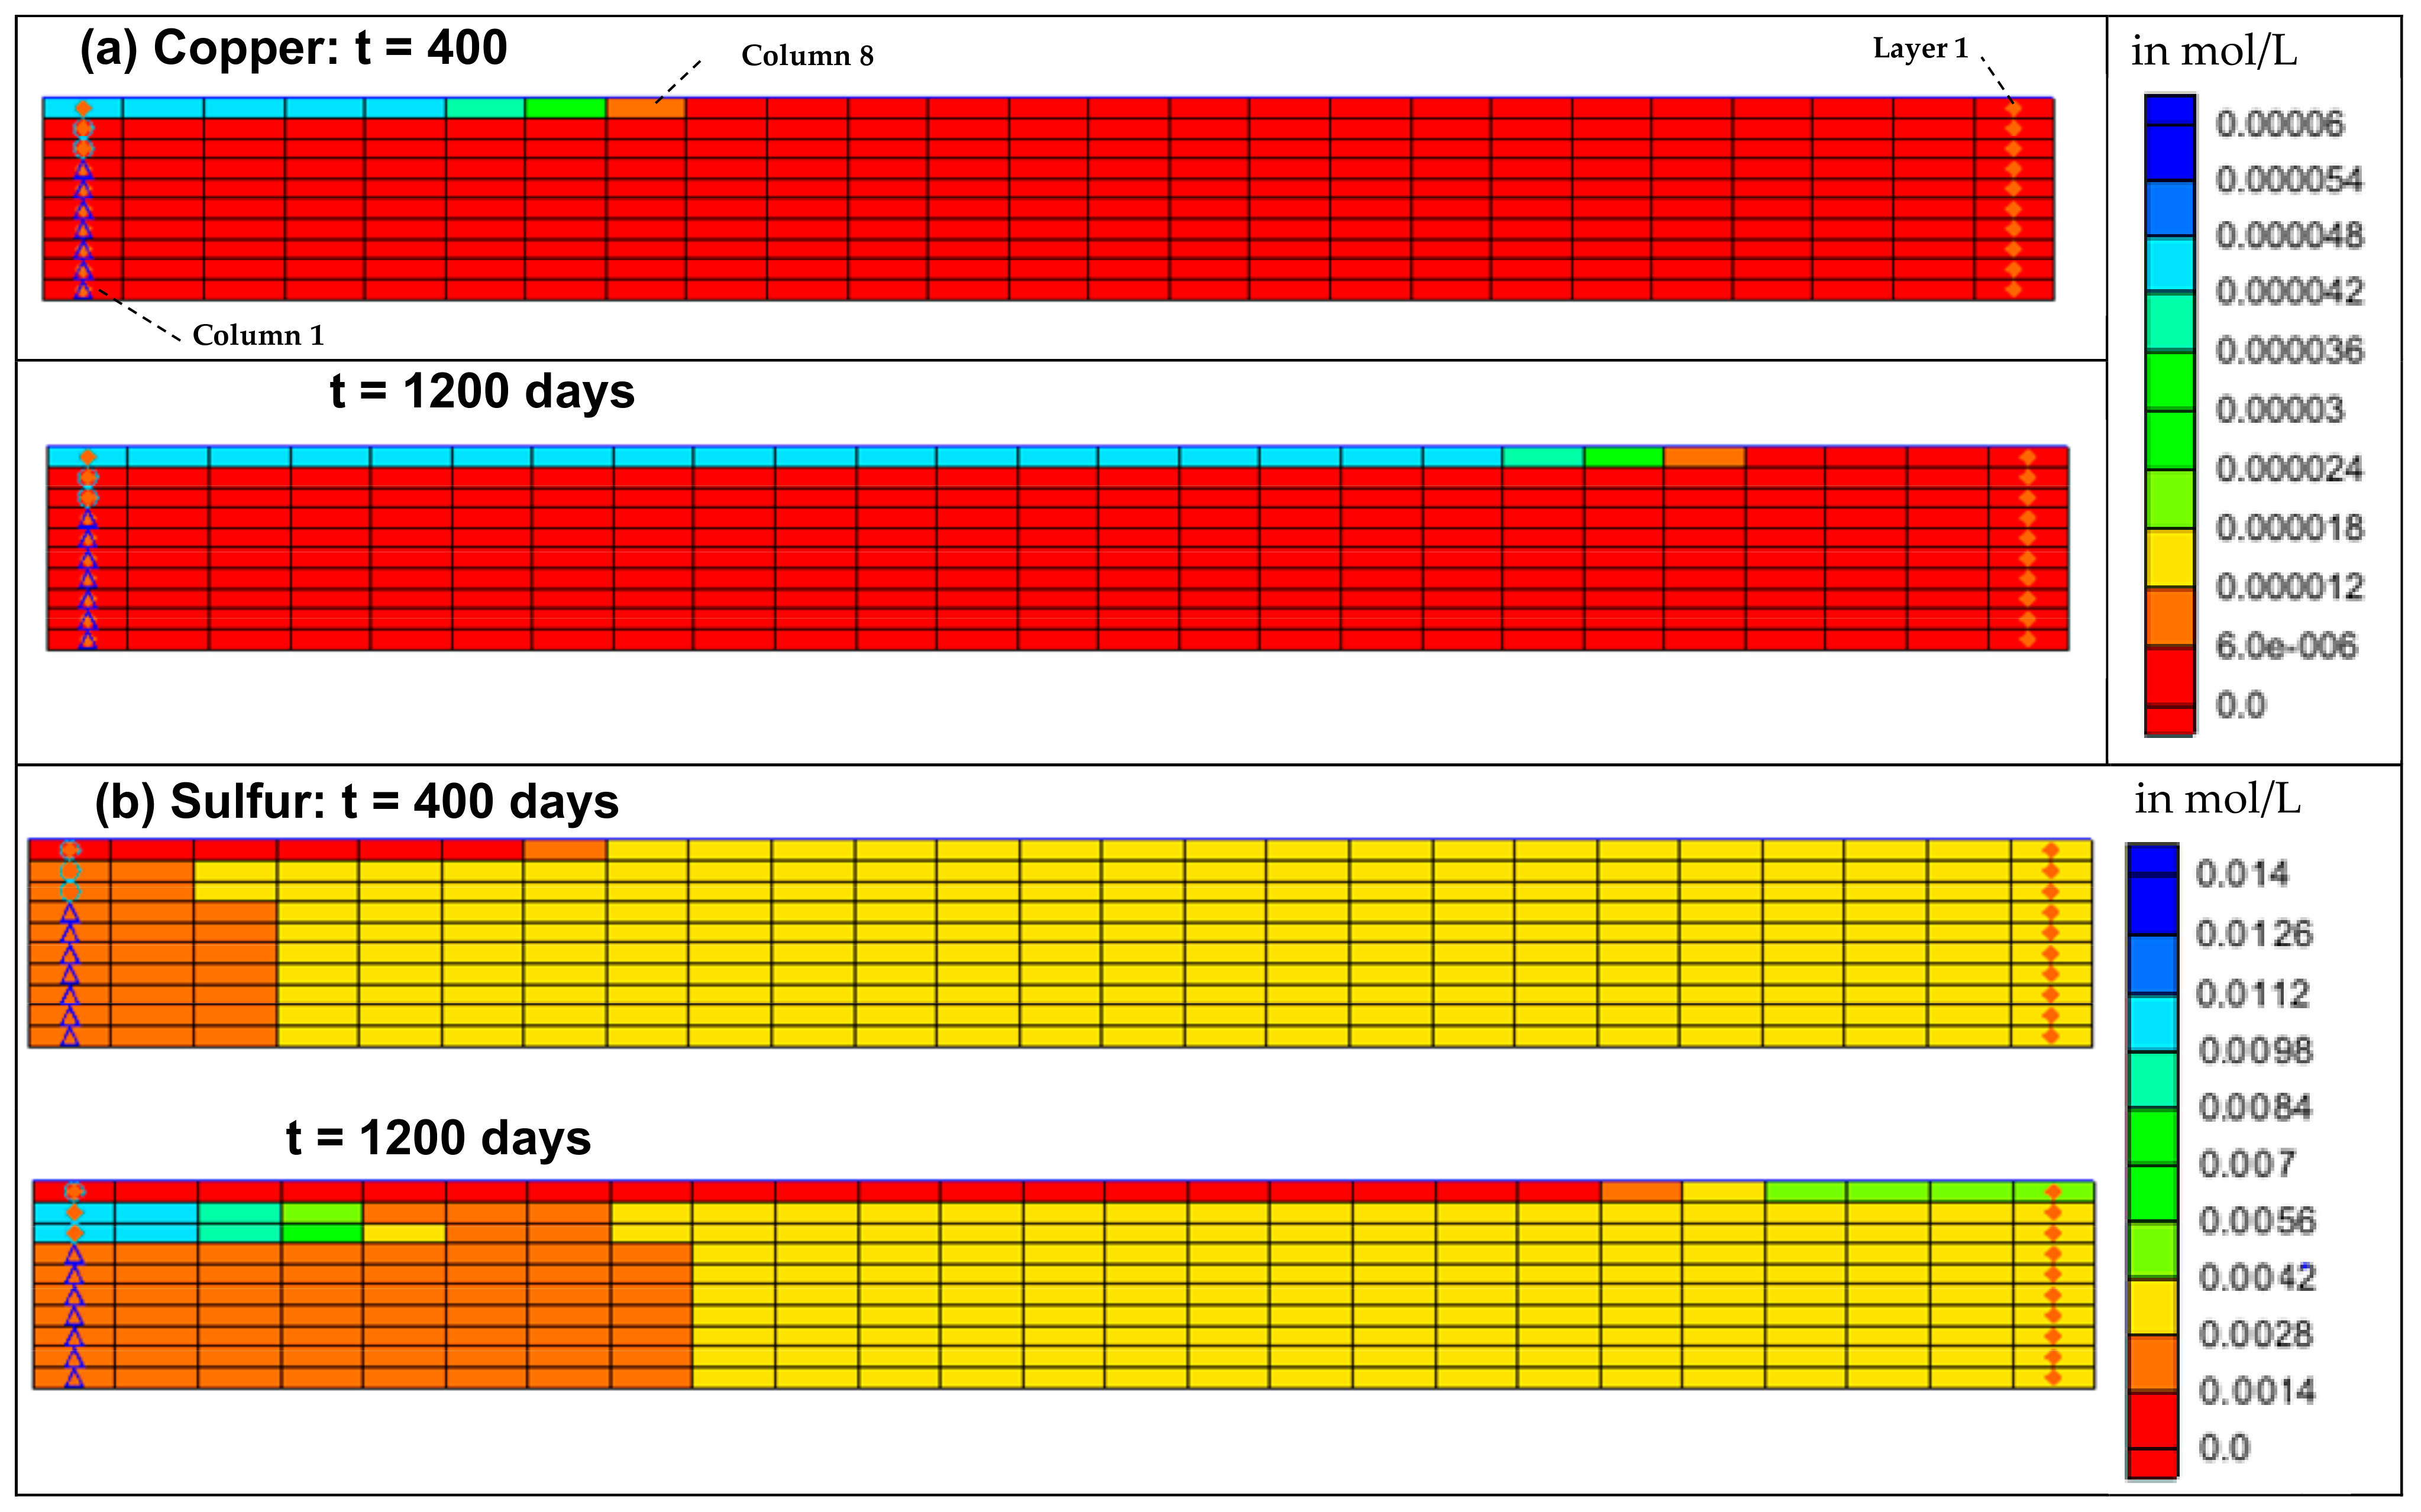
4.5.1. Copper in Sludge and Slag
4.5.2. Sulfur in Mine Tailing
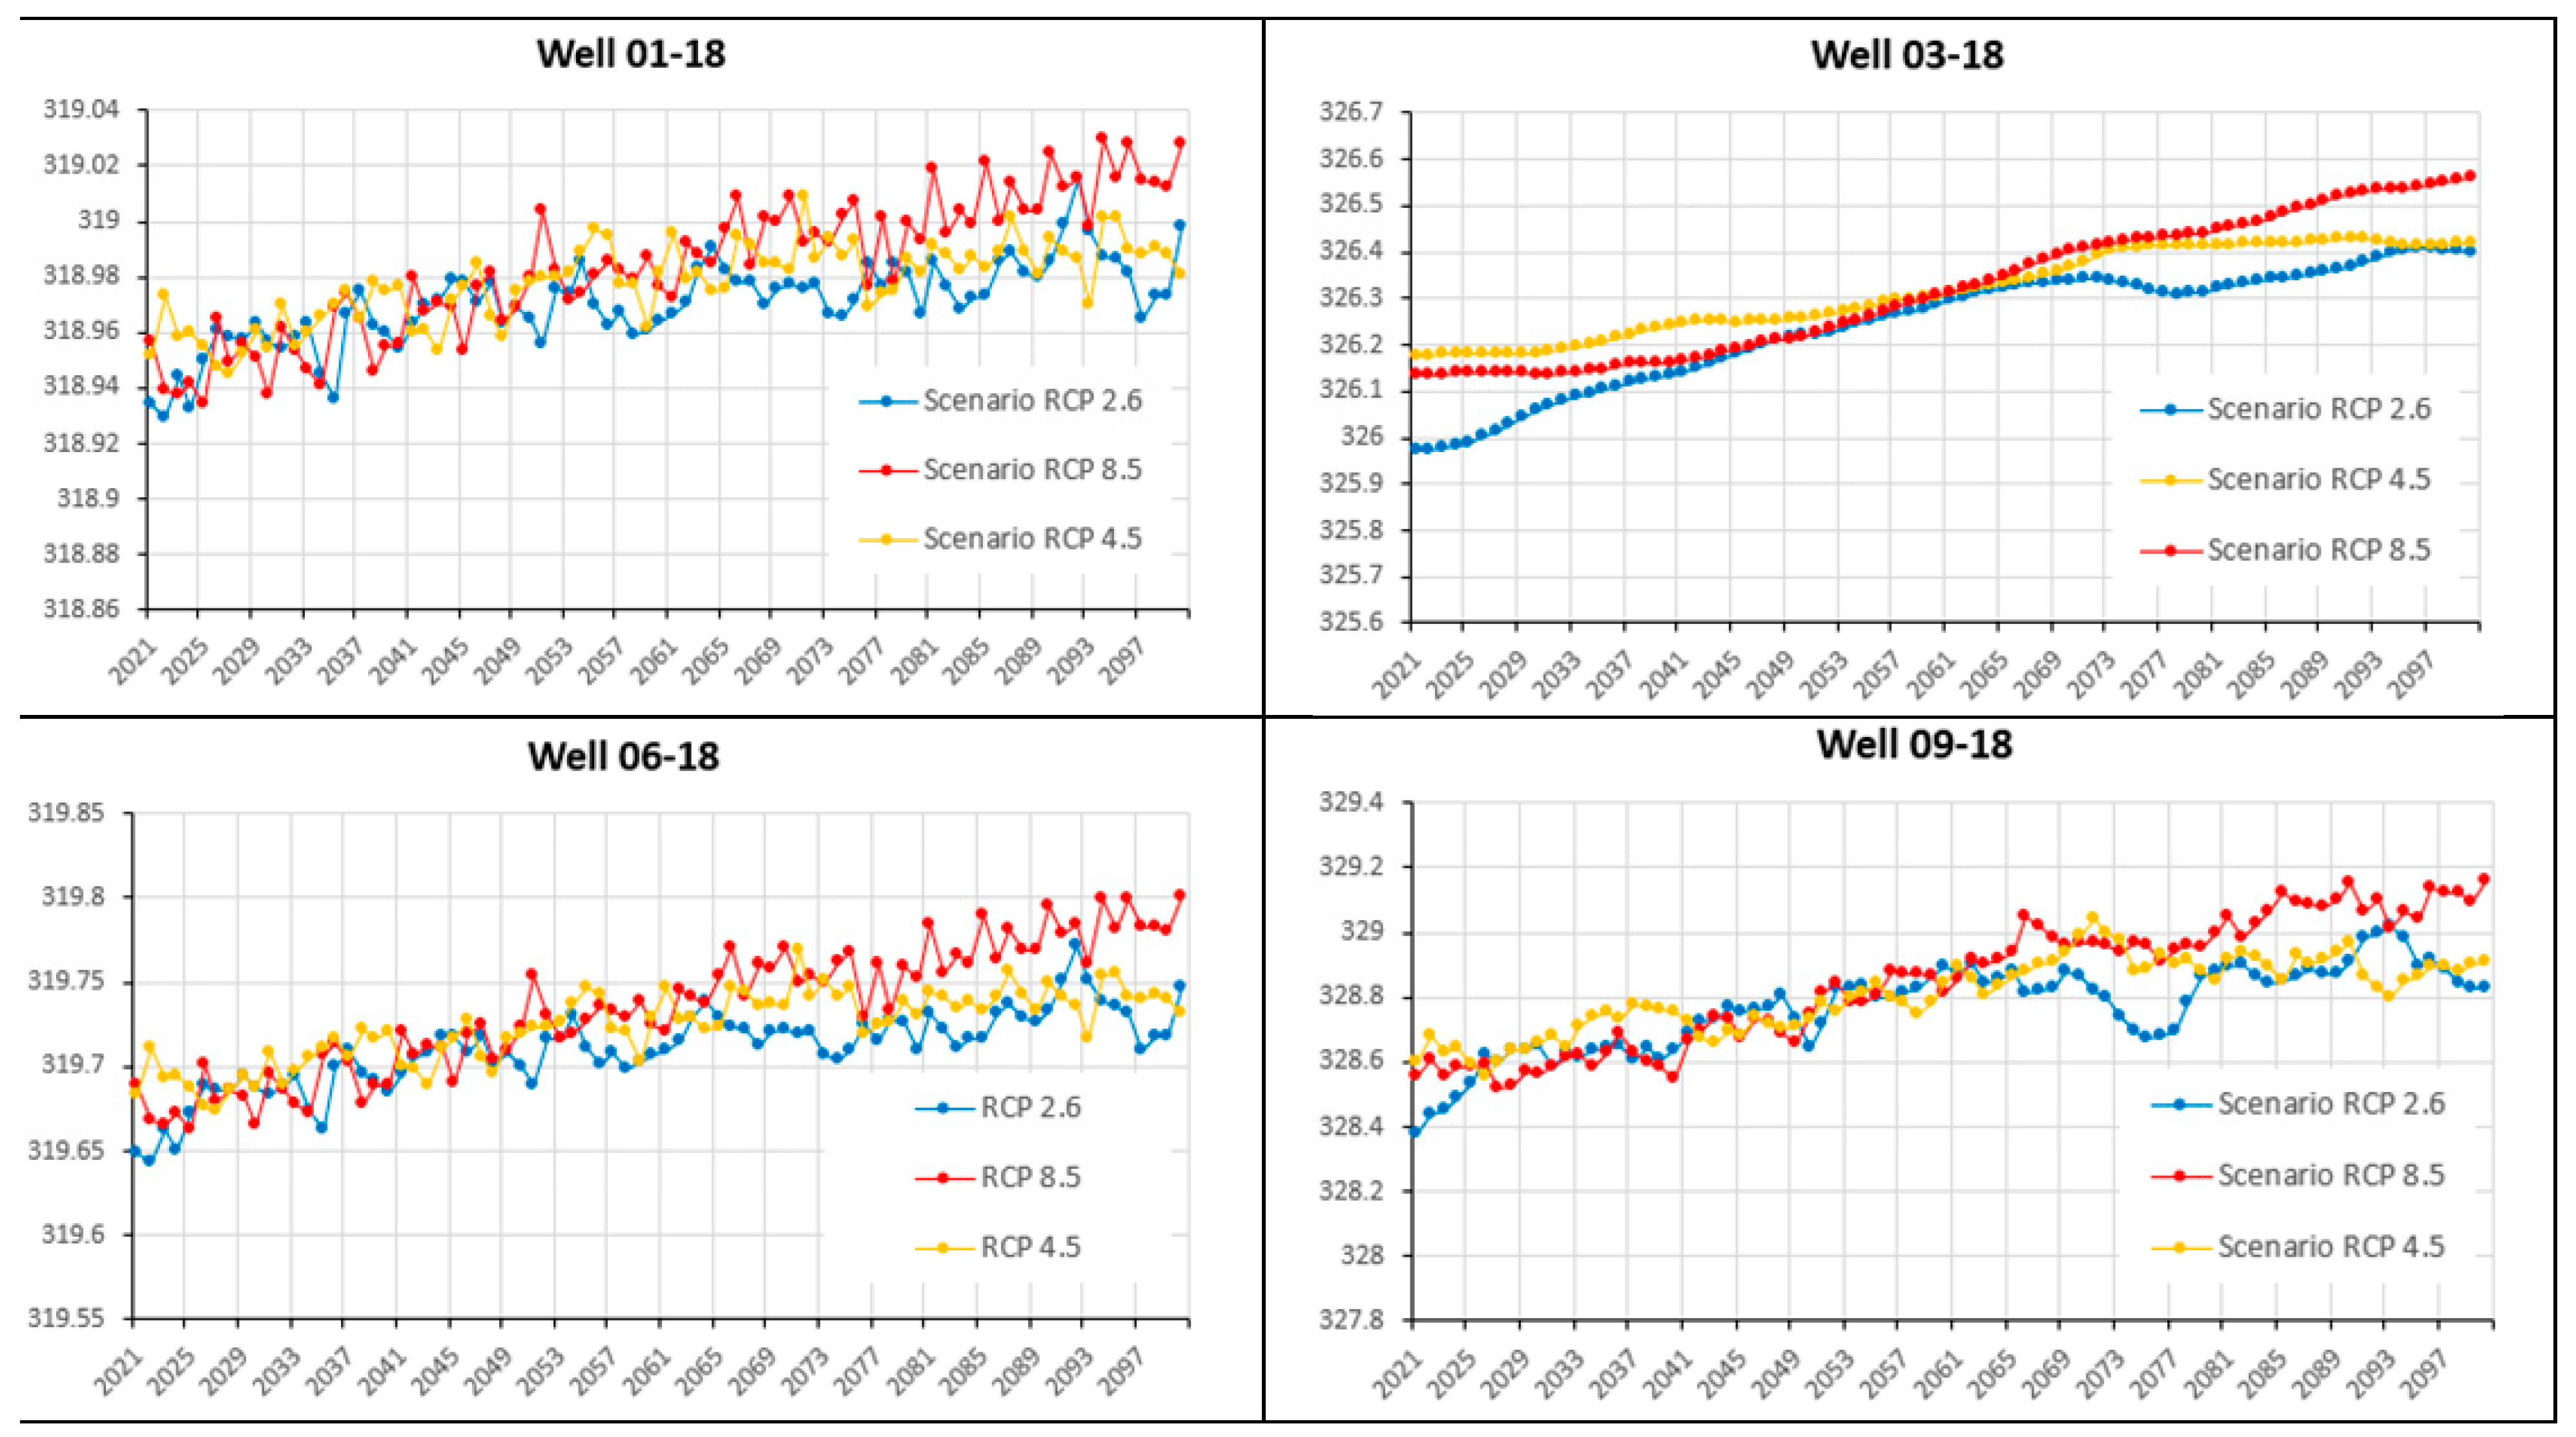
4.6. Climate Change, Reclamation Technique Using Visual Modflow
5. Conclusions
Author Contributions
Funding
Data Availability Statement
Acknowledgments
Conflicts of Interest
Abbreviations
| AMD | Acid Mine Drainage |
| EWT | Elevated Water Table |
| CCBE | Cover with Capillary Barrier Effect |
| TSF | Tailings Storage Facilities |
| RCP | Representative Concentration Pathway |
| Mt | Million tons |
| ha | Hectares |
| GPR | Ground-Penetrating Radar |
| EMW | Electromagnetic Waves |
| ERT | Electrical Resistivity Tomography |
| DEM | Digital Elevation Model |
| GIS | Geographic information System |
| CMIP5 | Coupled Model Intercomparison Project 5 |
| CC | Climate Change |
| Bi-CGSTAB | Bi-Conjugate Gradient Stabilized |
| RMSE | Root Mean Squared Error |
| MA | Mean Absolute Error |
References
- Aubertin, M.; Bussière, B.; Pabst, T.; James, M.; Mbonimpa, M. Review of the reclamation techniques for acid-generating mine wastes upon closure of disposal sites. In Proceedings of the 2nd Geo-Chicago Conference, Chicago, IL, USA, 14–18 August 2016; pp. 343–358. [Google Scholar]
- Aubertin, M.; Bussière, B.; Bernier, L. Environnement et Gestion des Rejets Miniers [Environment and Mine Wastes Management]; Manual on CD-ROM; Presses Internationales Polytechnique: Montreal, QC, Canada, 2002. [Google Scholar]
- Aubertin, M.; Chapuis, R.P.; Aachib, M.; Bussière, B.; Ricard, J.-F.; Tremblay, L. Évaluation en Laboratoire de Barrières Sèches Construites à Partir de Résidus Miniers [Laboratory Evaluation of Dry Covers Constructed from Mine Tailings]. Report NEDEM/MEND. 1995. Available online: http://www.mend-nedem.org (accessed on 5 December 2023).
- Bussière, B.; Aubertin, M.; Zagury, G.J.; Potvin, R.; Benzaazoua, M. Principaux défis et pistes de solution pour la restauration des aires d’entreposage de rejets miniers abandonnées [Key challenges and possible solutions for reclamation of abandoned mine waste storage areas]. In Proceedings of the Symposium 2005 Sur L’environnement et les Mines, Rouyn-Noranda, QC, Canada, 15–18 May 2005. [Google Scholar]
- Maqsoud, A.; Bussère, B.; Mbonimpa, M. Low Saturated Hydraulic Conductivity Covers. In Hard Rock Mine Reclamation: From Prediction to Management of Acid Mine Drainage; Bussière, B., Guittonny, M., Eds.; CRC Press: New York, NY, USA, 2021. [Google Scholar]
- MEND (Mine Environment Neutral Drainage). MEND Manual, Report 5.4.2, Volume 4–Prevention and Control; Secretariat CANMET: Ottawa, ON, Canada, 2001. [Google Scholar]
- Ritcey, G.M. Tailings Management, Problems and Solutions in the Mining Industry. In Process Metallurgy 6; Elsevier: Amsterdam, The Netherlands, 1989. [Google Scholar]
- SRK (Steffen Robertson and Kirsten (B.C.) Inc.). Draft Acid Rock Drainage Technical Guide. Volume I: Report Prepared for British Columbia, Acid Mine Drainage Task Force; Bi-Tech Publishers Ltd, SRK: Vancouver, BC, Canada, 1989. [Google Scholar]
- Amyot, D.; Vézina, S. Flooding as a Reclamation Solution to an Acidic Tailings Pond-the Solbec case. In Proceedings of the 4th International Conference on Acid Rock Drainage, Vancouver, BC, Canada, 31 May–6 June 1997; pp. 681–696. [Google Scholar]
- Fraser, W.W.; Robertson, J.D. Subaqueous Disposal of Reactive Mine Waste: An Overview and Update of Case Studies-MEND/Canada. In Proceedings of the International Land Reclamation and Mine Drainage Conference and 3rd International Conference on the Abatement of Acidic Drainage, Pittsburgh, PA, USA, 24–30 April 1994; pp. 250–259. [Google Scholar]
- Simms, P.H.; Yanful, E.K.; St-Arnaud, L.; Aubé, B. A laboratory evaluation of metal release and transport in flooded preoxidized mine tailings. Appl. Geochem. 2001, 15, 1245–1263. [Google Scholar] [CrossRef]
- Aubertin, M.; Pépin, N.; Mbonimpa, M.; James, M.; Prétot, F.; Maknoon, M.; Bussière, B. Vers une mise à jour des critères de stabilité géotechnique pour la conception des ouvrages de retenue de résidus miniers [Towards an update of the geotechnical stability criteria for the design of tailings impoundments]. In Proceedings of the Symposium on Mines and the Environment, Rouyn-Noranda, QC, Canada, 6–9 November 2011. 38p. [Google Scholar]
- Aubertin, M.; Dionne, J.; Marcoux, L. Design guidelines and stability criteria of engineering works for water covers. In Proceedings of the 4th ICARD, Vancouver, BC, Canada, 31 May–6 June 1997; pp. 1849–1866. [Google Scholar]
- Aubertin, M.; Bussière, B.; Monzon, M.; Joanes, A.M.; Gagnon, D.; Barbera, J.M.; Aachib, M.; Bédard, C.; Chapuis, R.P.; Bernier, L. Étude sur Les Barrières Sèches Construites À Partir de Résidus Miniers Phase II—Essais En Place [A study of Dry Covers Constructed from Mine Tailings, Phase II: In-Situ Test]. Mine Environment Neutral Drainage Report (NEDEM/MEND) 2.22.2c; CANMET: Ottawa, ON, Canada, 1999; 395p. [Google Scholar]
- Dagenais, A.M.; Aubertin, M.; Bussière, B. Parametric study on the water content profiles and oxidation rates in nearly saturated tailings above the water table. In Proceedings of the 7th ICARD, St. Louis, MI, USA, 26–30 March 2006; Barnhisel, R.I., Ed.; The American Society of Mining and Reclamation: St. Louis, MO, USA, 2006; pp. 405–420. [Google Scholar]
- Dagenais, A.-M. Techniques de Contrôle du Drainage Minier Acide Basées sur Les Effets Capillaires [Techniques to Control Acid Mine Drainage Based on Capillary Barrier Effects]. Ph.D. Thesis, Polytechnique Montréal, Montreal, QC, Canada, 2005. [Google Scholar]
- Demers, I.; Bussière, B.; Benzaazoua, M.; Mbonimpa, M.; Blier, A. Column test investigation on the performance of monolayer covers made of desulphurized tailings to prevent acid mine drainage. Min. Eng. 2008, 21, 317–329. [Google Scholar] [CrossRef]
- Orava, D.A.; Tremblay, G.A.; Tibble, A.; Nicholson, R. Prevention of acid rock drainage through the application of in-pit disposal and elevated water table concepts. In Proceedings of the 4th ICARD, Vancouver, BC, Canada, 31 May–6 June 1997; pp. 973–983. [Google Scholar]
- Ouangrawa, M.; Aubertin, M.; Molson, J.W.; Bussière, B.; Zagury, G.J. Preventing Acid Mine Drainage with an Elevated Water Table: Long-Term Column Experiments and Parameter Analysis. Water Air Soil Pollut. 2010, 213, 437–458. [Google Scholar] [CrossRef]
- Ouangrawa, M.; Molson, J.; Aubertin, M.; Bussière, B.; Zagury, G.J. Reactive transport modeling of mine tailings columns with capillarity-induced high water saturation for preventing sulfide oxidation. Appl. Geochem. 2009, 24, 1312–1323. [Google Scholar] [CrossRef]
- Ouangrawa, M. Étude Expérimentale et Analyse Numérique des Facteurs Qui Influencent Le Comportement Hydrogéochimique de Résidus Miniers Sulfureux Partiellement Saturés [Experimental Study and Numerical Analysis of the Factors that Influence the Hydrogeochemical Behavior of Partially Saturated Sulphidic Mining Residues]. Ph.D. Thesis, Polytechnique Montréal, Montreal, QC, Canada, 2007. [Google Scholar]
- Ouangrawa, M.; Molson, J.; Aubertin, M.; Zagury, G.J.; Bussière, B. The effect of water table elevation on acid mine drainage from reactive tailings: A laboratory and numerical modeling study. In Proceedings of the 7th International Conference on Acid Rock Drainage (ICARD), St. Louis, MO, USA, 26–30 March 2006; Barnhisel, R.I., Ed.; The American Society of Mining and Reclamation: St. Louis, MO, USA, 2006; pp. 1473–1482. [Google Scholar]
- Pabst, T.; Aubertin, M.; Bussière, B.; Molson, J. Column tests to characterize the hydrogeochemical response of pre-oxidised acid-generating tailings with a monolayer cover. Water Air Soil Pollut. 2014, 225, 1–21. [Google Scholar] [CrossRef]
- SENES. Review of Use of an Elevated Water Table as a Method to Control and Reduce Acidic Drainage from Tailings; MEND Report 2.17.1; CANMET: Ottawa, ON, Canada, 1996. [Google Scholar]
- Collin, M. Mathematical Modeling of Water and Oxygen Transport in Layered Soil Covers for Deposits of Pyritic Mine Tailings; Royal Institute of Technology: Stockholm, Sweden, 1987. [Google Scholar]
- Cosset, G.; Aubertin, M. Physical and numerical modeling of a monolayer cover placed on reactive tailings. In Proceedings of the 63rd CGC & 1st Joint CGS/CNC-IPA Permafrost Speciality Conference, Calgary, AB, Canada, 12–16 September 2010. [Google Scholar]
- Demers, I.; Bussière, B.; Rousselle, M.; Aubertin, M.; Pabst, T.; Lacroix, R. Laboratory Evaluation of Reclamation Scenarios for the Spillage Areas of the Abandoned Manitou Mine Site Using Goldex Tailings. In Proceedings of the World Mining Congress, Montréal, QC, Canada, 11–15 August 2013. [Google Scholar]
- Dobchuk, B.; Nichol, C.; Wilson, G.W.; Aubertin, M. Evaluation of a single-layer desulphurized tailings cover. Can. Geotech. J. 2013, 50, 777–792. [Google Scholar] [CrossRef]
- Ethier, M.P.; Bussière, B.; Aubertin, M.; Maqsoud, A.; Demers, I.; Broda, S. In situ evaluation of the performance of the reclamation measures implemented on an abandoned reactive tailings disposal site. Can. Geotech. J. 2018, 55, 1742–1755. [Google Scholar] [CrossRef]
- Maqsoud, A.; Mbonimpa, M.; Benzaazoua, M.; Turcotte, S. Evaluation performance of a monolayer cover with an elevated water table used for the reclamation of the abandoned Aldermac mine site (Québec, Canada). Min. J. 2022, 2, 65–85. [Google Scholar] [CrossRef]
- Mbonimpa, M.; Aubertin, M.; Aachib, M.; Bussière, B. Diffusion and consumption of oxygen in unsaturated cover materials. Can. Geotech. J. 2003, 40, 916–932. [Google Scholar] [CrossRef]
- Cabral, A.; Racine, I.; Burnotte, F.; Lefebvre, G. Diffusion of oxygen through a pulp and paper residue barrier. Can. Geotech. J. 2000, 37, 201–217. [Google Scholar] [CrossRef]
- Tassé, N.; Germain, D. Performance of Forestry Wastes for the Treatment of Acid Mine Drainage through a Reactive Barrier. In Proceedings of the 7th International Symposium on Environmental Issues and Waste Management in Energy and Mineral Production (SWEMP 2002), Calgliari, Italy, 7–10 October 2002; pp. 723–773. [Google Scholar]
- Bussière, B.; Maqsoud, A.; Aubertin, M.; Martschuk, J.; McMullen, J.; Julien, M. Performance of the oxygen limiting cover at the LTA site, Malartic, Québec. Env. Soc. CIM 2006, 99, 1–11. [Google Scholar]
- Collin, M.; Rasmuson, A. Mathematical Modelling of Water and Oxygen Transport in Layered Soil Covers for Deposits of Pyritic Mine Tailings, Acid Mine Drainage: Designing for Closure. In Proceedings of the GAC-MAC Annual Meeting, Vancouver, BC, Canada, 16–18 May 1990; pp. 311–333. [Google Scholar]
- Maqsoud, A.; Bussière, B.; Turcotte, S.; Roy, M. Performance Evaluation of Covers with Capillary Barrier Effects (CCBE) under Deep Groundwater Conditions Using Experimental Cells. In Proceedings of the Conférence Canadienne de Géotechnique, GeoOttawa, Ottawa, ON, Canada, 1–4 October 2017. [Google Scholar]
- Maqsoud, A.; Bussière, B.; Mbonimpa, M.; Aubertin, M.; Chouteau, M. Suction break to control slope-induced effects in covers used as gas barrier. Can. Geotech. J. 2011, 48, 53–71. [Google Scholar] [CrossRef]
- Nicholson, R.V.; Gillham, R.W.; Cherry, J.A.; Reardon, E.J. Reduction of acid generation in mine tailings through the use of moisture-retaining cover layers as oxygen barriers. Can. Geotech. J. 1989, 26, 1–8. [Google Scholar] [CrossRef]
- WSP. Modélisation Hydrogéologique Parc À Résidus Actif—Quémont 2; Glencore Canada Corporation Fonderie Horne: Rouyn-Noranda, QC, Canada, 2019; 296p. [Google Scholar]
- Broda, S.; Aubertin, M.; Blessent, D.; Maqsoud, A.; Bussière, B. Simulating the variation of the phreatic surface level to assess reclamation techniques for an acidic tailings impoundment: A fieldscale study. In Proceedings of the 67th CGS Conference, Regina, SK, Canada, 28 September–1 October 2017. 7p. [Google Scholar]
- Khalil, B.; Broda, S.; Adamowski, J.; Ozga-Zielinski, B.; Donohoe, A. Short-term forecasting of groundwater levels under conditions of mine-tailings recharge using wavelet ensemble neural network models. Hydrogeol. J. 2014, 23, 121–141. [Google Scholar] [CrossRef]
- Pabst, T.; Molson, J.; Aubertin, M.; Bussière, B. Physical and geochemical transport modeling of pre-oxidized acid-generating tailings with a monolayer cover. In Proceedings of the 2011 Mine Clos Conference, Lake Louise, AB, Canada, 18–21 September 2011. [Google Scholar]
- El Hamidi, M.J.; Maqsoud, A.; Belem, T. A Kinetic Test Method to Assess the Long-Term Acid Generation Behavior of Sludge/Slag and Mine Tailings of Mine a (Quebec, Canada). In Recent Research on Sedimentology, Stratigraphy, Paleontology, Geochemistry, Volcanology, Tectonics, and Petroleum Geology. MedGU 2022. Advances in Science, Technology & Innovation; Springer: Cham, Switzerland, 2024. [Google Scholar] [CrossRef]
- El-Mrabet, E. Développement D’Approches Géophysiques, D’Imagerie Thermique et de Modélisation pour L’évaluation Des Processus Hydrologiques au Sein D’Un Parc à Résidus Miniers. Master’s Thesis, Research Institute on Mines and the Environment (URSTM), Université du Québec en Abitibi-Témiscamingue (UQAT), Rouyn-Noranda, QC, Canada, 2021; 215p. [Google Scholar]
- Kahlaoui, S. Évaluation des Échanges Hydrogéochimiques Entre un Parc à Résidus Miniers et les Aquifères Périphériques. Master’s Thesis, Research Institute on Mines and the Environment (URSTM), Université du Québec en Abitibi-Témiscamingue (UQAT), Rouyn-Noranda, QC, Canada, 2022; 176p. [Google Scholar]
- WSP. Plan de Restauration—Sites Sctifs; Glencore Canada Corporation—Fonderie Horne: Rouyn-Noranda, QC, Canada, 2019. [Google Scholar]
- Granados, A.A.; Maqsoud, A.; Belem, T.; Mbonimpa, M.; Viger, M.E. Évaluation sur le terrain de la performance des recouvrements à base d’argile. In Proceedings of the Canadian Geotechnical Confrence, GeoCalgary, Calgary, AB, Canada, 2–5 October 2022. [Google Scholar]
- Niamké, E.; Maqsoud, A.; Belem, T.; Mbonimpa, M. Laboratory assessment of the clay-based covers ability to limit the acid mine drainage production. In Proceedings of the Canadian Geotechnical Confrence GeoSaskatoon, Saskatoon, SK, Canada, 1–4 October 2023. [Google Scholar]
- Otalora Vasquez, N.C.; Maqsoud, A.; Belem, T. Physical and Numerical Modeling of a Flow Control Layer Made with a Sludge and Slag Mixture for Use in Waste Rock Pile Reclamation. Mining 2024, 4, 841–862. [Google Scholar] [CrossRef]
- Données Québec. Database for the Rouyn Region, Québec, Canada. 2022. Available online: https://www.donneesquebec.ca (accessed on 15 November 2021).
- Envirotecheau. Boreholes Logs and Pumping Test Data of the Quémont 2 Tailing Storage Obtained from WSP Report. 1993. [Google Scholar]
- SNC LAVALIN. Boreholes Logs of the Quémont 2 Tailing Storage Obtained from WSP Report; SNC LAVALIN: Montreal, QC, Canada, 2007. [Google Scholar]
- Environment Canada. Climatic Database for the Rouyn Station, Québec, Canada. 2022. Available online: www.climate.weather.gc.ca (accessed on 15 November 2021).
- Canadian Climate Data and Scenarios. Climate change database for the Rouyn region, Québec, Canada. 2022. Available online: https://climate-scenarios.canada.ca/?page=statistical-downscaling (accessed on 15 November 2021).
- Geocon. Geotechnical Investigation (Text and Boring Logs); Geocon: Lavalin, QC, Canada, 1988; p. 102. [Google Scholar]
- URSTM. Essais Statiques et Cinétiques sur Matériaux de la Fonderie Horne pour Augmentation de Déposition de Résidus; Unité de Recherche et de Service en Technologie Minérale: Rouyn-Noranda, QC, Canada, 2009; p. 42. [Google Scholar]
- Bouwer, H.; Rice, R.C. A slug test method for determining hydraulic conductivity of unconfined aquifers with completely or partially penetrating wells. Water Resour. Res. 1976, 12, 423–428. [Google Scholar] [CrossRef]
- Richelieu. Pumping Test Data of the Quémont 2 Tailing Storage Obtained from WSP Report. 2011. [Google Scholar]
- Amec. Pumping Test Data of the Quémont 2 Tailing Storage Obtained from WSP Report. 2014. [Google Scholar]
- Environnement Quebec. Directive 019 sur L’Industrie Manière, Québec, Canada. 2012, p. 105. Available online: https://www.environnement.gouv.qc.ca/milieu_ind/directive019/ (accessed on 15 November 2021).
- Waterloo Hydrogeologic Inc. Visual MODFLOW User’s Manual; Waterloo Hydrogeologic Inc: Waterloo, ON, Canada, 2022. [Google Scholar]
- Harbaugh, A.W.; Banta, E.R.; Hill, M.C.; McDonald, M.G. MODFLOW-2000, the U.S. Geological Survey Modular Ground-Water Model–User Guide to Modularization Concepts and the Ground-Water Flow Process; U.S. Geological Survey: Reston, VA, USA, 2000.
- McDonald, M.G.; Harbaugh, A.W. A Modular Three Dimensional Finite-Difference Groundwater Flow Model; Techniques of Water-Resources Investigations Report 06-A1; U.S. Geological Survey: Reston, VA, USA, 1988; 588p.
- Zheng, C.; Wang, P.P. MT3DMS: A Modular Three-Dimensional Multispecies Model for Simulation of Advection, Dispersion and Chemical Reactions of Contaminants in Groundwater Systems; U.S. Army Engineer Research and Development Center: Vicksburg, MS, USA, 1999. [Google Scholar]
- Prommer, H.; Barry, D.A. PHT3D–A Reactive Multi-Component Transport Model for Saturated Porous Media. Version 1.0 User’s Manual; Contaminated Land Assessment and Remediation Research Centre, The University of Edinburgh: Edinburgh, UK, 2001. [Google Scholar]
- Parkhurst, D.L.; Appelo, C.A.J. User’s Guide to PHREEQC—A Computer Program for Speciation, Reaction-Path, 1D-Transport, and Inverse Geochemical Calculations; U.S. Geological Survey Water-Resources Investigations: Reston, VA, USA, 1999.
- Engesgaard, P.; Kipp, K.L. A geochemical transport model for redox-controlled movement of mineral fronts in groundwater flow systems: A case of nitrate removal by oxidation of pyrite. Water Resour. Res. 1992, 28, 2829–2843. [Google Scholar] [CrossRef]
- Yeh, G.T.; Tripathi, V.S. A critical evaluation of recent developments in hydrogeochemical transport models of reactive multichemical components. Water Resour. Res. 1989, 25, 93–108. [Google Scholar] [CrossRef]
- United States Department of Agriculture. Chapter 11: Snowmelt, National Engineering Handbook. Part 630 Hydrology. 2012. Available online: https://www.irrigationtoolbox.com/NEH/Part630_Hydrology/H_210_630_11.pdf#:~:text=This%20chapter%20describes%20the%20basic%20physical%20processes%20that,methods%20may%20also%20be%20used%20for%20short-term%20forecasts (accessed on 15 December 2022).
- Akabzaa, T.M.; Armah, T.E.K.; Baneong-Yakubo, B.K. Prediction of acid mine drainage generation potential in selected mines in the Ashanti Metallogenic Belt using static geochemical methods. Environ. Geol. 2006, 52, 957–964. [Google Scholar] [CrossRef]
- Equeenuddin, S.M.; Tripathy, S.; Sahoo, P.K.; Panigrahi, M.K. Geochemistry of ochreous precipitates from coal mine drainage in India. Environ. Earth Sci. 2009, 61, 723–731. [Google Scholar] [CrossRef]


| Data | Data Types | Conceptual Model | Sources | Values or Year of Data Production |
|---|---|---|---|---|
| Geology/ Reservoir | Subsurface: sludge and slag, tailings, glacio-lacustrine deposits, and the rock |
|
|
|
| Boundary conditions |
|
|
| |
|
|
| ||
|
|
| ||
|
|
| ||
|
|
| ||
|
|
| ||
| ||||
|
| |||
|
| |||
|
| |||
|
|
| ||
|
|
| ||
|
|
| ||
|
|
|
| Data | Data Types | Conceptual Model | Sources | Values or Year of Data Production |
|---|---|---|---|---|
| Hydrogeology | Hydrodynamic parameters |
|
|
|
| Piezometry and depth |
|
|
| |
| Hydro-Climatology | Precipitation and Temperature |
|
|
|
| Projected precipitation and temperature |
|
|
| |
| AMD, Catch basin |
|
|
| |
| Groundwater Quality | Physical and chemical parameters |
|
|
|
|
|
| Unit | Borehole | Hydraulic Conductivity (m/s) | ||
|---|---|---|---|---|
| Test 1 | Test 2 | Geometric Mean | ||
| Unit 1 (Rock) | 01–18 | |||
| 02–18 | ||||
| 03–18 | n/d | |||
| 04–18 | ||||
| 05–18 | ||||
| Unit 4 (Mine Tailings) | 06–18 | |||
| 07–18 | ||||
| 08–18 | ||||
| 09–18 | ||||
| 10–18 | ||||
| N° | W19-07 | W22-07 | W02-18 | W04-18 |
|---|---|---|---|---|
| Fe (μg/L) | 1300 | 42,000 | 17,000 | 11,0000 |
| SO4 (μg/L) | 15,500 | 2,170,000 | 2,750,000 | 2,720,000 |
| pH | 5.54 | 6.68 | 6.67 | 5.51 |
| Parameters Unit | Values | |
|---|---|---|
| Effective porosity | 0.3 | |
| Longitudinal dispersivity (αL) | 9 | |
| Transverse dispersivity (αT) | 3 | |
| TRPT ratio m | 0.333 | |
| TRVT ratio m | 0.0333 | |
| Components and Concentration | Tailings | Sludge and slag |
| As | 0.000034703 | 0.00004138 |
| Cd | 0.000007704 | 0.00043412 |
| Co | 0.000184955 | 0.00007432 |
| Cu | 0.000140056 | 0.04547887 |
| Fe | 0.001092309 | 0.00039395 |
| Pb | 0.000000820 | 0.05791506 |
| S | 31.37866500 | 0.37429819 |
| Zn | 0.000565922 | 0.02493117 |
| pH | 7.51 | 6.85 |
| pe | 413 | 598 |
| Sulfur | 0.0313 mol/L | - |
| Reclamation Technique and RCPs | RCP 2.6 | RCP 4.5 | RCP 8.5 |
|---|---|---|---|
| Cell #1: Single layer covering clay (e = 80 cm) | Simulation 1 | Simulation 2 | Simulation 3 |
| Cell #2: Single layer covering Clay–Sand (e = 60 cm) | Simulation 4 | Simulation 5 | Simulation 6 |
| Cell #3: Single layer covering Clay–Silt (e = 60 cm) | Simulation 7 | Simulation 8 | Simulation 9 |
| Cell #4: Multilayer covering Clay–Sand–Clay (e = 40 cm each) | Simulation 10 | Simulation 11 | Simulation 12 |
Disclaimer/Publisher’s Note: The statements, opinions and data contained in all publications are solely those of the individual author(s) and contributor(s) and not of MDPI and/or the editor(s). MDPI and/or the editor(s) disclaim responsibility for any injury to people or property resulting from any ideas, methods, instructions or products referred to in the content. |
© 2025 by the authors. Licensee MDPI, Basel, Switzerland. This article is an open access article distributed under the terms and conditions of the Creative Commons Attribution (CC BY) license (https://creativecommons.org/licenses/by/4.0/).
Share and Cite
El Hamidi, M.J.; Maqsoud, A.; Belem, T.; Viger, M.-E. Three-Dimensional Groundwater and Geochemical Reactive Transport Modeling to Assess Reclamation Techniques at the Quémont 2 Mine, Rouyn-Noranda, Canada. Water 2025, 17, 1191. https://doi.org/10.3390/w17081191
El Hamidi MJ, Maqsoud A, Belem T, Viger M-E. Three-Dimensional Groundwater and Geochemical Reactive Transport Modeling to Assess Reclamation Techniques at the Quémont 2 Mine, Rouyn-Noranda, Canada. Water. 2025; 17(8):1191. https://doi.org/10.3390/w17081191
Chicago/Turabian StyleEl Hamidi, Mohamed Jalal, Abdelkabir Maqsoud, Tikou Belem, and Marie-Elise Viger. 2025. "Three-Dimensional Groundwater and Geochemical Reactive Transport Modeling to Assess Reclamation Techniques at the Quémont 2 Mine, Rouyn-Noranda, Canada" Water 17, no. 8: 1191. https://doi.org/10.3390/w17081191
APA StyleEl Hamidi, M. J., Maqsoud, A., Belem, T., & Viger, M.-E. (2025). Three-Dimensional Groundwater and Geochemical Reactive Transport Modeling to Assess Reclamation Techniques at the Quémont 2 Mine, Rouyn-Noranda, Canada. Water, 17(8), 1191. https://doi.org/10.3390/w17081191