Article

Combining Fluorescent Organic Substances, Ions, and Oxygen-18 to Trace Diverse Water Sources of River Flow in a Hilly Catchment

1
Institute of Mountain Hazards and Environment, Chinese Academy of Sciences, Chengdu 6100299, China
2
University of Chinese Academy of Sciences, Beijing 101408, China
3
National Key Laboratory for Development and Utilization of Forest Food Resources, College of Forestry and Biotechnology, Zhejiang A&F University, Hangzhou 311300, China
4
Tianmushan Forest Ecosystem Orientation Observation and Research Station of Zhejiang Province, Zhejiang A&F University, Hangzhou 311300, China
*
Authors to whom correspondence should be addressed.
Water 2025, 17(8), 1222; https://doi.org/10.3390/w17081222
Submission received: 21 March 2025 / Revised: 15 April 2025 / Accepted: 17 April 2025 / Published: 19 April 2025

Abstract

:
Reliable identification of river hydrograph separation is crucial for prioritizing water source areas to be protected from pollution. A field study was carried out in a hilly catchment with diverse land uses, located in Southwest China. A novel water-tracing method, combining the ratio of two conservative fluorescent components of dissolved organic matter, two ion ratios, and oxygen-18, was proposed for river hydrograph separation with MixSIAR. During a rain event with the longest preceding no-rain period, a set of four tracers were found to be applicable to drainage areas with diverse land uses. Notably, a drier antecedent soil moisture condition could favor the occurrence of more tracers qualified for distinguishing multiple water sources of river flow.

1. Introduction

Human activities affect hydrological behaviors in varying manners [1]. Given the complex influence of changes in land use on hydrological processes [2,3,4], reliable identification of water sources contributing to river flow in a catchment is challenging, especially in rapidly developing regions with diversified land uses. Accurate apportionment of river water sources is essential for prioritizing source areas to be protected from pollution in an intensively utilized catchment [5].
A number of tracers, including water isotopes such as oxygen-18 and deuterium, as well as various solutes such as dissolved organic matter, inorganic ions, and anthropogenic pollutants, have been reported to be conservative during mixing processes and, therefore, used in the water source apportionment of river flow [6,7,8]. Isotopic signatures of water are commonly used to distinguish rain water from soil water or groundwater [6,9]; however, their specificity across pre-event water sources under different land-use types is often limited, precluding their use to track two or more pre-event water sources of river flow [6]. Dissolved organic matter (DOM), as a mixture of biogenic materials, is pervasive in rain water, soils, surface waters, and groundwater. DOM’s composition may vary across soils under different land uses, as a result of differences in the input of plant material and the management of water and fertilization [10,11,12]. Recently, single or multiple DOM attributes were employed to identify water sources as well as flow paths [7,13]. In particular, the ratio of two conservative, humic-like, fluorescent components of DOM was proposed as a useful tracer to distinguish soil waters under different types of land use [14]. Natural inorganic ions (such as NO3, Cl, SO42−, Ca2+, Na+, and K+) and their ratios are often different between rain water, soil water, and groundwater, and therefore can be used to identify the sources of river water [15]. Moreover, some anthropogenic pollutants, such as artificial sweeteners and pharmaceuticals, have the potential for quantifying the contributions of polluted sources to surface waters and groundwater at limited spatiotemporal scales, where they are ubiquitous and exhibit persistence [8,16].
Low specificity of a single tracer between more than two water sources, along with resultant uncertainties in hydrograph separation, has often been reported [6]. Therefore, a combined use of multiple tracers is necessary to obtain more reliable estimation of water contributions from diverse (>2) sources to river flow [17,18]. Water–soil/rock interactions, vegetation cover, and anthropogenic activities (such as fertilization, irrigation, cropping, and waste discharge) jointly affect water sources and result in their diverse hydrochemical characteristics (such as parameters of major ions and dissolved organic matter) [15,19], which can be potentially used to track the diverse sources of river water in a complex landscape.
It is assumed in this study that the involvement of selected inorganic ion ratios of high specificity in water sources that have similar fluorescent DOM component ratios and water isotopic signatures will lead to more reliable results of river hydrograph separation in a catchment with complex land uses. As far as we know, no multiple-spatial-scale study in a catchment has been documented on the combined use of biogenic and abiogenic solutes and water-stable isotopes to quantify the proportions of waters from different land-use types in river flow.
This study aimed to identify as many tracers as possible for distinguishing multiple (at least five) water sources of river flow in a hilly catchment with complex land uses. This study offers a useful tool to aid in the protection of major water sources of river flow from pollution.

2. Materials and Methods

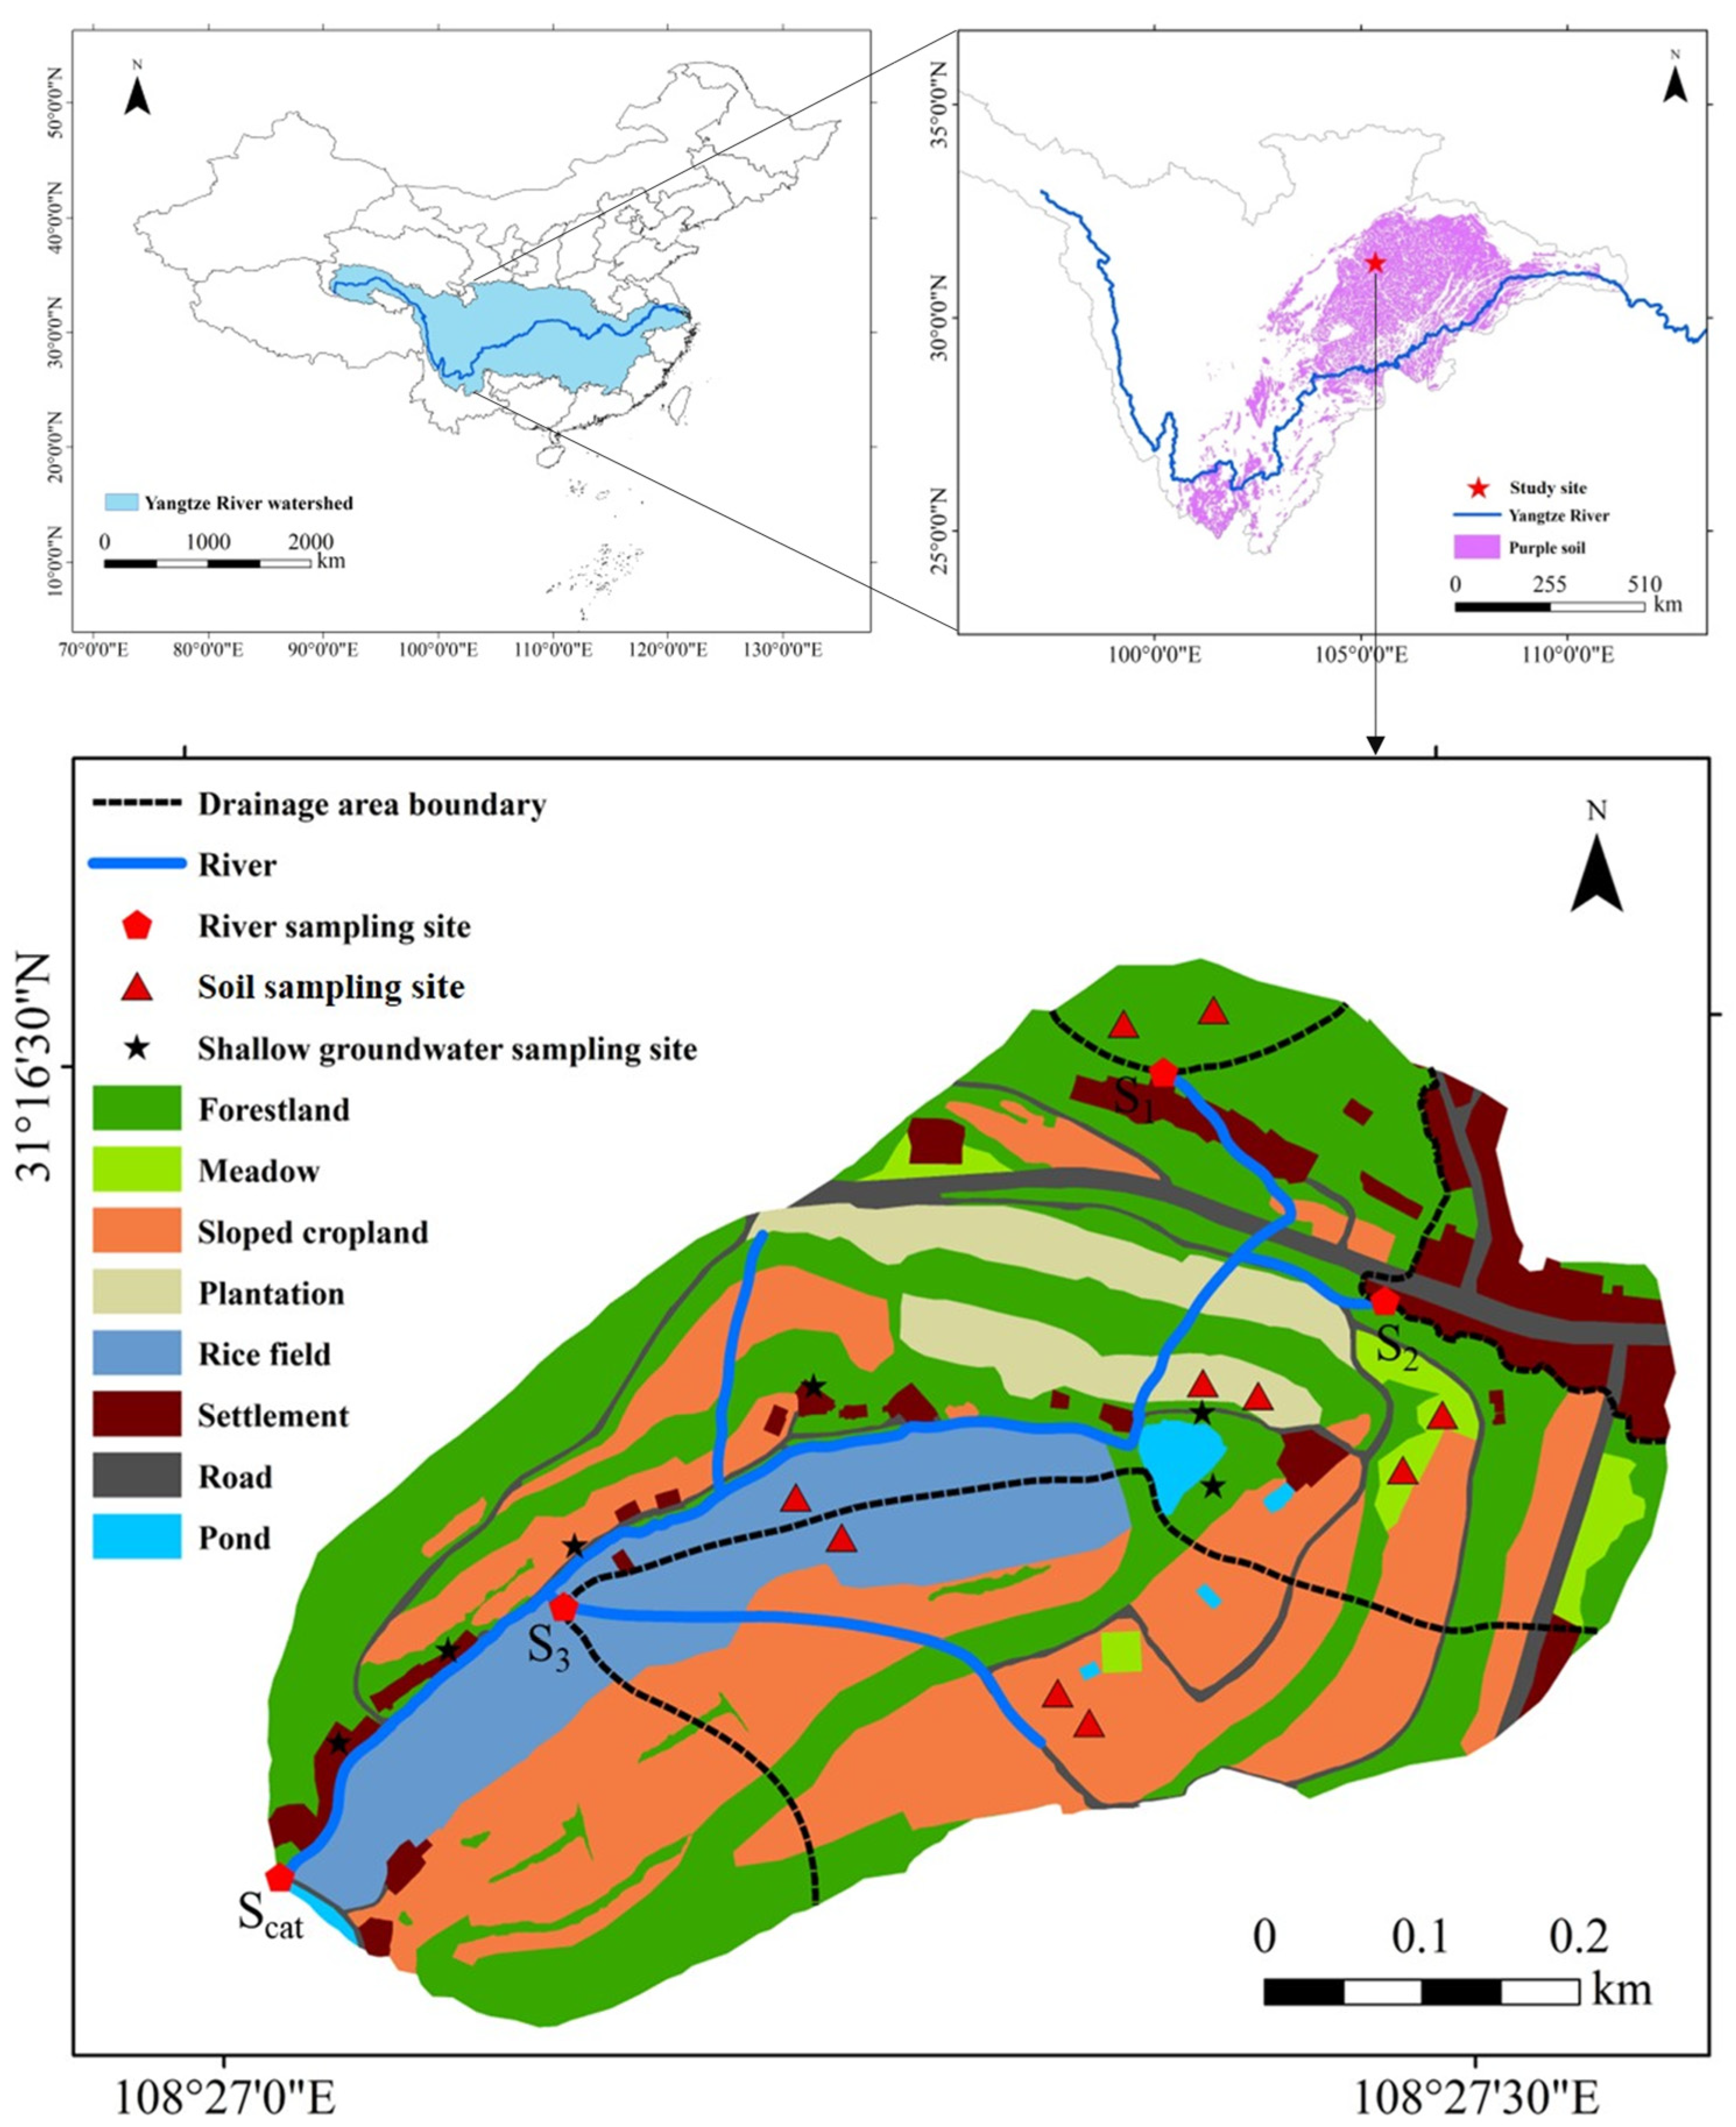
2.1. Catchment Characteristics

This research was conducted in a small agroforestry-dominated catchment (35 ha; Jieliu catchment) (31°16′ N, 105°28′ E) in the upper reaches of the Yangtze River (Figure 1). This catchment is hilly, at 360−600 m above sea level, and features a subtropical monsoon climate. From 2005 to 2023, the average annual precipitation was 922.26 mm, 79% of which took place during May−September, and the annual mean air temperature was 16.6 °C.
This catchment encompasses various land-use types, including sloped croplands (maize–corn rotation), forestlands (mixed alder–cypress), rice fields, residential areas, plantations (mainly lemon trees), meadows, and others (ponds and roads), which account for 42.2%, 32.2%, 9.9%, 7.6%, 5.2%, 1.7%, and 1.2%, respectively. The catchment’s slopes are characterized by purple soil (an Entisol containing 27% sand, 52% silt, and 21% clay), while its lowland areas are dominated by paddy soil. Finely fractured mudrock lies under the thin soil (<60 cm) and overlies an impermeable sandstone [20].
Hydrological processes on the slopes are governed successively by vertical infiltration of rain water through the soil, fast flow through mudrock fractures, lateral flow above the underlying sandstone layer, and eventual seepage into the river. Moreover, in rice fields, lateral flow may also occur above the top of the paddy hardpan (at the 45−50 cm depth) to form bank seepage into the river [21]. The river generally flows southeastward in the catchment [14]. Shallow groundwater is available only in wells located in the lowland areas of the catchment [22]. Irrigation is carried out only for rice fields whenever necessary to ensure the optimal rice production [23].

2.2. Water Sampling and Analyses

Rain water, soil waters under different land uses, groundwater (water in the six wells), and river flow/runoff were sampled for a total of three rain events, i.e., rain events 1, 2, and 3 on 28 June, 27 July, and 25 August 2023, respectively (Figure 1). For each vegetation cover type, two representative areas were selected for sampling. There were a total of ten sampling areas, including two forestlands on the upslope, two meadows on the mid-slope, two sloped croplands on the mid-slope, two plantation lands on the footslope, and two rice fields in the valley bottom. At each area, mobile soil water (if any) was sampled before rainfall with soil water samplers (1900, SEC, Santa Barbara, CA, USA) at four depths (with the porous cup’s center at 7.5 cm, 17.5 cm, 27.5 cm, and 47.5 cm, respectively) [24]; on the other hand, disturbed soil cores were taken in triplicate before rainfall to make a composite sample for each depth. Each sample was separated into two subsamples. The fresh soil subsample was extracted for bulk soil water (including both immobile and mobile fractions of soil water) by cryogenic vacuum distillation and measured for oxygen-18 [25]. Another soil subsample was sieved through a 2 mm mesh after air-drying. Notably, mobile soil water was often unavailable at some depths before rainfall, particularly after a long dry period. Therefore, bulk soil water (referred to as “soil water” hereinafter for convenience) was eventually used to represent pre-event soil water in this study. In particular, the extract of the air-dried soil subsample with ultrapure water (at a 1 g/10 mL soil/water ratio) was measured for hydrochemical parameters (major inorganic ions and DOM fluorescence), which were used to represent their pre-event levels in soil water. Moreover, the runoff discharged from the settlement drainage area and water in the six lowland wells were sampled before rainfall and measured for hydrochemical parameters as well as oxygen-18.
During rainfall, river/channel flow samples were taken at varying intervals (depending on rain intensity) from the outlets of the catchment (Scat) and nested forestland (1.6 ha; S1), settlement (2.02 ha; S2), and agricultural–forestry (12.1 ha; S3) drainage areas; meanwhile, rain water samples were also taken at 10, 20, or 30 min intervals. On the other hand, flow discharges at the time of sampling were obtained from water level data recorded by automatic data-logged water level meters using calibrated curves between the water flux and level.
All water (extract) samples were filtered through 0.45 μm cellulose acetate membrane filters and were kept at 4 °C. Rain water, soil water, well water, and river/channel water were measured for δ18O with an isotope analyzer (L2120-i, Picarro, Santa Clara, CA, USA), concentrations of Ca2+, Mg2+, Na+, K+, NO3, Cl, and SO42− by an ion chromatograph (ICS-900, Dionex, Sunnyvale, CA, USA), and fluorescence excitation–emission matrices (EEMs) with a spectrofluorometer (Aqualog, Horiba, Kyoto, Japan).
The δ18O content of the water samples was expressed in per mil (‰) and defined relative to the standard (Vienna Standard Mean Ocean Water) in terms of the 18O to 16O ratio (R), as given in Equation (1). The analytical precision was 0.05‰.
δ 18 O s a m p l e = ( R s a m p l e R s t a n d a r d 1 ) × 1000
Fluorescence intensity was determined across excitation (Ex) wavelengths of 250–500 nm and emission (Em) wavelengths of 200–600 nm. The blank EEM spectrum of Milli-Q water was employed to remove background noise. Raman scatters and Rayleigh bands were also eliminated. Fluorescent components of DOM were identified and quantified through parallel factor analysis. Then, the maximum fluorescence intensity (Fmax) was calculated for each identified component of DOM.

2.3. River Water Sources and Tracers

Pre-event water sources of river flow were selected according to the land-use composition of the drainage area and hydrological connectivity. Rain water and pre-event forestland soil water were considered to be water sources of river flow discharged from the forestland drainage area (S1). Rain water, pre-event soil waters of sloped cropland, forestland, and rice fields, and pre-event shallow groundwater were considered to be water sources of river flow discharged from the agricultural–forestry drainage area (S3). Rain water, pre-event soil waters of plantations, forestland, meadows, sloped cropland, and rice fields, pre-event shallow groundwater, and settlement baseflow runoff were considered to be water sources of river flow discharged from the entire study catchment (Scat).
Given the reported low specificity of the ratio of two conservative, humic-like, fluorescent components of DOM in soil waters under some land uses [14], multiple hydrochemical parameters, including both DOM fluorescence and inorganic ions (Ca2+, Mg2+, Na+, K+, NO3, Cl, and SO42−), were considered as potential tracers for identifying multiple water sources of river flow in this study catchment. On the one hand, the ratio of Fmax of humic-like components C1 (at Ex/Em 255/420 nm) and C2 (at Ex/Em 265 (375)/500 nm) was considered as a biogenic tracer. On the other hand, different ratios of ion concentrations were considered as abiogenic tracers, and their specificity in water sources was evaluated. It should be noted that individual Fmax and ion concentrations were not considered as tracers, as they were less conservative and of lower specificity as compared to the selected Fmax and ion concentration ratios.
Using multiple conservative tracers (such as water isotopes and various solutes) with high specificity in potential water sources always leads to more reliable quantification of flow components [26]. The combined use of hydrochemical parameters and δ18O as tracers is assumedly a better method for hydrograph separation in drainage areas with mixed land uses than the use of any single tracer. Two steps were taken to identify qualified tracers for river flow at each monitoring weir for each rain event. Firstly, hydrochemical parameters significantly correlated with δ18O were considered to be conservative. Secondly, the largest set of parameters (including the conservative hydrochemical parameters and δ18O), among which at least one parameter showed a significant difference (p < 0.05) between any two of the potential water sources, were considered to be qualified tracer(s). The specificity of a tracer set is higher if more parameters exhibiting significant differences between any two potential water sources can be included. The spatial variability of rain water δ18O was ignored in this small catchment. The means of the Fmax(C1)/Fmax(C2) ratio, δ18O, and inorganic ion ratios across rain water samples taken from near the soil sampling locations were employed as tracer values of event water sources. For each vegetation cover type, the mean values of depth-averaged hydrochemical parameters and δ18O in the water extracts of soil samples collected from two representative areas before rainfall were employed as tracer values of pre-event water sources.

2.4. Hydrograph Separation

The MixSIAR model was employed to estimate the water contributions of potential sources to river flow. This Bayesian mixing model accounts for the uncertainty of multiple sources and integrates prior continuous covariate data [27]. Its mixing equation can be written as shown in Equation (2):
Y j = k p k μ j k s
where Yj is the value of each tracer after mixing, pk is the water contribution of each source to the river flow, μ j k s is the tracer mean of each source, j is the number of tracers, and k is the number of sources.
MixSIAR needs inputs of water source data (observed values of selected tracers in each source) and flow data (observed values of the same tracers in river flow). A default assumption of no tracer fractionation was used. The runtime of the Markov chain Monte Carlo algorithm was initially set to “short”, with the process only selected for the error, and subsequently adjusted to “normal”, “long”, and then “very long” sequentially to achieve the convergence of modeling. Both the Gelman–Rubin and Geweke diagnostics were employed to assess the convergence [28]. The means of the early and late parts of a single chain were compared with the Geweke diagnostic; convergence was achieved when the difference was statistically insignificant. On the other hand, multiple chains were compared with the Gelman–Rubin diagnostic; convergence was achieved when the statistic value was smaller than 1.1. The model’s outputs were summarized using the mean posterior values of source contributions in this study.

2.5. Statistical Analyses

Correlations of the Fmax(C1)/Fmax(C2) ratio and inorganic ion ratios with δ18O in different water sources (rain water, various soil waters, shallow groundwater, and settlement runoff) were analyzed to evaluate whether they were as conservative as δ18O. Differences in the selected tracers between water sources were evaluated by one-way analysis of variance.
The performance of each hydrochemical tracer in estimating the water contributions of sources to river flow in the forestland drainage area was evaluated by comparing it with the traditional water isotope tracer 18O. The hydrograph separation results obtained from the data of δ18O and those obtained from the data of each hydrochemical tracer were taken as true and estimated values, respectively. The accuracy of the results was assessed in terms of Nash–Sutcliffe efficiency (NSE) and percentage bias (PBIAS), which can be calculated using Equations (3) and (4), respectively [29,30]:
N S E = 1 i = 1 n E i T i 2 i = 1 n T i M i 2
P B I A S = i = 1 n E i T i T i × 100
where n represents the number of river flow samples used for validation, Mi represents the mean of the true water contributions of pre-event sources for all river flow samples for each rain event, and Ti and Ei represent the true and estimated water contributions of pre-event sources to each river flow sample, respectively. In this study, the performance of a hydrochemical tracer was considered satisfactory if the NSE was over 0.5 and the absolute value of PBIAS was smaller than 25%.

3. Results

3.1. Differences in Hydrochemical Parameters and δ18O Between Various Water Sources

The correlations of hydrochemical parameters with δ18O in rain water and pre-event water sources (various soil waters, shallow groundwater, and settlement runoff) are shown for rain events 1, 2, and 3 (Table 1) in Figure S1. Conservative hydrochemical parameters, which exhibited significant correlations with δ18O in all potential water sources of river flow at each monitoring weir, are listed with respect to the rain events in Table S1. For all three rain events, the number of conservative hydrochemical parameters decreased with the increase in the number of potential water sources. The number and species of conservative hydrochemical parameters in potential water sources of river flow at all three locations could vary among the three rain events, reflecting that the conservativeness of hydrochemical parameters may be affected by hydro-climatic conditions before rainfall.
The differences in conservative parameters (hydrochemical parameter ratios and δ18O) between potential water sources are shown in Figure S2. Prior to all three rain events, significantly higher values of all 5−6 conservative tracers were observed in soil water from forestland than in rain water. Parameters showing significant differences between soil waters collected from forestland and sloped cropland prior to rainfall differed between rain events. In particular, significantly smaller ratios of Fmax(C1)/Fmax(C2) and Ca2+/NO3 before rain event 1, Fmax(C1)/Fmax(C2), Mg2+/NO3, and Ca2+/NO3 before rain event 2, and Mg2+/NO3 and Ca2+/NO3 before rain event 3 were observed in sloped cropland soil water, whereas significantly smaller values of the Ca2+/NO3 ratio in rice field soil water than in forestland soil water were found before rain events 1 and 3. Moreover, significantly smaller values of the Ca2+/NO3 ratio were also observed in plantation soil water before rain event 1. Apparently, the application of nitrogen fertilizers was responsible for the observed lower ratios of major divalent cation(s) to NO3 in the soil waters of sloped cropland, plantations, and rice fields than in the soil water of forestland. Notably, the Ca2+/NO3 ratios in shallow groundwater were not significantly different from those in the soil waters of sloped cropland, indicating that water infiltration through sloped cropland soil probably played a major role in recharging shallow groundwater. The ratios of Fmax(C1)/Fmax(C2) were significantly higher in the soil waters of forestland and meadows than in the soil waters of sloped cropland, plantations, and rice fields, which are often amended with crop straw and fertilizers. Moreover, the ratios of Fmax(C1)/Fmax(C2) were significantly smaller in rice field soil water than in sloped cropland and plantation soil waters, indicating that water logging can increase the relative abundance of C2, as also observed previously in the same catchment [14]. The patterns of differences in the ratio of Fmax(C1)/Fmax(C2) between soil waters under different land uses before rain events 1 and 2 were similar, implying the conservativeness of Fmax(C1)/Fmax(C2). The highest δ18O values in potential water sources were all observed before rain event 1, with the longest preceding no-rain period. Notably, for rain event 2, δ18O exhibited significant differences among rain water, soil waters, shallow groundwater, and settlement runoff; nevertheless, the differences in δ18O among soil waters under different vegetation covers were not significant. Moreover, significantly lower values of δ18O were observed in shallow groundwater than in soil waters under all land-use types before rain event 2, indicating that rain water from previous rainfall (rain event 1) recharged the shallow groundwater preferentially through soil macropores and underlying mudrock fractures [31,32]. For rain events 1 and 2, the number of potential water sources showing significant differences in the ratio of Fmax(C1)/Fmax(C2) was higher than that showing significant differences in δ18O.
For all three rain events, significant differences in 2−4 conservative tracers were observed between any two of the five potential water sources of river flow at outlet S3. Significant differences in at least one conservative tracer between any two of the eight potential water sources of river flow at outlet Scat were observed only for rain event 1 (Figure S2). The qualified sets of conservative tracers showing sufficient specificity across all potential water sources of river flow at outlets S3 and Scat are listed in Table 2. Apparently, the specificity of conservative tracers among different water sources may vary temporally, as a result of changing climatic conditions over time [14,33].

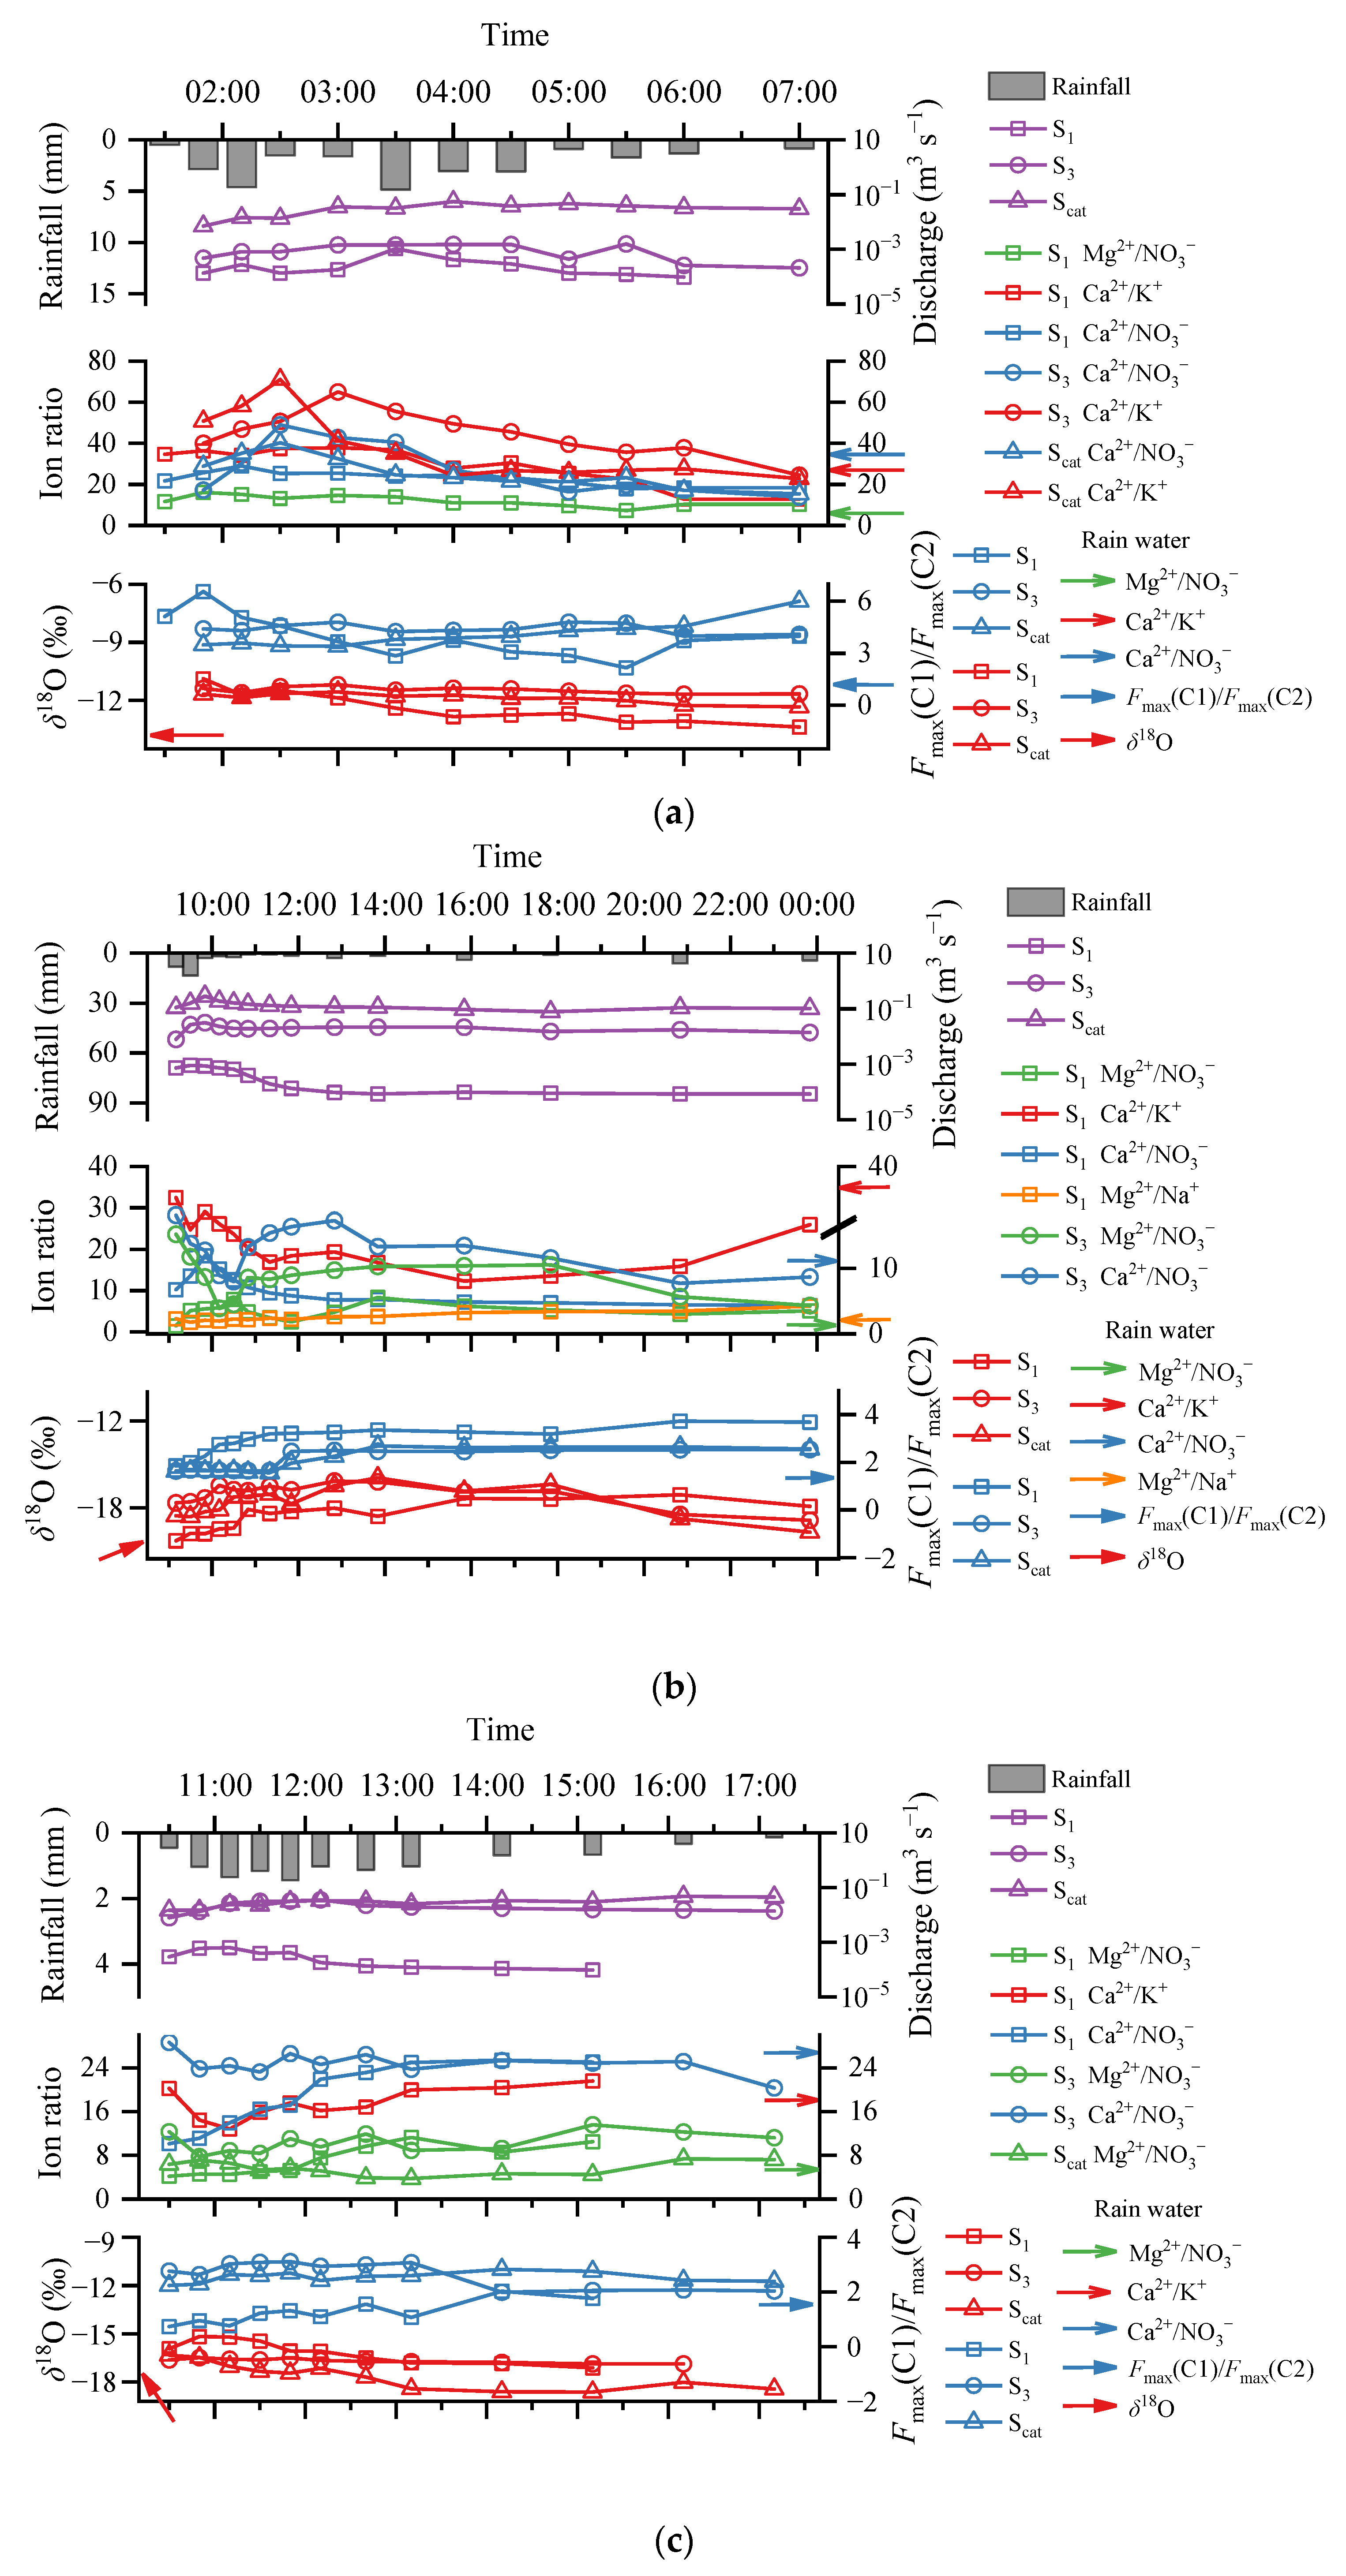
3.2. Temporal Changes in River Discharge, Hydrochemical Parameters, and δ18O During Rainfall

Dynamics of discharge, conservative hydrochemical parameters, and the δ18O of river flow at outlets S1, S3, and Scat during three rain events in the summer of 2023 are presented in Figure 2, and the depths of rainfall-induced river flow are given in Table 1.
The simultaneity of maximum rain intensity and maximum river discharge and the fastest response of river discharge happened during the light rainfall (rain event 3) at all three sampling outlets. This can be ascribed to the observed highest pre-event soil water contents and shallow groundwater levels resulting from the shortest dry period (2 days) prior to rain event 3. A slight delay in maximum discharge (20 min; relative to Imax) occurred during the heavy rainfall (rain event 2) at outlets S3 and Scat, which can be attributed to the greatest Imax and amount of rain event 2, despite the nine preceding dry days. The longest delays in maximum river discharge were observed at outlets S3 and Scat (3 h and 1.5 h, respectively) upon the medium rainfall (rain event 1), as a result of the lowest detected soil water contents and shallow groundwater levels caused by the longest preceding dry period (23 days).
The lowest ratios of river flow depth to rain amount at outlets S3 and Scat were observed during the medium rainfall. During all three rain events, the ratios of river flow depth to rain amount across the outlets followed the order S1 < S3 < Scat. The highest ratio of river flow depth to rain amount (31.48%) was detected at outlet Scat during the heavy rainfall.
The Fmax(C1)/Fmax(C2) in the river flow at outlet S1 exhibited the highest variations, which can be attributed to the more complex composition of DOM in forestland soil due to the presence of dense roots of various plants [34]. The Fmax(C1)/Fmax(C2) in the river flow at outlets S1, S3, and Scat varied in distinctive ranges among three rain events, implying that hydro-climatic conditions may affect the potential of Fmax(C1)/Fmax(C2) for hydrograph separation. At outlet S1, The Ca2+/NO3 ratio increased with increasing rainfall intensity (having greater Ca2+/NO3 values than the river’s baseflow) during the rising limb of the river flow hydrograph, and then it became stable (Figure 2).
During the medium rainfall, the δ18O values of all rainfall-induced river flow samples collected at outlets S1, S3, and Scat were greater than those of the rain water samples, implying that some proportion(s) of the river flow could be composed of pre-event water(s) with higher δ18O. At the end of the medium rainfall, the greatest dominance of rain water in river flow was found at outlet S1, as indicated by their similar δ18O values. At the end of the heavy rainfall, the dominance of rain water in river flow was greatest at outlet Scat, while it was lowest at outlet S1, as interpreted from the differences in δ18O. At the end of the light rainfall, the river flow at outlet Scat was almost completely composed of rain water.
Apparently, the ratios of Fmax(C1)/Fmax(C2) and Ca2+/NO3 were most responsive hydrochemical parameters to rain events in the river flow at outlet S1. At outlet S2, during the medium rain with the longest preceding dry period, the ratios of Ca2+/NO3 and Ca2+/K+ were the most responsive hydrochemical parameters in the river flow; in contrast, during the other two rain events with shorter preceding dry periods, Ca2+/NO3 and Mg2+/NO3 were more responsive than Fmax(C1)/Fmax(C2) and δ18O. At outlet Scat, the most responsive conservative hydrochemical parameter in the river flow to the rain event following the longest no-rain period was the ratio of Ca2+/NO3; notably, the responses of conservative parameters in river flow to the other two rain events following wetter periods were of much smaller magnitudes. Therefore, qualified tracers for distinguishing the water sources of river flow may vary not only with land use but also with hydro-climatic conditions.

3.3. Performance of Hydrochemical Parameters in the Separation of River Hydrographs in a Drainage Area with a Single Vegetation Cover Type by Comparing with δ18O

The river hydrograph separation results in the forestland drainage area using each conservative solute tracer are presented in Figure S3. The performance of each conservative hydrochemical parameter in river hydrograph separation is shown in Table S2.
Based on δ18O data, no delay in the maximum rain water contribution, compared to the maximum river flow discharge, was evidenced for rain events 2 and 3 with short preceding dry periods, implying that piston flow was dominant in the river flow generation under high antecedent soil moistures, as also observed previously in the same forestland drainage area [14]. Nevertheless, a delay of 2 h occurred during rain event 1, following a long no-rain period. This indicates that the infiltration of rain water through large pores was dominant during the rising limb of the river hydrograph, while piston flow through both large and small pores (partially emptied by evaporation before the rainfall and filled gradually by rain water) was dominant during the receding limb [32]. Soil water’s contributions to the river flow were 30.8–98.3%, 16.2–89.4%, and 21.5–94.9% during rain events 1, 2, and 3, respectively. According to the PBIAS and NSE values obtained (Table S2), the ratio of Fmax(C1)/Fmax(C2) performed best during rain events 1 and 2, while the ratio of Mg2+/NO3 showed the best overall performance during rain event 3.
Apparently, the applicability of each potential hydrochemical tracer to hydrograph separation may vary with rain characteristics and pre-event soil moisture (Table S2). For a rain event with a longer dry period, more tracers showing satisfactory performance may be available.

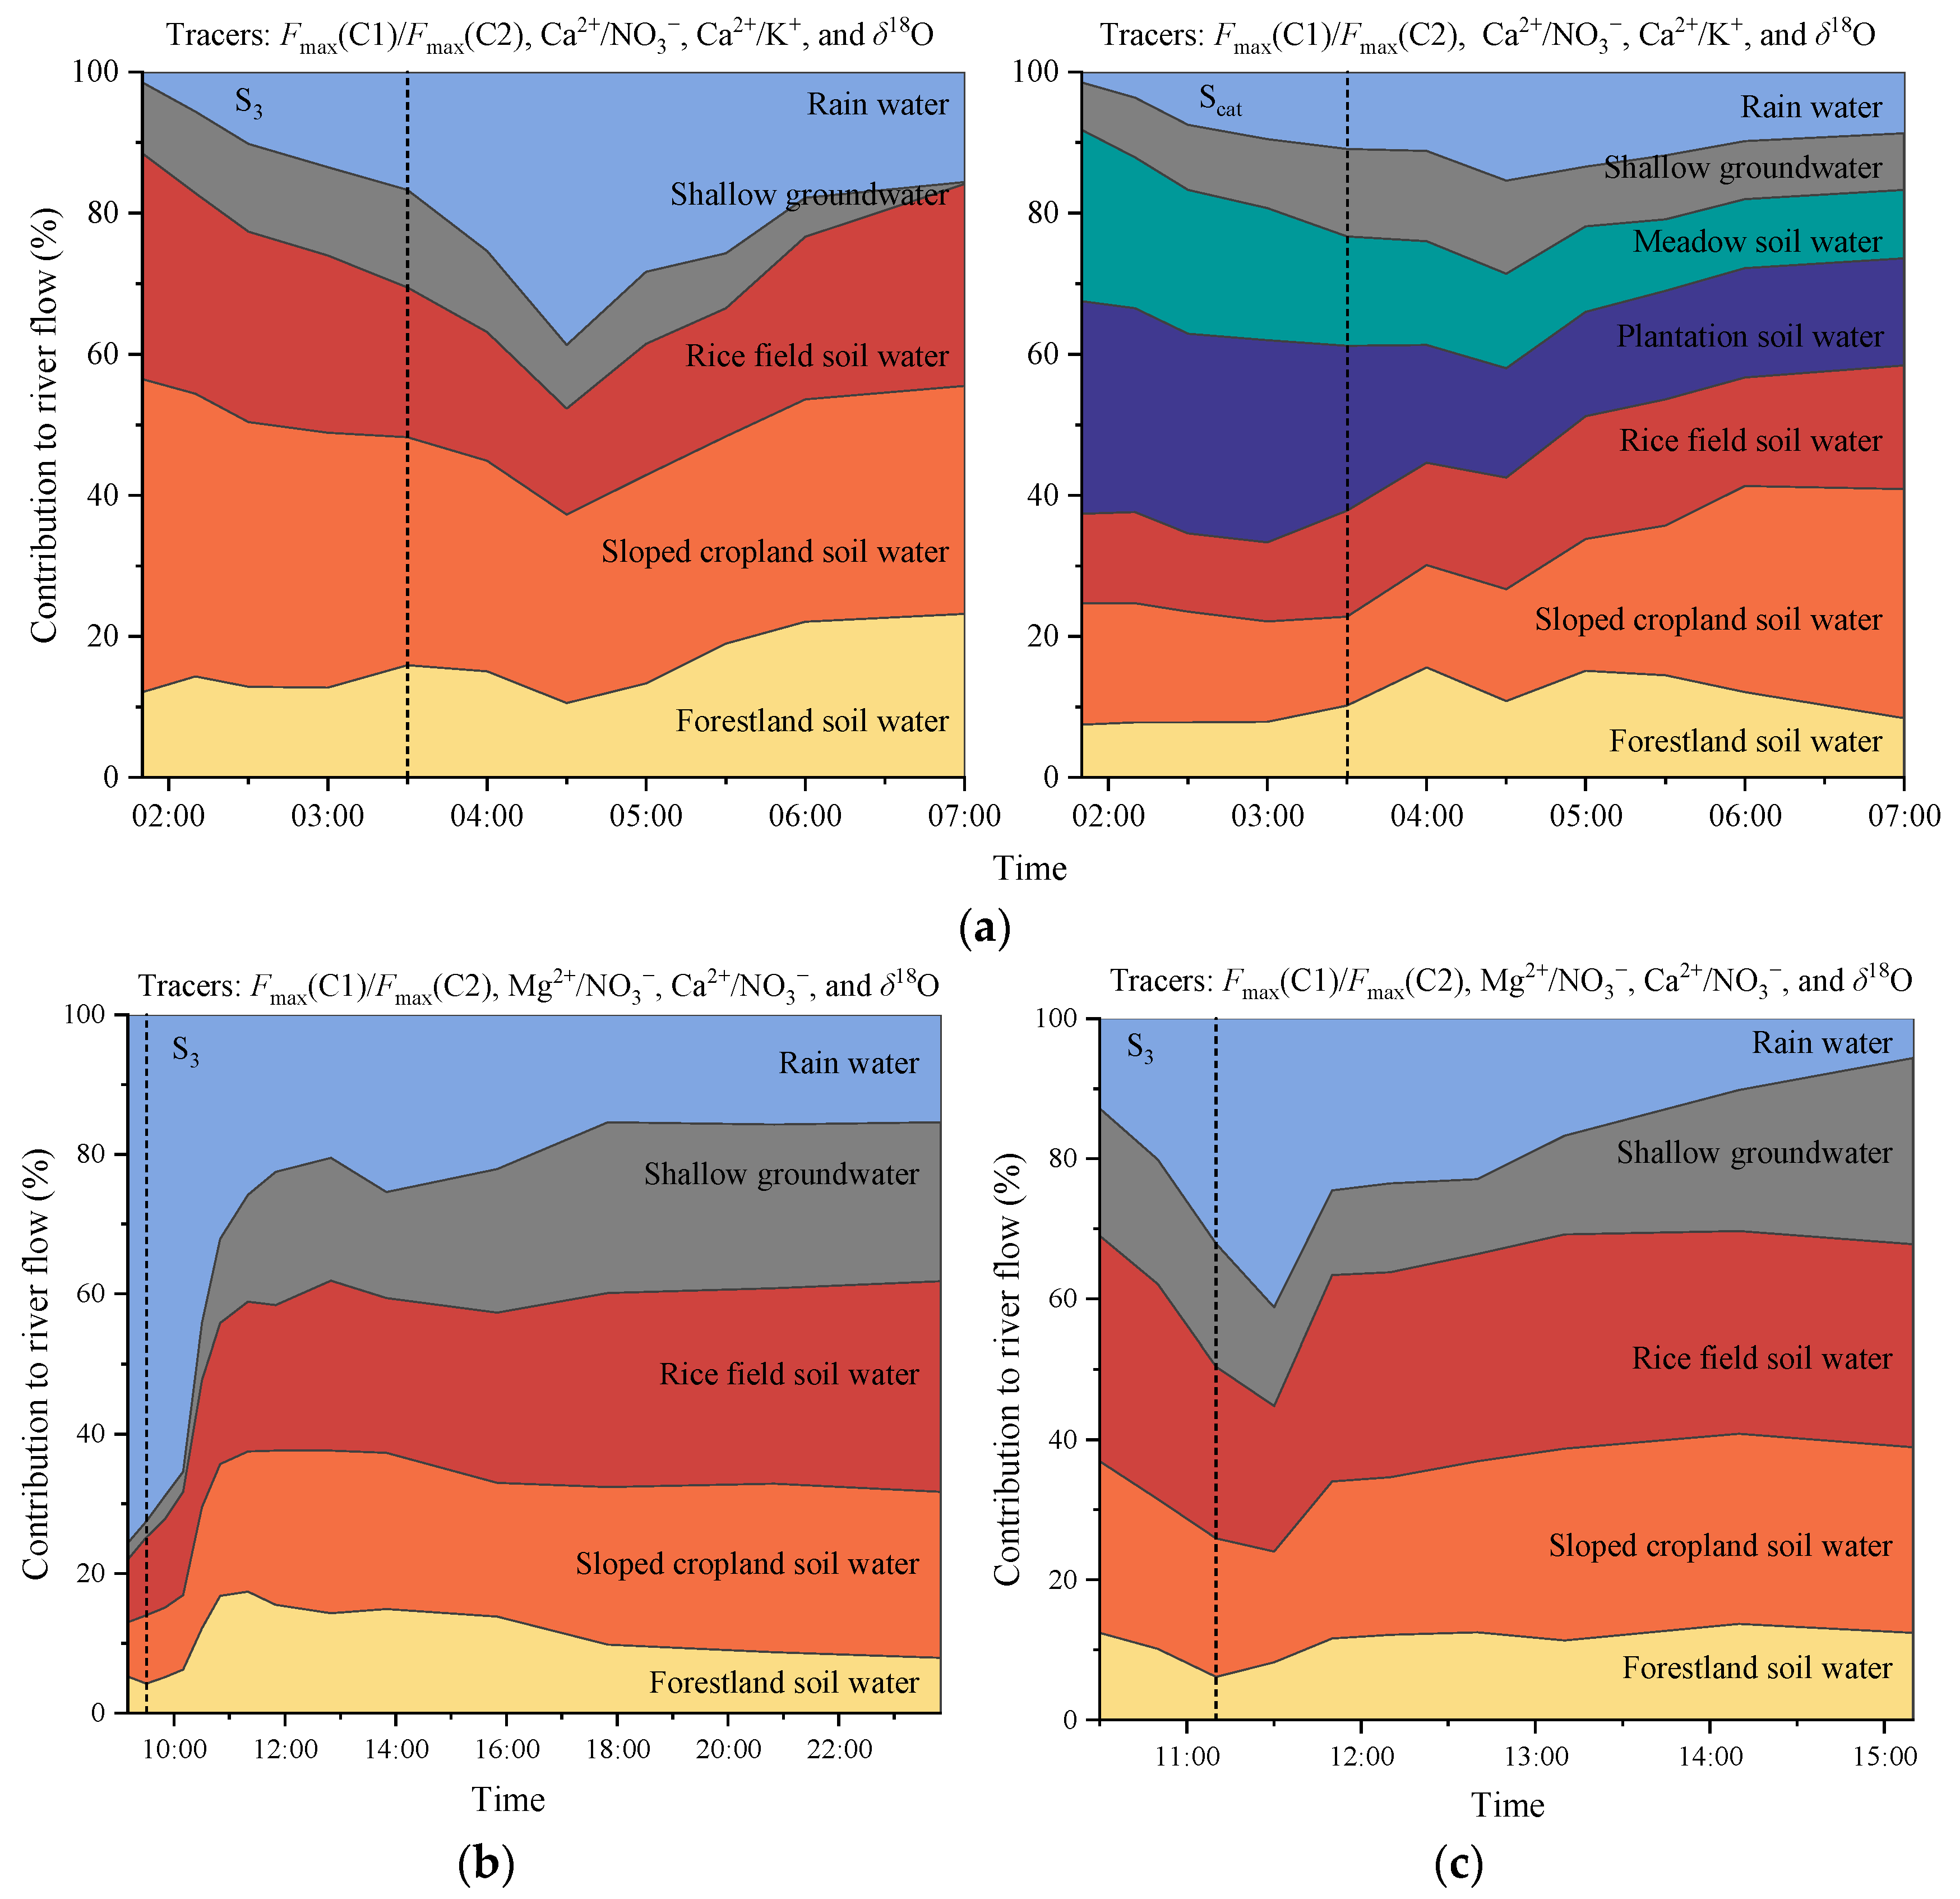
3.4. Performance of Multiple Tracers in the Separation of River Hydrographs in Drainage Areas with Multiple Land-Use Types

During rain event 1, a set of four tracers (Fmax(C1)/Fmax(C2), Ca2+/NO3, Ca2+/K+, and δ18O) was applicable to the separation of the river hydrographs at outlets Scat and S3. During rain events 2 and 3, a different set of four tracers (Fmax(C1)/Fmax(C2), Mg2+/NO3, Ca2+/NO3, and δ18O) was applicable at outlet S3; however, there was no such set of multiple tracers applicable at outlet Scat. The river hydrograph separation results at outlets Scat and S3, using four tracers, are presented in Figure 3. The statistics and uncertainties of the estimated proportions of water sources in the river flow are given in Table 3. Notably, settlement runoff exhibited very low pre-event discharge, and its inclusion led to unacceptably high uncertainties in the hydrograph separation results at Scat. Therefore, settlement runoff was eventually excluded from the list of river water sources at outlet Scat in the hydrograph separation.
The contributions of all pre-event water sources to river flow at outlet S3 were 61.3–98.5%, 24.4–84.6%, and 58.8–94.4% during rain events 1, 2, and 3, respectively. Rain water’s contribution to the river flow at outlet S3 was lowest during the medium rainfall with the longest preceding no-rain period (event 1: 18.1%), while it was highest during the heavy rainfall (event 2: 37.3%). During rain event 1, rain water’s contribution to the river flow at outlet Scat (9.4%) was markedly lower than that at outlet S3, which may be ascribed to the involvement of two more water sources (soil waters from plantations and meadows, with the plantation soil having a much greater water-holding capacity than other soils) in the highland areas [35]. Moreover, from rain event 1 through rain event 3, shallow groundwater’s contribution to the river flow at outlet S3 increased, which may be partially ascribed to the observed elevations of pre-event shallow groundwater levels (with the mean groundwater level being 7.81, 8.45, and 8.62 m above outlet S3, respectively). Rain water’s maximum contribution to the river flow at outlets S3 and Scat happened 1 h later than the maximum river discharge during rain event 1, implying that piston flow through small pores with an increased fraction of rain water remained dominant during the early receding limb of the river hydrograph. In contrast, at outlet S3, no delay in the occurrence time of the maximum contribution of rain water to river flow (relative to the time of maximum river discharge occurrence) took place during rain events 2 and 3, with fewer preceding dry days, which were conducive to piston flow [32].
During rain event 1, the largest contribution of pre-event water to the river flow at S3 came from sloped croplands (33.6%). In contrast, during rain events 2 and 3, the largest water source of river flow at S3 was rice field soil water, accounting for 20.3% and 28.4%, respectively. The largest contribution of pre-event water to river flow at outlet Scat during rain event 1 came from plantations (21.1%), especially at the rising limb of the river hydrograph. Soil waters from rice fields (23.2%) and sloped cropland (18.9%) made the second-greatest contribution to river flow at outlets S3 and Scat during rain event 1, respectively. Moreover, at the receding limb of the hydrograph during rain event 1, the water contribution of sloped cropland to river flow at outlet Scat gradually increased and eventually became the greatest (32.5%).

4. Discussion

4.1. Selection of Multiple Tracers

Stable isotopes of water have been recognized as the most conservative tracers, which are commonly used to distinguish pre-event and event waters [36,37,38], but they often exhibit limited specificity in diverse water sources (>2) within a catchment [6]. DOM in soils comes from the leaching of fresh litter, humified organic matter, and microbial biomass [39]. The Fmax(C1)/Fmax(C2) ratio has a higher ability than δ18O to identify water sources of river flow under different vegetation covers or land uses. Nevertheless, it was reported that the differences in Fmax(C1)/Fmax(C2) ratio between forestlands and meadows, and between plantations and sloped croplands, were not significant at the 0.05 level, which might partially account for the observed uncertainties in water source apportionment results [14]. Therefore, further involvement of conservative parameters of ions derived from geochemical processes and fertilization is necessary.
The ratio of Ca2+/Mg2+ can be employed to trace groundwater flow paths and discern water–rock interactions, and the ratio of Na+/Cl can be used to differentiate groundwater recharge sources and processes [40,41]. Our investigation showed that a total of four ion ratios (Ca2+/NO3, Mg2+/NO3, Ca2+/K+, and Mg2+/Na+) could exhibit significant differences between water sources of river flow at one or more outlets (Table 2). For the agricultural–forestry drainage area, the combination of four tracers (including Fmax(C1)/Fmax(C2), two ion ratios, and δ18O) applicable to rain event 1, with the longest preceding dry period, was different from that applicable to rain events 2 and 3, with shorter preceding dry periods. In addition to the ratio of Ca2+/NO3, the ratio of Ca2+/K+ was included for rain event 1, while the ratio of Mg2+/NO3 was included instead for rain events 2 and 3. The varying differences in the ratios of hydrochemical parameters can be attributed to the coupled effects of biogeochemical processes (such as rock weathering or carbon and nitrogen transformation) and anthropogenic activities (such as fertilizer application and domestic sewage discharge), as affected by hydro-climatic conditions [6]. For instance, a high soil water content favors a decrease in the NO3 concentration in soil water through reduction [41,42], leading to an elevated ratio of Ca2+/NO3. Therefore, caution should be taken in selecting conservative tracers for river hydrograph separation, as their specificity among water sources under different land-use types may change temporally.
Similarly, a comprehensive suite of tracers (δ18O, δD, δ34S-SO42−, δ13C-DIC, and 87Sr/86Sr) was used to analyze the recharge and mixing of groundwater in a karst area [43]. In another study, hydrochemical and isotopic tracers were employed to evaluate the interaction between groundwater and surface water in the Qujiang River, located in Zhejiang Province, China [44]. Apparently, the combined use of isotopic and hydrochemical tracers is a promising approach for identifying water sources of river flow in a catchment with complex land-use patterns.

4.2. Applicability of Multiple Tracers to River Hydrograph Separation

Lands under different uses (such as forestlands, plantations, sloped croplands, meadows, and rice fields) often have different soil hydraulic properties and, therefore, exhibit different patterns of hydrological processes [45]. Distinctive signatures of physically mixed tracers in pre-event water sources enable the quantification of more than two components of river flow. In an intensively utilized catchment, the number of potential water sources may increase with the increasing spatial scale of the drainage area. There is clearly a need to identify as many tracers as possible so as to ensure accurate apportionment of multiple water sources of river flow. However, not all conservative parameters show significant differences between water sources. In this study, there was no such set of tracers among which at least one tracer showed a significant difference between any two of the potential water sources of river flow at outlet Scat during rain events 2 and 3, which had shorter preceding no-rain periods (Table 1 and Table 2).
The same set of four tracers was applied successfully to river water source apportionment at outlets Scat and S3 for rain event 1, with the longest preceding no-rain period, but such successful application of four tracers at both outlets was not achieved for rain events 2 and 3, with shorter preceding no-rain periods (Table 2). This implies that a lower antecedent soil moisture may favor the occurrence of significant differences in more hydrochemical parameters between water sources in a catchment with diverse land uses, probably through affecting various processes such as soil biogeochemical reactions, chemical weathering, and flushing [15].

4.3. Future Perspectives

There are three limitations in the present research: Firstly, a comparison with other hydrologically independent catchments for an extensive validation and applications of the water source tracing method described in our research is lacking. Secondly, potential spatial variations in the tracers were not considered for water sources. Thirdly, the potential effects of the subsoil (below 50 cm depth) and parent rocks were considered implicitly by the measurements of the tracers in well water in the lowland areas only. Despite these limitations, our research offers a useful approach for distinguishing different water sources of river flow using multiple tracers (including both water isotopes and hydrochemical tracers).
Several issues remain to be explored in the future: Firstly, do the multiple selected tracers of different types in water sources remain stable during rainfall? Secondly, are there any other potential tracers representing the distinctive natures of lands under different vegetation, uses, and management? Thirdly, are there significant differences in tracers among waters in soil pores of different sizes? If so, the development of tools for sampling mobile water under low soil moisture is highly desirable. Fourthly, do the tracers in the subsoil and/or parent rocks differ significantly from those in shallow soil water and well water? If so, more subsurface water sources lying between the top 50 cm soil layer and the shallow groundwater table need to be considered to achieve better accuracy of hydrograph separation.
To support the effective control of river contamination in hilly catchments with complex land-use patterns, a protocol for sampling pre-event water sources, particularly source lands with varying soil thicknesses, needs to be developed. Moreover, in the future development of hydrograph separation models, it is necessary to introduce an additional parameter representing the varying connectivities among water sources, as the landscape–stream connectivity may be affected by a number of factors (such as the distance between the landscapes and stream network, topographic characteristics, and antecedent soil moisture) [46,47].

5. Conclusions

A reliable quantification of river water sources in catchments with multiple land-use types still remains challenging. In this study, a novel water source tracing method combining water isotopes, DOM fluorescence, and ion ratio tracers was proposed for hydrograph separation in a hilly catchment with diverse anthropogenic interferences. For the medium rain event with the longest preceding dry period, a combined use of Fmax(C1)/Fmax(C2), Ca2+/NO3, Ca2+/K+, and δ18O was successful in hydrograph separation of river flow at the outlets of the catchment and nested agricultural–forestry drainage area (with five and seven water sources, respectively). Nevertheless, during the other two rain events, with shorter preceding dry periods, a different set of four tracers was applicable to the nested drainage area with mixed land use but not applicable to the entire catchment. A drier climate condition appeared to favor the occurrence of more qualified tracers for river flow hydrograph separation. A more extensive screening across diverse land uses is needed to build a large collection of conservative tracers, from which as many tracers as possible can be selected to ensure the occurrence of significant differences in at least one tracer between any two potential water sources.

Supplementary Materials

The following supporting information can be downloaded at https://www.mdpi.com/article/10.3390/w17081222/s1: Figure S1: Correlations (r values) of hydrochemical parameters with δ18O in rain water, soil waters of forestland, plantations, meadows, sloped cropland, and rice fields, shallow groundwater, and settlement runoff for rain events on 28 June (a), 27 July (b), and 25 August (c), 2023; * and ** represent significance at the 0.05 and 0.01 levels, respectively. Figure S2: Differences in selected conservative parameters between water sources for river flow at three monitoring weirs in the study catchment for rain events on 28 June (a), 27 July (b), and 25 August (c), 2023. Different letters indicate significant differences between water sources at the 0.05 level. Figure S3: Dynamics of estimated contributions of rain water and pre-event soil water to river flow at the outlet of the forestland drainage area (S1) during rain events on 28 June (a), 27 July (b), and 25 August (c), 2023, based on the data of each hydrochemical tracer and δ18O using MixSIAR. Dashed lines represent the occurrence times of maximum river discharge. Water sampling and discharge monitoring were conducted at intervals of 30 min and 15 min, respectively. Table S1: Conservative hydrochemical parameters in potential water sources of river flow at three monitoring weirs in the study catchment upon three rain events. Table S2: Statistical results of hydrochemical tracers’ performance in estimating the water sources of river flow at the outlet of the forestland drainage area (S1), by comparison with δ18O.

Author Contributions

Conceptualization, X.-Y.T.; methodology, X.-Y.T.; software, Z.-X.S.; validation, Z.-X.S.; formal analysis, Z.-X.S.; investigation, Z.-X.S., Y.-T.A. and L.C.; resources, J.-F.C., X.-Y.T., X.-Y.L. and J.-H.C.; writing—original draft preparation, Z.-X.S.; writing—review and editing, X.-Y.T.; supervision, J.-F.C. and X.-Y.T.; project administration, J.-F.C., X.-Y.L. and X.-Y.T.; funding acquisition, J.-F.C., X.-Y.L. and X.-Y.T. All authors have read and agreed to the published version of the manuscript.

Funding

This research was funded by supported by the National Key Research and Development Program of China (No. 2023YFF0806002) and the National Natural Science Foundation of China (Nos. 42177379, 42371039, 32071581, 42377374, and 32330065).

Data Availability Statement

The data presented in this study are available on request from the corresponding author.

Conflicts of Interest

The authors declare no conflicts of interest.

References

  1. Yang, D.W.; Yang, Y.T.; Xia, J. Hydrological cycle and water resources in a changing world: A review. Geo. Sus. 2021, 2, 115–122. [Google Scholar] [CrossRef]
  2. Musie, M.; Sen, S.; Chaubey, I. Hydrologic responses to climate variability and human activities in Lake Ziway Basin, Ethiopia. Water 2020, 12, 164. [Google Scholar] [CrossRef]
  3. Osei, M.A.; Amekudzi, L.K.; Wemegah, D.D.; Preko, K.; Gyawu, E.S.; Obiri-Danso, K. The impact of climate and land-use changes on the hydrological processes of Owabi catchment from SWAT analysis. J. Hydrol. Reg. Stud. 2019, 25, 100620. [Google Scholar] [CrossRef]
  4. Xiao, X.; Zhang, X.P.; Shi, X.N.; Yu, Z.L.; Liu, K.S.; Liu, Z. Identifying river water sources using end-member mixing analysis in a subtropical monsoon basin China. Hydrol. Process. 2023, 37, e14824. [Google Scholar] [CrossRef]
  5. Lv, Y.J.; Gao, L.; Geris, J.; Verrot, L.; Peng, X.H. Assessment of water sources and their contributions to streamflow by end-member mixing analysis in a subtropical mixed agricultural catchment. Agric. Water Manag. 2018, 203, 411–422. [Google Scholar] [CrossRef]
  6. Abbott, B.W.; Baranov, V.; Mendoza-Lera, C.; Nikolakopoulou, M.; Harjung, A.; Kolbe, T.; Balasubramanian, M.N.; Vaessen, T.N.; Ciocca, F.; Campeau, A.; et al. Using multi-tracer inference to move beyond single-catchment ecohydrology. Earth Sci. Rev. 2016, 160, 19–42. [Google Scholar] [CrossRef]
  7. Begum, M.S.; Park, H.Y.; Shin, H.S.; Lee, B.J.; Hur, J. Separately tracking the sources of hydrophobic and hydrophilic dissolved organic matter during a storm event in an agricultural watershed. Sci. Total Environ. 2023, 873, 162347. [Google Scholar] [CrossRef] [PubMed]
  8. Buerge, I.J.; Buser, H.R.; Kahle, M.; Mueller, M.D.; Poiger, T. Ubiquitous occurrence of the artificial sweetener acesulfame in the aquatic environment: An ideal chemical marker of domestic wastewater in groundwater. Environ. Sci. Technol. 2009, 43, 4381–4385. [Google Scholar] [CrossRef]
  9. Brenot, A.; Benoît, M.; Carignan, J.; France-Lanord, C. Insights into stable isotope characterization to monitor the signification of soil water sampling for environmental studies dealing with soil water dynamics through the unsaturated zone. C. R. Geosci. 2015, 347, 317–327. [Google Scholar] [CrossRef]
  10. Cheng, K.; Liu, Z.Q.; Xiong, K.N.; He, Q.F.; Li, Y.; Cai, L.L.; Chen, Y. Migration of dissolved organic matter in the epikarst fissured soil of south China karst. Land 2023, 12, 887. [Google Scholar] [CrossRef]
  11. Cotrufo, M.F.; Haddix, M.L.; Kroeger, M.E.; Stewart, C.E. The role of plant input physical-chemical properties, and microbial and soil chemical diversity on the formation of particulate and mineral-associated organic matter. Soil Biol. Biochem. 2022, 168, 108648. [Google Scholar] [CrossRef]
  12. Vogt, R.D.; Porcal, P.; Hejzlar, J.; Paule-Mercado, M.C.; Haaland, S.; Gundersen, C.B.; Orderud, G.I.; Eikebrokk, B. Distinguishing between sources of natural dissolved organic matter (DOM) based on its characteristics. Water 2023, 15, 3006. [Google Scholar] [CrossRef]
  13. Hu, Y.; Lu, Y.H.; Edmonds, J.W.; Liu, C.; Wang, S.; Das, O.; Liu, J.; Zheng, C.M. Hydrological and land use control of watershed exports of dissolved organic matter in a large arid river basin in northwestern China. J. Geophys. Res. Biogeosci. 2016, 121, 466–478. [Google Scholar] [CrossRef]
  14. Sun, Z.X.; Cui, J.F.; Cheng, J.H.; Tang, X.Y. A novel tool for tracing water sources of streamflow in a mixed land-use catchment. Sci. Total Environ. 2024, 912, 168800. [Google Scholar] [CrossRef] [PubMed]
  15. Stewart, B.; Shanley, J.B.; Kirchner, J.W.; Norris, D.; Adler, T.; Bristol, C.; Harpold, A.A.; Perdrial, J.N.; Rizzo, D.M.; Sterle, G.; et al. Streams as mirrors: Reading subsurface water chemistry from stream chemistry. Water Resour. Res. 2022, 58, e2021WR029931. [Google Scholar] [CrossRef]
  16. Buerge, I.J.; Poiger, T.; Müller, M.D.; Buser, H.R. Caffeine, an anthropogenic marker for wastewater contamination of surface waters. Environ. Sci. Technol. 2003, 37, 691–700. [Google Scholar] [CrossRef] [PubMed]
  17. Gatesman, T.A.; Liljedahl, A.K.; Douglas, T.A.; Debolskiy, M.V.; Trainor, T.P.; Gaedeke, A. Glacier contribution to lowland streamflow: A multi-year, daily geochemical hydrograph separation study in subarctic Alaska. Chem. Geol. 2023, 621, 121368. [Google Scholar] [CrossRef]
  18. Ladouche, B.; Probst, A.; Viville, D.; Idir, S.; Baque, D.; Loubet, M.; Probst, J.L.; Bariac, T. Hydrograph separation using isotopic, chemical and hydrological approaches (Strengbach catchment, France). J. Hydrol. 2001, 242, 255–274. [Google Scholar] [CrossRef]
  19. Ledesma, J.L.J.; Grabs, T.; Futter, M.N.; Bishop, K.H.; Laudon, H.; Koehler, S.J. Riparian zone control on base cation concentration in boreal streams. Biogeosciences 2013, 10, 3849–3868. [Google Scholar] [CrossRef]
  20. Xian, Q.S.; Li, P.H.; Liu, C.; Cui, J.F.; Guan, Z.; Tang, X.Y. Concentration and spectroscopic characteristics of DOM in surface runoff and fracture flow in a cropland plot of a loamy soil. Sci. Total Environ. 2018, 622, 385–393. [Google Scholar] [CrossRef]
  21. Liu, H.Y.; Guan, Z.; Cheng, J.H.; Tang, X.Y.; Xian, Q.S. Ambient temperature modulates dissipation and redistribution of chlorpyrifos and 3,5,6-trichloro-2-pyridinol in paddy field. Soil Sediment Contam. 2022, 31, 533–555. [Google Scholar] [CrossRef]
  22. Zhang, W.; Cheng, J.H.; Xian, Q.S.; Cui, J.F.; Tang, X.Y.; Wang, G.X. Dynamics and sources of colloids in shallow groundwater in lowland wells and fracture flow in sloping farmland. Water Res. 2019, 156, 252–263. [Google Scholar] [CrossRef] [PubMed]
  23. Zhang, W. Hydrological Processes and Colloid Transport in the Sloping Farmland of Purple Soil. Ph.D. Thesis, Institute of Mountain Hazards and Environment, UCAS, Chengdu, China, 2015. [Google Scholar]
  24. Brooks, J.R.; Barnard, H.R.; Coulombe, R.; McDonnell, J.J. Ecohydrologic separation of water between trees and streams in a Mediterranean climate. Nat. Geosci. 2009, 3, 100–104. [Google Scholar] [CrossRef]
  25. West, A.G.; Patrickson, S.J.; Ehleringer, J.R. Water extraction times for plant and soil materials used in stable isotope analysis. Rapid Commun. Mass Spectrom. 2006, 20, 1317–1321. [Google Scholar] [CrossRef] [PubMed]
  26. Bauer, S.; Fulda, C.; Schäfer, W. A multi-tracer study in a shallow aquifer using age dating tracers 3H, 85Kr, CFC-113 and SF6—indication for retarded transport of CFC-113. J. Hydrol. 2001, 248, 14–34. [Google Scholar] [CrossRef]
  27. Stock, B.C.; Jackson, A.L.; Ward, E.J.; Parnell, A.C.; Phillips, D.L.; Semmens, B.X. Analyzing mixing systems using a new generation of Bayesian tracer mixing models. PeerJ 2018, 6, e5096. [Google Scholar] [CrossRef]
  28. Hopkins, J.B.; Ferguson, J.M. Estimating the diets of animals using stable isotopes and a comprehensive Bayesian mixing model. PLoS ONE 2012, 7, e28478. [Google Scholar] [CrossRef]
  29. Nash, J.E.; Sutcliffe, J.V. River flow forecasting through conceptual models: Part I. A discussion of principles. J. Hydrol. 1970, 10, 282–290. [Google Scholar] [CrossRef]
  30. Moriasi, D.N.; Arnold, J.G.; Van Liew, M.W.; Bingner, R.L.; Harmel, R.D.; Veith, T.L. Model evaluation guidelines for systematic quantification of accuracy in watershed simulations. Trans. ASABE 2007, 50, 885–900. [Google Scholar] [CrossRef]
  31. Zhao, P.; Tang, X.Y.; Zhao, P.; Wang, C.; Tang, J.L. Tracing water flow from sloping farmland to streams using oxygen-18 isotope to study a small agricultural catchment in southwest China. Soil Tillage Res. 2013, 134, 180–194. [Google Scholar] [CrossRef]
  32. Zhao, P.; Tang, X.Y.; Zhao, P.; Zhang, W.; Tang, J.L. Mixing of event and pre-event water in a shallow Entisol in sloping farmland based on isotopic and hydrometric measurements. SW China. Hydrol. Process. 2016, 30, 3478–3493. [Google Scholar] [CrossRef]
  33. Birkel, C.; Correa-Barahona, A.; Martinez-Martinez, M.; Granados-Bolanos, S.; Venegas-Cordero, N.; Gutierrez-Garcia, K.; Blanco-Ramirez, S.; Quesada-Mora, R.; Solano-Rivera, V.; Mussio-Mora, J.; et al. Headwaters drive streamflow and lowland tracer export in a large-scale humid tropical catchment. Hydrol. Process. 2020, 34, 3824–3841. [Google Scholar] [CrossRef]
  34. Hoffland, E.; Kuyper, T.W.; Comans, R.N.J.; Creamer, R.E. Eco-functionality of organic matter in soils. Plant Soil 2020, 455, 1–22. [Google Scholar] [CrossRef]
  35. Gbadegesin, L.A. Leaching of Veterinary Antibiotics in Purple Soil Orchard and Farmland. Ph.D. Thesis, Institute of Mountain Hazards and Environment, UCAS, Chengdu, China, 2023. [Google Scholar]
  36. McDonnell, J.J. A rationale for old water discharge through macropores in a steep, humid catchment. Water Resour. Res. 1990, 26, 2821–2832. [Google Scholar] [CrossRef]
  37. Jasechko, S.; Kirchner, J.W.; Welker, J.M.; McDonnell, J.J. Substantial proportion of global streamflow less than three months old. Nat. Geosci. 2016, 9, 126–129. [Google Scholar] [CrossRef]
  38. Kirchner, J.W. Quantifying new water fractions and transit time distributions using ensemble hydrograph separation: Theory and benchmark tests. Hydrol. Earth Syst. Sci. 2019, 23, 303–349. [Google Scholar] [CrossRef]
  39. Kaiser, K.; Kalbitz, K. Cycling downwards—Dissolved organic matter in soils. Soil Biol. Biochem. 2012, 52, 29–32. [Google Scholar] [CrossRef]
  40. Zhang, X.; Chen, J.S.; Zhan, L.C.; Ma, F.Y.; Yan, J.H.; Wang, T. Study on groundwater recharge based on chloride mass balance and hydrochemistry in the irrigated agricultural area, North China Plain. Environ. Earth Sci. 2023, 82, 70. [Google Scholar] [CrossRef]
  41. Zhou, Y.H.; Wu, J.H.; Gao, X.Y.; Guo, W.Y.; Chen, W.Q. Hydrochemical background levels and threshold values of phreatic groundwater in the greater Xi’an region, China: Spatiotemporal distribution, influencing factors and implication to water quality management. Expo. Health. 2023, 15, 757–771. [Google Scholar] [CrossRef]
  42. Dayo-Olagbende, G.O.; Ewulo, B.S. Ionic mobility of cations as affected by redox status of two different soil types. Bulg. J. Soil Sci. 2021, 6, 18–32. [Google Scholar]
  43. Duan, Y.; Gao, X.B.; Li, C.C.; Wang, H.; Kang, C.Q.; Wang, W.Z.; Zhang, X.; Sun, Z.; Xiong, Y.Z.; Wang, Y.X. Combining hydrodynamics, geochemical and multiple isotopic tracers to understand the hydrogeological functioning of karst groundwater system in Jinci, northern China. J. Hydrol. 2025, 648, 132375. [Google Scholar] [CrossRef]
  44. Liu, Y.; Zhang, C.Y.; Jiang, J.Y.; Zhang, Y.; Wang, G.H.; Xu, L.L.; Qu, Z.H. Interaction between groundwater and surface water in the Qujiang River basin in China: Evidence from chemical isotope measurements. Water 2023, 15, 3932. [Google Scholar] [CrossRef]
  45. Wang, H.L.; Tang, X.Y.; Zhang, W.; Song, S.B.; McKenzie, B.M. Within-year changes in hydraulic properties of a shallow entisol in farmland and forestland. Vadose Zone J. 2015, 14, vzj2014-11. [Google Scholar] [CrossRef]
  46. Jencso, K.G. Hydrologic Connectivity Between Landscapes and Streams: Transferring Reach and Plot Scale Understanding to the Catchment Scale. Ph.D. Thesis, Montana State University, Bozeman, MT, Canada, 2010. [Google Scholar]
  47. Outram, F.N.; Cooper, R.J.; Suennenberg, G.; Hiscock, K.M.; Lovett, A.A. Antecedent conditions, hydrological connectivity and anthropogenic inputs: Factors affecting nitrate and phosphorus transfers to agricultural headwater streams. Sci. Total Environ. 2016, 545, 184–199. [Google Scholar] [CrossRef]
Figure 1. Monitoring locations in the Jieliu catchment, situated in the upper reaches of the Yangtze River.
Water 17 01222 g001
Figure 2. Hydrographs and tracer dynamics of river flow discharged from the study catchment (Scat) and its forestland (S1) and agricultural–forestry (S3) drainage areas during rain events on 28 June (a), 27 July (b), and 25 August (c), 2023.
Water 17 01222 g002
Figure 3. Dynamics of estimated water source contributions to river flow discharged from mixed-land-use drainage areas (S3 (and Scat)) during rain events on 28 June (a), 27 July (b), and 25 August (c), 2023, based on the data of multiple tracers using MixSIAR. Dashed lines represent the times of maximum river discharge occurrence. Water sampling and discharge monitoring were conducted at intervals of 30 min and 15 min, respectively.
Water 17 01222 g003
Table 1. Characteristics of investigated rain events and resultant river flow depths at four monitoring weirs.
Rain Characteristics *River Flow Depth §
Event No. (date)PNRDAmountTime DurationImax
(day)(mm)(h)(mm (30 min)−1)(mm)
S1S2S3Scat
1 (28 June 2023)2325.955.676.930.292.400.731.64
2 (27 July 2023)954.5114.6720.160.4736.294.2717.16
3 (25 August 2023)210.446.672.170.025.671.691.82
Notes: * PNRD represents the number of preceding no-rain days. Imax represents the maximum intensity. § River flow depth (mm) was calculated by dividing the cumulative stormflow (excluding baseflow, if present) during each rain event by the corresponding drainage area.
Table 2. Qualified tracers for distinguishing water sources of river flow at three monitoring weirs upon three rain events.
Rain Event No.Qualified Multiple Tracers for Distinguishing Water Sources of Streamflow *
S1S3Scat
1Fmax(C1)/Fmax(C2), Mg2+/NO3, Ca2+/K+, Ca2+/NO3, and δ18OFmax(C1)/Fmax(C2), Ca2+/NO3, Ca2+/K+, and δ18OFmax(C1)/Fmax(C2), Ca2+/NO3, Ca2+/K+, and δ18O
2Fmax(C1)/Fmax(C2), Mg2+/NO3, Ca2+/K+, Ca2+/NO3, Mg2+/Na+, and δ18OFmax(C1)/Fmax(C2), Mg2+/NO3, Ca2+/NO3, and δ18O
3Fmax(C1)/Fmax(C2), Mg2+/NO3, Ca2+/K+, Ca2+/NO3, and δ18OFmax(C1)/Fmax(C2), Mg2+/NO3, Ca2+/NO3, and δ18O
Notes: * River flow at outlets S1, S3, and Scat had 2, 5, and 8 potential water sources, respectively, as described in detail in “2.3 River water sources and tracers”. Only one of the listed tracers was needed for hydrograph separation at outlet S1, while combinations of multiple tracers (if present) were proposed for use in hydrograph separation at outlets S3 and Scat.
Table 3. Separation results and associated river hydrograph uncertainties at monitoring weirs, obtained using single or multiple tracers with MixSIAR.
Rain Event NoWeirWater Source Proportions in River Flow (%) *
Rain WaterForestland Soil WaterPlantation Soil WaterSloped Cropland Soil WaterRice Field Soil WaterMeadow Soil WaterSettlement RunoffShallow Groundwater
1S144.9 ± 21.755.1 ± 21.7------------
(NU)(NU)
S318.1 ± 10.815.6 ± 4.1--33.6 ± 5.323.2 ± 5.4----9.5 ± 3.9
(7.3–8.9)(5.1–7.9) (12.4–14.7)(9.3–14.8) (3.4–4.2)
Scat9.4 ± 4.010.7 ± 3.1721.1 ± 6.718.9 ± 6.314.7 ± 2.415.5 ± 5.1NS9.8 ± 2.2
(6.5–7.2)(5.3–5.5)(8.4–14.7)(9.3–12.7)(9.6–11.4)(6.3–8.3) (3.5–6.4)
2S149.5 ± 25.550.5 ± 25.5------------
(NU)(NU)
S337.3 ± 23.210.9 ± 4.7--18.0 ± 5.920.3 ± 6.4----13.5 ± 8.4
(12.6–14.3)(4.3–4.6) (7.9–10.2)(10.2–11.5) (5.2–5.6)
3S130.5 ± 23.869.5 ± 23.8------------
(NU)(NU)
S320.9 ± 10.511.0 ± 2.3--23.2 ± 3.628.4 ± 3.3----16.4 ± 4.7
(10.8–12.2)(7.6–8.7) (10.4–11.2)(9.2–11.8) (5.7–8.4)
Notes: * Values are means ± standard deviations (uncertainties). NU indicates that no value of uncertainty was obtained; -- indicates that this water source was not included in the river hydrograph separation; NS indicates that no solution was obtained when settlement runoff was included.
Disclaimer/Publisher’s Note: The statements, opinions and data contained in all publications are solely those of the individual author(s) and contributor(s) and not of MDPI and/or the editor(s). MDPI and/or the editor(s) disclaim responsibility for any injury to people or property resulting from any ideas, methods, instructions or products referred to in the content.

