Abstract
Overextraction of groundwater, as well as rapidly changing land use patterns, climatic change, and anthropogenic activities, in the densely populated Melur of Tamil Nadu state in India, has led to aquifer degradation. This study maps the groundwater potential (GWPZ) by evaluating 678 km2 of this region in the Analytical Hierarchy Processes (AHP) and by using remote sensing and GIS tools as part of SDG 6 for the sustainable management of drinking, irrigation, and industrial uses for future generations. Data information layers, such as aquifer (a), topography (t), lineaments (l), land-use/land-cover (LuLc), soil (s), rainfall (r), and drainage (d) characteristics, separated the study area between poor and excellent groundwater potential zones with 361 km2 or 53% of the study area remaining as low GWP and the prospective excellent groundwater potential zone covering only 9 km2 (1.3% of total area). The integrated approach of the GWPZ and Water Quality Index (WQI) can effectively identify different zones based on their suitability for extraction and consumption for better understanding. This study also evaluates the performance of three machine learning models, such as Random Forest (RF), Gradient Boosting, and Support Vector Machine (SVM), based on a classification method using the same layers that govern the groundwater potential. The results indicate that both the RF model and Gradient Boosting achieved 100% accuracy, while SVM had a lower accuracy of 50%. Performance metrics such as precision, recall, and F1-score were analyzed to assess classification effectiveness. The findings highlight the importance of model selection, dataset size, and feature importance in achieving optimal classification performance. Results of this study highlight that the aquifer system of Melur has a low groundwater reserve, and it requires adequate water resource management strategies such as artificial recharge, pumping restriction, and implementation of groundwater tariffs for sustainability.
1. Introduction
Groundwater, a vital resource, supports the global societies in multiple ways [1,2,3]. Approximately 42% of the total population is directly dependent on this resource for the necessities as well as for the livelihood [4,5,6]. However, the groundwater resources have been overexploited due to increasing industrialization [4], agricultural activities [7], and urbanization [8]. The Sustainable Development Goal 6 (SDG 6) provides a blueprint for the availability of safe water and its sustainable management as part of the 2030 agenda. India, with the largest population in the world, also consumes the highest volume of groundwater, and thus, its exploited wells have been continuously rising [9,10,11,12]. Estimates show that almost 60% of its aquifers would become critical by 2025 [13,14,15]
This common source of freshwater is dominantly used for the drinking water supply, agriculture, and animal farming in the Tamil Nadu state of India [16]. However, the depleting groundwater levels have impacted the water resource quantity and quality [16,17,18]. Groundwater exploitation is represented by the ratio of annual abstraction to yearly total water available, and its average value for the Tamil Nadu state is 70% [19]. The current annual groundwater extraction and recharge volumes for this state are 14.4 and 21.1 billion cubic meters, respectively [19]. Similarly, the groundwater withdrawal is about 68% of the annual recharge [12]. These values indicate that groundwater is being pumped at an extremely alarming rate in the state of Tamil Nadu [20]. In addition to their depleted nature [17], the complexity in aquifer systems of this region is represented by the geology comprising charnockite, khondalite, and migmatite gneisses, and they exhibit low storage and movement. The judicious use and sustainable management of these aquifers require effective strategies as designed in the other parts of the world [21] and India [12,22,23]. The delineation of the groundwater potential of any area is an important step for evaluating the aquifer sustainability [24,25]. It is carried out using the Analytic Hierarchy Process (AHP), which uses the multi-criteria decision-making method [26,27]. GIS and remote sensing technologies, incorporated into the AHP, have helped to synthesize the large datasets and to provide accurate results [27,28,29,30,31,32,33,34,35,36]. In the drought-prone Sivagangai district, ref. [37] delineated four major groundwater potential zones through the integration of thematic layers, such as geology and slope, validated by groundwater level maps, and proposed the implementation of artificial recharge structures to enhance groundwater resources. In the Cuddalore district [38], GIS and AHP were employed to map groundwater potential zones, identifying high infiltration rates in coastal areas with flat topography and lower groundwater potential in regions with steep slopes. Similarly, ref. [39] utilized GIS and AHP in the Chennai River Basin, achieving an accuracy of 78.43% in delineating groundwater potential zones. In the Vaigai River upper basin, ref. [40] applied GIS-based weighted overlay analysis to identify suitable zones for groundwater recharge and recommended site-specific artificial recharge structures to mitigate water scarcity.
Groundwater potential zone mapping has been assessed using statistical methods, including the Analytic Hierarchy Process (AHP), in different regions of the world [31,41,42]. However, dynamic interactions and nonlinear changes over time could be underestimated by conventional statistical approaches [24]. On the other hand, machine learning (ML) methods are growing increasingly effective because of their ability to identify intricate connections and predict the location of groundwater. For groundwater mapping, previous investigations have employed a number of machine learning approaches, such as Random Forest (RF), K-Nearest Neighbor (KNN), Gradient Boosting (GB), Support Vector Machine (SVM), and artificial neural network (ANN) [43,44,45]. Several locations have used these models, including India [46], China [47], Bangladesh [48], Pakistan [49], Tunisia [50], and Botswana drylands [51]. Previous studies have been performed in the Madurai district in a broader context, but there has not been any research performed specifically at the Melur block. Recent studies using GIS and remote sensing techniques, ref. [52] investigated groundwater potential zones in the Madurai district’s hard rock terrain, concentrating on thematic layers including geology, geomorphology, and slope. Ref. [53] used remote sensing and fuzzy AHP to evaluate the groundwater potential in Madurai city, finding important factors such as drainage density, geology, and land use. However, none of these studies specifically address the Melur block, an important region within the Madurai district that faces unique hydrogeological challenges. In order to reveal hidden patterns and relationships in groundwater data, these machine learning techniques make use of artificial intelligence. Researchers can precisely determine groundwater potential zones and make well-informed management decisions by utilizing RS and GIS through AHP and ML approaches. These methods allow for the effective mapping of groundwater resources while taking into account a number of variables that affect the presence and behavior of groundwater. Further study in this area will help create sustainable water resource management plans and advance our knowledge of groundwater dynamics.
Although groundwater potential zone mapping has utilized the use of singular models, ensemble models that integrate statistical and machine learning techniques have also shown acceptable accuracy. These ensemble models provide a combination of techniques, utilizing the advantages of machine learning and statistics [44]. Several kinds of machine learning models can be used to help researchers make use of different methods in their attempts at accurate mapping of groundwater potential. Assessing groundwater availability has historically been difficult due to factors such as accuracy, climate change, and a lack of data. By using an innovative approach integrating machine learning algorithms for mapping the sustainable groundwater potential zone in Melur, Madurai District, Tamil Nadu, India, this study addresses this gap.
Gradient Boosting (GB), Random Forest (RF), and Support Vector Machine (SVM) are three machine learning (ML) models that will be used in this study, along with the conventional AHP technique to map groundwater potential zones in the Melur Madurai District. The study enhances groundwater mapping’s accuracy and efficiency by including these models, exceeding traditional methods. This promotes the selection of suitable groundwater resource management plans and regulations. Being the first study to use machine learning techniques in the region of Melur, Madurai, it addresses a significant knowledge gap. Additionally, selecting the best-performing model among them becomes quite difficult because each model produces a profound impact, although there are a number of limitations on how each ML technique may predict a region’s potential. The aquifers here are least replenishable and might deplete further in the absence of any suitable measures in the near future [54]. The developed maps of GWPZ provide valuable information for water users and policymakers to develop sustainable strategies for the preservation of groundwater resources in this region, as well as in other regions with similar geomorphic and geologic characteristics within India.
Globally, numerous studies have applied GIS-based multi-criteria decision-making (MCDM) techniques and machine learning models to delineate groundwater potential zones; however, many are either region-specific or lack integration of both surface and hydrogeological variables in a data-scarce environment. In comparison, limited research exists for the Madurai region that combines geospatial analysis with advanced modeling techniques to evaluate groundwater potential with a focus on both spatial heterogeneity and model interpretability. The current study addresses this gap by integrating physical parameters with machine learning-based feature analysis to assess groundwater potential across a relatively uniform terrain. The key objectives of this research are as follows: (i) to delineate groundwater potential zones using a combination of geospatial and data-driven approaches; (ii) to evaluate the interrelationship between influencing parameters; (iii) to assess the effectiveness of different machine learning models in capturing groundwater potential. The novelty of this study lies in its application of both visual analytics (such as correlation maps and pair plots) and model-based accuracy assessment to interpret complex parameter interactions, offering a more robust and scalable approach to groundwater assessment compared to conventional methods.
2. Materials and Methods
2.1. Choosing the Parameter
The availability, storage, and dynamics of groundwater resources are influenced by the geomorphology, slope, aquifer type, soils, structures, lineaments, and drainage conditions of a region. Similarly, the groundwater recharge is influenced by precipitation, rate of percolation, LuLc, and climate. Therefore, the mapping of groundwater potential areas requires the analysis of the above-mentioned factors and processes [27,55,56,57,58]. Keeping this in view, the present study analyzed eight data layers to assess the groundwater potentiality in the ArcGIS (Version 10.1) software using a systematic procedure as shown in the flow chart (Figure 1). The thematic maps were generated in UTM Projection with Datum WGS84, Zone 44, and with an accuracy of 30 m.
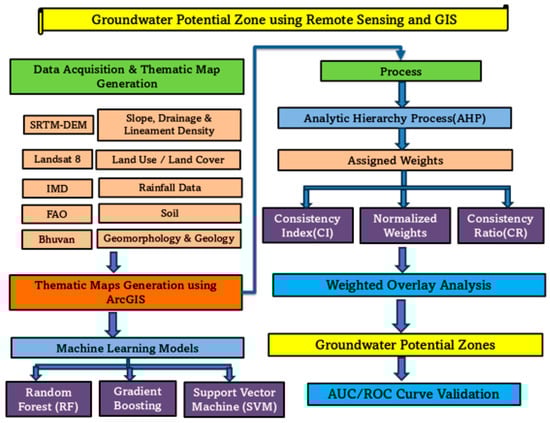
Figure 1.
Flow chart of the methodology adopted for the delineation of groundwater potential zones in the study area.
2.2. Data Acquisition
The geology and geomorphology maps were generated using the data from the survey of India toposheet 58/F and Bhuvan (a web-based platform by the Indian Space Research Organization, ISRO). The soil map of the study area was created using data collected from the Food and Agriculture Organization (FAO) digital soil map. Rainfall data from the Indian Meteorological Department was processed employing the Inverse Distance Weighted (IDW) interpolation [59]. The elevation data from the Shuttle Radar Topography Mission Digital Elevation Model (SRTM DEM) downloaded from USGS Earth Explorer were used to analyze the drainage density, slope, and lineament density. The images from the Landsat-8 sensor (USGS Earth Explorer) were used to categorize the LuLc classes of the area.
Water samples were collected from borewells and Handpumps from 52 different locations (Supplementary Table S1) in the Melur block of Madurai district in January 2023, following the standard procedures outlined by the American Public Health Association [60]. The collection and analysis of various water parameters were conducted using methods from [33,61]. Prior to sample collection, all plastic bottles were thoroughly washed, dried, and rinsed with the water to be sampled. Groundwater level measurements were conducted during the post-monsoon season in January 2023, a period that typically reflects recharged aquifer conditions following seasonal rainfall. Level Data were collected from existing open wells and bore wells throughout the study area using a water level indicator tape with an accuracy of ±1 cm. All wells were allowed to stabilize before recording to ensure accuracy.
Analytical Techniques
After the sample was collected, the bottles were taken to the Environmental Geochemistry laboratory, Department of Geology, V.O. Chidambaram College, in a cooler box to avoid unusual changes in water quality and stored at 4 °C for further analysis. pH, Electrical conductivity, TDS, and salinity were analysed with the help of a multi-parameter probe (HANNA HI98194, USA). The titration method was used to analyze magnesium, bicarbonate, chloride, and sulfate. Sodium, potassium, and calcium were analysed using a Flame Photometer (ELICO CL22D, India) following the standard methods. Fluoride was analysed using an ion-selective electrode (ISE) along with an ion analyzer (ELICO LI126, India). Nitrate and phosphate are analysed using a Visible Spectrophotometer (ANTECH, India). All the analyses were performed using the methods mentioned in APHA (23rd Edition).
2.3. Multi-Criteria Decision Making
Analytical Hierarchical Process (AHP) is commonly employed to solve a complex decision-making problem because it is an unbiased tool and hence can make an accurate judgment. This multi-step mathematical and analytical method initiates by selecting the criteria or parameters such as geology, geomorphology, lineament density, LuLc, rainfall, slope, soil, and drainage density. They were ranked using the [62] scale of (1–9) as shown in Table 1. The weight/rank method is based on the relative importance and influence of each other. A judgment matrix/pairwise comparison matrix was adopted into rows (B) and columns (A) as shown in Table 2, and the normalization was tested by calculating the Consistency Ratio (CR), Equation (1) [39]:
where the Consistency Index CI is a measure used to assess the consistency of pairwise comparisons (consistent < 0.10 and inconsistent > 0.10 [62]; Equation (2)), RI is a random index (Table 3), and n is the number of criteria involved.
CR = CI/RI
CI = (λ_max − n)/(n − 1)

Table 1.
Saaty’s scale of relative importance of different values used in the AHP model.
Table 2.
Pair-wise comparison matrices and weight of eight thematic layers developed in the study.
Table 3.
RI for different values of N used in the Saaty scale.
The weighted overlay analysis was used on the weights provided in the spatial format (Table 4), and the weighted sum of thematic layers was calculated using Equation (3) [63].
where GWPI represents the groundwater potential index, Gg is geology, RF is rainfall, Gm is the geomorphology, S is soil, Sl represents the slope, LuLc is the land-use/land-cover, Dd is the drainage density, Ld represents the lineament density, w denotes weight of the layers, and r is rank of the layer. The map provides five zones dividing the study area between very high and very poor groundwater potential.
GWPI = [(GgwGgr + Rw Rr + GmwGmr + SwSr + SlwSlr + DdwDdr + LuLcw LuLcr + LdwLdr)]
Table 4.
Weight and rank of criteria and sub-criteria influencing the groundwater potential zones in the area.
2.4. Water Quality Index (WQI)
The Water Quality Index (WQI) is a method used to assess the overall quality of water for human consumption by combining various water quality parameters. It is commonly used to determine the suitability of water for domestic use. In this study, the Weighted Arithmetic Water Quality Index was calculated following the established methods [33]. The analysis involved water quality parameters, including pH, turbidity, electrical conductivity (EC), total dissolved solids (TDS), salinity, chloride (Cl−), bromide (Br−), nitrate (NO3−), phosphate (PO43−), sulphate (SO42−), sodium (Na+), calcium (Ca2+), magnesium (Mg2+), and potassium (K+) from 52 water samples.
Each parameter was assigned an average weight value between 1 and 5 based on its significance for water quality and human health. The average weight value (AW) between 1 and 5 was assigned for each parameter.
The initial step was to calculate the relative weight (Rw) for each parameter, as in Equation (4) [64]:
The next step involved calculating the quality rating (Qi) by dividing the measured concentration (Ci) of each parameter by its permissible limit (Si) according to WHO guidelines, then multiplying by 100, as shown in Equation (5) [65]:
In the next step, the Sub-indices (SIi) for each parameter were calculated (Equation (6)) [66], and finally, the overall WQI was determined, as shown in Equation (7) [67]:
Based on the WQI value, the water was classified into five categories, ranging from WQI (0–25) as Excellent to WQI (26–50) as Good, WQI (51–70) as Poor, WQI (71–100) as Very Poor, and WQI > 100 as Unsuitable.
2.5. Machine Learning Approach
2.5.1. ML Models
Each machine learning (ML) technique has its own unique characteristics. Random Forest (RF) is a supervised machine learning approach that is frequently utilized in Python (Version 3.13) for both classification and regression. For classification, continuous variable datasets are used, and regression analysis is performed on categorical datasets. In comparison to other traditional machine learning techniques, the RF method is more effective when analyzing vast data sets and provides excellent prediction accuracy and explicability [68]. Another supervised machine learning method for classification and regression is SVM. SVM models operate more quickly and produce better results when the data is limited and easily identified [69].
Machine learning depends on data-driven methods; every model has its own advantages as well as disadvantages. To identify the Groundwater potential, we are unable to make any decisions based on a single model. So, three models are employed in this study for groundwater potential zonation so that we may compare the various models and obtain an extensive understanding of the groundwater status in this specific area.
Potential groundwater map creation is now considered an emerging topic. Over the past few years, an enormous amount of research has been conducted on this particular topic. GWPZ mapping and identification can be broadly categorized into location-based, statistical approach, physical-based method, and so on. The ML technique is regarded as an innovative approach in the field of GWPZ due to the development of AI. Because of their significantly higher assessment and prediction efficiency compared to the conventional method, the Support Vector Machine (SVM), Random Forest (RF), and Gradient Boost (XGB) algorithms are frequently employed to identify groundwater zones. The above-described method of GWPZ identification involves complex processing steps, and most of the time, researchers must employ multiple software packages. In the present study, we used the programming language Python (Version 3.13) for analysis.
2.5.2. Data Pre-Processing
The target variable in this study was the classified groundwater potential zones using the above AHP technique, and the dataset included several features affecting groundwater potential as mentioned above. Data preprocessing was the initial phase, during which Label Encoding was used to encode the categorical target variable. All feature values were standardized using the Standard Scaler technique to ensure equal distribution and avoid biased learning, as machine learning models perform best with normalized numerical data.
The dataset was divided into an 80:20 ratio, with 80% of the data being used for training and the remaining 20% for testing, aiming to efficiently train and test the models. There were three models used for classification. The Random Forest Classifier is a decision tree-based ensemble learning technique that combines several trees to increase prediction accuracy and avoid overfitting. The Gradient Boosting Classifier is a boosting technique that improves prediction power by iteratively building trees and fixing mistakes from earlier iterations. A kernel-based classification technique called the Support Vector Machine (SVM) determines the best hyperplane for dividing several groups of groundwater potential.
The training dataset was used to train each model, and the test dataset was used to make predictions. Classification criteria like accuracy, precision, recall, and F1-score were used to evaluate performance. To further visualize misclassifications, a confusion matrix was produced for every model. In addition to assessing accuracy, the Random Forest model was used to conduct a feature importance analysis in order to determine the most important factors influencing the classification of groundwater potential. Additionally, a correlation heatmap was created to analyze feature correlations and evaluate potential multicollinearity problems.
3. Study Area
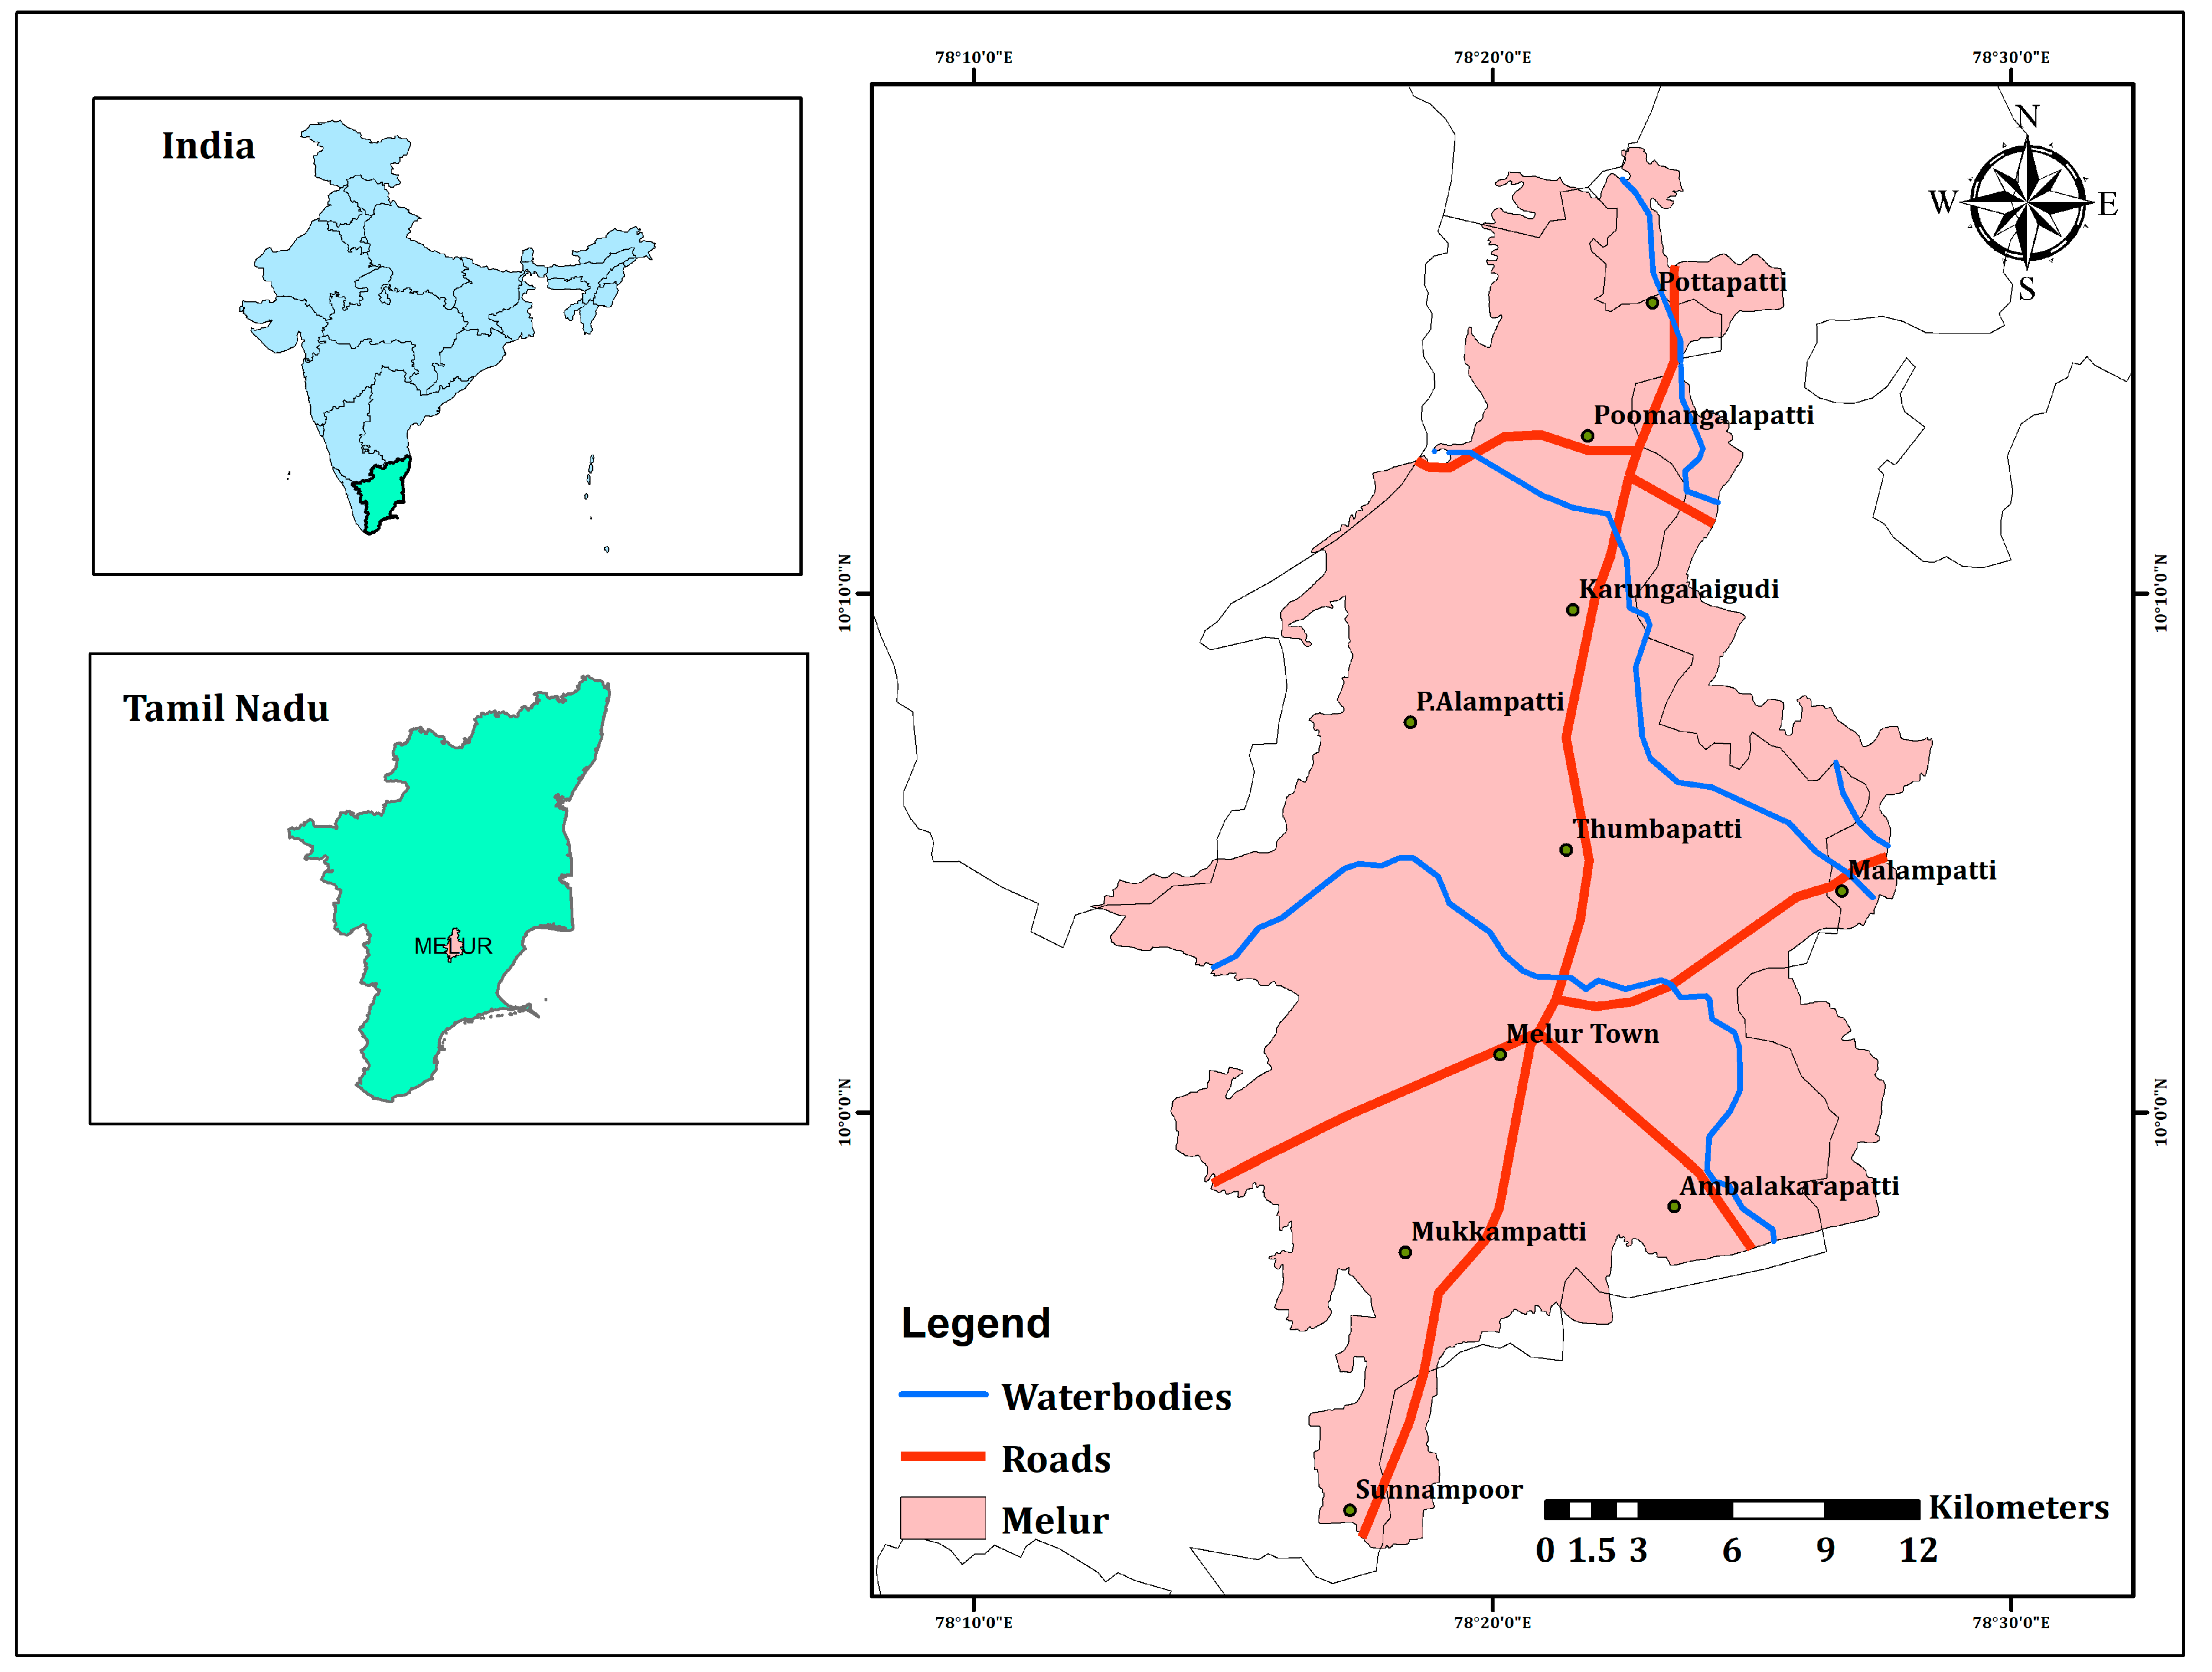
Melur is located in the Madurai district of Tamil Nadu state in India (Figure 2). This area, with an extension of 678 km2, has agriculture as the major occupation and economic driving force. The Vaigai River flows through it by bisecting the district almost equally. This Madurai region receives an annual mean rainfall of 902 mm, and the geology is represented by crystalline Archean to Proterozoic rocks comprising charnockite and khondalite groups with the migmatite derivatives. The groundwater movement occurs through interconnected shallow and deep fractures in the confined and semi-confined aquifers [70].
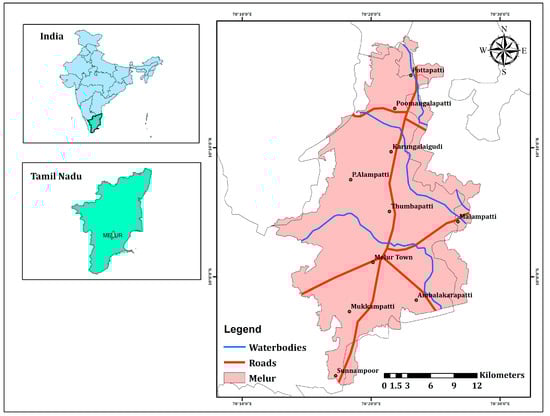
Figure 2.
Location map showing the study area of Melur, Madurai district, Tamil Nadu.
4. Results
4.1. Geology
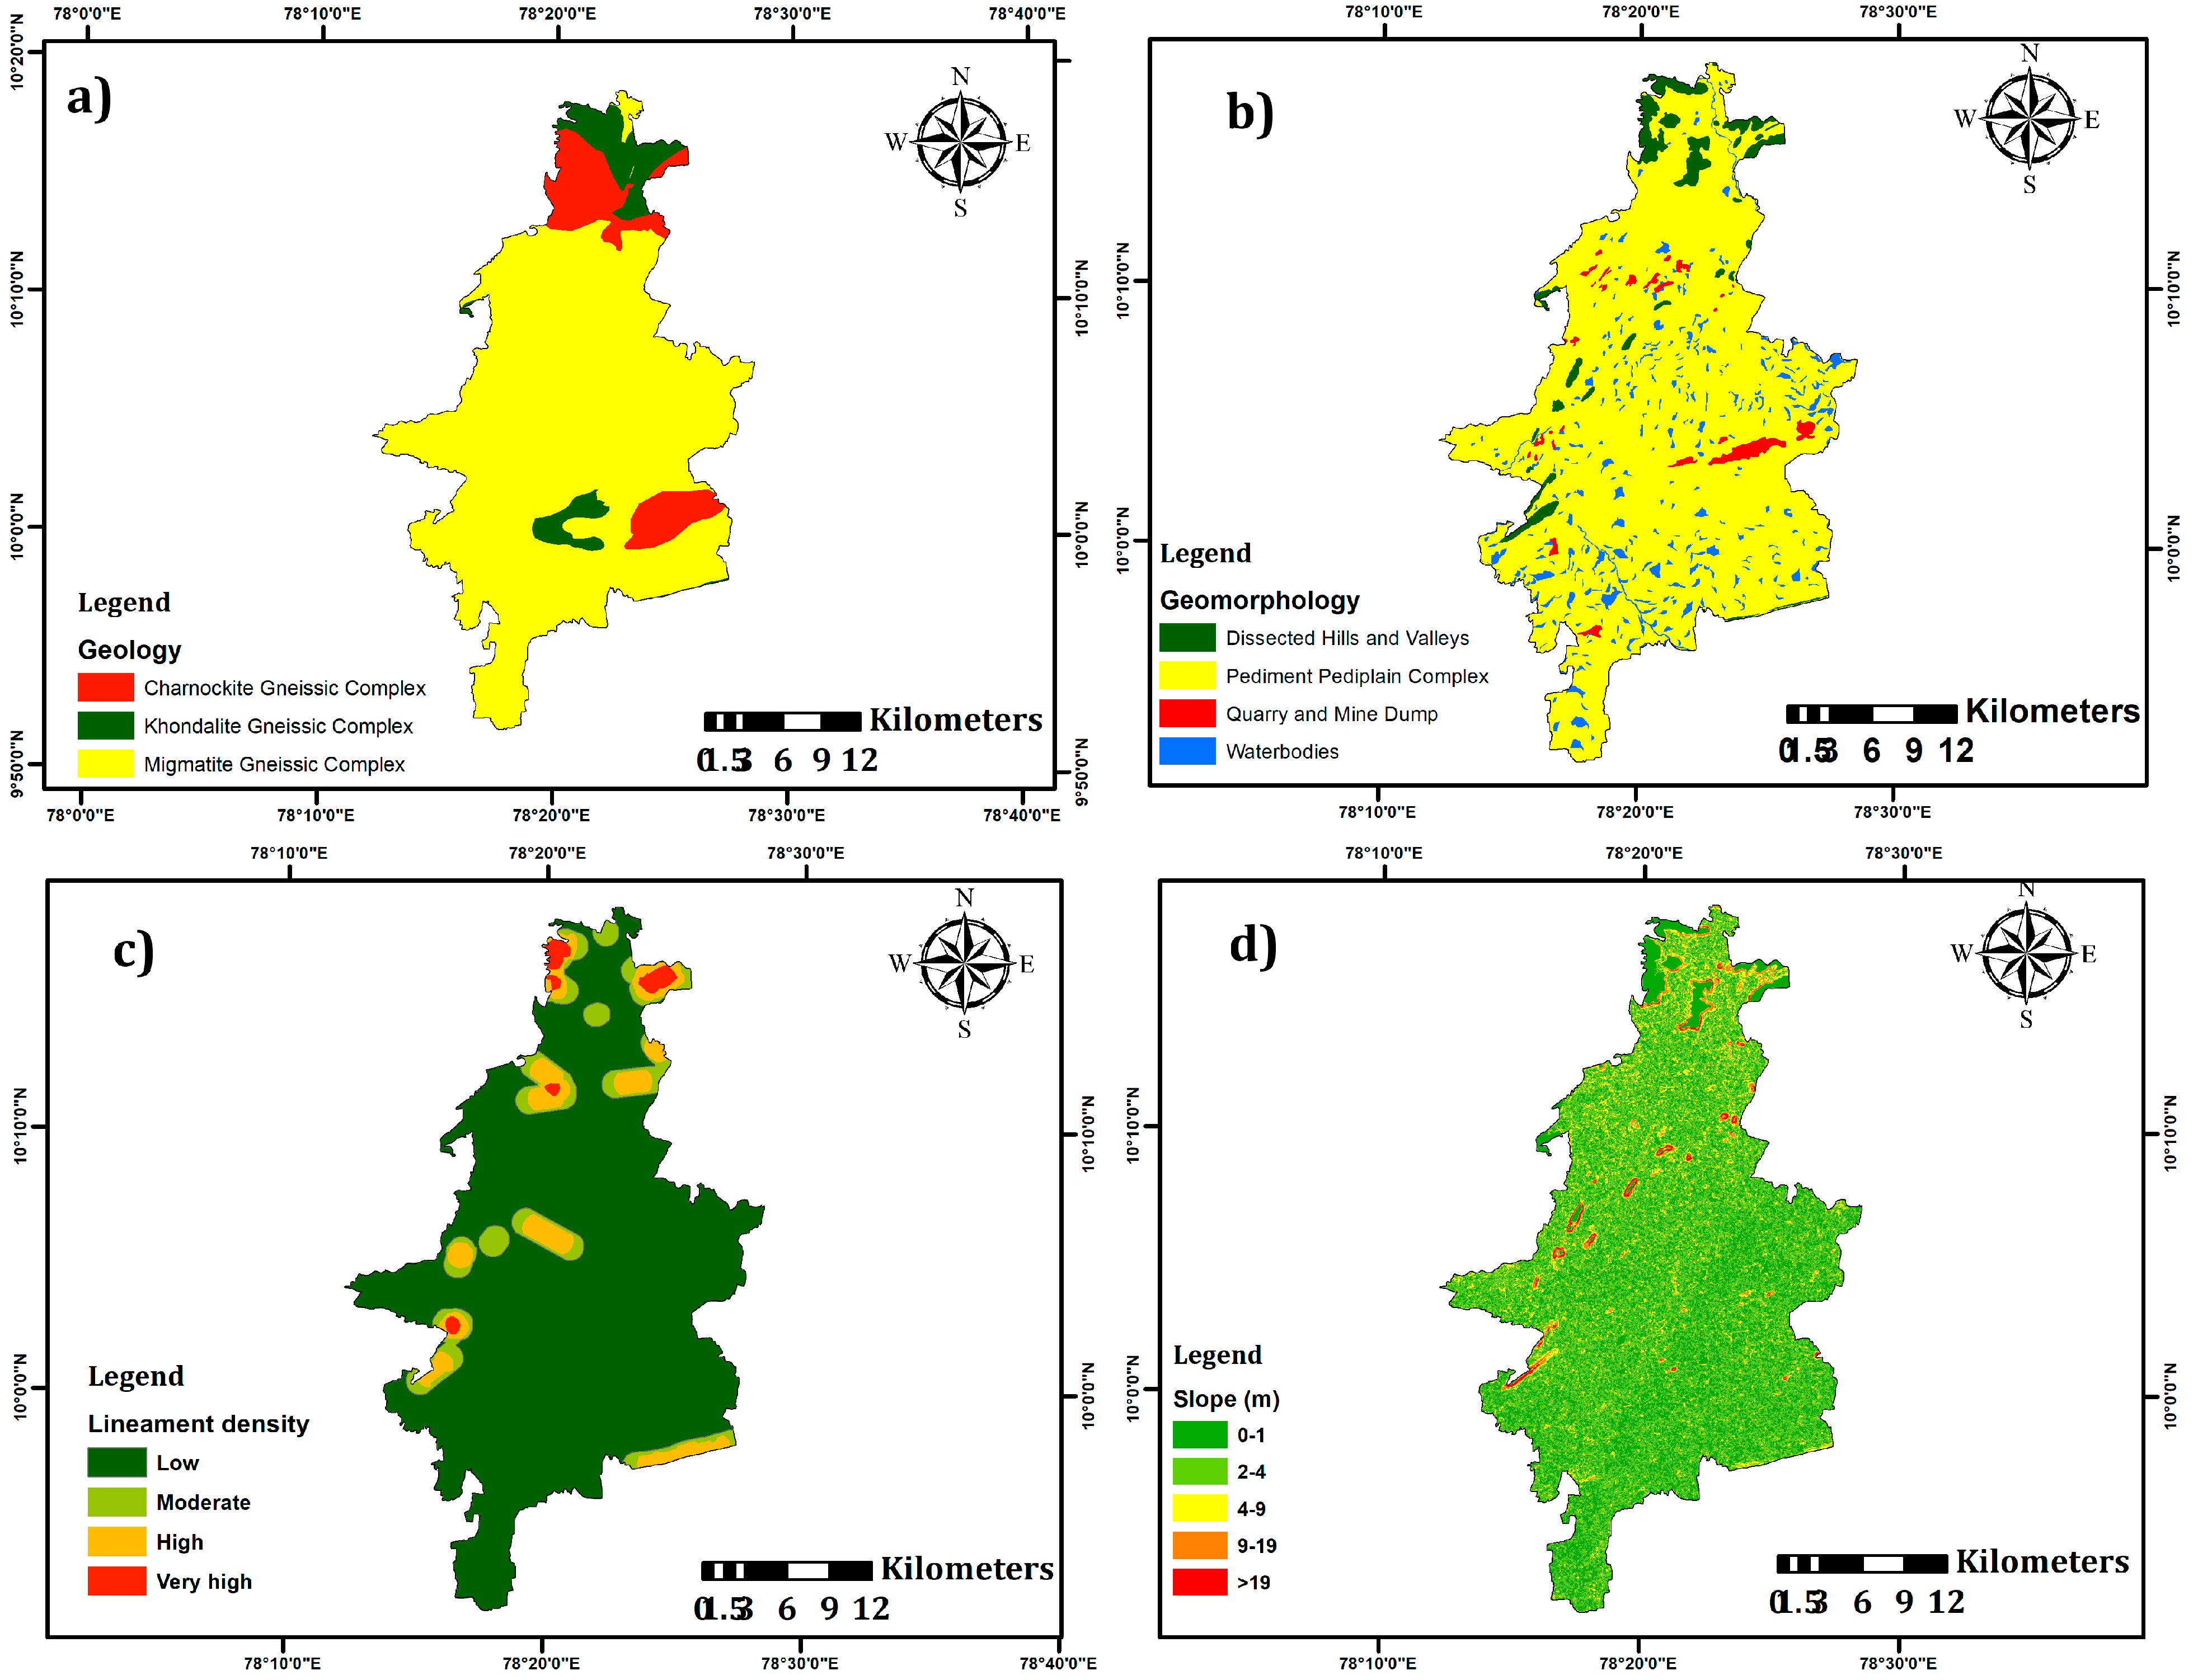
The major rock types include crystalline rocks consisting of charnockite and khondalites. A majority of the Melur area also has exposures of migmatite gneissic complex (Figure 3a) covering the southern and central regions, representing a significant portion of the area. The Khondalite Gneissic Complex is primarily concentrated in the northern region, while the Charnockite Gneissic Complex appears in scattered patches in the northern and central regions. These geological formations influence the area’s groundwater potential, with the Khondalite and Charnockite regions showing higher groundwater potential due to their lithological characteristics. In these terrains, the groundwater is sustained through the secondary porosity, such as percolation through the fractured and highly weathered crystalline rocks [70].
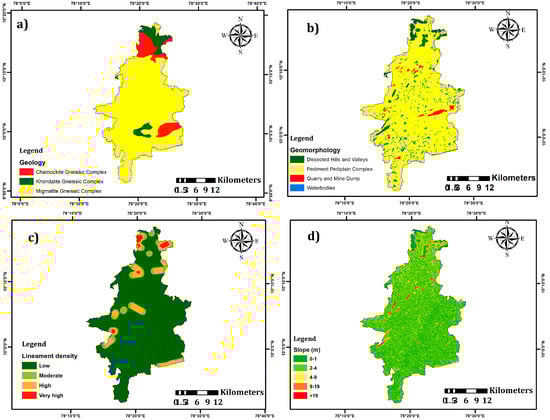
Figure 3.
(a–d). Map showing geology, geomorphology, lineament density, and slope in the Melur region.
4.2. Geomorphology
Among the eight thematic layers, the geomorphology influences the groundwater occurrence and flow [71]. The landform map shows distinct geomorphological units viz. pediment and pediplain complex covers approximately 450 km2, representing about 66.3% total area, weathered hills/valleys cover roughly 90 km2 or 13.3% of the area, quarry and mine areas occupy around 35 km2 or 5.1% of the study area, and river and water bodies covering approximately 60 km2 (8.8%) and 43 km2 (6.5%), respectively (Figure 3b). Pediments and pediplains are common. Manmade depressions like quarries generate artificial groundwater recharge [72]. Rivers and other water bodies also recharge the aquifers and encourage the groundwater potential.
4.3. Lineaments
Lineaments comprise mainly faults or fractures, as well as subsurface structural features like lithological boundaries and the drainage profiles [73]. The map of lineament (Figure 3c) indicates that the study area exhibits low lineament density. Lineament density is highest in the northern parts, favoring the recharge through fractures, joints, and fissures. The interconnected fractures, along with a pressure gradient, encourage the groundwater flow from the high to the low lineament areas.
4.4. Land Slope
Surface slope inversely affects the rate of recharge, with the steep slopes encouraging more runoff and the gentle slope favoring infiltration due to prolonged residence time [74,75]. The areas with gentle slope have higher groundwater potential than the steep slope regions [27]. The slope map shows an overall gently sloping topography, and the steeply sloping features resembling hills are found in the central and western regions. The isolated valleys, similar to the depressions, are present in the northern region (Figure 3d).
4.5. Land-Use/Land-Cover (LuLc)
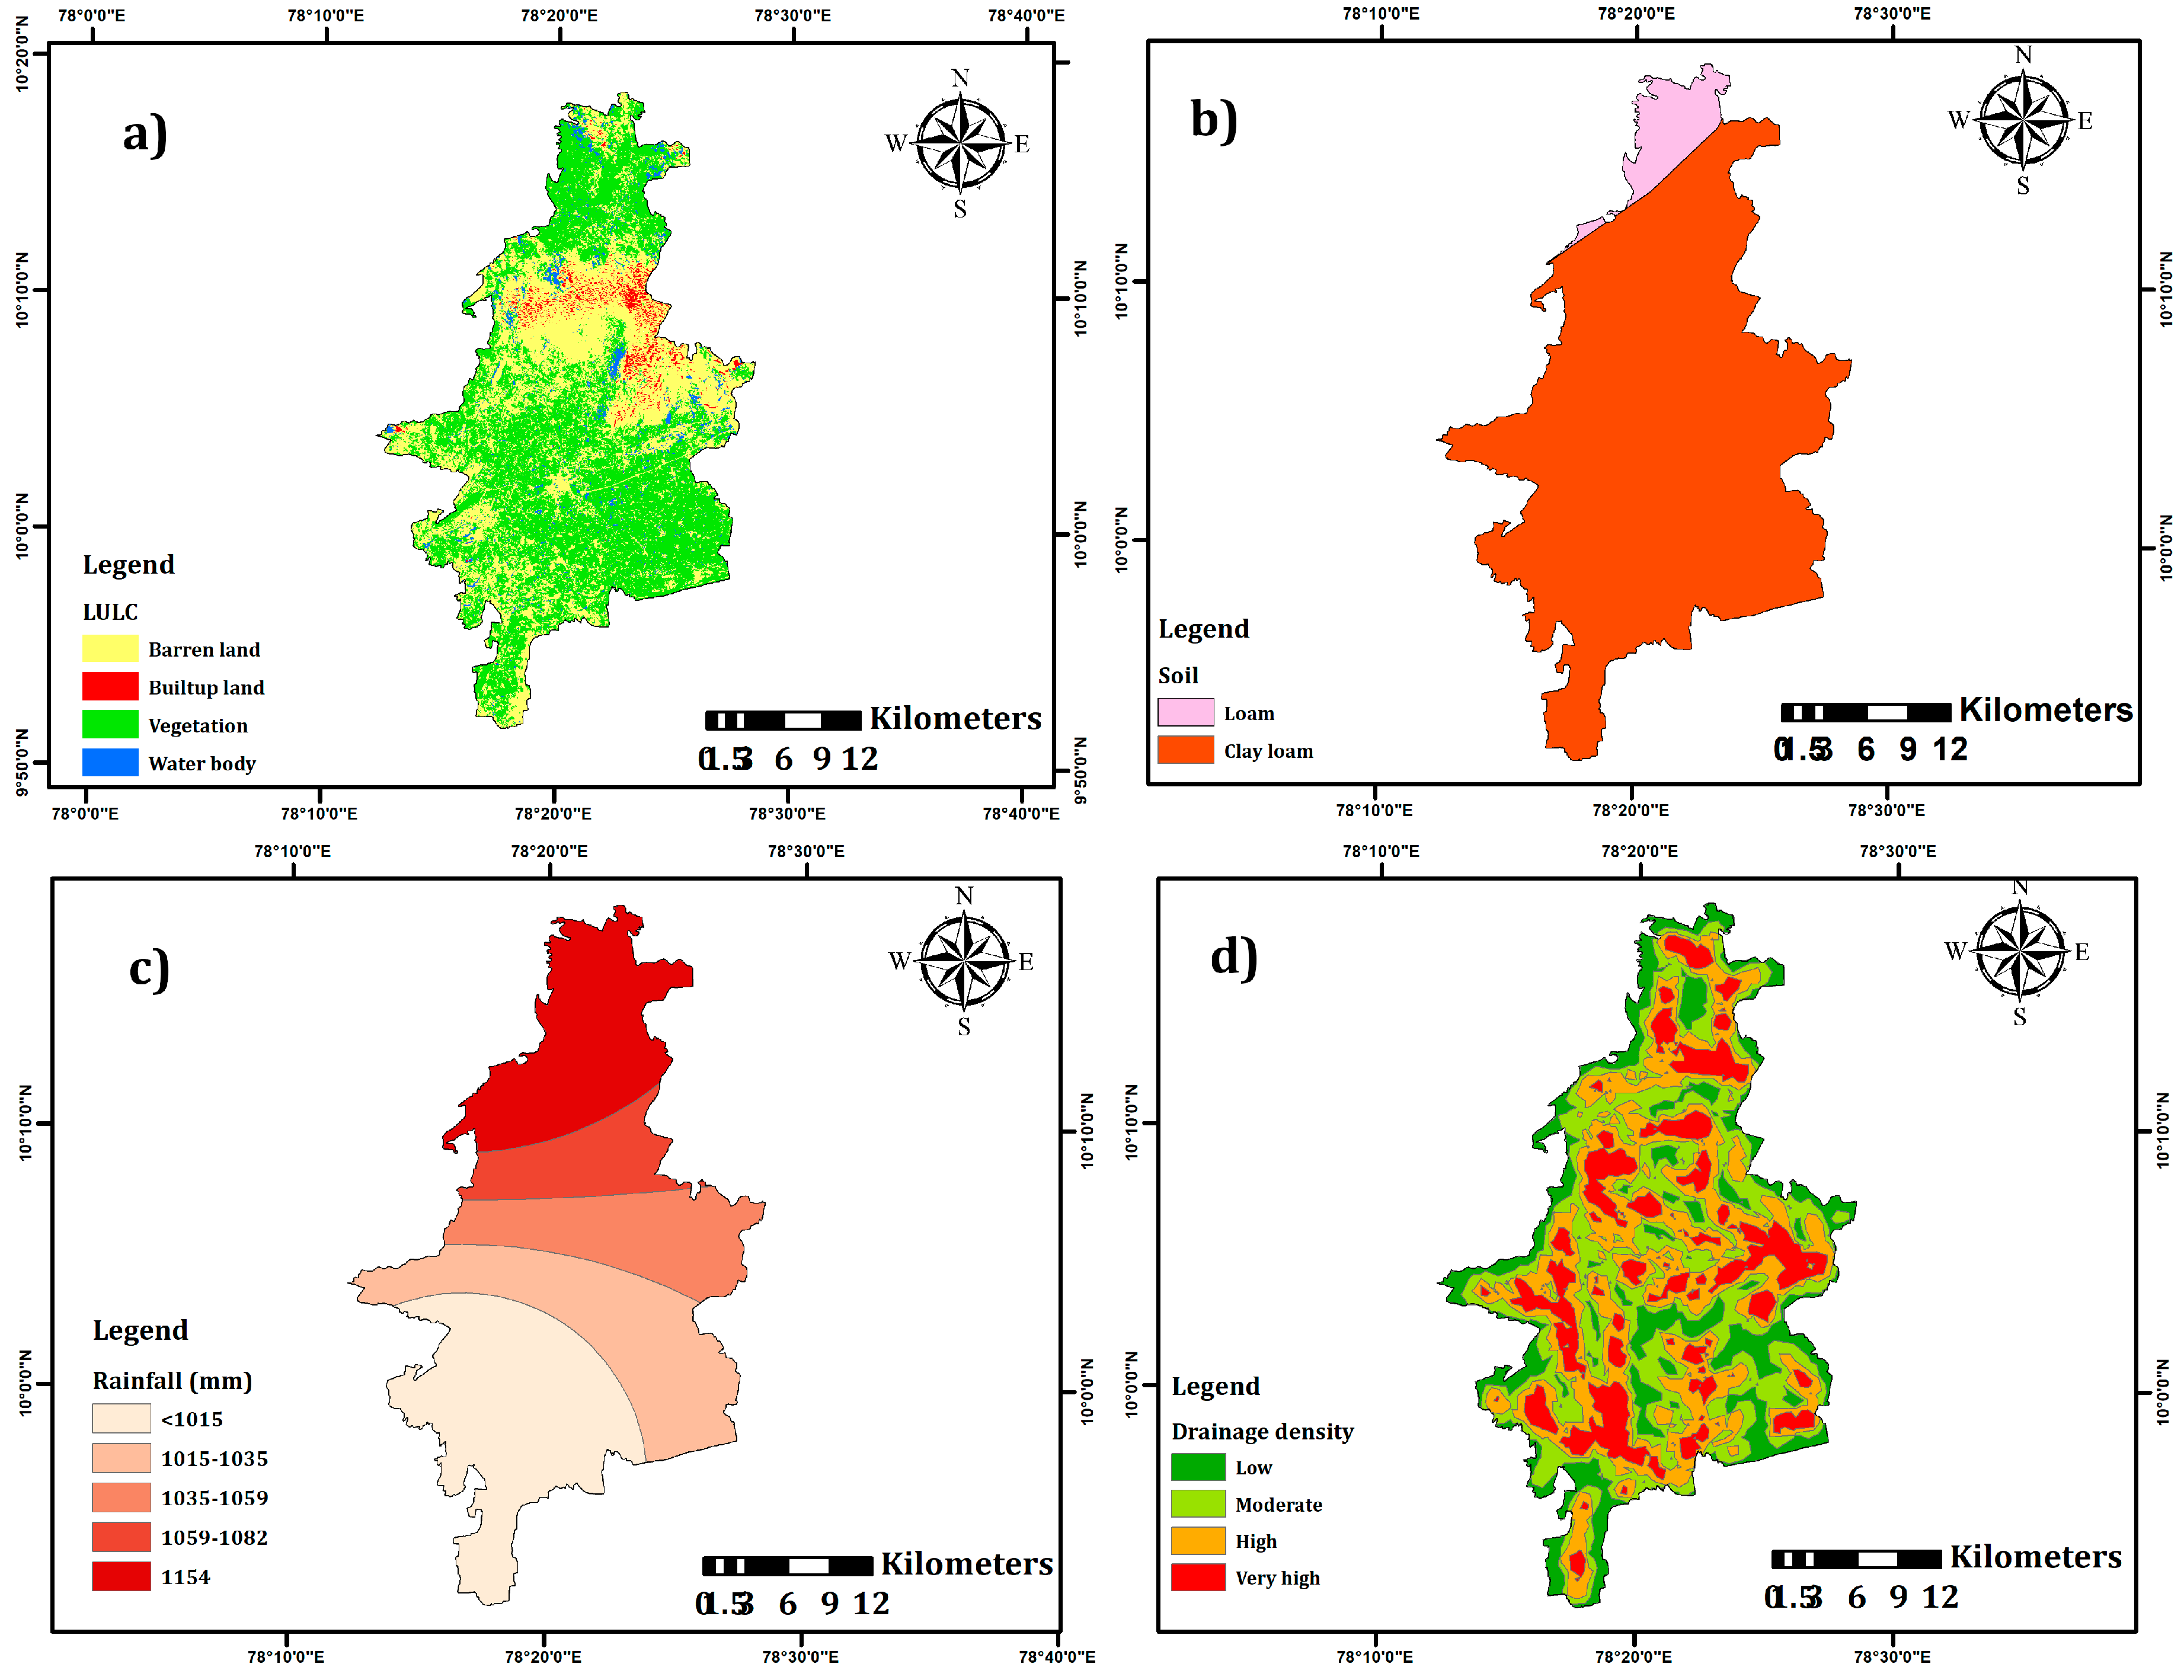
Land use/land cover (LuLc) data is essential to characterize the runoff, evapotranspiration, and percolation [76]. The LuLc map shows four major classes, with about 53.1% of the area covered by vegetation or cropland. This LuLc class favors recharge and storage of the groundwater (Figure 4a). About 41% of the area is barren or uncultivated land, 16.55% is represented by the residential buildings or urbanization, and 23.9% of the area is covered by water bodies.
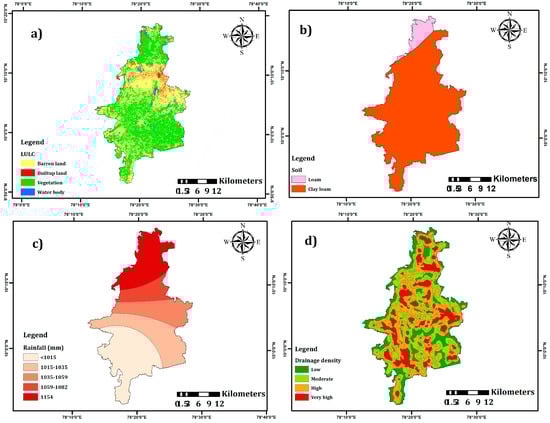
Figure 4.
(a–d). Map showing land use/land cover (LuLc), soil, rainfall, and drainage density in the Melur region.
4.6. Soil
Soils affect recharge by permitting water infiltration, as the highly permeable soil allows more recharge. The dominant soil types in the study area are represented by clay loam and loam soil. Clay loam has a higher percentage of clay, and its low permeability inhibits the groundwater infiltration. Loam soil, consisting of equivalent proportions of sand, silt, and clay, provides more permeability and allows more groundwater recharge [77]. The clay loam covers the entire area except for the northern region, whereas the loam soil is restricted to the northern part (Figure 4b).
4.7. Rainfall
The rate of infiltration is influenced by the amount of rainfall [28]. The duration, intensity, and pattern of rainfall control the recharge process. Low-intensity rainfall for many days is generally suitable for recharge [78]. In the study area, the northeastern monsoon is the major contributor of precipitation. The rainfall map illustrates between 1015 mm and 1104 mm of average annual precipitation, with the highest values located in the northern area. In general, the overall distribution shows comparable rainfall throughout the study area (Figure 4c).
4.8. Drainage Density
Drainage density, a measure of the length of streams per unit area of the basin, also impacts the groundwater resources. High drainage density promotes more runoff and low groundwater recharge. The drainage density is categorized into four classes: low density (high groundwater potential), moderate density, high density, and very high density (low groundwater potential) [79,80]. Figure 4d illustrates that the central parts have high drainage density and consequently the least groundwater prospects.
4.9. Hydrogeochemical Characteristics
pH levels in the Melur region range from 7.0 to 8.1. The southern region shows slightly alkaline water (up to 8.1), likely due to geological formations or human activities such as agriculture or industry. The central and northern regions have near-neutral pH levels (7.0–7.5), indicating stable and suitable water. The slight alkalinity in the southern parts may require periodic monitoring to maintain water quality.
Electrical Conductivity (EC), which indicates salinity and dissolved ions, ranges from 790 to 2010 µmho/cm. The southern region has higher EC levels, especially in areas with lower water levels, due to evaporation. The central region shows moderate EC levels (950–1690 µmho/cm), while the northern region has the lowest values, starting at 790 µmho/cm, suggesting fresher water. High EC in the south may affect water usability for drinking and irrigation, as salinity can harm crops and human health.
Total Dissolved Solids (TDS), which measure dissolved substances in water, range from 422 to 1054 mg/L. The southern region has higher TDS levels, often exceeding 1000 mg/L, likely due to rock–water interaction or agricultural runoff, making the water unsuitable for direct consumption without treatment. The central and northern regions have moderate to low TDS levels (422–855 mg/L), remaining within permissible drinking water limits.
Calcium (Ca++) and Magnesium (Mg++) are key indicators of water hardness. In the study area, calcium levels range from 50 to 118 mg/L, and magnesium levels range from 29 to 84 mg/L. The southern region has higher calcium levels, often above 100 mg/L, and magnesium levels reaching 84 mg/L, leading to harder water. This is caused by natural rock–water interaction. The northern region has lower calcium levels (50–60 mg/L) and magnesium levels below 29 mg/L, resulting in softer water. Sodium (Na+) and Potassium (K+) are important for assessing water salinity and irrigation suitability. Sodium levels range from 58 to 156 mg/L, with higher concentrations in the southern and central regions, which can affect soil quality and crop growth. The northern region has lower sodium levels (58–97 mg/L), making the water better for agriculture. Potassium levels are low across all regions, ranging from 2 to 7 mg/L, indicating little human impact, such as fertilizer runoff, on water quality.
Anions like Chloride (Cl−), Sulphate (SO42−), and Bicarbonate (HCO3−) are the main indicators of water quality. Chloride levels range from 72 to 330 mg/L, with higher levels in the southern region (over 300 mg/L), likely due to agricultural runoff, salt leaching, or weathering. Excess chloride can make water salty and unsuitable for drinking. The central and northern regions have moderate chloride levels (72–180 mg/L), indicating better water quality.
Sulphate levels vary between 48 and 180 mg/L. The southern regions show higher sulphate concentrations (above 150 mg/L), which can cause a bitter taste and gastrointestinal issues. In the northern regions, sulphate levels are lower (below 100 mg/L), indicating good water quality. Bicarbonates range from 180 to 360 mg/L, with higher levels in the southern regions contributing to alkalinity and water hardness.
The Water Quality Index (WQI) combines several parameters to assess overall water quality. WQI values range from 57.07 to 120.82. The southern regions have excellent water quality (WQI below 60), suitable for all purposes. The central regions show moderate quality (WQI 70–90), where treatment may be needed for drinking. The southern regions face poor water quality, with WQI exceeding 100 (up to 120.82), caused by high TDS, EC, and hardness. Immediate steps like water treatment and source protection are required to improve water quality in these areas.
5. Discussion
5.1. Mapping Groundwater Potential Zones
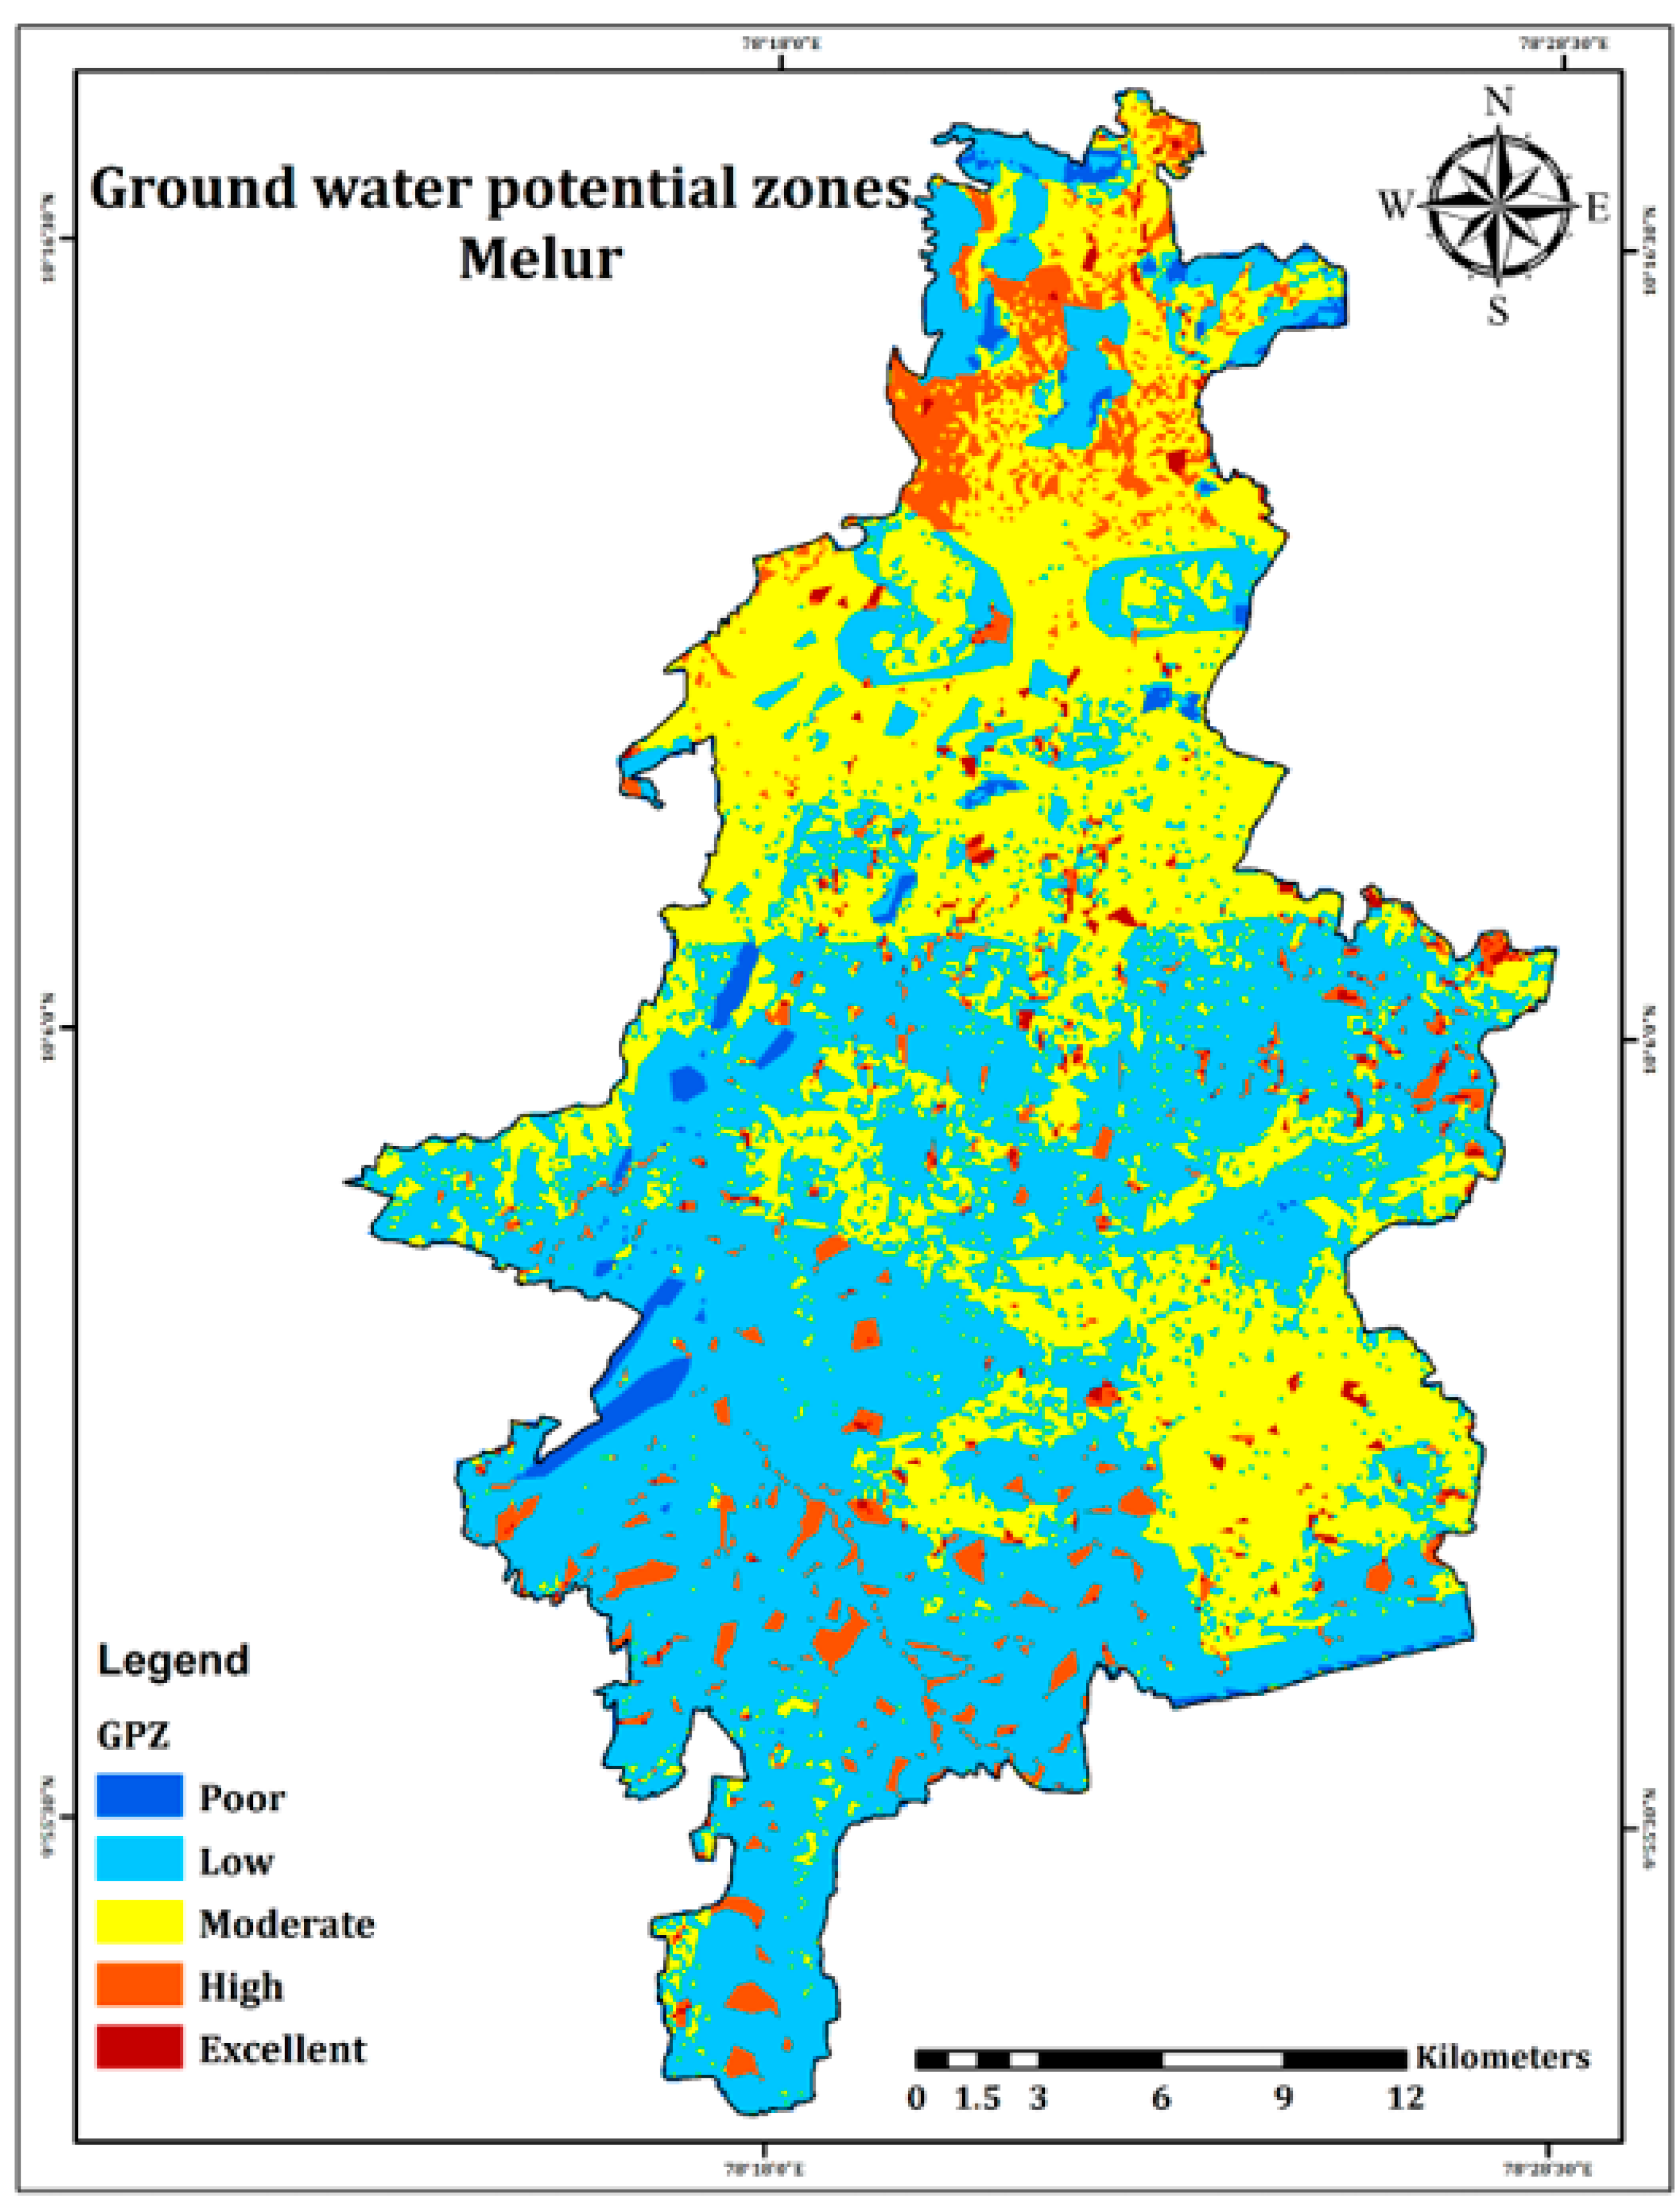
The groundwater potential zone (GWPZ) estimation shows five divisions within the study area covering about 678 km2, i.e., poor, low, moderate, high, and Excellent potential (Figure 5). The area with low potential covers about 361.16 km2. i.e., about 53% of the total surface, and the very low potential zone is restricted to approximately 15.41 km2 or 2.2% of the surface. The moderate potential zone represents approximately 248.14 km2 and covers 36.5% of the area. High potential and excellent potential zones cover only approximately 45.20 km2 (6.6%) and 9 km2 (1.3%) of the study area, respectively (Table 5). The northern area has excellent groundwater potential, and these areas comprise crystalline lithologies such as Khondalite-gneiss, Charnockite group of rocks, and small patches of Migmatite-gneissic group of rocks. The hard rock terrains are generally unfavorable for recharge, but the high lineament density might have favored more infiltration to the aquifer. The dissected valley in the northern region could have also favored high infiltration, and additionally, the northern region receives more rainfall than the rest of the study area. Thicker vegetation and cropland here allowed the elevated recharge. In the central and southern regions, the lack of secondary porosity in the crystalline formation restricts the groundwater recharge, and hence, these regions are characterized by poor groundwater potential. Numerous features of the steep slope in the central part also augmented the runoff and thus limited the groundwater recharge.
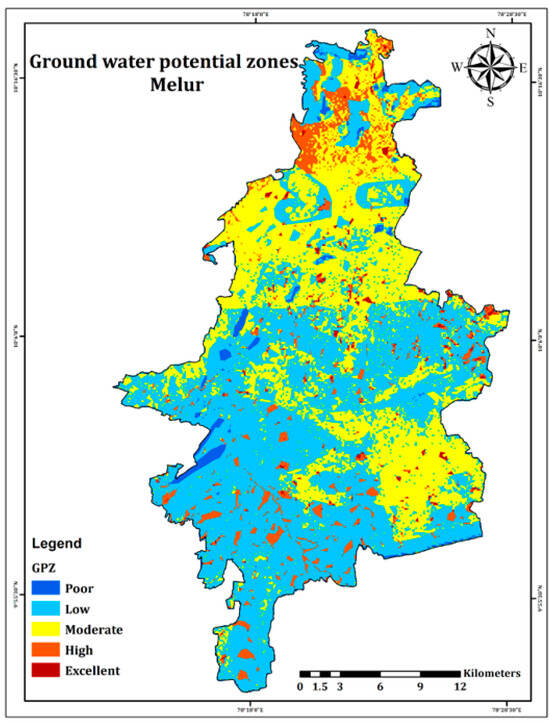
Figure 5.
Developed map depicting the groundwater potential zones in the study area.
Table 5.
GWPZ in the Melur area, the area covered, and the respective percentages.
The study’s results are similar to those of other groundwater potential studies conducted in India, particularly in Tamil Nadu. Ref. [37] identified moderate (38.2%) and good (30.8%) groundwater potential zones in Sivagangai using AHP and GIS, similar to the moderate to good zones found in Madurai’s hard rock terrain by [52]. Similarly, the study by [38] in Cuddalore also highlights high potential in flat areas and poor potential in steep zones, which correlates with the recharge variability in hilly areas of other studies. In the Chennai River Basin, ref. [81] demonstrated that AHP-based GIS mapping can provide a high level of accuracy (78.43%), validating groundwater potential zones, similar to the findings of other studies like [17] in the Upper Odai basin. Ref. [40] also emphasized the importance of recharge structures like check dams in regions with low groundwater infiltration, paralleling the current study’s recommendations for managing groundwater sustainably. Studies across Tamil Nadu, including the application of advanced soft computing models by [82], further enhance the reliability and significance of geospatial techniques in identifying and managing groundwater resources, as reflected in the broader comparison with similar hard rock terrain assessments.
5.2. Integration of Water Quality Index
In the GWPZ map in Figure 5, substantial portions of the central and northern areas show moderate to high groundwater potential, whereas the southern parts exhibit poor to low potential. The areas with a high potential are characterized by favorable geological formations and topography, promoting recharge. The minimum and maximum values of the hydrogeochemical parameters in the Melur region, compared with WHO drinking water standards, are summarized in Table 6.
Table 6.
Minimum and maximum values of the hydrogeochemical parameter in the Melur region.
Figure 6 shows the water level variations across the study region, which represents the depth of groundwater, and the Water Quality Index (WQI) map assesses groundwater quality based on hydrochemical parameters. The north-central region, classified as having moderate to high GWPZ, also corresponds to shallow to moderate water levels. This indicates good recharge zones with relatively higher groundwater availability. The northeastern zone also shows good to excellent water quality (WQI 0–70). This region is good for groundwater extraction for drinking and irrigation.
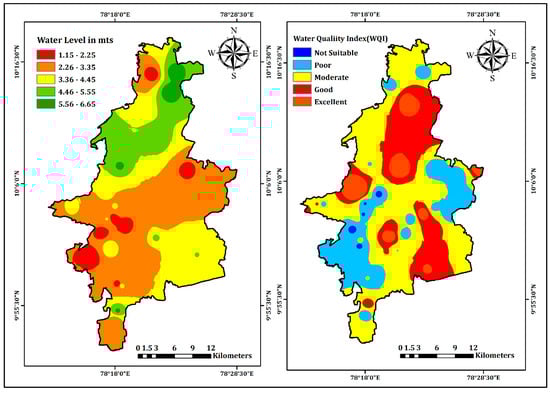
Figure 6.
Spatial distribution of water level (mts) and Water Quality Index (WQI) across the study area.
The western region of the study area with high water levels aligns well with low to moderate GWPZ zones, suggesting specified recharge conditions despite potential limitations. Central and western areas demonstrate moderate water quality (WQI 70–90). These regions require periodic monitoring for contamination control.
The southern areas, which are shown as having poor groundwater potential, exhibit deeper water levels (>4.5 m). This confirms limited groundwater availability in these regions due to poor recharge. The southern parts exhibit poor to non-suitable water quality. These areas are categorized as having poor water quality (WQI 90–120), which is primarily due to elevated TDS, EC, and hardness levels. Deeper water levels and poor recharge result in higher salinity and contamination, lowering water usability.
By integrating the Groundwater Potential Zones (GWPZ) and Water Quality Index (WQI), the study can effectively identify different zones based on their suitability for extraction and consumption. Zones with both high potential and good quality are ideal for extraction and use, as they offer abundant and clean water resources. Zones that exhibit high potential, but poor quality, would require water treatment before they can be safely used, as they possess potential in terms of quantity but must be purified for proper use. Zones with low potential and poor quality are not suitable for extraction or consumption, as they provide insufficient water of poor quality. This integrated approach helps to efficiently manage water resources and ensure their ideal utilization based on both quantity and quality.
5.3. ML Model Evaluation
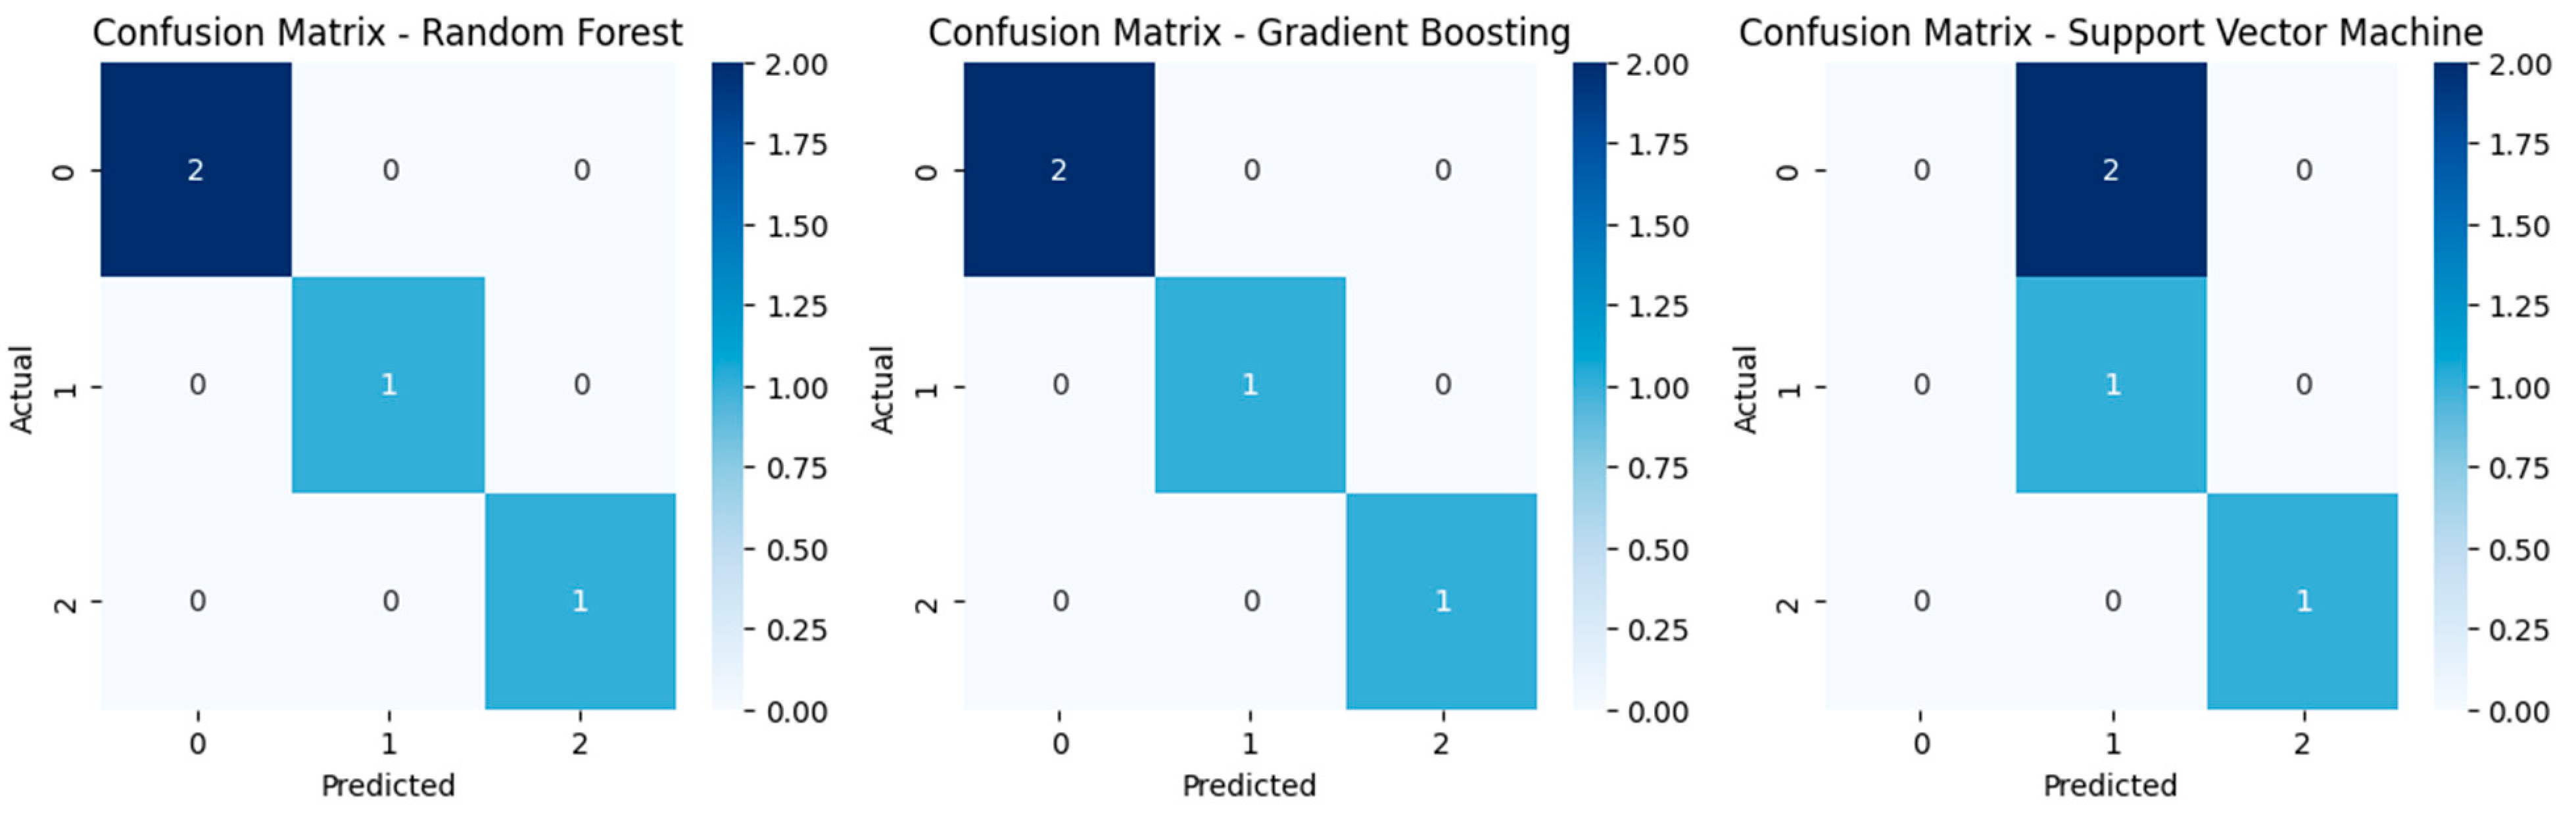
After training and evaluation of the three models, the Random Forest and Gradient Boosting classifiers precisely classified all test samples with a perfect accuracy of 100%. The Support Vector Machine (SVM) model performed weakly, achieving an accuracy of just 50%. Both the Random Forest and Gradient Boosting models had precision, recall, and F1-score of 1.00 for all groundwater potential classes, according to a comprehensive analysis of the classification reports. This suggests that these models were quite successful in identifying patterns in the dataset and accurately identifying the zones of groundwater potential. However, the Support Vector Machine (SVM) model had a lot of trouble where class 2 received a precision score of 0.00 because, according to the classification report, it was entirely misclassified. However, class 4 was accurately identified with 100% precision and recall, while class 3 was correctly forecasted with 100% recall (Table 7). This implies that not all groundwater potential zones were adequately covered by the SVM model. One possible explanation for SVM’s poor performance is its dependence on hyperplane separation, which may not be optimal for high-dimensional datasets with complex feature interactions. Additionally, the presence of class imbalance in the dataset may have contributed to its reduced accuracy. Since SVM depends on support vectors to define decision boundaries, it may struggle in cases where classes are not well-separated in feature space.
Table 7.
Machine learning models’ accuracy and performance.
Figure 7 shows the confusion matrices for further understanding of model performance. While Random Forest and Gradient Boosting showed no misclassifications, the SVM model exhibited incorrect classifications for class 2, leading to an overall accuracy of just 50%. The confusion matrix for SVM revealed that it failed to predict any instances of class 2 correctly, reinforcing the findings from the classification report.
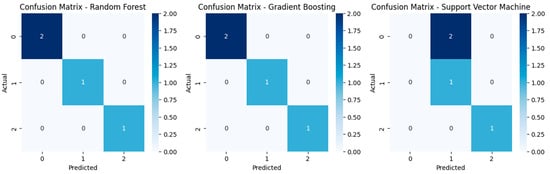
Figure 7.
Confusion matrices for different ML models.
5.3.1. Feature Importance and Correlation Analysis
The Random Forest model was used to do a feature importance analysis to better understand the factors that influence the classification of groundwater potential (Figure 8). The findings showed that certain factors were significantly more important than others. These crucial factors were most important in identifying groundwater potential zones and had the greatest impact on model predictions.
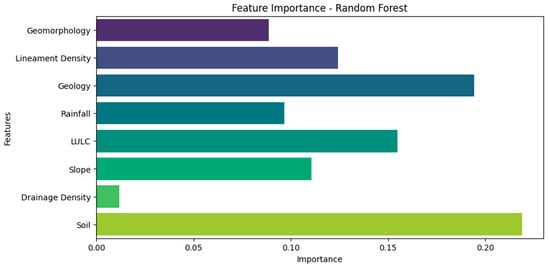
Figure 8.
Feature importance analysis was performed using the Random Forest (RF) model.
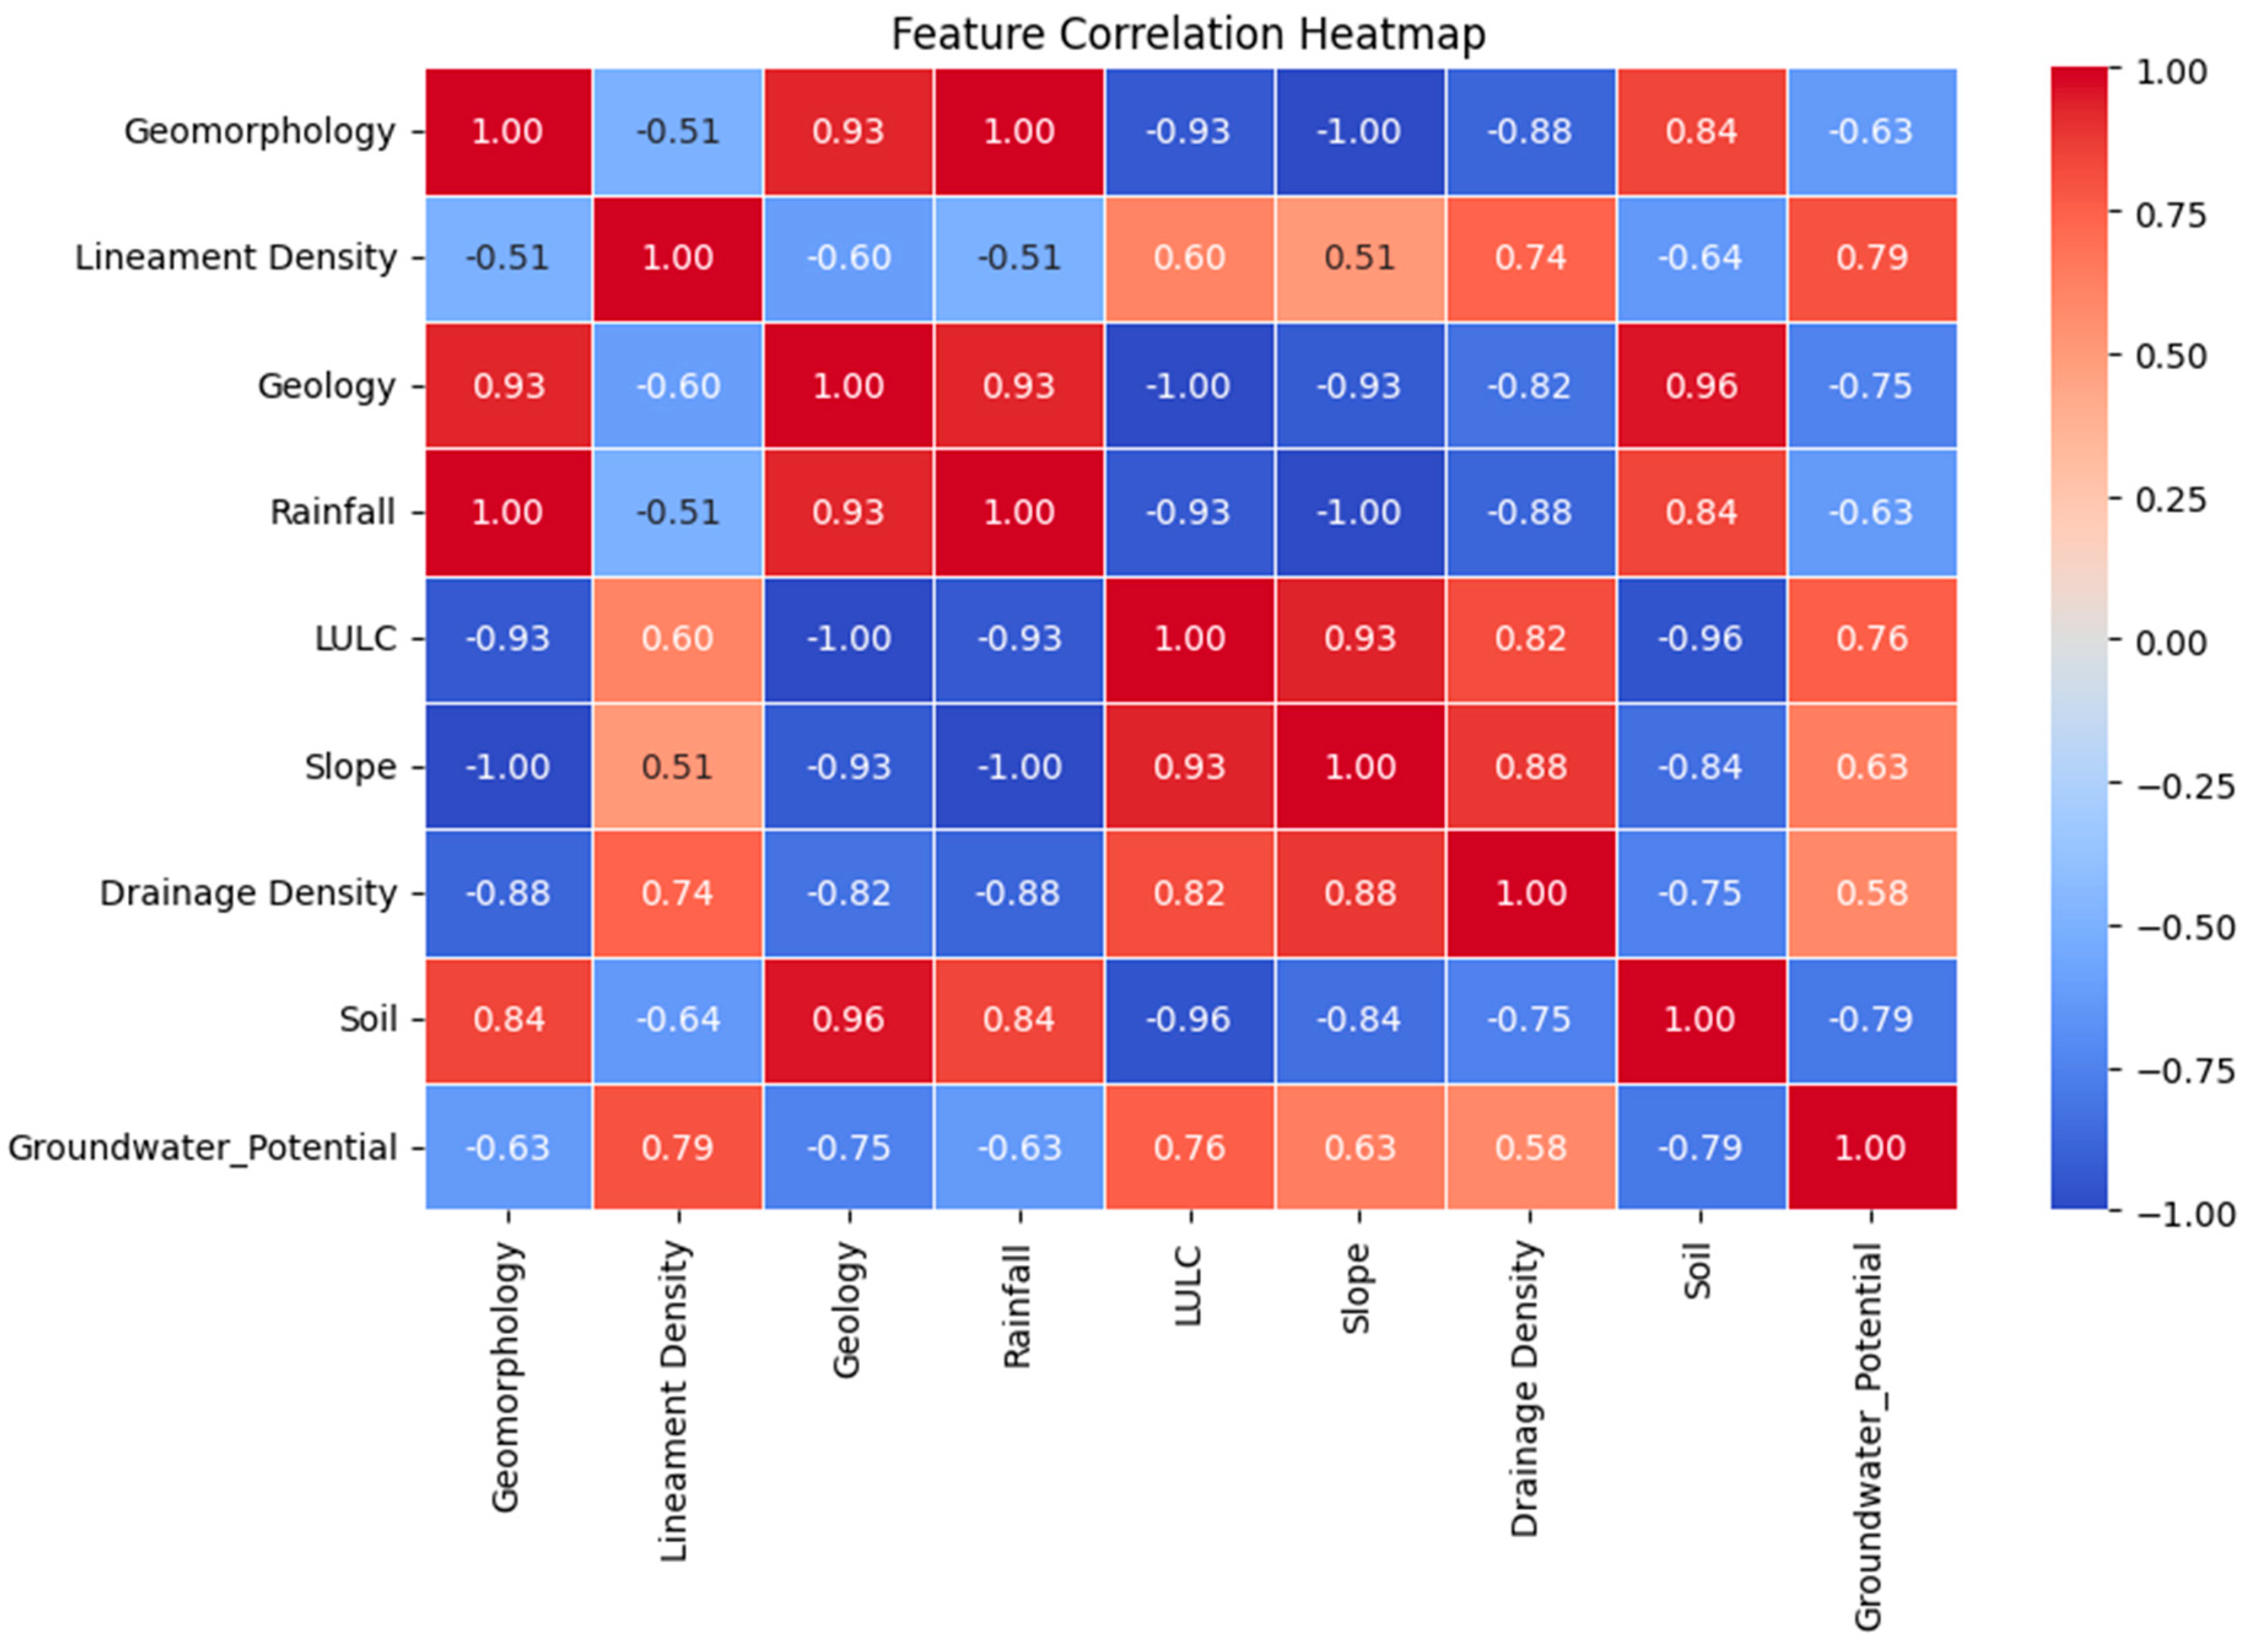
Figure 9 shows the correlation heatmap, and Figure 10 shows the pair plot that was developed to investigate the relationship between different parameters, in addition to feature importance. Strong correlations between certain variables were found across the study, which may indicate that the dataset contains information that is redundant. Multicollinearity, or a high correlation between features, can lead to overestimation, resulting in the model being less accessible. Feature selection strategies could be useful in future investigations to remove excessive information and increase model efficiency.
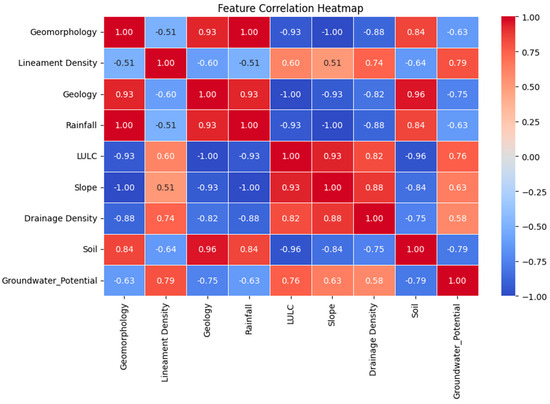
Figure 9.
Correlation heat map for model parameters.
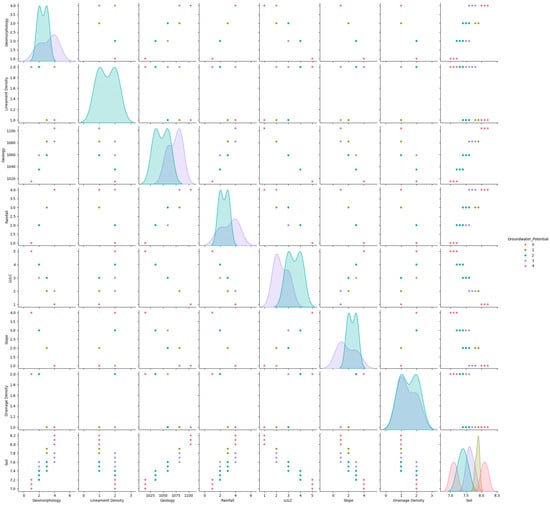
Figure 10.
Pair plots of hydrogeological parameters and groundwater potential classes.
Several studies worldwide have employed similar GIS-based approaches for delineating groundwater potential zones, allowing for meaningful comparisons with the present findings. Ref. [83] applied the Analytical Hierarchy Process (AHP) in the sub-Himalayan foothills of India, identifying geomorphology and drainage density as significant contributors to groundwater potential. In the upper Narmada basin, ref. [84] utilized AHP alongside geospatial techniques, achieving an 80% accuracy rate in delineating potential zones, emphasizing the role of slope and land use/land cover. Similarly, in Bangladesh, ref. [85] integrated eleven thematic layers using AHP within a GIS framework, resulting in a groundwater potential map validated with 84% accuracy through ROC analysis. In Turkey’s Upper Coruh River Basin, ref. [55] employed GIS and multi-criteria decision-making techniques to identify groundwater potential zones, emphasizing the importance of factors such as geology, land use, and slope. In the Al-Qalamoun region of Syria, ref. [86] integrated multi-criteria decision analysis with GIS to map groundwater potential zones, highlighting the relevance of parameters like lineament density and drainage density.
Based on the spatial distribution of groundwater potential zones identified in this study, specific regions with very low to low groundwater potential require urgent management interventions. These areas are experiencing limited recharge and may be more vulnerable to over-extraction and water scarcity. In such zones, measures such as artificial recharge structures (e.g., check dams, percolation ponds), rainwater harvesting, and regulated groundwater extraction should be prioritized to enhance recharge and sustainability. Regions identified with high to excellent potential should be managed to prevent overexploitation, with monitoring programs and policy frameworks in place to ensure long-term availability. Integrating these strategies based on the groundwater potential mapping can support targeted and sustainable water resource planning in the Melur region
5.3.2. Model Accuracy
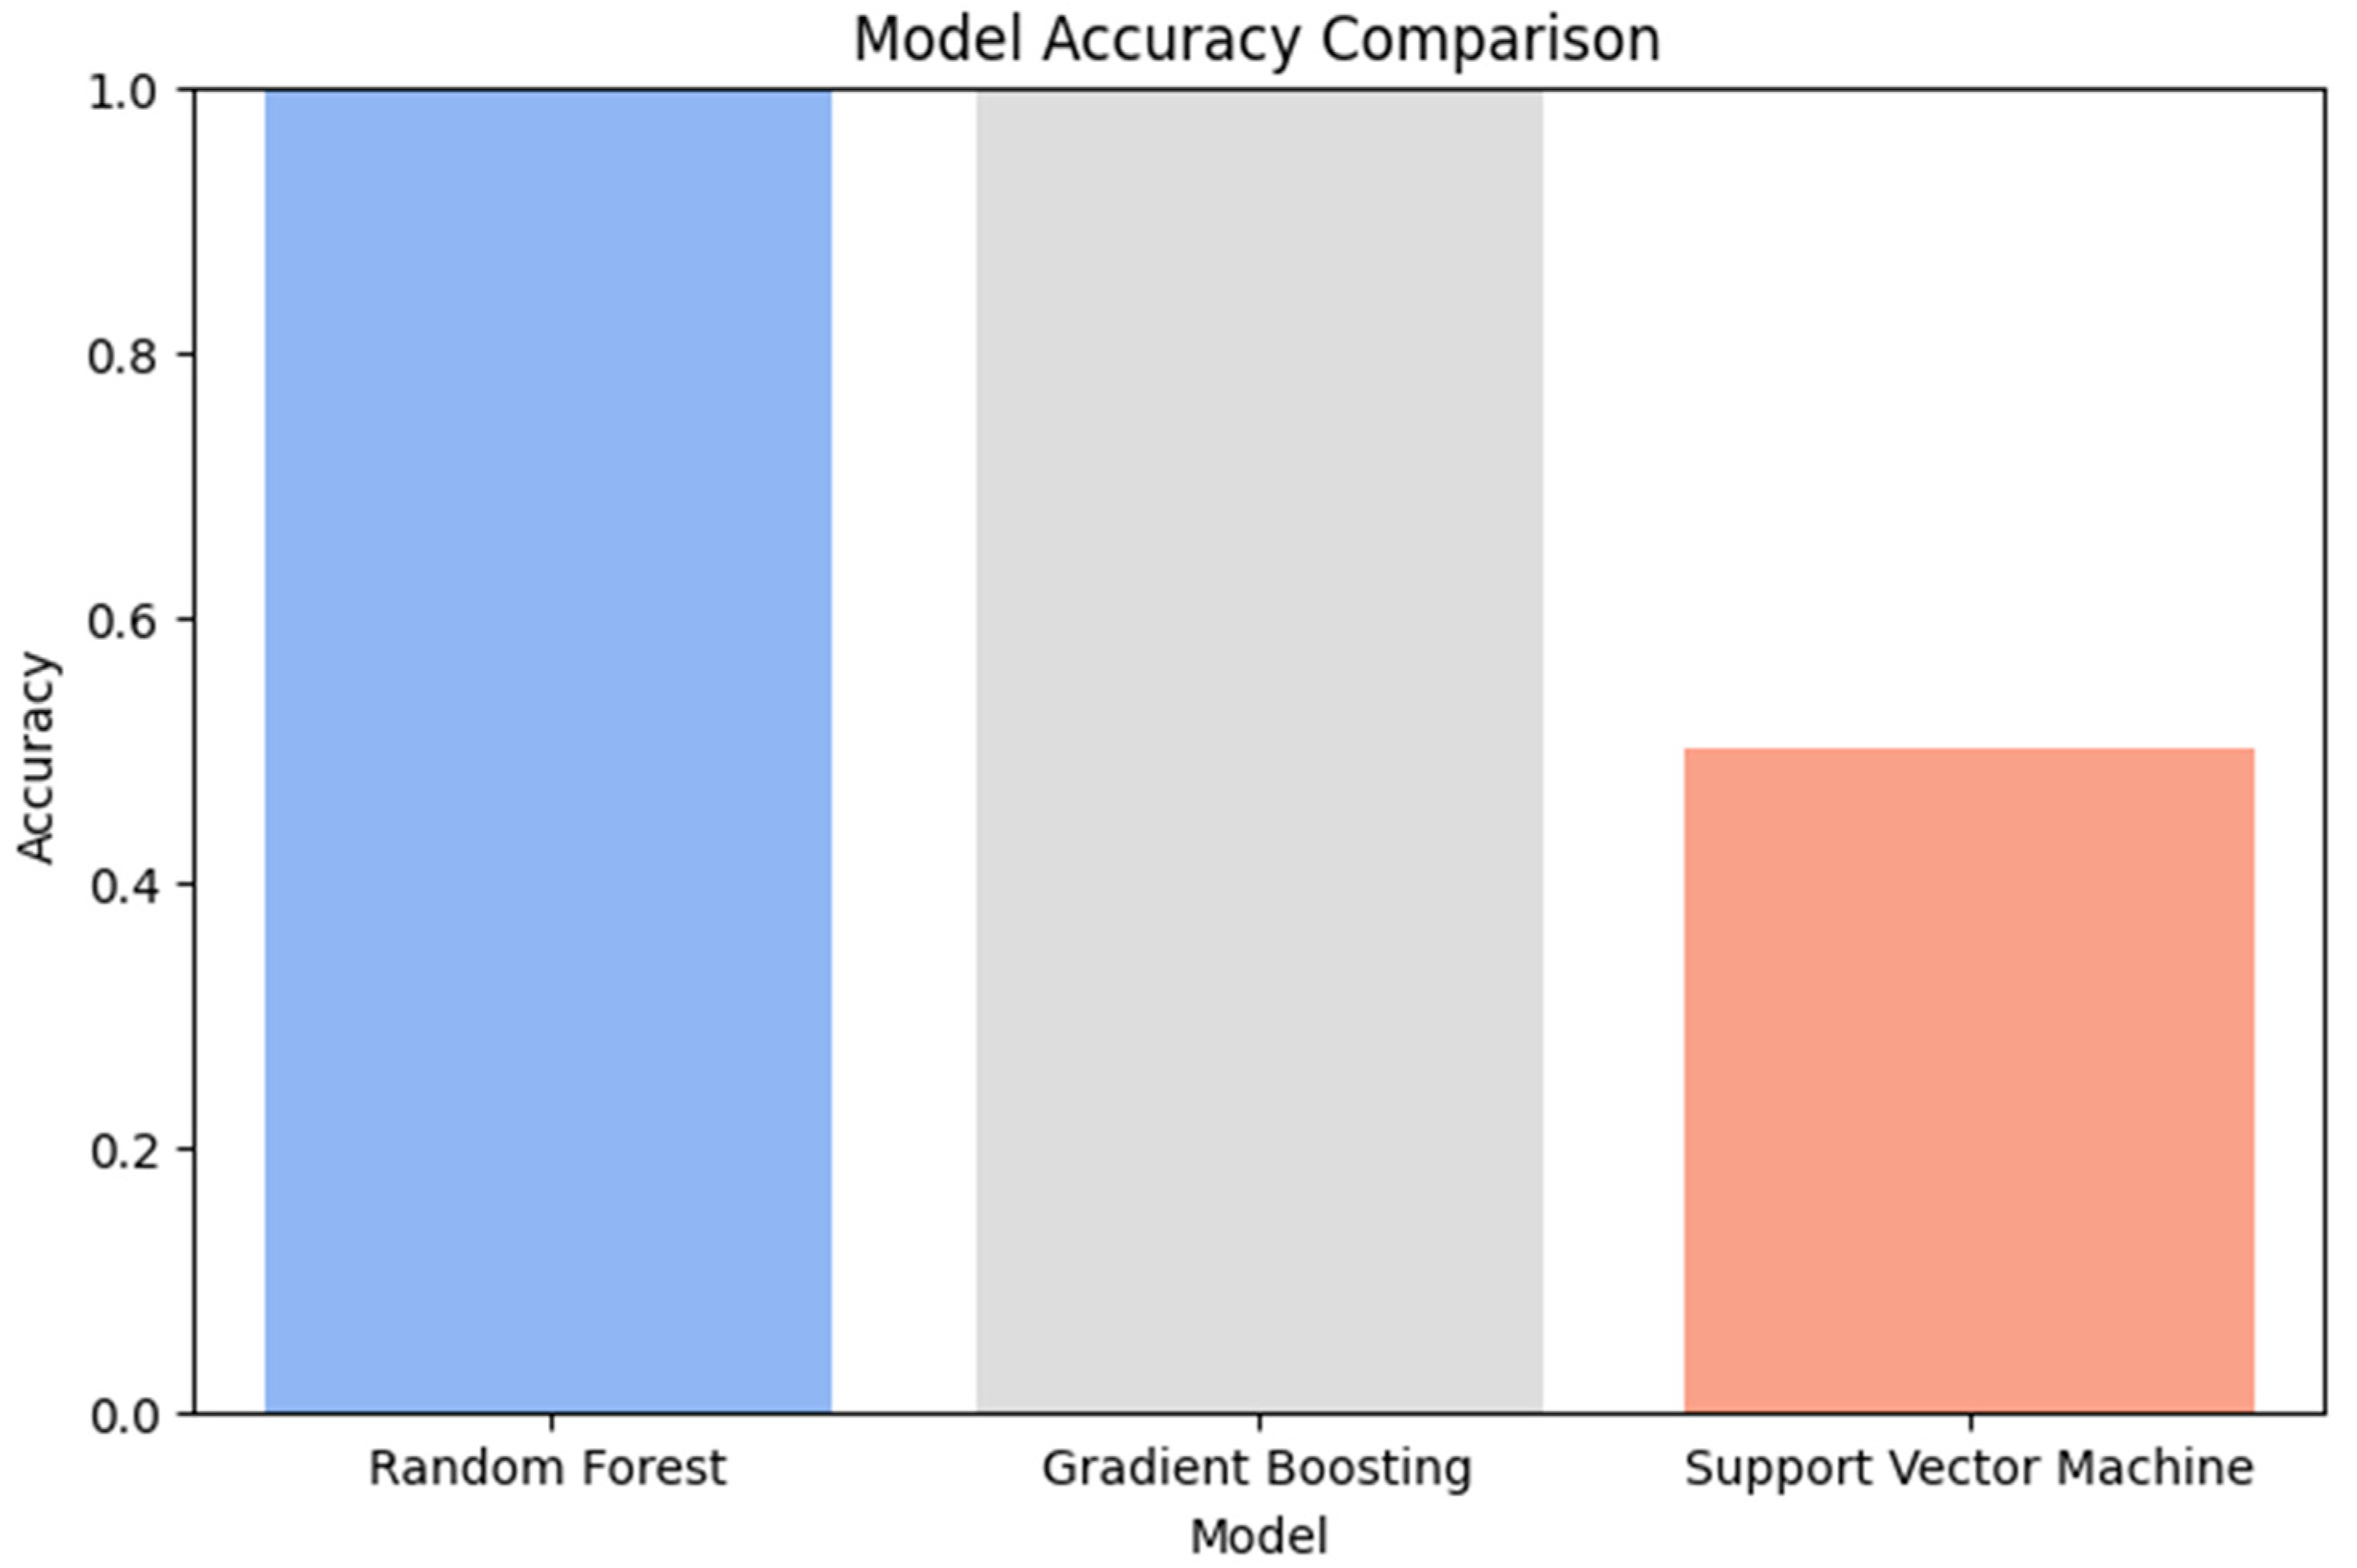
According to the study findings, groundwater potential zones can be effectively classified using ensemble-based algorithms such as Random Forest and Gradient Boosting. Both models were 100% accurate, which made them perfect for practical hydrogeology applications. They are able to capture intricate feature interactions and generalize effectively across various groundwater potential zones, which is responsible for their exceptional performance. However, the Support Vector Machine model only achieved 50% accuracy, indicating poor performance (Figure 11). Class 2 sample misclassification increases the possibility that SVM needs further data conditioning methods, different kernels, or hyperparameter adjustment to perform better. The dataset’s class imbalance also made it more difficult for the model to accurately predict particular categories.

Figure 11.
Comparison of ML model accuracy.
Several suggestions can be made to improve groundwater potential assessment reliability and classification performance. More representative samples in a larger dataset will help improve model generalization and guard against overfitting. Modifying parameters, including gamma, C-value, and kernel type, may enhance SVM’s classification capabilities. Redundancy can be decreased, and model efficiency can be increased by discarding strongly correlated characteristics. To improve model learning and balance class distribution, strategies like the Synthetic Minority Over-sampling Technique (SMOTE) can be used.
5.4. Validation
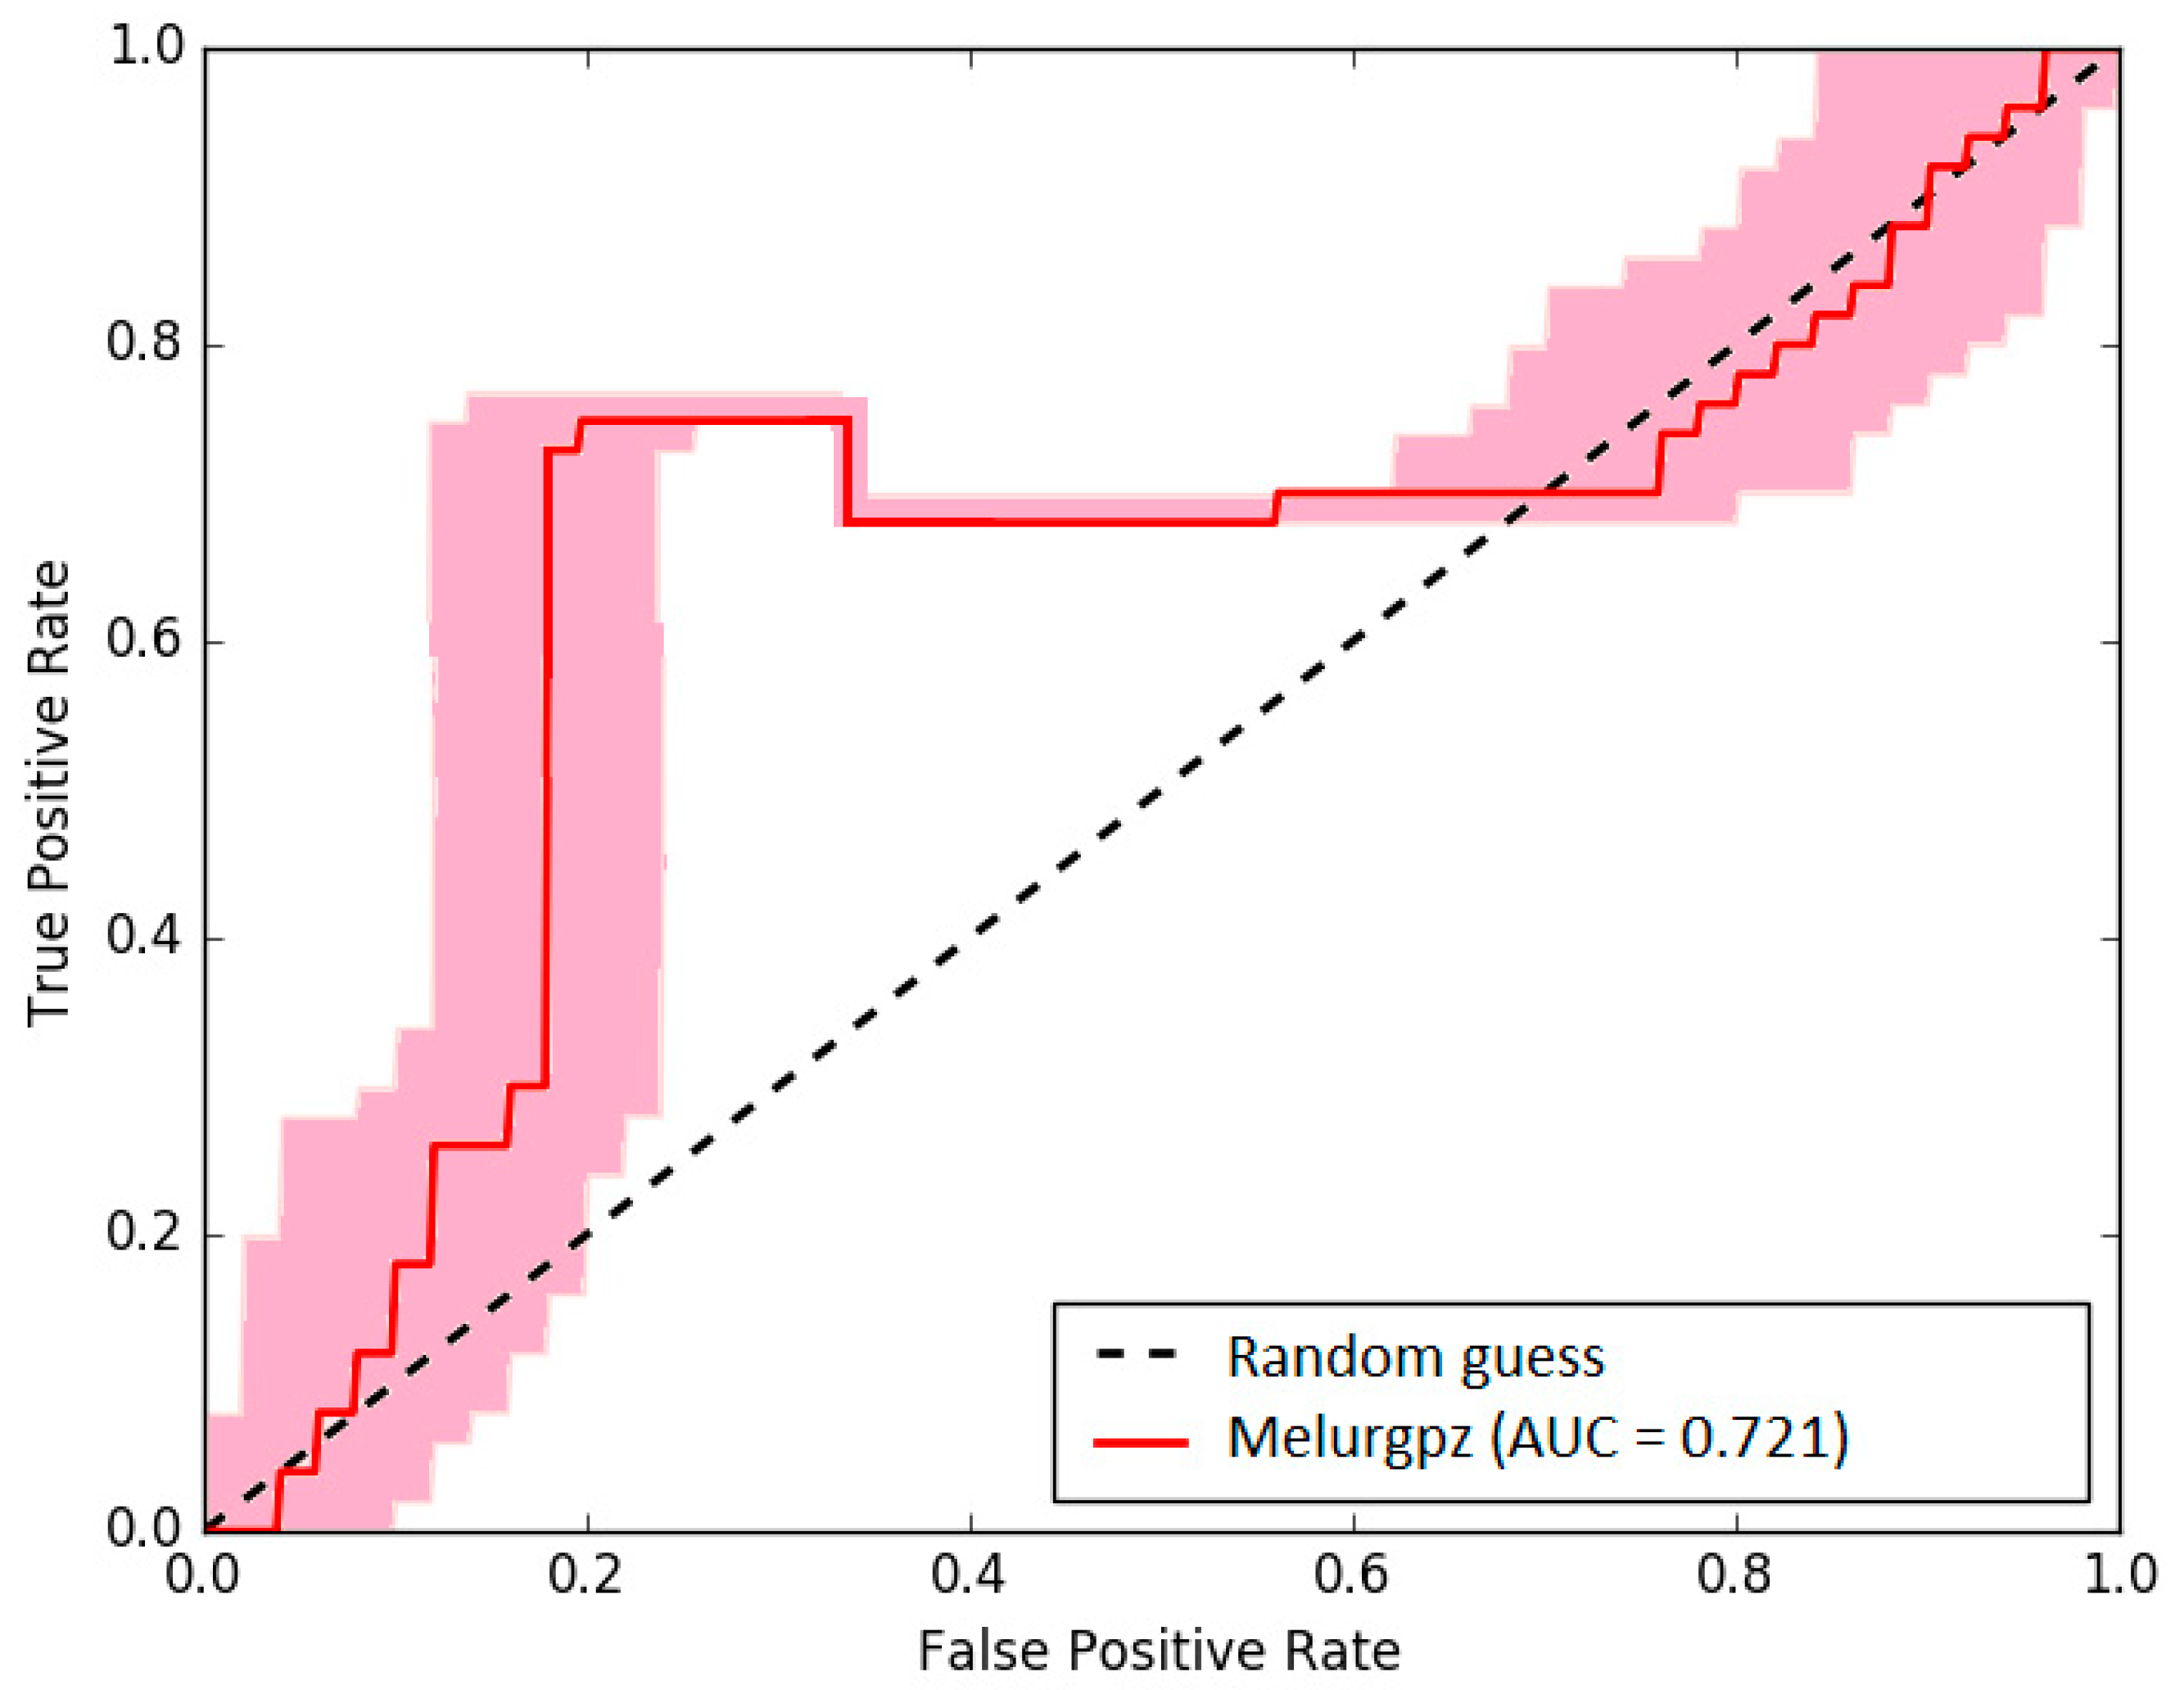
The model performance was assessed by a receiver operating characteristic curve (ROC). This curve uses two parameters, i.e., true positive rate (TPR) and false positive rate (FPR), and a value under 1 indicates more model accuracy (Figure 6). The groundwater data representing a number of wells was considered as the true positive rate, and the plot of TPR vs. FPR in the ArcGIS platform generated an AUC/ROC curve with a value of 7.21 for this AHP model is 7.21. It indicates that the model tested is good and that the predicted map is accurate (Figure 12).
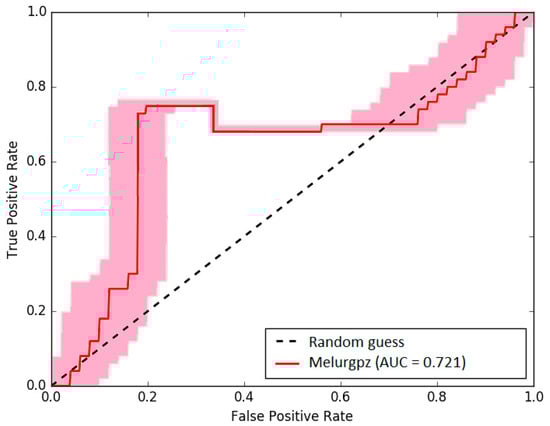
Figure 12.
AUC/ROC curve used to validate the AHP model results in the present study.
Limitations and Future Scope
Although this study offers a comprehensive assessment of groundwater potential using integrated geospatial and machine learning approaches, certain limitations are acknowledged. The analysis was largely based on surface-derived parameters, as detailed subsurface information such as aquifer geometry, hydraulic properties, and groundwater extraction data was not readily available across the entire Melur block. Additionally, temporal aspects like seasonal rainfall variation, land use dynamics, and climate change influences were beyond the current scope. Future research could benefit from incorporating long-term hydrogeological monitoring data, geophysical surveys, and temporal remote sensing inputs to improve model robustness. Furthermore, field validation would strengthen the practical relevance of the findings, particularly for developing localized and sustainable groundwater management strategies.
6. Conclusions
The groundwater potentiality of Melur in Tamil Nadu state of India was evaluated by studying an area of 678 km2 in widely accepted Analytical Hierarchy Processes (AHP) and by using the remote sensing and GIS tools with the data layers consisting of geology, geomorphology, lineament density, land use/land cover, rainfall, soil, slope and drainage density. The weighted layers separated this area into five zones between poor and high groundwater potential. About 55.2% of the study area has very low to low groundwater potential, and only 1.3% of the area has excellent groundwater potential. About 6.6% and 36.5% of the study area has high and moderate groundwater potential, respectively.
The distribution map demarcates the northern region as more appropriate for groundwater extraction in a sustainable way. The southern and central regions are vulnerable to aquifer degradation, and the groundwater prospection here must be restricted with adequate aquifer system rejuvenation or replenishment strategies. By integrating the Groundwater Potential Zones (GWPZ) and Water Quality Index (WQI), the study can effectively identify different zones based on their suitability for extraction and consumption. This study effectively illustrated how machine learning algorithms may be used to categorize groundwater potential zones. With 100% accuracy and accurate predictions, the Random Forest (RF) and Gradient Boosting classifiers performed better than the Support Vector Machine (SVM) model. The most significant variables influencing the classification of groundwater potential were identified using correlation visualization and feature importance analysis. The findings highlight how crucial feature selection, model selection, and data pretreatment are to obtaining high classification accuracy. While ensemble methods such as Random Forest and Gradient Boosting proved to be highly effective, further studies could explore additional machine learning techniques such as XGBoost, Neural Networks, or k-Nearest Neighbors (k-NN) to further enhance predictive capabilities. This study highlights the effectiveness of machine learning in groundwater potential assessment and provides a foundation for future research in hydrogeological modeling and sustainable water resource management. The delineated groundwater potential zones can serve as a scientific basis for local authorities and water resource planners to prioritize areas for sustainable groundwater extraction, recharge zone protection, and infrastructure development. Integrating these insights into land-use planning and agricultural water management policies can enhance water security, especially in water-scarce regions. The lithological and geological conditions are not favorable for efficient groundwater recharge and storage. Therefore, artificial recharging or managed aquifer recharge measures should be vital for sustainable aquifer productivity, congruent with SDG 6.
Supplementary Materials
The following supporting information can be downloaded at: https://www.mdpi.com/article/10.3390/w17081235/s1, Supplementary Table S1: Well Location Details.
Author Contributions
S.S. (Selvam Sekar): Writing—original draft, Conceptualization; Data curation; Formal analysis; Funding acquisition; Methodology, Software, Investigation; S.S. (Subin Surendran): Writing—review and editing, Data curation, and Formal analysis. P.D.R.: Investigation; Writing—review and editing, Data curation, and Formal analysis. F.A.D.: Writing—review and editing, Software, Investigation. A.V.N.: Writing—review and editing, Software, Data curation, and Formal analysis. M.J.: Writing—review and editing, and Formal analysis M.P.: Writing—original draft, Methodology, Software, Investigation. All authors have read and agreed to the published version of the manuscript.
Funding
This research received no external funding.
Data Availability Statement
The original contributions presented in this study are included in the article.
Acknowledgments
The authors acknowledge the help and guidance of Shri A.P.C.V. Chockalingam (Secretary) and C. Veerabahu (Principal), V.O.C College, Tuticorin. We would like to thank the Reviewers for taking the time and effort necessary to review the manuscript. We sincerely appreciate all valuable comments and suggestions, which helped us to improve the quality of the manuscript.
Conflicts of Interest
The authors declare no conflicts of interest.
References
- Zektser, I.S.; Everett, L.G. Groundwater and the Environment: Applications for the Global Community; CRC Press: Boca Raton, FL, USA, 2000. [Google Scholar]
- Margat, J.; Van der Gun, J. Groundwater Around the World: A Geographic Synopsis; CRC Press: Boca Raton, FL, USA, 2013. [Google Scholar]
- Singha, K.; Navarre-Sitchler, A. The importance of groundwater in critical zone science. Groundwater 2022, 60, 27–34. [Google Scholar] [CrossRef] [PubMed]
- Ashraf, B.; AghaKouchak, A.; Alizadeh, A.; Mousavi Baygi, M.; Moftakhari, H.R.; Mirchi, A.; Madani, K. Quantifying anthropogenic stress on groundwater resources. Sci. Rep. 2017, 7, 12910. [Google Scholar] [CrossRef] [PubMed]
- Das, A.; Thoithoi Devi, M.; Babu, S.; Ansari, M.; Layek, J.; Bhowmick, S.N.; Yadav, G.S.; Singh, R. Cereal-legume cropping system in indian himalayan region for food and environmental sustainability. In Legumes for Soil Health and Sustainable Management; Springer: Singapore, 2018; pp. 33–76. [Google Scholar]
- Kordestani, M.D.; Naghibi, S.A.; Hashemi, H.; Ahmadi, K.; Kalantar, B.; Pradhan, B. Groundwater potential mapping using a novel data-mining ensemble model. Hydrogeol. J. 2019, 27, 211–224. [Google Scholar] [CrossRef]
- Narayanamoorthy, A. India’s groundwater irrigation boom: Can it be sustained? Water Policy 2010, 12, 543–563. [Google Scholar] [CrossRef]
- Manasi, S.; Raju, K.V.; Manasi, S.; Raju, K.V. Land Use Changes and Groundwater Overuse. In Coping Mechanisms for Climate Change in Peri-Urban Areas; Springer: Cham, Switzerland, 2020; pp. 29–91. [Google Scholar]
- Gandhi, V.P.; Namboodiri, N.V. Groundwater Irrigation in India: Gains, Costs, and Risks; Indian Institute of Management: Ahmedabad, India, 2009. [Google Scholar]
- Roy, A.D.; Shah, T. The Socio-Ecology of Groundwater in India; International Water Management Institute: Colombo, Sri Lanka, 2002. [Google Scholar]
- Dangar, S.; Asoka, A.; Mishra, V. Causes and implications of groundwater depletion in India: A review. J. Hydrol. 2021, 596, 126103. [Google Scholar] [CrossRef]
- Dar, F.A.; Ramanathan, A.L.; Mir, R.A.; Pir, R.A. Groundwater scenario under climate change and anthropogenic stress in Ladakh Himalaya, India. J. Water Clim. Change 2024, 15, 1459–1489. [Google Scholar] [CrossRef]
- Gupta, S.K.; Deshpande, R.D. Water for India in 2050: First-order assessment of available options. Curr. Sci. 2004, 86, 1216–1224. [Google Scholar]
- Goyal, S.K. Vulnerability and sustainability of groundwater resource in India. Energy 2013, 2, 15. [Google Scholar]
- Kumari, S. Emerging groundwater crisis in India and its solution. Int. J. Res. Soc. Sci. Humanit. 2022, 12, 1–13. [Google Scholar]
- Chinnasamy, P.; Agoramoorthy, G. Groundwater storage and depletion trends in Tamil Nadu State, India. Water Resour. Manag. 2015, 29, 2139–2152. [Google Scholar] [CrossRef]
- Anbazhagan, S.; Jothibasu, A. Geoinformatics in groundwater potential mapping and sustainable development: A case study from southern India. Hydrol. Sci. J. 2016, 61, 1109–1123. [Google Scholar] [CrossRef]
- Chinnadurai, M. Situation Analysis of Water Resources in Tamil Nadu. Int. J. Agric. Sci. 2018, 10, 7163–7167. [Google Scholar]
- CGWB—Central Ground Water Board. National Compilation on Dynamic Ground Water Resources of India, 2022; Central Ground Water Board, Department of Water Resources, River Development & Ganga Rejuvenation, Ministry of Jal Shakti Government of India: Faridabad, India, 2022. [Google Scholar]
- Suhag, R. Overview of Ground Water in India. PRS on Standing Committee on Water Resources, Legislative Research, (February). 2016. 12p. Available online: https://prsindia.org/files/policy/policy_analytical_reports/1455682937--Overview%20of%20Ground%20Water%20in%20India_0.pdf (accessed on 15 March 2024).
- Kath, J.; Dyer, F.J. Why groundwater matters: An introduction for policy-makers and managers. Policy Stud. 2017, 38, 447–461. [Google Scholar] [CrossRef]
- Mehta, M. Status of groundwater and policy issues for its sustainable development in India. Groundw. Res. Manag. Integr. Sci. Manag. Decis. 2006, 62–74. [Google Scholar]
- Kulkarni, H.; Shah, M.; Shankar, P.V. Shaping the contours of groundwater governance in India. J. Hydrol. Reg. Stud. 2015, 4, 172–192. [Google Scholar] [CrossRef]
- Mallick, J.; Singh, C.K.; Al-Wadi, H.; Ahmed, M.; Rahman, A.; Shashtri, S.; Mukherjee, S. Geospatial and geostatistical approach for groundwater potential zone delineation. Hydrol. Process. 2015, 29, 395–418. [Google Scholar] [CrossRef]
- Ajay, K.V.; Mondal, N.C.; Ahmed, S. Identification of groundwater potential zones using RS, GIS and AHP techniques: A case study in a part of Deccan volcanic province (DVP), Maharashtra, India. J. Indian. Soc. Remote Sens. 2020, 48, 497–511. [Google Scholar] [CrossRef]
- Aliabad, F.A.; Shojaei, S.; Zare, M.; Ekhtesasi, M.R. Assessment of the fuzzy ARTMAP neural network method performance in geological mapping using satellite images and Boolean logic. Int. J. Environ. Sci. Technol. 2018, 16, 3829–3838. [Google Scholar] [CrossRef]
- Igwe, O.; Ifediegwu, S.I.; Onwuka, O.S. Determining the occurrence of potential groundwater zones using integrated hydrogeomorphic parameters, GIS and remote sensing in Enugu State, Southeastern. Niger. Sust. Wat Resour. Manag. 2020, 6, 39. [Google Scholar] [CrossRef]
- Agarwal, E.; Agarwal, R.; Garg, R.D.; Garg, P.K. Delineation of groundwater potential zone: An AHP/ANPapproach. J. Earth Syst. Sci. 2013, 122, 887–898. [Google Scholar] [CrossRef]
- Rahmati, O.; Nazari Samani, A.; Mahdavi, M.; Pourghasemi, H.R.; Zeinivand, H. Groundwater potential mapping at Kurdistan region of Iran using analytic hierarchy process and GIS. Arab. J. Geosci. 2015, 8, 7059–7071. [Google Scholar] [CrossRef]
- Arulbalaji, P.; Padmalal, D.; Sreelash, K. GIS and AHP techniques based delineation of groundwater potential zones: A case study from southern Western Ghats, India. Sci. Rep. 2019, 9, 2082. [Google Scholar] [CrossRef] [PubMed]
- Ahmadi, H.; Kaya, O.A.; Babadagi, E.; Savas, T.; Pekkan, E. GIS-based groundwater potentiality mapping using AHP and FR models in central antalya, Turkey. Environ. Sci. Proc. 2020, 5, 11. [Google Scholar] [CrossRef]
- Uc Castillo, J.L.; Martínez Cruz, D.A.; Ramos Leal, J.A.; Tuxpan Vargas, J.; Rodríguez Tapia, S.A.; Marín Celestino, A.E. Delineation of groundwater potential zones (GWPZs) in a semi-arid basin through remote sensing, GIS, and AHP approaches. Water 2022, 14, 2138. [Google Scholar] [CrossRef]
- Selvam, S.; Jesuraja, K.; Senapathi, V.; Roy, P.D.; Chung, S.Y.; Gnanachandrasamy, G.; Muthukumar, P. GIS-based evaluation of groundwater quality and seawater intrusion assessment in a Coastal Region of Tiruchendur Taluk, Southern Tamil Nadu, India. In Groundwater Contamination in Coastal Aquifers; Elsevier: Amsterdam, The Netherlands, 2022; pp. 155–168. [Google Scholar]
- Selvam, S.; Nath, A.V.; Roy, P.D.; Chung, S.Y.; Elzain, H.E.; Carvalho, P.C.; Perumal, M. Identification of groundwater potential zones of Alappuzha (Kerala) in South India integrating AHP and GIS. Environ. Dev. Sustain. 2024, 1–23. [Google Scholar] [CrossRef]
- Bekri, S.; Hoskan, N. Investigation of Groundwater Potential within the Coastal and the Orontes Basins in Syria by Using Remote Sensing, Analytical Hierarchy Processes (AHP) and Geographic Information Systems (GIS). Preprint, 2023. [Google Scholar] [CrossRef]
- Omeka, M.E.; Igwe, O.; Onwuka, O.S.; Nwodo, O.M.; Ugar, S.I.; Undiandeye, P.A.; Anyanwu, I.E. Efficacy of GIS-based AHP and data-driven intelligent machine learning algorithms for irrigation water quality prediction in an agricultural-mine district within the Lower Benue Trough, Nigeria. Environ. Sci. Pollut. Res. 2023, 31, 54204–54233. [Google Scholar] [CrossRef]
- Vellaikannu, A.; Palaniraj, U.; Karthikeyan, S.; Senapathi, V.; Viswanathan, P.M.; Sekar, S. Identification of groundwater potential zones using geospatial approach in Sivagangai district, South India. Arab. J. Geosci. 2021, 14, 8. [Google Scholar] [CrossRef]
- Sathiyamoorthy, M.; Masilamani, U.S.; Chadee, A.A.; Golla, S.D.; Aldagheiri, M.; Sihag, P.; Rathnayake, U.; Patidar, J.; Shukla, S.; Singh, A.K.; et al. Sustainability of Groundwater Potential Zones in Coastal Areas of Cuddalore District, Tamil Nadu, South India Using Integrated Approach of Remote Sensing, GIS and AHP Techniques. Sustainability 2023, 15, 5339. [Google Scholar] [CrossRef]
- Kumar, M.; Singh, S.K.; Kundu, A.; Tyagi, K.; Menon, J.; Frederick, A.; Raj, A.; Lal, D. GIS-based multi-criteria approach to delineate groundwater prospect zone and its sensitivity analysis. Appl. Water Sci. 2022, 12, 71. [Google Scholar] [CrossRef]
- Kaliraj, S.; Chandrasekar, N.; Magesh, N.S. Evaluation of multiple environmental factors for site-specific groundwater recharge structures in the Vaigai River upper basin, Tamil Nadu, India, using GIS-based weighted overlay analysis. Environ. Earth Sci. 2015, 74, 4355–4380. [Google Scholar] [CrossRef]
- Moharir, K.N.; Pande, C.B.; Gautam, V.K.; Singh, S.K.; Rane, N.L. Integration of hydrogeological data, GIS and AHP techniques applied to delineate groundwater potential zones in sandstone, limestone and shales rocks of the Damoh district,(MP) central India. Environ. Res. 2023, 228, 115832. [Google Scholar] [CrossRef] [PubMed]
- Ranganathan, M.; Karuppannan, S.; Murugasen, B.; Brhane, G.K.; Panneerselvam, B. Assessment of groundwater prospective zone in Adigrat Town and its surrounding area using geospatial technology. In Climate Change Impact on Groundwater Resources: Human Health Risk Assessment in Arid and Semi-Arid Regions; Springer International Publishing: Cham, Switzerland, 2022; pp. 387–405. [Google Scholar]
- Al-Abadi, A.M.; Fryar, A.E.; Rasheed, A.A.; Pradhan, B. Assessment of groundwater potential in terms of the availability and quality of the resource: A case study from Iraq. Environ. Earth Sci. 2021, 80, 426. [Google Scholar] [CrossRef]
- Naghibi, S.A.; Pourghasemi, H.R. A comparative assessment between three machine learning models and their performance comparison by bivariate and multivariate statistical methods in groundwater potential mapping. Water Resour. Manag. 2015, 29, 5217–5236. [Google Scholar] [CrossRef]
- Lee, J.H.; Shin, J.; Realff, M.J. Machine learning: Overview of the recent progresses and implications for the process systems engineering field. Comput. Chem. Eng. 2018, 114, 111–121. [Google Scholar] [CrossRef]
- Kumar, P.; Singh, P.; Asthana, H.; Yadav, B.; Mukherjee, S. Groundwater potential zone mapping of middle Andaman using multi-criteria decision-making and support vector machine. Groundw. Sustain. Dev. 2024, 26, 101191. [Google Scholar] [CrossRef]
- Chen, P.; Ma, X.; Ma, J.; Zeng, H.; Huang, Q.; Wang, Y.; Zhou, Y.; Zhang, L. Discrepancy and estimates of groundwater recharge under different land use types on the Loess Plateau. J. Hydrol. Reg. Stud. 2024, 53, 101793. [Google Scholar] [CrossRef]
- Sarkar, S.K.; Rudra, R.R.; Talukdar, S.; Das, P.C.; Nur, M.S.; Alam, E.; Islam, M.K.; Islam, A.R.M.T. Future groundwater potential mapping using machine learning algorithms and climate change scenarios in Bangladesh. Sci. Rep. 2024, 14, 10328. [Google Scholar] [CrossRef]
- Rasool, U.; Yin, X.; Xu, Z.; Rasool, M.A.; Senapathi, V.; Hussain, M.; Siddique, J.; Trabucco, J.C. Mapping of groundwater productivity potential with machine learning algorithms: A case study in the provincial capital of Baluchistan, Pakistan. Chemosphere 2022, 303, 135265. [Google Scholar] [CrossRef]
- Trabelsi, F.; Bel Hadj Ali, S.; Lee, S. Comparison of novel hybrid and benchmark machine learning algorithms to predict groundwater potentiality: Case of a drought-prone region of Medjerda Basin, northern Tunisia. Remote Sens. 2022, 15, 152. [Google Scholar] [CrossRef]
- Touré, H.; Boateng, C.D.; Gidigasu, S.S.; Wemegah, D.D.; Mensah, V.; Aryee, J.N.; Osei, M.A.; Gilbert, J.; Afful, S.K. Review of machine learning algorithms used in groundwater availability studies in Africa: Analysis of geological and climate input variables. Discov. Water 2024, 4, 109. [Google Scholar] [CrossRef]
- Ganesan, S.; Subramaniyan, A. Identification of groundwater potential zones using multi-influencing factor method, GIS and remote sensing techniques in the hard rock terrain of Madurai district, southern India. Sustain. Water Resour. Manag. 2024, 10, 54. [Google Scholar] [CrossRef]
- Rajaveni, S.P.; Muniappan, N. Assessment of Groundwater Potential Using an Integrated Approach of GIS, Fuzzy AHP, and Remote Sensing: A Case Study of Madurai City in India. In Geo-Environmental Hazards Using AI-Enabled Geospatial Techniques and Earth Observation Systems. Advances in Geographic Information Science; Choudhury, T., Koley, B., Nath, A., Um, J.S., Patidar, A.K., Eds.; Springer: Cham, Switzerland, 2024. [Google Scholar] [CrossRef]
- Gleeson, T.; Alley, W.M.; Allen, D.M.; Sophocleous, M.A.; Zhou, Y.; Taniguchi, M.; VanderSteen, J. Towards sustainable groundwater use: Setting long-term goals, backcasting, and managing adaptively. Groundwater 2012, 50, 19–26. [Google Scholar] [CrossRef] [PubMed]
- Yıldırım, Ü. Identifcation of groundwater potential zones using GIS and multi-criteria decision-making techniques: A case study upper Coruh River basin (NE Turkey). ISPRS Int. J. Geo-Inf. 2021, 10, 396. [Google Scholar] [CrossRef]
- Hamdani, N.; Baali, A. Characterization of groundwater potential zone using analytic hierarchy processes and integrated geomatic techniques in Central middle Atlas (Moroco). Appl. Geomat. 2020, 12, 323–335. [Google Scholar] [CrossRef]
- Lentswe, G.B.; Molwalefhe, L. Delineation of potential groundwater recharge zones using analytic hierarchy process-guided GIS in the semi-arid Motloutse watershed, eastern Botswana. J. Hydrol. Reg. Stud. 2020, 28, 100674. [Google Scholar] [CrossRef]
- Shao, Z.; Huq, M.E.; Cai, B.; Altan, O.; Li, Y. Integrated remote sensing and GIS approach using fuzzy-AHP to delineate and identify groundwater potential zones in semi-arid Shanxi Province. Environ. Model. Softw. 2020, 134, 104868. [Google Scholar] [CrossRef]
- Shi, Y.; Li, L.; Zhang, L. Application and comparing of IDW and Kriging interpolation in spatial rainfall information. In Geoinformatics 2007: Geospatial Information Science; SPIE: Bellingham, WA, USA, 2007; Volume 6753, pp. 539–550. [Google Scholar]
- American Public Health Association (APHA). Standard Methods for the Examination of Water and Wastewater, 21th ed.; American Public Health Association (APHA): Washington, DC, USA, 2005. [Google Scholar]
- Kamaraj, J.; Sekar, S.; Roy, P.D.; Senapathi, V.; Chung, S.Y.; Perumal, M.; Nath, A.V. Groundwater pollution index (GPI) and GIS-based appraisal of groundwater quality for drinking and irrigation in coastal aquifers of Tiruchendur, South India. Environ. Sci. Pollut. Res. 2021, 28, 29056–29074. [Google Scholar] [CrossRef]
- Saaty, T.L. Decision Making for Leaders: The Analytic Hierarchy Process for Decisions in a Complex World; RWS Publications: Maidenhead, UK, 1990. [Google Scholar]
- Chatterjee, S.; Dutta, S. Assessment of groundwater potential zone for sustainable water resource management in south-western part of Birbhum District, West Bengal. Appl. Water Sci. 2022, 12, 40. [Google Scholar] [CrossRef]
- Selvam, S.; Nath, A.V.; Roy, P.D.; Jesuraja, K.; Muthukumar, P. Evaluation of groundwater for nitrate and fluoride in Alappuzha region from the southwestern coast of India and associated health risks. Environ. Res. 2023, 236, 116791. [Google Scholar] [CrossRef]
- Jesuraja, K.; Selvam, S.; Murugan, R. GIS-based assessment of groundwater quality index (DWQI and AWQI) in Tiruchendur Coastal City, Southern Tamil Nadu, India. Environ. Earth Sci. 2021, 80, 1–17. [Google Scholar] [CrossRef]
- Selvam, S.; Jesuraja, K.; Roy, P.D.; Venkatramanan, S.; Chung, S.Y.; Elzain, H.E.; Muthukumar, P.; Nath, A.V.; Karthik, R. Assessment of groundwater from an industrial coastal area of south India for human health risk from consumption and irrigation suitability. Environ. Res. 2021, 200, 111461. [Google Scholar] [CrossRef] [PubMed]
- Selvam, S.; Manimaran, G.; Sivasubramanian, P.; Balasubramanian, N.; Seshunarayana, T.J.E.E.S. GIS-based evaluation of water quality index of groundwater resources around Tuticorin coastal city, South India. Environ. Earth Sci. 2014, 71, 2847–2867. [Google Scholar] [CrossRef]
- Bai, Z.; Liu, Q.; Liu, Y. Groundwater potential mapping in hubei region of china using machine learning, ensemble learning, deep learning and automl methods. Nat. Resour. Res. 2022, 31, 2549–2569. [Google Scholar] [CrossRef]
- Tian, Y.; Shi, Y.; Liu, X. Recent advances on support vector machines research. Technol. Econ. Dev. Econ. 2012, 18, 5–33. [Google Scholar] [CrossRef]
- Atlas, S. Soil Survey and Land Use Organization; Department of Agriculture: Chennai, India, 1998. [Google Scholar]
- Dwivedi, C.S. Hydro-Geomorphicstudy of Sagar Lake Catchment Area Using Remote Sensing Technique. Master’s Thesis, University of Sagar, Sagar, India, 2007, unpublished. [Google Scholar]
- Badapalli, P.K.; Kottala, R.B.; Pujari, P.S. Aeolian Desertification. In Advances in Geographical and Environmental Sciences (AGES); Springer: Berlin/Heidelberg, Germany, 2023. [Google Scholar]
- Sander, P. Lineaments in groundwater exploration: A review of applications and limitations. Hydrogeol. J. 2007, 15, 71–74. [Google Scholar] [CrossRef]
- Ishola, K.S.; Fatoyinbo, A.A.; Hamid-Mosaku, A.I.; Okolie, C.J.; Daramola, O.E.; Lawal, T.O. Groundwater potential mapping in hard rock terrain using remote sensing, geospatial and aeromagnetic data. Geosystems Geoenvironment 2023, 2, 100107. [Google Scholar] [CrossRef]
- Magesh, N.S.; Chandrasekar, N.; Soundranayagam, J.P. Delineation of groundwater potential zones in Theni district, Tamil Nadu, using remote sensing, GIS and MIF techniques. Geosci. Front. 2012, 3, 189–196. [Google Scholar] [CrossRef]
- Bhattacharya, R.K.; Chatterjee, N.D.; Das, K. An integrated GIS approach to analyze the impact of land use change and land cover alteration on ground water potential level: A study in Kangsabati Basin, India. Groundw. Sustain. Dev. 2020, 11, 100399. [Google Scholar] [CrossRef]
- Sun, J.; He, F.; Zhang, Z.; Shao, H.; Pan, Y.; Yang, R.; Zheng, M. Analysis of saline groundwater infiltration into two loam soils. Land. Degrad. Dev. 2018, 29, 3795–3802. [Google Scholar] [CrossRef]
- Nasir, M.; Khan, S.; Zahid, H.; Khan, A. Delineation of groundwater potential zones using GIS and multi influence factor (MIF) techniques: A study of district Swat, Khyber Pakhtunkhwa, Pakistan. Environ. Earth Sci. 2018, 77, 367. [Google Scholar] [CrossRef]
- Doke, A.; Pardeshi, S.D.; Das, S. Drainage morphometry and groundwater potential mapping: Application of geoinformatics with frequency ratio and influencing factor approaches. Environ. Earth Sci. 2020, 79, 393. [Google Scholar] [CrossRef]
- Ifediegwu, S.I. Assessment of groundwater potential zones using GIS and AHP techniques: A case study of the Lafa district, Nasarawa State, Nigeria. Appl. Water Sci. 2022, 12, 10. [Google Scholar] [CrossRef]
- Sajil Kumar, P.J.; Elango, L.; Schneider, M. GIS and AHP Based Groundwater Potential Zones Delineation in Chennai River Basin (CRB), India. Sustainability 2022, 14, 1830. [Google Scholar] [CrossRef]
- Arabameri, A.; Santosh, M.; Moayedi, H.; Tiefenbacher, J.P.; Pal, S.C.; Nalivan, O.A.; Costache, R.; Ahmed, N.; Hoque, M.A.-A.; Chakrabortty, R.; et al. Application of the novel state-of-the-art soft computing techniques for groundwater potential assessment. Arab. J. Geosci. 2022, 15, 929. [Google Scholar] [CrossRef]
- Mitra, R.; Roy, D. Delineation of groundwater potential zones through the integration of remote sensing, geographic information system, and multi-criteria decision-making technique in the sub-Himalayan foothills region, India. Int. J. Energy Water Resour. 2023, 7, 581–601. [Google Scholar] [CrossRef]
- Patel, D.K.; Thakur, T.K.; Thakur, A.; Karuppannan, S.; Swamy, S.L.; Pant, R.R. Groundwater potential zone mapping using AHP and geospatial techniques in the upper Narmada basin, central India. Discov. Sustain. 2024, 5, 355. [Google Scholar] [CrossRef]
- Rahman, M.M.; AlThobiani, F.; Shahid, S.; Virdis, S.G.P.; Kamruzzaman, M.; Rahaman, H.; Momin, M.A.; Hossain, M.B.; Ghandourah, E.I. GIS and remote sensing-based multi-criteria analysis for delineation of groundwater potential zones: A case study for industrial zones in Bangladesh. Sustainability 2022, 14, 6667. [Google Scholar] [CrossRef]
- Alrawi, I.; Chen, J.; Othman, A.A. Groundwater potential zone mapping: Integration of multi-criteria decision analysis (MCDA) and GIS techniques for the Al-Qalamoun region in Syria. ISPRS Int. J. Geo-Inf. 2022, 11, 603. [Google Scholar] [CrossRef]


Disclaimer/Publisher’s Note: The statements, opinions and data contained in all publications are solely those of the individual author(s) and contributor(s) and not of MDPI and/or the editor(s). MDPI and/or the editor(s) disclaim responsibility for any injury to people or property resulting from any ideas, methods, instructions or products referred to in the content. |
© 2025 by the authors. Licensee MDPI, Basel, Switzerland. This article is an open access article distributed under the terms and conditions of the Creative Commons Attribution (CC BY) license (https://creativecommons.org/licenses/by/4.0/).