Article

Simulated Effects of Future Water Availability and Protected Species Habitat in a Perennial Wetland, Santa Barbara County, California

U.S. Geological Survey, California Water Science Center, 6000 J St. Suite 5001, Sacramento, CA 95819, USA
*
Author to whom correspondence should be addressed.
Water 2025, 17(8), 1238; https://doi.org/10.3390/w17081238
Submission received: 12 January 2025 / Revised: 5 April 2025 / Accepted: 7 April 2025 / Published: 21 April 2025

Abstract

:
This study evaluates the potential water availability in Barka Slough and the effects of changing hydrological conditions on the aquatic habitat of five protected species. Barka Slough is a historically perennial wetland at the downstream western end of the San Antonio Creek Valley watershed (SACVW). A previously published hydrologic model of the SACVW for 1948–2018 was extended to include 2019–2021 and then modified to simulate the future years of 2022–2051. Two models simulating the future years of 2022–2051 were constructed, each with different climate inputs: (1) a repeated historical climate and (2) a 2070-centered Drier Extreme Warming climate (2070 DEW). The model with the 2070 DEW climate had warmer temperatures and an increase in average annual precipitation driven by larger, albeit more infrequent, precipitation events than the model with the historical climate. Simulated groundwater pumpage resulted in cumulative groundwater storage depletion and groundwater-level decline in Barka Slough in both future models. The simulations indicate that Barka Slough may transition from a perennial to an ephemeral wetland. Streamflow, stream disconnection, and depth to groundwater are key habitat metrics for federally listed species in Barka Slough. Future seasonal conditions for each metric are more likely to affect federally listed species’ habitats under 2070 DEW climatic conditions. Future seasonal streamflow volume may negatively impact unarmored threespine stickleback (Gasterosteus aculeatus williamsoni) and tidewater goby (Eucyclogobis newberryi) habitats. Future seasonal stream disconnection may negatively impact the unarmored threespine stickleback habitat. Future groundwater-level decline may negatively impact Gambel’s watercress (Nasturtium gambelii) and La Graciosa thistle (Cirsium scariosum var. loncholepis) habitats and could influence the ability to use Barka Slough as a restoration or reintroduction site for these species. Results from this study can be used to inform water management decisions to sustain future groundwater availability in the SACVW.

1. Introduction

Groundwater is the primary source of water supply in the San Antonio Creek Valley watershed (SACVW) in Santa Barbara County, California. Climatic conditions and groundwater withdrawals in the SACVW affect water availability, baseflow in San Antonio Creek [1], and, potentially, the extent and quality of federally listed species’ habitats in the Barka Slough wetland. Hereafter, federally listed protected species are referred to as “protected species”. The future climate of central California may have warmer and drier conditions and more variable precipitation, potentially resulting in an increase in overall water demand [2] from agricultural, military, and municipal entities.
The groundwater basin within the SACVW was designated a “medium priority” groundwater basin by the California Department of Water Resources as part of the Sustainable Groundwater Management Act that was enacted in 2014 (https://water.ca.gov/programs/groundwater-management/sgma-groundwater-management, accessed 11 April 2025). As a result of this designation, stakeholders were required to develop a groundwater sustainability plan with the goal of balancing groundwater withdrawals and recharge in order to prevent further losses of groundwater storage. In cooperation with the Santa Barbara County Water Agency, this study simulates future water availability in the SACVW and evaluates the associated effects of climate on the riparian and aquatic habitats in Barka Slough, which hosts federally listed endangered species.
The SACVW is a coastal valley in Santa Barbara County about 240 km (km) west-northwest of Los Angeles (Figure 1). The valley is about 50 km long and 10 km wide, encompasses an area of about 350 square kilometers (km2), and parallels San Antonio Creek. San Antonio Creek provides the main surface drainage for the SACVW, flowing generally from east to west into the Pacific Ocean. The valley is bounded on all sides by uplifted hills comprising consolidated sedimentary rocks. An important feature of the SACVW is Barka Slough, a 2.7 km2 historically perennial wetland located about 8 km east of the Pacific Ocean in the western part of the valley. The slough exists because of groundwater upwelling at the western part of the SACVW, where uplifted consolidated bedrock forms a barrier to the seaward flow of groundwater [1,3,4] (see Figure 2).
Barka Slough provides an important habitat for five aquatic and riparian species that are listed in the U.S. Endangered Species Act, and whose habitat may be heavily impacted by reductions in streamflow and declines in groundwater levels. These species are the following: (1) the tidewater goby (Eucyclogobis newberryi) [6], (2) unarmored threespine stickleback (Gasterosteus aculeatus williamsoni) [7,8], (3) California red-legged frog (Rana draytonii) [9,10], (4) Gambel’s watercress (Nasturtium gambelii) [11,12], and (5) La Graciosa thistle (Cirsium scariosum var. loncholepis) [13,14]. Background information on each of these species, as well as descriptions of how each species may be impacted by changes to different hydrologic-based habitat metrics, can be found in Appendix A.
The tidewater goby, unarmored threespine stickleback, and California red-legged frog are currently found in or near Barka Slough. Gambel’s watercress and La Graciosa thistle are not currently found in Barka Slough but are included in this study to better understand how changes to hydrology could impact the suitability of Barka Slough as a site for potential restoration or reintroduction efforts for these two species.
Land and groundwater use has changed throughout the history of the SACVW [1]. Historically, the upland parts of the valley have been used for dry farming or pastureland, and the flatlands along the streams for irrigated farming. Since the 1980s, however, large sections of formerly non-irrigated pastureland in the uplands have been converted to irrigated vineyards [15,16]. Demand for groundwater in the predominantly rural SACVW has doubled since the late 1970s because of the establishment of irrigated vineyards on formerly non-irrigated pastureland [1] (Figure 1).
Groundwater is the primary source of water for agricultural, military, municipal, and domestic uses [1,17,18]. Estimated annual groundwater withdrawals for agriculture, military, and municipal use in the SACVW have increased 10-fold from 3.7 million cubic meters per year (Mm3/yr) in water year 1948 to 40.2 Mm3/yr in water year 2018. Agricultural use is the dominant use of groundwater (greater than 90 percent, on average) in the SACVW [1]. Estimated annual groundwater recharge has historically ranged from about 6.2 Mm3/yr to more than 37.0 Mm3/yr [1,4]. Observed groundwater-level declines of more than 38 m (m) in parts of the valley and declines in San Antonio Creek baseflow [1,18] support the interpretation that groundwater withdrawals have largely exceeded recharge to the aquifer system.
The recently completed San Antonio Creek integrated model (SACIM) [4] simulated water years 1948–2018 and was developed as a tool for water managers to evaluate historical hydrologic conditions in the SACVW. The SACIM showed that increased pumpage since the mid-1980s was tied to an increased rate of storage depletion and reduced rates of groundwater evapotranspiration and surface leakage (groundwater discharge to the surface and soil zone). The increased pumpage also reduced subsurface inflow to Barka Slough, resulting in a decline in upward flow through the underlying hydrogeologic units and surface leakage.
This study will (1) quantify changes to water availability in the SACVW under two future climate scenarios and (2) qualitatively evaluate potential impacts of the future climate scenarios on protected aquatic taxa in Barka Slough. The SACIM is utilized to simulate the future effects of different climate inputs and provide insight into potential management strategies. Water availability in the SACVW is likely to be impacted by climate change, with the combined effect of land use, groundwater withdrawals, and climate variability having substantial impacts on groundwater-dependent ecosystems (see [19] for a review) such as Barka Slough. Studies evaluating hydrologic model scenarios often focus solely on hydrologic outcomes; here, the scope is expanded to include an evaluation of how hydrologic outcomes affect aquatic habitats. The impacts on aquatic habitats are qualitatively evaluated. Ecological responses to changing hydrologic conditions are complex and require comprehensive research and analysis that is beyond the scope of this study.

2. Materials and Methods

The SACIM [4] utilizes the U.S. Geological Survey (USGS) coupled groundwater and surface water flow model (GSFLOW) [20,21] that simulates historical hydrologic conditions of the SACVW. The SACIM was extended to include water years 2019–2021, for which more recent data were available, and then ran 30 years into the future for water years 2022–2051, using two climate inputs [5]. The first climate input included historical climate data representing conditions from 1990 to 2021; the second climate input included the 2070-centered Drier Extreme Warming (2070 DEW) climate change scenario [22]. Changes in water availability in the SACVW and in Barka Slough were evaluated for each climate input in the future SACIM, with a focus on changes in precipitation and temperature, changes in groundwater budget component volumes and net groundwater storage depletion, and changes to the volume of surface water flow. The effects of simulated changes in water availability were then qualitatively evaluated for the potential to affect riparian and aquatic habitats of federally listed endangered species.

2.1. Extended San Antonio Creek Integrated Model

The extended SACIM included land use, climate data (precipitation and temperature) [23,24,25], streamflow and groundwater-level observation data [26,27], and groundwater pumping data [5]. These data were added to the extended SACIM as input data using standard methods from pyGSFLOW and FloPy [28,29,30,31,32].
Land uses added to the extended SACIM were from 2019 [5,33,34] (Figure 1) and were interpreted in the same manner as in previously published work [1]. In 2019, land use comprised native vegetation (82 percent), agricultural land (15.7 percent), and developed land (2.3 percent). Compared to land use in 2016 [1], the amount of irrigated farmland decreased by about 4.0 km2, and there was an equivalent increase in the area of non-irrigated farmland.

2.2. Future San Antonio Creek Integrated Model

The future SACIM (SACIMF) was run through 2022–2051 using consistent simulation parameters from water year 2021 in the extended SACIM. Groundwater pumping and climate inputs were the exception; these inputs were tailored specifically for future model simulations. Annual agricultural groundwater pumping was simulated based on 2019 land use (Figure 1) and model-specific climate forcings. Annual military groundwater pumping was held at a constant rate of 0.80 Mm3/yr for the future simulation period, which represented the average value of historical military pumping [1,5] (Figure 1). Annual municipal pumping was held at a constant rate of 0.36 Mm3/yr for the future simulation period, which was the maximum annual pumpage amount for the Los Alamos Community Services District between 2019 and 21 [5] (Figure 1).
Precipitation and temperature were used as inputs in the SACIMF and were incorporated into the Precipitation Runoff Modeling System (PRMS) [35] as daily time steps for the SACIMF. Historical climate data from 1990 to 2021 were applied to the SACIMF (hereafter referred to as SACIMF.1). To provide continuous climatic forcings, the historical climate inputs were applied in reverse order—the inputs for 2022 were the same as 2021, and the climate inputs for water year 2051 were the same as for water year 1990. The 2070 DEW change scenario [22] was applied to the SACIMF (hereafter referred to as SACIMF.2). The 2070 DEW represents the drier estimated boundary of the California Department of Water Resources’ future climate models [22].

2.3. Qualitative Evaluation of Barka Slough Aquatic Habitat

Three habitat metrics were identified as important for the protected species of interest: (1) streamflow—the volume of flowing surface water; (2) stream disconnection—if streamflow approaches zero; and (3) depth to groundwater from land surface. Hydrologic budget components from SACIMF.1 and SACIMF.2 were used to represent these habitat metrics. A quantitative analysis of the habitat metrics and the associated effects on specific protected species was beyond the scope of this study; therefore, the relative impacts of future changes on each habitat metric were qualitatively evaluated (Table 1). Background information on each protected species, as well as descriptions of how each species may be impacted by changes to habitat metrics can be found in Appendix A.

3. Results

Results from the SACIMF are presented in this section for (1) water availability in the entire SACVW; (2) water availability in Barka Slough; and (3) the effects on aquatic habitats in Barka Slough.

3.1. Water Availability in the San Antonio Creek Valley Watershed

Changes in precipitation and temperature and groundwater availability for each of the future models (SACIMF.1 and SACIMF.2) are described for the entire SACVW. The evaluation of these changes across the watershed provides insight into the overall dynamics of the hydrologic system and the relative effects of the two climate inputs on water availability.

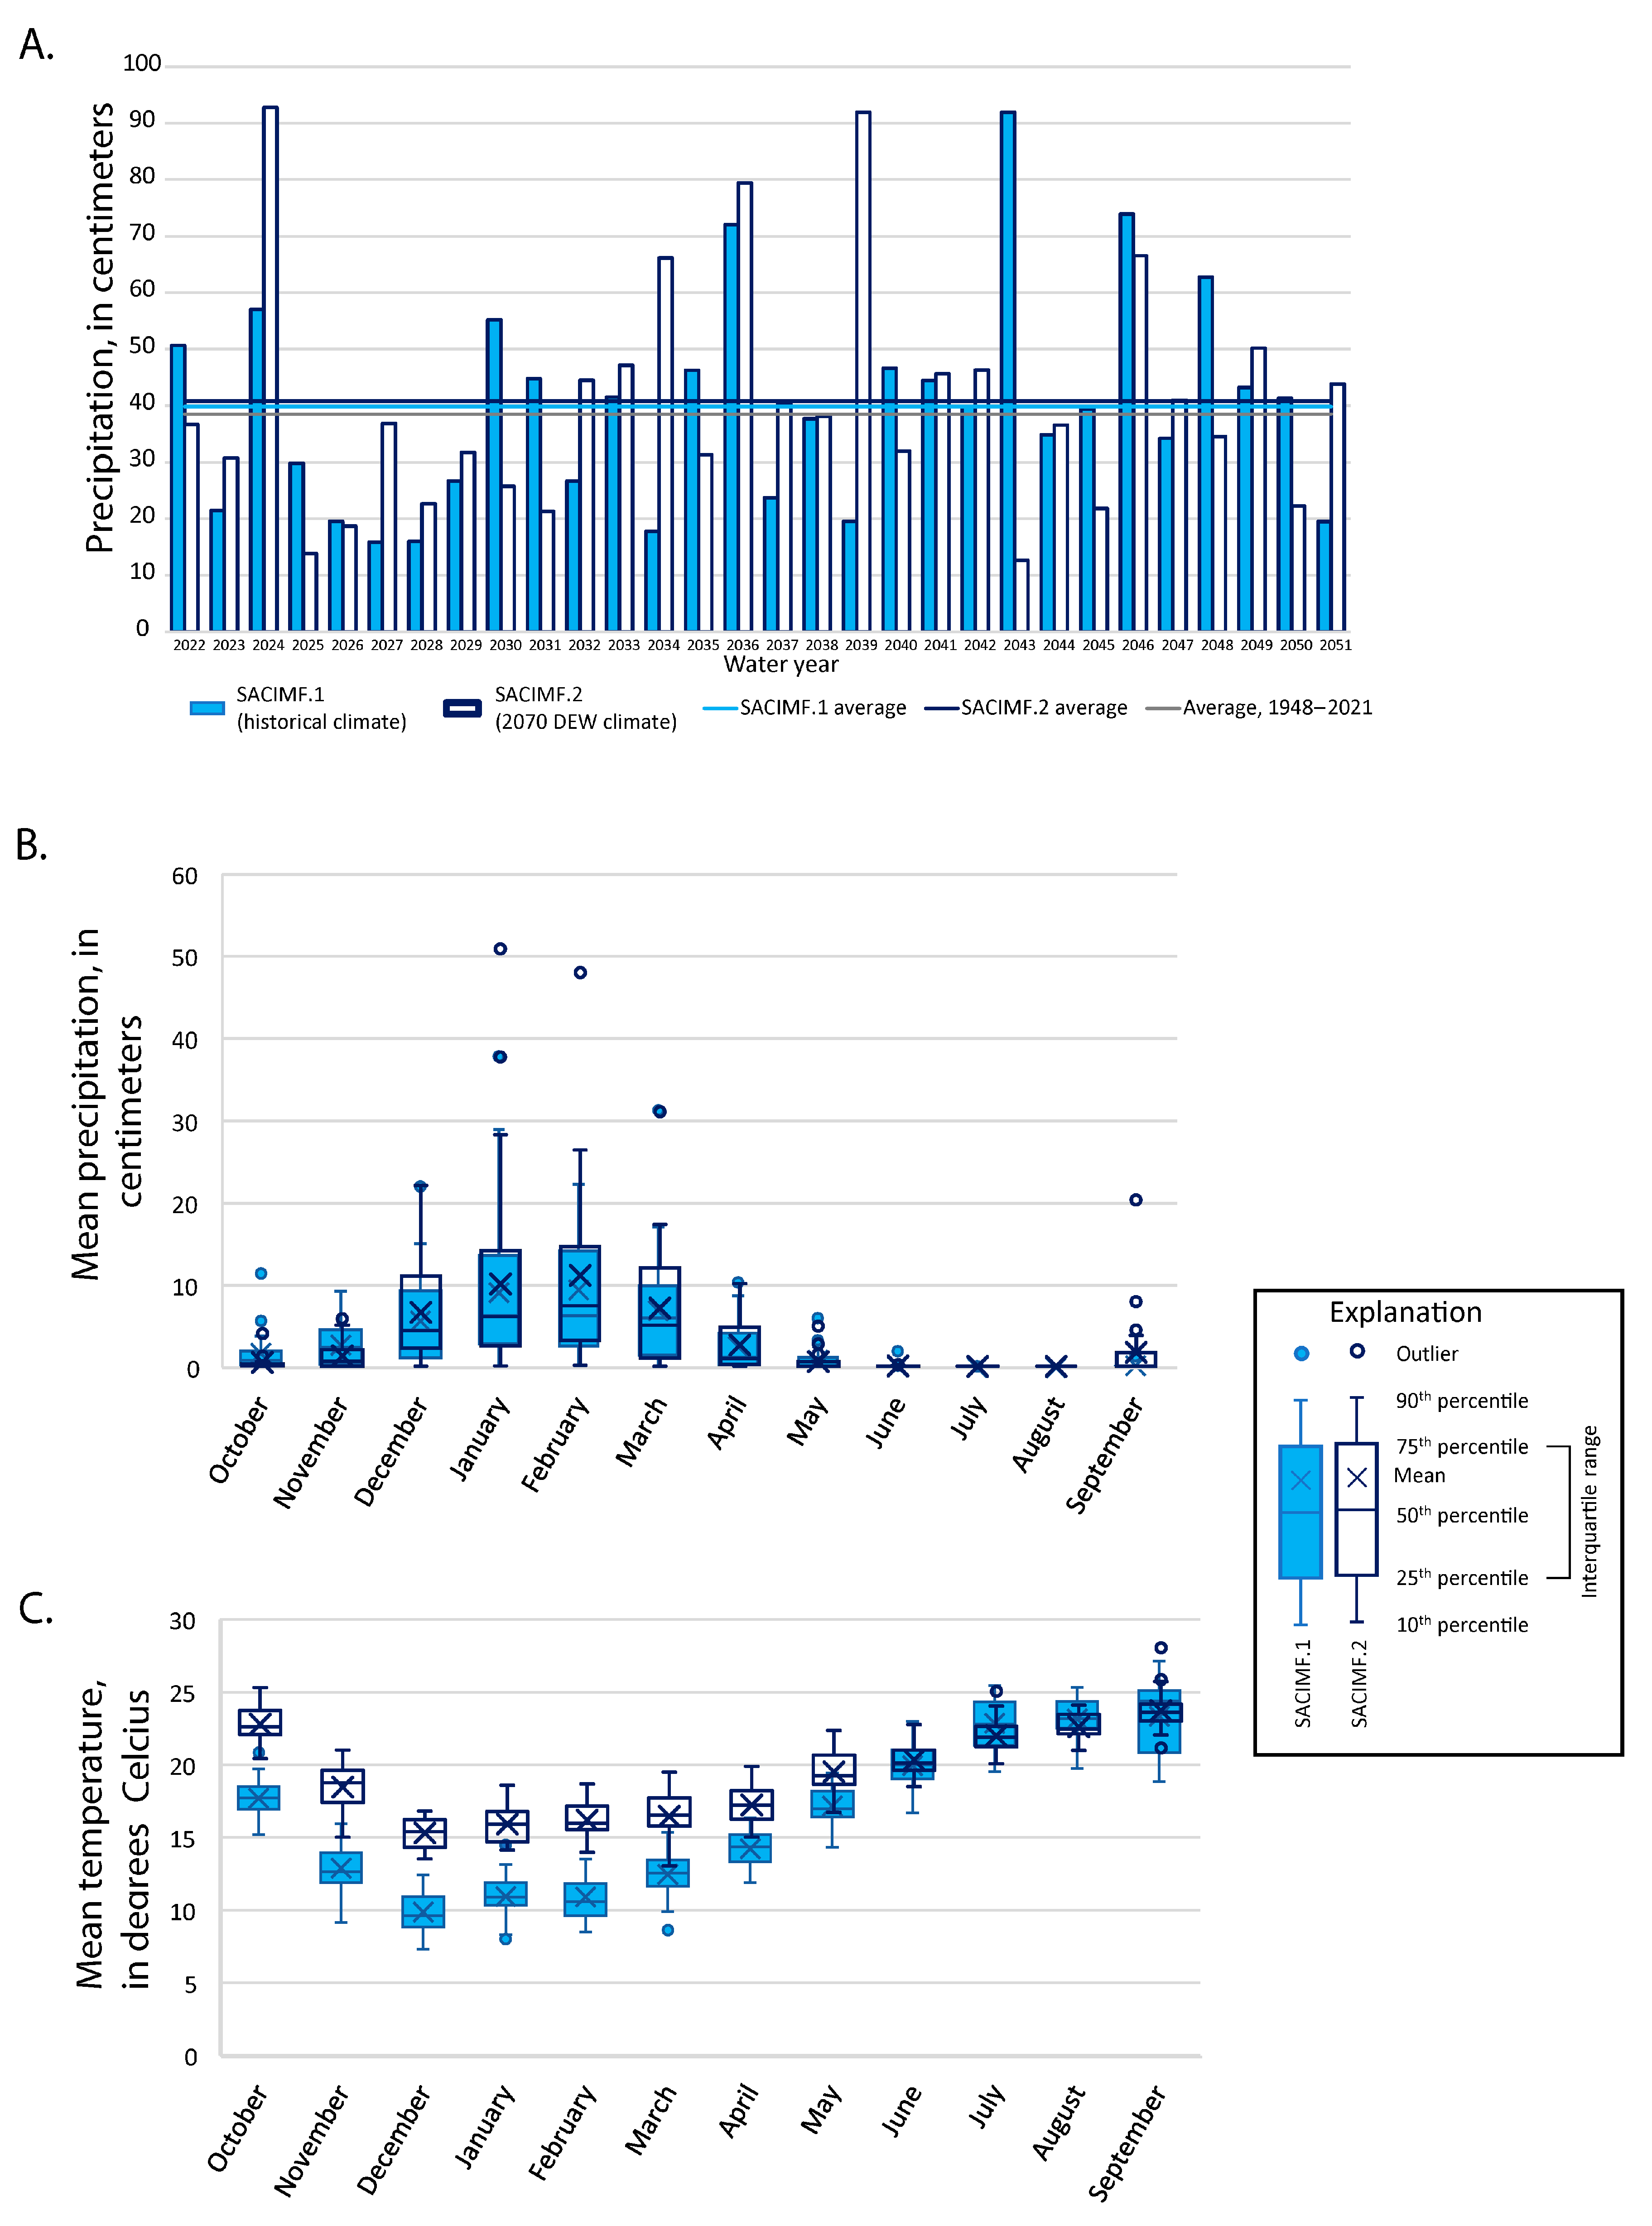
3.1.1. Precipitation and Temperature

The SACIMF.2 future model has slightly greater average precipitation, larger precipitation events, and warmer temperatures than SACIMF.1 (Figure 3), which is characteristic of the 2070 DEW climate input used in SACIMF.2. The 2070 DEW predicts larger and more infrequent precipitation events and overall higher temperatures than historical climate records [22]. The long-term average annual precipitation for SACIMF.2 was slightly greater than SACIMF.1, although annual precipitation amounts varied for each model (Figure 3A). The greater average annual precipitation in SACIMF.2 is a result of larger precipitation events in that climate model, despite having more years of annual precipitation less than the long-term average (Figure 3A). Mean monthly precipitation for both models was also similar, although SACIMF.2 was more likely to have large precipitation events during the winter months (Figure 3B). Mean monthly temperatures, as well as the long-term average temperature, of SACIMF.2 were substantially greater than SACIMF.1 (Figure 3C). The precipitation and temperature in Figure 3 were simulated at Santa Barbara County Climate Station 204, Los Alamos Fire Station #24 [25], in the town of Los Alamos.

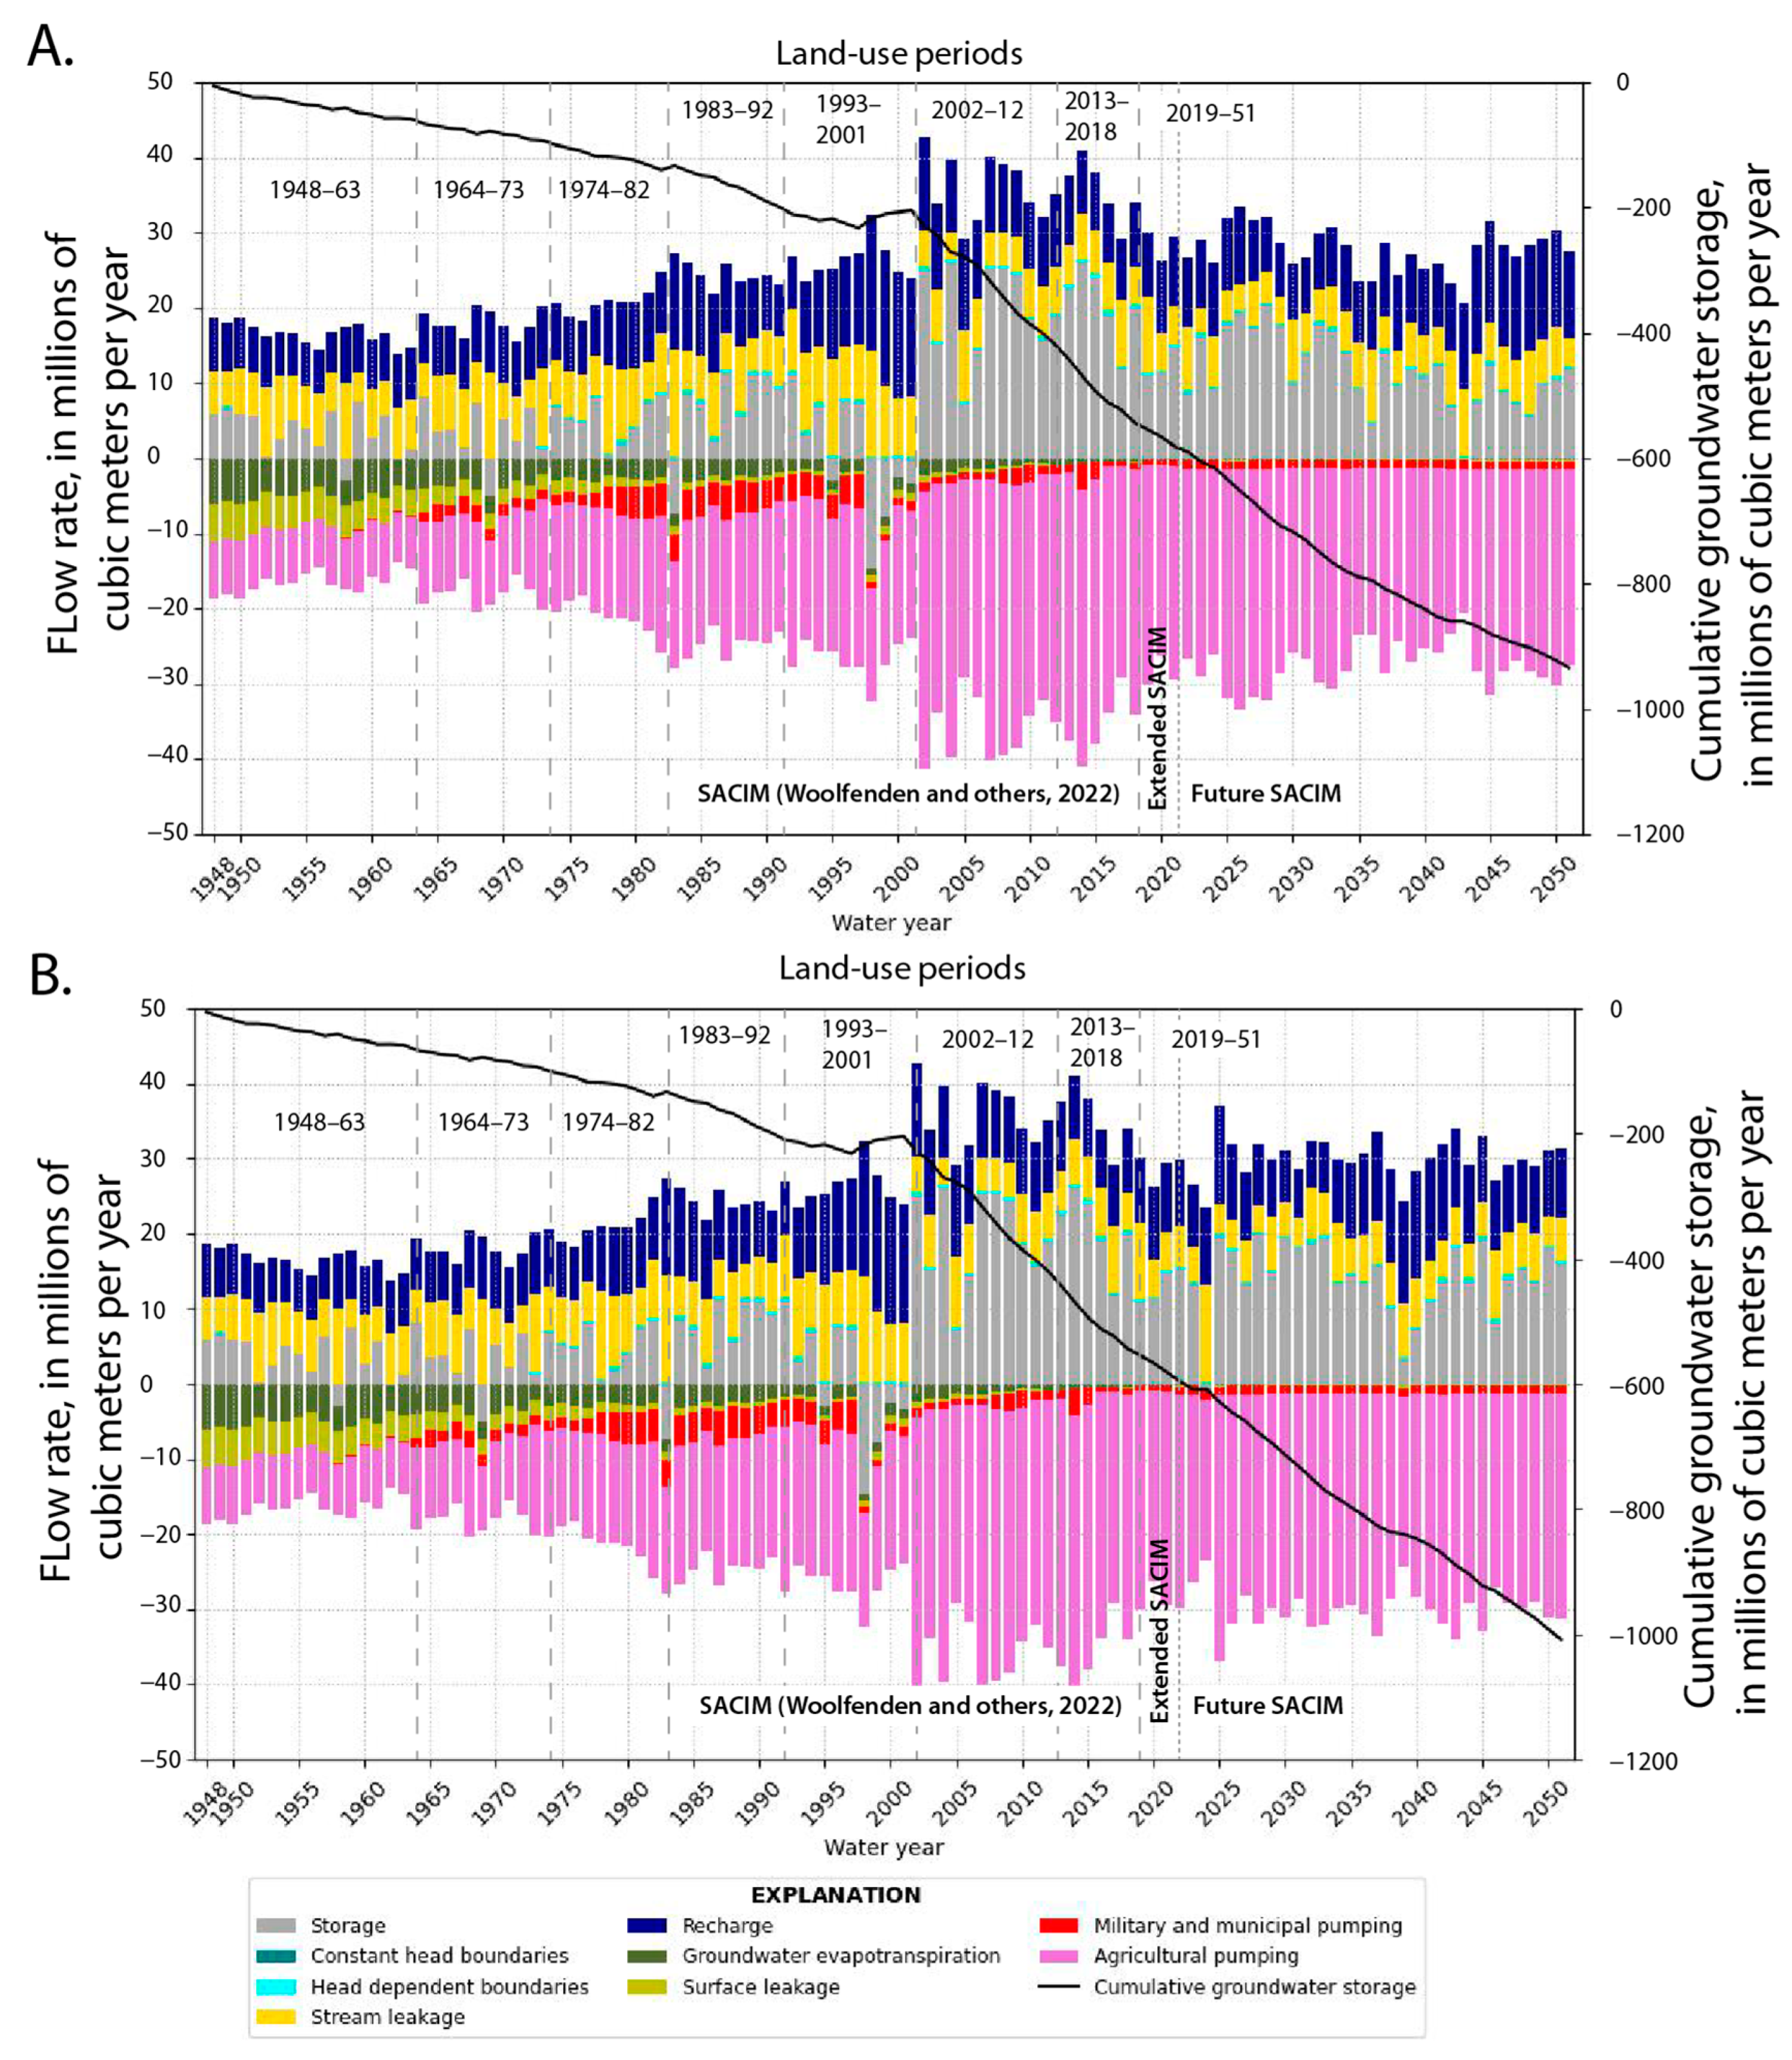
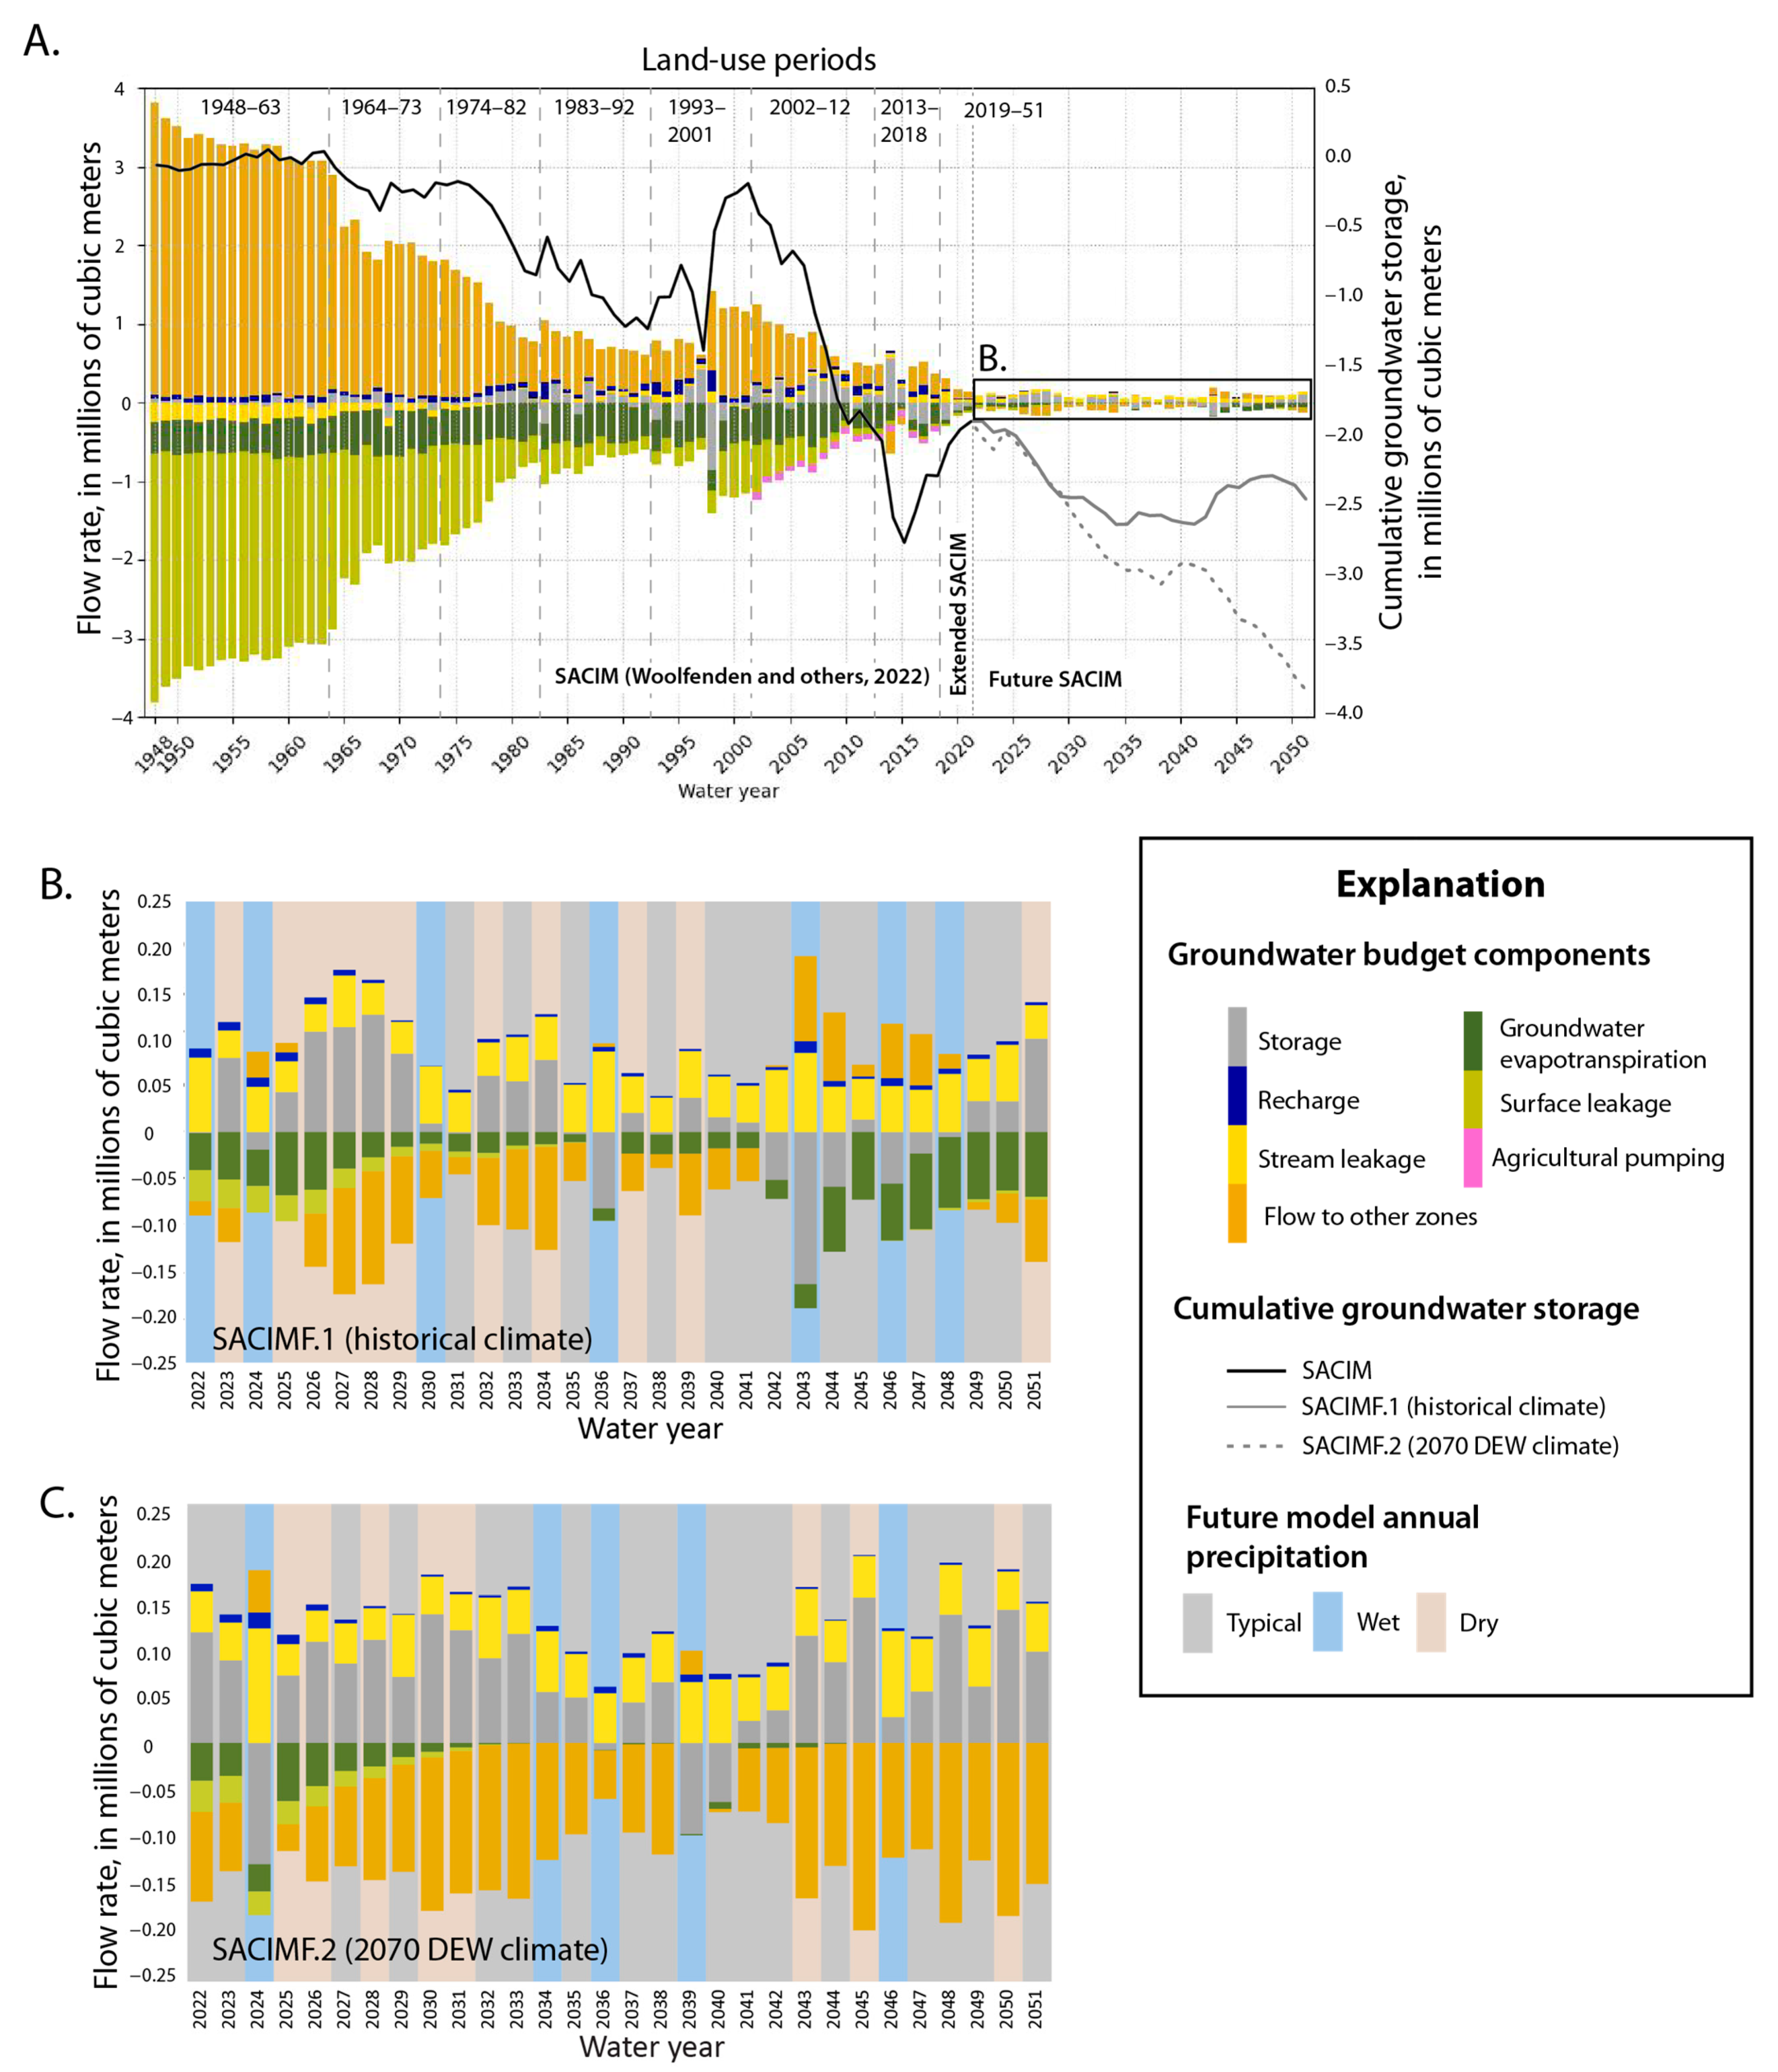
3.1.2. Groundwater Budget

The simulated groundwater budget of the SACVW during the future model period continued the water use trends of the SACIM [4] and extended SACIM and was consistent with the changes in land use and climatic and hydrologic inputs (Figure 4; Table 2). Groundwater budget values in Figure 4 are presented with respect to the groundwater system. Positive values are inflows to the groundwater system, and negative values are outflows from the groundwater system. For the storage component, groundwater removed from storage has a positive value, and groundwater added to storage has a negative value. The cumulative change in storage is presented in the conventional sense where negative values represent storage depletion (Figure 4; Table 2).
During the entire simulation period, groundwater removed from storage (withdrawal) almost always exceeded groundwater added to storage (recharge) each year, resulting in the depletion of groundwater storage (Figure 4; Table 2). Groundwater storage depletion was positively correlated with increases in irrigated agricultural land use and agricultural pumping [4] (Figure 4). During the future model period, the rate of annual groundwater storage depletion was relatively static in both SACIMF.1 and SACIMF.2, due to relatively constant agricultural pumping—a result of the use of a single land use map for the future model period (Figure 1 and Figure 4). Storage loss in SACIMF.2 was greater than in SACIMF.1 by 74 Mm3 (Figure 4; Table 2). This difference in storage loss is driven by greater simulated potential evapotranspiration in SACIMF.2 than SACIMF.1. The result of higher simulated potential evapotranspiration is a larger evapotranspiration deficit in the agricultural rooting zone and a larger volume of simulated agricultural pumpage in SACIMF.2 to account for that deficit (Figure 4; Table 2).

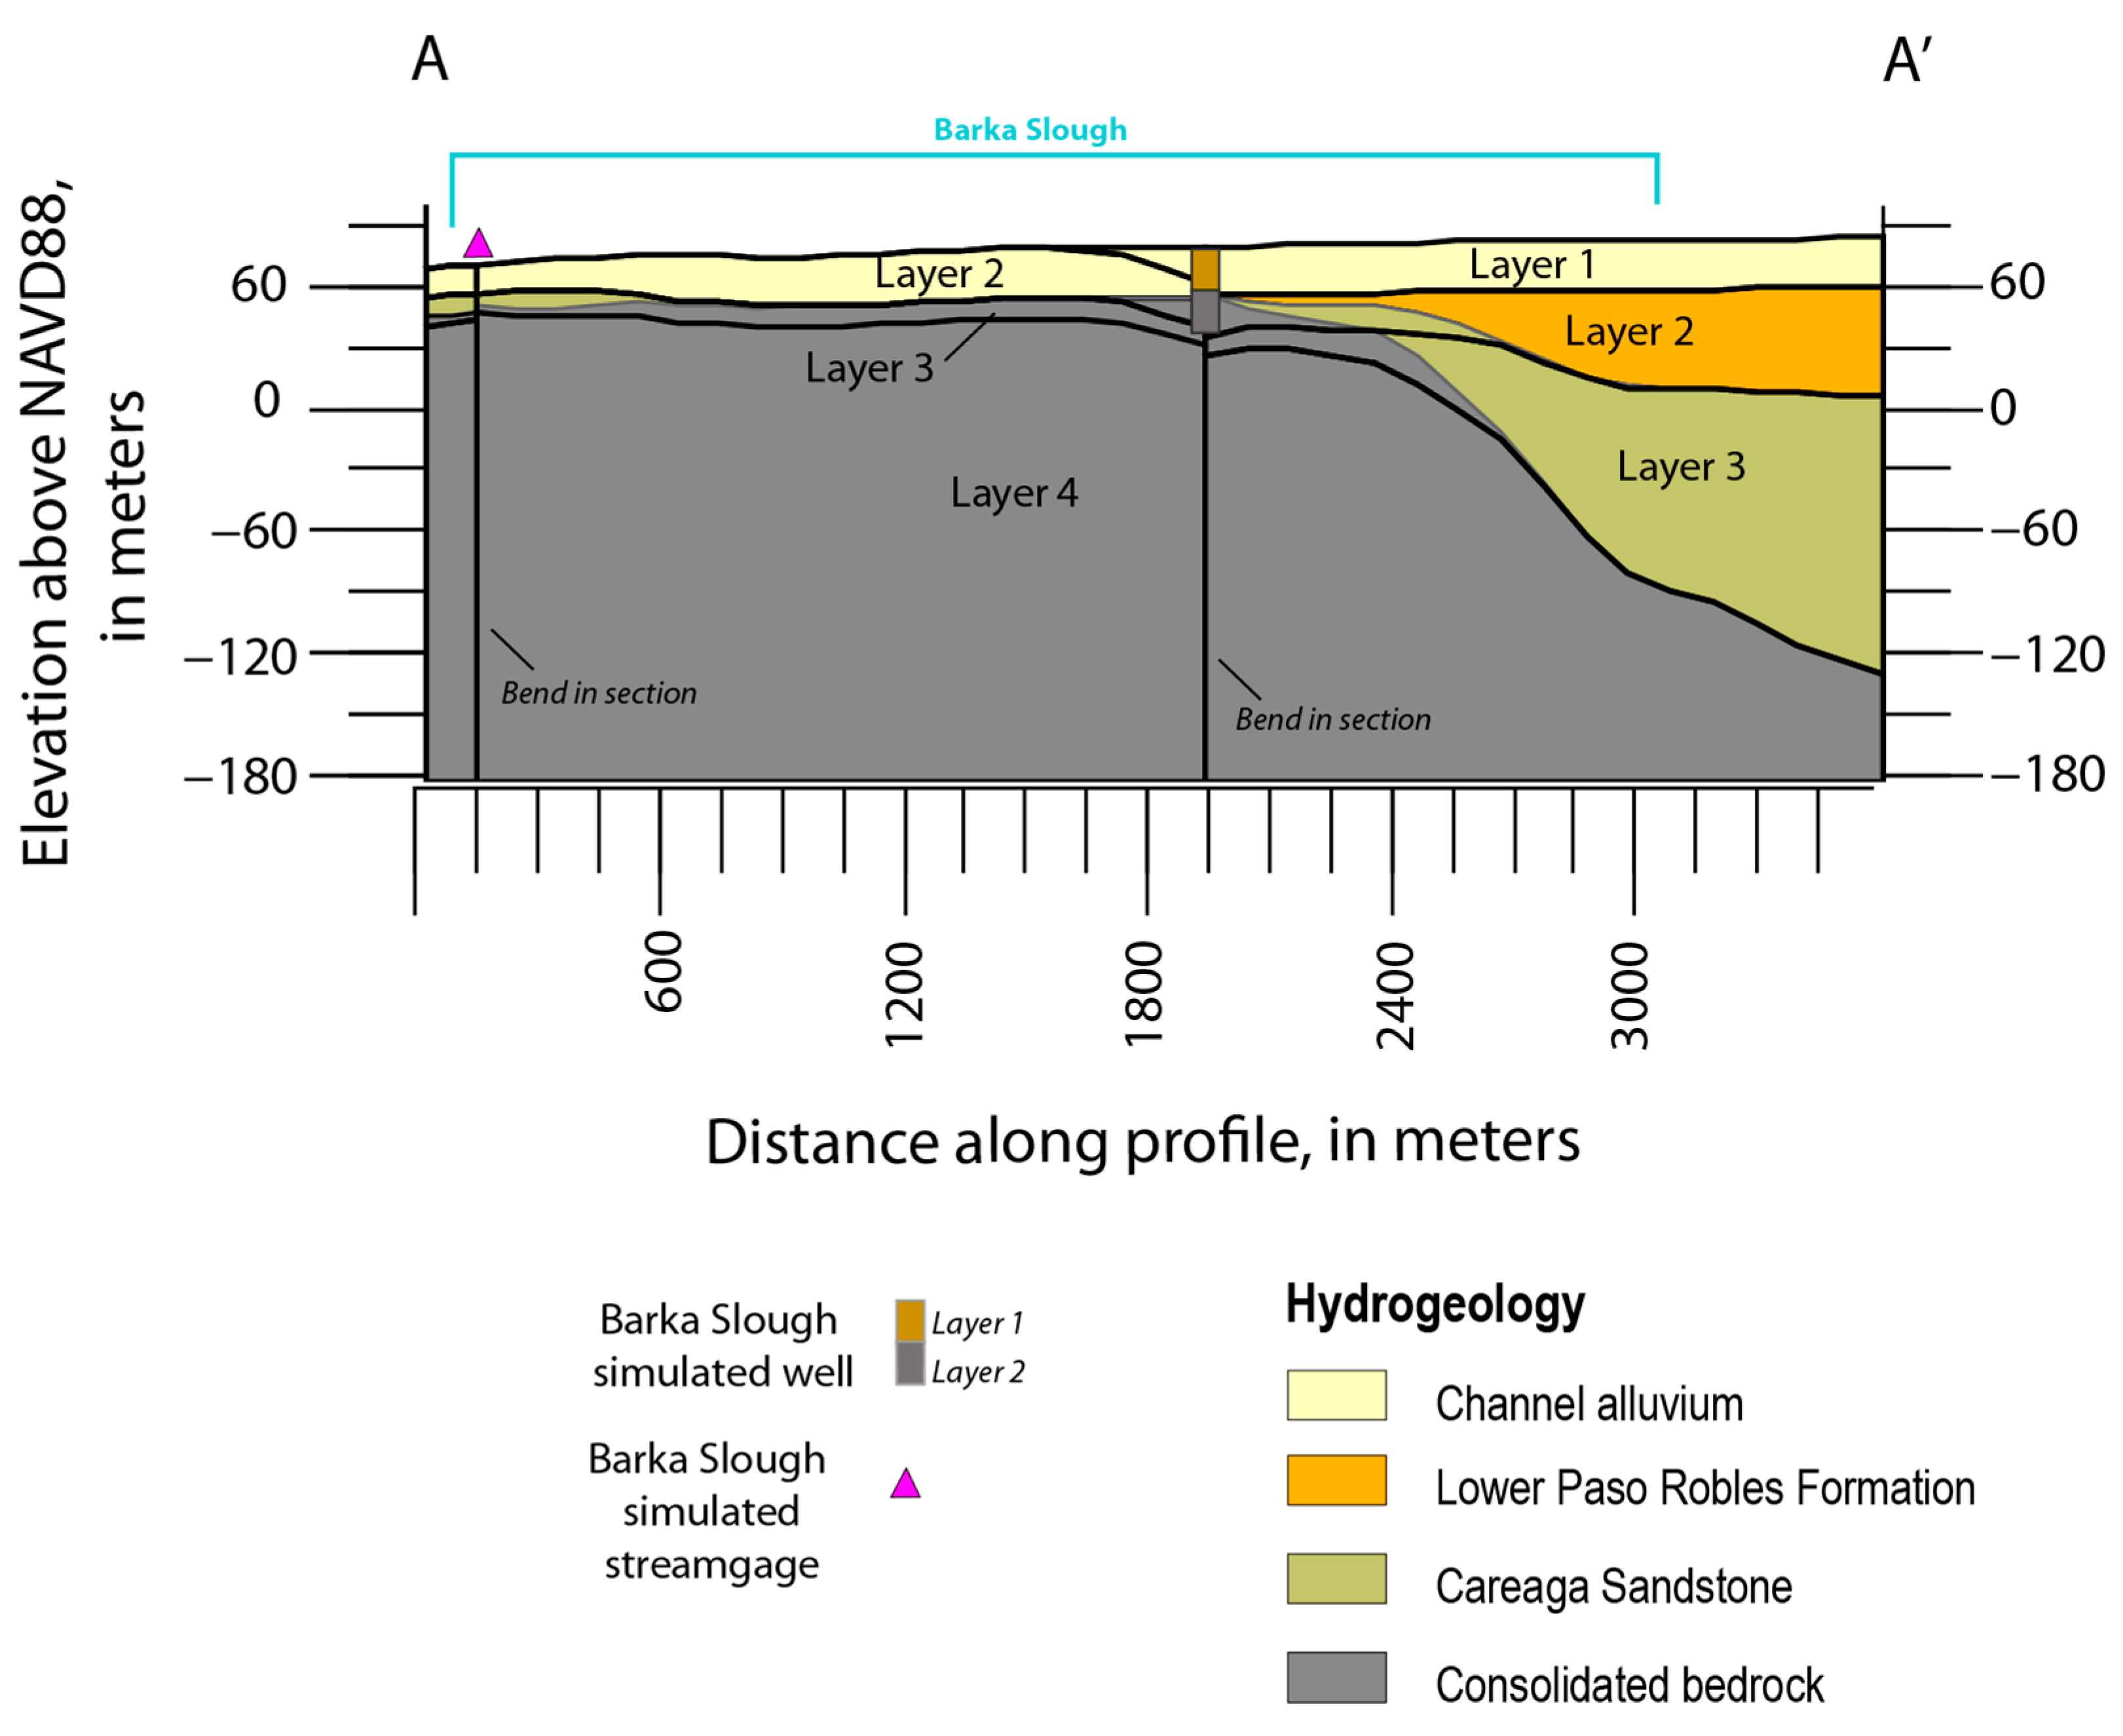
3.2. Water Availability in Barka Slough

Potential changes to water availability in Barka Slough (Figure 1) were evaluated during the future model period for SACIMF.1 and SACIMF.2. The surface water flow was evaluated at a simulated streamgage in Barka Slough; groundwater availability at the slough was evaluated with respect to groundwater budget components, including storage groundwater-level elevations; and vertical groundwater-flow gradients were evaluated at a simulated observation well within the slough. The simulated changes to water availability were used to inform potential impacts on aquatic habitats in Barka Slough (see “Effects on Aquatic Habitats” Section).

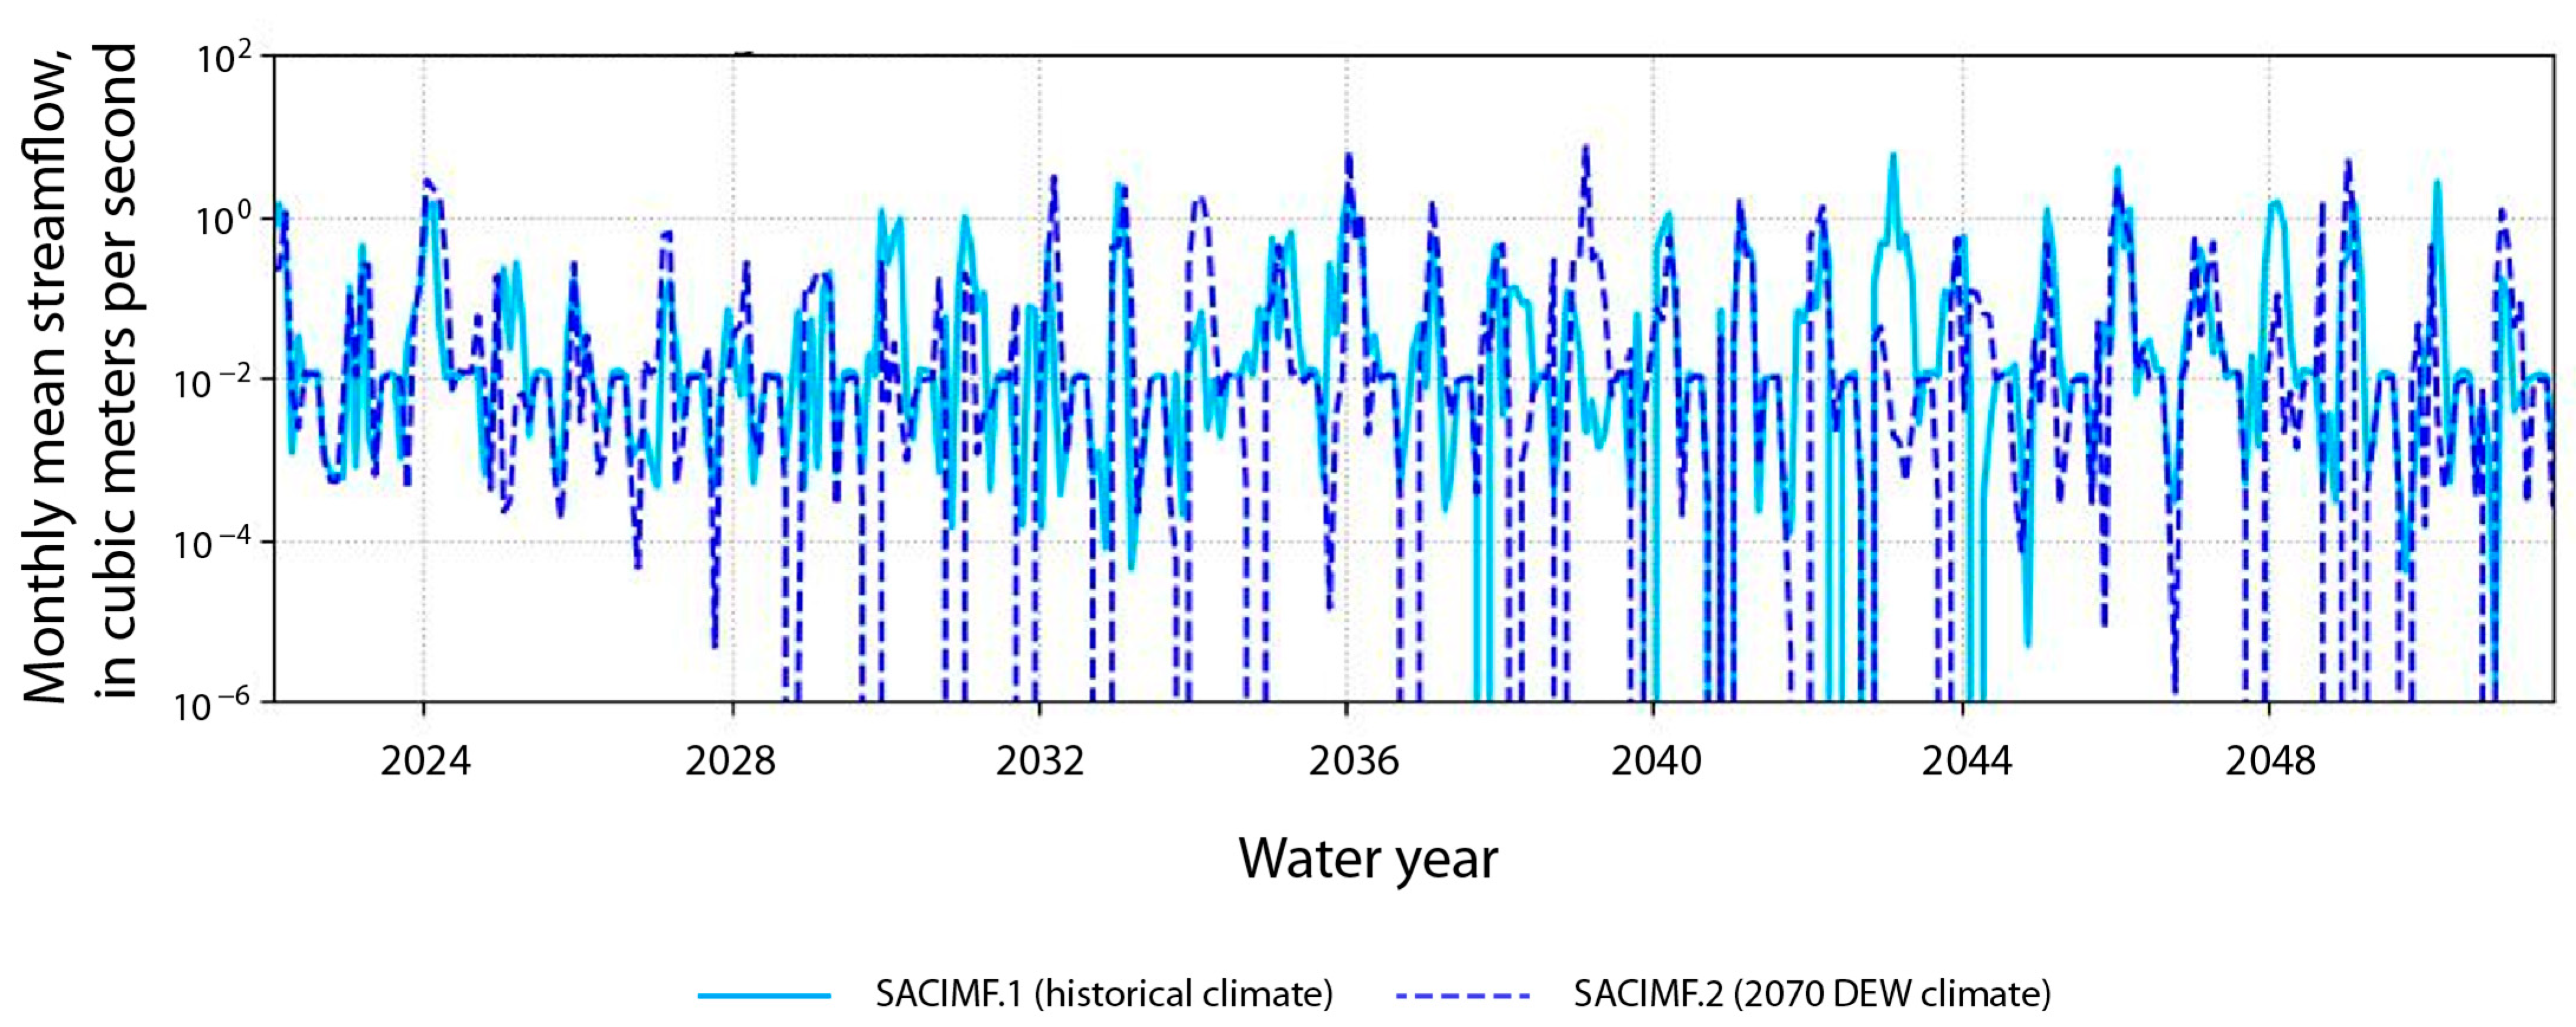
3.2.1. Surface Water Flow

Simulated mean monthly surface water outflow rates from Barka Slough (Figure 5) indicated that the streamflow system is driven by surface water runoff processes instead of baseflow. Outflow rates at the simulated streamgage (“Barka Slough streamgage”; Figure 1) ranged from about 0–7.105 cubic meters per second (cms; Figure 5), varied seasonally, and correlated with the mean monthly and annual precipitation for both SACIMF.1 and SACIMF.2 (Figure 3A,B). Cumulative and mean monthly streamflow was greater for SACIMF.2 relative to SACIMF.1; however, this was likely a result of slightly greater amounts of annual precipitation and larger precipitation events in SACIMF.2.
Historically, San Antonio Creek has had perennial streamflow at and downstream of Barka Slough [36]. Both SACIMF.1 and SACIMF.2 had recurring intervals of no streamflow (Figure 5), most often occurring in the dry season from May to September. In SACIMF.2, streamflow approached zero in most years after 2027, whereas in SACIMF.1, streamflow approached zero only between 2038 and 45. Recurring intervals of no streamflow during the future model period in SACIMF.2 indicate that the creek may transition from perennial to intermittent flow, with implications for aquatic taxa (see “Effects on Barka Slough Aquatic Habitat”).

3.2.2. Groundwater Budget for Barka Slough

The simulated groundwater budget for Barka Slough is shown for the entire simulation period in Figure 6A and is shown for the future model period (Table 3) for SACIMF.1 (Figure 6B) and for SACIMF.2 (Figure 6C). Groundwater budget values and cumulative groundwater storage in Figure 6 and Table 3 are presented in the same manner as in Figure 4 and Table 2. There was no groundwater pumping in Barka Slough for most of the simulation period. A small amount of agricultural pumping occurred during 2002–2018, when land use maps indicated the presence of irrigated agricultural fields within the boundaries of the slough. Any nearby pumping was represented in the catch-all “flow to other zones” budget component.
Following historical trends, most simulation years showed a net loss of groundwater storage in Barka Slough, resulting in continued groundwater storage depletion (Figure 6; Table 3). During years with greater than average precipitation (e.g., 1998, Figure 6A), recharge was greater than groundwater withdrawals and some aquifer recovery occurred. During the future model period, the decline in storage in SACIMF.2 was greater than SACIMF.1 by 1.37 Mm3, a result of the larger volume of watershed-wide agricultural pumpage in SACIMF.2 (Figure 4A; Table 2 and Table 3).
The effects of cumulative groundwater storage depletion on Barka Slough can be observed in the decline in groundwater-level elevations at a simulated observation well in the slough (Figure 1B, Figure 2 and Figure 7). The simulated well was assumed to be perforated in layers 1 and 2 of the model (Figure 2). At the simulated well location, layer 1 consists of channel alluvium, and layer 2 consists of consolidated bedrock (Figure 2). From 1948 to 2051, groundwater levels in layer 1 declined by 5.0–8.7 m (depending on the future model), and levels in layer 2 declined by 12.6–16.2 m, with the greatest declines occurring in SACIMF.2 (Figure 7).
The patterns of spatial groundwater-level changes in each future model (Figure 8) are consistent with the relative recovery (SACIMF.1) and decline (SACIMF.2) in groundwater levels at the simulated Barka Slough well (Figure 7). The groundwater level changes in Figure 8 represent the difference in springtime water levels between March 2022 and March 2051 for the uppermost layer in each grid cell. In SACIMF.1 (Figure 8A), groundwater levels declined in most parts of the slough, with a maximum decline of 2.1 m; groundwater levels increased in the upgradient parts of the slough along San Antonio Creek, with a maximum increase of 0.4 m. In SACIMF.2 (Figure 8B), groundwater levels declined everywhere in the slough, with a maximum decline of 4.5 m; groundwater levels declined the least at the downgradient part of the slough along San Antonio Creek.

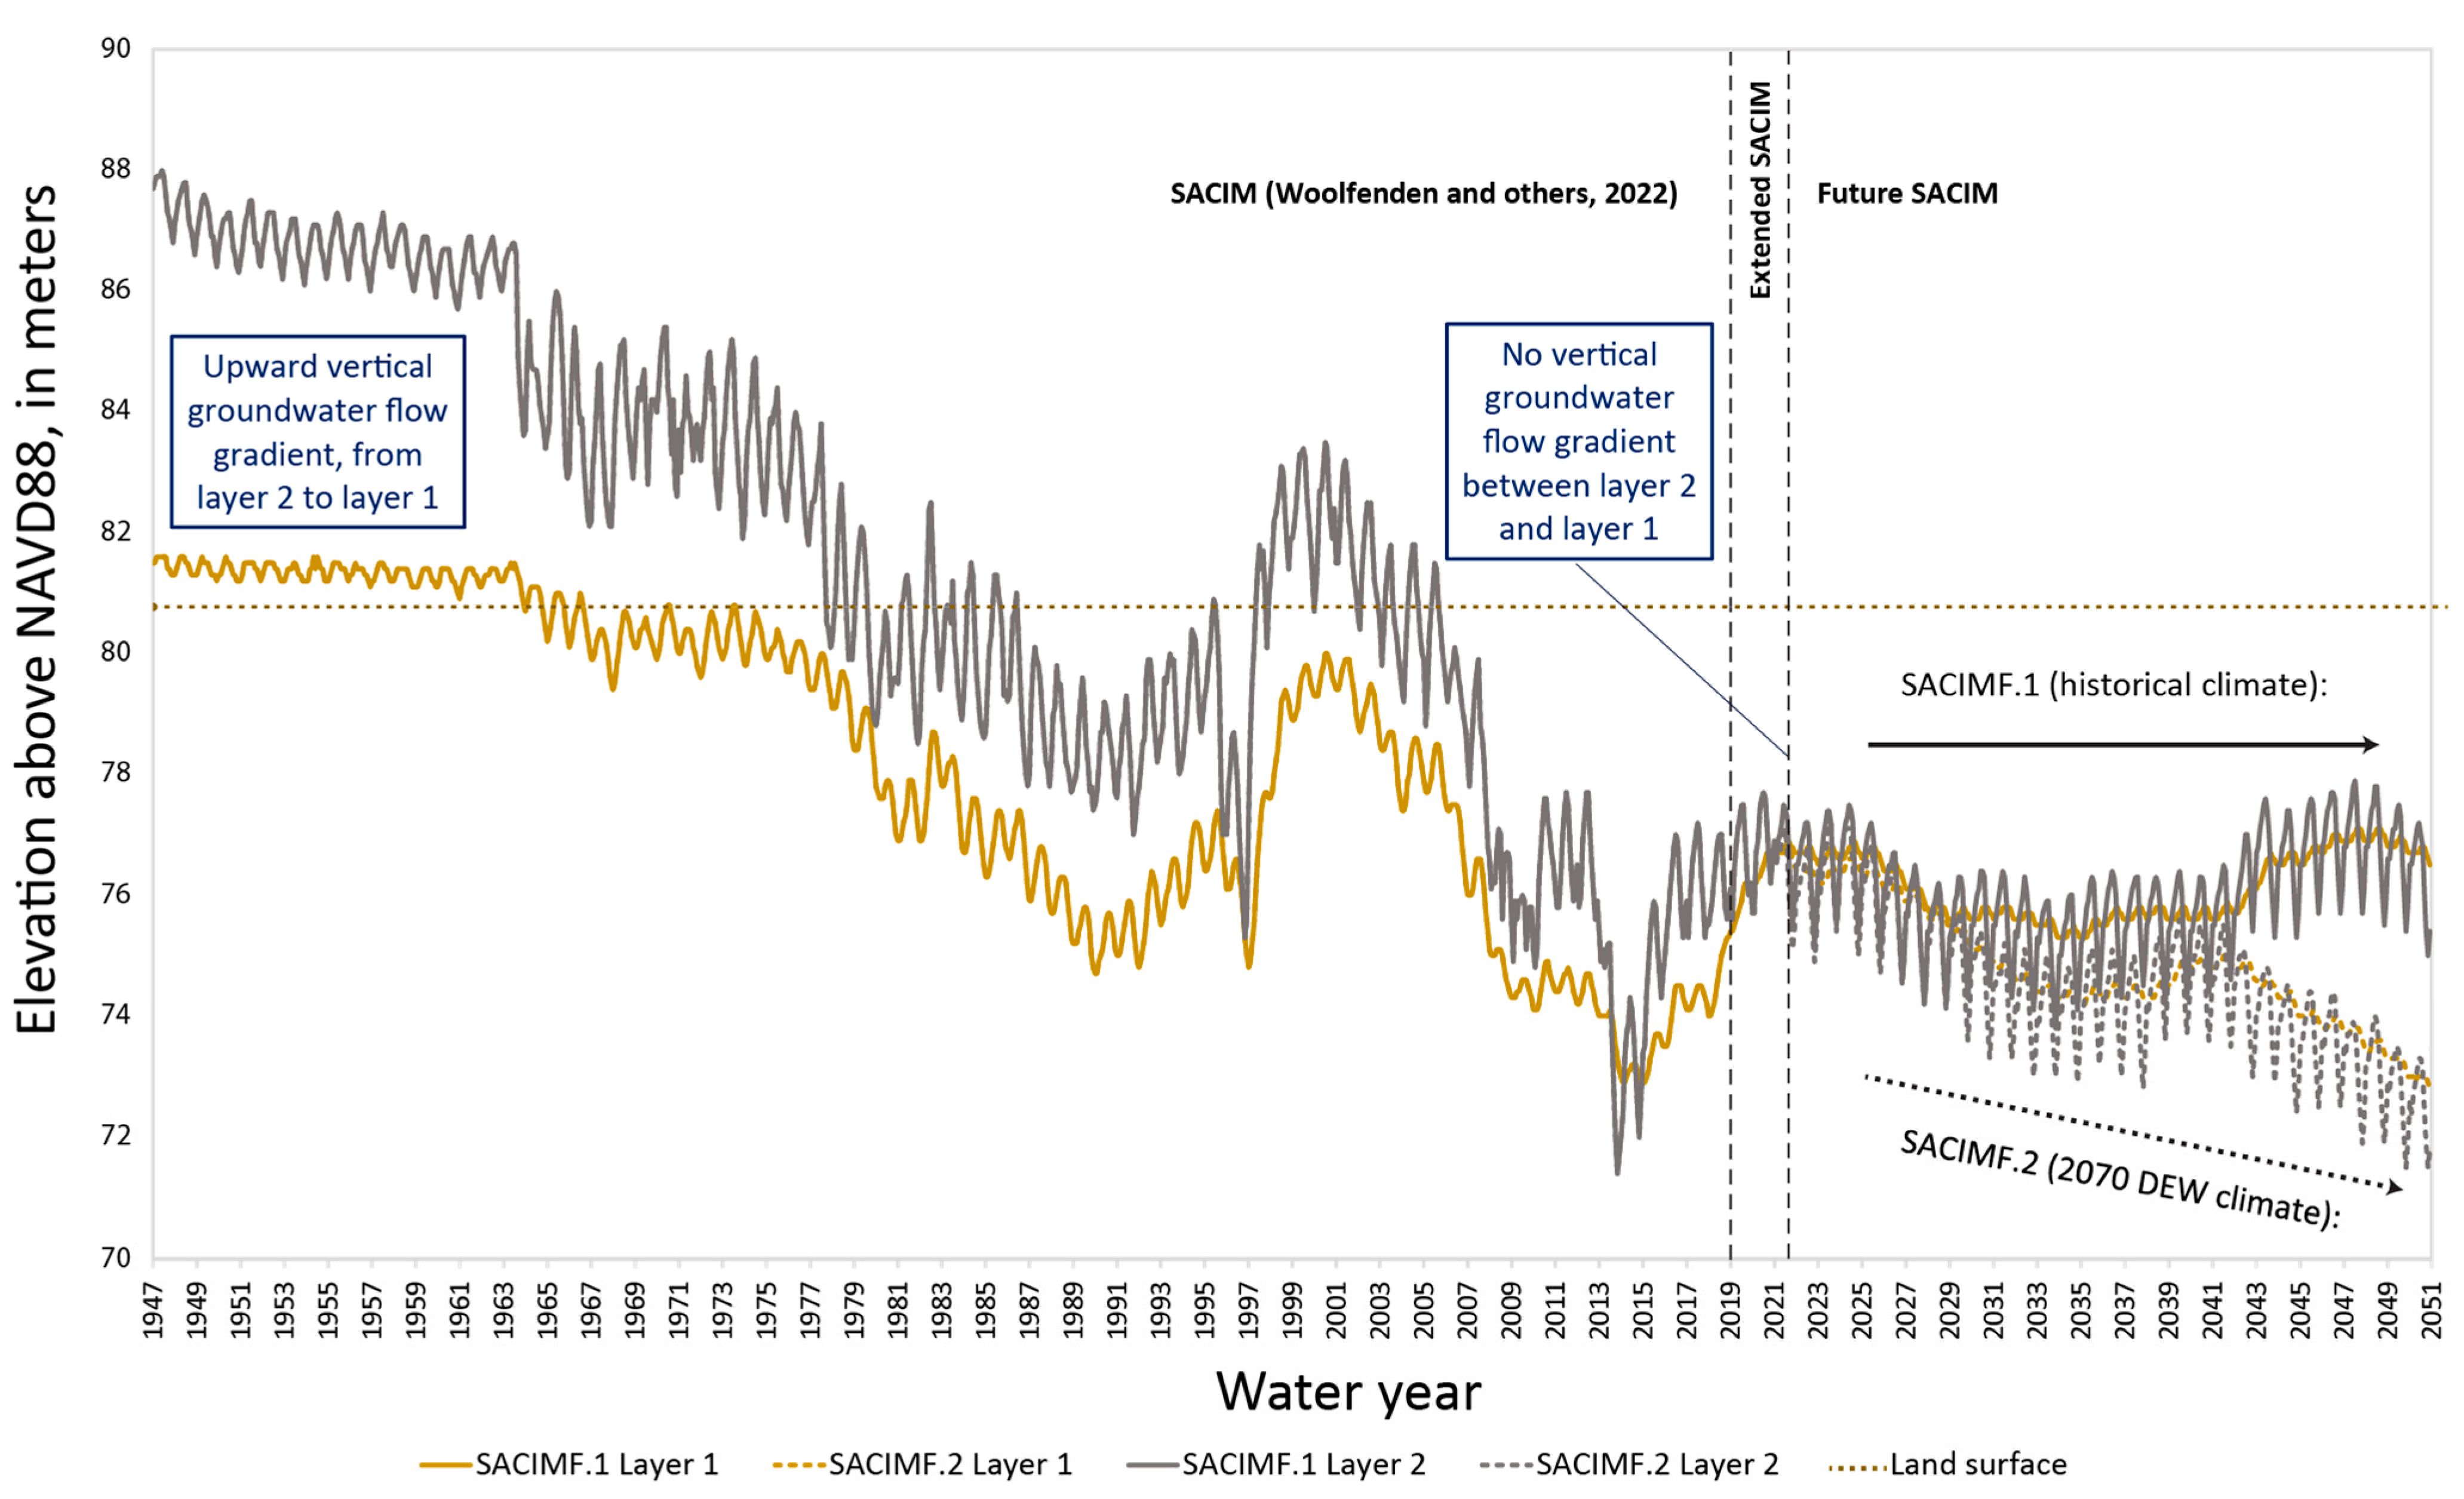
3.2.3. Vertical Groundwater Flow Gradients

Changes to groundwater-level elevations between layers at the simulated observation well indicate changing vertical groundwater flow gradients in Barka Slough during the future model period (Figure 7). An upward vertical gradient between layers 1 and 2 was present from 1948 to 2021 [1,4,27] (Figure 7), which drove simulated surface leakage to the historically perennial wetlands in Barka Slough. The difference in groundwater-level elevations between layers 1 and 2 declined between 1948 and 2021, indicating a reduction in the vertical flow gradient caused by the long-term extraction of groundwater from the deeper part of the SACVW aquifer system [1]. The vertical flow gradient reduction is consistent with reductions in the estimated baseflow to San Antonio Creek [1,18] and net groundwater storage depletion in Barka Slough and the SACVW (Figure 4 and Figure 6).
Simulated water levels in layers 1 and 2 were generally about the same from 2022 to 51, in both SACIMF.1 and SACIMF.2 (Figure 7), indicating that during the future model period there was not a consistent, perennial upward vertical groundwater flow gradient between the two layers. Instead, the direction and magnitude of vertical flow were seasonally dependent, with groundwater levels in layer 2 higher than those in layer 1 during the wet season and lower than layer 1 during the dry seasons (during which groundwater pumping would be greater).
The weakening and seasonal reversal of the upward groundwater flow gradient in both future models indicates that the groundwater contribution to Barka Slough and to surface water flow will likely become seasonal and reduce the overall availability of water to support riparian and aquatic habitats in the slough.
Additional evidence for the reduced contribution of groundwater to Barka Slough is from the changes in the magnitude of surface leakage and groundwater evapotranspiration (ET; Figure 6). Both components are indicators of groundwater above the land surface or within the simulated riparian vegetation rooting zone. From 1948 to 2021, surface leakage declined from 3.15 to 0.04 Mm3, and groundwater ET declined from 0.4 to 0.03 Mm3 (Figure 6A). During the future model period, surface leakage was near 0 (less than 0.004 Mm3/yr) beginning in 2034 in SACIMF.1 and 2032 in SACIMF.2 (Figure 6B,C), indicating that groundwater discharge to the land surface effectively ceased in Barka Slough in each model beginning in these years. Groundwater ET was perennial in SACIMF.1, ranging from 0.009 Mm3 to 0.08 Mm3/yr (Figure 6B). However, groundwater ET in SACIMF.2 was near 0 (less than 0.004 Mm3/yr) from 2032 to 39 and from 2044 to 51 (Figure 6C), indicating groundwater levels were below the root zone in Barka Slough during these years.

3.3. Effects on Aquatic Habitat

The relative impacts of future changes in water availability on each of the three habitat metrics for the protected species of interest were qualitatively evaluated (Table 1; Appendix A). The three habitat metrics are streamflow, stream disconnection, and depth to groundwater. Generally, species are most likely to be impacted by these negative effects during reproductive windows in the late winter, spring, and summer (Table 1; Appendix A), although year-round conditions are not to be discounted.
Impacts on vertebrate taxa (tidewater goby, unarmored threespine stickleback, and California red-legged frog) are likely to be most strongly correlated (moderate or high impact) to decreases in streamflow volume and periods of stream disconnection. Impacts on riparian plants (Gambel’s watercress and La Graciosa thistle) are likely to be most strongly correlated to declines in the depth to groundwater. Although Gambel’s watercress and La Graciosa thistle are not currently found in Barka Slough, evaluation of habitat metrics presented here are useful for the evaluation of any potential restoration or reintroduction efforts.

3.3.1. Streamflow

Streamflow is of high importance to all five protected species (Table 1). Of particular concern is the regional long-term trend of the increased frequency of extreme precipitation events and declining summer streamflow [37]. Periods of no or low streamflow are detrimental to all protected species. No or low streamflow can increase the risk of poor habitat conditions (such as elevated temperature or reduced oxygenation) and predation and can result in stream disconnection, which constrains the ability of individuals to freely migrate, seek out refuge, or move to locations with more beneficial environmental conditions. Periods of high streamflow may also be detrimental, especially to the vertebrate taxa. High streamflow can potentially flush individuals out and (or) damage their preferred habitat.
The effects of streamflow on protected species’ habitats are discussed qualitatively and with respect to the differences in streamflow trends between each model. A meaningful and quantifiable threshold for no streamflow is readily identifiable and is discussed in the “Stream Disconnection” Section. Meaningful and quantifiable thresholds for high streamflow, however, are not readily identifiable and require substantial and specific information about local conditions (such as streamflow velocity, refugia habitat type and extent, and species-specific surveys). The compilation of such information was beyond the scope of this study.
Mean monthly streamflow (the mean of simulated daily streamflow within a month) at the Barka Slough streamgage was used to evaluate the potential of streamflow to support aquatic habitats for all five protected species (Figure 9). Mean monthly streamflow at the Casmalia streamgage (Figure 1) may be a more appropriate habitat metric for the tidewater goby because that species is primarily observed between Barka Slough and the estuary at the outfall of San Antonio Creek and the Pacific Ocean (Appendix A). For simplicity, only the Barka Slough streamgage is discussed because the pattern of mean monthly streamflow is the same at both streamgages, although the volume of streamflow is somewhat larger at the Casmalia streamgage [5].
Streamflow during March–July would most directly impact the California red-legged frog, Gambel’s watercress, and La Graciosa thistle (Figure 9; Table 1; Appendix A). Streamflow volume during April–September would most directly impact the tidewater goby and unarmored threespine stickleback (Figure 9; Table 1; Appendix A).
The California red-legged frog, Gambel’s watercress, and La Graciosa thistle are unlikely to be affected by streamflow during their reproductive window (March–July). The absolute ranges of mean streamflow volume during each month were comparable between SACIMF.1 and SACIMF.2, except in September (Figure 9). During March–August, there were no obvious trends in the volume or frequency of low or high streamflow periods in each model. These results indicate that streamflow was relatively stable during each month, and neither model was more likely to affect aquatic habitats in Barka Slough.
The tidewater goby and unarmored threespine stickleback are more likely to be affected by changes in streamflow under 2070 DEW climatic conditions, but only in September. In September, streamflow for most years was consistently low and punctuated by occasional years with high streamflow. There were more years with high streamflow (and higher streamflow volumes) in SACIMF.2 than SACIMF.1, indicating that SACIMF.2 is more likely to affect aquatic habitats in Barka Slough. Any effects on aquatic habitat for these two species are likely minimal because September marks the end of their reproductive window (April–September)
The variability in simulated streamflow for March–September (Figure 9) is correlated to climate variability and monthly precipitation in SACIMF.1 and SACIMF.2 (Figure 3B). Effects from changes in groundwater availability are likely minimal. In both models, March–May had the highest streamflow volumes (Figure 9) and the greatest amount of precipitation, and June–August had the lowest streamflow volumes and the least amount of precipitation. SACIMF.2 demonstrated more years with high streamflow and more precipitation in September than SACIMF.1.

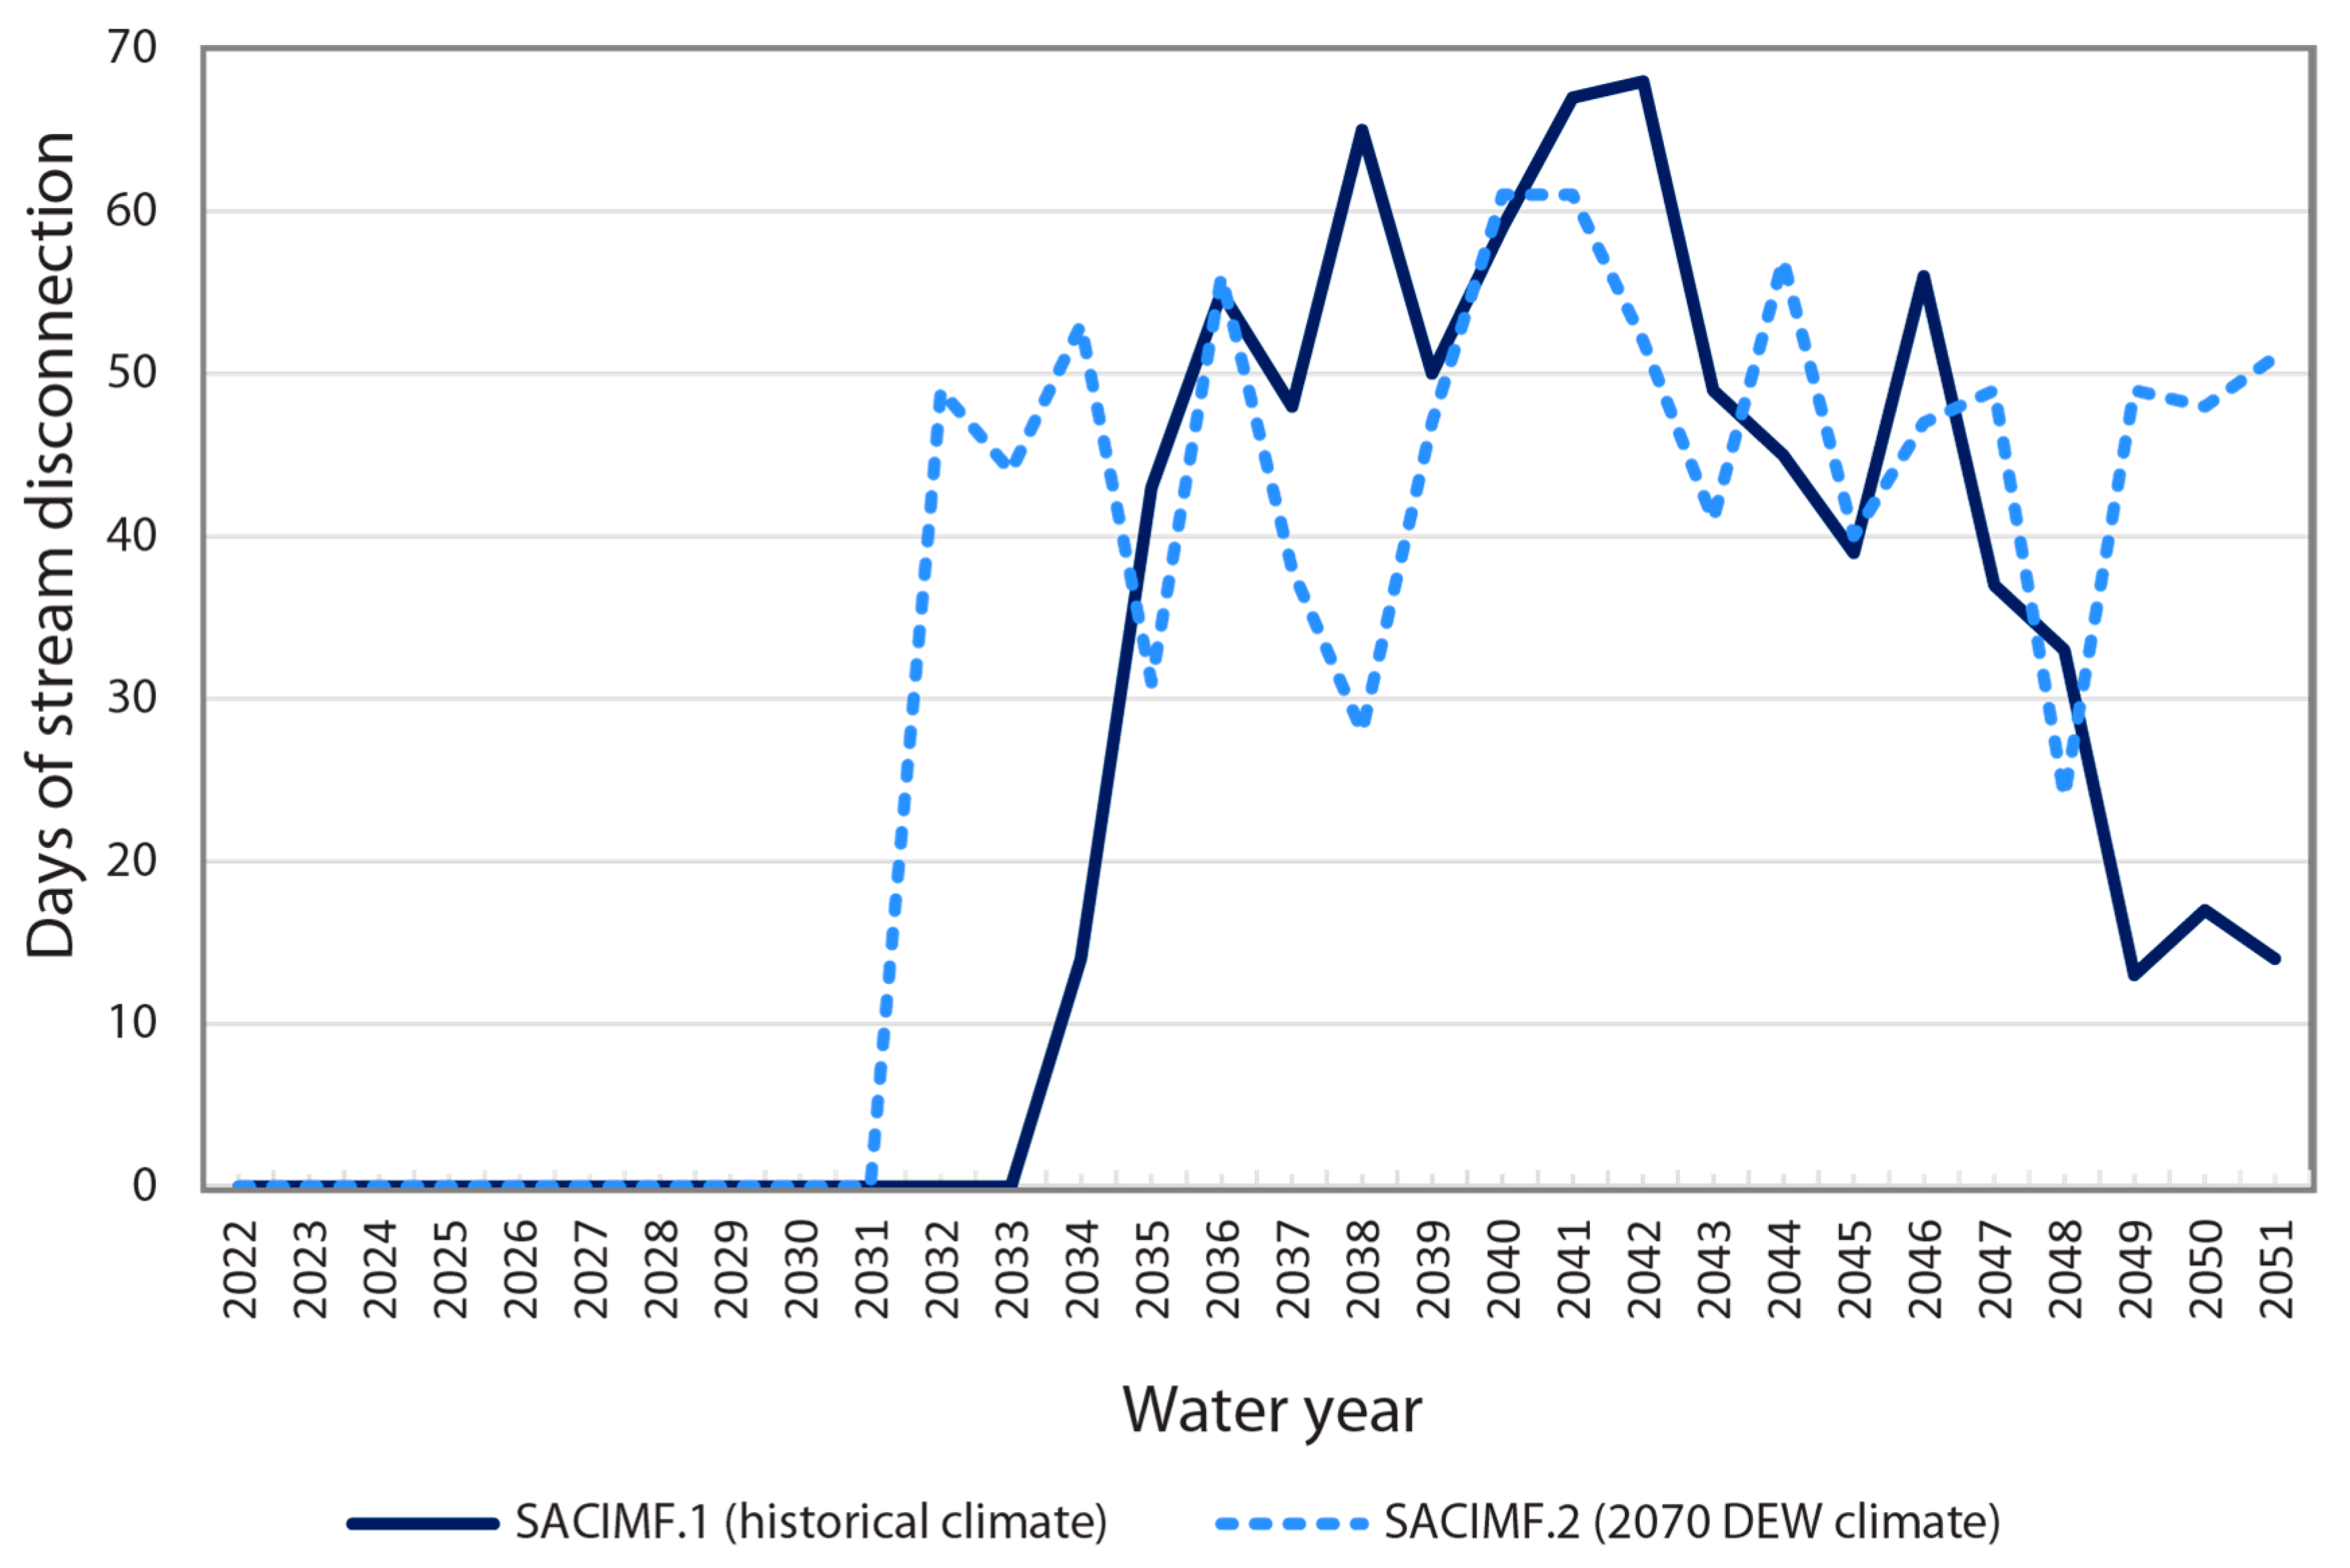
3.3.2. Stream Disconnection

Stream disconnection is of moderate importance to the tidewater goby and unarmored threespine stickleback fish, low importance to the California red-legged frog, and minimal importance to the two plant species (Table 1). Stream disconnection is a metric where streamflow approaches zero (assumed here to be less than a daily average flow rate of 2.8 × 10⁻⁹ cms). When streamflow approaches zero, the stream shifts from a flowing stream to a series of ponds connected, if at all, by hyporheic flow. When there is no streamflow, the stream is considered “disconnected”.
The impacts of stream disconnection are evaluated for the tidewater goby and unarmored threespine stickleback. Although the California red-legged frog is somewhat impacted by changes in stream disconnection, the adult life stage is not reliant on connected surface water reaches for mobility. Disconnection of stream reaches may prevent the tidewater goby from moving upstream or downstream along San Antonio Creek, between Barka Slough and the estuary at the Pacific Ocean, and may expose the unarmored threespine stickleback to elevated temperatures or greater predation risk.
The tidewater goby is most directly impacted by stream disconnection from April–May and from August–September. The unarmored threespine stickleback is most directly impacted from April–September (Table 1). To accommodate both species, stream disconnection is evaluated from April–September at the Casmalia streamgage for the tidewater goby (not plotted) and at the Barka Slough streamgage for the unarmored threespine stickleback (Figure 10).
Changes in stream disconnection during the future model period are not likely to affect the tidewater goby habitat. There were no days of stream disconnection at the Casmalia streamgage during the future model period, indicating that the tidewater goby habitat is unlikely to be affected during the April–September months of high impact. The tidewater goby is primarily observed between Barka Slough and the estuary at the outfall of San Antonio Creek and the Pacific Ocean. The fish will therefore be able to move freely upstream and downstream in San Antonio Creek between Barka Slough and the Pacific Ocean with no stream disconnection.
Changes in stream disconnection during the future model period are likely to affect the unarmored threespine stickleback habitat. Simulation results showed that stream disconnection occurred beginning in 2034 for SACIMF.1 and 2032 for SACIMF.2 (Figure 10). There was an average of 43 days per year of disconnection in SACIMF.1, and an average of 46 days per year of disconnection in SACIMF.2. Habitat conditions for the unarmored threespine stickleback are likely to degrade and the predation risk during periods of stream disconnection is likely to increase.
The years with stream disconnection correspond to years during which surface leakage was near zero (Figure 6B,C and Figure 10), indicating a likely correlation between stream disconnection and groundwater availability in Barka Slough. The relatively low number of days of disconnection in SACIMF.1 from 2049 to 2051 corresponds to years during which surface leakage was between 0.002 and 0.004 Mm3/yr (although still less than 0.004 Mm3/yr). To this end, the stream disconnection risk to the unarmored threespine stickleback habitat was relatively constant in SACIMF.2, whereas in SACIMF.1 the risk was more variable. The annual number of days of disconnection in SACIMF.2 ranged between 24 and 61 days, whereas the number of days in SACIMF.1 ranged between 14 and 68 days (Figure 10). The difference in the relative threat to habitat from each model, as represented by variability in the number of days of disconnection, is the result of the more variable historical climate signature (temperature and precipitation) in SACIMF.1 and the associated variability in groundwater flux.

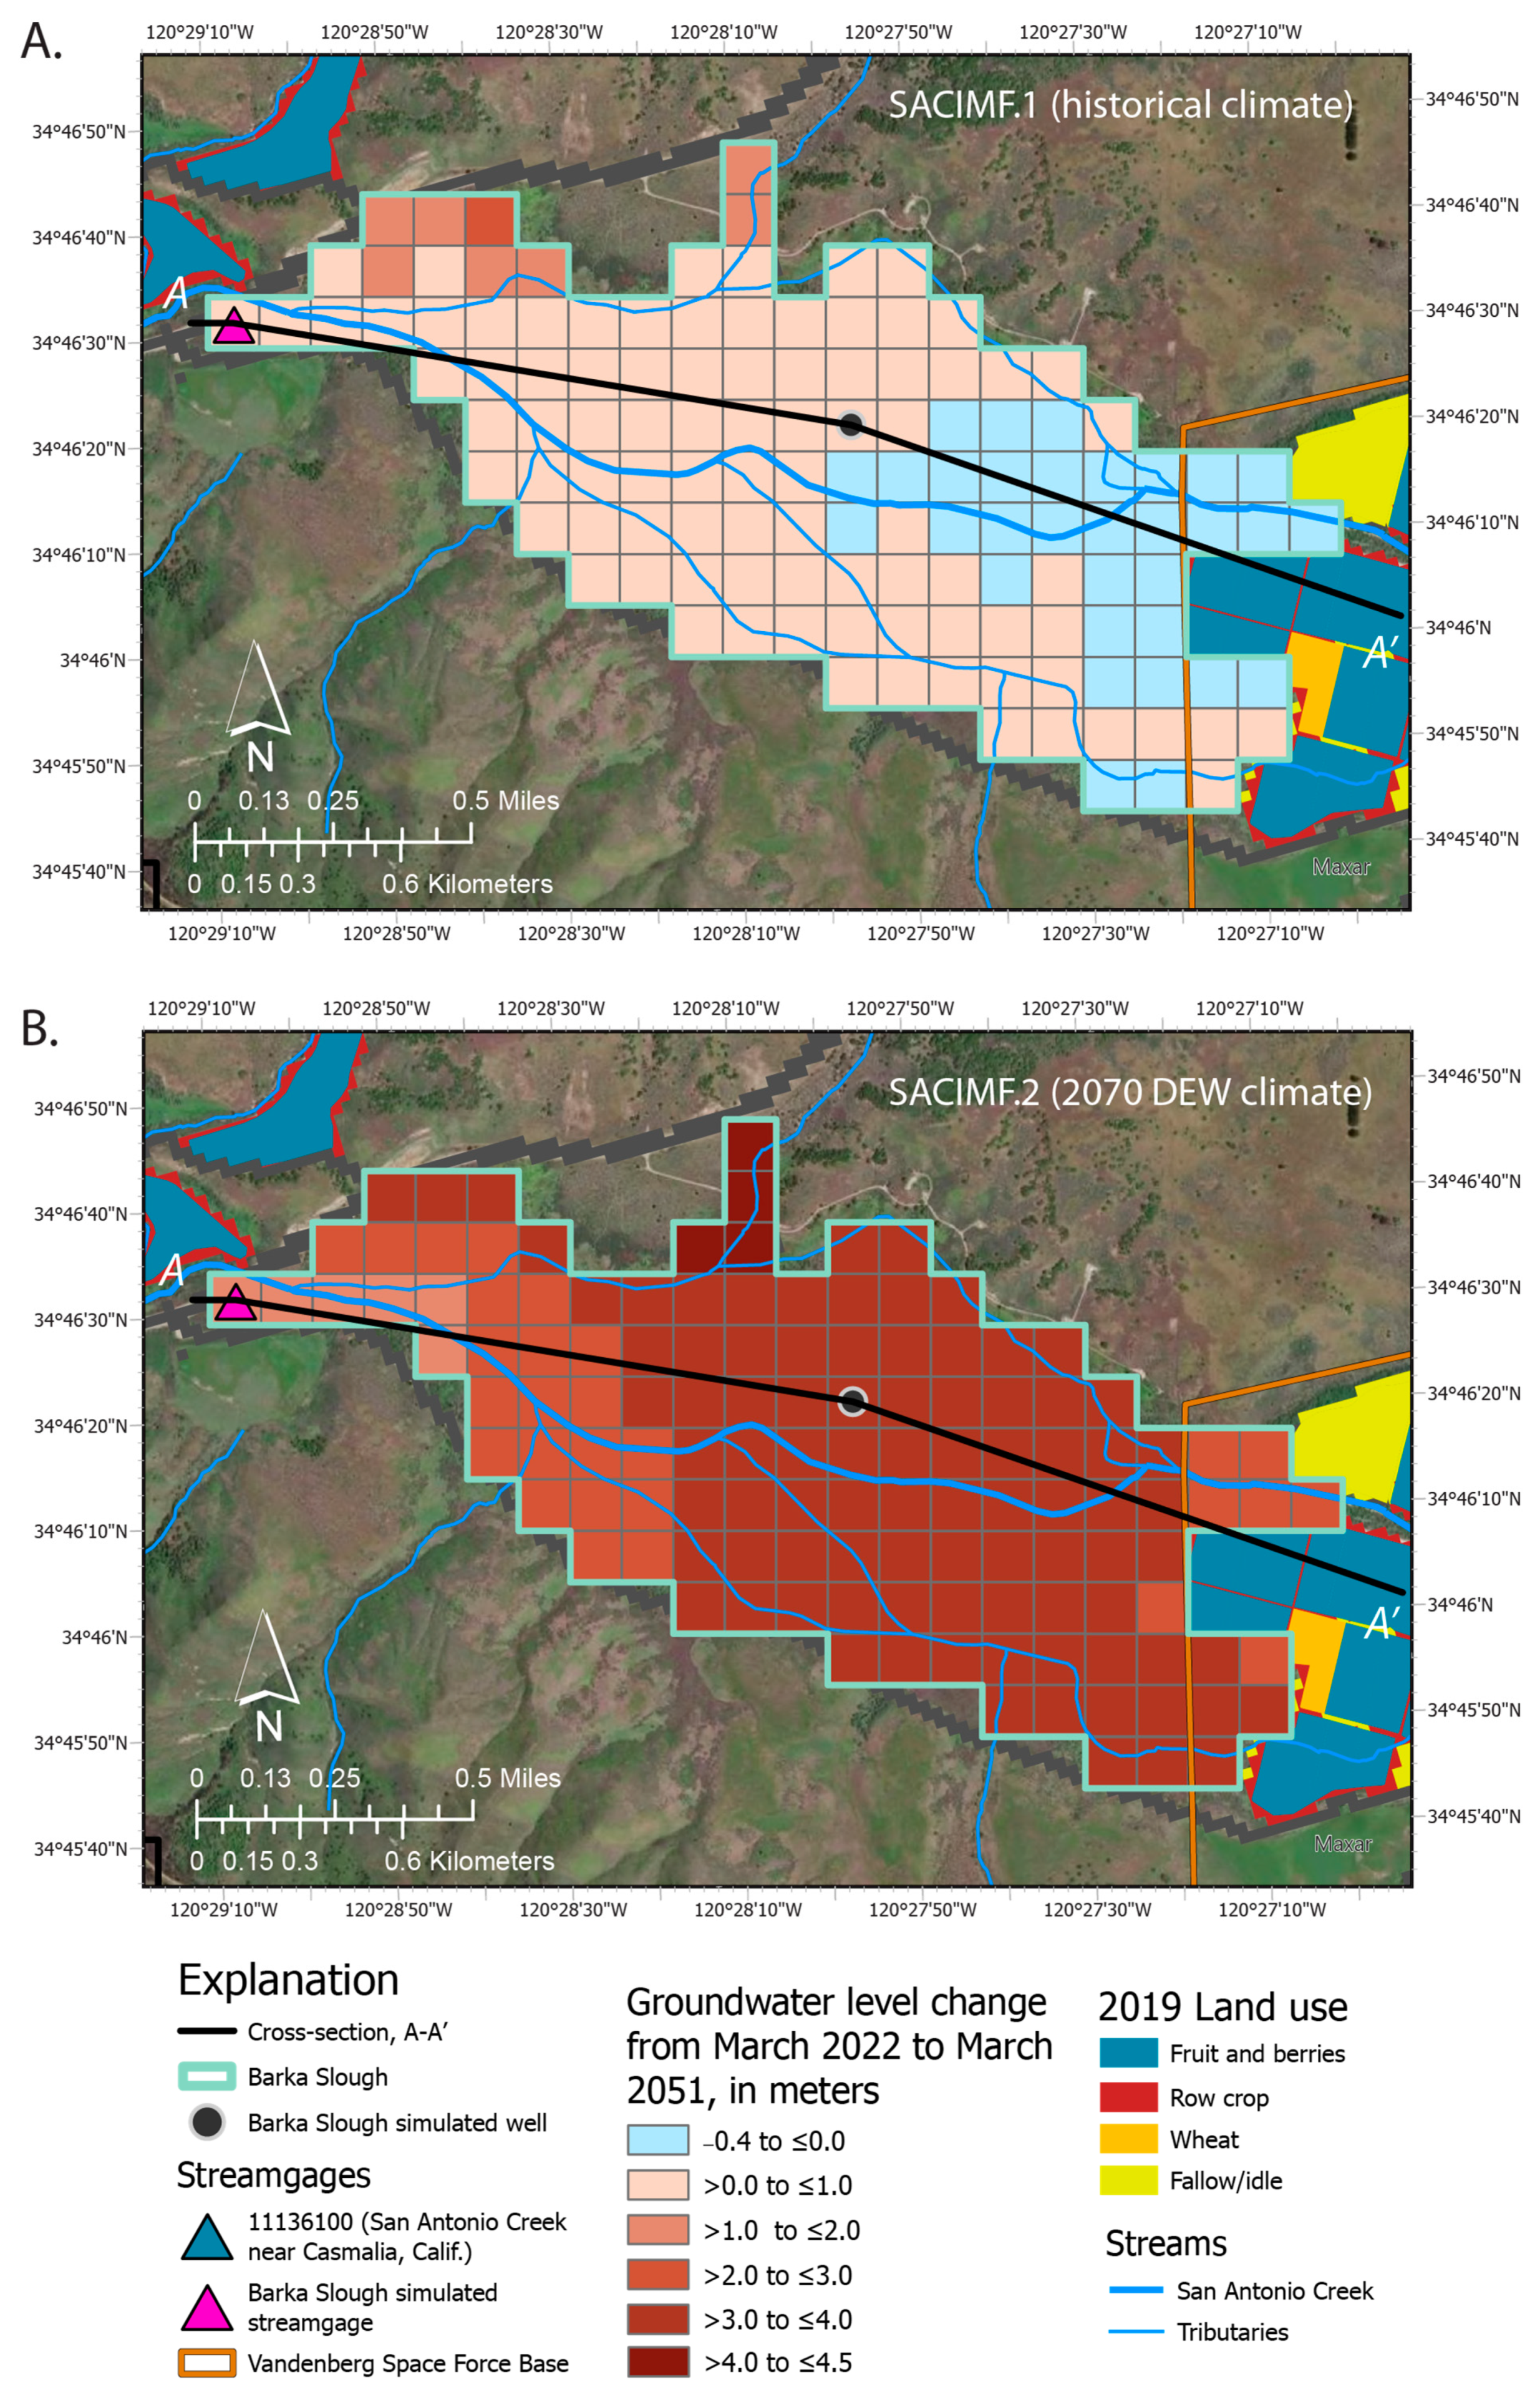
3.3.3. Depth to Groundwater

Depth to groundwater is of high importance to the Gambel’s watercress and the La Graciosa thistle plant species and of minimal importance to the three vertebrate taxa (Table 1). Depth to groundwater represents the potential for groundwater to support riparian vegetation from direct withdrawals of groundwater by plants through their root systems. Groundwater ET was used as a proxy for the potential of groundwater to support riparian plants in Barka Slough. Groundwater ET represents the amount of groundwater that is generally accessible to riparian plants and is estimated based on the assigned rooting depth of vegetation in the model. As groundwater gets deeper below the land surface, groundwater ET decreases, affecting the extent of wetland, marsh, and riparian habitats. If the groundwater table is below the root zone, then the simulated groundwater ET will be zero [20]; when this occurs, groundwater may no longer be a source of water for vegetation.
Gambel’s watercress and La Graciosa thistle are most directly impacted by declining depth to groundwater from April–July (Table 1; Appendix A). Changes in groundwater ET in Barka Slough were evaluated during the future model period by calculating the mean of monthly groundwater ET for April–July (Figure 11).
In the SACIMF, the minimum simulated rooting depth of vegetation within Barka Slough was 5.76 m below the land surface. The Gambel’s watercress and La Graciosa thistle, however, have rooting depths of about 1 m below the land surface. This difference in rooting depth between the model simulation and the two protected plant species means that if the model groundwater ET is zero, then Gambel’s watercress and La Graciosa thistle do not receive any groundwater contribution to their root zone. If the model groundwater ET is greater than zero, then the two plant species may or may not receive groundwater to their root zone, depending on the actual depth to groundwater. Even if there is no groundwater contribution to Gambel’s watercress and La Graciosa thistle, the plants may still be supported by streamflow, seasonal surface ponding, shallow infiltration from rain events, or other sources of water. These other impacts are not addressed in this study.
The Gambel’s watercress and La Graciosa thistle are likely to be affected by declining depth to groundwater under 2070 DEW climatic conditions (Figure 11). Groundwater ET in SACIMF.2 was effectively zero (less than 0.0006 Mm3/yr) from 2033 to 2039 and from 2044 to 2051. These results indicate that groundwater does not support riparian plants in Barka Slough during these years in SACIMF.2, at least from April–July. The statistical variability in groundwater ET during 2033–2039 and 2044–2051 is low, meaning that the depth to groundwater is typically below the root zone for the entirety of the April–July reproductive window. Riparian plants may still be supported by streamflow or other sources of water, but the aquatic habitat may be stressed without a groundwater contribution to the root zone.
Neither Gambel’s Watercress nor La Graciosa Thistle are currently found in Barka Slough; therefore, changes to depth to groundwater are not likely to result in direct threats to existing populations but could impact the potential for Barka Slough to be used as a restoration or reintroduction site for these species.
Groundwater ET in SACIMF.1 does not reach zero in any year (Figure 11), indicating that groundwater may support riparian plants from April–July. The available water for ET declines by over 50 percent in 2030–2043 with an increase in water availability starting in 2044 due to a wet climatic cycle that also corresponded to elevated groundwater levels (Figure 7) and streamflow (Figure 5) during this time. The statistical variability in groundwater ET in SACIMF.1 is greater than the variability in SACIMF.2, and groundwater ET in SACIMF.1 never reaches zero.

4. Discussion

This study highlights the hydrologic complexity of the SACVW, especially with respect to groundwater availability and groundwater–surface water interactions that occur at Barka Slough. These results show a continuation of net groundwater storage depletion in the SACVW and in Barka Slough, due to long-term and estimated future groundwater withdrawals. Adverse changes to groundwater–surface water interactions in Barka Slough are evident, with more substantial changes occurring under 2070 DEW climatic conditions. Estimates of groundwater availability are correlated with groundwater pumping and are therefore lower in SACIMF.2 compared to SACIMF.1 (Figure 4, Figure 6, Figure 7, Figure 8 and Figure 11). Estimates of surface water flow are correlated to precipitation, and the differences between the two models are more nuanced (Figure 5, Figure 9 and Figure 10).
Findings from this study are consistent with other work showing the long-term challenges associated with climate change, water availability, and aquatic species (such as [19,38]). Hydrologic controls can have both direct, immediate impacts on individual organisms, and also indirect, long-term impacts on the communities in which those organisms are enmeshed. For example, the habitat fragmentation through disconnection predicted for Barka Slough can not only inhibit migration and increase predation risk but also have other impacts such as leading to reduced genetic diversity and affecting long-term persistence [39]. Notably, in this study, only a subset of all species that rely on riparian habitats in Barka Slough were addressed. A variety of migratory bird species, including potentially the endangered southwestern willow flycatcher (Empidonax traillii extimus), could be impacted by changes to groundwater-dependent riparian vegetation [40]. Changes to streamflow and groundwater availability will likely more broadly affect Barka Slough riparian vegetation [41], with potential implications for all taxa included in this study, as well as birds and other taxa not included in this study [42].
Stakeholders in the SACVW can use this study to inform management decisions, at least with respect to the climatic and water use parameters instilled in future models. The model results show potential adverse conditions in three groundwater sustainability indicators defined in California’s Sustainable Groundwater Management Act. The three relevant sustainability indicators are (1) lowering groundwater levels (Figure 7 and Figure 8); (2) surface water depletion (Figure 5 and Figure 10); and (3) reduction in storage (Figure 4 and Figure 6). Stakeholders can evaluate the hydrologic outcomes of the two future models and consider actions to sustain future groundwater use.
This study was designed to explore potential impacts on aquatic habitats at Barka Slough, and as such, the only variable modified between the two future models was the climate input. All other variables were held constant. Changes to other model variables (such as land use, municipal or military pumping, or applied anthropogenic recharge) could be applied with different implications for water use and water availability and could exacerbate or ameliorate some of the simulated impacts on habitat suitability. Different model scenarios with changes in land use (such as conversion of agricultural land to urban land or fallowing of agricultural fields) could interact with climate variability to further alter the hydrology of the SACVW in various ways. For example, in the Netherlands, it has been demonstrated that limiting groundwater pumping and surface water withdrawals could improve groundwater availability while simultaneously reducing seepage fluxes [43] with variable impacts on riparian vegetation. This example highlights the complexities of groundwater-dependent ecosystems with anthropogenic impacts [19,44] and underscores research opportunities for watershed-level assessments when multiple, diverse species are considered (as in this study). A robust ecological monitoring program in the SACVW would be necessary to fully assess the impact of hydrologic changes. This study provides insight into hydrologic parameters that may be worth monitoring and which biological responses might be worth assessing.

5. Conclusions

This study evaluates the potential effects of future climatic conditions on water availability in Barka Slough and the effects of changing hydrologic conditions on protected species’ aquatic habitats. Barka Slough is a historically perennial wetland at the downstream western end of the San Antonio Creek Valley watershed (SACVW). The San Antonio Creek integrated model (SACIM) was extended to include water years 2019–2021. The extended model included climate, land use, surface water flow, groundwater pumpage, and groundwater-level data that was collected during the extended model period. The extended SACIM was then modified to simulate future hydrologic conditions for water years 2022–2051 to quantify and analyze the effects of different climate inputs on Barka Slough.
The future SACIM (SACIMF) utilized two climate inputs: (1) historical climate data from the last thirty years (SACIMF.1) and (2) the California Department of Water Resources updated, 2070-centered Drier Extreme Warming (2070 DEW) climate change scenario (SACIMF.2). SACIMF.2 had marginally greater amounts of monthly and annual precipitation, was more likely to have large precipitation events, and was warmer than SACIMF.1. The larger precipitation events and warmer temperatures simulated in SACIMF.2 are characteristic of the 2070 DEW, which predicts larger and more infrequent precipitation events and overall higher temperatures than historical climate records. The warmer climate of SACIMF.2 and the associated greater demand for water from agriculture and native vegetation resulted in a greater amount of groundwater removed from storage in the SACVW relative to SACIMF.1.
The simulated monthly streamflow along San Antonio Creek at Barka Slough varied seasonally and correlated with mean monthly and annual precipitation. Cumulative streamflow was greater in SACIMF.2 relative to SACIMF.1. However, streamflow approached zero in SACIMF.2 in most years after 2027, indicating that San Antonio Creek at Barka Slough may transition from perennial to intermittent during some future climatic conditions.
Groundwater from storage almost always exceeded groundwater to storage in Barka Slough. The rate of groundwater storage depletion in Barka Slough correlated primarily to changes in long-term groundwater pumpage in the SACVW. During the future model period (2022–2051), groundwater levels in the uppermost model layer at Barka Slough declined by a maximum of 2.1 m in SACIMF.1 and 4.5 m in SACIMF.2. Groundwater levels declined the least in parts of the slough along San Antonio Creek.
The direction of vertical groundwater flow in Barka Slough changed from an upward vertical flow gradient to a neutral groundwater flow gradient over the course of the entire simulation period. The change in the vertical groundwater flow direction is correlated with net groundwater storage depletion and is consistent with simulated declines in groundwater evapotranspiration, the cessation of surface leakage, and reductions in estimated baseflow to San Antonio Creek. A shift in vertical flow gradient, and corresponding changes in groundwater availability, may impact the perennial nature of Barka Slough and affect the aquatic habitats relied upon by federally listed species in and near the slough.
The relative impacts of future changes in water availability on each of the three habitat metrics for five federally listed species were qualitatively evaluated based on streamflow, stream disconnection, and depth to groundwater. Three of the five species are currently found in or near Barka Slough: the tidewater goby (Eucyclogobis newberryi), the unarmored threespine stickleback (Gasterosteus aculeatus williamsoni), and the California red-legged frog (Rana draytonii). The remaining two, Gambel’s watercress (Nasturtium gambelii), and La Graciosa thistle (Cirsium scariosum var. loncholepis), are not currently found in Barka Slough but are included in this study to better understand how changes to hydrology may impact the suitability of the Barka Slough as a site for potential restoration or reintroduction efforts. Each evaluated metric could directly impact at least one of the five species.
  • Changes to streamflow in San Antonio Creek under 2070 DEW climatic conditions may affect habitat for the tidewater goby and unarmored threespine stickleback. These species are adapted to variable streamflow and precipitation conditions, and, therefore, future changes to streamflow may have a limited impact on the species.
  • Changes to stream disconnection along San Antonio Creek are likely to affect the unarmored threespine stickleback. This fish may face poor habitat conditions and predation during periods when reaches of the creek are disconnected, and the fish may be constrained in seeking out refuge or more beneficial environmental conditions.
  • Changes in the depth to groundwater in Barka Slough under 2070 DEW conditions are likely to affect the Gambel’s watercress and La Graciosa thistle—these riparian plants are likely to be stressed without a groundwater contribution to the root zone and will need to rely solely on surface water or other sources of water.
Although this study focused on direct impacts on the federally listed species, broader ecological impacts are likely to occur. Simulated changes to streamflow and stream disconnection will likely impact aquatic organisms beyond protected fish and amphibian taxa, and a broader assessment of the ecological impacts of climate change on surface water–groundwater interactions may be warranted. Simulated changes to groundwater depth will likely have implications for vegetation throughout the Barka Slough watershed, affecting the persistence and distribution of riparian plants and wetland habitats in Barka Slough, which supports a wide range of breeding and nonbreeding birds.

Author Contributions

Conceptualization, G.C., D.P.C., M.J.Y. and J.D.L.; methodology, G.C., D.P.C., M.J.Y. and J.D.L.; software, D.P.C. and J.D.L.; validation, G.C., D.P.C. and J.D.L.; formal analysis, G.C. and M.J.Y.; investigation, G.C., D.P.C. and M.J.Y.; resources, G.C. and D.P.C.; data curation, G.C. and D.P.C.; writing—original draft preparation, G.C., D.P.C. and M.J.Y.; writing—review and editing, G.C., D.P.C., M.J.Y. and J.D.L.; visualization, G.C., D.P.C. and M.J.Y.; supervision, G.C.; project administration, G.C. and D.P.C.; funding acquisition, G.C. and D.P.C. All authors have read and agreed to the published version of the manuscript.

Funding

This research was cooperatively funded by the Santa Barbara County Water Agency and the U.S. Geological Survey.

Data Availability Statement

A USGS Data Release that includes model input data and outputs for both future San Antonio Creek integrated models [5] is available at https://doi.org/10.5066/P1VGXVD3.

Acknowledgments

The authors thank Vandenberg Space Force Base for their collaborative support of this project. The authors thank U.S. Geological Survey staff including Claudia Faunt, John Engott, Whitney Seymour, and Christiana Rosenberg. Any use of trade, firm, or product names is for descriptive purposes only and does not imply endorsement by the U.S. Government. This journal article has been peer reviewed and approved for publication consistent with USGS Fundamental Science Practices (https://pubs.usgs.gov/circ/1367/, accessed on 14 April 2025).

Conflicts of Interest

The authors declare no conflicts of interest. The funders had no role in the design of the study; in the collection, analyses, or interpretation of data; in the writing of the manuscript; or in the decision to publish the results.

Abbreviations

The following abbreviations are used in this manuscript:
SACVWSan Antonio Creek Valley watershed
2070 DEW2070-centered Drier Extreme Warming
SACIMSan Antonio Creek integrated model
SACIMFfuture San Antonio Creek integrated model
SACIMF.1future San Antonio Creek integrated model with historical climate inputs
SACIMF.2future San Antonio Creek integrated model with 2070 DEW climate inputs
ETevapotranspiration
kmkilometers
mmeters
cmscubic meters per second
Mm3/yrmillion cubic meters per year

Appendix A

A literature review of the federally listed species was conducted to identify hydrologic metrics that are most likely to affect the viability of each species in and near Barka Slough, San Antonio Creek Valley watershed, Santa Barbara County, California. Hereafter, federally listed protected species are referred to as “protected species”. Here, five protected species are identified that may be impacted by hydrologic variability within the Barka Slough basin along with a qualitative assessment of plausible impacts associated with different management scenarios. The five protected species are (1) the tidewater goby (Eucyclogobis newberryi) [6], (2) the unarmored threespine stickleback (Gasterosteus aculeatus williamsoni) [7,8], (3) the California red-legged frog (Rana draytonii) [9,10], (4) Gambel’s watercress (Nasturtium gambelii) [11,12], and (5) La Graciosa thistle (Cirsium scariosum var. loncholepis) [13,14]. To qualitatively assess the potential impacts of future climate, three key habitat metrics associated with streamflow and groundwater levels were identified and assessed with respect to the relative impacts of each of these metrics on each species throughout the year (Table 1).

Appendix A.1. Tidewater Goby

The tidewater goby (Eucyclogobius newberryi) is endemic to California and listed as Endangered under the United States Endangered Species Act. Tidewater gobies are found primarily in coastal lagoons, estuaries, and marshes [6,45]. Tidewater gobies spend all life stages in lagoons, estuaries, and river mouths and only enter marine environments when flushed out of these habitats by high outflow or storm events. Tidewater gobies are primarily an estuarine species; however, San Antonio Creek is a watershed where the tidewater goby has been observed several kilometers upstream of the estuary [46,47]. Changes to streamflow could impact the tidewater goby in the San Antonio Creek estuary, as they may affect salinity and dissolved oxygen dynamics in the estuary [48,49], particularly important during key reproductive periods (from late spring to late summer). Changes to streamflow could impact tidewater gobies’ use of San Antonio Creek, particularly if streamflow drops enough to result in disconnection, which would limit the ability of tidewater goby to freely migrate up- or downstream during reproductive windows.
The impact of changes to streamflow on the tidewater goby was rated high from April to September, with lower potential impacts before and after these months. The impact of increased disconnection on the tidewater goby was rated moderate at the beginning and end of the reproductive period when reproductive movements are most likely, and low during the rest of the reproductive window. Impacts of streamflow changes outside of this time period may exist but are less likely to directly impact the tidewater goby. Direct groundwater impacts are unlikely and are captured by changes to surface water flow.

Appendix A.2. Unarmored Threespine Stickleback

The unarmored threespine stickleback (Gasterosteus aculeatus williamsoni) is a subspecies of the threespine stickleback (Gasterosteus aculeatus) that is endemic to California and Baja California, Mexico, and listed as Threatened under the United States Endangered Species Act.
Unarmored threespine sticklebacks are freshwater fish found in slow-moving reaches or quiet water microhabitats in streams and rivers [7,8]. Unarmored threespine sticklebacks perennially live in the San Antonio Creek watershed [7,8], and reductions in streamflow would limit their available habitat. This is particularly important in low-flow seasons, as reductions in baseflow could increase the risk of poor habitat conditions (e.g., elevated temperature, reductions in dissolved oxygen) and predation. If streamflow declines to the point of disconnection, this could constrain the ability of individuals to seek out refuge or more beneficial environmental conditions.
The impact of changes to streamflow on the unarmored threespine stickleback was rated high from March to October, with lower potential impacts for the rest of the year. The impact of increased disconnection on the unarmored threespine stickleback was rated moderate during warmer months (April to September) with lower potential impacts before and after this time period. Impacts of streamflow changes outside of this time period may exist but are less likely to directly impact the unarmored threespine stickleback. Direct groundwater impacts are unlikely and are captured by changes to surface water flow.

Appendix A.3. California Red-Legged Frog

The California red-legged frog (Rana draytonii) is the largest native frog in the western United States (and listed as Threatened under the United States Endangered Species Act). California red-legged frogs are endemic to California and Baja California, Mexico, and their habitats are freshwater water sources such as streams, lakes, and marshes [9]. California red-legged frogs use aquatic habitats for breeding and rearing of tadpoles, while adults use aquatic and nearby terrestrial habitats [10]. Most frogs lay their eggs in March, with eggs taking about 20–22 days to develop into tadpoles and tadpoles requiring about 11–20 weeks to develop into terrestrial frogs [9]. In San Antonio Creek, California, red-legged frogs have been observed at every surveyed location, except along Highway 1 where the water is too shallow [9]. Water withdrawal in the area could affect the amount of permanent water in the creek and therefore the aquatic breeding and non-breeding habitats of the California red-legged frog.
The impact of changes to streamflow on the California red-legged frog was rated high from March to May, with moderate impacts through July, and lower potential impacts through October. The impact of increased disconnection on the California red-legged frog was rated low from April to June because the adult life stage is not reliant on connected surface water reaches for mobility. However, stream disconnection may increase predation risk or risk of elevated temperatures and could reduce the wetted surface area available for successful reproduction and rearing. Impacts of streamflow changes outside of this time period may exist but are less likely to directly impact the California red-legged frog. Direct groundwater impacts from groundwater depth are unlikely.

Appendix A.4. Gambel’s Watercress

Gambel’s watercress (Nasturtium gambelii) is endemic to California and listed as Endangered under the United States Endangered Species Act. Gambel’s watercress is a perennial herb and part of the mustard family. Gambel’s watercress is generally found in marshes, swamps, and other coastal wetland habitats, including streambanks and brackish marshes [11]. The population located along a tributary to San Antonio Creek on the Vandenberg Space Force Base is now considered the last pure population of the Gambel’s watercress [12]. The species can grow up to 1.8 m tall, with seedlings beginning to emerge in April and flowering primarily May–October. Specific information on the rooting depth of Gambel’s watercress was unavailable. We estimated that the maximum rooting depth may approximate the height of the plant. Gambel’s watercress is rhizomatous [12] and, therefore, has shallower rooting depths than La Graciosa thistle.
The impact of changes to streamflow on Gambel’s watercress was rated high from April to June and moderate from July to October, with lower impacts during the rest of the year. The impact of changes to groundwater depth was rated identically, with the strongest impacts during the sprouting and blooming period. Direct impacts of disconnection are unlikely. It should be noted that other shallow groundwater impacts are possible, due to seasonal surface ponding or penetration from rain events, and these impacts are not addressed in this effort.

Appendix A.5. La Graciosa Thistle

La Graciosa thistle (Cirsium scariosum var. loncholepis) is endemic to California and listed as Endangered under the United States Endangered Species Act. We use the common name and species name listed above because those names are listed in the United States Endangered Species Act documentation [13,14]. We note that the Integrated Taxonomic Information System (www.itis.gov, accessed 13 March 2025) uses a different species name, Cirsium scariosum var. citrinum, with taxonomic serial number 780856.
La Graciosa thistle, a perennial member of the sunflower family, is generally found in areas with intermediate or medium moisture conditions (marshes, wetlands, and drainages) in backdune and coastal wetlands. In the San Antonio Creek area, La Graciosa thistle can be found along drainages and tributaries [13,14]. Individual La Graciosa thistles generally live between two and six years, flower once, and die shortly thereafter, with flowering occurring in April through September. Specific information on the rooting depth of La Graciosa thistle was unavailable, but C. scariosum is a taprooting species [50]. We estimated that maximum rooting depth may approximate the height of the plant (about 1 m tall).
The impact of changes to streamflow on La Graciosa thistle was rated high from April to July, moderate from August to September, and lower for the rest of the year. The impact of changes to groundwater depth was rated identically, with the strongest impacts during the blooming period. Direct impacts of disconnection are unlikely. It should be noted that other shallow groundwater impacts are possible, due to seasonal surface ponding or penetration from rain events, and these impacts are not addressed in this effort.

References

  1. Cromwell, G.; Sweetkind, D.S.; Densmore, J.N.; Engott, J.A.; Seymour, W.A.; Larsen, J.D.; Ely, C.P.; Stamos, C.L.; Faunt, C.C. Hydrogeologic Characterization of the San Antonio Creek Valley Watershed, Santa Barbara County, California; Scientific Investigations Report 2022-5001; U.S. Geological Survey: Reston, VA, USA, 2022; p. 124. Available online: https://pubs.usgs.gov/publication/sir20225001 (accessed on 24 May 2023).
  2. Flint, L.E.; Flint, A.L. Simulation of Climate Change in San Francisco Bay Basins, California: Case Studies in the Russian River Valley and Santa Cruz Mountains; U.S. Geological Survey Scientific Investigations Report 2012-5132; U.S. Geological Survey: Reston, VA, USA, 2012; p. 55. [CrossRef]
  3. Martin, P. Development and Calibration of a Two-Dimensional Digital Model for the Analysis of the Ground-Water Flow System in the San Antonio Creek Valley, Santa Barbara County, California; U.S. Geological Survey Water-Resources Investigation Report 84-4340; U.S. Geological Survey: Reston, VA, USA, 1985. [CrossRef]
  4. Woolfenden, L.R.; Engott, J.A.; Larsen, J.D.; Cromwell, G. Simulation of Groundwater and Surface-Water Resources of the San Antonio Creek Valley Watershed, Santa Barbara County, California; U.S. Geological Survey Scientific Investigations Report 2021-5139; U.S. Geological Survey: Reston, VA, USA, 2022; p. 76. [CrossRef]
  5. Culling, D.; Larsen, J.D.; Engott, J.A.; Seymour, W.A.; Cromwell, G. GSFLOW model to extend the San Antonio Creek Integrated Model and simulate future water availability scenarios, San Antonio Creek Valley watershed, Santa Barbara County, California; U.S. Geological Survey Data Release; USGS: Reston, VA, USA, 2025. [CrossRef]
  6. US Fish and Wildlife Service. Recovery Plan for the Tidewater Goby (Eucyclogobius newberryi); U.S. Fish and Wildlife Service: Portland, OR, USA, 2005; p. 205. Available online: https://ecos.fws.gov/docs/recovery_plan/051207.pdf (accessed on 13 February 2023).
  7. US Fish and Wildlife Service. Unarmored Three-Spine Stickleback Recovery Plan (Revised); U.S. Fish and Wildlife Service: Portland, OR, USA, 1985; p. 90. Available online: https://ecos.fws.gov/docs/recovery_plan/Revised%20UTS%20RP.pdf (accessed on 6 January 2023).
  8. US Fish and Wildlife Service. Unarmored Three-Spine Stickleback (Gasterosteus aculeatus williamsoni) 5-Year Review: Summary and Evaluation; Ventura Fish and Wildlife Office: Ventura, CA, USA, 2021; p. 21. Available online: https://ecos.fws.gov/docs/tess/species_nonpublish/944.pdf (accessed on 6 January 2023).
  9. US Fish and Wildlife Service. Recovery Plan for the California Red-legged Frog (Rana aurora draytonii); U.S. Fish and Wildlife Service: Portland, OR, USA, 2002; p. 180. Available online: https://ecos.fws.gov/docs/recovery_plan/020528.pdf (accessed on 6 January 2023).
  10. US Fish and Wildlife Service. California Redlegged Frog (Rana draytonii) 5-Year Review: Summary and Evaluation; U.S. Fish and Wildlife Service: Sacramento, CA, USA, 2022; p. 44. Available online: https://ecos.fws.gov/docs/tess/species_nonpublish/4025.pdf (accessed on 6 January 2023).
  11. US Fish and Wildlife Service. Recovery Plan for Marsh Sandwort (Arenaria Paludicola) and Gambel’s Watercress (Rorippa Gambelii); US Fish and Wildlife Service: Portland, OR, USA, 1998; p. 63. Available online: https://ecos.fws.gov/docs/recovery_plan/980928b.pdf (accessed on 26 January 2023).
  12. US Fish and Wildlife Service. Gambel’s Watercress (Nasturtium gambelii [Rorippa gambellii]) 5-Year Review: Evaluation and Summary; U.S. Fish and Wildlife Service: Ventura, CA, USA, 2022; p. 14. Available online: https://ecos.fws.gov/docs/tess/species_nonpublish/3673.pdf (accessed on 26 January 2023).
  13. US Fish and Wildlife Service. Cirsium loncholepis [Cirsium scariosum var. loncholepis] (La Graciosa thistle) 5-Year Review: Evaluation and Summary; U.S. Fish and Wildlife Service: Ventura, CA, USA, 2011; p. 36. Available online: https://ecos.fws.gov/docs/tess/species_nonpublish/1716.pdf (accessed on 20 January 2023).
  14. US Fish and Wildlife Service. La Graciosa Thistle (Cirsium scariosum var. loncholepis) Recovery Plan; U.S. Fish and Wildlife Service: Ventura, CA, USA, 2021; p. 14. Available online: https://ecos.fws.gov/docs/recovery_plan/Recovery%20Plan%20for%20La%20Graciosa%20Thistle.pdf (accessed on 20 January 2023).
  15. California Department of Water Resources. 1996 South Central Coast Land Use Survey; California Department of Water Resources: Sacramento, CA, USA, 2000. Available online: https://water.ca.gov/Programs/Water-Use-And-Efficiency/Land-And-Water-Use/Land-Use-Surveys (accessed on 1 November 2018).
  16. California Department of Conservation. Farmland Mapping & Monitoring Program; California Department of Conservation: Sacramento, CA, USA, 2018. Available online: https://www.conservation.ca.gov/dlrp/fmmp (accessed on 26 October 2018).
  17. Muir, K.S. Geology and Ground Water of San Antonio Creek Valley, Santa Barbara County, California; U.S. Geological Survey Professional Paper 1664; USGS: Reston, VA, USA, 1964; p. 53. [CrossRef]
  18. Hutchinson, C.B. Appraisal of Groundwater Resources in the San Antonio Creek Valley, Santa Barbara County, California; U.S. Geological Survey Open-File Report 80–750; USGS: Reston, VA, USA, 1980; p. 48. [CrossRef]
  19. Kløve, B.; Ala-Aho, P.; Bertrand, G.; Gurdak, J.J.; Kupfersberger, H.; Kværner, J.; Muotka, T.; Mykrä, H.; Preda, E.; Rossi, P.; et al. Climate change impacts on groundwater and dependent ecosystems. J. Hydrol. 2014, 518, 250–266. [Google Scholar] [CrossRef]
  20. Markstrom, S.L.; Niswonger, R.G.; Regan, R.S.; Prudic, D.E.; Barlow, P.M. GSFLOW-Coupled Ground-Water Surface-Water Flow Model Based on the Integration of the Precipitation-Runoff Modeling System (PRMS) and the Modular Ground-Water Flow Model (MODFLOW-2005); U.S. Geological Survey Techniques and Methods 6–D1; USGS: Reston, VA, USA, 2008; p. 240. [CrossRef]
  21. Regan, R.S.; Niswonger, R.G. GSFLOW Version 2.2.0—Coupled Groundwater and Surface-Water Flow Model; U.S. Geological Survey Software Release; USGS: Reston, VA, USA, 2021.
  22. California Department of Water Resources. 2070 Extreme Climate Change Scenarios for Water Supply Planning; California Department of Water Resources: Sacramento, CA, USA, 2020. Available online: https://data.ca.gov/dataset/2070-extreme-climate-change-scenarios-for-water-supply-planning (accessed on 18 February 2023).
  23. California Irrigation Management Information System. CIMIS Station Reports. 2017. Available online: https://cimis.water.ca.gov/ (accessed on 24 February 2023).
  24. National Centers for Environmental Information. Global Historical Climatology Network—Daily, Ver. 3. 2022. Available online: https://www.ncei.noaa.gov/access/search/data-search/daily-summaries (accessed on 31 August 2022).
  25. Santa Barbara County. Daily Rainfall Data. 2022. Available online: https://www.countyofsb.org/2328/Daily-Rainfall-Data-XLS (accessed on 31 August 2022).
  26. California Department of Water Resources. SGMA Data Viewer: California Department of Water Resources Sustainable Groundwater Management Program; California Department of Water Resources: Sacramento, CA, USA, 2022. Available online: https://www.water.ca.gov/Programs/Groundwater-Management/Data-and-Tools (accessed on 25 October 2022).
  27. US Geological Survey. USGS Water Data for the Nation; U.S. Geological Survey National Water Information System Database; USGS: Reston, VA, USA, 2022. [CrossRef]
  28. Larsen, J.D.; Alzraiee, A.; Niswonger, R. pyGSFLOW v100: U.S. Geological Survey Software Release; USGS: Reston, VA, USA, 2021. [CrossRef]
  29. Larsen, J.D.; Alzraiee, A.H.; Martin, D.; Niswonger, R.G. Rapid model development for GSFLOW with Python and pyGSFLOW. Front. Earth Sci. 2022, 10. [Google Scholar] [CrossRef]
  30. Larsen, J.D.; Alzraiee, A.; Niswonger, R.G. Integrated hydrologic model development and postprocessing for GSFLOW using pyGSFLOW. J. Open Source Softw. 2022, 7, 3852. [Google Scholar] [CrossRef]
  31. Hughes, J.D.; Langevin, C.D.; Paulinski, S.R.; Larsen, J.D.; Brakenhoff, D. FloPy Workflows for Creating Structured and Unstructured MODFLOW Models. Groundwater 2023, 62, 124–139. [Google Scholar] [CrossRef] [PubMed]
  32. Bakker, M.; Post, V.; Hughes, J.D.; Langevin, C.D.; White, J.T.; Leaf, A.T.; Paulinski, S.R.; Bellino, J.C.; Morway, E.D.; Toews, M.W.; et al. FloPy v3.7.0: U.S. Geological Survey Software Release; USGS: Reston, VA, USA, 2024. [CrossRef]
  33. California Department of Water Resources. Statewide Crop Mapping GIS Shapefile; California Department of Water Resources: Sacramento, CA, USA, 2019. Available online: https://data.cnra.ca.gov/dataset/statewide-crop-mapping/resource/1da7b37a-dd97-4b69-a86a-fe824a252eaf (accessed on 15 August 2022).
  34. LANDFIRE 2020 Update. Existing Vegetation Type Layer, LANDFIRE 2.2.0: U.S. Department of the Interior, U.S. Geological Survey. 2022. Available online: https://landfire.gov/version_download.php (accessed on 22 August 2022).
  35. Markstrom, S.L.; Regan, R.S.; Hay, L.E.; Viger, R.J.; Webb, R.M.T.; Payn, R.A.; LaFontaine, J.H. PRMS-IV, the Precipitation-Runoff Modeling System, Version 4; U.S. Geological Survey Techniques and Methods 6–B7; USGS: Reston, VA, USA, 2015; p. 158. [CrossRef]
  36. US Geological Survey. National Hydrography Dataset (Ver. USGS Hydrography Dataset Best Resolution (NHD) for Hydrologic Unit (HU) 8-18060009 (Published 20161230)); USGS: Reston, VA, USA, 2016. Available online: https://www.usgs.gov/national-hydrography/national-hydrography-dataset (accessed on 19 January 2017).
  37. Feng, D.; Beighley, E.; Raoufi, R.; Melack, J.; Zhao, Y.; Iacobellis, S.; Cayan, D. Propagation of future climate conditions into hydrologic response from coastal southern California watersheds. Clim. Change 2019, 153, 199–218. [Google Scholar] [CrossRef]
  38. Falke, J.A.; Fausch, K.D.; Magelky, R.; Aldred, A.; Durnford, D.S.; Riley, L.K.; Oad, R. The role of groundwater pumping and drought in shaping ecological futures for stream fishes in a dryland river basin of the western Great Plains, USA. Ecohydrology 2011, 4, 682–697. [Google Scholar] [CrossRef]
  39. Gido, K.B.; Whitney, J.E.; Perkin, J.S.; Turner, T.F. Fragmentation, connectivity and fish species persistence in freshwater ecosystems. Conserv. Freshw. Fishes 2016, 292–323. [Google Scholar] [CrossRef]
  40. Brand, L.A.; Stromberg, J.C.; Goodrich, D.C.; Dixon, M.D.; Lansey, K.; Kang, D.; Brookshire, D.S.; Cerasale, D.J. Projecting avian response to linked changes in groundwater and riparian floodplain vegetation along a dryland river: A scenario analysis. Ecohydrology 2011, 4, 130–142. [Google Scholar] [CrossRef]
  41. Stromberg, J.C.; Tiller, R.; Richter, B. Effects of groundwater decline on riparian vegetation of semiarid regions: The San Pedro, Arizona. Ecol. Appl. 1996, 6, 113–131. [Google Scholar] [CrossRef]
  42. Breininger, D.R. Survey for Least Bell’s Vireo in Riparian Habitat on Vandenberg Air Force Base, Santa Barbara County, California; No. BIO-1; NASA: Kennedy Space Center, FL, USA, 1988. Available online: https://ntrs.nasa.gov/api/citations/19880017360/downloads/19880017360.pdf (accessed on 1 August 2024).
  43. van der Knaap, Y.A.; de Graaf, M.; van Ek, R.; Witte JP, M.; Aerts, R.; Bierkens, M.F.; van Bodegom, P.M. Potential impacts of groundwater conservation measures on catchment-wide vegetation patterns in a future climate. Landsc. Ecol. 2015, 30, 855–869. [Google Scholar] [CrossRef]
  44. Lennox, R.J.; Crook, D.A.; Moyle, P.B.; Struthers, D.P.; Cooke, S.J. Toward a better understanding of freshwater fish responses to an increasingly drought-stricken world. Rev. Fish Biol. Fish. 2019, 29, 71–92. [Google Scholar] [CrossRef]
  45. Moyle, P.B. Inland Fishes of California: Revised and Expanded; University of California Press: Berkeley, CA, USA, 2002. [Google Scholar]
  46. Irwin, J.; Soltz, D. The Natural History of the Tidewater Goby, Eucyclogobius newberryi, in the San Antonio and Shuman Creek Systems, Santa Barbara County, California; Sacramento Endangered Species Office, US Fish and Wildlife Service: Sacramento, CA, USA, 1984. [Google Scholar]
  47. Swift, C.; Duangsitti, P.; Clemente, C.; Hasserd, K.; Valle, L. Biology and Distribution of the Tidewater Goby, Eucyclogobius newberryi, on Vandenberg Air Force Base, Santa Barbara County, California; Final Report; USNBS Cooperative Agreement Contributions in Science: Los Angeles, CA, USA, 1997; 121p, ISBN 1445-007-94-8129. [Google Scholar]
  48. Swift, C.C. Biology and distribution of the tidewater goby, Eucyclogobius newberryi (Pisces: Gobiidae) of California. Contrib. Sci. 1989, 404, 1–19. [Google Scholar] [CrossRef]
  49. Swift, C.C.; Baskin, J.N.; Haglund, T.R. The Status and Distribution of the Tidewater Goby, Eucyclogobius Newberryi (Pisces, Gobiidae) on MCB Camp Pendleton, California; San Marino Environmental Associates: San Marino, CA, USA, 1994. [Google Scholar]
  50. Debinski, D.M.; Wickham, H.; Kindscher, K.; Caruthers, J.C.; Germino, M. Montane meadow change during drought varies with background hydrologic regime and plant functional group. Ecology 2010, 91, 1672–1681. [Google Scholar] [CrossRef] [PubMed]
Figure 1. Map of the study area showing (A), the San Antonio Creek Valley watershed in Santa Barbara County, California, with 2019 land use [5], as well as military and municipal pumping areas; and (B), Barka Slough, Santa Barbara County, California. Cross-section A-A’ is shown in Figure 2. Basemap credit for A, EarthStar Geographics 2025; for B, Maxar 2025.
Water 17 01238 g001
Figure 2. Cross-section through Barka Slough, Santa Barbara County, California, showing hydrogeologic units [1] and San Antonio Creek integrated hydrologic model layers [4]. Cross-section location shown in Figure 1B.
Water 17 01238 g002
Figure 3. Simulated precipitation and temperature from the future San Antonio Creek integrated model versions 1 and 2 (SACIMF.1 and SACIMF.2) [5] during water years 2022–2051. Precipitation and temperature simulated at the town of Los Alamos (Figure 1). (A) Annual precipitation; (B) monthly mean precipitation; and (C) monthly mean temperature. SACIMF.1 uses historical climate inputs, SACIMF.2 uses the 2070 Drier Extreme Warming (2070 DEW) climate inputs [22].
Water 17 01238 g003
Figure 4. Groundwater budget and cumulative groundwater storage in the San Antonio Creek valley watershed, Santa Barbara County, California, for water years 1948–2051 from the future San Antonio Creek integrated hydrologic model versions 1 and 2 (SACIMF.1 and SACIMF.2) [5]. (A) SACIMF.1 and (B) SACIMF.2. SACIMF.1 uses historical climate inputs, SACIMF.2 uses the 2070 Drier Extreme Warming climate inputs [22].
Water 17 01238 g004
Figure 5. Streamflow along San Antonio Creek, Santa Barbara County, California, at Barka Slough simulated streamgage for water years 2022–2051 from the future San Antonio Creek integrated hydrologic model versions 1 and 2 (SACIMF.1 and SACIMF.2) [5]. SACIMF.1 uses historical climate inputs, SACIMF.2 uses the 2070 Drier Extreme Warming (2070 DEW) climate inputs [22].
Water 17 01238 g005
Figure 6. Groundwater budget and cumulative groundwater storage in Barka Slough, San Antonio Creek Valley watershed, Santa Barbara County, California, from the future San Antonio Creek integrated model versions 1 and 2 (SACIMF.1 and SACIMF.2) [5]. (A) Groundwater budget for water years 1948–2051 with cumulative groundwater storage for SACIMF.1 and SACIMF.2; (B) groundwater budget and cumulative storage from SACIMF.1 for 2022–2051; and (C) groundwater budget and cumulative storage from SACIMF.2 for 2022–2051. SACIMF.1 uses historical climate inputs, SACIMF.2 uses the 2070 Drier Extreme Warming (2070 DEW) climate inputs [22].
Water 17 01238 g006
Figure 7. Groundwater-level elevations at the Barka Slough simulated well, San Antonio Creek Valley watershed, Santa Barbara County, California, for water years 1948–2051 from the future San Antonio Creek integrated model versions 1 and 2 (SACIMF.1 and SACIMF.2) [5]. Simulated well location is shown in Figure 1B and Figure 8, and model layers and hydrogeologic units represented in the well are shown in Figure 2. SACIMF.1 uses historical climate inputs, SACIMF.2 uses the 2070 Drier Extreme Warming (2070 DEW) climate inputs [22].
Water 17 01238 g007
Figure 8. Simulated changes in groundwater-levels in Barka Slough, San Antonio Creek Valley watershed, Santa Barbara County, California, from March 2022–March 2051 from the future San Antonio Creek integrated model. (A) version 1 (SACIMF.1); and (B) version 2 (SACIMF.2) [5]. SACIMF.1 uses historical climate inputs, SACIMF.2 uses the 2070 Drier Extreme Warming (2070 DEW) climate inputs [22]. Shown with 2019 land use [5]. Cross-section A-A’ is shown in Figure 2. Basemap credit, Maxar 2025.
Water 17 01238 g008
Figure 9. Mean monthly streamflow (the mean of simulated daily streamflow within a month) in cubic meters per second (cms) at the Barka Slough simulated streamgage, San Antonio Creek Valley watershed, Santa Barbara County, California, for water years 2022–2051 from the future San Antonio Creek integrated model versions 1 and 2 (SACIMF.1 and SACIMF.2) [5] for March––September. Simulated streamgage location is shown in Figure 1B and Figure 8. SACIMF.1 uses historical climate inputs, SACIMF.2 uses the 2070 Drier Extreme Warming (2070 DEW) climate inputs [22].
Water 17 01238 g009
Figure 10. Stream disconnection at the Barka Slough simulated streamgage, San Antonio Creek Valley watershed, Santa Barbara County, California, for water years 2022–2051 from the future San Antonio Creek integrated model versions 1 and 2 (SACIMF.1 and SACIMF.2) for April–September [5]. Stream disconnection is defined when streamflow approaches zero, less than 2.8 × 10⁻⁹ cubic meters per second per day. SACIMF.1 uses historical climate inputs, SACIMF.2 uses the 2070 Drier Extreme Warming (2070 DEW) climate inputs [22].
Water 17 01238 g010
Figure 11. Groundwater evapotranspiration at Barka Slough, San Antonio Creek Valley watershed, Santa Barbara County, California, for water years 2022–2051 from the future San Antonio Creek integrated model versions 1 and 2 (SACIMF.1 and SACIMF.2) for April–July [5]. SACIMF.1 uses historical climate inputs, SACIMF.2 uses the 2070 Drier Extreme Warming (2070 DEW) climate inputs [22].
Water 17 01238 g011
Table 1. Qualitative impacts of habitat metrics on protected species found in or around Barka Slough, San Antonio Creek Valley watershed, Santa Barbara County, California. Impacts of habitat metrics on each species are rated by relative severity for each month. Detailed information on each species and the role of each habitat metric can be found in Appendix A. Habitat metric abbreviations: S; streamflow; SD, stream disconnection; DtG, depth to groundwater.
SpeciesDescriptionHabitat MetricImpact Severity
JanFebMarAprMayJunJulAugSepOctNovDec
Tidewater goby, Eucyclogobius newberryiEstuarine fish found in San Antonio Creek and its estuary. Endangered [6]. S
SD
DtG
Unarmored threespine stickleback, Gasterosteus aculeatus williamsoniFreshwater and brackish fish found in San Antonio Creek and Barka Slough. Threated [7,8].S
SD
DtG
California red-legged frog, Rana draytoniiThe largest native frog in the western United States. Threatened [9,10].S
SD
DtG
Gambel’s watercress, Nasturtium gambeliiPerennial marsh and riparian plant found in an upstream tributary to San Antonio Creek. Endangered [11].S
SD
DtG
La Graciosa thistle, Cirsium scariosum var. loncholepisPerennial wetland plant. Endangered [13,14].S
SD
DtG
High impactModerate impactLow impactMinimal impact
Table 2. Simulated groundwater budget components for San Antonio Creek valley watershed, Santa Barbara County, California, for water years 2022–2051 from the future San Antonio Creek integrated model versions 1 and 2 (SACIMF.1 and SACIMF.2) [5]. SACIMF.1 uses historical climate inputs, SACIMF.2 uses the 2070 Drier Extreme Warming climate inputs [22].
BudgetsSACIMF.1SACIMF.2
Total Flux for 2022–2051Average Annual Flux for 2022–2051Total Flux for 2022–2051Average Annual Flux for 2022–2051
Groundwater inflow components, in millions of cubic meters
Boundary flow 7.546 0.252 8.764 0.292
Stream Leakage 172.215 5.741 172.667 5.765
Recharge 292.695 9.990 293.231 9.774
Total inflow 479.457 15.982 474.662 15.822
Groundwater outflow components, in millions of cubic meters
Groundwater evapotranspiration −4.265 −0.142 −2.495 −0.083
Surface leakage −3.431 −0.114 −3.263 −0.109
Municipal and military pumping −34.961 −1.165 −34.961 −1.165
Agricultural pumping −790.453 −26.348 −861.543 −28.718
Total outflow −833.110 −27.770 −902.262 −30.075
Net groundwater storage −353.758 −11.792 −427.755 −14.258
Table 3. Simulated groundwater budget components for Barka Slough, San Antonio Creek Valley watershed, Santa Barbara County, California, for water years 2022–2051 from the future San Antonio Creek integrated model versions 1 and 2 (SACIMF.1 and SACIMF.2) [5]. SACIMF.1 uses historical climate inputs, SACIMF.2 uses the 2070 Drier Extreme Warming climate inputs [22].
BudgetsSACIMF.1SACIMF.2
Total Flux for 2022–2051Average Annual Flux for 2022–2051Total Flux for 2022–2051Average Annual Flux for 2022–2051
Groundwater inflow components, in millions of cubic meters
Stream Leakage 1.485 0.050 1.559 0.052
Recharge 0.140 0.005 0.124 0.004
Total inflow 1.612 0.054 1.683 0.056
Groundwater outflow components, in millions of cubic meters
Groundwater ET −1.172 −0.039 −0.322 −0.011
Surface leakage −0.233 −0.008 −0.179 −0.006
Net flow to other zones −0.780 −0.026 −3.110 −0.104
Total outflow −2.184 −0.073 −3.612 −0.120
Net groundwater storage −0.560 −0.186 −1.930 −0.064
Disclaimer/Publisher’s Note: The statements, opinions and data contained in all publications are solely those of the individual author(s) and contributor(s) and not of MDPI and/or the editor(s). MDPI and/or the editor(s) disclaim responsibility for any injury to people or property resulting from any ideas, methods, instructions or products referred to in the content.

