Abstract
Urbanization and climate change amplify urban flooding risks, demanding efficient, data-minimal tools to strengthen flood resilience. This study presents a pioneering multi-dimensional framework that quantifies the contributions of source reduction, stormwater pipes, and drainage/flood control systems, circumventing the need for intricate hydrological models. Leveraging rainfall depth (mm), runoff volume (m3), and peak flow rate (m3/h) provides a comprehensive evaluation of stormwater management efficacy. Applied to a hypothetical city, City A, under 30- and 50-year rainfall scenarios, the framework reveals efficiencies of 91.0% for rainfall depth and runoff volume, and 90.8% for peak flow in the 30-year case (9% shortfall), declining to 75.7% peak flow efficiency with a 24.3% deficit in the 50-year scenario, underscoring constraints in extreme-event response. Contributions analysis shows stormwater pipes (42.8–47.6%, mean: 46.0%) and drainage/flood control (40.8–43.2%, mean: 41.6%) predominate, while source reduction adds 11.6–14.0% (mean: 12.4%). A primary contribution lies in reducing data demands by approximately 70% compared to traditional approaches, rendering this framework a practical, scalable solution for flood management and sponge city design in data-limited settings. These findings elucidate system vulnerabilities and offer actionable strategies, advancing urban flood resilience both theoretically and practically.
1. Introduction
Rapid urbanization, coupled with the escalating intensity and frequency of extreme rainfall events due to climate change, has markedly exacerbated urban flooding risks. According to the 2020 UN-Habitat Report, about 55% of the world’s population resides in urban areas, and over half of these inhabitants are susceptible to flood hazards [1]. Likewise, the Sixth Assessment Report of the Intergovernmental Panel on Climate Change (IPCC) indicates that extreme precipitation events are becoming more frequent, particularly in coastal and low-lying urban regions, where flood risks are particularly acute [2]. Urban flooding in rapidly growing cities has been shown to result in substantial socio-economic impacts, particularly where land-use change, inadequate drainage, and climate variability intersect [3]. To tackle these challenges, urban stormwater management has emerged as a vital strategy for bolstering flood resilience and promoting sustainable urban development. The primary objectives of stormwater management include mitigating peak runoff, regulating total runoff volume, and improving the system’s capacity to withstand extreme rainfall through infrastructure and policy measures. Recent studies have emphasized the role of scenario-based green infrastructure (GI) implementations in supporting stormwater resilience across various rainfall return periods [4]. An urban stormwater system typically consists of three interconnected subsystems [5]: source reduction, stormwater pipes, and drainage and flood control. Source reduction measures, including green infrastructure and low-impact development (LID) methods, are pivotal in diminishing runoff at its origin. Meanwhile, stormwater pipes function as the principal drainage conduit, gathering and channeling runoff throughout urban environments. Concurrently, drainage and flood control infrastructure—such as detention basins and pumping stations—offers vital flood mitigation capabilities, particularly in extreme conditions. Nevertheless, the pronounced spatial, temporal, and functional interlinkages among these subsystems complicate precise quantification of their individual and collective roles in urban flood management.
Historically, urban stormwater assessments have depended on hydrological and hydraulic models, notably the Storm Water Management Model (SWMM) [6]. Numerous studies validate the effectiveness of these models in optimizing stormwater drainage networks. For instance, Fletcher et al. (2013) found that refining stormwater pipe layouts via SWMM reduced flood incidents in Melbourne, Australia, by 25% [7]. Likewise, in Copenhagen, Denmark, the MIKE URBAN model accurately simulated drainage network hydraulics [8]. Despite their advantages, such models encounter several critical constraints. First, hydrodynamic models require extensive datasets, including detailed topographic information, drainage network parameters, and high-resolution rainfall records, which are often unavailable in developing regions [1]. Second, parameter calibration can introduce notable uncertainties, with studies indicating that subjectively adjusted parameters in stormwater models can lead to estimation errors exceeding 30% [9]. Lastly, these models’ high computational demands hinder their deployment in small and medium-sized cities, where resources for advanced simulations are often scarce.
In recent years, studies of urban stormwater management have progressed from assessing individual infrastructure components to pursuing a more integrated, synergistic optimization strategy. Source reduction measures, especially low-impact development (LID) techniques, have been recognized as effective strategies for mitigating initial runoff and alleviating pressure on stormwater pipes. Empirical investigations corroborate their real-world applications. For example, Elliott and Trowsdale (2007) found that rain gardens and permeable pavements in Auckland, New Zealand, reduced peak runoff by 30–50% [10]. Likewise, Ahiablame et al. (2012) reported that green roofs and bioretention basins in Seattle, USA, led to an approximate 40% reduction in annual runoff volume [11]. Meanwhile, bolstering the design standards and capacity of stormwater pipes is crucial for mitigating urban flood hazards. A case study by Palla and Gnecco (2015) in Genoa, Italy, demonstrated that integrating LID with drainage network expansion reduced inundation areas by 40% under a 50-year return period storm event [12]. In addition, drainage and flood control systems at the terminal stage play an essential role in urban flood resilience. Che et al. (2019) analyzed Shanghai’s flood control system and found that the coordinated operation of pumping stations and underground storage tanks reduced flood-prone areas by approximately 60% during extreme storm events [13]. These findings underscore that the three subsystems—source reduction, stormwater pipes, and drainage and flood control—each provide unique benefits. Nevertheless, a comprehensive and quantitative appraisal of their joint contributions remains insufficient.
Many existing studies concentrate on isolated subsystems, offering limited insights into their interactions and overall integrated performance. For instance, Jia et al. (2013) introduced an LID-based source reduction optimization framework, which demonstrated significant effectiveness in reducing initial runoff. However, their study did not thoroughly explore the dynamic interactions between downstream stormwater pipes and flood control facilities [14]. Additionally, numerous evaluation approaches depend on substantial field data or high-fidelity hydrodynamic models yet lack a standardized framework, complicating cross-city comparative analyses [15]. Under extreme rainfall conditions, the limited coordinated capacity among the three subsystems can lead to bottlenecks or failures. Butler and Davies (2011) further observed that current assessment methods are insufficient for gauging system resilience during extreme rainfall, thereby complicating optimal infrastructure allocation, especially in resource-limited settings [16]. Moreover, these methods commonly entail high data acquisition costs for smaller cities.
To overcome these limitations, researchers have explored simplified or indicator-based evaluation approaches as alternatives to complex hydrological models. Raimondi et al. (2022) developed an analytical–probabilistic water balance model tailored to sustainable urban drainage systems, which allows efficient evaluation of source reduction facilities by estimating runoff and storage efficiency under varying rainfall conditions [17]. Similarly, Bach et al. (2014) proposed an indicator-based framework incorporating rainfall depth and runoff coefficients. However, their model did not fully account for dynamic parameters such as peak flow rates, which are critical for flood risk assessment [18]. In addition, emerging studies have explored real-time optimization using digital twin technology, yet these methods require high-resolution monitoring data, posing challenges for widespread implementation [19]. To bridge the gap between data and model dependency and the lack of integrated assessments, this study proposes a multi-dimensional, standardized evaluation framework that quantifies the contributions of source reduction, stormwater pipes, and drainage and flood control based on three key performance metrics. Specifically, rainfall depth (mm) is used to quantify the static retention and runoff control capacity of each subsystem, reflecting their ability to manage precipitation across different stages. Meanwhile, runoff volume (m3) evaluates the system’s overall contribution to urban water balance, providing insights into long-term hydrological performance. Finally, peak flow rate (m3/h) serves as a critical indicator of emergency response capacity, assessing the system’s ability to mitigate extreme flooding conditions by regulating flow dynamics under high-intensity rainfall events.
To validate the effectiveness and applicability of this framework, a case study was conducted in a hypothetical city, “City A”, where system performance was analyzed under 30-year and 50-year return period rainfall scenarios. The findings highlight the framework’s capacity to pinpoint system vulnerabilities and guide resource optimization in urban stormwater management.
Compared to conventional studies, this research introduces a multi-dimensional evaluation framework with standardized indicators, contributing to both theoretical advancements and practical applications. Theoretically, it dissects the nonlinear interactions among the three subsystems—source reduction, stormwater pipes, and drainage and flood control—establishing a multi-dimensional quantitative assessment paradigm that enhances urban stormwater evaluation methodologies. In practical terms, the proposed framework significantly reduces reliance on high-resolution data and complex simulations, making it adaptable to cities of varying scales and data availability. This approach can be directly applied to sponge city initiatives, drainage system upgrades, and emergency response planning, offering a structured decision-making tool for urban flood resilience.
The remainder of this paper is organized as follows: Section 2 presents the methodology, Section 3 and Section 4 present the case study analysis and discuss the results, and Section 5 concludes the study by summarizing key findings and proposing directions for future research. This study aims to provide new insights and practical tools for enhancing urban stormwater management and improving flood resilience strategies.
2. Methodology
2.1. Conceptual Framework
To systematically evaluate urban stormwater management systems, this study introduces a multi-dimensional quantitative framework that integrates source reduction, stormwater pipes, and drainage/flood control. The framework quantifies the contributions of these three subsystems using three key performance indicators: rainfall depth (mm), runoff volume (m3), and peak flow rate (m3/h). It aims to overcome the limitations of traditional hydrological models by reducing data dependency while maintaining a comprehensive, scalable assessment methodology. This Section details the framework’s design principles, theoretical foundations, evaluation metrics, comparison with existing methods, implementation steps, and its innovations and applicability.
2.1.1. Core Design Principles for Multi-Dimensional Evaluation
Developed from three fundamental principles, the proposed framework ensures both scientific rigor and practical applicability. First, it prioritizes standardization and comparability by employing standardized rainfall scenarios—such as a 30-year return period 24 h rainfall or historical extreme events—to maintain consistency across diverse urban contexts. Through normalized performance indicators, the framework enables comparative analyses between different cities or across distinct periods within the same city.
Second, a multi-dimensional synergy analysis approach is adopted to reflect the complex interactions within urban stormwater management. The system operates in distinct but interconnected phases, where source reduction mitigates initial runoff through infiltration and storage, stormwater pipes facilitate mid-stage conveyance, and drainage and flood control infrastructure provide emergency retention and discharge capacity during extreme events. By integrating these three subsystems, the framework captures their interactions across spatial and temporal scales, offering a holistic assessment of urban flood resilience.
Third, the framework stresses simplicity and feasibility to broaden its applicability. By streamlining hydrological parameters and leveraging design-based assumptions, the approach significantly reduces the reliance on high-precision data and computationally intensive hydrological models. The methodology requires only typical rainfall intensity–duration–frequency (IDF) curves, urban catchment areas, and key design parameters of subsystems, making it applicable to both data-rich and data-scarce urban environments.
2.1.2. Theoretical Basis and Key Equations of the Framework
The framework is grounded in hydrological balance principles and hydraulic flow theory, treating the urban stormwater system as a multi-tiered structure composed of source reduction, stormwater pipes, and drainage and flood control subsystems. The overall contribution of the system is quantified as follows:
where Gtotal represents the total system effectiveness, and Gs, Gsp, and Gd denote the contributions of source reduction, stormwater pipes, and drainage and flood control, respectively.
Equation (1) assumes that the contributions of source reduction, stormwater pipes, and drainage and flood control subsystems are additive, implying negligible water loss or overlap in their functional roles during stormwater management. This simplification is grounded in the principle of mass conservation, where total rainfall is either retained, conveyed, or discharged through distinct subsystems without significant hydraulic interactions under design conditions. While real-world systems may exhibit nonlinear effects—such as capacity constraints in pipes affecting downstream drainage efficiency—the additive model prioritizes computational simplicity and reduced data dependency, making it suitable for rapid assessments in data-scarce regions. These assumptions are validated in the case study (Section 3), where subsystem interactions remain within acceptable bounds for the selected rainfall scenarios.
Subsystem contributions across the three evaluation dimensions—rainfall depth (H), runoff volume (V), and peak flow rate (Q)—are uniformly expressed as:
where X represents the evaluation metric (H, V, or Q), Xsubsystem is the capacity managed by a specific subsystem, and Xflood is the design standard for flood prevention. To account for spatial variability, the adjusted capacity of each subsystem relative to the total urban area is calculated as:
where Xsubsystem is the subsystem’s raw capacity, Asubsystem is its service area (m2), and Aurban is the total urban area (m2). For example, the rainfall depth contribution of source reduction (GH,s) is derived from Hs-adj/Hflood, with Hs-adj adjusted by Equation (3). Similar formulations apply to runoff volume and peak flow rate, enabling quantitative decomposition of system performance without complex hydrodynamic simulations. Detailed subsystem calculations are provided in Section 2.2.
2.1.3. Multi-Dimensional Evaluation Metrics
The proposed framework evaluates system performance across three key dimensions. Rainfall depth, measured in millimeters, quantifies the amount of precipitation managed by each subsystem, providing insights into its static retention capacity. This metric is particularly relevant for assessing the performance of LID infrastructure, such as permeable pavements and rain gardens, which contribute to early-stage runoff reduction and infiltration enhancement.
Runoff volume, expressed in cubic meters, evaluates the system’s overall contribution to urban water balance, offering insights into long-term hydrological performance and the efficiency of stormwater conveyance and retention mechanisms. Peak flow rate, measured in cubic meters per hour, serves as a critical indicator of emergency response capacity, assessing the system’s ability to mitigate extreme flooding conditions by regulating flow dynamics under high-intensity rainfall events. These three metrics collectively provide a comprehensive assessment of stormwater system performance across static storage, long-term conveyance, and emergency response functions.
2.1.4. Comparison with Conventional Hydrological Models
Unlike traditional hydrological models such as SWMM or MIKE URBAN, which require detailed input data, parameter calibration, and computationally intensive simulations, the proposed framework offers significant advantages. Conventional models rely on high-resolution spatial datasets and real-time monitoring, making them resource-intensive and often impractical for cities with limited hydrological data availability. In contrast, the proposed framework substantially reduces data requirements by employing standardized performance indicators instead of complex hydrodynamic equations, thereby making it more accessible for a wider range of urban settings.
To highlight the advantages of the proposed framework, Table 1 compares it with widely used hydrological models, such as SWMM and MIKE URBAN.

Table 1.
Comparison of the Proposed Method with Traditional Hydrological Models.
2.1.5. Stepwise Implementation of the Multi-Dimensional Urban Stormwater Assessment Framework
To ensure the practical applicability of the proposed framework, its implementation follows a structured four-step process.
The first step involves establishing the design rainfall scenarios, which serve as the foundation for system assessment. The evaluation follows urban flood prevention standards, such as a 30-year return period 24 h rainfall event, to determine three key hydrological parameters: design rainfall depth (Hflood, mm), total runoff volume (Vflood, m3), and peak flow rate (Qflood, m3/h). The design rainfall depth is derived from the intensity–duration–frequency (IDF) curve, considering the selected return period and duration or, alternatively, historical extreme rainfall records.
The total runoff volume is estimated using the rainfall–runoff relationship:
where Curban represents the composite runoff coefficient.
Vflood = Hflood × Curban × Aurban
The peak flow rate is estimated using the rational method:
where Iflood (mm/h) denotes the peak rainfall intensity obtained from the IDF curve. These equations ensure that the selected parameters accurately reflect the hydrological characteristics of the study area.
Qflood = Curban × Iflood × Aurban
The second step involves collecting key system parameters for the three primary subsystems: source reduction, stormwater pipes, and drainage and flood control. For source reduction, the key parameter is the rainfall retention depth (Hs), which quantifies the capacity of low-impact development (LID) measures such as permeable pavements, green roofs, and bioretention systems in reducing runoff. The stormwater pipe subsystem is characterized by its conveyance capacity (Hsp), indicating the volume of stormwater transported through the drainage network. The drainage and flood control subsystem is assessed based on its storage capacity (Vd), which includes detention basins, pumping stations, and emergency overflow structures. These parameters are obtained from urban drainage design guidelines, field measurements, or hydrological modeling, ensuring a balance between accuracy and data availability.
The third step consists of computing the contributions of each subsystem based on the three key performance metrics: rainfall depth, runoff volume, and peak flow rate. The overall system effectiveness is determined by aggregating the contributions of the three primary subsystems. To provide a more detailed evaluation, these contributions are further broken down according to the three performance dimensions. The total contribution for each dimension is obtained by summing the individual contributions of the subsystems:
where GH,s, GH,sp, GH,d represent the contributions of source reduction, stormwater pipes, and drainage and flood control to rainfall depth, while GV,s, GV,sp, GV,d and GQ,s, GQ,sp, GQ,d denote their respective contributions to runoff volume and peak flow rate.
GH,total = GH,s + GH,sp + GH,d
GV,total = GV,s + GV,sp + GV,d
GQ,total = GQ,s + GQ,sp + GQ,d
Each subsystem contribution is computed using the normalized contribution metric defined in Equation (2) in Section 2.1.2, ensuring consistency across all evaluation dimensions. To ensure comparability across different spatial extents, subsystem effectiveness is adjusted based on its respective service area, as outlined in Equation (3) in Section 2.1.2.
The fourth and final step involves analyzing the system performance based on the computed effectiveness measures and developing optimization strategies accordingly. If any of the aggregated contributions for rainfall depth, runoff volume, or peak flow rate fall below the target threshold, it indicates an underperformance in that aspect of the system. In such cases, interventions such as expanding LID coverage, upgrading stormwater drainage networks, or increasing storage capacity are recommended. If the contributions align with the target benchmark, the system is considered to be adequately designed, with potential for further refinement through resource reallocation or infrastructure optimization. In scenarios where any of the computed values significantly exceed the benchmark, this suggests that the system may be overdesigned. Under such conditions, adjustments such as downsizing specific components or redistributing resources could improve cost-effectiveness while maintaining flood resilience.
This structured assessment approach provides a systematic, quantitative framework for evaluating and optimizing urban stormwater management. Designed for applicability across diverse urban contexts, the framework supports decision-making processes in sponge city planning, drainage infrastructure enhancement, and flood emergency preparedness. Figure 1 illustrates the multi-dimensional assessment framework for urban stormwater storage–drainage systems, highlighting the interactions among the three subsystems and their respective contributions to overall system performance.
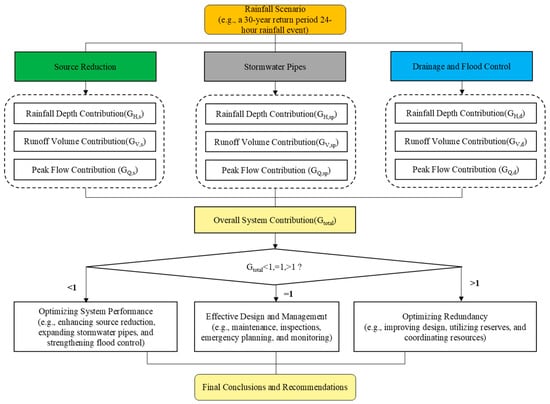
Figure 1.
Multi-Dimensional Assessment Framework for Urban Stormwater Storage–Drainage Systems.
Figure 1 illustrates the multi-dimensional assessment framework for urban stormwater storage–drainage systems, highlighting the interactions among the three subsystems and their respective contributions to overall system performance.
2.1.6. Innovation and Practical Applications
This framework introduces two key innovations. First, by integrating rainfall depth, runoff volume, and peak flow rate, the framework overcomes the limitations of single-metric assessments and provides a holistic understanding of system performance. Second, through streamlined data requirements and standardized indicators, the method reduces reliance on complex hydrological models, making it highly applicable in both data-rich and data-scarce urban environments.
The practical applications of this framework extend to multiple areas, including sponge city planning, stormwater system upgrades, and flood emergency response strategies. By providing a structured decision-support tool, this approach facilitates the effective allocation of resources and enhances urban flood resilience planning, ensuring that urban areas can better adapt to increasingly extreme precipitation events.
2.2. Methodology Description
This study presents a contribution-based method to quantify the spatial roles of source reduction, stormwater pipes, and drainage/flood control in urban stormwater management, using rainfall depth (mm), runoff volume (m3), and peak flow rate (m3/h). A simplified mathematical model assesses subsystem performance against flood prevention standards across multiple rainfall scenarios.
The following Sections provide a detailed description of the evaluation method across the three dimensions, including the theoretical foundation, computational formulas, parameter definitions, and data sources, along with a comprehensive implementation workflow.
2.2.1. Computation of Rainfall Depth Contribution
The contribution of each subsystem to rainfall depth mitigation is a key parameter for assessing the effectiveness of urban stormwater management. This metric quantifies the extent to which source reduction, stormwater pipes, and drainage and flood control systems retain and manage precipitation within an urban catchment. The calculation is based on the ratio of rainfall depth retained or controlled by each subsystem to the design rainfall depth (Hflood), which is determined according to urban flood prevention standards.
The contribution of an individual subsystem to rainfall depth mitigation is expressed as a normalized efficiency measure:
where GH,i represents the rainfall depth contribution of subsystem i, Hi denotes the effective rainfall depth managed by a specific subsystem, and Hflood is the design rainfall depth. Hi may vary based on regional design standards.
The source reduction system contributes to rainfall depth mitigation through two primary components: sponge city development zones and non-sponge city areas. The contribution of each component is quantified based on its runoff control capacity and adjusted to reflect its impact on the entire urban catchment.
In sponge city development zones, the effective rainfall depth contribution is determined by the design rainfall retention capacity, which corresponds to the annual runoff volume control rate specified for sponge city areas. This value is typically derived from local rainfall frequency analysis. The contribution of sponge city zones to the total urban area is adjusted as follows:
where Hsponge-design is the rainfall retention capacity in sponge city zones, and Asponge is the sponge city development area.
In non-sponge city areas, urban green spaces serve as the primary retention units. The effective rainfall depth contribution of these areas is determined by converting the total rainfall volume retained by green spaces into an equivalent rainfall depth over the entire non-sponge city region:
where Vgreen represents the total rainfall volume retained by green spaces, computed as:
where K denotes the saturated hydraulic conductivity (mm/h), J represents the hydraulic gradient, Agreen is the green space area within the non-sponge city region, and ts is the infiltration duration (h).
Vgreen = K × J × Agreen × ts
To account for its contribution at the urban scale, the rainfall depth controlled by non-sponge city green spaces is adjusted using:
Finally, the overall contribution of source reduction to rainfall depth mitigation is obtained by summing the adjusted contributions of sponge city and non-sponge city areas:
Hs = Hsponge-adj + Hnon-sponge-adj
This formulation provides a comprehensive quantitative assessment of the source reduction system’s effectiveness in urban stormwater management, facilitating direct comparisons across different urban development scenarios.
The rainfall depth contribution of the stormwater pipe system is assessed based on the drainage capacity of the pipe network and the operational capacity of the pumping stations. The rainfall depth controlled by the stormwater pipe network is computed using the system’s design flow rate:
where Qpipes represents the design discharge capacity of the stormwater pipe system (m3/h), train is the rainfall duration (h), and Apipes is the catchment area served by the drainage network.
To scale the stormwater pipe contribution to the entire urban area, the adjusted value is computed as:
If pumping stations are present, their contribution to rainfall depth control is determined as follows:
where Qpumps is the design discharge capacity of the pumping station (m3/h) and Apumps is the catchment area served by the pumping station. The corresponding adjusted value is given by:
The total rainfall depth contribution of the stormwater pipe system, including both the drainage network and pumping stations, is then obtained as:
Hsp = Hpipes-adj + Hpumps-adj
The rainfall depth contribution of the drainage and flood control system is determined based on flow conveyance through designated flood channels and storage capacity within retention spaces. These components are computed separately and then aggregated.
For flood channels, the controlled rainfall depth is given by:
where Qchannels represents the design discharge capacity of flood channels (m3/h) and Achannels is the flood channel service area. The adjusted contribution at the urban scale is:
For retention spaces, the controlled rainfall depth is computed using the total retention volume:
where Vstorage represents the total retention volume (m3), Astorage is the surface area of the retention zone (m2), and Cstorage is the runoff coefficient. The adjusted contribution is:
The total rainfall depth contribution of the drainage and flood control system is then computed as:
Hd = Hchannels-adj + Hstorage-adj
These formulations provide a systematic evaluation of how stormwater pipes and flood control infrastructure contribute to urban rainfall management, supporting data-driven strategies for optimizing urban drainage systems.
2.2.2. Computation of Runoff Volume Contribution
The runoff volume contribution is a key metric for evaluating the capacity of each subsystem to retain or convey stormwater during a rainfall event. This parameter reflects the overall efficiency of the system in managing urban runoff and serves as a critical indicator of long-term hydrological performance.
The contribution of each subsystem to runoff volume management is computed using a normalized efficiency measure:
where GV,i represents the runoff volume contribution of subsystem i, Vi is the volume of stormwater retained or conveyed by the subsystem (m3), and Vflood denotes the total runoff volume under design rainfall conditions (m3).
The total runoff volume is determined using the rainfall–runoff relationship:
where Hflood is the design rainfall depth (mm), and Curban represents the composite runoff coefficient of the city.
Vflood = Hflood × Curban × Aurban
The runoff volume contribution is computed separately for each subsystem—source reduction, stormwater pipes, and drainage and flood control—and subsequently aggregated to determine the overall system efficiency.
The source reduction system contributes to runoff volume management by retaining a portion of precipitation before it enters the drainage network. The retained volume is computed as:
where Hs represents the effective rainfall depth retained by source reduction measures, as derived in Section 2.2.1.
Vs = Hs × Curban × Aurban
For the stormwater pipe system, the runoff volume conveyed through the drainage network is given by:
where Hsp represents the rainfall depth contribution of the stormwater pipe system, as determined in Section 2.2.1.
Vsp = Hsp × Curban × Aurban
For the drainage and flood control system, the total runoff volume managed is expressed as:
where Hd corresponds to the rainfall depth controlled by the drainage and flood control system, as calculated in Section 2.2.1.
Vd = Hd × Curban × Aurban
By integrating these subsystem contributions, this approach provides a comprehensive quantitative assessment of urban stormwater management effectiveness. The results offer valuable insights into the relative efficiency of different stormwater management strategies, supporting informed decision-making for system optimization and flood resilience planning.
2.2.3. Computation of Peak Flow Contribution
The peak flow contribution is a key metric for evaluating the ability of each subsystem to attenuate peak runoff during heavy rainfall events, reflecting its emergency response capacity under extreme precipitation conditions. This metric is defined as the ratio of the peak flow controlled by each subsystem to the total urban peak flow under design conditions:
where GQ,i represents the peak flow contribution of subsystem i, Qi is the peak flow managed by the subsystem (m3/h), and Qflood denotes the total peak flow under design rainfall conditions (m3/h).
The total peak flow is calculated based on the rainfall–runoff relationship:
where Iflood represents the peak hourly rainfall intensity (mm/h), and Curban is the composite runoff coefficient of the city.
Qflood = Curban × Iflood × Aurban
The peak flow contribution is computed separately for each subsystem—source reduction, stormwater pipes, and drainage and flood control—and subsequently aggregated to determine the overall system efficiency.
The source reduction system reduces peak flow by mitigating initial runoff at the source. The contribution of source reduction is calculated as:
where Is represents the reduced rainfall intensity due to source reduction measures, which is determined based on Hs and the intensity–duration–frequency (IDF) curve.
Qs = Is × Curban × Aurban
The stormwater pipe system contributes to peak flow regulation by conveying runoff through the drainage infrastructure. Its contribution is determined as:
where Qpipes is the design discharge capacity of the drainage network (m3/h), calculated using the Manning equation, and Qpumps is the design pumping station capacity (m3/h).
Qsp = Qpipes + Qpumps
The drainage and flood control system manages peak flows through flood channels and retention storage. The contribution of this subsystem is given by:
where Qchannels represents the design discharge capacity of flood channels, computed using the Manning equation, and Qstorage denotes the peak storage attenuation capacity of retention facilities, which is calculated as:
where Vstorage-peak is the maximum storage volume available during peak flow conditions (m3), and Tpeak is the peak duration (h).
Qd = Qchannels + Qstorage
By integrating these subsystem contributions, the overall system effectiveness in peak flow control is assessed using the formulation established in Section 2.1.5. This approach provides a comprehensive quantitative evaluation of the hydrological performance of urban stormwater management systems.
This methodology integrates rainfall depth (mm), runoff volume (m3), and peak flow rate (m3/h) as key assessment dimensions, ensuring a scientifically rigorous and reproducible evaluation based on mass conservation and hydraulic principles. The results support data-driven decision-making for optimizing urban stormwater resilience, with subsequent Sections further exploring its applications.
2.3. Case Study: City A
To validate the effectiveness and applicability of the proposed multi-dimensional quantitative assessment method, this Section presents a case study of City A, a representative urban area in northern China. The study evaluates the spatial contributions of the three primary subsystems—source reduction, stormwater pipes, and drainage and flood control—within City A’s stormwater storage and drainage system. The design parameters for City A are established based on typical urbanization characteristics, simulating common rainfall and urban flooding scenarios. By integrating the theoretical framework with empirical parameter data, this case study demonstrates the proposed method’s applicability in assessing system performance, identifying vulnerabilities, and guiding optimization strategies.
2.3.1. Overview of City A
City A is a northern Chinese city with a built-up area of 100 km2 (Aurban = 1 × 10⁸ m2). The city has a composite runoff coefficient (Curban = 0.7), reflecting a high proportion of impervious surfaces, including roads and buildings. Given the city’s rainfall characteristics and flood prevention requirements, the design rainfall standard is based on a 30-year return period 24 h rainfall event, with a total rainfall depth of 180 mm (Hflood = 180 mm) and a peak hourly rainfall intensity of 50 mm/h (Iflood = 50 mm/h). These parameters are determined using intensity–duration–frequency (IDF) curve analysis. The parameter selection follows the Chinese National Standard for Outdoor Drainage Design to ensure representativeness and reliability [5].
The stormwater management system of City A consists of three subsystems. The source reduction system includes both sponge city-compliant areas and non-compliant green spaces. The stormwater pipe system is composed of a primary drainage network and localized pumping stations. The drainage and flood control system incorporates flood channels and retention spaces. The following Sections provide a detailed description of the parameter settings and data sources for each subsystem, forming the basis for the contribution calculations.
2.3.2. Subsystem Parameter Configuration
This Section defines the parameters for the three subsystems of City A’s stormwater storage and drainage system—source reduction, stormwater pipes, and drainage and flood control—which serve as the basis for subsequent contribution calculations. The parameter selection is based on typical urbanization characteristics and relevant engineering standards, ensuring the representativeness and reliability of the case study.
Table 2 summarizes the key parameters of each subsystem in City A’s stormwater management system. The source reduction system includes designated sponge city-compliant areas and non-compliant green spaces, with an effective area of 50 km2 and a design rainfall retention capacity of 30 mm. The green space coverage within non-compliant areas is 10 km2, with an estimated rainfall retention depth of 8 mm. The stormwater pipe system covers a drainage area of 90 km2, with an effective conveyance depth of 60 mm, and incorporates pumping stations with a total discharge capacity of 1 × 10⁵ m3/h. The drainage and flood control system consists of flood channels covering 0.5 km2, with a design flow capacity of 4 × 10⁴ m3/h, and retention storage with a total capacity of 4 × 10⁶ m3.
Table 2.
Summary of Subsystem Parameters for City A’s Stormwater Management System.
The following Sections provide a detailed explanation of how these parameters are used in runoff contribution calculations, ensuring a systematic assessment of City A’s stormwater management performance.
- (1)
- Source Reduction System
The source reduction system in City A consists of sponge city-compliant areas and non-sponge areas, each contributing differently to rainfall retention and runoff reduction. These two zones are evaluated separately based on their hydrological characteristics and design retention capacities.
The sponge city-compliant area covers 50 km2, accounting for 50% of the total urban area. This region follows the Sponge City Construction Technical Guidelines, which recommend an annual runoff control rate of 80%. Based on these guidelines, the design rainfall retention depth for sponge city areas is 30 mm, reflecting the storage and infiltration capacity of permeable pavements, rain gardens, and other low-impact development (LID) features.
The non-sponge area also spans 50 km2 and includes 10 km2 of urban green spaces, representing 20% of the non-sponge zone. The rainfall retention capacity of these green spaces is estimated based on soil infiltration characteristics. Assuming a saturated hydraulic conductivity (K) of 0.02 m/h (20 mm/h), a hydraulic gradient (J) of 1, and an infiltration duration (ts) of 2 h, the rainfall retention depth of urban green spaces is 40 mm. Adjusting this value to represent the entire non-sponge area using Equation (11), the effective rainfall retention depth is determined to be 8 mm.
These calculations establish the basis for assessing the overall contribution of the source reduction system to rainfall retention and runoff reduction, ensuring a quantitative and comparative evaluation of its effectiveness in urban stormwater management.
- (2)
- Stormwater Pipe System
The stormwater pipe system in City A is responsible for collecting and conveying runoff through a network of primary drainage infrastructure and pumping stations. This subsystem plays a crucial role in urban flood mitigation, ensuring efficient stormwater transport and discharge.
The primary drainage network serves an area of 90 km2, covering 90% of the urban area. The design rainfall depth managed by the pipe system, determined using Equation (15), is 60 mm, based on hydraulic design flow rate calculations. Within the serviced area, the composite runoff coefficient is 0.7. Using Equation (16), the effective controlled rainfall depth for the entire urban area is determined to be 54 mm.
In addition to the drainage network, pumping stations are deployed in low-lying areas to facilitate stormwater removal. These facilities cover 10 km2, accounting for 10% of the total urban area, and have a design discharge capacity of 1 × 10⁵ m3/h. Assuming a rainfall duration of 24 h, the effective rainfall depth managed by the pumping system, as determined using Equation (17), is 240 mm. Using Equation (18), the adjusted value for the entire urban area is computed as 24 mm.
By integrating these contributions, the total rainfall depth managed by the stormwater pipe system is determined using Equation (19), ensuring a quantitative assessment of the system’s hydraulic conveyance and discharge capacity.
This calculation quantifies the role of the stormwater pipe system in urban flood mitigation, supporting data-driven decision-making for stormwater infrastructure optimization.
- (3)
- Drainage and Flood Control System
The drainage and flood control system in City A serves as the last line of defense against excess stormwater, comprising flood channels and retention spaces. These two components function collectively to store and safely discharge excessive runoff, mitigating urban flooding risks.
The flood channel network covers 0.5 km2, representing 0.5% of the total urban area. The design flow capacity of the flood channels is 4 × 10⁴ m3/h, with a runoff coefficient of 0.7. Using Equation (20), the rainfall depth managed by flood channels is determined to be 1920 mm. Adjusting this value for the entire urban area using Equation (21), the effective controlled rainfall depth is 9.6 mm.
The retention storage system has a catchment area of 5 km2 (5% of the total urban area) and a total storage volume of 4 × 10⁶ m3, with a runoff coefficient of 0.7. Using Equation (22), the effective rainfall depth stored within these facilities is 1142.86 mm. Adjusting this value for the entire urban area using Equation (23), the final adjusted contribution is 57.14 mm.
By integrating these contributions, the total rainfall depth managed by the drainage and flood control system is computed using Equation (24), ensuring a comprehensive evaluation of the system’s ability to regulate excess runoff.
This assessment quantifies the effectiveness of City A’s flood channels and retention facilities in controlling stormwater, supporting data-driven decision-making for flood mitigation and urban water management strategies.
2.3.3. Data Sources and Assumptions
The parameter settings in this study are based on established data sources and reasonable assumptions to ensure the scientific rigor and applicability of the evaluation framework. The rainfall parameters, including design rainfall depth (Hflood) and peak rainfall intensity (Iflood), are determined using intensity–duration–frequency (IDF) curve analysis, reflecting the precipitation characteristics of City A.
The subsystem parameters are derived from relevant technical guidelines, empirical research, and survey data specific to City A. The source reduction system parameters, including the design rainfall retention depth (Hsponge) and saturated hydraulic conductivity (K), are based on the Sponge City Construction Technical Guidelines and soil infiltration studies. The stormwater pipe system parameters, such as conveyance capacity and pumping station discharge rates, are obtained from hydraulic design standards and municipal drainage network assessments. The drainage and flood control system parameters, including flood channel discharge capacity and retention storage volume, are determined from survey data and flood control engineering specifications.
Several assumptions are made to simplify the analysis while ensuring the feasibility and robustness of the proposed evaluation framework. Rainfall is assumed to be spatially uniform across the study area, consistent with the design rainfall scenarios used in urban flood assessments. The performance of each subsystem is computed independently, without considering secondary factors such as groundwater table fluctuations, infrastructure aging effects, or operational variability. These assumptions facilitate streamlined calculations while maintaining the practical applicability of the proposed framework in urban stormwater management evaluation.
2.3.4. Case Study Implementation Steps
The case study of City A was implemented following the methodology described in Section 2.2 to systematically evaluate the contributions of source reduction, stormwater pipes, and drainage and flood control subsystems. The implementation process consists of three primary steps: establishing evaluation benchmarks, computing subsystem contributions, and validating results to develop optimization strategies.
The first step involves defining the evaluation benchmarks, including the design rainfall depth (Hflood), total runoff volume (Vflood), and peak flow rate (Qflood). The design rainfall depth is set at 180 mm, based on precipitation characteristics and urban flood prevention standards. Using Equation (26), the total runoff volume is determined as 1.26 × 10⁷ m3, while the peak flow rate, calculated using Equation (31), is 3.5 × 10⁶ m3/h. These benchmarks serve as reference values for evaluating the effectiveness of stormwater management interventions.
The second step consists of computing the contributions of each subsystem. Using the parameters defined in Section 2.3.2, the contributions to rainfall depth (GH), runoff volume (GV), and peak flow (GQ) are quantified. The aggregated performance of the three subsystems is analyzed to assess their synergistic effectiveness in mitigating urban flooding. The detailed results of these calculations are presented in Section 3, where subsystem contributions are further examined under different hydrological scenarios.
The third step entails validating the results and formulating optimization recommendations. The overall system contribution, evaluated based on Equation (2), is compared against the design standard benchmarks to identify performance gaps, overcapacity, or deficiencies. Based on this assessment, targeted improvement measures are proposed, including enhancing source reduction strategies, optimizing stormwater pipe conveyance capacity, or expanding drainage storage facilities. These recommendations provide a structured approach for improving flood resilience and urban stormwater management efficiency.
2.3.5. Significance of the Case Study
The case study of City A serves not only as an empirical validation of the proposed multi-dimensional quantitative assessment method but also as a critical link between theoretical methodology and practical application. By quantifying the contributions of the three primary subsystems, the case study effectively demonstrates the real-world applicability of the evaluation framework in urban stormwater management.
From a methodological perspective, the case study maintains logical continuity within the research. Following the framework design in Section 2.1 and methodological descriptions in Section 2.2, this case study provides essential data and validation for the subsequent results analysis in Section 3.
The study also offers practical insights for flood management planning in City A. The results can inform strategic decision-making, such as optimizing the spatial distribution of source reduction measures or enhancing pumping station capacity to improve urban flood resilience. By simulating a 30-year return period rainfall scenario, this study establishes a realistic application setting for evaluating the proposed multi-dimensional contribution assessment method. The findings validate the scientific rigor and operational feasibility of the framework, laying a foundation for further analysis and optimization in the following Sections.
3. Results
This Section provides a systematic analysis of how source reduction, stormwater pipes, and drainage/flood control subsystems spatially contribute to City A’s stormwater storage and drainage system. The assessment employs the multi-dimensional quantitative evaluation method introduced in Section 2.2, considering three key performance dimensions: rainfall depth (mm), runoff volume (m3), and peak flow rate (m3/h). The results are illustrated through statistical analysis and graphical representations, providing a clear visualization of each subsystem’s effectiveness and its synergistic interactions. A comparative evaluation against urban flood prevention standards is performed to assess the overall system performance. The ensuing discussion delves into the theoretical and practical ramifications of these findings, corroborates the methodology against existing literature, evaluates robustness across various scenarios, and outlines optimization strategies consistent with China’s sponge city initiatives.
3.1. Rainfall Depth Contribution Analysis
The rainfall depth contribution (GH) quantifies the ability of source reduction, stormwater pipes, and drainage and flood control subsystems to retain and manage precipitation within City A under the design rainfall conditions (Hflood = 180 mm). This metric reflects each subsystem’s static storage capacity and initial runoff interception efficiency. The calculation follows the methodology established in Section 2.2, with parameter values sourced from Section 2.3.2.
The source reduction system contributes to rainfall depth retention through sponge city-compliant areas and non-sponge green spaces. The sponge city area has a rainfall depth retention capacity of 30 mm over a 50 km2 service area. The non-sponge area, including 10 km2 of green space, has a retention depth of 8 mm, as determined using Equation (11). Using Equation (14), the total contribution of the source reduction system is 19 mm, yielding a rainfall depth contribution ratio of 0.106. These results indicate that source reduction contributes 10.6% to rainfall retention, highlighting its limited role in static rainfall storage.
The stormwater pipe system, consisting of a primary drainage network and pumping stations, plays a critical role in urban drainage. The drainage network, covering 90 km2, manages a rainfall depth of 60 mm, as determined using Equation (15). Using Equation (16), the effective controlled rainfall depth is 54 mm when adjusted for the total urban area. The pumping stations, which serve low-lying areas spanning 10 km2, have a design discharge capacity of 1 × 10⁵ m3/h. With a rainfall duration of 24 h, the effective rainfall depth controlled by pumping stations, as determined using Equation (17), is 240 mm. Using Equation (18), the adjusted contribution for the entire urban area is 24 mm. By integrating these contributions using Equation (19), the total rainfall depth managed by the stormwater pipe system is 78 mm, corresponding to a contribution ratio of 0.433 (43.3%).
The drainage and flood control system consists of flood channels and retention storage. The flood channels, covering 0.5 km2, have a design discharge capacity of 4 × 10⁴ m3/h. Using Equation (20), the rainfall depth managed by flood channels is 1920 mm. After adjustment using Equation (21), the effective controlled rainfall depth is 9.6 mm. The retention storage system, covering 5 km2, has a total storage volume of 4 × 10⁶ m3, with a runoff coefficient of 0.7. Using Equation (22), the effective rainfall depth stored within these facilities is 1142.86 mm, with an adjusted contribution of 57.14 mm, calculated using Equation (23). The total rainfall depth managed by the drainage and flood control system, computed using Equation (24), is 66.74 mm, yielding a contribution ratio of 0.371 (37.1%).
The total system contribution, computed using Equation (6), is 91.0% of the design standard, with individual contributions of 10.6% (source reduction), 43.3% (stormwater pipes), and 37.1% (drainage and flood control). The mean contribution across the three subsystems is 0.303, with a standard deviation of 0.141, suggesting considerable variation in their performance. Figure 2 provides a graphical representation of the rainfall depth contributions across the three subsystems.

Figure 2.
Rainfall Depth Contribution of Subsystems in City A.
3.2. Runoff Volume Contribution Analysis
The runoff volume contribution (GV) assesses the ability of source reduction, stormwater pipes, and drainage and flood control subsystems to retain or convey stormwater during the design rainfall event. This metric reflects each subsystem’s role in maintaining long-term urban water balance. The total runoff volume under the design rainfall scenario, determined using Equation (26), is 1.26 × 10⁷ m3. The parameters required for this assessment are sourced from Section 2.3.2, and the results are as follows.
The source reduction system contributes to runoff volume retention through sponge city-compliant areas and non-sponge green spaces. The effective rainfall depth managed by this system is 19 mm, as determined in Section 2.3.2. Using Equation (27), the total runoff volume retained by the source reduction system is computed as 1.33 × 10⁶ m3, yielding a runoff volume contribution ratio of 0.106 (10.6%). These results indicate that source reduction has a limited role in overall runoff volume regulation.
The stormwater pipe system plays a dominant role in total runoff volume management. The primary drainage network, serving 90 km2, has an effective conveyance depth of 60 mm and a runoff coefficient of 0.7. The pumping stations, covering 10 km2, have a design discharge depth of 240 mm. Using Equations (28) and (29), the total runoff volume managed by the stormwater pipe system is 5.46 × 10⁶ m3, corresponding to a contribution ratio of 0.433 (43.3%). These findings underscore the critical function of stormwater pipes in urban flood mitigation.
The drainage and flood control system supplements runoff regulation through flood channels and retention spaces. The flood channels, covering 0.5 km2, have a design discharge depth of 1920 mm, while the retention spaces, spanning 5 km2, provide a total storage capacity of 4 × 10⁶ m3. Using Equations (29) and (26), the total runoff volume managed by the drainage and flood control system is 4.672 × 10⁶ m3, yielding a contribution ratio of 0.371 (37.1%). These results highlight the essential role of the drainage and flood control system in long-term water balance regulation.
According to Equation (7), the system’s overall contribution reaches 91.0% of the design standard, with individual shares of 10.6% (source reduction), 43.3% (stormwater pipes), and 37.1% (drainage/flood control). The mean contribution across the three subsystems is 0.303, with a standard deviation of 0.141, suggesting significant variation in subsystem effectiveness. The runoff volume contributions of the three subsystems align with those in Figure 2, indicating a uniform distribution trend.
3.3. Peak Flow Contribution Analysis
The peak flow contribution (GQ) assesses the ability of source reduction, stormwater pipes, and drainage and flood control subsystems to attenuate peak runoff under extreme rainfall conditions, reflecting their emergency response capacity in flood mitigation. This evaluation is based on the design peak flow rate of City A, determined using Equation (31), which is 3.5 × 10⁶ m3/h. The parameters required for this analysis are sourced from Section 2.3.2, with the peak event duration (Tpeak) set at 3 h.
The source reduction system mitigates peak flow by reducing initial runoff generation. The effective rainfall depth managed by this subsystem is 19 mm, with a corresponding rainfall intensity of 6.33 mm/h, estimated using the IDF curve. Using Equation (32), the total peak flow controlled by the source reduction system is computed as 4.431 × 10⁵ m3/h, yielding a contribution ratio of 0.127 (12.7%). These results indicate that source reduction has a limited role in controlling peak discharges.
The stormwater pipe system plays a critical role in peak flow regulation by conveying runoff through the drainage network and pumping stations. The primary drainage network, covering 90 km2, operates under a peak rainfall intensity of 20 mm/h, with a runoff coefficient of 0.7. The pumping stations, with a design discharge capacity of 1 × 10⁵ m3/h, further contribute to peak flow management. Using Equations (33) and (34), the total peak flow managed by the stormwater pipe system is 1.36 × 10⁶ m3/h, corresponding to a contribution ratio of 0.389 (38.9%). These findings reinforce the primary function of stormwater pipes in urban drainage infrastructure.
The drainage and flood control system supplements peak flow regulation through flood channels and retention storage. The flood channels have a design flow capacity of 4 × 10⁴ m3/h, while the retention storage system, spanning 5 km2, provides a storage volume of 4 × 10⁶ m3 over a 3 h peak duration. Using Equation (34), the total peak flow managed by the drainage and flood control system is 1.373 × 10⁶ m3/h, yielding a contribution ratio of 0.392 (39.2%). These results highlight the critical function of drainage and flood control infrastructure in emergency flood response.
The overall system contribution, computed using Equation (8), indicates that the system achieves 90.8% of the design standard, with individual contributions of 12.7% (source reduction), 38.9% (stormwater pipes), and 39.2% (drainage and flood control). The mean contribution across the three subsystems is 0.303, with a standard deviation of 0.124, suggesting variability in subsystem effectiveness. The stormwater pipe and drainage systems play dominant roles in peak flow regulation, whereas source reduction has the least impact. Figure 3 provides a graphical representation of the peak flow contributions across the three subsystems in City A.
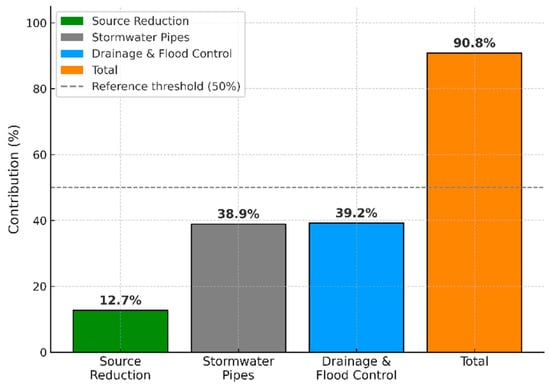
Figure 3.
Peak Flow Contribution of Subsystems in City A.
4. Discussion
This Section critically discusses the interactions, performance gaps, and adaptive potential of the three core subsystems—source reduction, stormwater pipes, and drainage and flood control—under varying rainfall return periods in City A. Rather than reiterating quantitative results, the discussion focuses on revealing subsystem imbalances, identifying resilience bottlenecks, and interpreting the implications for practical flood mitigation. Through scenario-based analysis, the Section also examines how design trade-offs and functional overlap among subsystems influence the system’s capacity to manage compound flood risks. Furthermore, opportunities for enhancing synergy and system adaptability are explored, offering insights for decision-making in data-scarce urban contexts.
4.1. Key Innovations and Contributions
The proposed framework introduces three major innovations in the evaluation of urban stormwater management systems. First, it establishes a multi-dimensional performance evaluation paradigm that integrates rainfall depth, runoff volume, and peak flow rate, thereby offering a holistic representation of stormwater system functionality. Unlike traditional single-metric approaches, this allows for the simultaneous assessment of static retention, long-term conveyance, and emergency regulation capacities. Second, the framework employs a contribution-based methodology that avoids reliance on complex hydrodynamic simulations or parameter calibration, thereby reducing computational complexity and uncertainty propagation. Third, it significantly reduces data requirements by relying on design-based parameters—such as rainfall intensity, catchment area, and infrastructure capacity—making it highly applicable in data-scarce or rapidly urbanizing regions. Collectively, these innovations not only advance the theoretical understanding of subsystem interactions but also offer a scalable tool for practical implementation in flood risk diagnostics and sponge city planning.
4.2. Analysis of Subsystem Performance and Synergistic Effects
This subsection focuses on the 30-year return period rainfall scenario, where the total rainfall depth (Hflood) is 180 mm, the peak hourly rainfall intensity (Iflood) is 50 mm/h, and the design peak flow rate (Qflood) is 3.5 × 10⁶ m3/h. The overall system performance under these conditions demonstrates a rainfall depth control efficiency (GH,total) of 91.0%, a runoff volume control efficiency (GV,total) of 91.0%, and a peak flow control efficiency (GQ,total) of 90.8%, indicating a performance deficit of approximately 9%.
The source reduction system exhibits a rainfall depth contribution of 10.6%, a runoff volume contribution of 10.6%, and a peak flow contribution of 12.7%. The standard deviation of 0.008 suggests that the system maintains stable performance in initial runoff interception, but its effectiveness in peak flow attenuation remains limited.
The stormwater pipe system demonstrates the highest contribution to total runoff control, with a rainfall depth contribution of 43.3%, a runoff volume contribution of 43.3%, and a peak flow contribution of 38.9%. However, the standard deviation of 0.021 indicates that while the stormwater pipes dominate total volume conveyance, their effectiveness declines under short-duration, high-intensity rainfall events due to capacity limitations in the drainage network.
The drainage and flood control system plays a complementary role in flood mitigation, with a rainfall depth contribution of 37.1%, a runoff volume contribution of 37.1%, and a peak flow contribution of 39.2%. The standard deviation of 0.011 suggests that this subsystem maintains stable long-term performance in total runoff control, but its effectiveness in managing instantaneous peak flows remains constrained. Figure 4 presents a radar chart illustrating the performance deficit across the three dimensions of rainfall depth, runoff volume, and peak flow regulation.
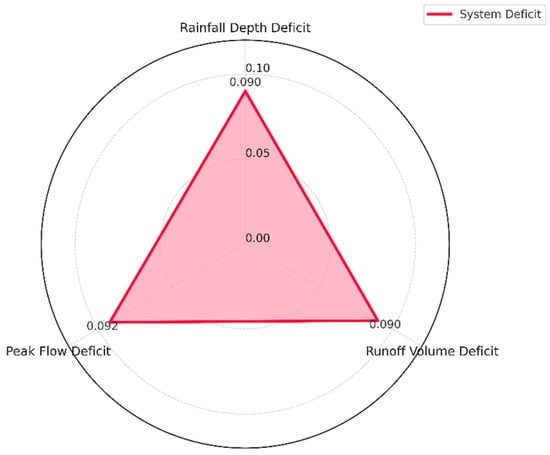
Figure 4.
System Deficit Radar Chart for Three-Dimensional Contribution.
The interactions among subsystems exhibit nonlinear characteristics, revealing both complementary and limiting effects. The source reduction system effectively reduces initial runoff, alleviating pressure on the stormwater pipe system. However, its impact on peak flow attenuation is minimal, as it primarily functions in the early stages of rainfall events. The stormwater pipe system serves as the primary conduit for runoff conveyance under normal conditions, but during high-intensity rainfall, it reaches capacity constraints, leading to localized flooding. The drainage and flood control system provides critical buffering capacity at the terminal stage, partially compensating for upstream inefficiencies. However, its effectiveness is highly dependent on controlled inputs from the upstream subsystems.
The observed nonlinear interactions highlight that improving individual subsystems in isolation may yield limited overall benefits. Instead, a system-level optimization approach is required to enhance collaborative performance across all subsystems, ensuring a more resilient and adaptive stormwater management strategy.
4.3. Multi-Scenario Performance Comparison and System Vulnerability Assessment
To further evaluate the system’s performance under varying rainfall intensities, this Section compares the effectiveness of stormwater management in 30-year and 50-year return period rainfall scenarios. The 50-year return period scenario, characterized by a total rainfall depth of 200 mm (Hflood = 200 mm), a peak hourly rainfall intensity of 60 mm/h (Iflood = 60 mm/h), and a design peak flow rate of 4.2 × 10⁶ m3/h (Qflood), serves as a stress test for the system’s resilience. Table 3 presents a comparative analysis of system effectiveness across different rainfall scenarios in City A.
Table 3.
System Performance Comparison Across Rainfall Scenarios in City A.
Under the 50-year return period scenario, the system exhibits a notable decline in performance across all three evaluation metrics. The total rainfall depth contribution (GH,total) and runoff volume contribution (GV,total) both decrease to 81.9%, while the peak flow control contribution (GQ,total) declines more significantly to 75.7%. Breaking down the efficiency drop (using data from Section 3.3 and Section 4.2) shows declines of 3.05% for source reduction, 9.41% for stormwater pipes, and 9.56% for drainage and flood control. The overall performance deficit expands from 9.0–9.2% under the 30-year scenario to 18.1–24.3% under the 50-year scenario.
A particularly noteworthy observation is the 15.1% reduction in peak flow control efficiency, which is substantially higher than the 9.1% reduction in total runoff volume management. This disparity indicates that the system is highly sensitive to short-duration, high-intensity rainfall events. Under extreme conditions, the system’s capacity limitations become more pronounced, exposing its vulnerability to peak flow surges. These findings highlight the need for adaptive stormwater management strategies, particularly in mitigating flash flooding risks under extreme precipitation events.
4.4. Analysis of Relative Subsystem Contribution
To further quantify the relative roles of source reduction, stormwater pipes, and drainage and flood control subsystems in overall system performance, this Section examines their contributions to rainfall depth control, runoff volume management, and peak flow attenuation under the 30-year return period rainfall scenario. By evaluating the proportion of each subsystem’s contribution relative to the total system effectiveness, this analysis provides insights into their functional significance in urban flood mitigation.
The rainfall depth contribution of the system reaches 91.0% of the design benchmark, with stormwater pipes accounting for the largest share (47.6%), followed by drainage and flood control (40.8%), while source reduction contributes the least (11.6%). These findings underscore the dominant role of stormwater pipes in urban drainage and conveyance, with drainage and flood control infrastructure providing essential retention capacity. The limited contribution of source reduction reflects its role in static rainfall storage, consistent with empirical studies on LID infrastructure interception efficiency, such as those by Elliott and Trowsdale (2007) [10]. Figure 5 presents the relative contributions of the three subsystems to rainfall depth management in City A.

Figure 5.
Percentage Contribution of Subsystems to Rainfall Depth in City A.
A similar trend is observed in runoff volume contribution, where stormwater pipes contribute 47.6%, drainage and flood control 40.8%, and source reduction 11.6%. These values indicate that the capacity of each subsystem to regulate long-term water balance is closely related to its static rainfall retention capacity. The high contribution of stormwater pipes reinforces their essential role in runoff conveyance and transport, while the low contribution of source reduction confirms its primary function in initial runoff interception, aligning with previous research on green infrastructure’s annual runoff reduction efficiency, such as the findings by Ahiablame et al. (2012) [11]. The relative contributions of the three subsystems to runoff volume control are consistent with those observed in Figure 5.
For peak flow contribution, the system achieves 90.8% of the design benchmark, with drainage and flood control contributing the most (43.2%), slightly exceeding stormwater pipes (42.8%), while source reduction accounts for 14.0%. The relatively higher contribution of drainage and flood control suggests that flood retention infrastructure, including flood channels and storage basins, plays a crucial role in mitigating peak discharges during high-intensity rainfall events. The drop in stormwater pipe contribution from 47.6% (rainfall depth and runoff volume) to 42.8% (peak flow) highlights capacity limitations under extreme conditions, necessitating complementary flood mitigation strategies. The increase in source reduction contribution to 14.0% suggests some potential for attenuating peak flow, although its overall effectiveness remains comparatively low. Figure 6 illustrates the relative contributions of the three subsystems to peak flow mitigation in City A.
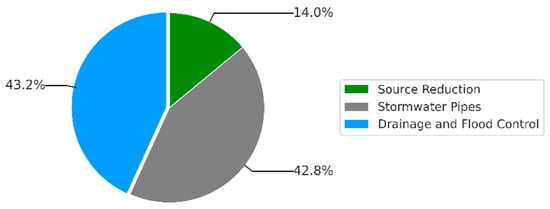
Figure 6.
Percentage Contribution of Subsystems to Peak Flow in City A.
A comparative assessment across rainfall depth, runoff volume, and peak flow contributions is presented in Figure 7, providing a comprehensive overview of subsystem effectiveness under different hydrological conditions. The results indicate that stormwater pipes and drainage and flood control systems collectively dominate system performance, contributing 46.0% and 41.6% on average, respectively. The source reduction system consistently exhibits the lowest contribution, ranging from 11.6% to 14.0% (mean: 12.4%), reinforcing its auxiliary role in urban flood management.

Figure 7.
Comparative Percentage Contribution of Subsystems Across Rainfall Depth, Run-off Volume, and Peak Flow in City A.
The standard deviation analysis suggests greater variability in subsystem performance across different hydrological metrics. For rainfall depth and runoff volume, a standard deviation of 0.141 indicates a higher degree of imbalance in contribution distribution, while for peak flow, a lower standard deviation of 0.124 suggests a more balanced distribution of subsystem effectiveness, indicating greater synergy during extreme rainfall events.
From a practical standpoint, this contribution analysis provides valuable insights for urban stormwater management optimization. In resource-limited scenarios, prioritizing investments in stormwater pipes (to enhance conveyance capacity) and drainage and flood control systems (to strengthen retention and emergency response mechanisms) can help address the 9–24% performance deficit observed under different rainfall scenarios. Given the relatively low contribution of source reduction, it should be considered a supplementary measure rather than a primary flood mitigation strategy. Expanding green space coverage, for example, increasing from 20% to 40%, could potentially raise its contribution to 15–20%, aligning with recommendations from Ahiablame et al. (2012) [11].
This analysis not only clarifies subsystem interplay but also delivers data-driven guidance for sponge city initiatives and flood risk mitigation in extreme rainfall contexts.
4.5. Comparative Analysis with Traditional Hydrological Models
The proposed framework fundamentally differs from conventional hydrological models such as SWMM and MIKE URBAN in both evaluation philosophy and operational design. Traditional models emphasize process-based simulations of rainfall–runoff dynamics, requiring extensive datasets and detailed system schematics. While effective in high-resolution flood forecasting and infrastructure calibration, these models often exhibit limited scalability due to high computational demand and sensitivity to parameter uncertainty. In contrast, the proposed framework adopts a performance-based attribution strategy using three standardized metrics—rainfall depth, runoff volume, and peak flow rate—to quantify subsystem contributions. This shift enables rapid, reproducible assessments even in data-scarce contexts, facilitating early-stage planning and adaptive design. Additionally, while SWMM and MIKE URBAN simulate flow propagation pathways, the proposed method evaluates functional contributions of subsystems based on simplified assumptions rooted in conservation laws. Table 4 illustrates these methodological contrasts. Furthermore, the proposed framework’s modularity supports potential integration with real-time monitoring systems, paving the way for hybrid modeling approaches that combine empirical diagnostics with simulation-based refinement.
Table 4.
Comparative Data Requirements and Model Complexity: Traditional Hydrological Models vs. Proposed Framework.
The data requirements for SWMM were referenced from Rossman [6] and Fletcher et al. [6], while those for MIKE URBAN were based on Arnbjerg-Nielsen et al. [8]. The impact of uncertainty calibration was examined in Dotto et al. [9]. The data needs of the proposed assessment method are detailed in Section 2.1 and Section 2.2.
While the proposed framework significantly reduces data and model complexity—requiring only 3 to 4 core parameters—it is not intended to replace traditional simulation models in fine-resolution drainage design. Instead, it can serve as a rapid assessment tool for early-stage planning, vulnerability screening, or sponge city project prioritization. In practice, the framework may be integrated upstream of SWMM or MIKE URBAN workflows, offering pre-calculated input estimations or spatial targeting for simulation refinement. This hybrid strategy enables adaptive management in data-rich regions and agile diagnostics in under-instrumented urban areas, ensuring flexible scalability across diverse planning scenarios.
In summary, the multi-dimensional quantitative assessment framework proposed in this study achieves a 70% reduction in data requirements while maintaining key analytical capabilities. This significantly lowers the barriers to implementation in small and medium-sized cities or resource-limited areas. Importantly, the methodology does not compromise the core hydrological principles necessary for reliable stormwater evaluation but rather simplifies high-resolution data dependencies and complex calibration procedures. This makes it particularly valuable for rapid flood risk diagnostics, especially in urban areas where detailed drainage network data and real-time monitoring capabilities are limited. Furthermore, this framework lays the foundation for future integration with smart drainage monitoring systems, enabling a multi-tiered urban hydrological management approach that balances data availability and analytical precision.
4.6. Theoretical Significance
The multi-dimensional assessment framework proposed in this study integrates rainfall depth, runoff volume, and peak flow rate to systematically reveal the nonlinear synergistic effects among source reduction, stormwater pipes, and drainage and flood control subsystems. Compared to traditional single-metric assessments, this framework provides a more comprehensive characterization of the complex source–process–end interaction mechanisms within urban stormwater systems. By quantitatively decomposing the contributions of each subsystem, the method overcomes the limitations of conventional assessment approaches and aligns with established hydrological theories, such as the SCS-CN method [2]. This aligns with growing interest in using multifunctional public spaces such as school lots to integrate GSI and enhance localized resilience through educational and participatory frameworks [20]. This approach not only advances the understanding of holistic stormwater system behavior but also lays a theoretical foundation for future optimization and design improvements.
4.7. Practical Implications
Based on the evaluation results, this study proposes optimization strategies for City A and similar urban environments to enhance stormwater management efficiency and flood resilience.
For source reduction, increasing green space coverage to 40% is expected to enhance initial runoff interception capacity, increasing rainfall depth contribution (GH,s) and runoff volume contribution (GV,s) from 10.6% to 15% [10]. Expanding low-impact development (LID) features, such as permeable pavements, green roofs, and rain gardens, could further strengthen infiltration capacity, reducing surface runoff generation.
For the stormwater pipe system, upgrading pumping stations and expanding drainage network capacity could increase peak flow contribution (GQ,sp) to 45%, ensuring efficient stormwater conveyance under high-intensity rainfall conditions [11]. Improving pipe diameter design standards, incorporating real-time flow regulation, and optimizing network connectivity could mitigate localized flooding risks and enhance drainage efficiency.
For the drainage and flood control system, optimizing the spatial configuration of retention facilities and reducing response times could lower peak flow by 15–20%, based on empirical studies on distributed retention systems [18]. Enhancing detention basin storage, implementing automated flood gate controls, and integrating multi-functional retention areas could significantly improve urban flood resilience, particularly during extreme precipitation events.
These strategies collectively have the potential to increase overall system effectiveness by 15–20%, significantly improving resilience to extreme rainfall events. Furthermore, the modular nature of the proposed assessment framework allows for seamless integration with real-time monitoring technologies, enabling a scalable and actionable approach for sustainable urban stormwater management. By incorporating smart drainage systems, data-driven predictive modeling, and adaptive infrastructure planning, cities can effectively mitigate flood risks while ensuring long-term hydrological stability.
4.8. Future Research Directions
To enhance the scientific rigor and practical applicability of urban stormwater system assessments, future research should focus on three key areas. First, the development of real-time monitoring-based dynamic capacity adjustment mechanisms could leverage high-frequency rainfall data and sensor feedback to adaptively regulate storage and drainage capacities, thereby improving responsiveness to extreme rainfall events. Second, the construction of a comprehensive evaluation framework that incorporates soil infiltration characteristics and urbanization dynamics is essential. While soil properties influence infiltration efficiency, urban expansion modifies runoff characteristics by increasing impervious surfaces, highlighting the need for more precise and adaptable assessments.
Lastly, expanding multi-scenario analyses through the simulation of diverse rainfall patterns and climate change scenarios would enable the quantification of long-term system stability and adaptability, providing scientific insights for planning and design. Future research may further explore predictive control strategies and layout optimization methods to dynamically enhance urban drainage resilience under extreme climate conditions [21]. Research indicates that the synergistic integration of dynamic adaptability and comprehensive assessments can effectively address urbanization and climate-induced water management challenges, thereby laying a solid foundation for sustainable urban stormwater management.
5. Conclusions
This study developed a novel, contribution-based, multi-dimensional evaluation framework for urban stormwater management systems by integrating three key hydrological indicators: rainfall depth, runoff volume, and peak flow rate. The application to City A demonstrated the framework’s capacity to accurately decompose subsystem contributions under varying rainfall scenarios, while reducing input data requirements by approximately 70% relative to conventional hydrodynamic models.
The framework provides a critical methodological advancement by shifting from simulation-heavy paradigms to an indicator-driven approach, offering a rapid, reproducible, and scalable solution for stormwater assessment. Its use of standardized metrics enables cross-scenario benchmarking and inter-city comparisons, making it particularly valuable for preliminary planning, sponge city development, and flood adaptation in resource-constrained settings.
Future enhancements should prioritize integrating real-time sensing technologies, climate-resilient design principles, and dynamic capacity adjustment mechanisms. Broader application across diverse urban morphologies and hydrological regimes will help validate its generalizability, support model hybridization with process-based tools, and facilitate informed decision-making for resilient urban water infrastructure systems.
Author Contributions
Conceptualization, methodology, formal analysis, writing—original draft, K.M.; data curation, validation, methodology, supervision, writing—review and editing, J.L. (Junqi Li); writing—review and editing, J.L. (Jiawei Li). All authors have read and agreed to the published version of the manuscript.
Funding
This work was supported by the National Key R&D Program of China (Grant No. 2022YFC3800500).
Data Availability Statement
Data are contained within the article.
Conflicts of Interest
The authors declare no conflicts of interest.
References
- UN-Habitat. World Cities Report 2020: The Value of Sustainable Urbanization; United Nations Human Settlements Programme: Nairobi, Kenya, 2020; Available online: https://unhabitat.org/world-cities-report-2020-the-value-of-sustainable-urbanization (accessed on 16 April 2025).
- IPCC. Climate Change 2021: The Physical Science Basis. Contribution of Working Group I to the Sixth Assessment Report of the Intergovernmental Panel on Climate Change; Cambridge University Press: Cambridge, UK, 2021. [Google Scholar] [CrossRef]
- Mahadeva, M.; Abhijth, C.C.; Harshith, V.E.; Leela, N.R.; Naik, N.S. A review on urban flooding in Bangalore: A growing environmental crisis. J. Environ. Eng. Stud. 2025, 10, 11–19. [Google Scholar] [CrossRef]
- Mao, Y.; Li, Y.; Bai, X.; Yang, X.; Han, Y.; Fu, X. Scenario-based green infrastructure installations for building urban stormwater resilience—A case study of Fengxi New City, China. Sustainability 2024, 16, 3990. [Google Scholar] [CrossRef]
- GB 50014:2021; Standard for Design of Outdoor Wastewater Engineering. Ministry of Housing and Urban-Rural Development of the People’s Republic of China. China Planning Press: Beijing, China, 2021.
- Rossman, L.A. Storm Water Management Model User’s Manual; version 5.1; U.S. Environmental Protection Agency: Cincinnati, OH, USA, 2015. Available online: https://www.epa.gov/water-research/storm-water-management-model-swmm (accessed on 16 April 2025).
- Fletcher, T.D.; Andrieu, H.; Hamel, P. Understanding, management and modelling of urban hydrology and its consequences for receiving waters: A state of the art. Adv. Water Resour. 2013, 51, 261–279. [Google Scholar] [CrossRef]
- Arnbjerg-Nielsen, K.; Willems, P.; Olsson, J.; Beecham, S.; Pathirana, A.; Bülow Gregersen, I.; Madsen, H.; Nguyen, V.T.-V. Impacts of climate change on rainfall extremes and urban drainage systems: A review. Water Sci. Technol. 2013, 68, 16–28. [Google Scholar] [CrossRef] [PubMed]
- Dotto, C.B.; Mannina, G.; Kleidorfer, M.; Vezzaro, L.; Henrichs, M.; McCarthy, D.T.; Freni, G.; Ashley, R.; Bertrand-Krajewski, J.-L. Comparison of different uncertainty techniques in urban stormwater quantity and quality modelling. Water Res. 2012, 46, 2545–2558. [Google Scholar] [CrossRef] [PubMed]
- Elliott, A.H.; Trowsdale, S.A. A review of models for low impact urban stormwater drainage. Environ. Model. Softw. 2007, 22, 394–405. [Google Scholar] [CrossRef]
- Ahiablame, L.M.; Engel, B.A.; Chaubey, I. Effectiveness of low impact development practices: Literature review and suggestions for future research. Water Air Soil Pollut. 2012, 223, 4253–4273. [Google Scholar] [CrossRef]
- Palla, A.; Gnecco, I. Hydrologic modeling of low impact development systems at the urban catchment scale. J. Hydrol. 2015, 528, 361–368. [Google Scholar] [CrossRef]
- Che, W.; Zhang, W. Urban water management for future cities. In Urban Water Management for Future Cities; Köster, S., Reese, M., Zuo, J., Eds.; Springer: Cham, Switzerland, 2019; pp. 3–11. [Google Scholar]
- Jia, H.; Yao, H.; Shaw, L. Advances in LID BMPs research and practice for urban runoff control in China. Front. Environ. Sci. Eng. 2013, 7, 709–720. [Google Scholar] [CrossRef]
- Freni, G.; Mannina, G.; Viviani, G. Uncertainty in urban stormwater quality modelling: The influence of model structure and calibration data. Sci. Total Environ. 2009, 408, 138–145. [Google Scholar] [CrossRef] [PubMed]
- Butler, D.; Davies, J.W. Urban Drainage, 3rd ed.; CRC Press: Boca Raton, FL, USA, 2011. [Google Scholar] [CrossRef]
- Raimondi, A.; Di Chiano, M.G.; Marchioni, M.L.; Sanfilippo, U.; Becciu, G. Probabilistic modeling of sustainable urban drainage systems. Urban Ecosyst. 2022, 26, 493–502. [Google Scholar] [CrossRef]
- Bach, P.M.; Rauch, W.; Mikkelsen, P.S.; McCarthy, D.T.; Deletic, A. A critical review of integrated urban water modelling—Urban drainage and beyond. Environ. Model. Softw. 2014, 54, 88–107. [Google Scholar] [CrossRef]
- Monachese, A.P.; Gómez-Villarino, M.T.; López-Santiago, J.; Sanz, E.; Almeida-Ñauñay, A.F.; Zubelzu, S. Challenges and innovations in urban drainage systems: Sustainable drainage systems focus. Water 2025, 17, 76. [Google Scholar] [CrossRef]
- Bosco, R.; Giacobbe, S.; Mozingo, L.A.; Valente, R. Urban green streets and water management safety hubs in public schools lots. IOP Conf. Ser. Earth Environ. Sci. 2024, 1402, 012011. [Google Scholar] [CrossRef]
- Chen, T.L.; Chen, L.; Shao, Z.; Chai, H. Enhanced resilience in urban stormwater management through model predictive control and optimal layout schemes under extreme rainfall events. J. Environ. Manag. 2024, 366, 121767. [Google Scholar] [CrossRef] [PubMed]
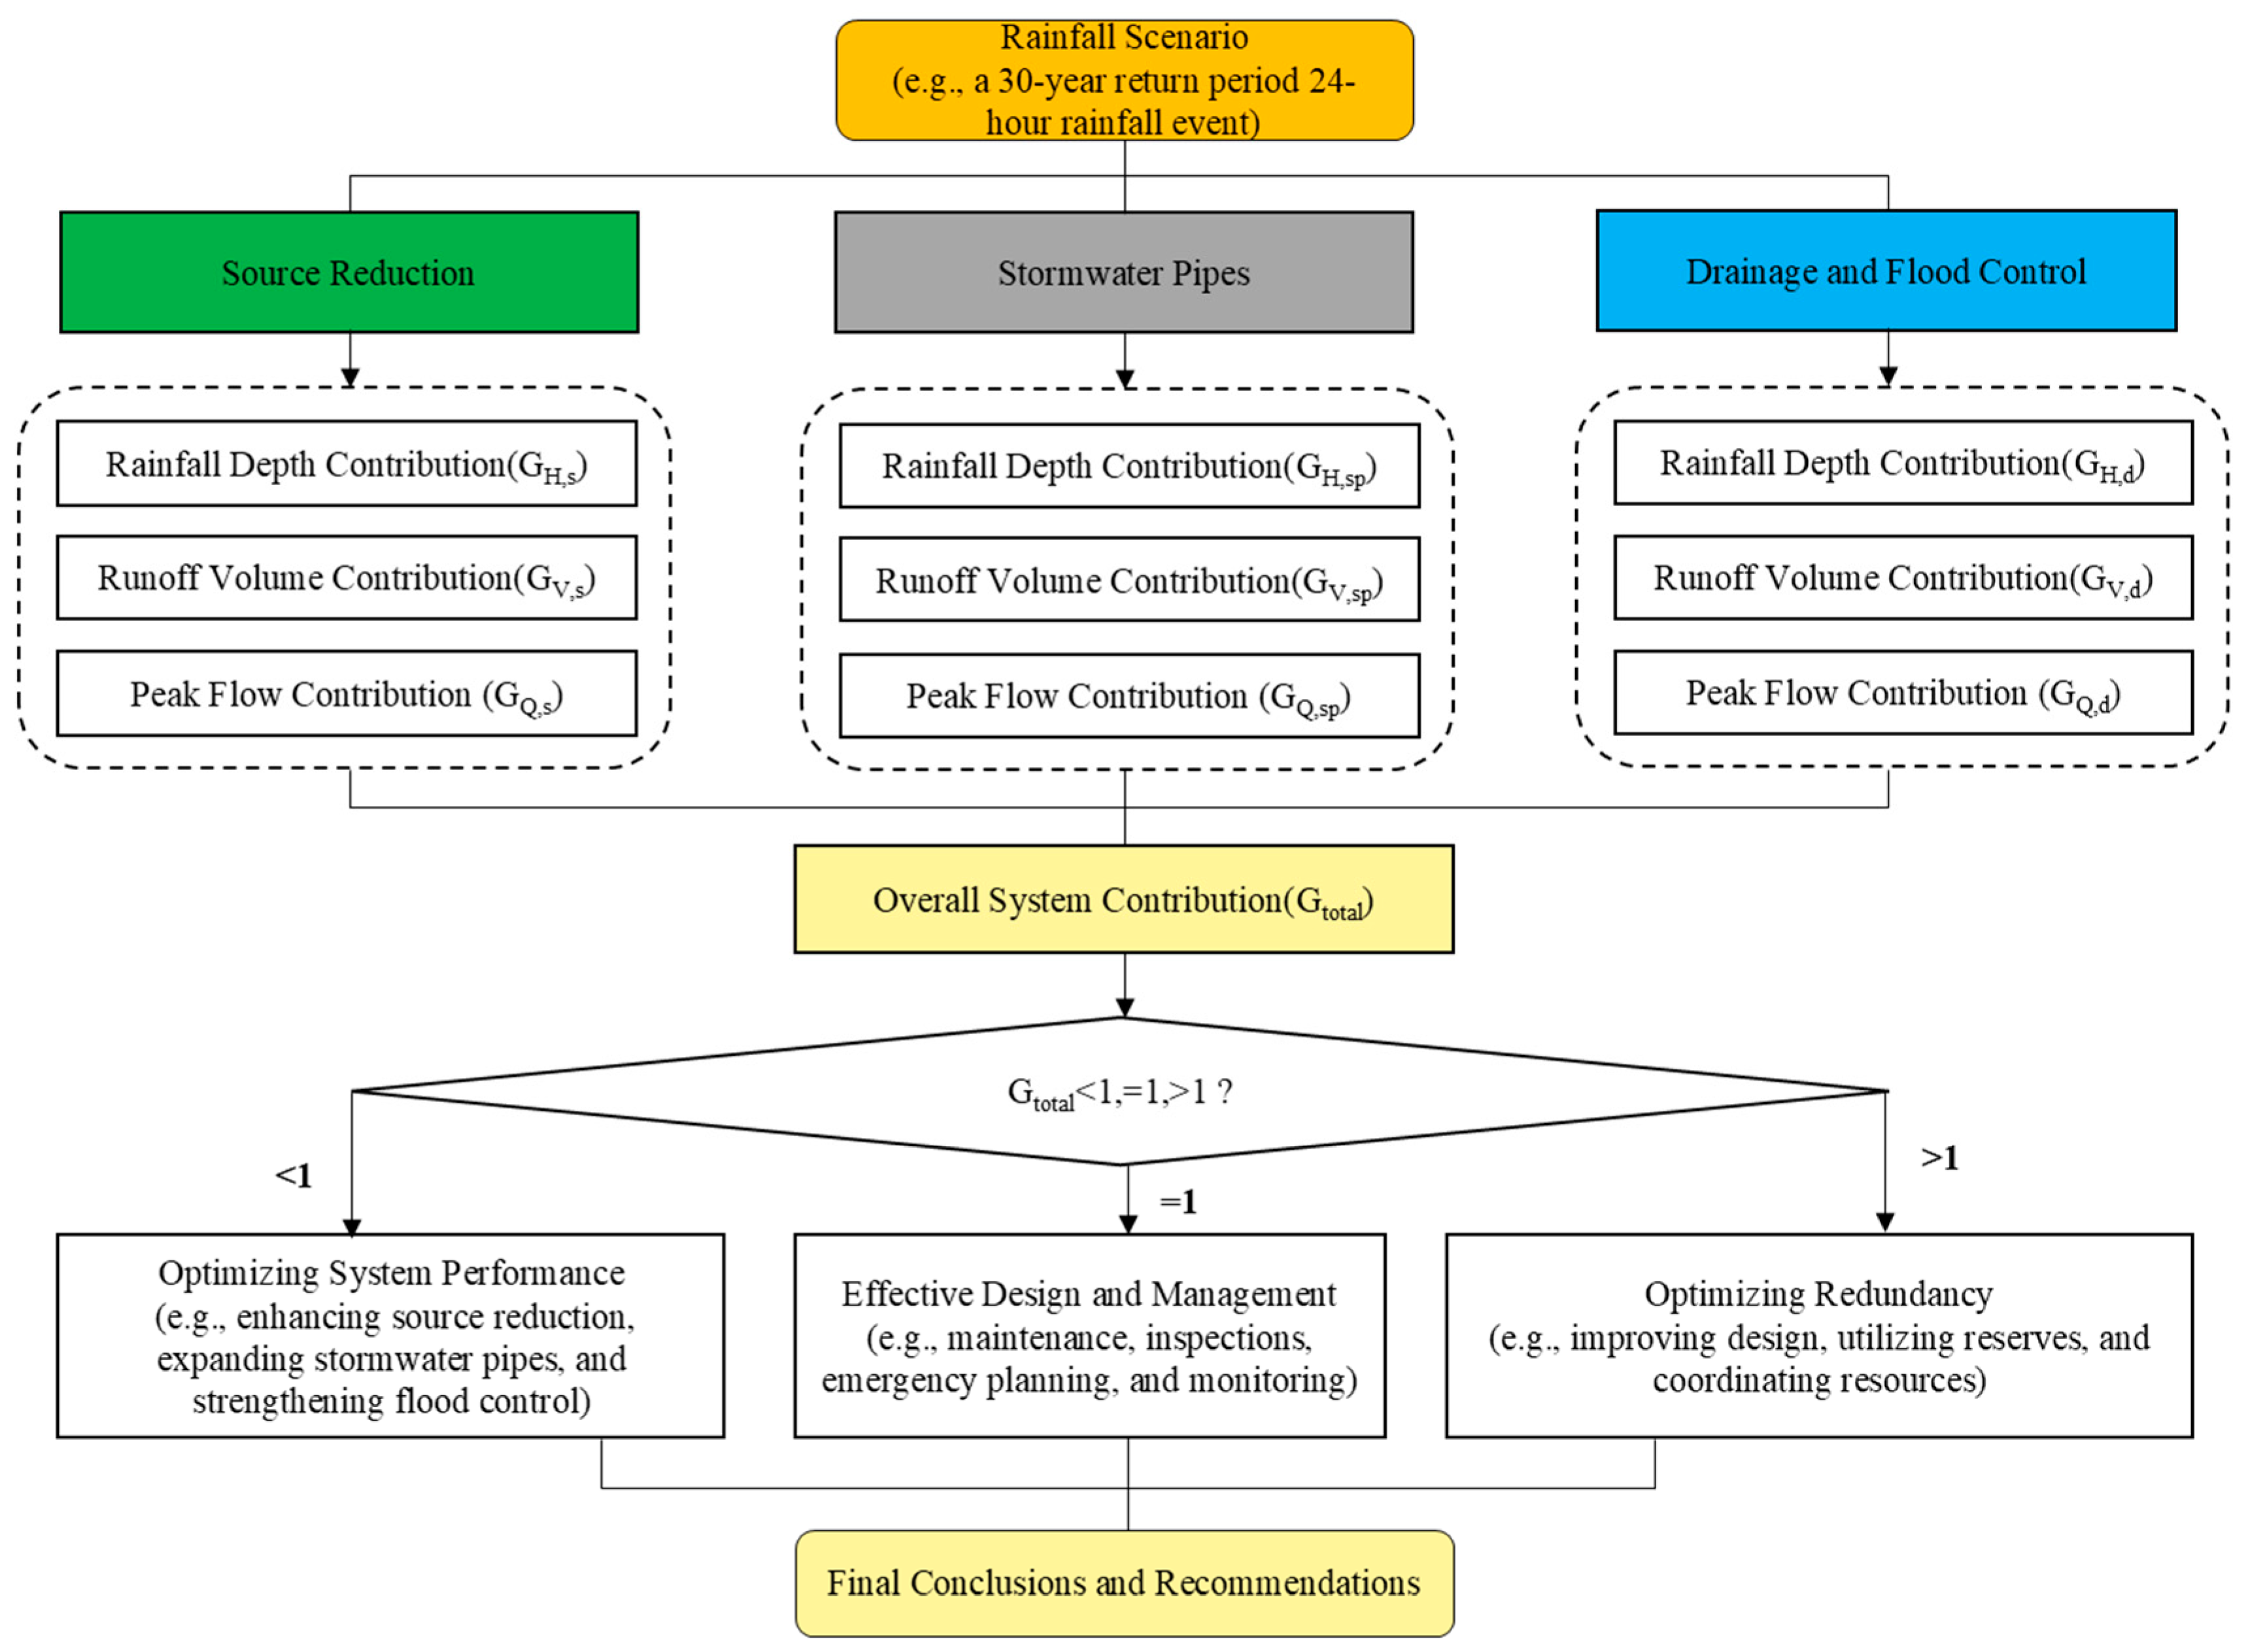
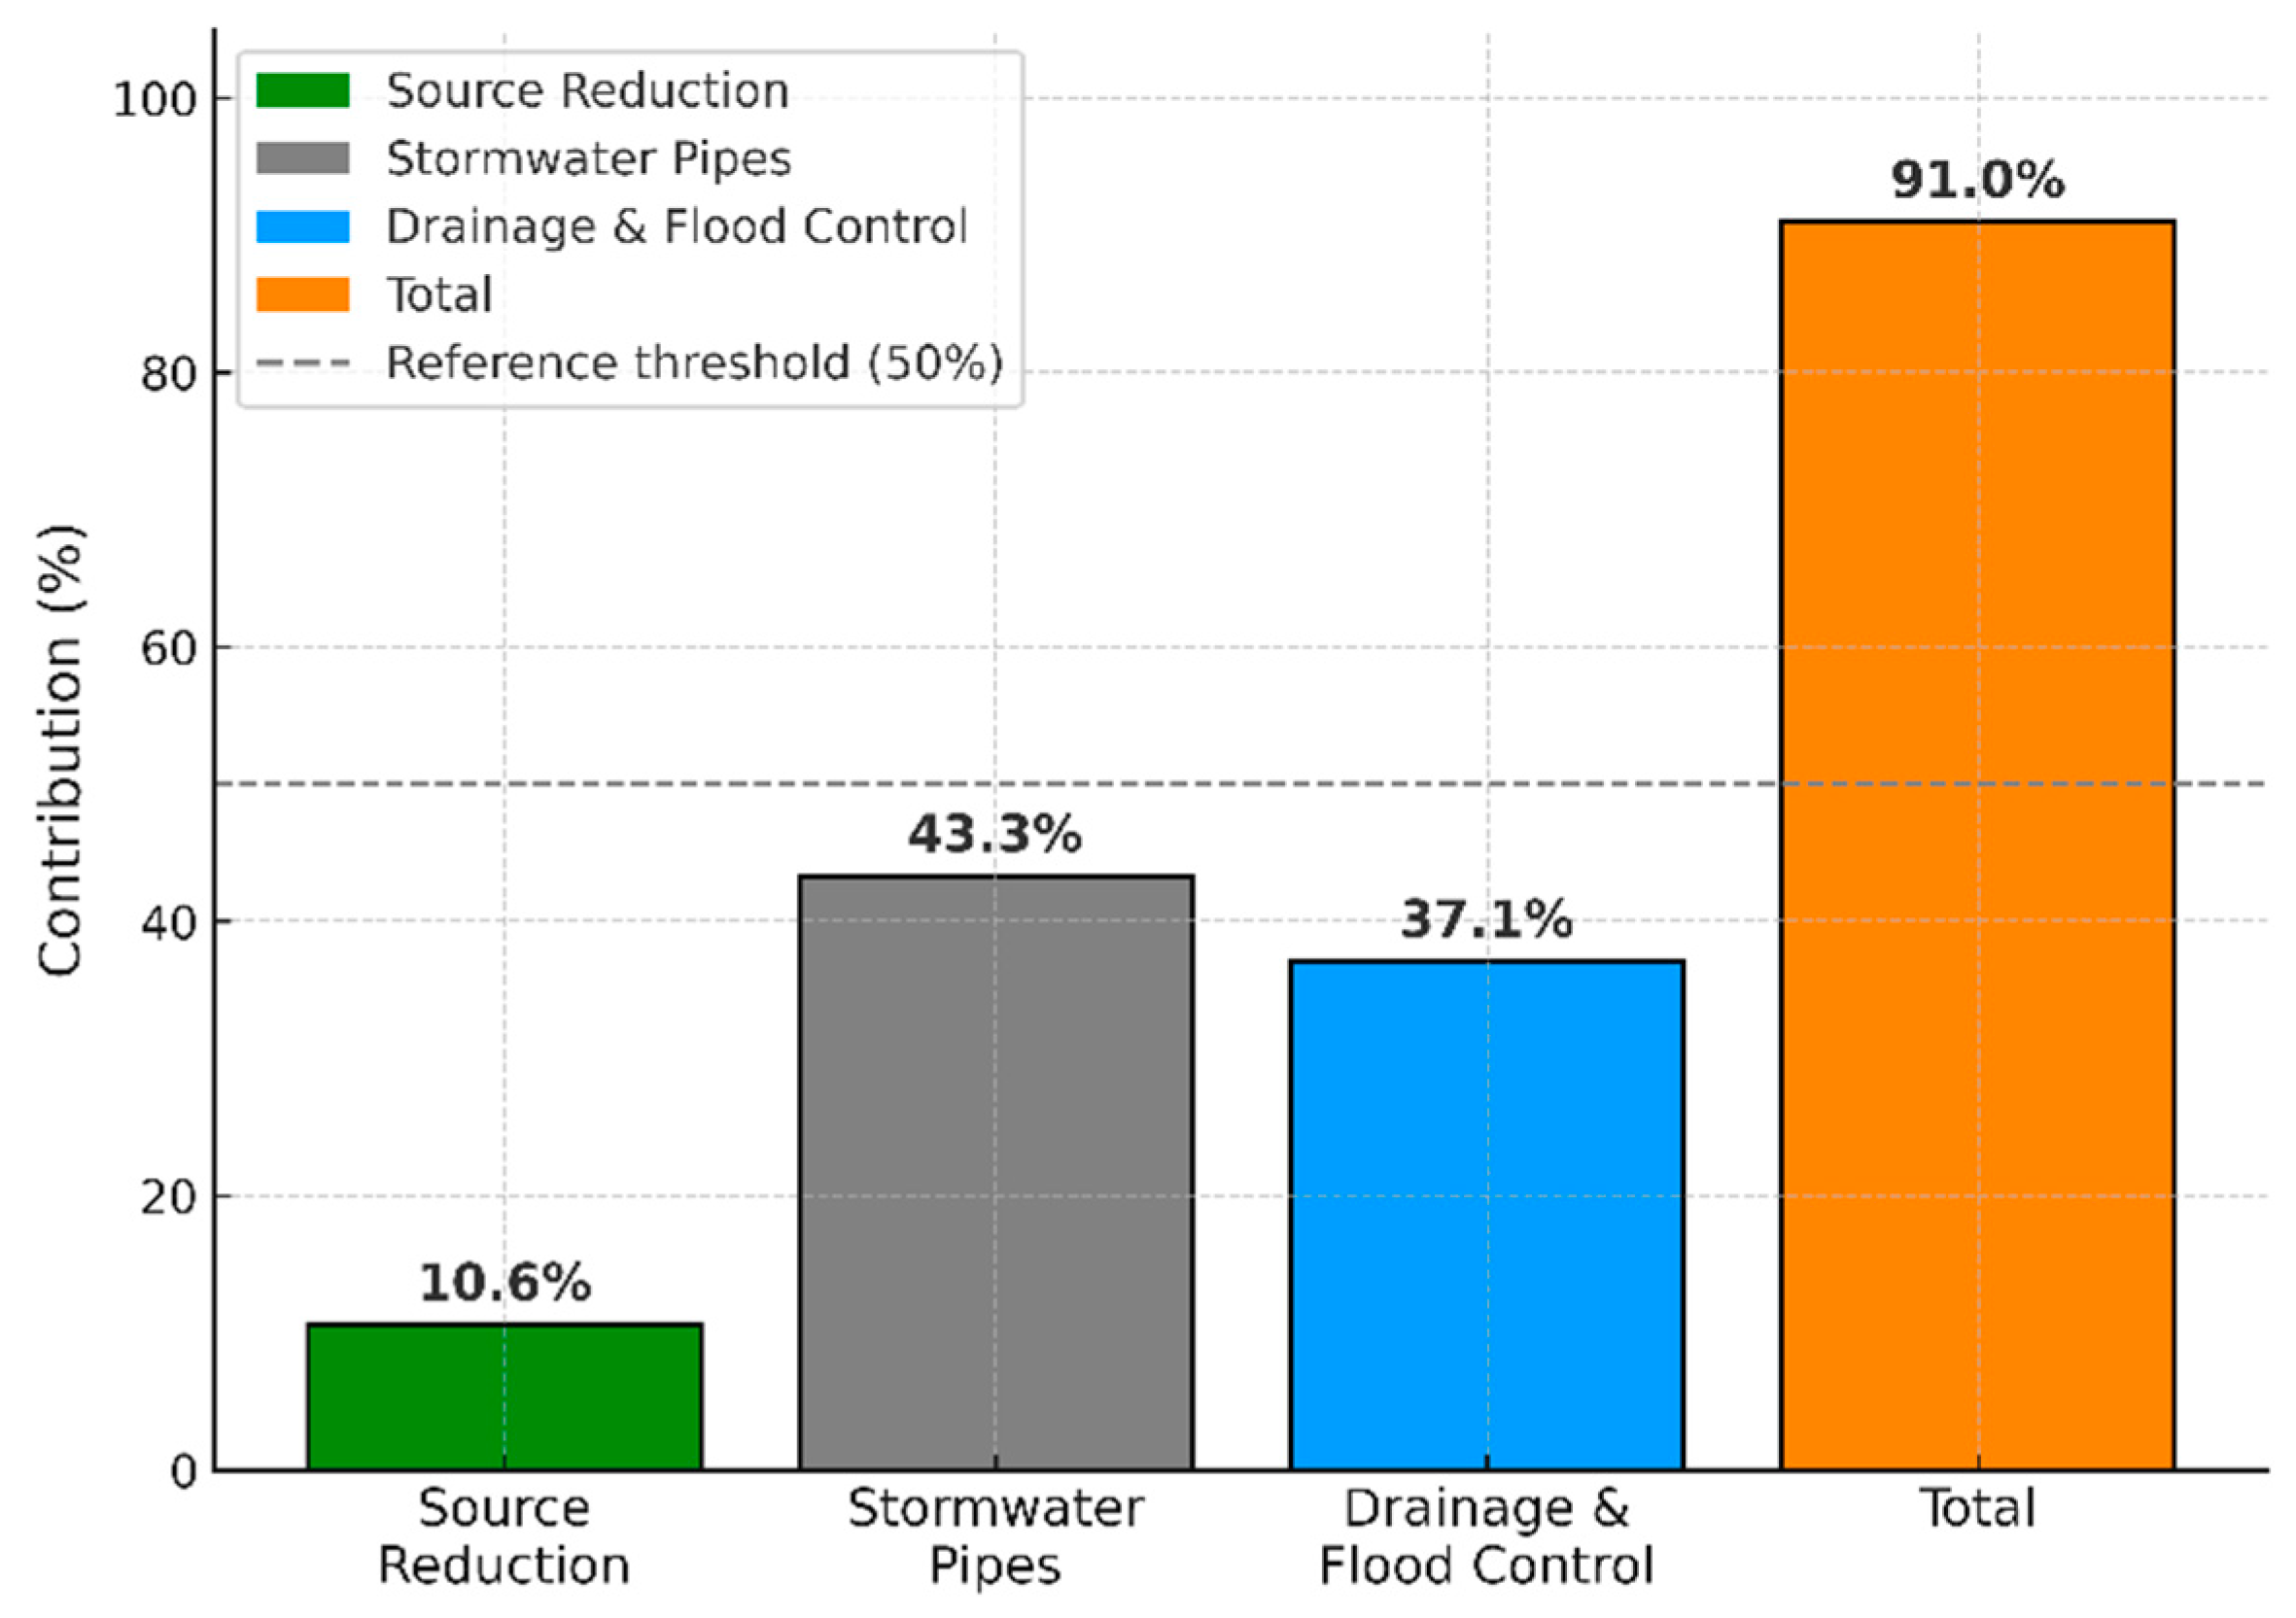


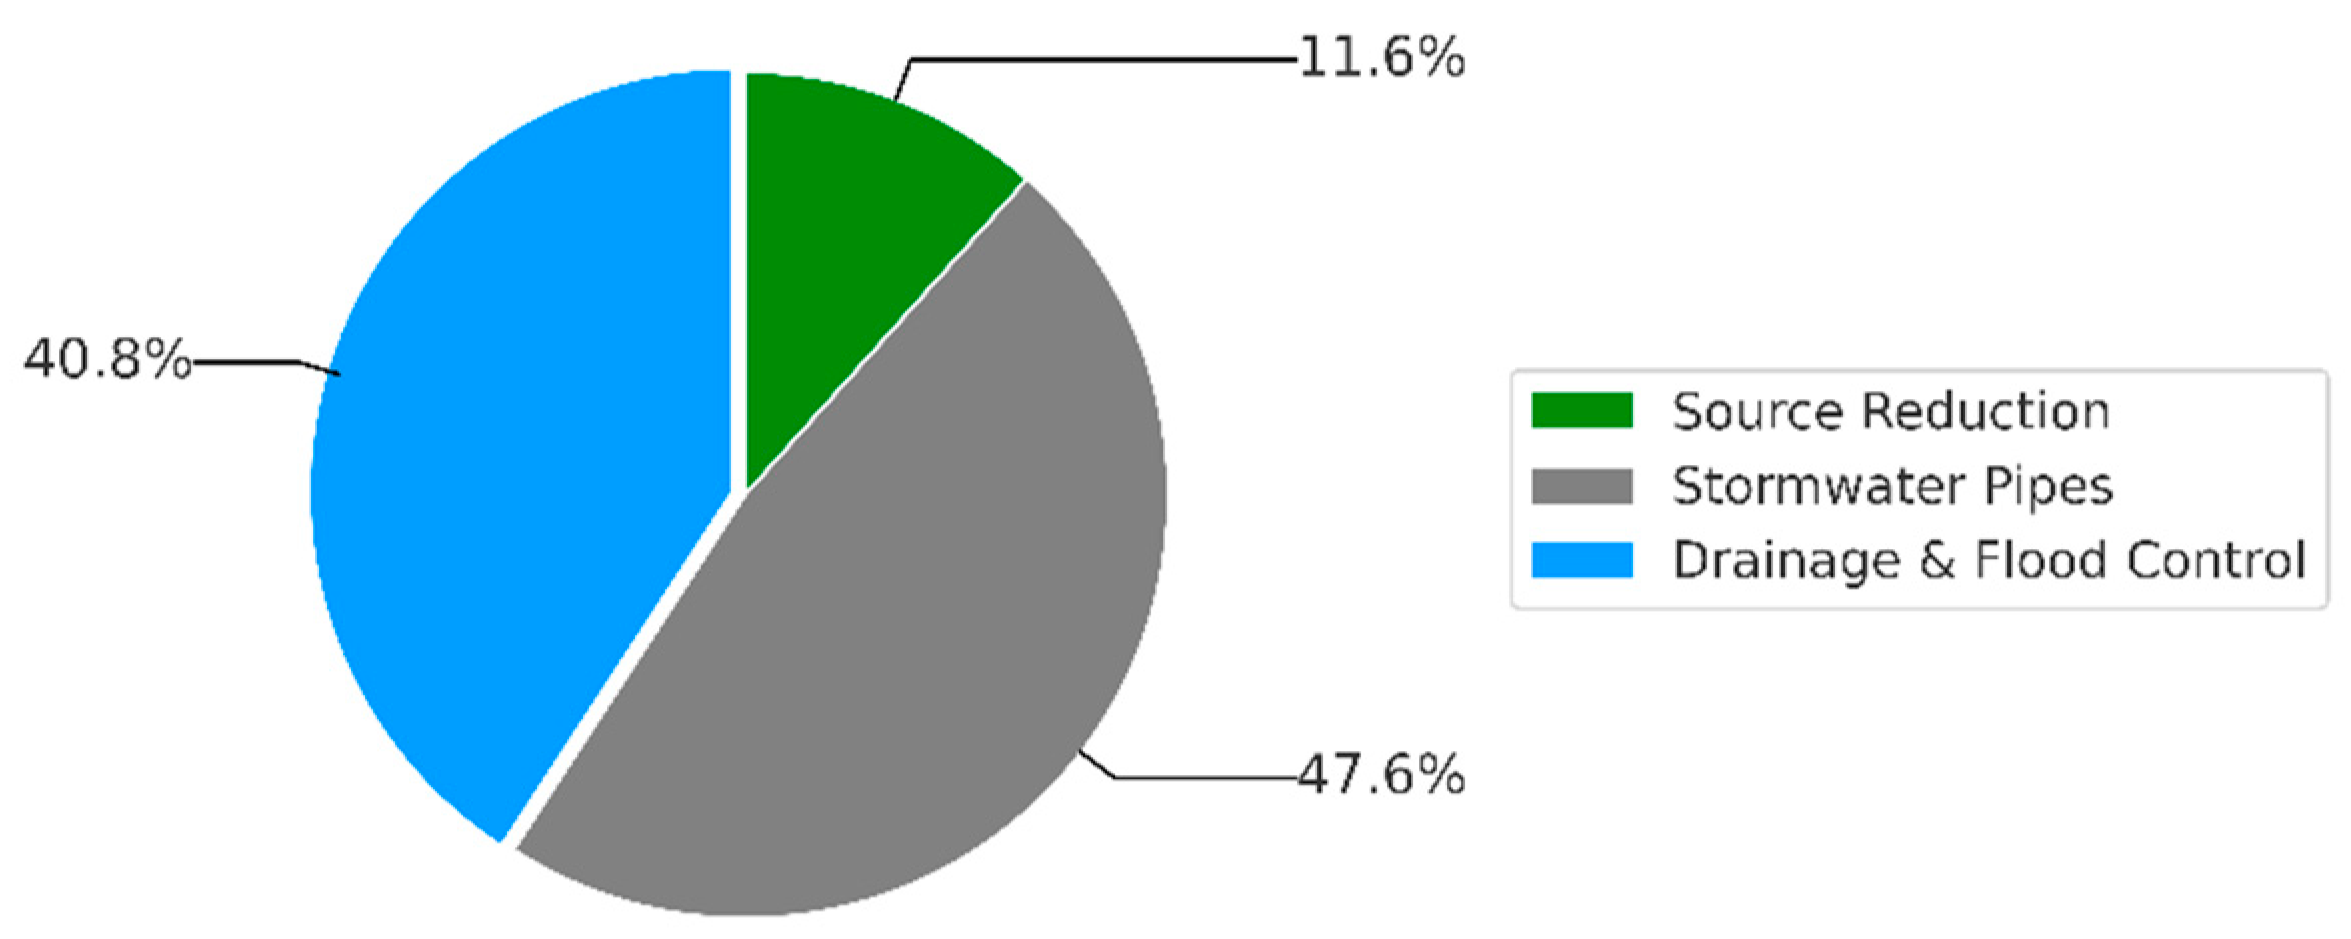
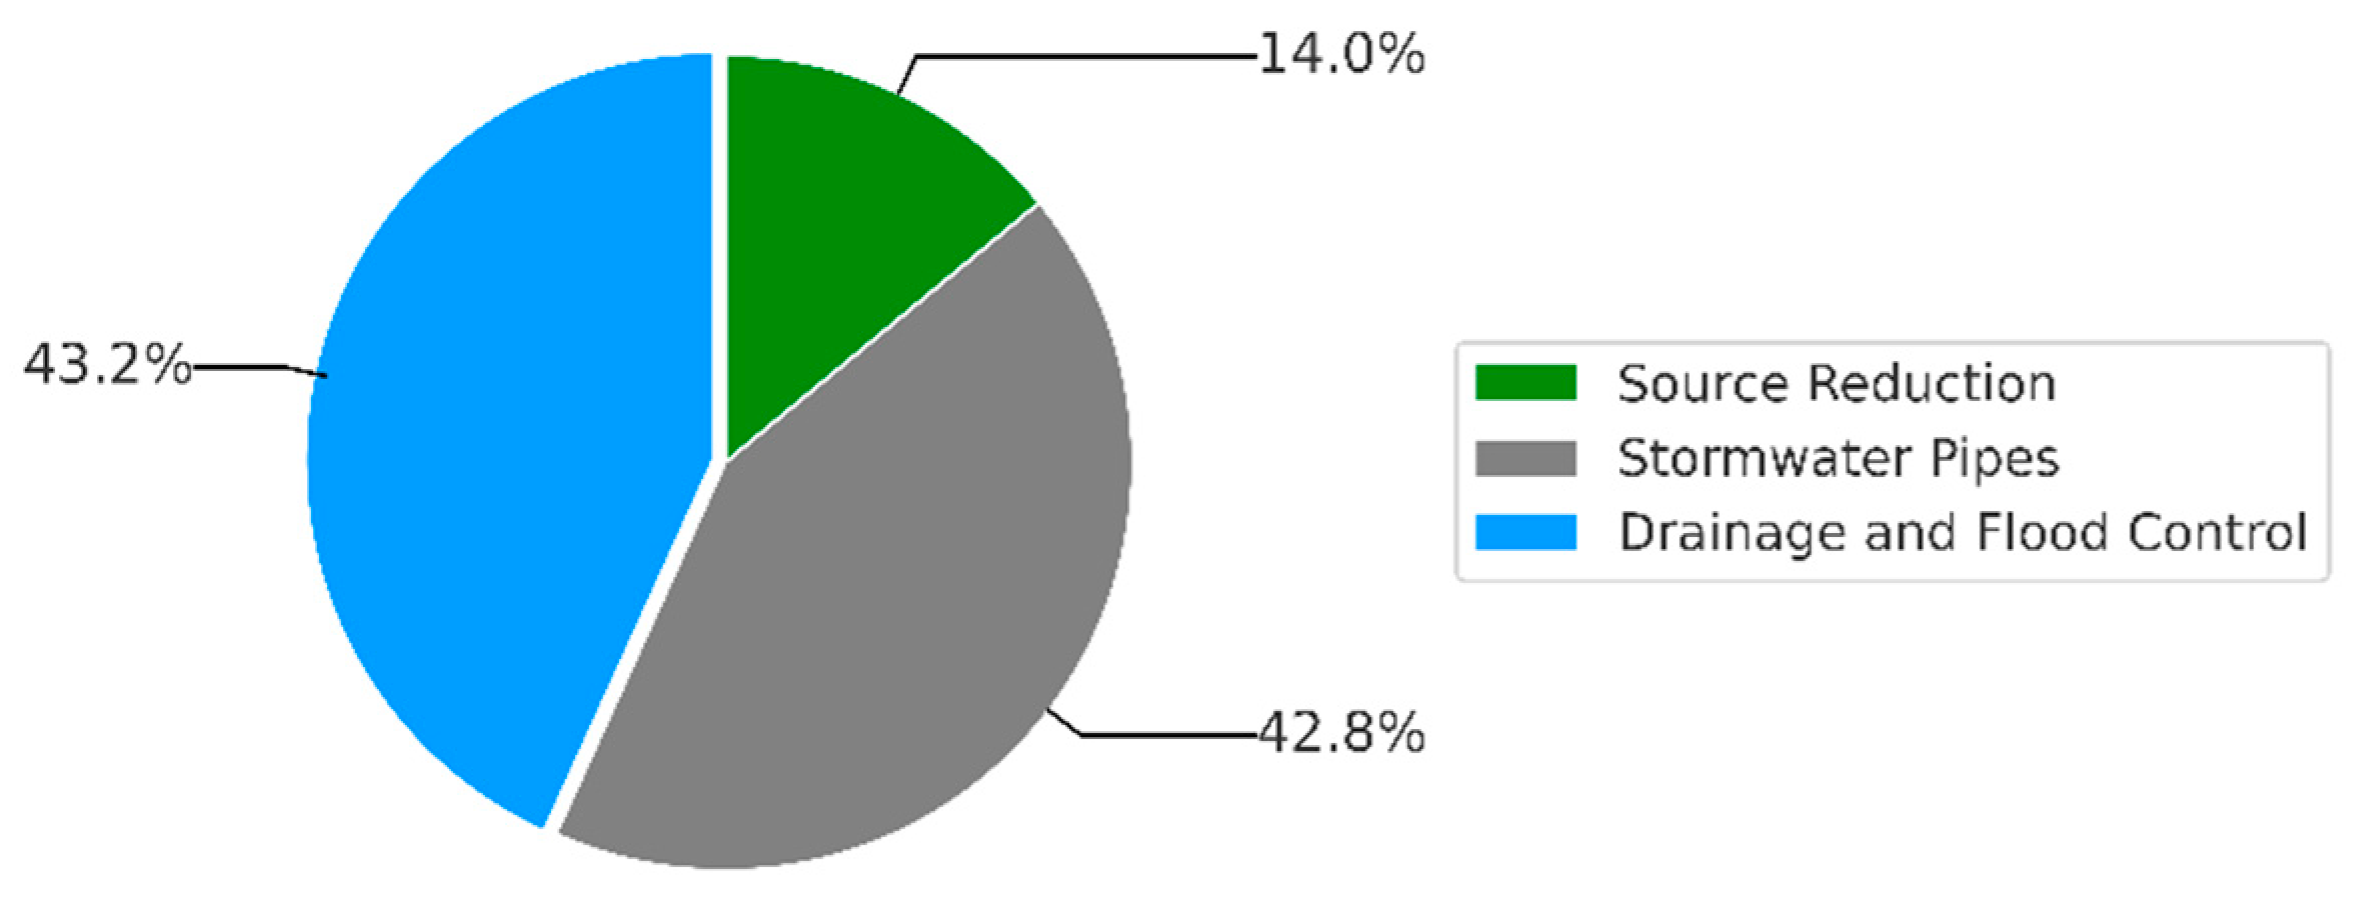
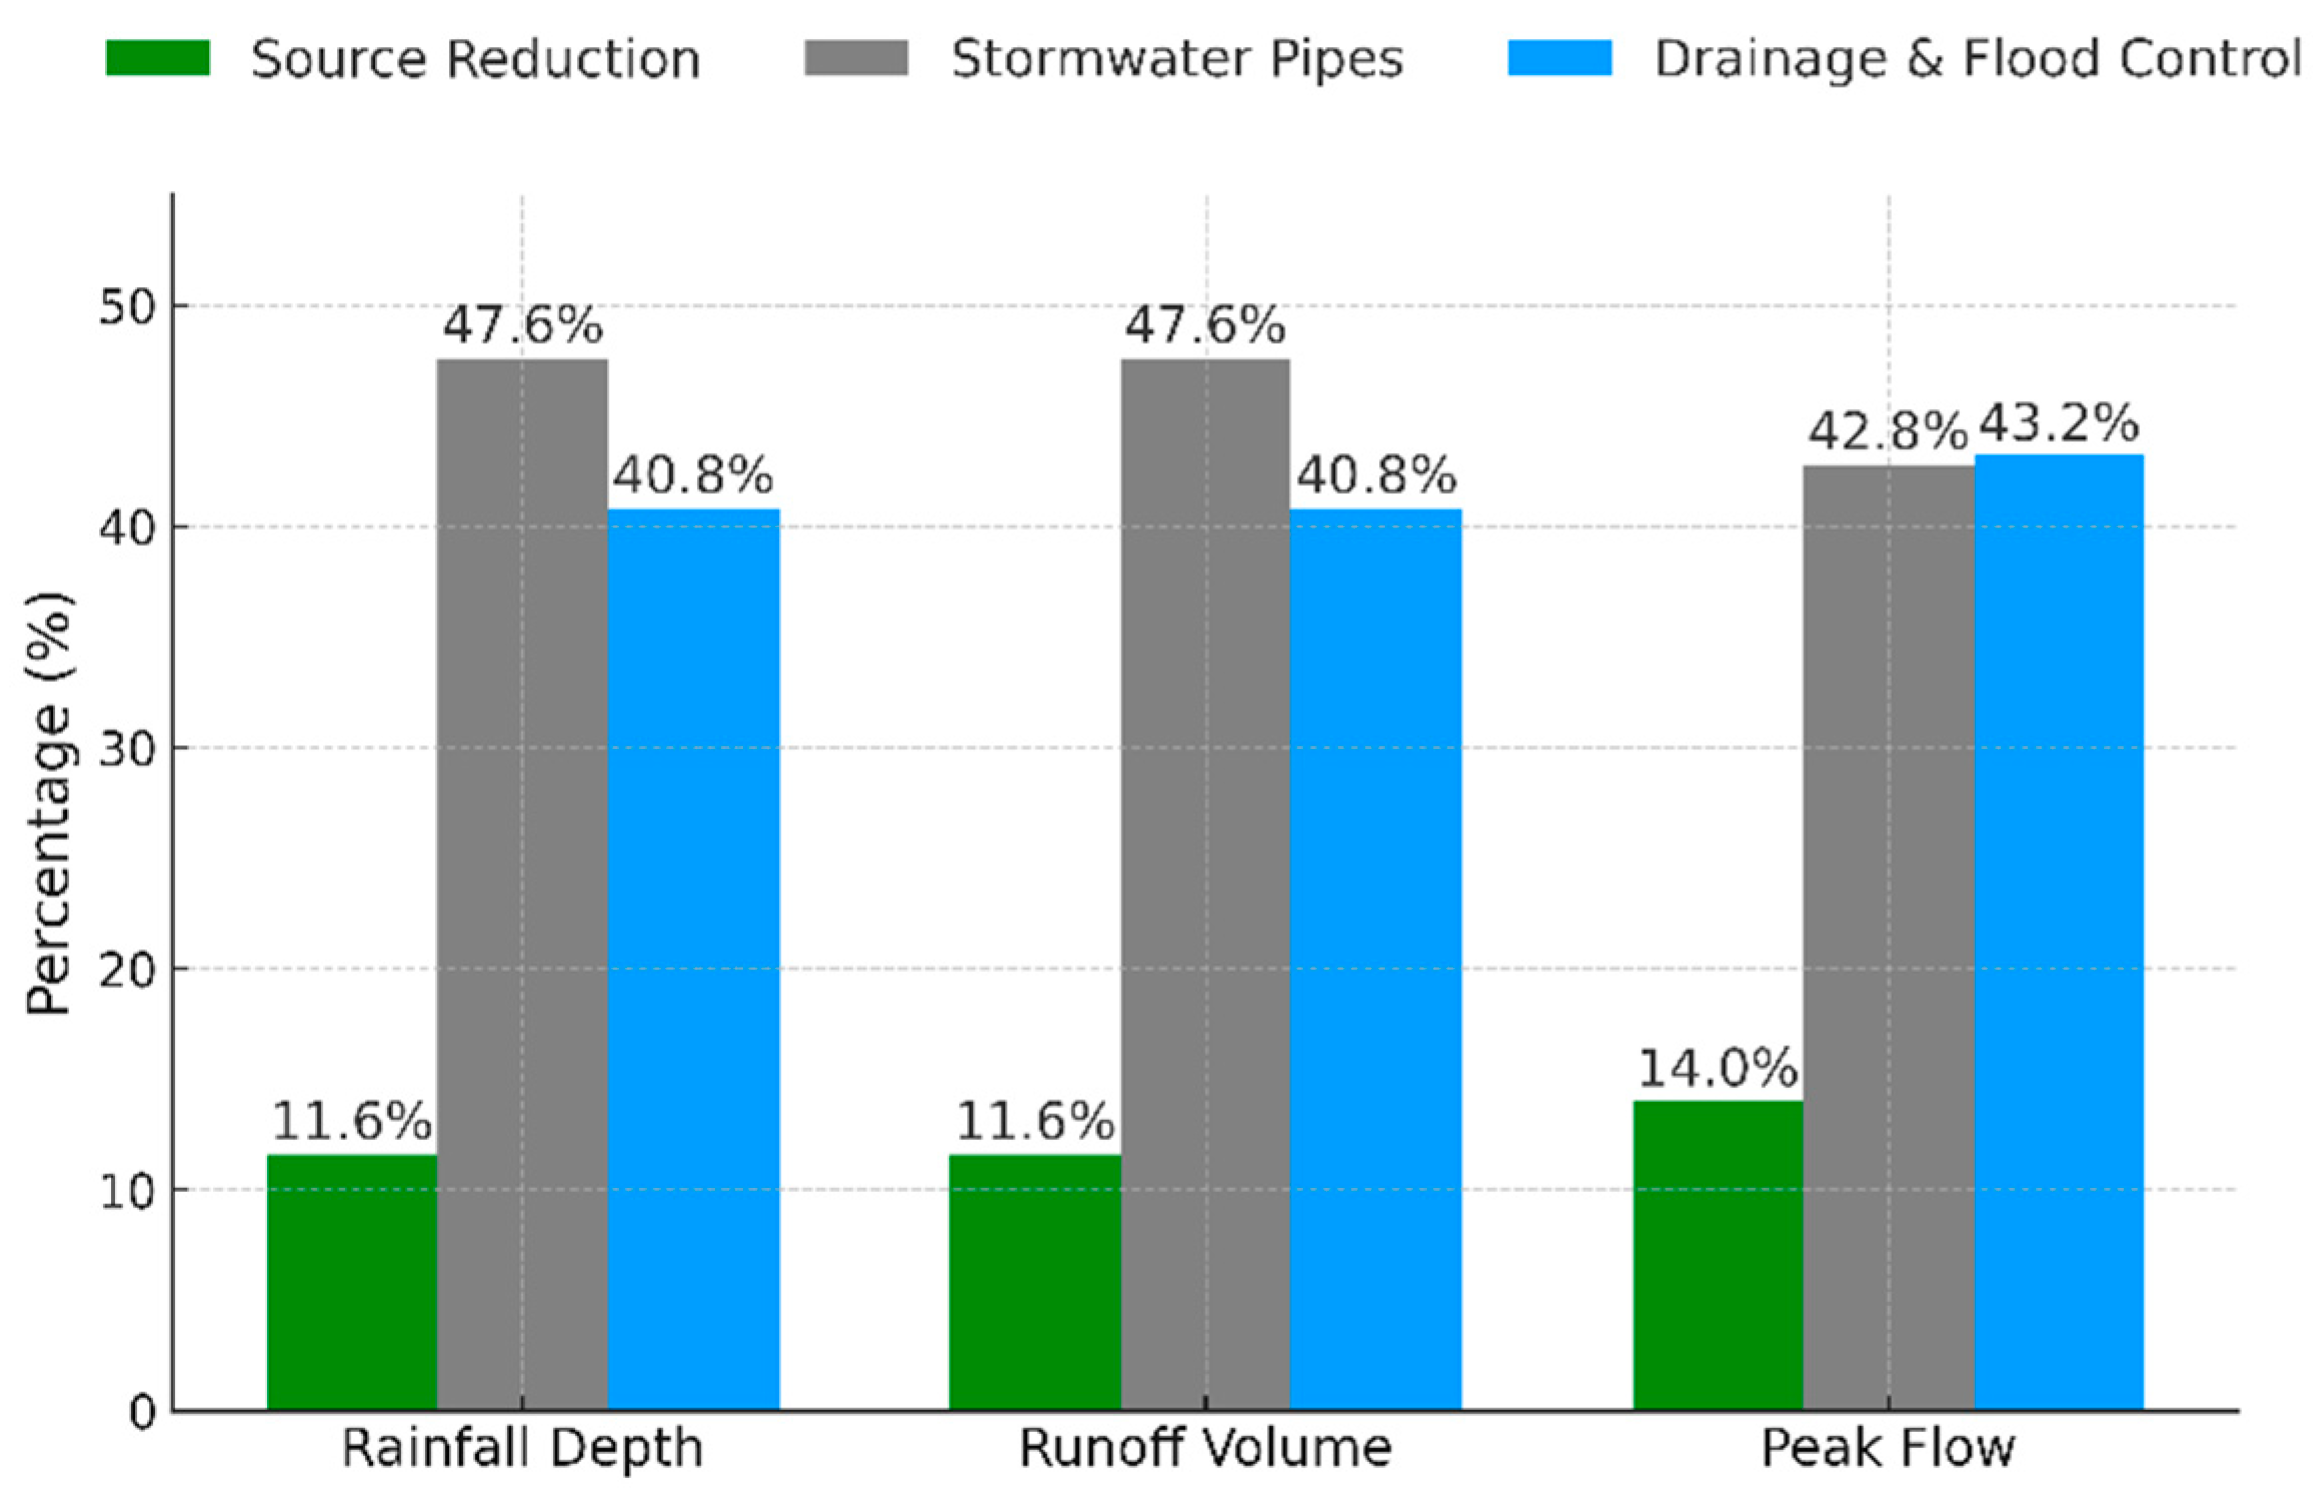
Disclaimer/Publisher’s Note: The statements, opinions and data contained in all publications are solely those of the individual author(s) and contributor(s) and not of MDPI and/or the editor(s). MDPI and/or the editor(s) disclaim responsibility for any injury to people or property resulting from any ideas, methods, instructions or products referred to in the content. |
© 2025 by the authors. Licensee MDPI, Basel, Switzerland. This article is an open access article distributed under the terms and conditions of the Creative Commons Attribution (CC BY) license (https://creativecommons.org/licenses/by/4.0/).