Abstract
Nitrogen (N) and phosphorus (P) losses from sloping agricultural lands through runoff are a significant environmental concern, yet their transport mechanisms across different slope gradients are not well understood. Therefore, we built an experimental site in a subtropical hilly region of China to explore the patterns of nitrogen and phosphorus loss in tea plantations under typical slopes. We set two slope gradients of 20° and 30°, with three plots for each gradient. We quantified the loss of nitrogen (N) and phosphorus (P) through surface flow and interflow on these two slope gradients. We also collected meteorological data through the meteorological station we built. A total of 17 rainfall events were recorded. Results showed that total nitrogen (TN) and phosphorus (TP) concentrations in surface flow on the 30° slope were 8.9% and 31.6% higher, respectively, than on the 20° slope. In interflow, the differences were even more pronounced, with TN and TP concentrations 68.5% and 218.1% higher on the 30° slope. Overall nutrient loss loads (combining surface and interflow pathways) were significantly greater on the steeper slope, with TN and TP loss loads being 2.58 and 3.43 times higher on the 30° slope than on the 20° slope. The composition analysis revealed that dissolved nitrogen (DN) dominated nitrogen transport, accounting for 68.6% of TN in surface flow and 97.8% in interflow, while dissolved phosphorus (DP) represented 35.0% of TP in surface flow and 57.0% in interflow. Initially, TN and TP concentrations in surface flow were high and decreased as runoff generation time increased. Correlation analysis showed that higher temperatures increased TN and TP concentrations in surface flow. On the 30° slope, increased soil moisture promoted higher concentrations of soluble P. Instantaneous rainfall intensity was significantly correlated with TN and TP concentrations in surface flow under both slope gradients. This study revealed N and P loss patterns in tea gardens on steeper slopes, offering guidance for controlling nutrient loss in sloping farmland.
1. Introduction
The intensification of agricultural activities has become a major driver of non-point source pollution, particularly in regions with sloping terrains [1]. Recent estimates suggest that agricultural runoff contributes over 40% of nitrogen and 35% of phosphorus inputs to freshwater systems in developing countries with intensive farming practices [2]. In the hilly regions of China, the combination of intensive farming practices, steep topography, and subtropical monsoon climate exacerbates nitrogen (N) and phosphorus (P) losses through agricultural runoff [1,3,4]. While these nutrients are essential for crop growth, their transport via runoff significantly contributes to eutrophication in downstream water bodies, leading to water quality degradation and ecosystem disruption [5,6].
Extensive research has explored N and P loss dynamics from sloping cropland, highlighting the role of surface flow in transporting particulate-bound nutrients and eroded soil particles [7,8]. These studies have established that slope gradient significantly influences soil erosion rates and nutrient transport mechanisms, with steeper slopes generally associated with higher nutrient losses. For example, Gao et al. noted that steeper slopes result in greater erosive effects and higher nutrient loss. Their study showed that on a 40° slope, the sand production rate was 123.86 times higher than on a 10° slope [9]. Fu et al. also found that slope significantly affects soil erosion. Specifically, steeper slopes are more prone to soil and nutrient loss. Their study showed that the soil erosion from a 58% slope was 2.23 times higher than on a 9% slope [10]. However, there are differing views on how slope affects nitrogen and phosphorus loss. Jourgholami et al. found that increasing the slope from 20° to 25° increased soil erosion and runoff. However, when the slope exceeded 25°, both runoff and soil erosion decreased [11]. Fang et al. conducted indoor simulated rainfall experiments to analyze the runoff characteristics of two types of loess at different slopes. The results showed that runoff for both soil types followed a “bell-shaped curve”, first increasing and then decreasing with slope. The critical slopes were 36.4% and 26.8%, respectively [12]. Wu et al. developed a theoretical model coupling the improved Green-Ampt infiltration, kinematic wave runoff, and WEPP erosion models to analyze the spatiotemporal impacts of slope on runoff erosion and soil erosion [13]. The results showed that under short-duration rainfall, runoff erosion force and erosion amount followed a “bell-shaped curve” with slope. The critical slope ranged from 10° to 30° for short durations, disappearing for longer durations. Existing studies indicate that a higher slope does not always result in greater surface flow. After reaching a certain threshold, surface flow decreases with increasing slope. At this point, interflow—the lateral movement of water within the soil profile—plays a key role in nutrient loss due to changes in hydrodynamics and infiltration characteristics [14,15]. Recent modeling studies reveal that interflow can account for 35–60% of total phosphorus transport in steeply sloped red soil regions, challenging traditional surface runoff dominated paradigms [16]. This transition from predominant surface flow to significant interflow contribution represents a critical but often overlooked pathway for nutrient transport in sloping agricultural lands. Rainfall intensity and frequency further modulate these processes [17]: high intensity rainfall generates strong surface flow, scouring soil surfaces and washing away N and P bound to soil particles. In contrast, low intensity, prolonged rainfall enhances the dissolution and leaching of N and P, increasing their transport via interflow [18,19]. These temporal variations in precipitation patterns, combined with spatial heterogeneity in landscape features, create complex nutrient loss dynamics that require sophisticated monitoring and modeling approaches to fully understand and predict.
Sloping tea plantations, with their unique topography, vegetation, and intensive agricultural activities, have gained increasing attention in environmental and agricultural research [20]. China’s tea cultivation area has expanded by 28% since 2010, with over 70% of plantations located on slopes >10°, creating specific hydrological challenges [21]. Tea trees, with their extensive leaf and root systems, intercept rainfall and mitigate raindrop impact, reducing soil erosion risks [22]. However, their strong root absorption alters soil water distribution, promoting deeper infiltration and complicating nutrient migration patterns through interflow [23]. Furthermore, conventional tea cultivation practices often involve heavy applications of nitrogen and phosphorus fertilizers—sometimes exceeding 450 kg N ha−1 yr−1 and 50 kg P ha−1 yr−1—to maintain high yields and quality, creating substantial potential for nutrient losses [24]. In recent years, growing environmental awareness and increasingly stringent water quality regulations have highlighted the urgent need to study nutrient loss mechanisms in sloping tea plantations and their interactions with environmental factors such as slope gradient, soil properties, and meteorological conditions [25]. While research has identified the importance of both surface flow and interflow in nutrient transport, the specific pathways and mechanisms of N and P losses in sloping tea plantations remain incompletely characterized.
Therefore, this study focused on sloping tea plantations in Chun’an County, Hangzhou City, Zhejiang Province, Southeast China—a region characterized by a subtropical monsoon climate and intensive tea cultivation. Using advanced monitoring equipment and systematic sampling protocols, we examined rainfall and runoff characteristics across experimental plots with two slope gradients (20° and 30°) to provide critical insights into the mechanisms governing the transport of N and P under varying slope gradients in sloping tea plantations. Specifically, this study aims to (1) compare N and P concentration characteristics under two slope gradients via surface and interflow, (2) compare N and P loss load characteristics under two slope gradients via surface and interflow, and (3) explore the interactions between nutrient concentrations in surface and interflow with key environmental factors. The novelties of this research are (1) focus on the characteristics of nitrogen and phosphorus losses in surface runoff and subsurface flow from tea plantations in subtropical hilly regions under different slope gradients (20° and 30°) and (2) explore the key environmental factors influencing nitrogen and phosphorus losses in sloping tea plantations by Mantel correlation and redundancy analysis.
2. Materials and Methods
2.1. Experimental Site
The study was conducted in Tangkeng Village (29.4° N, 118.86° E, 168.7 m), located within the Shangwu Creek watershed in Chun’an County, Hangzhou City, Zhejiang Province, Southeast China (Figure 1a). The region experiences a subtropical monsoon climate, with an average annual rainfall of 1596 mm and an average temperature of 18.6 °C (2023–2024). The terrain is primarily medium to low hills, with yellow-red loam as the dominant soil type. The topsoil (0–10 cm) is classified as clay loam. Table 1 presents the basic soil data for the two slope gradients investigated in this study. As shown in Table 1, there are notable differences in several soil parameters between the 20° and 30° slopes: The most pronounced difference is in soil bulk density, which is significantly lower on the 30° slope (averaging around 0.87 g/cm3) compared to the 20° slope (averaging around 1.81 g/cm3). The soil on the 30° slope is slightly less acidic (pH 5.01 ± 0.07) than on the 20° slope (pH 4.71 ± 0.03). The TP content is lower on the 30° slope (478.6 ± 14.4 mg/kg) compared to the 20° slope (657.5 ± 50.5 mg/kg).
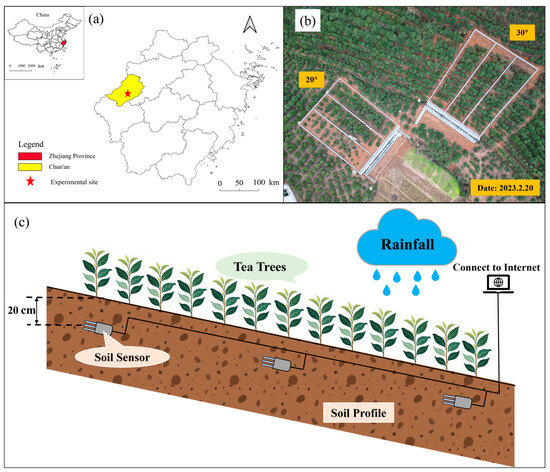
Figure 1.
Location map (a), overhead view (b), and soil profile (c) of the experimental plot.

Table 1.
The basic soil data of the nitrogen and phosphorus loss observation experiment plot.
2.2. Experimental Design
Two slope gradients (20° and 30°) were selected, each with three parallel runoff plots. Each plot covered 100 m2 (20 m × 5 m), separated by cement fences to prevent water exchange between areas. The fences extended 20 cm above and 30 cm below ground. At the base of each plot, a runoff collection tank, equal in length to the plot’s width, was installed. A flow guide pipe at the lowest point of the tank, equipped with a valve, facilitated instantaneous runoff sampling. The pipe directed runoff to a collection bucket fitted with a liquid level meter to measure runoff volume. An overflow conduit at the top of the collection bucket connects to a spare diversion bucket and a tipping bucket flow meter, allowing for runoff collection and flow recording during high runoff events. A PVC pipe, sealed at both ends with a central opening, was inserted into the soil to collect interflow at varying depths based on insertion depth. A weather station adjacent to the runoff plots recorded real-time meteorological data, including rainfall, temperature, wind speed and direction, and humidity. Soil sensors installed 20 cm deep at the upper, middle, and lower sections of each plot monitored soil moisture and temperature (Figure 1c).
2.3. Sample Collection and Measuring
The monitoring period, spanning May 2023 to September 2024, included two rainy seasons (May–September 2023 and May–September 2024). Prior to monitoring, soil samples from the 0–20 cm tillage layer were collected by combining five subsamples per plot. Bulk density was determined using the ring knife method [18]. Air-dried, 2 mm-sieved samples were mixed with distilled water (1:5 ratio) to measure pH using a precision pH meter (Shanghai INESA Scientific Instrument Co., Ltd., PHS-3C, Shanghai, China). Parameters such as total carbon (TC), total N (TN), organic matter (SOC), available P (AP), and available potassium (AK) were analyzed using an elemental analyzer (Vario MAX CNX, Elementar, Germany). Nitrate nitrogen (NO3−-N) and ammonia nitrogen (NH4+-N) were quantified by UV spectrophotometry and colorimetry, respectively, following 2 mol L−1 potassium chloride (Sinopharm Chemical Reagent Co., Ltd., Shanghai, China) extraction. Total P (TP) was determined through sulfuric-perchloric acid (Sinopharm Chemical Reagent Co., Ltd., Shanghai, China) digestion and molybdenum-antimony colorimetry. Runoff samples were collected in clean polyethylene bottles at 0, 5, 15, 25, 35, and 45 min after flow initiation. Following flow cessation, mixed runoff samples were prepared by stirring the bucket’s runoff and sediment. Interflow samples were obtained 1 h post-event using designated collection tubes.
Unfiltered runoff and interflow samples were thoroughly mixed to determine TN and TP. TN was measured using alkaline potassium persulfate (Sinopharm Chemical Reagent Co., Ltd., Shanghai, China) digestion and UV spectrophotometry (HJ 636-2012) [26], while TP was analyzed via ammonium molybdate spectrophotometry (GB 11893-89) [27]. Filtered samples (0.45 μm) were tested for dissolved nitrogen (DN) and phosphorus (DP) using the same methods. Particulate nitrogen (PN) and particulate phosphorus (PP) are calculated by subtracting DN and DP from TN and TP. NO3−-N and NH4+-N were measured by UV spectrophotometry and colorimetry with Nano reagent, respectively. Suspended solids (SS) were quantified by gravimetric analysis (GB 11901-89) [28].
2.4. Data Processing and Statistical Analysis
A total of 17 rainfall events were recorded during data collection and analysis. For each rainfall event, the runoff depths of surface flow and interflow were calculated using Equation (1) [29]:
where V is the runoff volume of surface flow and interflow (L) and A is the area of the plot (m2). HYDRUS-2D was specifically employed in this study to model subsurface water movement and quantify interflow volumes that could not be directly measured in the field. Our primary modeling objectives were to (1) simulate the temporal dynamics of subsurface water movement along the soil profile during and after rainfall events and (2) calculate the cumulative interflow volumes at the lower boundary of the experimental plots. The geometric type was set to 2D General Vertical Plane, with length units in cm and model precision at the default value of 0.00714 cm. We selected water flow and root water uptake as the main processes to be modeled, excluding the Dual-Permeability Model since our preliminary soil analyses indicated that macropore flow was not a dominant process in the experimental soils. The simulation duration depends on rainfall conditions, starting one hour before runoff and ending one hour after rainfall, when interflow samples are collected. The initial time step is 1/10,000 of the simulation duration, the minimum time step is 1/100,000, and the maximum time step is 1 min. Time-variable boundary conditions are set to 1/10 of the simulation duration, input every 10 min. The output frequency is set to 1 min intervals. For soil hydraulic properties, we employed the van Genuchten–Mualem (V-G) model with hysteresis consideration, starting with the initial drying curve based on field conditions at the beginning of the monitoring period. Rather than using literature-based parameters, we implemented the Neural Network Prediction function within HYDRUS-2D to derive site-specific soil hydraulic parameters based on measured soil texture (sand, silt, and clay percentages) and bulk density data from each experimental plot (Table 1). This approach allowed us to account for the soil heterogeneity between the 20° and 30° slopes, particularly the significant differences in bulk density that would affect water movement patterns. Root water uptake, which significantly influences subsurface water dynamics in tea plantations, was modeled using the Feddes approach. Due to the lack of specific Feddes parameters for tea plants in the literature, we substituted tobacco parameters as the closest available crop type with similar rooting characteristics. Atmospheric boundary conditions were implemented using our on-site meteorological station data, which provided high resolution rainfall, temperature, humidity, and wind speed measurements. Potential evapotranspiration was calculated using the Penman–Monteith equation within HYDRUS-2D’s built-in functions. Initial soil moisture conditions for each simulation were based on soil moisture sensor readings taken immediately before each rainfall event. The soil profile geometry was carefully constructed in the FE-Mesh window to match our field plots, with a targeted finite element (FE) size of 4 cm to ensure adequate spatial resolution while maintaining computational efficiency. Grid stretching was prevented to maintain uniform numerical accuracy throughout the domain. Maximum boundary curve nodes and FE-mesh nodes were set to 5000 and 200,000, respectively, with a smoothing factor of 1.3 to optimize mesh quality at slope transition zones. Boundary conditions were defined to represent our field setup: the upper boundary was set as an atmospheric boundary to simulate rainfall input, while all other boundaries were designated as free drainage to simulate the unimpeded movement of interflow at the lower boundary of the experimental plots. After running the model for each rainfall event, interflow depth was calculated by integrating the cumulative flux across the free drainage boundary at the downslope edge of the modeled domain.
The sediment yields via surface flow were calculated by Equation (2) [30]:
where Cs is the concentration of sediment in the surface flow samples.
The loss flux of TN, DN, NO3−−N, NH4+−N, TP, and DP via surface flow and interflow was calculated by Equation (3) [31]:
where C is the nutrient concentration in surface flow and interflow samples (mg L−1).
Finally, the average rainfall intensity was calculated by Equation (4) [30]:
where p is the precipitation of each erosive rainfall and t is the rainfall time.
Data statistical analysis was carried out using SPSS (R27.0.1.0), Canoco 5 (5.02), and R programming; data visualization was performed using OriginPro 2024b software.
3. Results
3.1. Rainfall, Runoff Depth, and Sediment Yields
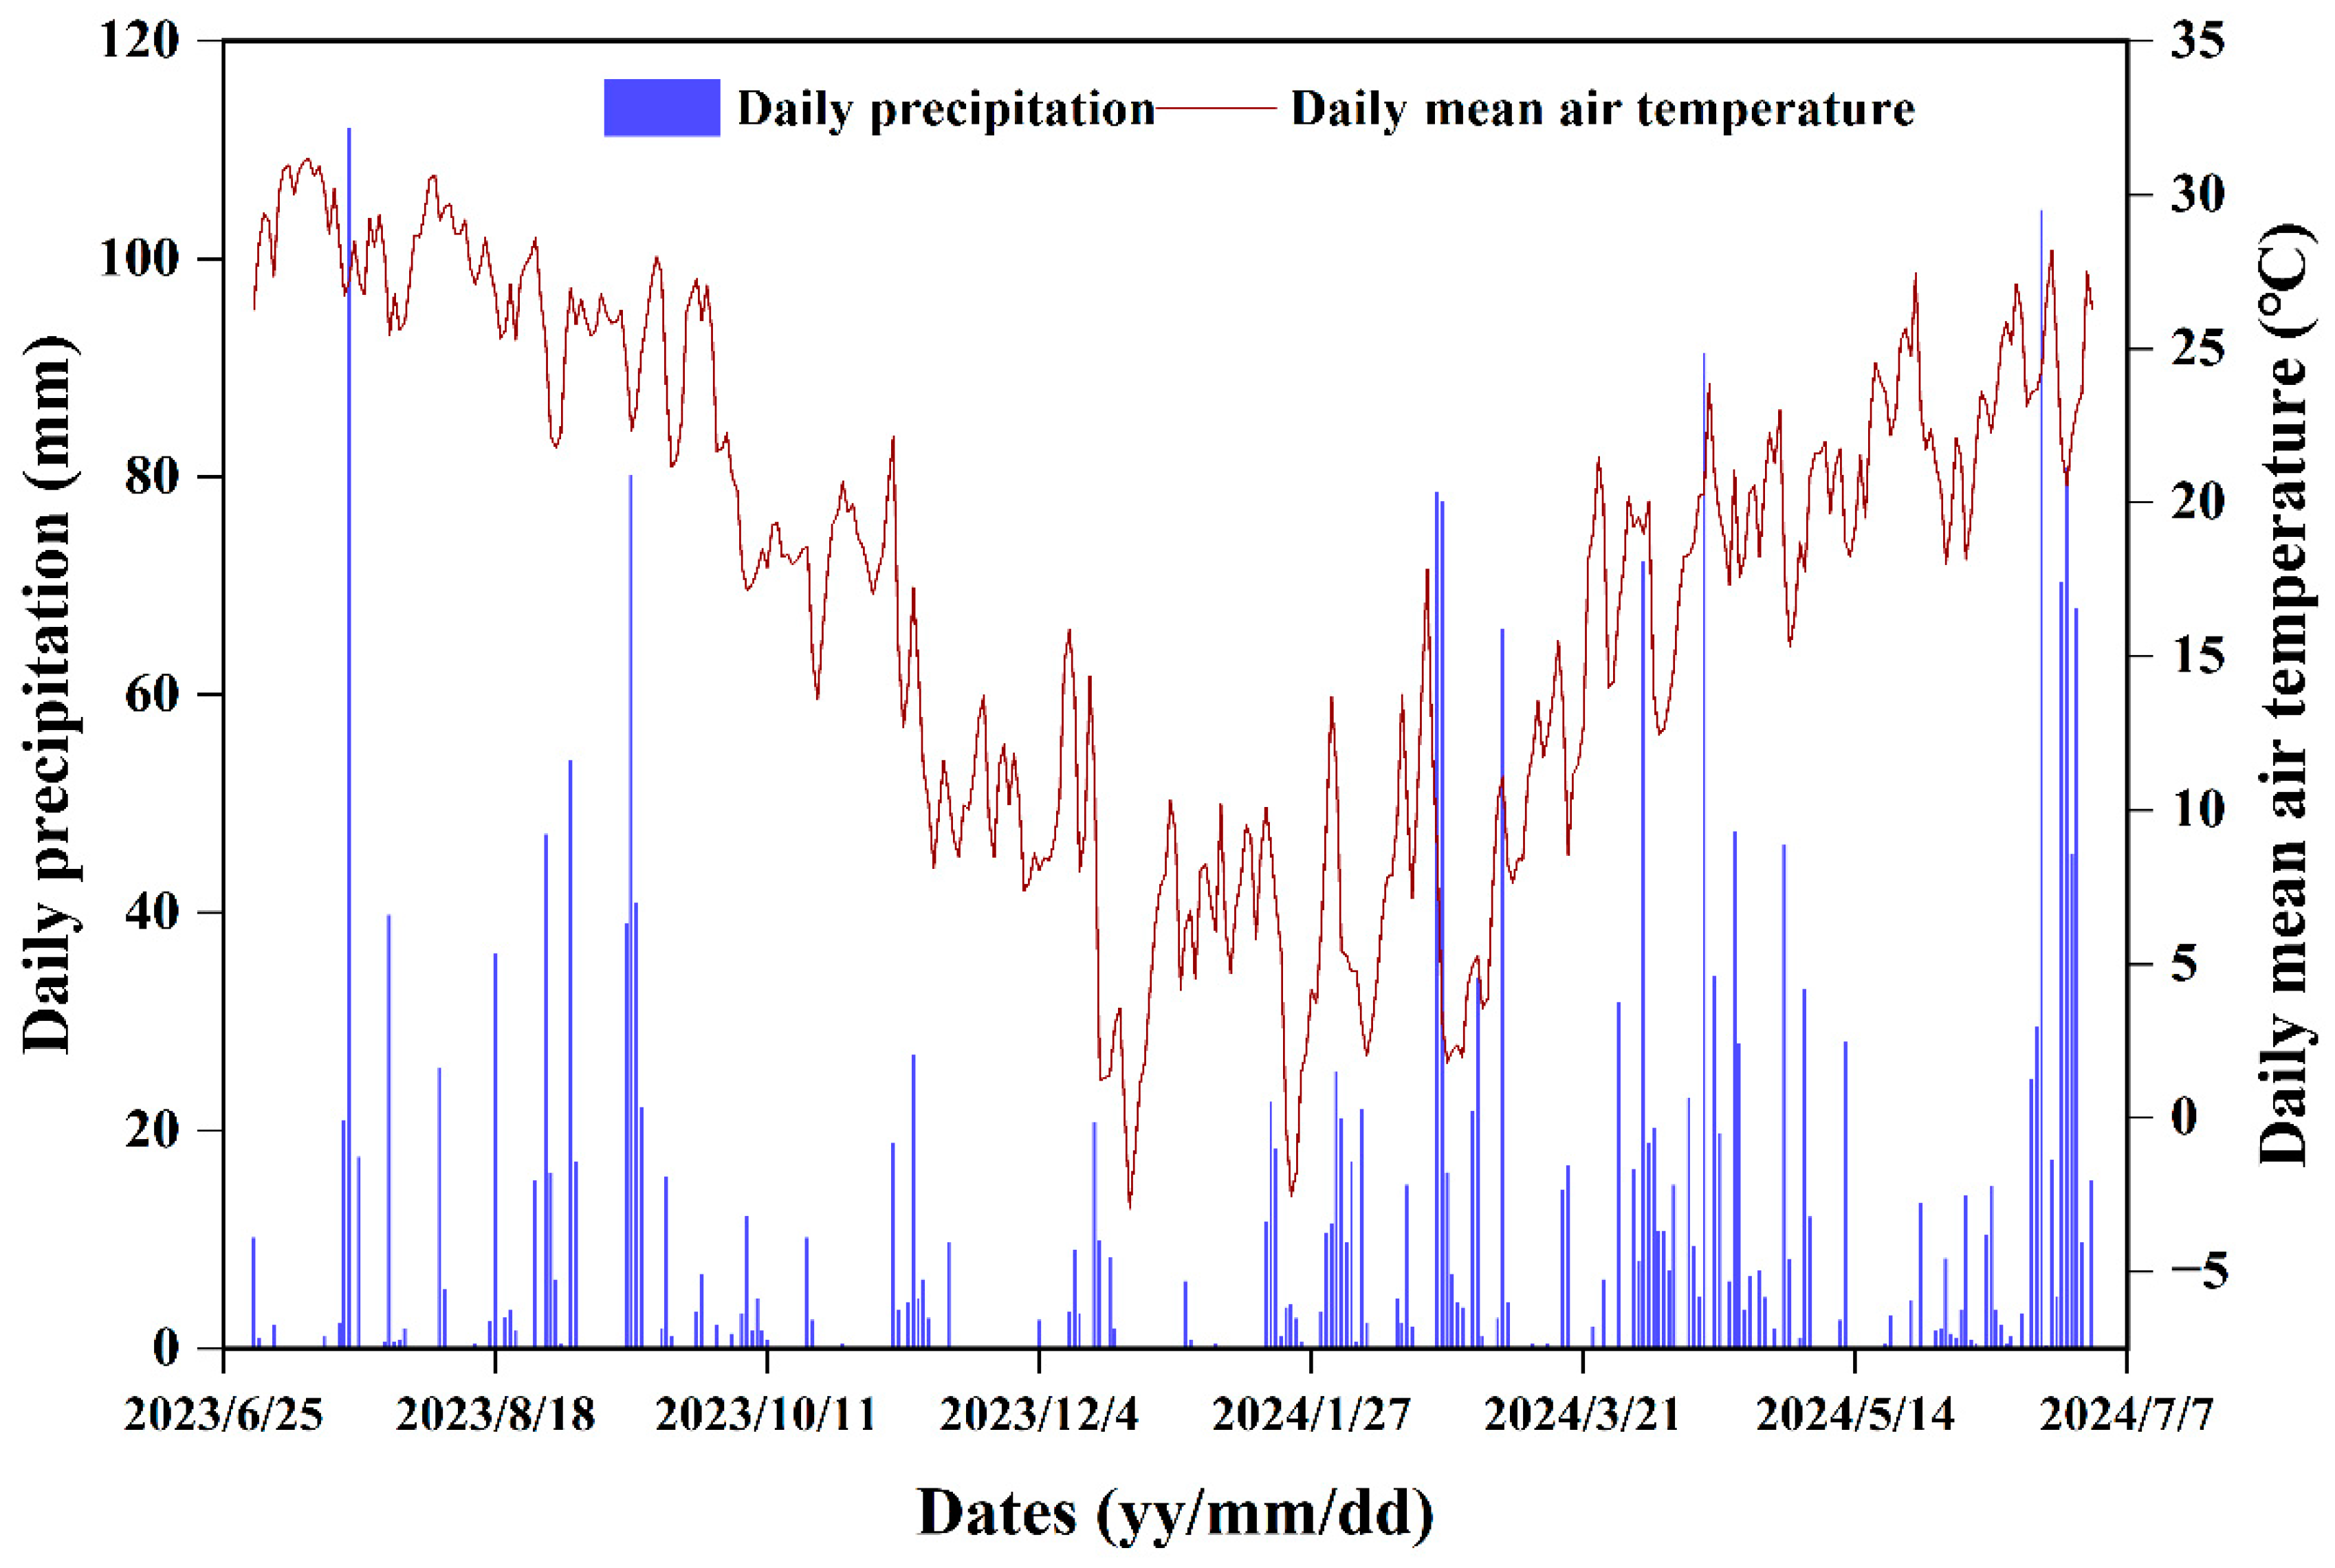
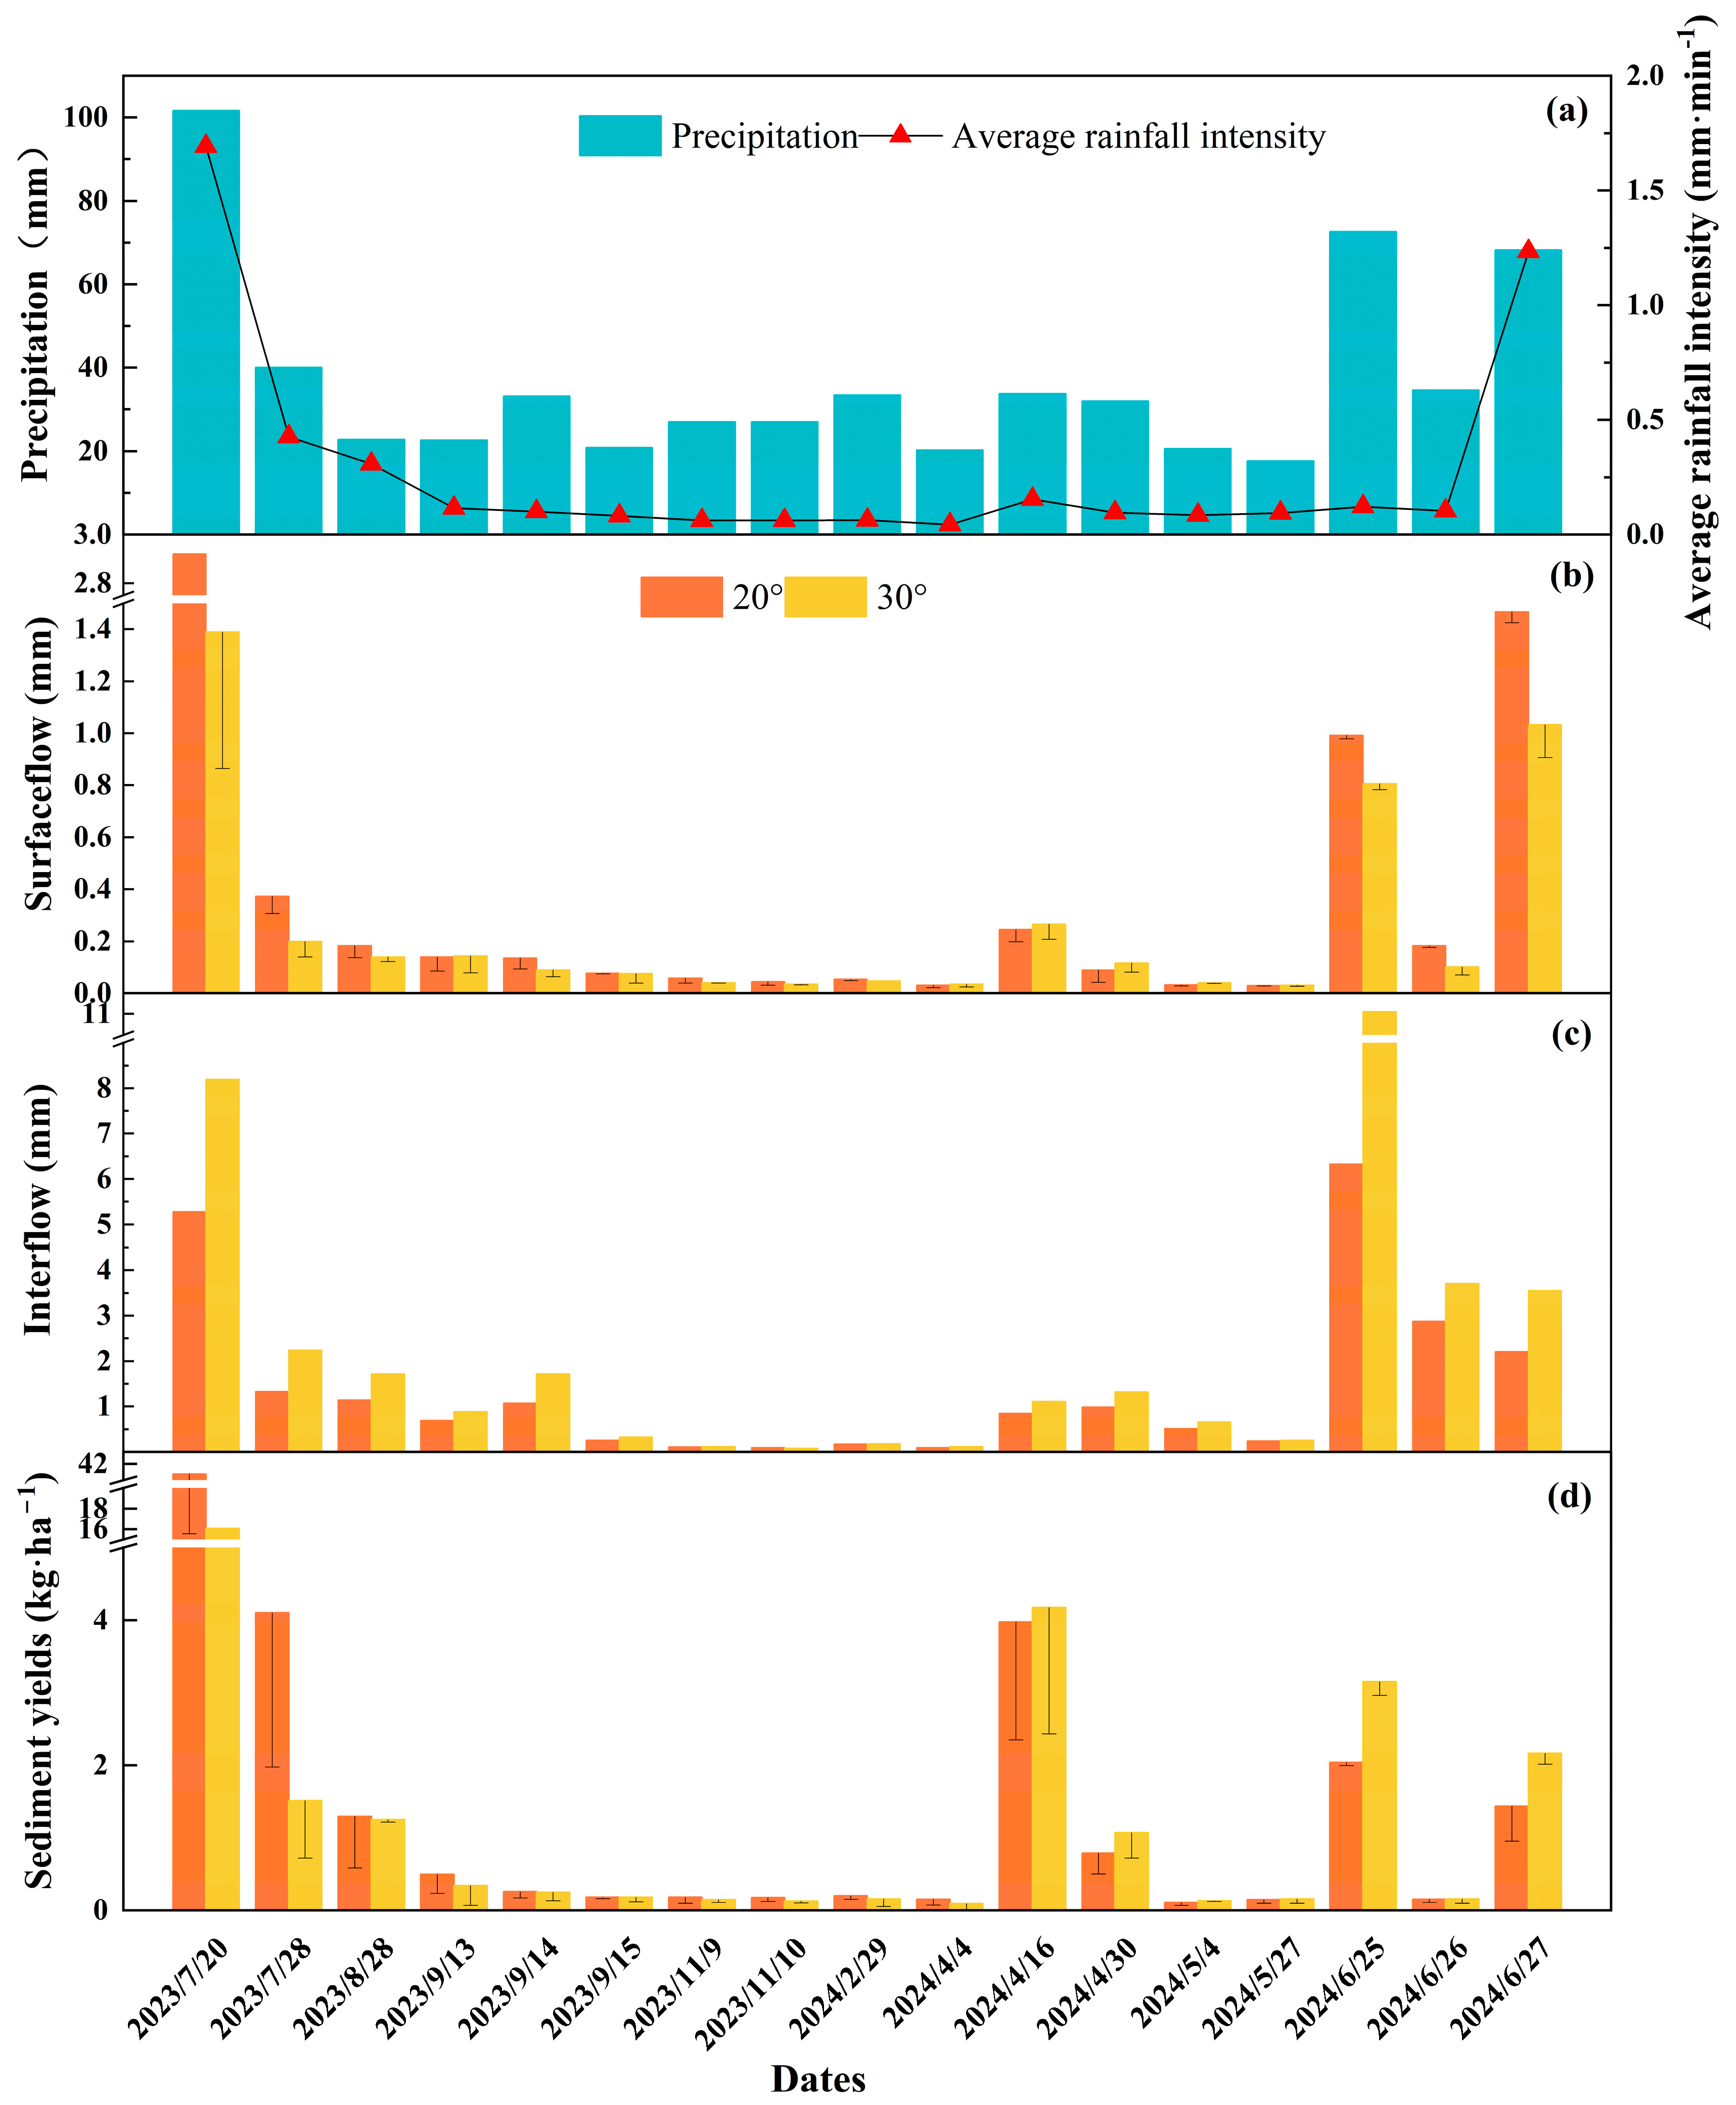
Between July 2023 and June 2024, total rainfall reached 2609.3 mm, with 43.9% occurring between April and June 2024. There were 21 days with daily rainfall exceeding 15 mm (Figure 2), and 17 erosive rainfall events were recorded. Rainfall during runoff events ranged from 17.6 to 101.6 mm, with average intensities between 0.043 and 1.69 mm·min−1 (Figure 3a). Surface runoff depths ranged from 0.03 to 2.92 mm for the 20° slope and 0.03 to 1.39 mm for the 30° slope (Figure 3b). Overall, the 20° slope had greater surface runoff depths than the 30° slope. Differences in surface runoff between the 20° and 30° slopes were more pronounced during high rainfall and intensity events [6]. The largest disparity was observed on 20 July 2023, when rainfall totaled 101.6 mm and average intensity reached 1.69 mm·min−1. On this day, surface runoff depth on the 20° slope was 2.1 times greater than that on the 30° slope.

Figure 2.
Daily rainfall and daily temperature during the experimental period.
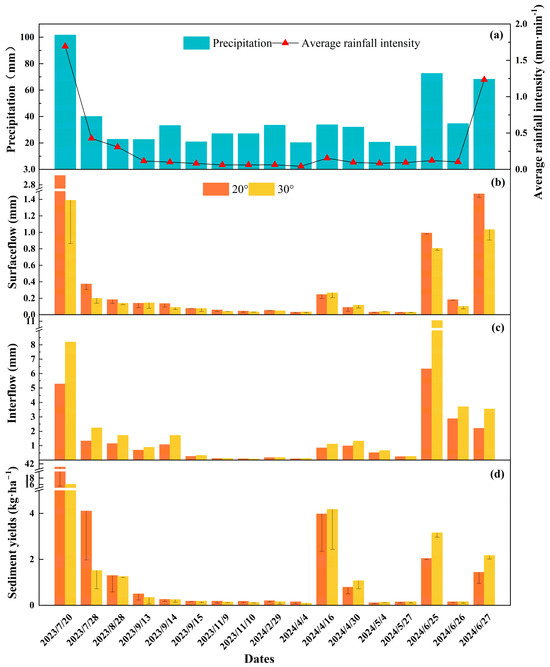
Figure 3.
The rainfall, average rainfall intensity (a), surface runoff (b), interflow (c), and sediment yield (d) under two slope conditions during 17 runoff events.
Interflow depths ranged from 0.09 to 6.33 mm for the 20° slope and 0.08 to 11.05 mm for the 30° slope (Figure 3c). The 30° slope generally exhibited greater interflow depths than the 20° slope. The most significant disparity in interflow depth between the two slopes occurred on 25 June 2024, measuring 4.72 mm. This coincided with a relatively high daily rainfall of 72.6 mm but a low average intensity of 0.12 mm·min−1. Sediment yields ranged from 0.11 to 40.71 kg·ha−1 for the 20° slope and 0.092 to 16.07 kg·ha−1 for the 30° slope (Figure 3d). The slope with higher sediment yield depended on specific rainfall conditions. The highest sediment yield was recorded on July 20, 2023, with 40.71 kg·ha−1 and 16.07 kg·ha−1 for the 20° and 30° slopes, respectively. This event coincided with maximum rainfall and intensity. However, on 25 June 2024, with high rainfall (72.6 mm) but low intensity (0.12 mm min−1), the sediment yield of the 30° slope exceeded that of the 20° slope.
3.2. Nitrogen and Phosphorus Concentration in Surface Runoff and Interflow
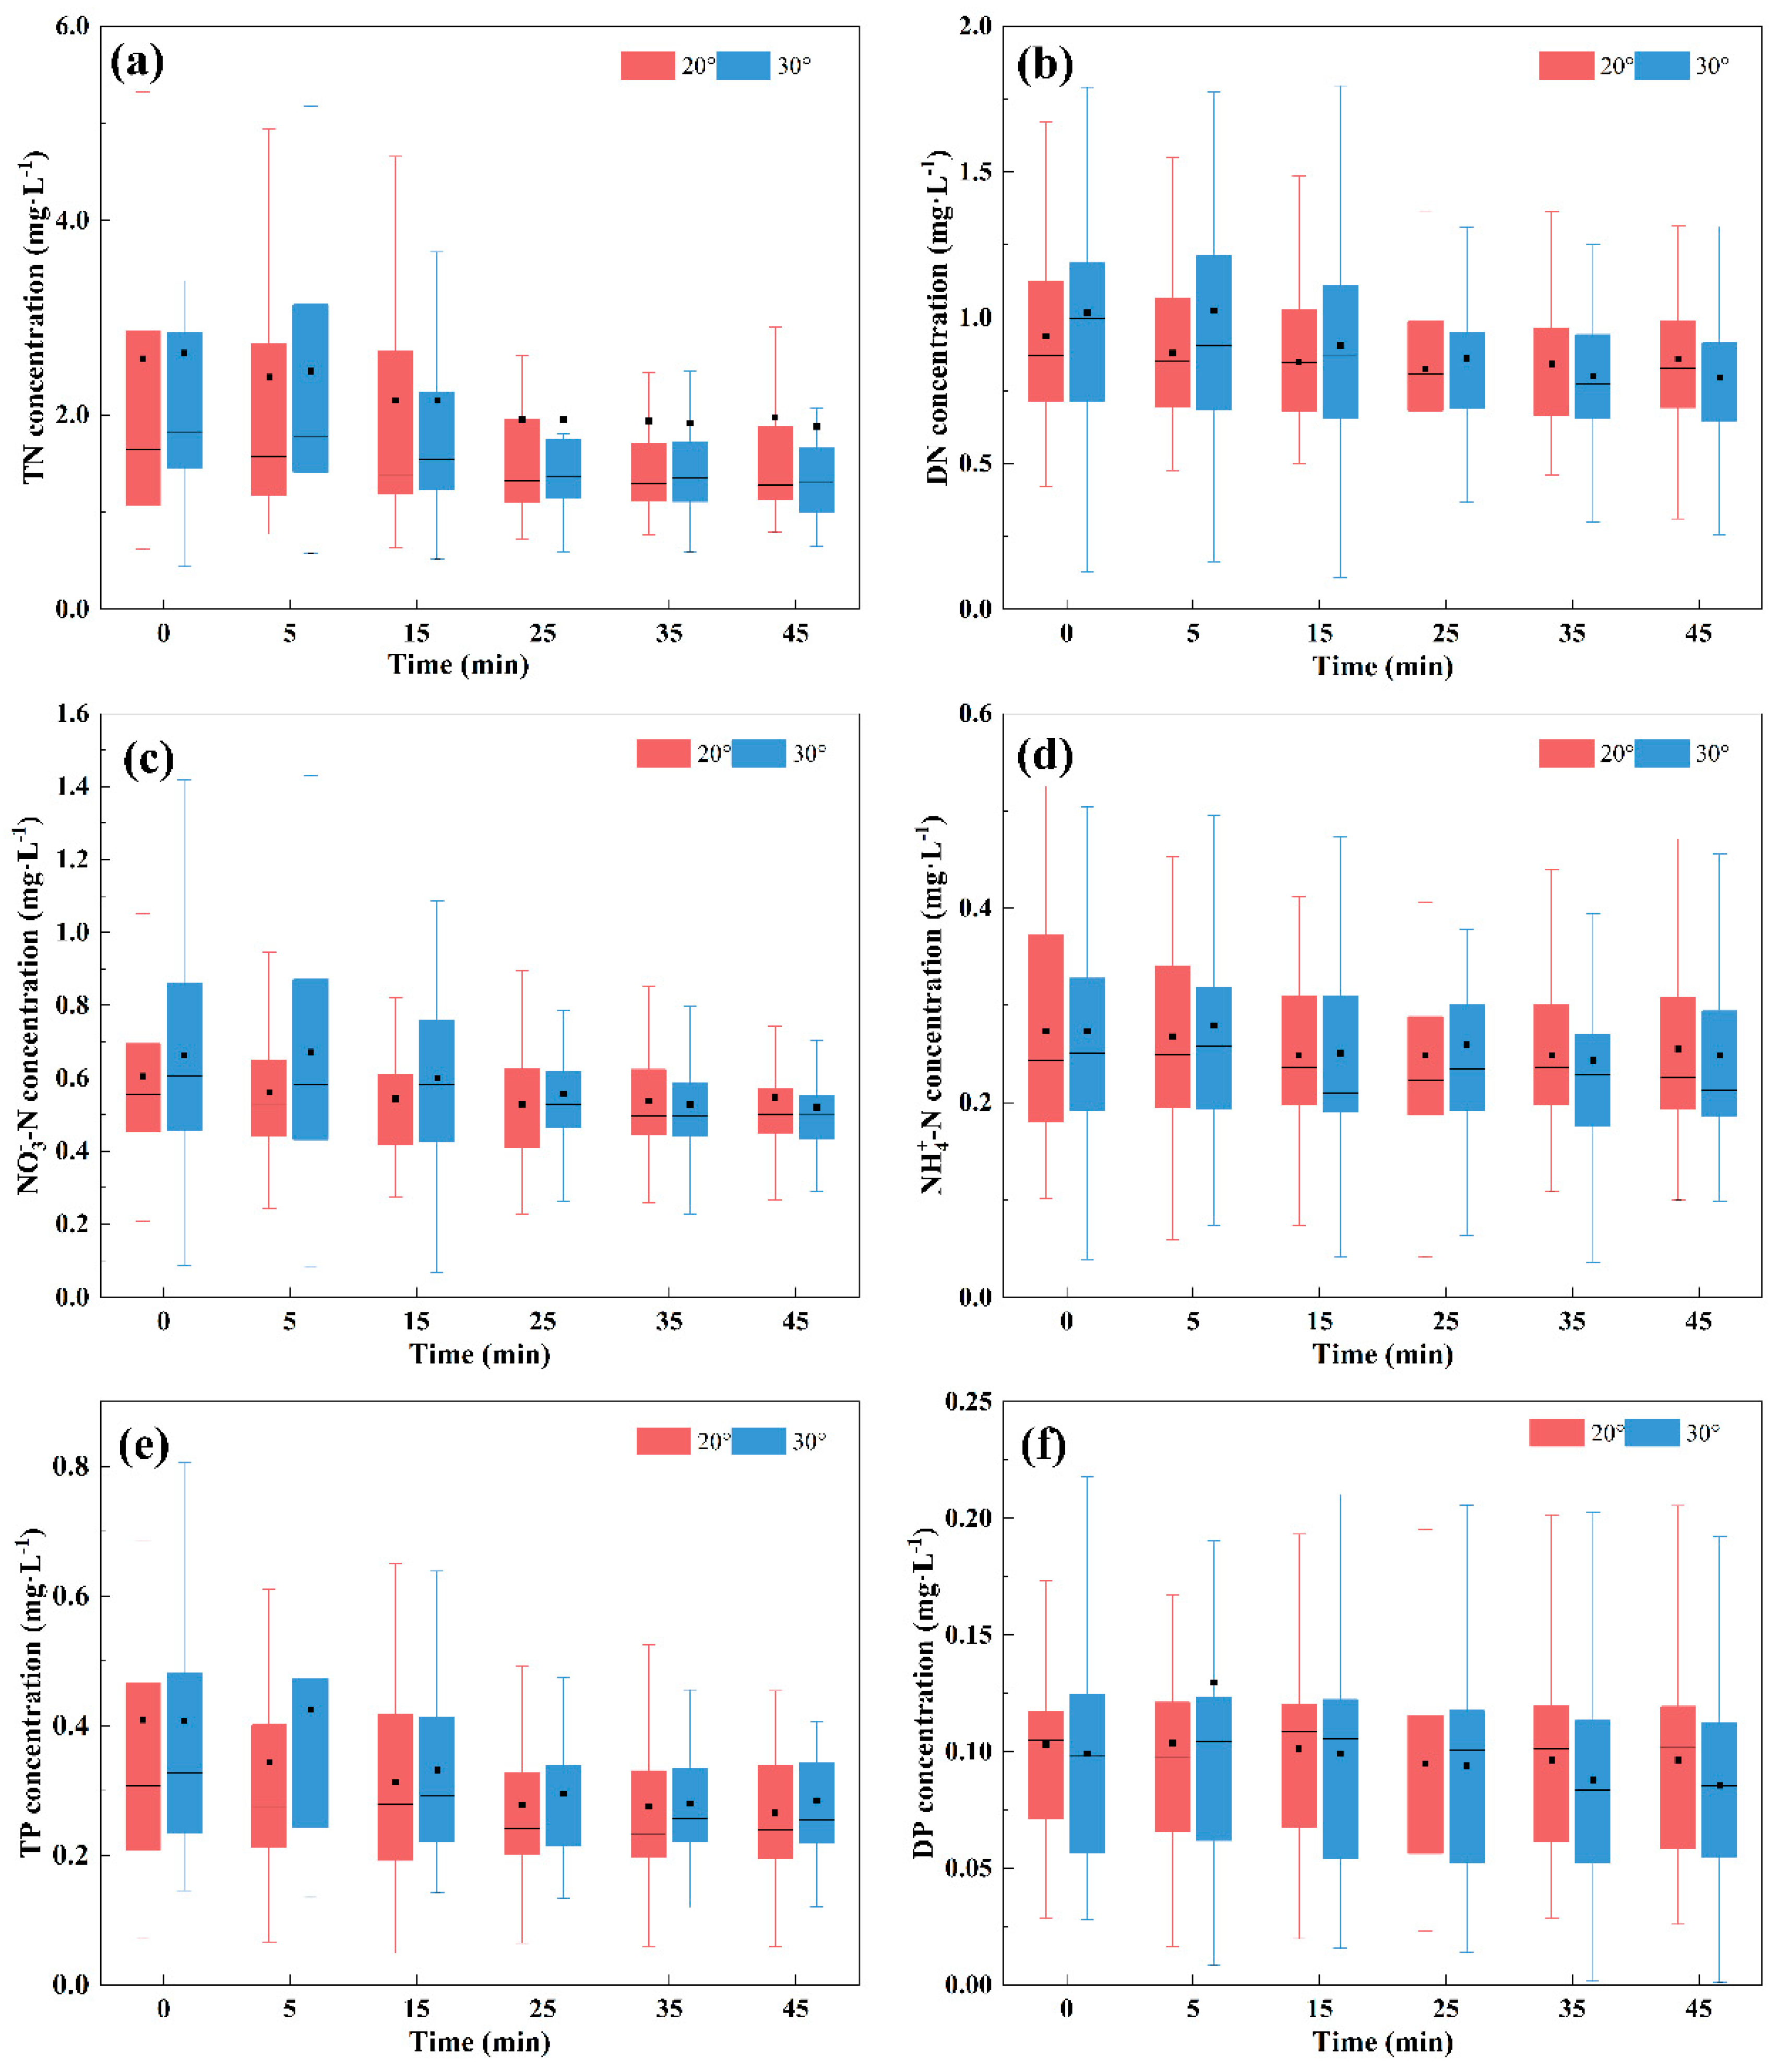
The TN concentration range for the 20° and 30° slopes was 0.619–8.86 mg·L−1 and 0.438–12.6 mg·L−1, respectively (Figure 4a). The average TN concentration under the 30° slope is 1.002 times higher than that under the 20° slope (Table 2). Both slopes showed the largest fluctuations at 0 min of runoff generation, indicating substantial early-stage variability. Total nitrogen concentration decreased gradually over the first 25 min before stabilizing. No significant difference was found in the average concentration between the two slopes, but the median value for the 30° slope was significantly higher at 0, 5, and 15 min, with the values becoming similar at 25, 35, and 45 min.
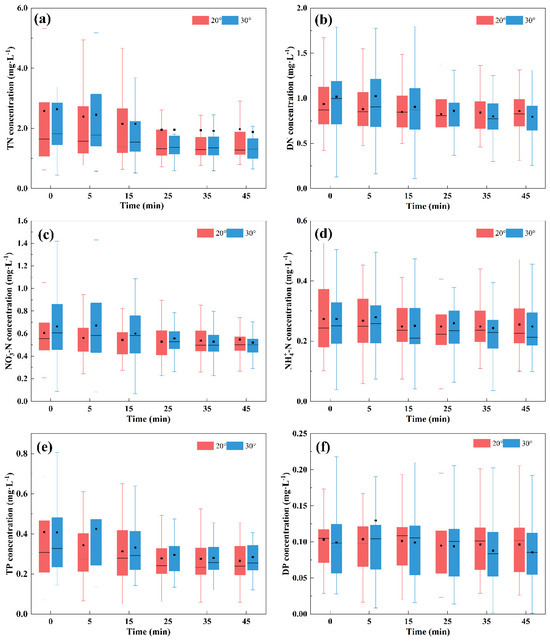
Figure 4.
Changes in nitrogen and phosphorus concentrations in surface flow over time during runoff events. (a) TN; (b) DN; (c) NO3−-N; (d) NH4+-N; (e) TP; (f) DP.
Table 2.
The average concentrations of nitrogen and phosphorus in surface flow and interflow under the two slope gradients for 17 rainfall events.
The DN concentration range for the 20° and 30° slopes was 0.0950–2.21 mg·L−1 and 0.0810–4.11 mg·L−1, respectively (Figure 4b). The average DN concentration under the 30° slope is 1.043 times higher than that under the 20° slope (Table 2). The DN concentration showed a gradual decrease within 45 min of runoff, stabilizing afterward. At 0, 5, 15, and 25 min, both mean and median DN concentrations under the 30° slope were higher than those under the 20° slope. However, at 35 and 45 min, the 20° slope showed higher mean and median concentrations. The DN concentration fluctuation range under the 30° slope was significantly larger than under the 20° slope at 0, 5, and 15 min. However, at 25, 35, and 45 min, the fluctuation ranges were similar.
The NO3−-N concentration range for the 20° and 30° slopes was 0.0462–1.48 mg·L−1 and 0.0422–2.94 mg·L−1, respectively (Figure 4c). The average NO3−-N concentration under the 30° slope is 1.082 times higher than that under the 20° slope (Table 2). The trend of nitrate nitrogen concentration mirrored that of DTN, showing a gradual decrease before stabilizing. At 0, 5, 15, and 25 min, both the mean and median nitrate nitrogen concentrations under the 30° slope were higher than those under the 20° slope. However, after 5 min, the gap narrowed, and by 45 min, the 20° slope had a higher concentration than the 30° slope. The fluctuation range of nitrate nitrogen concentration under the 30° slope was larger than under the 20° slope at 0, 5, and 15 min. At 25, 35, and 45 min, the ranges became similar.
The NH4+-N concentration range for the 20° and 30° slopes was 0.0414–0.660 mg·L−1 and 0.0356–0.889 mg·L−1, respectively (Figure 4d). The average NH4+-N concentration under the 20° slope is 1.054 times higher than that under the 30° slope (Table 2). Ammonia nitrogen concentration fluctuated during rainfall, with no significant differences between the two slopes.
The TP concentration range for the 20° and 30° slopes was 0.0494–2.39 mg·L−1 and 0.120–1.81 mg·L−1, respectively (Figure 4e). The average TP concentration under the 30° slope is 1.042 times higher than that under the 20° slope (Table 2). The TP concentration decreased gradually within 45 min of runoff, stabilizing afterward. Median and mean total phosphorus concentrations were higher under the 30° slope than the 20° slope, with the gap reaching its maximum at 5 min of runoff. Fluctuations in TP concentration were larger at 0, 5, and 15 min compared to 25, 35, and 45 min.
The DP concentration range for the 20° and 30° slopes was 0.0164–0.347 mg·L−1 and 0.00123–1.50 mg·L−1, respectively (Figure 4f). The average DP concentration under the 30° slope is 1.047 times higher than that under the 20° slope (Table 2). DP concentration showed a general downward trend with little variation within 45 min of runoff. The mean DP concentration under the 20° slope was lower than that under the 30° slope at 5 min but higher at other times. At 35 and 45 min, this gap increased. The median DP concentration showed minimal differences at 0, 5, 15, and 25 min, with the 20° slope significantly higher than the 30° slope at 35 and 45 min.
Table 3 shows the proportions of nitrogen and phosphorus components in the surface flow and interflow under the two slopes. It can be seen from the table that nitrate nitrogen is the main form of nitrogen loss in the interflow, with an average proportion of 45.7%, while the main form of phosphorus in the interflow is particulate phosphorus, with an average proportion of 63.4%.
Table 3.
The proportion of nitrogen and phosphorus concentrations in surface flow and interflow under different slope gradients.
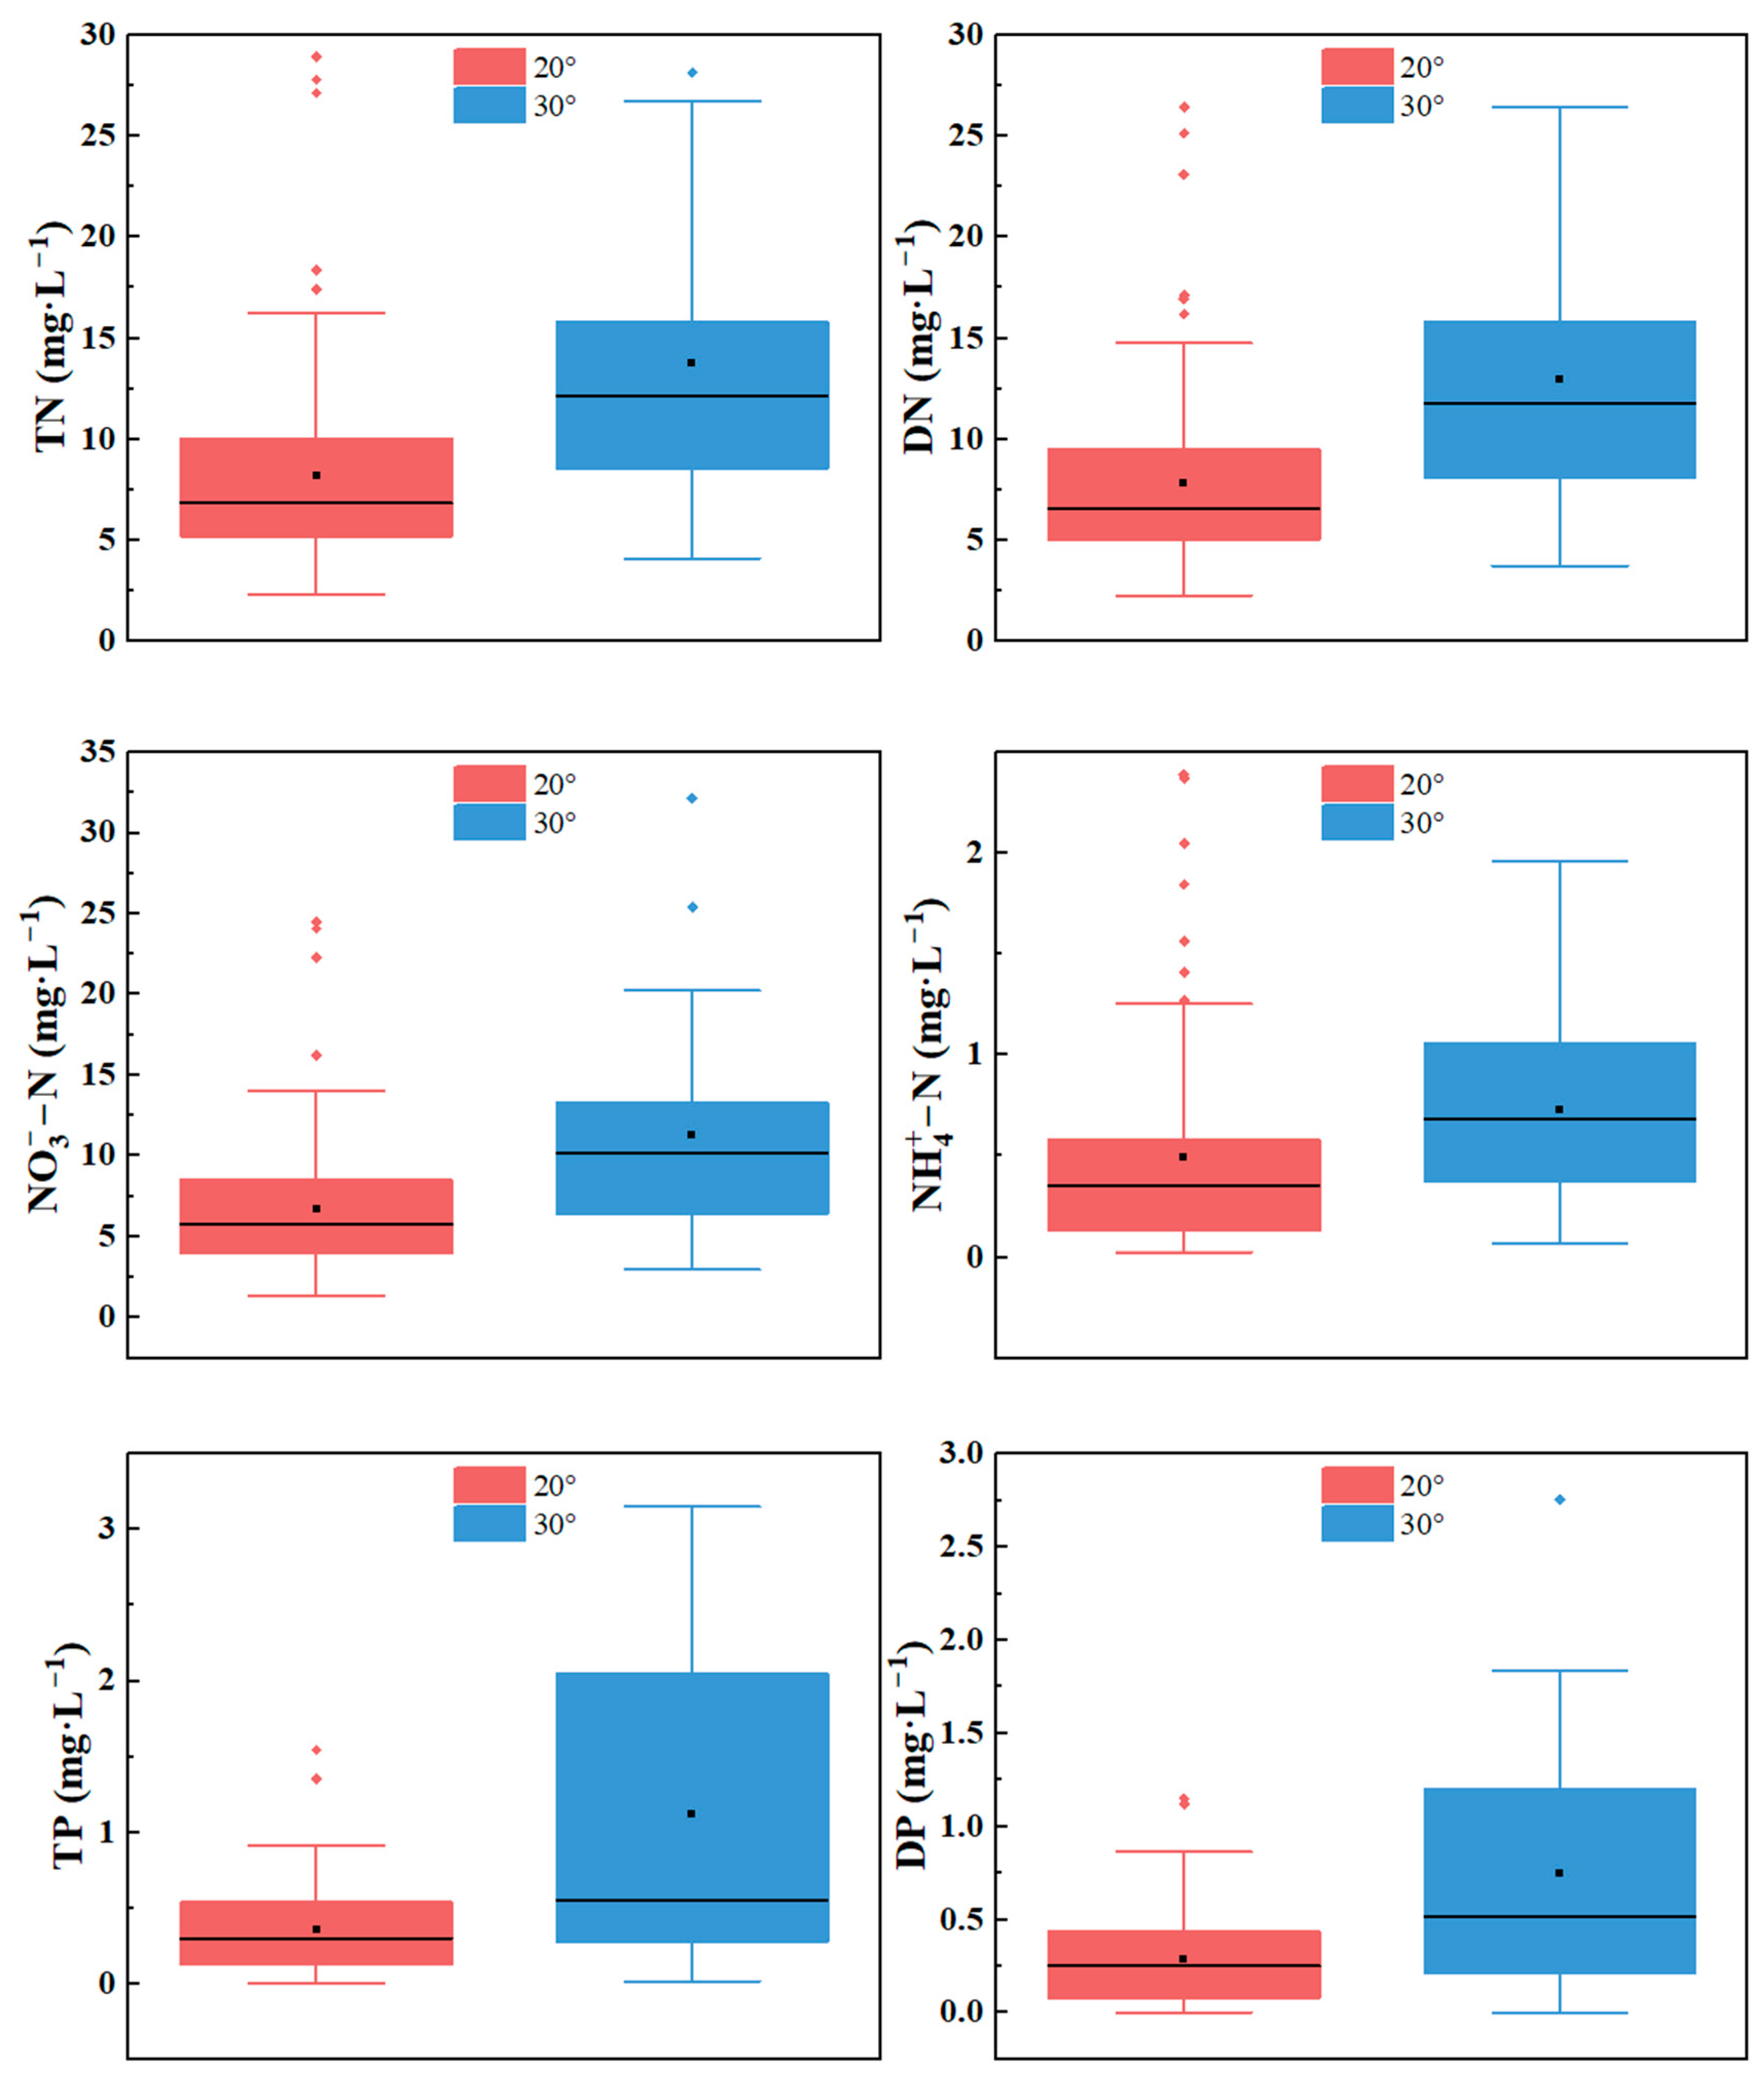
Figure 5 is a box plot of nitrogen and phosphorus concentrations in the interflow under two slopes. The ranges of the total nitrogen concentration in the interflow under the two slopes are 2.3 mg·L−1 to 28.9 mg·L−1 and 4.1 mg·L−1 to 37.1 mg·L−1, respectively, with the average values being 8.2 mg·L−1 and 13.8 mg·L−1, respectively. The average total nitrogen concentration in the interflow on the 30° slope is 68% higher than that on the 20° slope. The ranges of the soluble total nitrogen concentration in the interflow under the two slopes are 2.2 mg·L−1 to 26.5 mg·L−1 and 3.7 mg·L−1 to 35.4 mg·L−1, respectively, with the average values being 7.8 mg·L−1 and 12.9 mg·L−1, respectively. The average soluble total nitrogen concentration in the interflow on the 30° slope is 66% higher than that on the 20° slope. The ranges of the nitrate nitrogen concentration in the interflow under the two slopes are 1.3 mg·L−1 to 24.4 mg·L−1 and 3.0 mg·L−1 to 32.1 mg·L−1, respectively, with the average values being 6.7 mg·L−1 and 11.2 mg·L−1, respectively. The average nitrate nitrogen concentration in the interflow on the 30° slope is 67% higher than that on the 20° slope. The ranges of the ammonia nitrogen concentration in the interflow under the two slopes are 0.025 mg·L−1 to 5.65 mg·L−1 and 0.065 mg·L−1 to 1.96 mg·L−1, respectively, with the average values being 0.49 mg·L−1 and 0.72 mg·L−1, respectively. The average ammonia nitrogen concentration in the interflow on the 30° slope is 47% higher than that on the 20° slope. The ranges of the total phosphorus concentration in the interflow under the two slopes are 0.0052 mg·L−1 to 1.54 mg·L−1 and 0.015 mg·L−1 to 5.37 mg·L−1, respectively, with the average values being 0.35 mg·L−1 and 1.12 mg·L−1, respectively. The average total phosphorus concentration in the interflow on the 30° slope is 220% higher than that on the 20° slope. The ranges of the soluble total phosphorus concentration in the interflow under the two slopes are 0.0034 mg·L−1 to 1.15 mg·L−1 and 0.0012 mg·L−1 to 2.75 mg·L−1, respectively, with the average values being 0.29 mg·L−1 and 0.75 mg·L−1, respectively. The average soluble total phosphorus concentration in the interflow on the 30° slope is 158% higher than that on the 20° slope. This study found that, among all the indicators of the nitrogen and phosphorus concentrations in the interflow, the concentrations under the 30° slope condition were significantly higher than those under the 20° slope condition (p < 0.01), and the nitrogen and phosphorus concentrations in the interflow under the higher slope were more sensitive to rainfall events and had a larger fluctuation range.

Figure 5.
Nitrogen and phosphorus concentrations in interflow under two slopes over 17 erosive rainfall events.
It can be seen from Table 2 that nitrate nitrogen is the main form of nitrogen loss in the interflow, with an average proportion of 80.47%, while the main form of phosphorus in the interflow is soluble phosphorus, with an average proportion of 72.82%. When comparing the two slopes, there is no significant difference in the form of nitrogen loss. The proportion of soluble total phosphorus under the 20° slope condition is 2.4 percentage points higher than that under the 30° slope condition.
3.3. Loss Loads of Nitrogen and Phosphorus in Surface Flow and Interflow
Table 4 and Table 5 present the statistical data, including median values (with upper and lower quartiles), for N and P loss loads in surface flow and interflow over 17 sampling events. The p-value indicates the significance of the non-parametric test between the 20° and 30° slope conditions. In surface flow, the TN median loss flux of the 20° slope was 1.07 times higher than that under the 30° slope, and both upper and lower quartiles were higher than those under the 30° slope. The DN median loss flux of the 20° slope was 1.27 times higher than that under the 30° slope, and both upper and lower quartiles were higher than those under the 30° slope. The NH4+-N median loss flux of the 20° slope was 1.33 times higher than that under the 30° slope, and both upper and lower quartiles were higher than those under the 30° slope. The NO3−-N median loss flux of the 20° slope was 1.10 times higher than that under the 30° slope, and both upper and lower quartiles were higher than those under the 30° slope. The TP median loss flux of the 20° slope was 1.14 times higher than that under the 30° slope, but both upper and lower quartiles were lower than those under the 30° slope. This indicates that the TP loss flux has greater fluctuations. The DP median loss flux of the 20° slope was 1.19 times higher than that under the 30° slope, and both upper and lower quartiles were higher than those under the 30° slope. This indicates that the TP loss flux was not controlled by DP. The results showed that N and P loss flux in surface flow are slightly lower under the 30° slope compared to the 20° slope. However, the significance test reveals no statistically significant differences between the two conditions.
Table 4.
Nitrogen (N) loss loads in surface flow and interflow over 17 sampling events.
Table 5.
Phosphorus (P) loss loads in surface flow and interflow over 17 sampling events.
In interflow, median loss loads of TN, DN, NH4+-N, NO3−-N, TP, and DP under the 30° slope are 2.88, 2.88, 7.81, 3.27, 4.47, and 3.40 times higher than those under the 20° slope, respectively. For all nitrogen and phosphorus indicators, both upper and lower quartiles under the 20° slope were higher than those under the 30° slope. The p-values indicate statistically significant differences. Interflow loss fluxes are consistently higher than surface flow fluxes for all indices.
Consequently, total loss fluxes are significantly greater under the 30° slope than the 20° slope, primarily driven by subsurface flow contributions. For total flow, median loss loads of TN, DN, NH4+-N, NO3−-N, TP, and DP under the 30° slope are 2.58, 2.67, 2.74, 2.94, 3.43, and 2.38 times higher than those under the 20° slope, respectively. The loss flux of TN and TP on the 30° slope was significantly increased by 2.58 times and 3.43 times, respectively, compared with those on the 20° slope.
3.4. Environmental Factors on Nitrogen and Phosphorus Concentrations in Surface Flow
In data analysis, we use abbreviations instead of full names, and their corresponding relationships can be found in Table 6.
Table 6.
Abbreviations and their full names in correlation analysis and redundancy analysis.
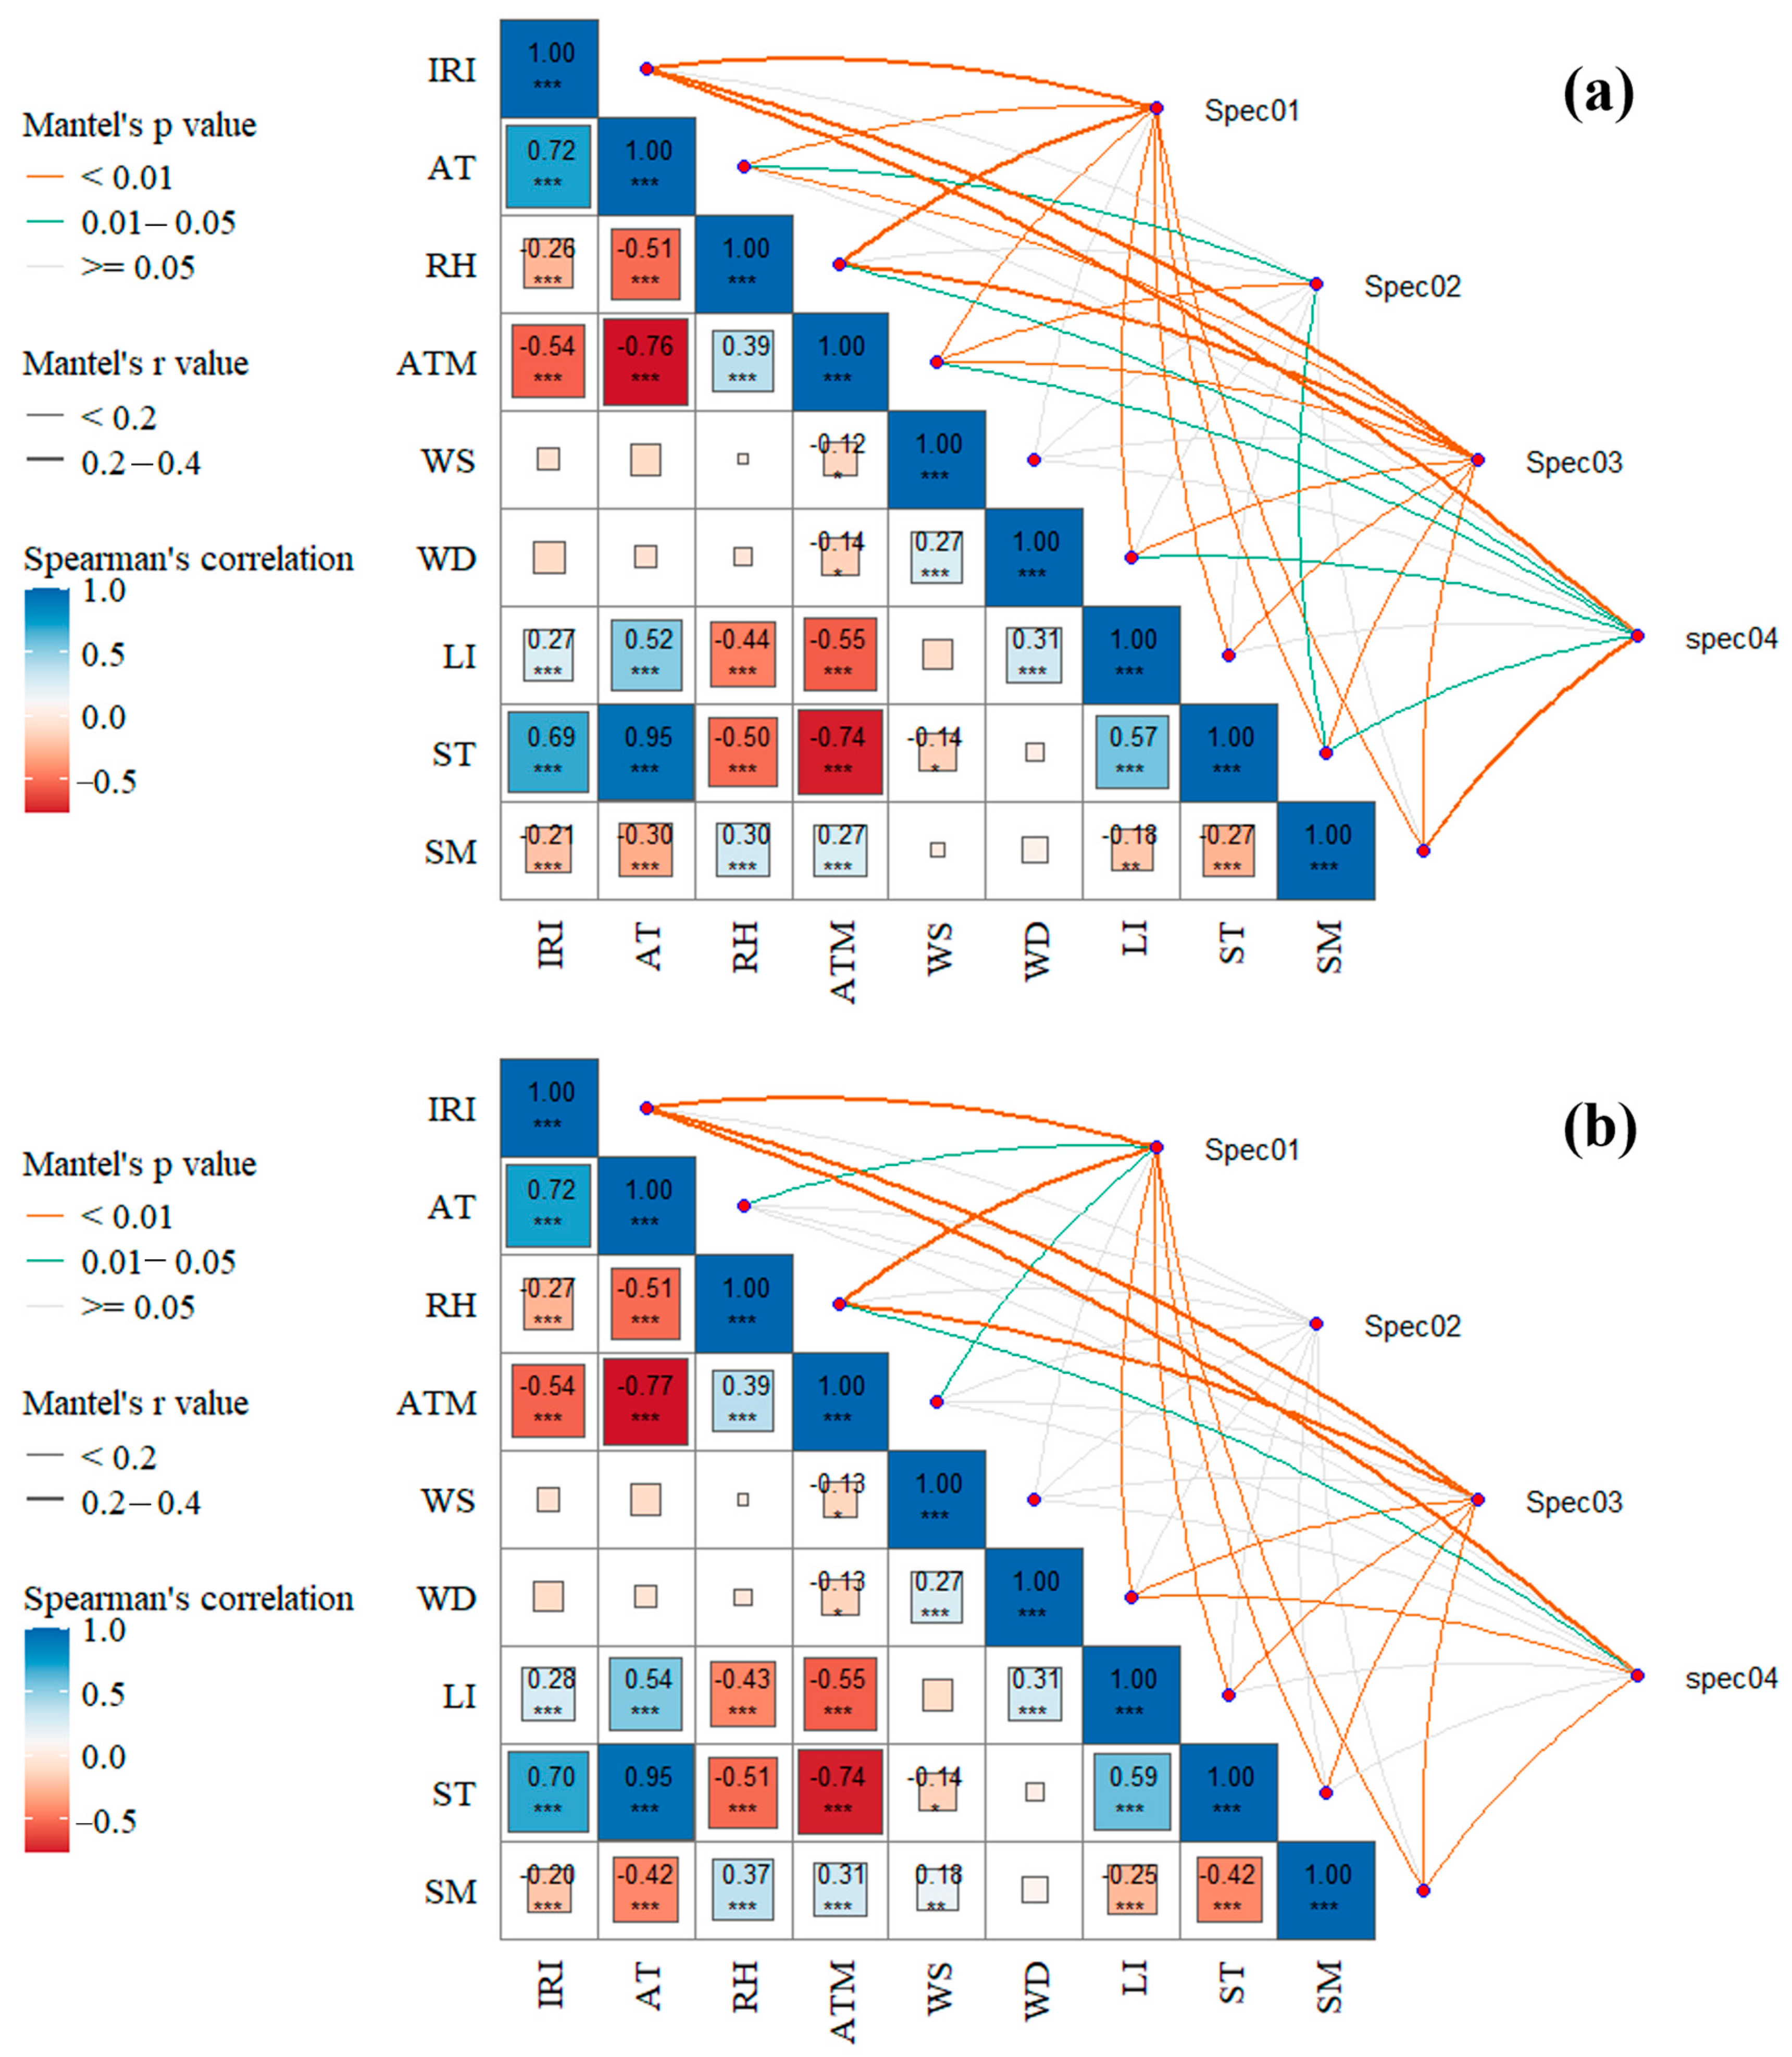
Figure 6 presents the results of the Mantel test examining the correlations between N and P concentrations in surface flow and various environmental factors. Under the 20° slope condition, TN and DN are highly significantly correlated with all environmental factors except wind speed. In contrast, under the 30° slope condition, TN and DN show significant correlations with air temperature and air pressure and highly significant correlations with instantaneous rainfall intensity, relative humidity, wind direction, light intensity, soil temperature, and soil humidity. Under the 20° slope condition, the NH4+-N and NO3−-N are highly significantly correlated with average air pressure, significantly correlated with air temperature and soil temperature, and not significantly correlated with other environmental factors. Under the 30° slope condition, however, NH4+-N and NO3−-N show no significant correlations with any environmental factors. Under the 20° slope condition, TP and DP are highly significantly correlated with all environmental factors except wind speed. In contrast, under the 30° slope condition, TP and DP show no significant correlations with air temperature, air pressure, and wind speed but are highly significantly correlated with the other environmental factors. When considering all six N and P indicators, under the 20° slope condition, N and P concentrations in surface flow are highly significantly correlated with instantaneous rainfall intensity and soil humidity, significantly correlated with relative humidity, air pressure, wind direction, and soil temperature, and not significantly correlated with other environmental factors. Under the 30° slope condition, N and P concentrations are highly significantly correlated with instantaneous rainfall intensity, wind direction, and soil humidity; significantly correlated with relative humidity; and not significantly correlated with other environmental factors.
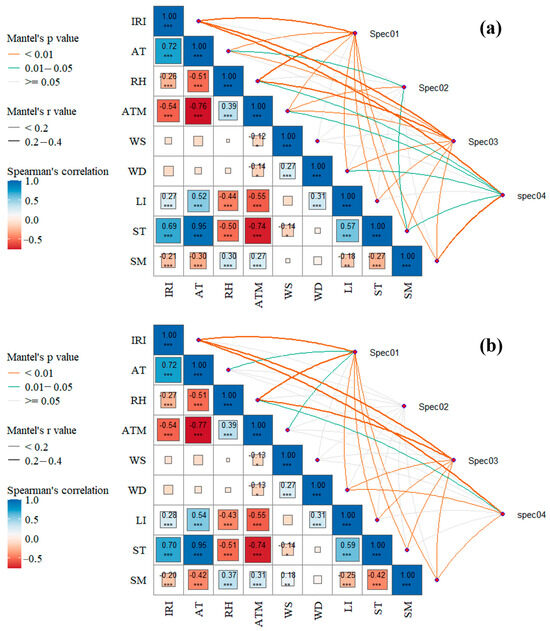
Figure 6.
Spearman correlation analysis of environmental factors and Mantel correlation analysis between nitrogen and phosphorus concentrations in surface flow and environmental factors under 20° (a) and 30° (b) slopes (spec01: TN, DN; spec02: NH4+-N, NO3−-N; spec03: TP, DP; spec04: TN, DN, NH4+-N, NO3−-N, TP, DP. The asterisks indicate statistical significance: * p < 0.05, ** p < 0.01, *** p < 0.001).
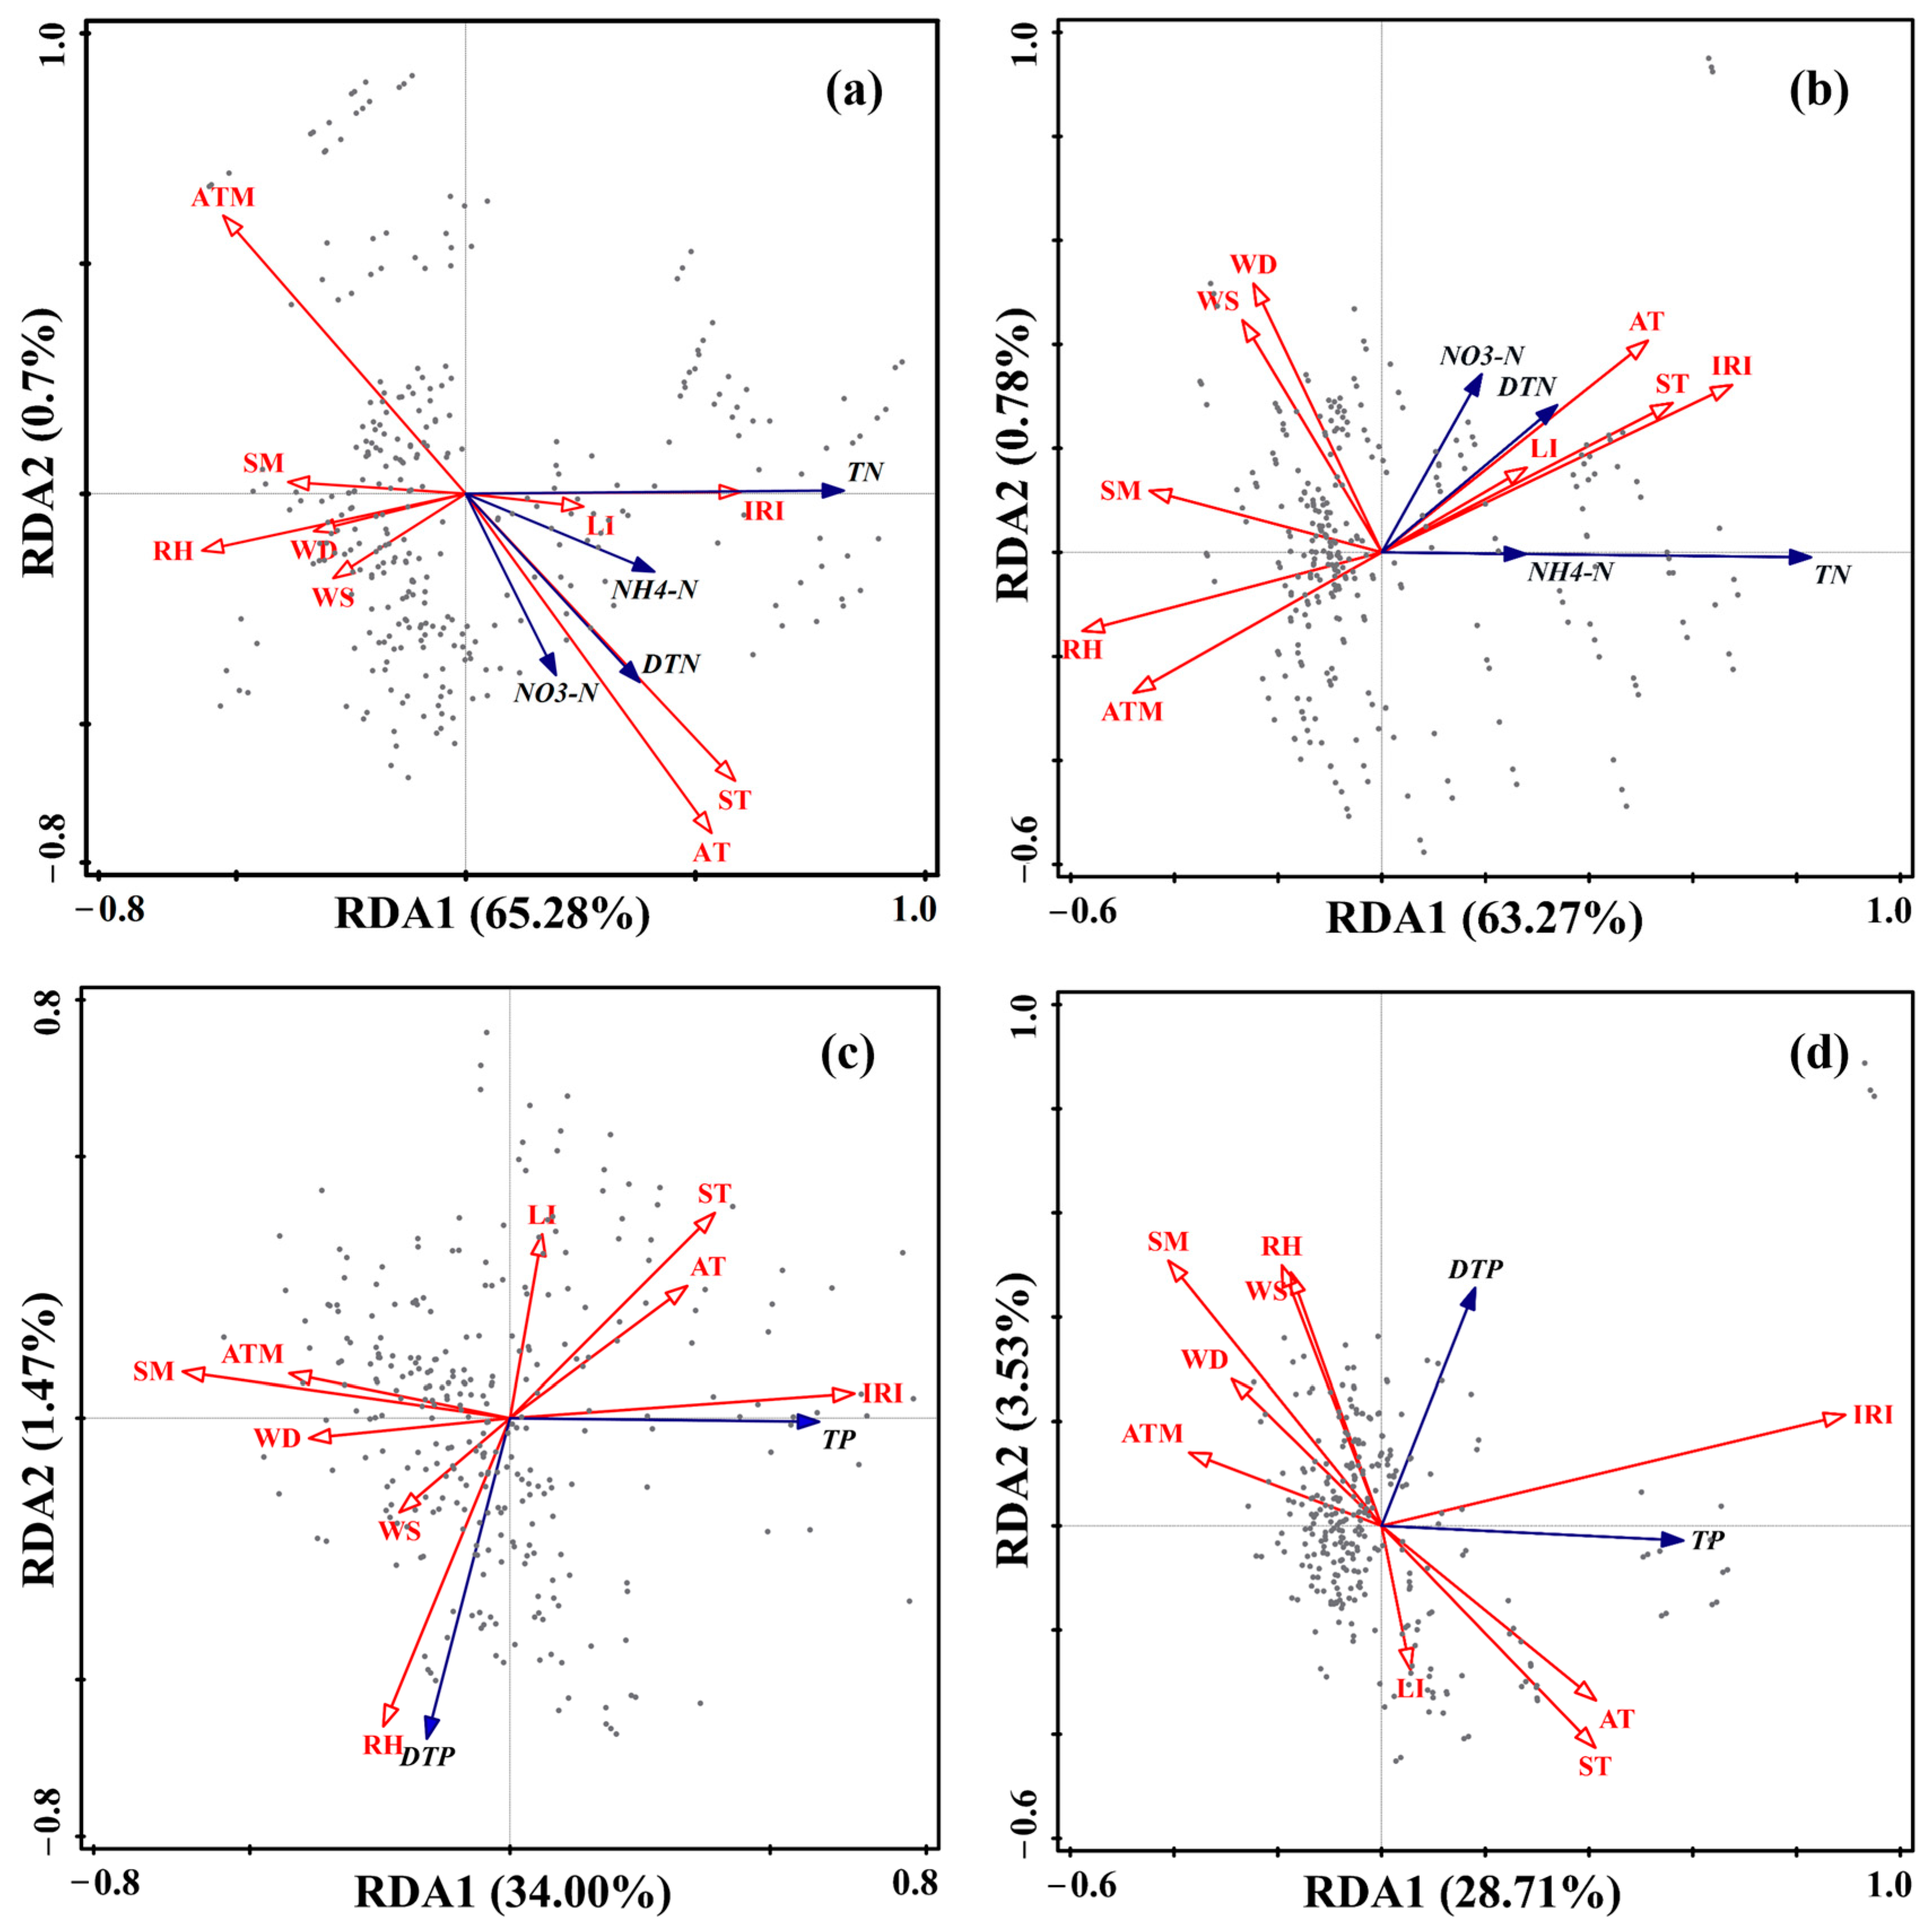
RDA analysis was conducted to assess the impact of environmental factors on N and P concentrations in surface flow (Figure 7). Under the 20° and 30° slope conditions, the selected axes explained 65.98% and 64.05% of the N concentration in the runoff, respectively (Figure 7a,b). Under the 20° slope condition, the correlation strength of instantaneous rainfall intensity with N fractions in runoff follows the order: TN, NH4+-N, DN, and NO3−-N. Soil humidity shows the strongest negative correlation with TN, while air pressure exhibits the strongest negative correlation with DN. Under the 30° slope condition, the correlation strength of instantaneous rainfall intensity with N components in runoff follows the order: TN, DN, NO3−-N, and NH4+-N. Soil humidity and relative air humidity show the strongest negative correlations with TN, while air pressure exhibits the strongest negative correlation with DN. Both air temperature and soil temperature are highly significantly positively correlated with DN under the 20° and 30° slope conditions. Under the 20° and 30° slope conditions, the selected axes explained 35.47% and 32.24% of the P concentration in the runoff, respectively (Figure 7c,d). Under the 20° slope condition, instantaneous rainfall intensity is highly significantly correlated with TP, shows no significant correlation with DP, relative air humidity is highly significantly positively correlated with DP, and light intensity is highly significantly negatively correlated with DP. Under the 30° slope condition, instantaneous rainfall intensity is significantly positively correlated with total P concentration.
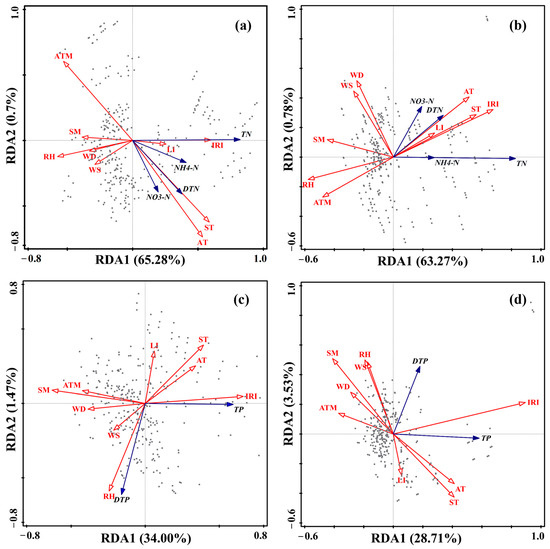
Figure 7.
RDA analysis of environmental factors and nitrogen/phosphorus concentrations in surface runoff under 20° (a,c) and 30° (b,d) slopes. The projection length of the nitrogen and phosphorus concentration arrows (blue) onto the direction of the environmental factor arrows (red) represents the strength of the correlation between them. If the projection direction is the same as that of the environmental factor, it indicates a positive correlation; otherwise, it is a negative correlation.
4. Discussion
4.1. Effects of Slope Gradient on Surface Flow and Interflow Generation
The observed differences in surface flow and interflow between the 20° and 30° slopes can be attributed to the interplay of slope gradient, rainfall characteristics, and subsurface hydrological processes. The 20° slope consistently generated greater surface flow than the 30° slope, particularly during high intensity rainfall events (e.g., 20 July 2023: 101.6 mm precipitation, 1.69 mm·min−1 average intensity). This counterintuitive result may stem from two mechanisms. First, gentler slopes allow prolonged water residence time on the surface, enhancing cumulative infiltration-excess runoff when rainfall intensity exceeds soil infiltration capacity [32]. Second, the steeper slope may exhibit higher soil permeability due to reduced surface compaction or preferential flow paths, promoting faster interflow drainage and reducing surface water accumulation [33]. Additionally, high intensity rainfall events likely exacerbated these effects by overwhelming infiltration capacity on the 20° slope, leading to rapid runoff generation, whereas the 30° slope’s steeper gradient facilitated quicker lateral drainage of infiltrated water as interflow rather than surface runoff. In fact, the 30° slope showed significantly higher interflow depths. Steeper slopes enhance gravitational gradients, accelerating lateral interflow through soil macropores or permeable layers [34]. During low intensity, high volume rainfall events, water infiltrates more uniformly, saturating the soil matrix and activating deeper interflow pathways. The 30° slope’s geometry likely amplified this process by directing infiltrated water along the slope’s hydraulic gradient, whereas the 20° slope retained more moisture in the root zone or upper soil layers, limiting lateral subsurface transport. The pronounced interflow disparity (4.72 mm difference) during the 25 June event underscores the sensitivity of subsurface flow to prolonged, low intensity rainfall, which sustains soil saturation without triggering surface runoff dominance.
4.2. Nitrogen and Phosphorus Concentration in Surface Flow
In this study, N and P concentrations were high, with significant fluctuations in the initial stage of runoff generation. This was primarily due to the high accumulation of nutrients in the soil before rainfall and intense water erosion [35,36]. Overall, the nutrient concentration decreased as runoff generation time increased. Nutrient concentration changes in runoff were most pronounced in the early stage, becoming uniform and stable in the later stage, consistent with previous research findings [30,37]. At the initial stage of runoff, it is generally believed that the high clay content in the soil, along with elevated nutrient concentrations adsorbed on surface particles and present in the soil liquid phase, results in high concentrations due to the strong dilution and dissolution effects of slope runoff [38,39]. As the rainfall continues, nutrients in the surface soil are leached into deeper layers by rainwater or transported with runoff and sediment, causing the nutrient concentration in runoff to gradually decrease and stabilize [40]. This study found that, at the initial stage of runoff, the TN concentration was higher under the 30° slope condition than under the 20° slope condition. However, as rainfall continued, the TN concentrations under both slopes tended to converge. This occurred because, at the initial stage of runoff, the steeper slope caused more severe soil erosion, which led to greater transport of soil N into the runoff [31]. As rainfall continued, surface flow velocity on the steeper slope increased, causing some N to be washed away before it could fully dissolve and migrate [41]. Simultaneously, intense soil and water loss led to a rapid decrease in N content in the surface soil, reducing the availability of N for subsequent runoff [42]. The trends of NO3−-N and NH4+-N were observed, revealing that the trend of NO3−-N closely mirrored that of TN, with a more pronounced difference in NO3−-N concentration between the two slopes. Therefore, it is hypothesized that this TN trend was primarily driven by NO3−-N.
Throughout the rainfall process, TP concentration was higher under the 30° slope condition than under the 20° slope condition, with the most significant difference occurring at the fifth min. This was primarily due to changes in PP. This was primarily because, under the steeper slope condition, the soil was more prone to erosion, and P in the soil was primarily adsorbed onto soil aggregates as PP [43]. During soil erosion, it was carried into the runoff with the soil particles. Changes in DP concentration in runoff were minimal, with little difference between the two slopes. Overall, it exhibited a decreasing trend, likely due to the dilution effect of rainfall.
The primary form of N loss in runoff under both slopes is the DN fraction. The DN loss fluxes account for 85.8% of TN under the 20° slope condition and 89.1% under the 30° slope condition. The proportion of DN is slightly higher under the 30° slope condition than under the 20° slope condition. This is because PN is primarily lost through surface flow, and the surface flow volume under the 30° slope condition is lower than that under the 20° slope. Previous studies have shown that the form of N loss on slopes varies depending on experimental conditions [32,44,45,46,47,48]. Due to the significant interflow loss flux, which predominantly contains DN, the main form of N loss is DN, with NO3−-N being the dominant component. This is primarily because NH4+-N is converted into NO3−-N through microbial nitrification following N fertilizer application [49,50]. NO3−-N, being an anion, is not adsorbed by soil particles [51].
The primary form of P loss in surface flow under both slopes is PP, consistent with previous research on slope runoff [52]. The P is strongly adsorbed by soil colloids, such as clay minerals and iron and aluminum oxides [53], forming insoluble compounds that are typically bound to soil particles [54,55]. As a result, P in surface flow is primarily in the form of PP [56]. The proportion of PP is higher under the 30° slope than under the 20° slope. This is likely due to the lower soil bulk density under the 30° slope, increased erosion of soil particles [55,57], and the cross-slope ridging cultivation method on the steeper slope, which significantly increases the area of direct contact between soil and rainwater, making soil particles more susceptible to erosion [58].
4.3. Nitrogen and Phosphorus Concentration in Interflow
The migration and transformation of nitrogen in the soil involve multiple processes. Organic nitrogen in the soil is converted into mineral nitrogen, such as ammonium nitrogen and nitrate nitrogen, through the action of microorganisms. Ammonium nitrogen is converted into nitrate nitrogen through nitrification under aerobic conditions. Nitrate nitrogen has strong water solubility and mobility and is not easily adsorbed by the soil. Therefore, it is prone to loss through groundwater or surface flow, and this process is a key step in nitrogen migration. Many studies to date have found that the loss of nitrogen in the soil mainly occurs in the form of nitrate nitrogen [59], which is consistent with the result that the proportion of nitrate nitrogen concentration in the interflow in this study is 80.47%. In addition, this study also found that the concentrations of total nitrogen, nitrate nitrogen, and ammonium nitrogen on the 30° slope are higher than those on the 20° slope, and this finding is consistent with the research results of Xie et al. [60]. Xie et al. set up four slopes of 5°, 10°, 15°, and 20°. Under different rainfall intensities, they found that with the increase of the slope, the nitrogen concentration in the interflow first decreases and then increases, and 10° may be the critical slope for the nitrogen concentration in the interflow. However, some studies have also shown that the nitrogen concentration in the interflow decreases with the increase of the slope [61]. Deng et al.’s research on slopes of 5°, 8°, 15°, and 25° shows that under different rainfall intensity conditions, the nitrate nitrogen concentration in the interflow shows a continuous decrease or a trend of first increasing and then decreasing. This is because the average concentration of nitrate nitrogen in the interflow is mainly affected by the interflow rate. Within a small slope range, when the slope increases, the interflow rate increases, and the internal soil erosion intensifies, leading to an increase in the average loss concentration of nitrate nitrogen. However, when the slope continues to increase, the generation rate of interflow rises sharply, which dilutes the nitrate nitrogen in the interflow and reduces its loss concentration. The different results obtained in different studies may be due to the differences in soil physical and chemical properties and specific rainfall conditions. The structure of the soil regulates the migration of nitrogen by affecting the fluidity and permeability of water and its binding with nitrogen. This study adopted the method of in-situ field experiments. The condition of the 30° slope will inevitably lead to a smaller soil bulk density than that of the 20° slope, which makes the soil on the 30° slope have a higher porosity and may even generate preferential flow, resulting in more nitrogen being transferred from the solid phase of the soil to the liquid phase, and thus leading to a higher nitrogen concentration.
The migration of phosphorus in the soil usually occurs in the form of dissolved phosphorus or particulate phosphorus. An important process of phosphorus in the soil is adsorption and desorption. Organic matter and inorganic minerals in the soil (such as iron, aluminum, and calcium oxides) can adsorb dissolved phosphorus. However, when the soil phosphorus concentration is too high or there is excessive moisture, phosphorus will desorb from the soil surface and enter the water flow, increasing the loss. In this study, phosphorus in the interflow is mainly lost in the form of dissolved state, with a concentration proportion as high as 72.82%. This is mainly because the flow rate of the interflow is much lower than that of surface flow, so dissolved phosphorus has more time to enter the interflow. Moreover, under the filtration effect of the soil, particulate phosphorus is less likely to migrate with the interflow. As can be seen from Table 2, the proportion of particulate phosphorus concentration in the interflow under the 30° slope condition is higher. This is because the soil on the 30° slope has a larger porosity, which improves the migration ability of particulate phosphorus in the soil. For the total phosphorus concentration and soluble phosphorus concentration, the 30° slope is significantly higher than the 20° slope. This may be due to the generation of preferential flow under the 30° slope condition. The preferential flow path refers to the pathway of water flow through large pores in the soil (such as root channels, cracks, or drainage systems). These paths provide rapid water flow channels, which can bypass the filtration effect of the soil and quickly carry phosphorus from the surface into the groundwater or drainage system. In the preferential flow path, both dissolved phosphorus and particulate phosphorus can be transported, especially when there is a high soil phosphorus concentration.
4.4. Nutrient Losses via Surface Runoff and Interflow Under Different Slopes
Previous studies have indicated that nutrient losses due to interflow should not be overlooked [62,63,64,65]. In this study, nutrient losses primarily occurred through interflow under both the 20° and 30° slope conditions. The proportion of TN loss flux in interflow under the two slopes was 94.02% and 97.95%, respectively, while the proportion of TP loss flux was 66.28% and 90.96%, respectively. This may be attributed to the well-developed leaves of tea plants, which can intercept substantial rainfall, and their extensive root systems with high water absorption capacity [66]. As a result, water storage on the slope is limited, and nutrient losses predominantly occur through interflow [29]. Previous studies have indicated that a steeper slope does not necessarily lead to greater surface flow [12,31]. Once the slope reaches a certain threshold, the surface flow volume may decrease instead [67,68,69,70,71]. This aligns with the findings of this study, where surface flow under the 20° slope condition was greater than that under the 30° slope (Figure 3b). Furthermore, in this study, soil bulk density under the 30° slope condition was significantly lower than that under the 20° slope condition. Lower soil bulk density allows the soil to retain more water, particularly when rainfall is abundant and rainfall intensity is low [72,73]. Additionally, on the steep 30° slope, cross-slope ridging cultivation is employed, which is highly effective in reducing surface flow [58,74]. Consequently, the N and P loss fluxes in interflow under the 30° slope condition were significantly higher than those under the 20° slope condition in this study.
4.5. Importance of Environmental Factors on Nutrient Leaching Losses from Slope Tea Garden
Nitrogen and phosphorus concentrations in surface flow are governed by a complex interplay of environmental factors [75,76]. While this study identified temperature, humidity, and rainfall intensity as key drivers, deeper exploration of their implications and potential mitigation strategies is critical for addressing nutrient pollution.
The observed positive correlation between temperature and N/P concentrations underscores the role of climate in nutrient cycling. Elevated temperatures enhance microbial mineralization, accelerating the release of bioavailable N and P from organic matter [77]. Concurrently, increased evaporation under warmer conditions concentrates nutrients in the soil, exacerbating their export during runoff events. This relationship suggests that climate warming could intensify eutrophication risks in downstream water bodies. To mitigate this, adaptive land management practices, such as planting vegetative buffer strips along waterways or implementing controlled drainage systems, could reduce nutrient leaching. These measures stabilize soil structure, enhance nutrient uptake by vegetation, and minimize thermal-driven nutrient surges.
Both air and soil humidity exhibited negative correlations with N concentrations, attributed to the dilution effect of increased runoff volume during high rainfall periods [78]. However, this dilution may mask the total nutrient load, as larger runoff volumes can transport proportionally higher absolute quantities of pollutants. In regions with seasonal humidity fluctuations, targeted practices such as rainwater harvesting or optimized irrigation scheduling could balance water availability and nutrient retention. Notably, the divergent relationship between dissolved phosphorus (DP) and soil humidity under 20° versus 30° slopes highlights the role of topography. On steeper slopes (30°), high soil humidity likely enhances DP mobility by saturating soil pores, facilitating dissolution and transport. Implementing terracing or contour farming on steep terrain could disrupt flow pathways, reduce erosion, and promote infiltration, thereby curbing DP loss.
The strong positive correlation between instantaneous rainfall intensity and TN/TP concentrations emphasizes the erosive power of intense storms. High intensity rainfall dislodges soil particles and solubilizes nutrients, enabling rapid transport to aquatic systems. This mechanism is particularly concerning in urbanizing catchments with impervious surfaces, where runoff velocity and pollutant loads are amplified. To address this, integrated erosion control measures, such as cover cropping, silt fencing, and constructed wetlands, can intercept sediment-bound nutrients. Additionally, urban green infrastructure (e.g., permeable pavements, rain gardens) could attenuate runoff peaks and enhance filtration, reducing scouring effects.
This study has several limitations: The research was conducted over a relatively short timeframe at a single location, examining only two slope gradients, which may not represent the full spectrum of conditions across tea-growing regions. Additionally, the simplification of surface flow-soil erosion coupling processes in the HYDRUS-2D model may reduce prediction accuracy. Future research should be substantially expanded in several directions: (1) investigating a wider range of slope gradients (10–40°) across multiple geographical regions with varying soil types to develop more universally applicable understanding of threshold effects in nutrient transport; (2) combining isotope tracing techniques (15N, 18O, and 32P/33P) with long term monitoring to precisely identify nitrogen and phosphorus migration pathways, transformation processes, and interannual variations under changing climate conditions; (3) integrating additional variables such as vegetation cover density, root distribution patterns, microbial community composition, and varied fertilization regimes to understand their interactions with slope effects; (4) developing sophisticated multi-factor coupling models that integrate meteorological data, soil physicochemical properties, hydrological processes, and vegetation characteristics to generate more accurate predictive tools for nutrient loss assessment; and (5) testing practical mitigation strategies such as terracing, contour hedgerows, and precision fertilization techniques specifically optimized for different slope gradients. Such comprehensive approaches would not only advance our theoretical understanding of nutrient transport mechanisms but also provide practical management solutions for reducing the environmental impacts of tea cultivation on sloping lands while maintaining productivity. The enhanced prediction capabilities of these advanced models would also facilitate the development of site-specific best management practices and policy recommendations for sustainable tea cultivation in mountainous regions under future climate scenarios.
5. Conclusions
This study shows that the N and P loss from sloping tea plantations is influenced by slope gradient. TN and TP loss loads were significantly higher on the 30° slope compared to the 20° slope, with increases of 2.58 and 3.43 times, respectively. Interflow was the primary pathway for N and P loss under both 20° and 30° slope conditions. Under the 20° slope, the proportions of nitrogen and phosphorus loss loads through subsurface flow were 90.0% and 70.3%, respectively, while under the 30° slope, they were 96.1% and 94.3%, respectively. The N loss predominantly occurred as DN, accounting for 68.6% of TN in surface flow and 97.8% in interflow. P loss was more variable, with DP accounting for 35.0% of TP in surface flow and 57.0% in interflow. N and P concentrations in surface flow fluctuated significantly during the initial stages of runoff but stabilized over time. Environmental factors, including air temperature, humidity, and rainfall intensity, were key contributors to nutrient loss, with higher humidity promoting P dissolution and increased rainfall intensity enhancing particulate N and P concentrations. These findings highlight the need for slope-specific management practices to mitigate nutrient loss and protect water quality.
Author Contributions
Conceptualization, X.L.; Methodology, S.H.; Data curation, H.W.; Writing—original draft, H.W.; Writing—review & editing, K.M.E., W.F., X.Y. and X.L.; Supervision, X.L.; Project administration, H.W., S.H., H.X., Y.W., Z.W. and X.L.; Funding acquisition, X.L. All authors have read and agreed to the published version of the manuscript.
Funding
The study was financially supported by the Key Research and Development Project of the Science and Technology Department of Zhejiang Province (2024C03245), the Project of Water Resources and Ecological Environment Protection in the Qiandao Lake and Xin’an River Basin, Zhejiang Province, financed by the World Bank (CHJC1—4), and the Science and Technology Cooperation Plan Project in “Three Rural Issues and Nine Aspects” of Zhejiang Province (2024SNJF066).
Data Availability Statement
The datasets obtained and analyzed in the research can be available from the first author on reasonable request.
Conflicts of Interest
The authors declare that they have no known competing financial interests or personal relationships that could have appeared to influence the work reported in this paper.
References
- Zhong, S.; Liu, W.; Ni, C.; Yang, Q.; Ni, J.; Wei, C. Runoff harvesting engineering and its effects on soil nitrogen and phosphorus conservation in the Sichuan Hilly Basin of China. Agric. Ecosyst. Environ. 2020, 301, 107022. [Google Scholar] [CrossRef]
- Sharpley, A.N.; McDowell, R.W.; Kleinman, P.J.A. Phosphorus loss from land to water: Integrating agricultural and environmental management. Plant Soil 2001, 237, 287–307. [Google Scholar] [CrossRef]
- Luo, C.; Gao, Y.; Zhu, B.; Wang, T. Sprinkler-based rainfall simulation experiments to assess nitrogen and phosphorus losses from a hillslope cropland of purple soil in China. Sustain. Water Qual. Ecol. 2013, 1–2, 40–47. [Google Scholar] [CrossRef]
- Ma, X.; Li, Y.; Li, B.; Han, W.; Liu, D.; Gan, X. Nitrogen and phosphorus losses by runoff erosion: Field data monitored under natural rainfall in Three Gorges Reservoir Area, China. CATENA 2016, 147, 797–808. [Google Scholar] [CrossRef]
- Xia, Y.; Zhang, M.; Tsang, D.C.W.; Geng, N.; Lu, D.; Zhu, L.; Igalavithana, A.D.; Dissanayake, P.D.; Rinklebe, J.; Yang, X. Recent advances in control technologies for non point source pollution with nitrogen and phosphorous from agricultural runoff: Current practices and future prospects. Appl. Biol. Chem. 2020, 63, 8. [Google Scholar] [CrossRef]
- Sánchez-Colón, Y.M.; Schaffner, F.C. Identifying Nonpoint Sources of Phosphorus and Nitrogen: A Case Study of Pollution That Enters a Freshwater Wetland (Laguna Cartagena, Puerto Rico). J. Water Resour. Prot. 2021, 13, 588–604. [Google Scholar] [CrossRef]
- García-Serrana, M.; Gulliver, J.S.; Nieber, J.L. Description of soil micro-topography and fractional wetted area under runoff using fractal dimensions. Earth Surf. Process. Landforms 2018, 43, 2685–2697. [Google Scholar] [CrossRef]
- Wang, Y.; Ma, Z.; Li, D.; Hou, G.; Zheng, J. Infiltration Characteristics and Hydrodynamic Parameters in Response to Topographic Factors in Bare Soil Surfaces, Laboratory Experiments Based on Cropland Fields of Purple Soil in Southwest China. Agriculture 2024, 14, 1820. [Google Scholar] [CrossRef]
- Gao, K.; Kong, Z.; Li, Y.; Zhao, F.; Cai, B.; Shi, D.; Wang, R. Experimental Study on Runoff and Sediment Production of the Fully Weathered Granite Backfill Slope under Heavy Rain in Longling, Yunnan Province. Sustainability 2024, 16, 1454. [Google Scholar] [CrossRef]
- Fu, S.; Liu, B.; Liu, H.; Xu, L. The effect of slope on interrill erosion at short slopes. CATENA 2011, 84, 29–34. [Google Scholar] [CrossRef]
- Jourgholami, M.; Karami, S.; Tavankar, F.; Monaco, A.L.; Picchio, R. Effects of Slope Gradient on Runoff and Sediment Yield on Machine-Induced Compacted Soil in Temperate Forests. Forests 2020, 12, 49. [Google Scholar] [CrossRef]
- Fang, H.; Sun, L.; Tang, Z. Effects of rainfall and slope on runoff, soil erosion and rill development: An experimental study using two loess soils. Hydrol. Process. 2014, 29, 2649–2658. [Google Scholar] [CrossRef]
- Wu, S.; Yu, M.; Chen, L. Nonmonotonic and spatial-temporal dynamic slope effects on soil erosion during rainfall-runoff processes. Water Resour. Res. 2017, 53, 1369–1389. [Google Scholar] [CrossRef]
- Peng, W.; Zhang, Z.; Zhang, K. Hydrodynamic characteristics of rill flow on steep slopes. Hydrol. Process. 2015, 29, 3677–3686. [Google Scholar] [CrossRef]
- Bagarello, V.; Caltabellotta, G.; Iovino, M. Estimation of hydrodynamic properties of a sandy-loam soil by two analysis methods of single-ring infiltration data. J. Hydrol. Hydromech. 2022, 70, 234–243. [Google Scholar] [CrossRef]
- Deng, L.; Fei, K.; Sun, T.; Zhang, L.; Fan, X.; Ni, L. Phosphorus Loss through Overland Flow and Interflow from Bare Weathered Granite Slopes in Southeast China. Sustainability 2019, 11, 4644. [Google Scholar] [CrossRef]
- Majewski, M.; Czuchaj, A.; Marciniak, M. Impact of rainfall intensity on soil erosion based on experimental research. Landf. Anal. 2023, 42, 25–36. [Google Scholar] [CrossRef]
- Kaufmann, V.; Pinheiro, A.; Castro, N.M.d.R. Simulating transport of nitrogen and phosphorus in a Cambisol after natural and simulated intense rainfall. J. Contam. Hydrol. 2014, 160, 53–64. [Google Scholar] [CrossRef]
- Franklin, D.; Truman, C.; Potter, T.; Bosch, D.; Strickland, T.; Bednarz, C. Nitrogen and Phosphorus Runoff Losses from Variable and Constant Intensity Rainfall Simulations on Loamy Sand under Conventional and Strip Tillage Systems. J. Environ. Qual. 2007, 36, 846–854. [Google Scholar] [CrossRef]
- Lin, T.-C.; Shaner, P.-J.L.; Wang, L.-J.; Shih, Y.-T.; Wang, C.-P.; Huang, G.-H.; Huang, J.-C. Effects of mountain tea plantations on nutrient cycling at upstream watersheds. Hydrol. Earth Syst. Sci. 2015, 19, 4493–4504. [Google Scholar] [CrossRef]
- Peng, Y.; Qiu, B.; Tang, Z.; Xu, W.; Yang, P.; Wu, W.; Chen, X.; Zhu, X.; Zhu, P.; Zhang, X.; et al. Where is tea grown in the world: A robust mapping framework for agroforestry crop with knowledge graph and sentinels images. Remote Sens. Environ. 2024, 303, 114016. [Google Scholar] [CrossRef]
- Yan, T.; Wang, Z.; Liao, C.; Xu, W.; Wan, L. Effects of the morphological characteristics of plants on rainfall interception and kinetic energy. J. Hydrol. 2021, 592, 125807. [Google Scholar] [CrossRef]
- Jiang, X.J.; Liu, W.; Chen, C.; Liu, J.; Yuan, Z.-Q.; Jin, B.C.; Yu, X.Y. Effects of three morphometric features of roots on soil water flow behavior in three sites in China. Geoderma 2018, 320, 161–171. [Google Scholar] [CrossRef]
- Chen, C.F.; Lin, J.Y. Estimating the gross budget of applied nitrogen and phosphorus in tea plantations. Sustain. Environ. Res. 2016, 26, 124–130. [Google Scholar] [CrossRef]
- Wang, W.; Wu, X.; Yin, C.; Xie, X. Nutrition loss through surface runoff from slope lands and its implications for agricultural management. Agric. Water Manag. 2019, 212, 226–231. [Google Scholar] [CrossRef]
- HJ 636-2012; Water Quality—Determination of Total Nitrogen-Alkaline Potassium Persulfate Digestion-UV Spectrophotometry. China Environmental Science Press: Beijing, China, 2012.
- GB 11893-89; Water Quality—Determination of Total Phosphorus-Ammonium Molybdate Spectrophotometric Method. China Environmental Science Press: Beijing, China, 1989.
- GB 11901-89; Water Quality—Determination of Suspended Solids-Gravimetric Method. China Environmental Science Press: Beijing, China, 1989.
- Wang, T.; Zhu, B.; Zhou, M.; Hu, L.; Jiang, S.; Wang, Z. Nutrient loss from slope cropland to water in the riparian zone of the Three Gorges Reservoir: Process, pathway, and flux. Agric. Ecosyst. Environ. 2020, 302, 107108. [Google Scholar] [CrossRef]
- Yan, L.; Xue, L.; Petropoulos, E.; Qian, C.; Hou, P.; Xu, D.; Yang, L. Nutrient loss by runoff from rice-wheat rotation during the wheat season is dictated by rainfall duration. Environ. Pollut. 2021, 285, 117382. [Google Scholar] [CrossRef]
- Zheng, W.; Zhang, H.; Jiang, Y.; Zhang, X.; Tong, Y.; Zhang, Q. Effect of Slope Gradient on Erosion Evolution Process at Microtopographic Tillage Soil Surfaces. J. Geogr. Inf. Syst. 2019, 11, 481–492. [Google Scholar] [CrossRef]
- Simelane, M.P.Z.; Soundy, P.; Maboko, M.M. Effects of Rainfall Intensity and Slope on Infiltration Rate, Soil Losses, Runoff and Nitrogen Leaching from Different Nitrogen Sources with a Rainfall Simulator. Sustainability 2024, 16, 4477. [Google Scholar] [CrossRef]
- Nieber, J.L.; Sidle, R.C. How do disconnected macropores in sloping soils facilitate preferential flow? Hydrol. Process. 2010, 24, 1582–1594. [Google Scholar] [CrossRef]
- Jackson, C.R.; Bitew, M.; Du, E. When interflow also percolates: Downslope travel distances and hillslope process zones. Hydrol. Process. 2014, 28, 3195–3200. [Google Scholar] [CrossRef]
- Liang, K.; He, B. Naturally rainfall-induced changes in runoff-associated nitrogen and phosphorus losses in purple soil area: Roles of land disturbance and plot length. EGU Gen. Assem. Conf. Abstr. 2021, 21, 13919. [Google Scholar]
- Han, J.; Li, Z.; Li, P.; Tian, J. Nitrogen and phosphorous concentrations in runoff from a purple soil in an agricultural watershed. Agric. Water Manag. 2010, 97, 757–762. [Google Scholar] [CrossRef]
- Kato, T.; Kuroda, H.; Nakasone, H. Runoff characteristics of nutrients from an agricultural watershed with intensive livestock production. J. Hydrol. 2009, 368, 79–87. [Google Scholar] [CrossRef]
- Wu, L.; Peng, M.; Qiao, S.; Ma, X. Assessing impacts of rainfall intensity and slope on dissolved and adsorbed nitrogen loss under bare loessial soil by simulated rainfalls. CATENA 2018, 170, 51–63. [Google Scholar] [CrossRef]
- Wu, L.; Qiao, S.; Peng, M.; Ma, X. Coupling loss characteristics of runoff-sediment-adsorbed and dissolved nitrogen and phosphorus on bare loess slope. Environ. Sci. Pollut. Res. 2018, 25, 14018–14031. [Google Scholar] [CrossRef]
- Wang, Z.; Chen, L.; Liu, C.; Jin, Y.; Li, F.; Khan, S.; Liang, X. Reduced colloidal phosphorus loss potential and enhanced phosphorus availability by manure-derived biochar addition to paddy soils. Geoderma 2021, 402, 115348. [Google Scholar] [CrossRef]
- Wang, N.; Wang, L.; Jin, L.; Wu, J.; Pang, M.; Wei, D.; Li, Y.; Wang, J.; Xu, T.; Yang, Z.; et al. Rainfall Runoff and Nitrogen Loss Characteristics on the Miyun Reservoir Slope. Water 2024, 16, 786. [Google Scholar] [CrossRef]
- Liu, R.; Wang, J.; Shi, J.; Chen, Y.; Sun, C.; Zhang, P.; Shen, Z. Runoff characteristics and nutrient loss mechanism from plain farmland under simulated rainfall conditions. Sci. Total. Environ. 2014, 468–469, 1069–1077. [Google Scholar] [CrossRef]
- Wang, Z.; Eltohamy, K.M.; Liu, B.; Jin, J.; Liang, X. Effects of drying-rewetting cycles on colloidal phosphorus composition in paddy and vegetable soils. Sci. Total. Environ. 2024, 907, 168016. [Google Scholar] [CrossRef]
- Bouraima, A.-K.; He, B.; Tian, T. Runoff, nitrogen (N) and phosphorus (P) losses from purple slope cropland soil under rating fertilization in Three Gorges Region. Environ. Sci. Pollut. Res. 2015, 23, 4541–4550. [Google Scholar] [CrossRef] [PubMed]
- Ramos, M.C.; Lizaga, I.; Gaspar, L.; Quijano, L.; Navas, A. Effects of rainfall intensity and slope on sediment, nitrogen and phosphorous losses in soils with different use and soil hydrological properties. Agric. Water Manag. 2019, 226, 105789. [Google Scholar] [CrossRef]
- Du, Y.; Li, T.; He, B. Runoff-related nutrient loss affected by fertilization and cultivation in sloping croplands: An 11-year observation under natural rainfall. Agric. Ecosyst. Environ. 2021, 319, 107549. [Google Scholar] [CrossRef]
- Wang, L.; Li, Y.; Wu, J.; An, Z.; Suo, L.; Ding, J.; Li, S.; Wei, D.; Jin, L. Effects of the Rainfall Intensity and Slope Gradient on Soil Erosion and Nitrogen Loss on the Sloping Fields of Miyun Reservoir. Plants 2023, 12, 423. [Google Scholar] [CrossRef]
- Wang, L.; Wang, N.; Zhang, Q.; Wu, J.; Wang, S.; Pang, M.; Wang, J.; Zhou, C.; Han, Y.; Yang, Z.; et al. Research on Multi-Factor Effects of Nitrogen Loss in Slope Runoff. Water 2024, 16, 1431. [Google Scholar] [CrossRef]
- Ouyang, Y.; Norton, J.M. Nitrite Oxidizer Activity and Community Are More Responsive Than Their Abundance to Ammonium-Based Fertilizer in an Agricultural Soil. Front. Microbiol. 2020, 11, 1736. [Google Scholar] [CrossRef]
- Kraft, B.; Tegetmeyer, H.E.; Sharma, R.; Klotz, M.G.; Ferdelman, T.G.; Hettich, R.L.; Geelhoed, J.S.; Strous, M. The environmental controls that govern the end product of bacterial nitrate respiration. Science 2014, 345, 676–679. [Google Scholar] [CrossRef]
- Fan, Y.; Wang, X.; Qian, X.; Dixit, A.; Herman, B.; Lei, Y.; McCutcheon, J.; Li, B. Enhancing the Understanding of Soil Nitrogen Fate Using a 3D-Electrospray Sensor Roll Casted with a Thin-Layer Hydrogel. Environ. Sci. Technol. 2022, 56, 4905–4914. [Google Scholar] [CrossRef]
- Wu, L.; Liu, X.; Ma, X. How biochar, horizontal ridge, and grass affect runoff phosphorus fractions and possible tradeoffs under consecutive rainstorms in loessial sloping land? Agric. Water Manag. 2021, 256, 107121. [Google Scholar] [CrossRef]
- Eltohamy, K.M.; Menezes-Blackburn, D.; Klumpp, E.; Liu, C.; Jin, J.; Xing, C.; Lu, Y.; Liang, X. Microbially Induced Soil Colloidal Phosphorus Mobilization Under Anoxic Conditions. Environ. Sci. Technol. 2024, 58, 7554–7566. [Google Scholar] [CrossRef]
- Xie, X.; Cheng, H. Adsorption and desorption of phenylarsonic acid compounds on metal oxide and hydroxide, and clay minerals. Sci. Total Environ. 2021, 757, 143765. [Google Scholar] [CrossRef] [PubMed]
- Amadou, I.; Faucon, M.-P.; Houben, D. Role of soil minerals on organic phosphorus availability and phosphorus uptake by plants. Geoderma 2022, 428, 116125. [Google Scholar] [CrossRef]
- Eltohamy, K.M.; Li, J.; Gouda, M.; Menezes-Blackburn, D.; Milham, P.J.; Khan, S.; Li, F.; Liu, C.; Xu, J.; Liang, X. Nano andfine colloids suspended in the soil solution regulate phosphorusdesorption and lability in organic fertiliser-amended soils. Sci. Total Environ. 2023, 858, 160195. [Google Scholar] [CrossRef]
- Sensoy, H. Impact of Deforestation and Erosion on Some Soil Physicochemical Properties and Microbial Activity on Steep Slopes. Croat. J. For. Eng. 2024, 45, 305–318. [Google Scholar] [CrossRef]
- Guo, S.; Zhai, L.; Liu, J.; Liu, H.; Chen, A.; Wang, H.; Wu, S.; Lei, Q. Cross-ridge tillage decreases nitrogen and phosphorus losses from sloping farmlands in southern hilly regions of China. Soil Tillage Res. 2019, 191, 48–56. [Google Scholar] [CrossRef]
- Xie, M.; Šimůnek, J.; Zhang, Z.; Zhang, P.; Xu, J.; Lin, Q. Nitrate subsurface transport and losses in response to its initial distributions in sloped soils: An experimental and modelling study. Hydrol. Process. 2019, 33, 3282–3296. [Google Scholar] [CrossRef]
- Xie, M.; Zhang, P.; Shi, Y.; Hong, D. Effects of hydrological processes on surface and subsurface nitrogen losses from purple soil slopes. Res. Sq. 2021. [Google Scholar] [CrossRef]
- Deng, L.-Z.; Fei, K.; Sun, T.-Y.; Zhang, L.-P.; Fan, X.-J.; Ni, L. Characteristics of runoff processes and nitrogen loss via surface flow and interflow from weathered granite slopes of Southeast China. J. Mt. Sci. 2019, 16, 1048–1064. [Google Scholar] [CrossRef]
- Harmel, R.D.; Smith, D.R.; Haney, R.L.; Allen, P.M. Comparison of nutrient loss pathways: Run-off and seepage flow in Vertisols. Hydrol. Process. 2019, 33, 2384–2393. [Google Scholar] [CrossRef]
- Gungor, K.; Karakaya, N.; Evrendilek, F.; Akgul, S.; Baskan, O.; Cebel, H.; Farhoud, H.J.; Turkecan, O.; Yasar, S.; Gumus, O. Spatiotemporal modeling of watershed nutrient transport dynamics: Implications for eutrophication abatement. Ecol. Inform. 2016, 34, 52–69. [Google Scholar] [CrossRef]
- Gao, R.; Dai, Q.; Gan, Y.; Yan, Y.; Peng, X. The mechanisms of nutrient output through water flow from sloping farmland with slight rocky desertification in a karst region. Environ. Res. Lett. 2020, 15, 094085. [Google Scholar] [CrossRef]
- Williams, M.R.; Livingston, S.J.; Penn, C.J.; Smith, D.R.; King, K.W.; Huang, C.-H. Controls of event-based nutrient transport within nested headwater agricultural watersheds of the western Lake Erie basin. J. Hydrol. 2018, 559, 749–761. [Google Scholar] [CrossRef]
- Pan, Q.; Jin, K.; Hu, Y. Influence of tea leaf morphology on water interception for droplet impact. Hydrol. Process. 2024, 38, 15090. [Google Scholar] [CrossRef]
- Chen, X.; Liang, Z.; Zhang, Z.; Zhang, L. Effects of Soil and Water Conservation Measures on Runoff and Sediment Yield in Red Soil Slope Farmland under Natural Rainfall. Sustainability 2020, 12, 3417. [Google Scholar] [CrossRef]
- Hou, F.; Ni, Z.; Wang, S.; Sun, H.; Zhao, F.; Zhong, W.; Zhang, Y. Study on Soil and Water Loss on Slope Surface and Slope Stability Under Rainfall Conditions. Water 2024, 16, 3643. [Google Scholar] [CrossRef]
- Zhang, Y.; Song, L.; Bi, Y.; He, B.; Zeng, R.; Li, T. Effects of the angle between the rock strata and slope on flow hydraulics and sediment yield in karst trough valley: Laboratory scour experiment. Int. J. Sediment Res. 2023, 39, 100–109. [Google Scholar] [CrossRef]
- Wang, X.; Deng, Y.; Dong, M.; Guan, M.; Wu, Y.; Xu, R. A simplified method for evaluating shallow slope stability of slopes based on an indirectly coupled runoff and groundwater seepage model. Hydrogeol. J. 2025, 33, 309–327. [Google Scholar] [CrossRef]
- Zare, M.; Soufi, M.; Nejabat, M.; Pourghasemi, H.R. The topographic threshold of gully erosion and contributing factors. Nat. Hazards 2022, 112, 2013–2035. [Google Scholar] [CrossRef]
- Wang, F.; Wang, J. Effects of rainfall intensity and compaction on water transport from opencast coal mine soils: An experimental study. Hydrol. Process. 2019, 34, 258–269. [Google Scholar] [CrossRef]
- Wu, L.; Yen, H.; Ma, X. Effects of particulate fractions on critical slope and critical rainfall intensity for runoff phosphorus from bare loessial soil. CATENA 2021, 196, 104935. [Google Scholar] [CrossRef]
- Li, T.; Ma, F.; Wang, J.; Qiu, P.; Zhang, N.; Guo, W.; Xu, J.; Dai, T. Study on the Mechanism of Rainfall-Runoff Induced Nitrogen and Phosphorus Loss in Hilly Slopes of Black Soil Area, China. Water 2023, 15, 3148. [Google Scholar] [CrossRef]
- Zhang, Y.; Zeng, R.; Li, T.; Song, L.; He, B. Intelligent Analysis Strategy for the Key Factor of Soil Nitrogen and Phosphorus Loss via Runoff under Simulated Karst Conditions. Forests 2023, 14, 2109. [Google Scholar] [CrossRef]
- Lang, M.; Li, P.; Yan, X. Runoff concentration and load of nitrogen and phosphorus from a residential area in an intensive agricultural watershed. Sci. Total. Environ. 2013, 458, 238–245. [Google Scholar] [CrossRef] [PubMed]
- Wang, R.; Sun, Q.; Wang, Y.; Liu, Q.; Du, L.; Zhao, M.; Gao, X.; Hu, Y.; Guo, S. Temperature sensitivity of soil respiration: Synthetic effects of nitrogen and phosphorus fertilization on Chinese Loess Plateau. Sci. Total. Environ. 2017, 574, 1665–1673. [Google Scholar] [CrossRef]
- Rodríguez-Blanco, M.; Taboada-Castro, M. Rainfall–runoff response and event-based runoff coefficients in a humid area (northwest Spain). Hydrol. Sci. J. 2012, 57, 445–459. [Google Scholar] [CrossRef]

Disclaimer/Publisher’s Note: The statements, opinions and data contained in all publications are solely those of the individual author(s) and contributor(s) and not of MDPI and/or the editor(s). MDPI and/or the editor(s) disclaim responsibility for any injury to people or property resulting from any ideas, methods, instructions or products referred to in the content. |
© 2025 by the authors. Licensee MDPI, Basel, Switzerland. This article is an open access article distributed under the terms and conditions of the Creative Commons Attribution (CC BY) license (https://creativecommons.org/licenses/by/4.0/).