Abstract
A hanging net test was conducted from May to November 2022 on Takifugu rubripes culture nets at Wang Jia Island in the North Yellow Sea, China. The study identified 21 species of fouling organisms, with Mytilus edulis emerging as the dominant fouling organism colonizing aquaculture net cages. Coverage rates varied temporally, with water depth, and by net material, exhibiting a unimodal pattern that peaked between June and October (38.46–98.45%). At different depths, the coverage rates were highest at −0.5 m (75.14% to 98.65%). Additionally, nets made of nylon (29.41% to 98.65%) had an average coverage rate 8.2% higher than those made of PE mesh (26.34% to 90.45%). To assess the growth and mechanical properties of M. edulis, we analyzed its morphological relationships. A strong positive linear correlation was observed between shell length, width, and thickness, while body weight followed a power function relationship with shell dimensions. Growth curve analysis indicated that M. edulis reached maturity in late August. Compression tests revealed a defined yield point, with crack propagation varying by force direction. The maximum compressive force occurred in the thickness direction (195.95 N), with resistance increasing progressively from length to width to thickness. These findings elucidate biofouling dynamics on aquaculture nets and support the development of improved antifouling technologies.
1. Introduction
In recent years, China’s seawater net-pen aquaculture industry has experienced rapid growth. In 2023, the country produced 58.09 million tons of aquatic products through aquaculture, of which 23.96 million tons (over 40% of the total production) originated from net-pen systems [1]. This production marked a 5.27% increase from 2022. Additionally, the value of seawater aquaculture output reached CNY 488.55 billion, reflecting a 5.32% increase compared to the previous year [2].
Prolonged immersion of aquaculture nets in seawater facilitates substantial biofouling accumulation [3]. This growth restricts water exchange within and around net enclosures [4,5], leading to reduced dissolved oxygen levels and degraded environmental conditions, which negatively affect survival rates, productivity, and quality of farmed species [6,7]. While China’s marine aquaculture industry has expanded rapidly, cost-effective and sustainable biofouling mitigation strategies for net enclosures remain underdeveloped. To address this gap, this study characterizes biofouling communities on aquaculture nets in China’s North Yellow Sea and evaluates the mechanical properties of dominant fouling species. The findings establish critical baseline data to inform the design of targeted net-cleaning technologies for marine aquaculture systems.
Biofouling on aquaculture nets remains a persistent challenge in marine farming. Atalah et al. [8] investigated spatial and temporal patterns of fouling organisms across 10 sites in New Zealand’s Perna canaliculus mussel farms, revealing chronic biological pollution in farmed waters. Seven sites exhibited significantly higher fouling densities compared to surrounding areas, with organism abundance declining with distance from the farms. Similarly, in mussel fry cultivation areas of Coqueiro’s, southeastern Brazil, De Sá et al. [9] documented 97 species and 42,646 individual fouling organisms over a 10-month study. Crustaceans dominated numerically, while biomass was highest for Polysiphonia subtilissima (Montagne, 1840), Ulva rigida (C. Agardh, 1823), and Bugula neritina (Linnaeus, 1758). Carraro et al. [10] expanded this research by analyzing fouling on Nodipecten nodosus (Linnaeus, 1758) aquaculture nets in Santa Catarina, Brazil, identifying 32 attached species, 80% of which belonged to Porifera, Urochordata, Polychaeta, and Mollusca. The impact of operational parameters on fouling dynamics has also been explored. Bloecher et al. [11] studied Norwegian salmon farms, assessing how immersion time (1–12 months), sampling season, mesh size (13 and 25 mm), and net spacing influenced biomass, species richness, and community composition. Their inventory of 90 species demonstrated that immersion duration and seasonal timing significantly affected fouling, while mesh size differences only marginally altered community structure in shorter-term samples (1–6 months). In the Red Sea, Ba-Akdah et al. [12] identified bivalves and ascidians as dominant fouling organisms on nets submerged at 1 m depth over one year, with intermittent occurrences of gastropods, polychaetas, and crustaceans. Supporting these findings, Salama et al. [13] observed greater fouling density on 4 mm mesh nets compared to 20 mm nets at Red Sea aquaculture sites, particularly at shallower depths (−2 m). Their study recorded diverse biofouling communities—including macroalgae, copepods, bivalves, and ascidians, underscoring depth and mesh size as critical factors in fouling management.
Research on fouling dynamics in Chinese aquaculture systems has highlighted both regional and seasonal variability. Xu et al. [14] investigated fouling organisms on deep-water net pens in Zhejiang’s Fodu, Xiangshan, and Dachen sea areas, identifying Obelia dichotoma (Linnaeus, 1758), Anthopleura xanthogrammica (Brandt, 1835), Caprella iniquilibra (Mayer, 1903), Mytilus edulis (Linnaeus, 1758) as dominant species. Their study also revealed seasonal fluctuations in fouling abundance, with distinct decline patterns observed across species. Similarly, Shui et al. [15] analyzed fouling communities in Zhoushan’s Xiushan and Changzhi Island waters, reporting a broader assemblage of dominant species, including Obelia dichotoma (Linnaeus, 1758), Anthopleura xanthogrammica (Brandt, 1835), Caprella iniquilibra (Mayer, 1903), Balanus amphitrite amphitrite (Darwin, 1854), Mytilus edulis (Linnaeus, 1758), Crassostrea gigas (Thunberg, 1793), Ulva pertusa (Kjellman, 1897), Enteromorpha clathrata (Roth Greville, 1830). Fouling biomass peaked between July and November, coinciding with warmer temperatures, followed by a gradual decline in macroalgal growth as temperatures dropped after November. In contrast, studies in the South China Sea demonstrated different fouling patterns. Liu et al. [16] documented two annual attachment peaks (April–May and October–December) during settlement panel surveys, with Perna viridis (Linnaeus, 1758), Balanus reticulatus (Utinomi, 1967), Perinereis nuntia (Lamarck, 1818), and Bugula neritina (Linnaeus, 1758) dominating the fouling community. Biomass followed a seasonal hierarchy, with summer > fall > spring > winter, emphasizing the influence of regional climatic conditions on fouling dynamics.
The colonization mechanisms of biofouling organisms on aquaculture netting materials exhibit significant spatial variations across different marine environments. Yu et al. [17] examined the influence of copper nanocomposite (CuNP) content on the monofilament morphology and antifouling properties of nanocomposite nets in the South China Sea. Their study demonstrated that copper nanocomposite/high-density polyethylene (CuNP/HDPE) nets exhibited significant antifouling effects, reducing biofouling colonization compared to conventional HDPE nets. After six months of immersion, the weight gain of CuNP/HDPE nets—a proxy for fouling biomass accumulation—was 32% lower than that of untreated HDPE nets, indicating enhanced antifouling performance due to the incorporated nanomaterials. Chen et al. [18] investigated the combined effects of exposure time and water depth on microplastic biofilm formation in the coastal waters of the Yellow Sea, China. Polyethylene (PE) films were deployed at three depths (2 m, 6 m, and 12 m) for varying durations (30, 75, and 135 days). The results demonstrated a significant positive correlation between biofilm accumulation and exposure time, whereas biofilm formation exhibited an inverse relationship with water depth. These findings highlight the critical role of temporal and spatial factors in shaping microplastic-associated biofouling dynamics in marine environments. Zhou et al. [19] conducted a 12-month investigation characterizing fouling organisms on mesh cages in Leizhou Bay, South China Sea. Their findings revealed that polyethylene terephthalate (PET) mesh cages accumulated higher biomass than polyethylene (PE) cages. Additionally, two dominant fouling species were identified: Perna viridis (Linnaeus, 1758) and Dreissena polymorpha (Pallas, 1771). These species exhibited significant colonization on both cage types, suggesting their adaptability to different substrate materials. In a pivotal investigation on biofouling dynamics during the initial phase of green tide formation in the Yellow Sea, Geng et al. [20] conducted comparative analyses of substrate preferences in Ulva prolifera (O.F.Müller, 1778) through controlled experimentation with nylon and plastic mesh substrates. By examining the adhesion mechanisms of U. prolifera germ cells, their research revealed a critical colonization window; spore attachment rates achieved 80% saturation within 2–6 h of exposure, with the most rapid adhesion kinetics observed during the initial 2 h period. Notably, quantitative assessments identified nylon mesh as the superior adhesion substrate, exhibiting statistically significant differences in spore density retention compared to plastic counterparts. While significant progress has been made in developing biodegradable antifouling coatings, their practical application in aquaculture remains constrained by two critical factors: high cost-effectiveness ratios and limited protective duration. This is exemplified by the aquaculture practices in Zhuanghe, Dalian, where conventional polyethylene (PE) nets and nylon nets persist as the predominant materials for farming infrastructure. Against this practical backdrop, the present study selects PE and nylon nets as experimental substrates to systematically investigate the biofouling attachment mechanisms on these material surfaces.
Wangjia Island, located in Zhuanghe, Dalian, Liaoning Province, is a representative area in the North Yellow Sea for ecological studies of biofouling communities. This region supports diverse aquaculture species and rich biological assemblages, making it an ideal site for investigating fouling dynamics in marine aquaculture systems. In this study, field experiments were conducted using submerged nets in Wangjia Island’s waters to examine the species composition and colonization patterns of fouling organisms on Takifugu rubripes (Temminck & Schlegel, 1850) aquaculture nets. Special attention was given to the dominant fouling species, Mytilus edulis (blue mussel), with detailed analyses of its growth characteristics and mechanical properties. The findings aim to provide foundational data for developing efficient net-cleaning technologies in marine aquaculture.
2. Materials and Methods
2.1. Test Material
In this study, two mesh materials widely employed in aquaculture—polyethylene (PE) (Qiang sheng Special Nets Co., Ltd., Taizhou, China) and nylon (Qiang sheng Special Nets Co., Ltd., Taizhou, China)—were selected for analysis. Both materials featured a uniform mesh size of 1 cm and wire diameter of approximately 2 mm. Twelve experimental nets (numbered 1–12) were constructed by securing the mesh to 30 cm × 30 cm PVC (Weng’s Huajian Co., Ltd., Taizhou, China) frames. Each frame held four nets deployed at depths of 0.5 m, 2.0 m, 3.5 m, and 5.0 m to assess fouling variability across water column strata. The experimental setup, illustrated in Figure 1, enabled systematic monitoring of biofouling accumulation under real-world aquaculture conditions.
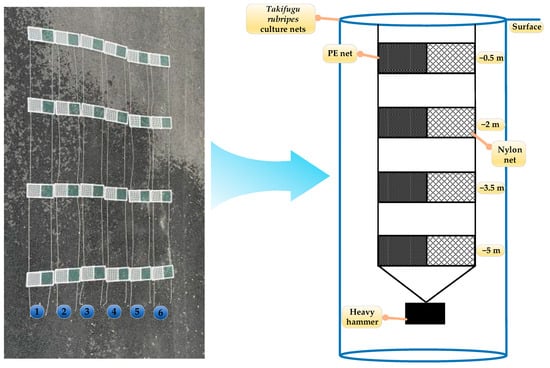
Figure 1.
Schematic of the experimental hanging net setup.
2.2. Test Methods
Field trials were conducted from 1 May to 1 November 2022 in the net-cultured waters of T. rubripes near Wangjia Island, Zhuanghe, Dalian City, Liaoning Province (123.10° E, 39.46° N; Figure 2). During the study period, the water temperature ranged seasonally from 5 °C to 25 °C, salinity remained stable at 31–32 ppt, and water transparency varied between 0.5 m and 3.0 m. The cultured fish were fed a diet of commercial pellet feed supplemented with fresh omnivorous prey to replicate standard aquaculture practices.
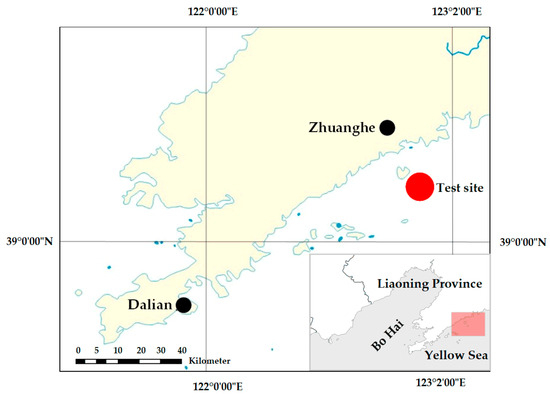
Figure 2.
Study site for experimental hanging net deployment.
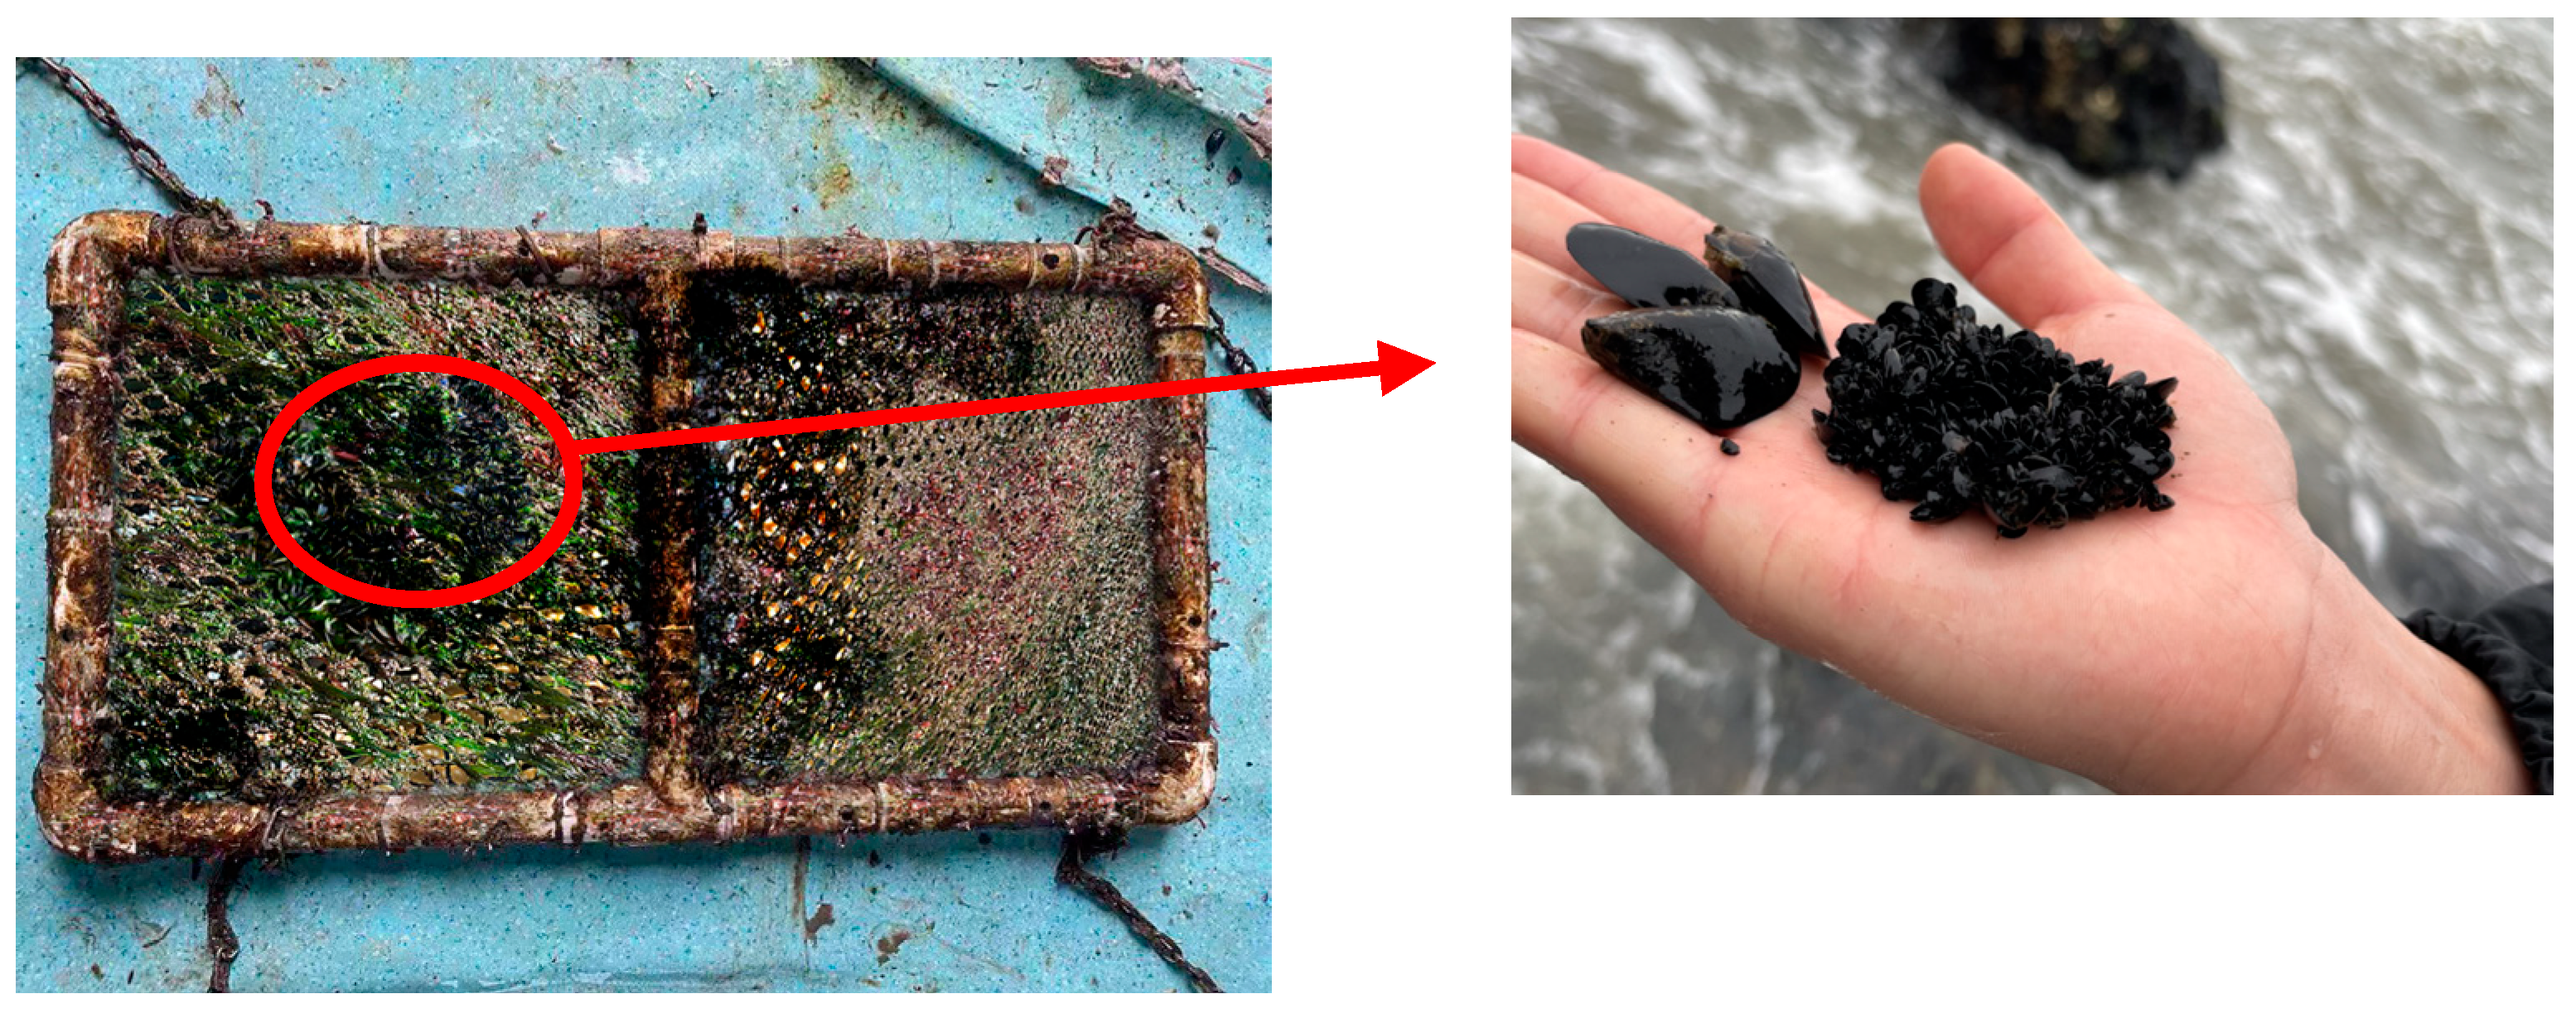
The experimental nets were secured to the inner edge of the aquaculture cage structure and inspected biweekly for structural integrity or fouling-related damage. During each inspection, photographic documentation and biological samples of fouling organisms were collected to assess community composition and biomass. To preserve sample integrity, retrieved specimens were immediately fixed in a 5% formalin solution and transported to the laboratory for taxonomic identification. Key equipment used in the study included a high-resolution camera (for image documentation) (Sony RX1R II , Sony Co., Ltd., Tokyo, Japan), salinity meter (ATAGO PR-100SA, ATAGO Co., Ltd., Tokyo, Japan), Secchi disk (PURITY SD2, Beijing Purity Instrument Co., Ltd., Beijing, China), digital calipers (Mitutoyo 573-621-20, Mitutoyo Co., Ltd., Kawasaki, Japan), binocular microscope (Olympus BX-63, Olympus Co., Ltd., Tokyo, Japan), electronic balance (Sartorius Cubis MCA 124S-1CEU, Sartorius Co., Ltd., Göttingen, Jerman), and an electronic peel tester (Instron 5944, Instron Co., Ltd., Norwood, MA, USA) to quantify fouling adhesion strength.
2.2.1. Species Identification for Attachments
Morphological features of fouling organisms were analyzed using a binocular microscope, with taxonomic classification based on the World Register of Marine Species [21]. Sampling timestamps were documented to track temporal patterns in the emergence and decline of dominant fouling taxa, providing insights into seasonal succession dynamics within the aquaculture environment.
2.2.2. Mesh Coverage Calculation
Coverage percentage, a key metric for quantifying biofouling biomass, was derived from digital image analysis of the net mesh, calculated as:
The fouling coverage analysis was performed following these steps: (1) the total area of netting material (S1) was measured; (2) digital images were processed using ImageJ (1.53r 21 April 2022) software through grayscale conversion and binarization; (3) the fouling organisms were effectively segmented from the background; and (4) the total area of both fouling organisms and netting threads (S2) was calculated. This standardized image analysis protocol ensured accurate quantification of biofouling coverage.
Initial baseline coverage values for unfouled mesh (Figure 3) were determined using threshold-based software, yielding 26.34% for polyethylene (PE) and 29.23% for nylon. These baseline values were applied uniformly in subsequent image processing to ensure consistency in tracking temporal changes in fouling accumulation.
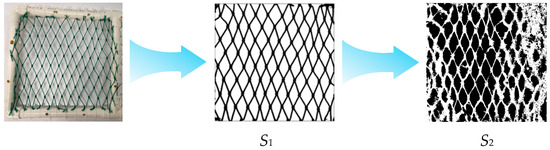
Figure 3.
Illustrates the methodology for calculating biofouling organism coverage on aquaculture net cages.
2.2.3. Dominant Fouling Organisms and Mechanical Property Analysis
Dominant fouling species were identified using the dominance index () [22], calculated as:
where is the abundance of species in a sampling grid, is the total abundance of all species, and represents the frequency of species across depth strata. Species with an index of relative importance (IRI) ≥ 100 were classified as dominant.
Following taxonomic identification, organisms were cleaned and measured for physical parameters (length, width, thickness, weight, and compression force) [23,24] using digital calipers (Mitutoyo 573-621-20, Mitutoyo Co., Ltd., Kawasaki, Japan), an electronic balance (Sartorius Cubis MCA 124S-1CEU, Sartorius Co., Ltd., Göttingen, Jerman), and an electronic striping tester (Instron 5944, Instron Co., Ltd., Norwood, MA, USA).
Taylor’s power law [23] was applied to model relationships between geometric dimensions, calculated as:
In the fitting equation, p represents shell width and thickness, while x denotes shell length. The coefficients a and a0 correspond to the fitted parameters derived from the regression analysis, describing the allometric relationship between these morphological characteristics.
A logistic function [25] was fitted to growth patterns of dominant species, calculated as:
In the growth model, G represents shell length and body weight, t denotes the quantified time interval, and c corresponds to the derived fitting coefficients that characterize the growth relationship between these biometric parameters.
Statistical analyses were performed using SPSS (28.0) and MATLAB (R2021b), with sampling intervals standardized to 15-day increments (t = 1 corresponding to 15 May 2022).
3. Results
3.1. Environmental Factors
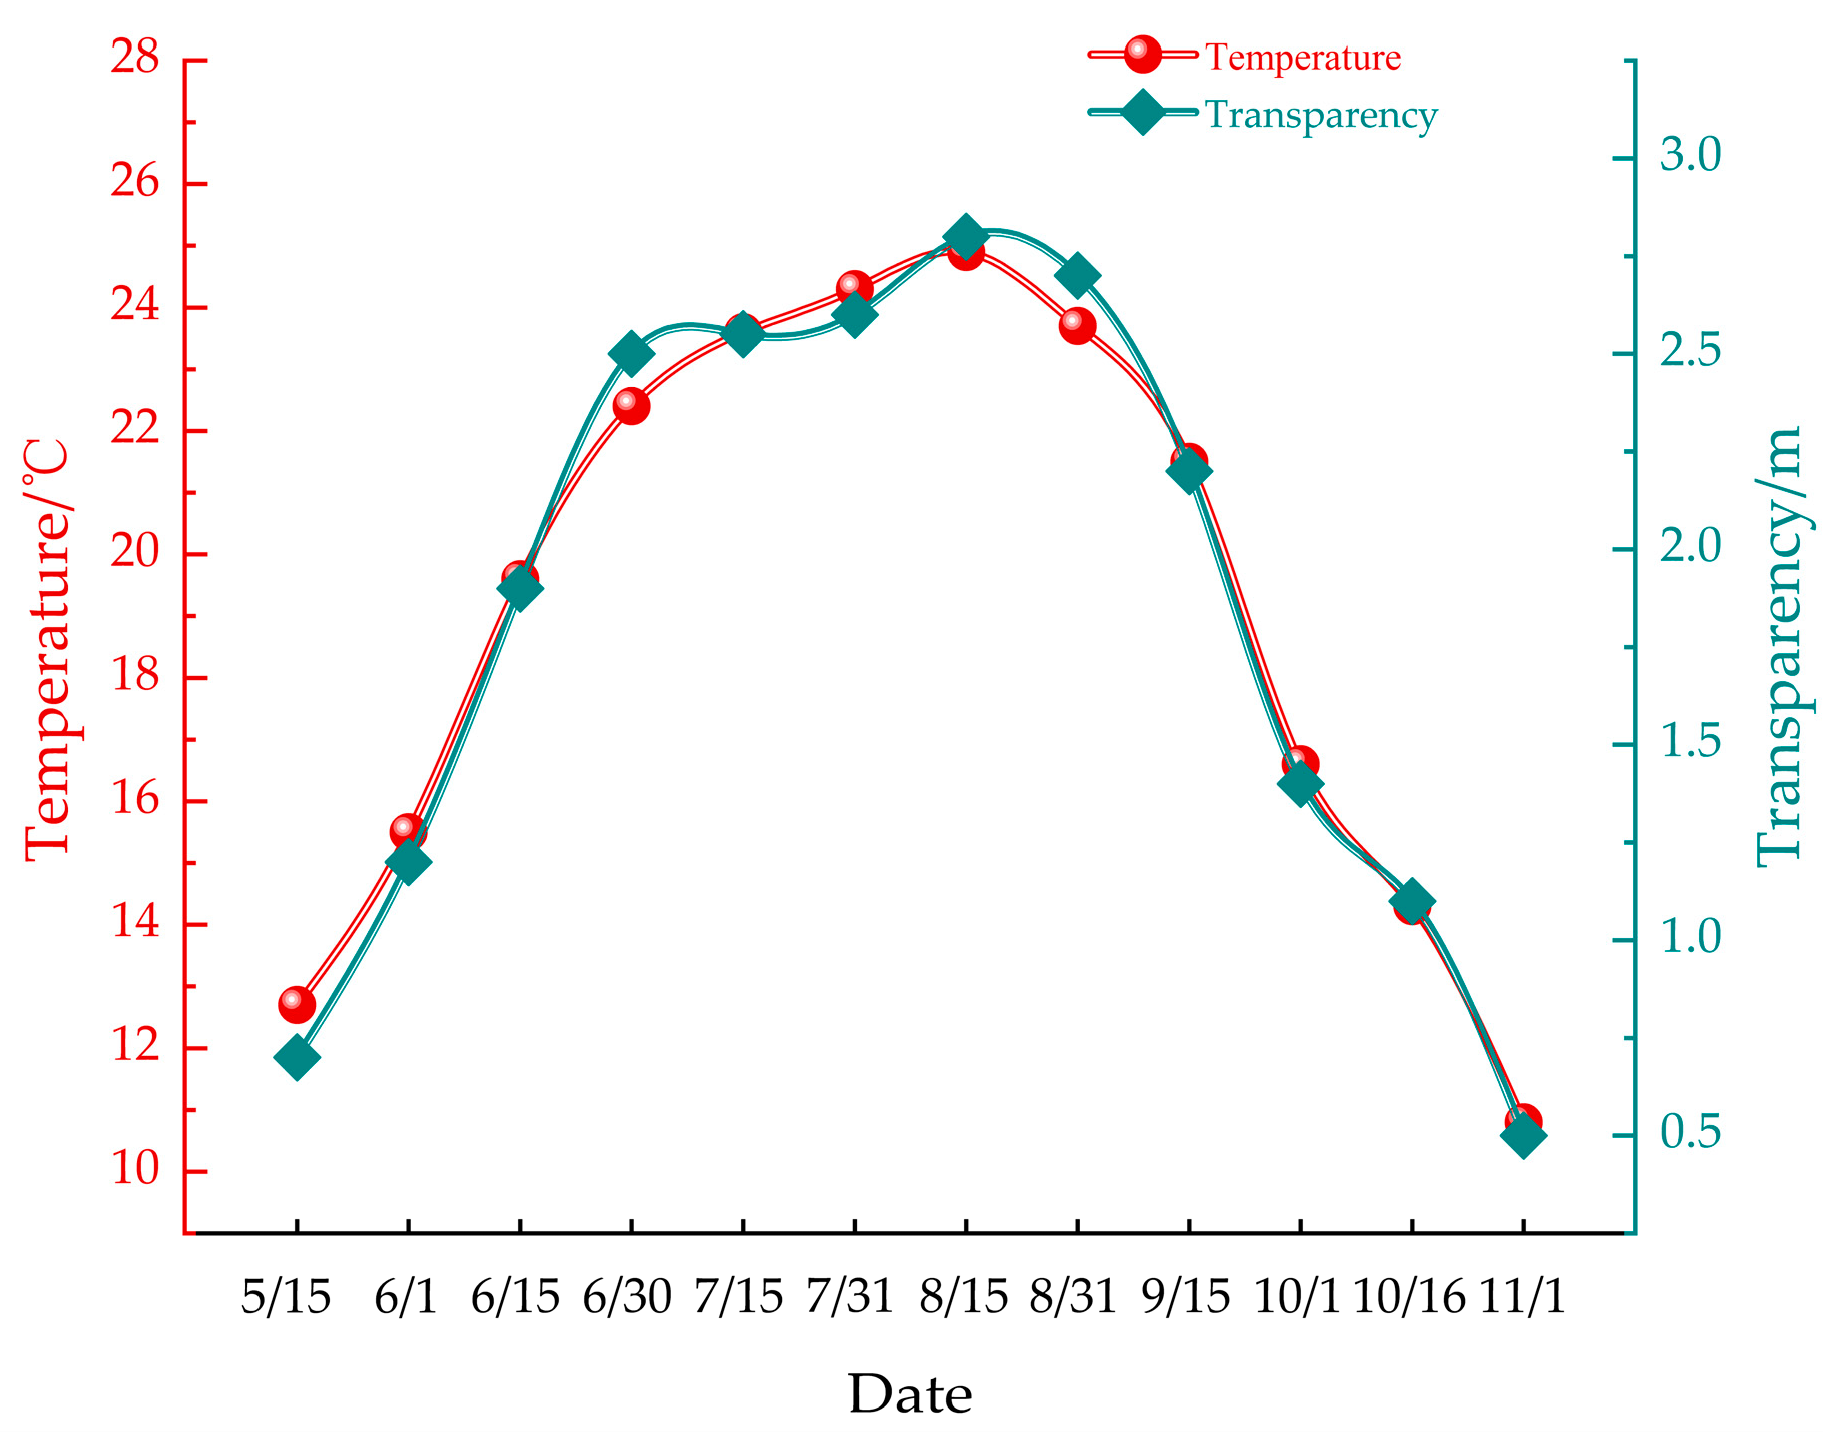
The monthly average water temperature during the study period ranged from 10.8 °C to 26.6 °C, peaking in July and reaching its lowest point in November. Concurrently, seawater transparency varied between 0.5 m and 3 m, with the clearest conditions observed in July and the lowest transparency recorded in November. These fluctuations in temperature and transparency are visually represented in Figure 4. This variability in environmental conditions provides essential context for understanding the fouling dynamics observed on the farmed nets.
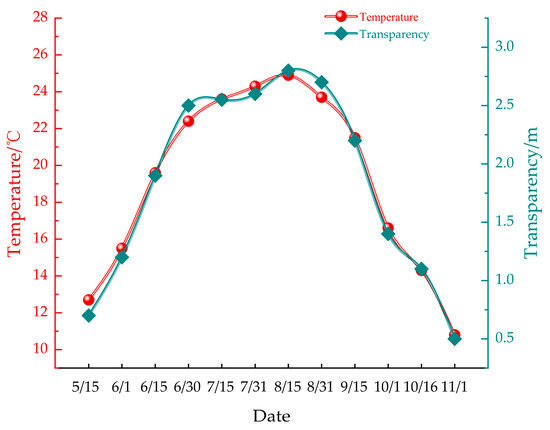
Figure 4.
Depicts temporal variations in water temperature and transparency.
3.2. Temporal Variation in Fouling Community Composition
During the experiment, a total of 21 species of attached organisms were recorded on the mesh. These species included Undaria pinnatifida (Harvey Suringar, 1873), Entomorpha clathrata (Roth Greville, 1830), Cladophora (Kützing, 1843), Ulva lactuca (Linnaeus, 1753), Ulva pertusa, Symphyocladia latiuscula (Harvey Yamada, 1941), Ulothrix flacca (Dillwyn Thuret, 1863), Gelidium amansii (J.V. Lamouroux, 1813), Anthopleura midori (Uchida & Muramatsu, 1958), Eudendrium capillare (Alder, 1856), Obelia geniculata (Linnaeus, 1758), Caprella scaura (Templeton, 1836), Jassa falcata (Montagu, 1808), Cymodoceae japonica (Richardson, 1906), Ciona intestinalis (Linnaeus, 1767), Botryllus schlosseri (Pallas, 1766), Bugula californica (Robertson, 1905), Tricellaria occidentalis (Trask, 1857), Reniera japonica (Kadota, 1922), Nereis falcaria multignatha (Wu, Sun & Yang, 1981), and M. edulis. Of these, M. edulis, U. lactuca, E. clathrata, S. latiuscula, C. scaura, E. capillare, and C. intestinalis were the dominant species, collectively accounting for 83% of the total recorded organisms in the aquaculture waters of Wangjia Island. The pattern of attachment of these organisms over the 75-day period of net hanging is depicted in Figure 5.
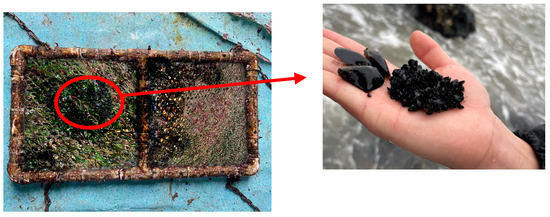
Figure 5.
Temporal dynamics of fouling attachment over the 75-day experimental period.
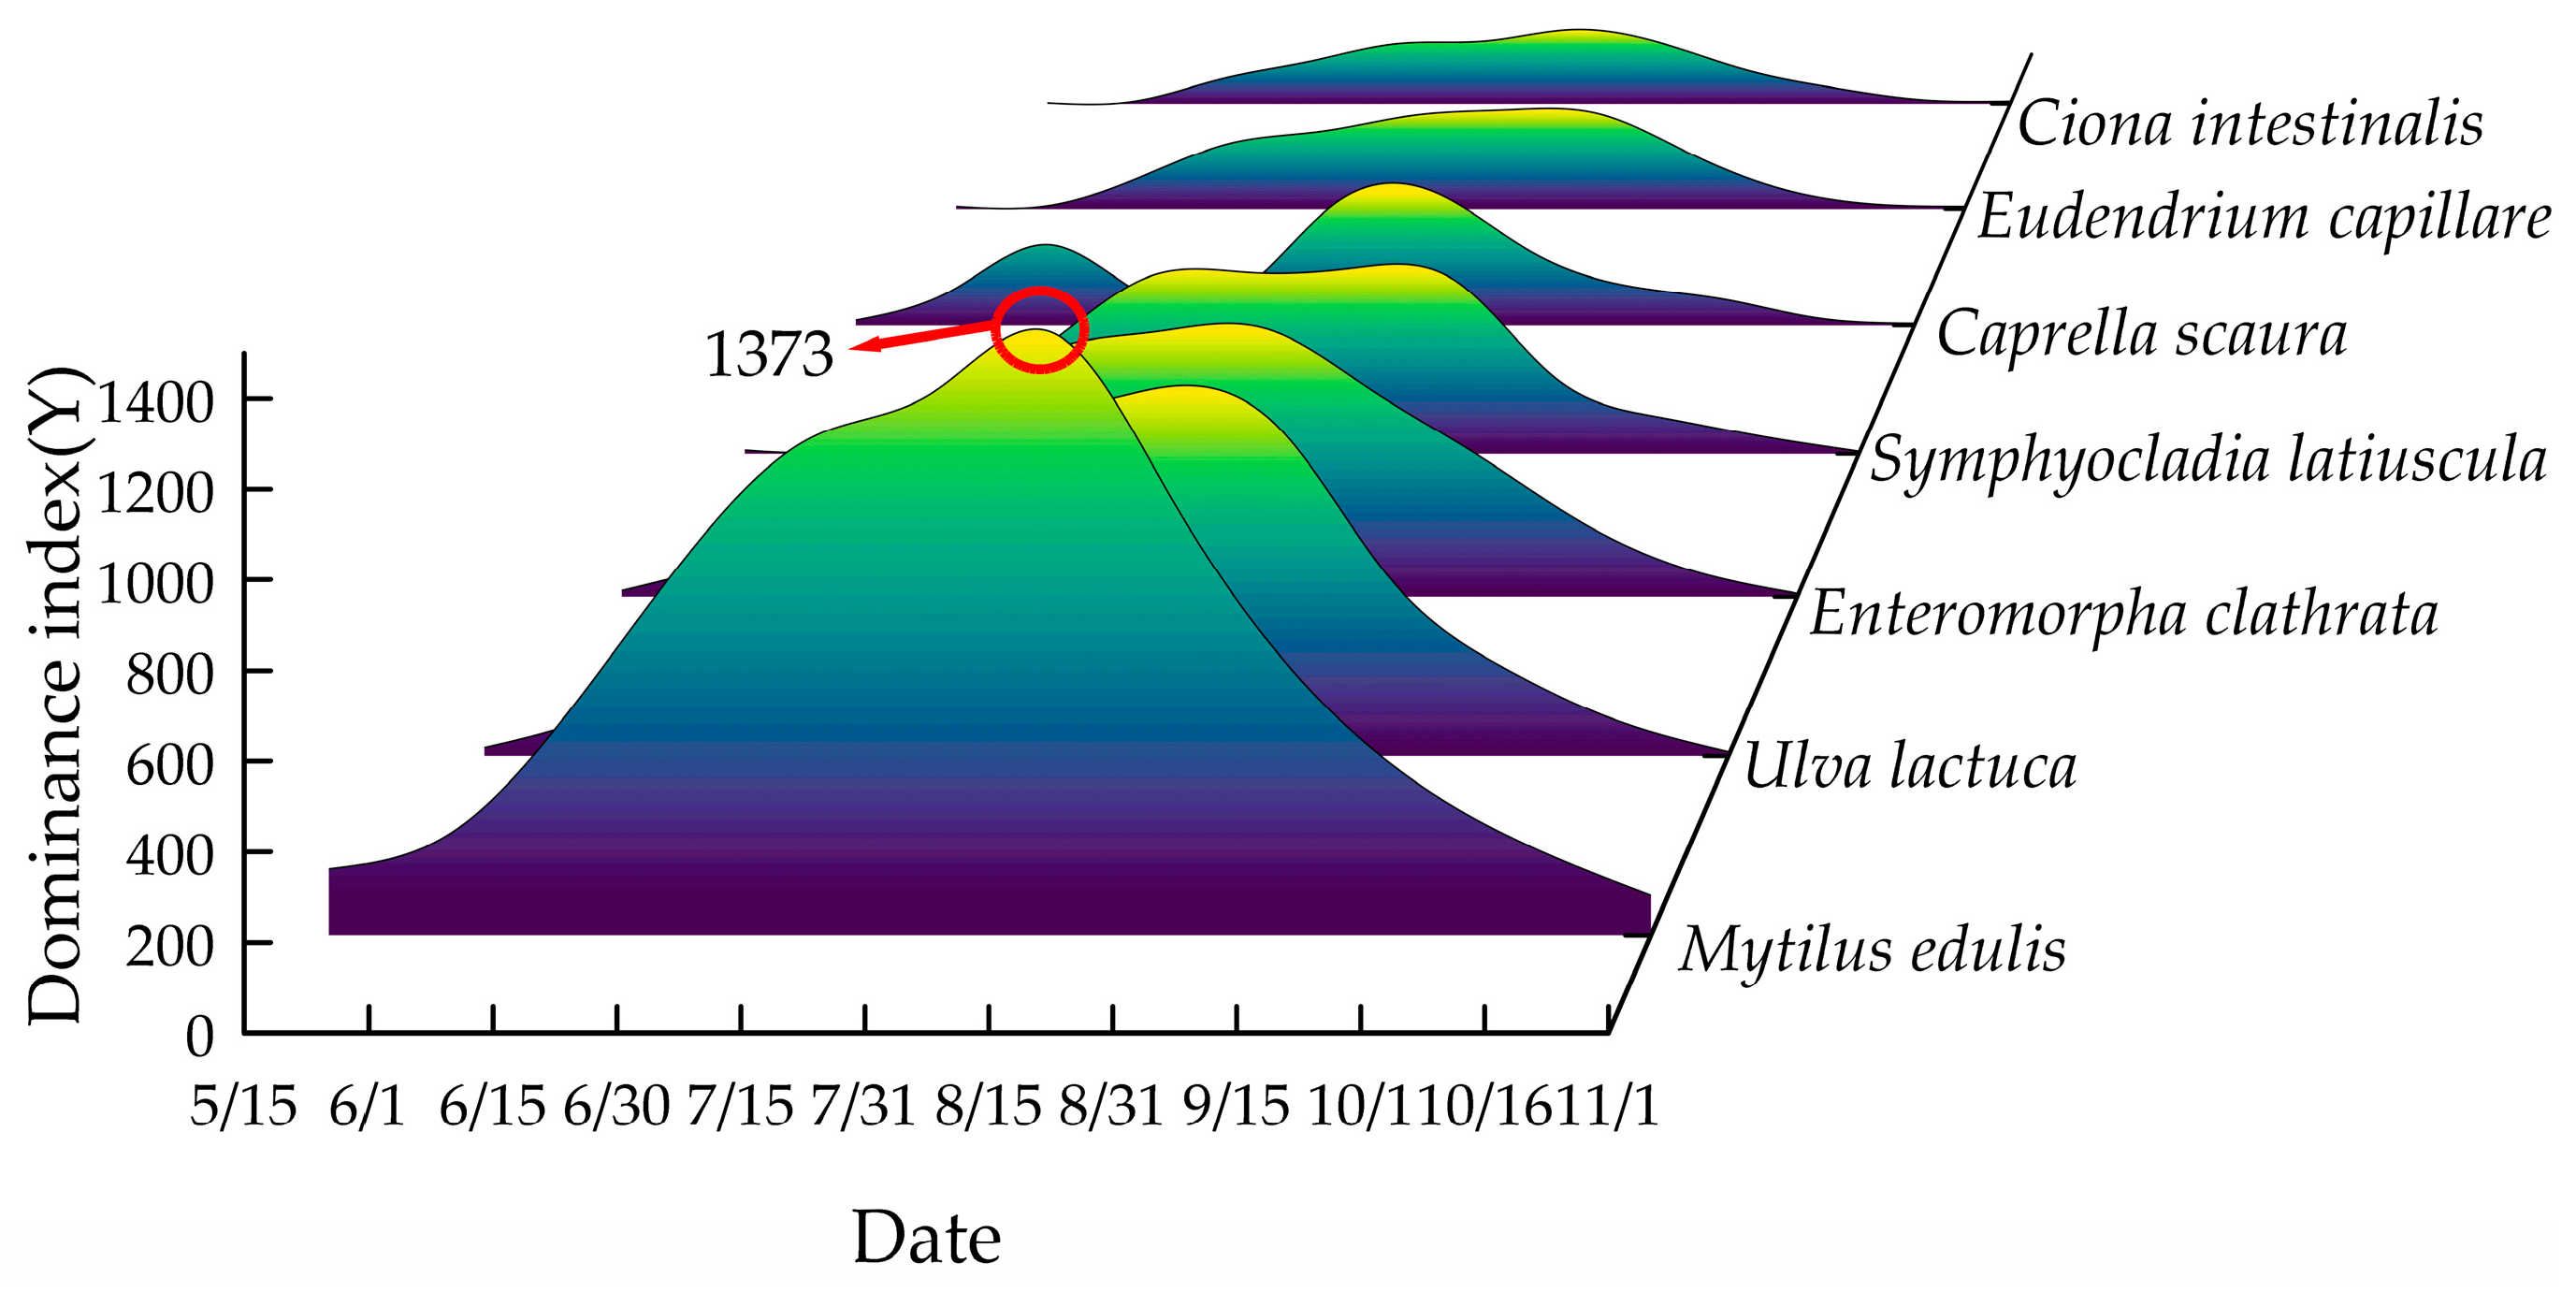
The temporal changes in dominant fouling species on the nets are illustrated in Figure 6. In mid-May, only M. edulis was observed, followed by the colonization of E. clathrata, U. lactuca, and C. scaura in early June. From mid-June to early October, the fouling community diversified, with E. clathrata, U. lactuca, S. latiuscula, E. capillare, C. scaura, C. intestinalis, and M. edulis all present. By November, only M. edulis remained attached. No significant differences in fouling species composition were observed between the two mesh materials. This uniformity can be attributed to seasonal environmental conditions. From June to October, elevated seawater temperatures and increased nutrient availability—driven by intensive feeding operations, unconsumed bait, and fish feces—created optimal conditions for fouling growth. In contrast, lower temperatures in May and November inhibited algal colonization, leaving M. edulis as the sole fouling organism.

Figure 6.
Illustrates the temporal variation of the index of dominant species affixed to nets in the experimental sea area.
E. capillare and C. intestinalis exhibited attachment from June to October, with peak colonization occurring in late July. Both species subsequently declined in abundance, disappearing entirely by the time of net lifting on 16 October. During their attachment period, E. capillare and C. intestinalis were primarily concentrated at depths of −0.5 m and −2 m, respectively.
E. clathrata, U. lactuca, and S. latiuscula colonized the nets in June, displaying rapid growth and significant biomass accumulation. These species persisted until mid-October, with peak colonization observed between mid-July and September. Over 90% of their attachment occurred at shallow depths (≤0.5 m), where light penetration was optimal for photosynthesis. The high photosynthetic efficiency at this depth supported their dominance, as irradiance levels favored algal proliferation in the upper water column.
The M. edulis emerged as the dominant and most representative fouling species in the study area. From mid-May to November, M. edulis was found attached to the mesh at four different water depths: −0.5 m, −2 m, −3.5 m, and −5 m. It reached its peak attachment in mid-July and remained prevalent through October. M. edulis was the dominant species, characterized by its long attachment period, large biomass, wide distribution, and significant impact on water exchanges around the mesh. Given its prominence, the subsequent investigation focused on its biological characteristics.
During the experiment, a significant population of Balanus amphitrite (Darwin, 1854) was observed on the coastal reefs in the waters of Wangjia Island. However, no attachment of B. amphitrite was recorded on the experimental nets. This absence may be linked to the species’ response to the material of the attachment substrate and the presence of other organisms on it. A similar phenomenon was noted in a study by Xu et al. [14].
3.3. Correlation Between Attached Biomass and Water Depth over Time
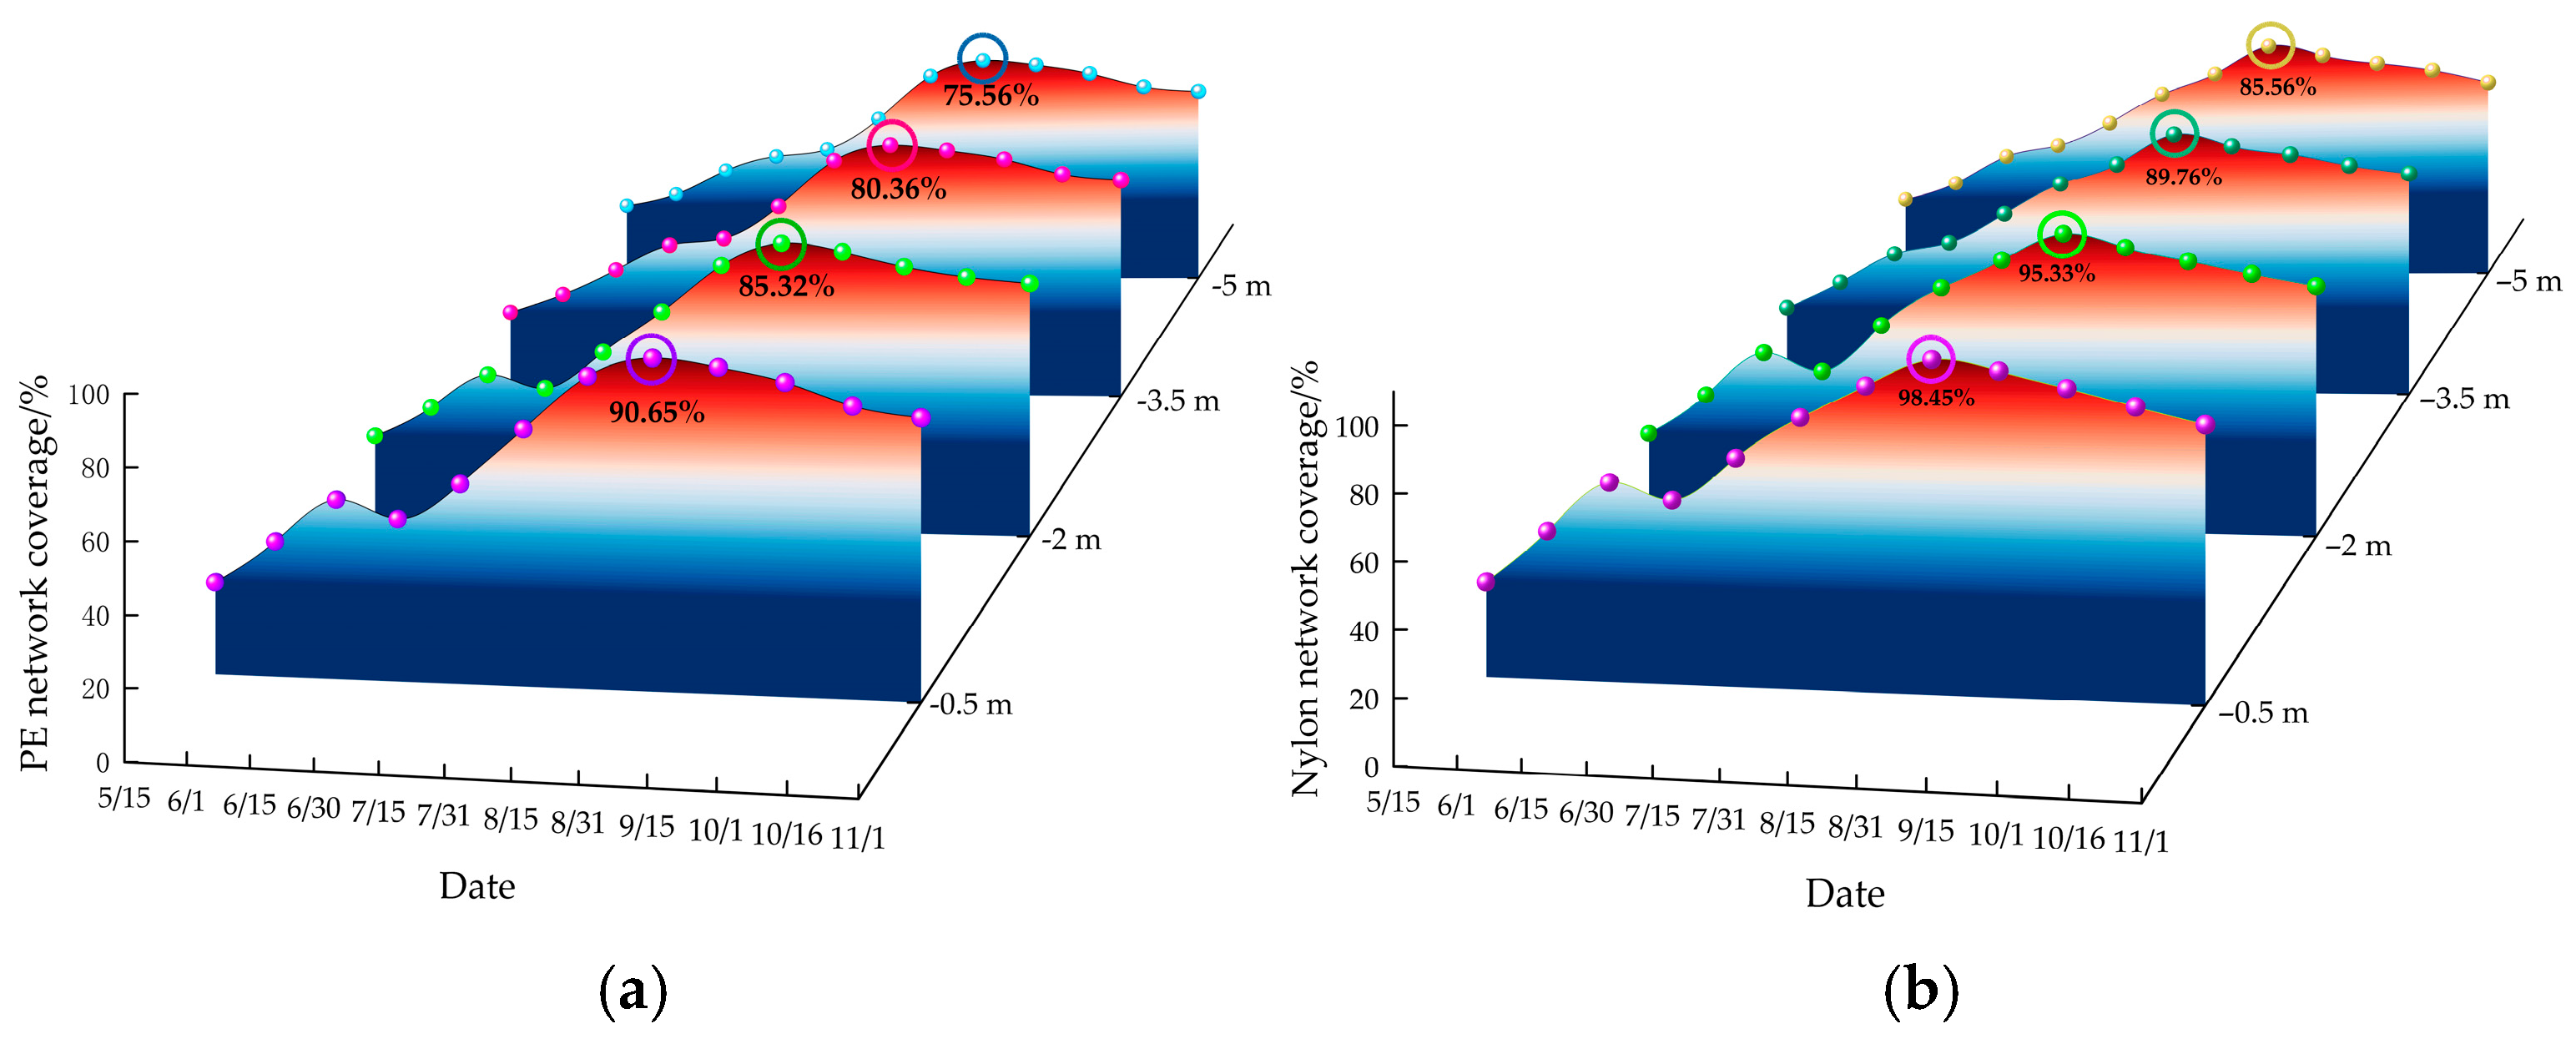
Figure 7 illustrates the change in the coverage rate of the mesh at different water depths over time. Overall, the coverage rate followed a pattern of initial increase followed by a decrease. However, the mesh at −0.5 m and −2 m depths experienced a temporary decline followed by a rise between mid-June and mid-July, likely due to re-attachment after the disappearance of C. scaura. One month after the mesh was submerged, there was a marked increase in biological attachment, which persisted until the end of August. Following this, the coverage rate declined but remained high through November. From June to October, the coverage rate peaked, ranging from 38.46% to 98.45%. Throughout the test, the coverage rate for nylon netting (29.41% to 98.65%) averaged 8.2% higher than PE netting (26.34% to 90.65%) throughout the experiment, suggesting that nylon was more prone to biological attachment.
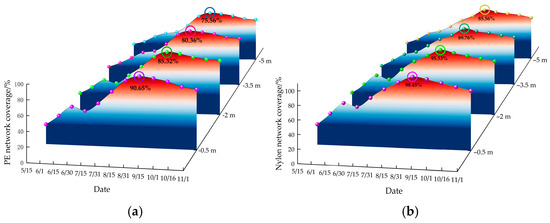
Figure 7.
Temporal and depth-dependent variations in mesh coverage rate. (a) Change of PE network coverage. (b) Change of nylon network coverage.
Fouling biomass exhibited a clear depth-dependent gradient, with coverage rates decreasing as water depth increased: −0.5 m > −2.0 m > −3.5 m > −5.0 m. During peak attachment periods, coverage at −0.5 m depth ranged from 75.14% to 98.65%, significantly higher (by 20.64%) than at −5.0 m depth. This pattern aligns with the phototactic behavior of fouling organisms, as both mollusks and algae possess photosensitive mechanisms that drive their preference for well-lit environments [26,27]. Low light intensity and reduced water clarity (1–2 m) during the early experimental period limited fouling growth at greater depths (−3.5 m and −5.0 m). However, as light intensity increased after mid-July, fouling biomass expanded rapidly at these depths. These findings underscore light availability as a primary factor influencing depth-dependent fouling biomass in aquaculture systems.
3.4. Biological Characteristics of M. edulis
M. edulis displayed the highest dominance index among fouling organisms, attributed to its extended attachment period, significant biomass, and strong adhesion to net surfaces. The byssal threads secreted by its posterior end formed particularly resilient bonds with the nets, making manual removal challenging. These characteristics collectively highlight its substantial impact on net integrity and maintenance, establishing it as the most influential fouling species in the study area. Given its substantial impact on cage operations, this study focuses on the biological characteristics of M. edulis to inform the development of effective net-cleaning technologies. During each sampling event, M. edulis specimens of varying sizes were collected from the nets. After a 24 h holding period, shell length, shell width, shell thickness, body weight, and compression force were measured to assess growth and mechanical properties.
3.4.1. Analysis of M. edulis Biological Characteristics
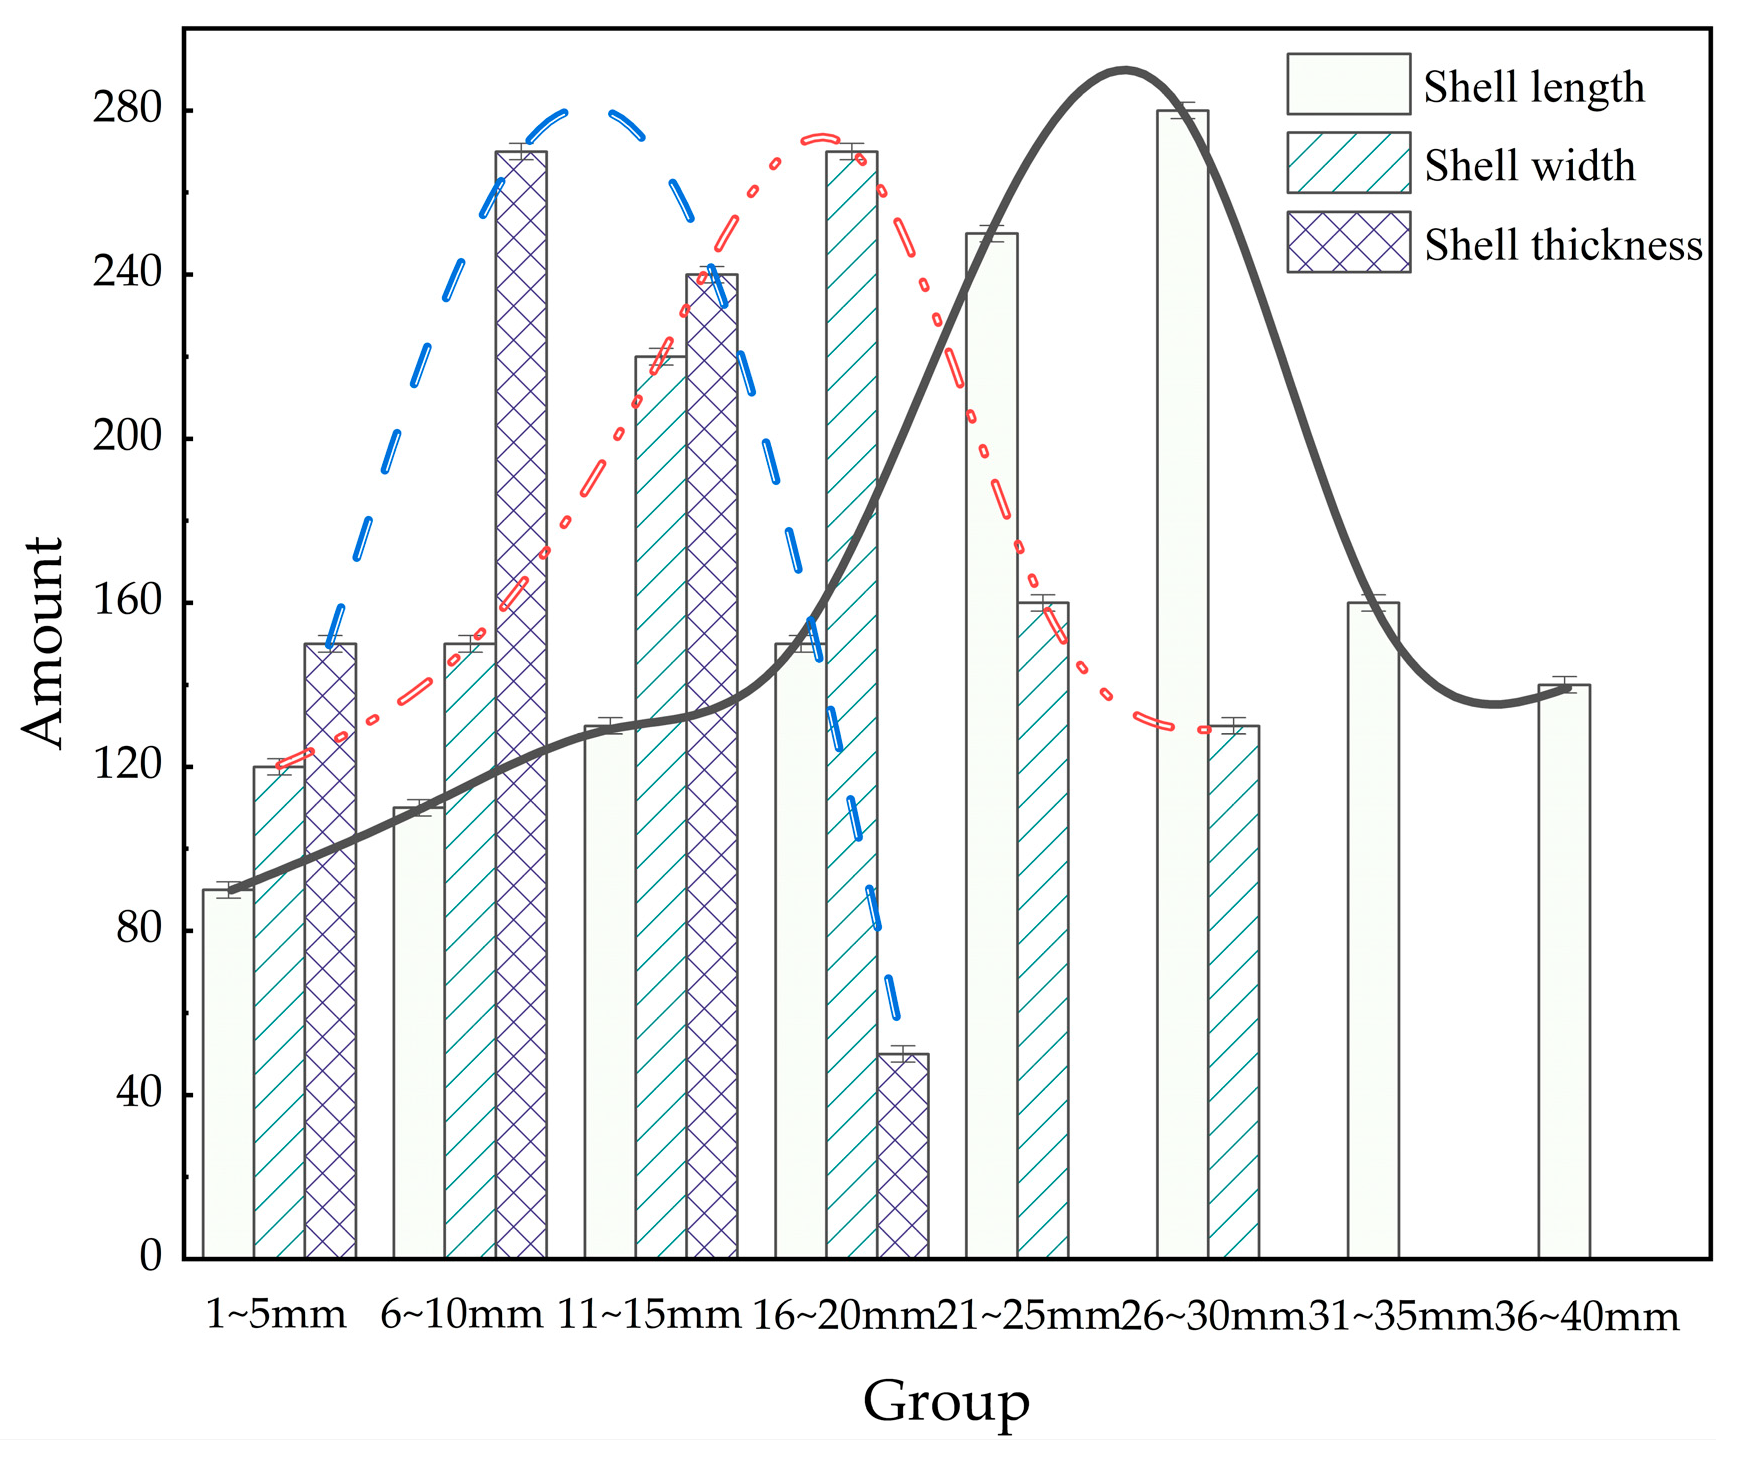
The geometric dimensions of M. edulis were analyzed to explore correlations between shell length (L), width (H), and thickness (D). As illustrated in Figure 8, shell length primarily ranged from 20 to 30 mm, shell width from 11 to 20 mm, and shell thickness from 6 to 15 mm. These measurements provide a baseline for understanding the growth patterns and morphological variability of M. edulis fouling on aquaculture nets.
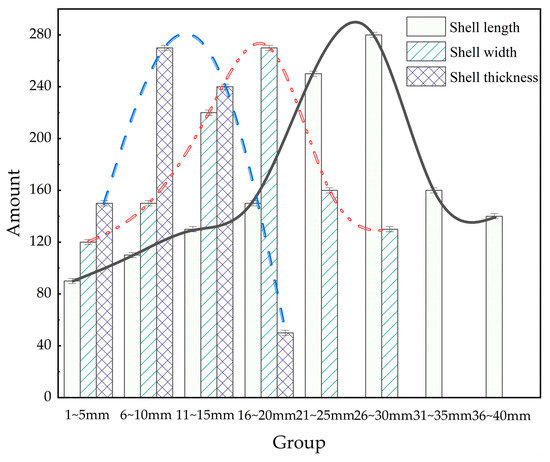
Figure 8.
Distribution of M. edulis sizes.
Linear regression analysis was used to establish relationships between shell length and shell thickness as:
Relationships between shell length and shell width were established as:
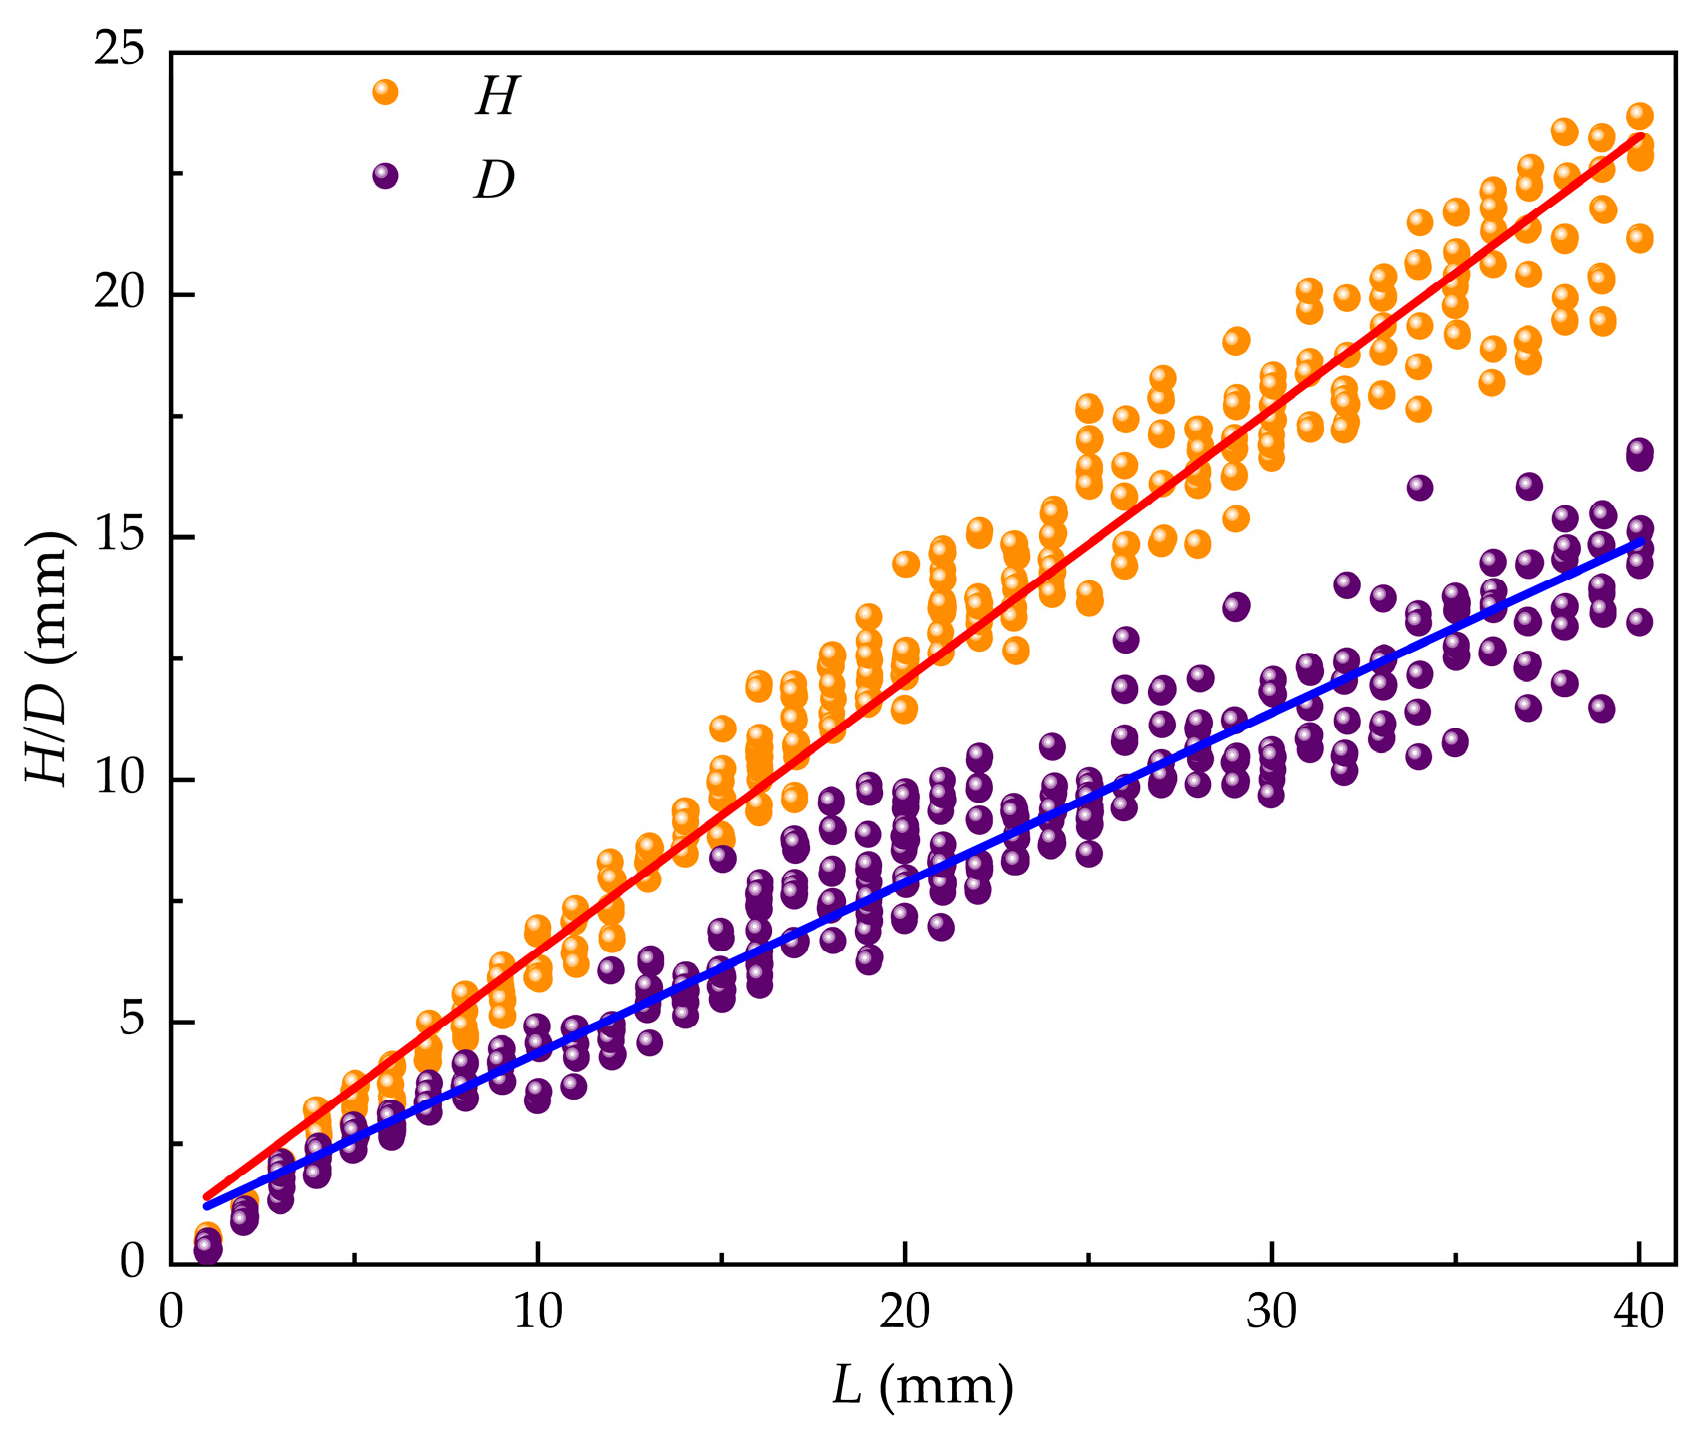
The slope (k) and intercept (d) for the D−L relationship were 0.351 ± 0.003 and 0.860 ± 0.067, respectively, with a throughput coefficient of 0.975. For the H−L relationship, the slope and intercept were 0.561 ± 0.003 and 0.857 ± 0.074, respectively, with a throughput coefficient of 0.988. These regressions, derived from M. edulis size data, revealed highly significant linear correlations between shell length, width, and thickness, as illustrated in Figure 9.

Figure 9.
Relationship between L, D, and H.
The path analysis used shell length as the independent variable, with shell width and thickness as dependent variables. The results showed that the strongest path coefficient was between shell length and width (0.988, p < 0.01), followed by shell length and thickness (0.975, p < 0.01). Both relationships were statistically significant, with a very high level of significance (p < 0.01). This indicates that shell length has the most direct influence on shell width in living M. edulis and is the primary factor affecting shell width.
Regression analysis based on Taylor’s power law revealed significant power function relationships between body weight (W) and shell dimensions in M. edulis. The relationship between shell length and body weight was found to be:
with a coefficient of 0.0001054 ± 0.0000034, a power exponent of 2.9937 ± 0.0051, and a flux coefficient of 0.653.
The relationship between shell width and body weight was:
with a coefficient of 0.000293 ± 0.000077, a power exponent of 3.075 ± 0.03613.075 ± 0.0361, and a flux coefficient of 0.432.
The relationship between shell thickness and body weight was:
with a coefficient of 0.001673 ± 0.000014, a power exponent of 2.9875 ± 0.00341, and a flux coefficient of 0.271.
These results demonstrated significant power function relationships between body weight and shell length, width, and thickness, as shown in Figure 10. The direct effects of shell length and width on body weight were statistically significant. Among the shell dimensions, shell length had the largest throughput coefficient (0.653), followed by shell width (0.432), indicating that shell length had the most significant direct impact on body weight, with shell width being the second most influential factor.
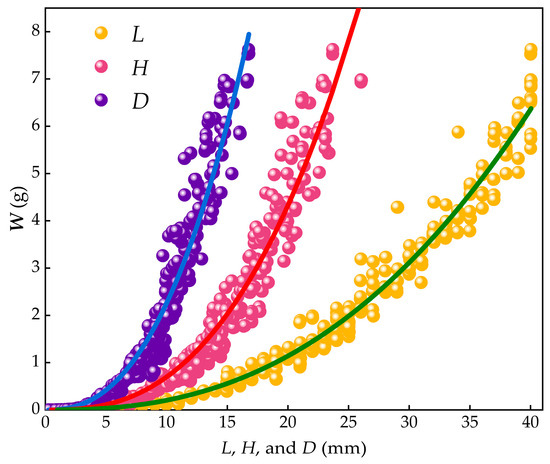
Figure 10.
Relationship between W, L, H, and D.
3.4.2. Growth Dynamics of M. edulis
Monthly growth patterns of M. edulis cultured on aquaculture nets were recorded between May and November 2022 (Table 1). These data were modeled using a logistic growth equation [25], which effectively captured the observed growth trends. The logistic function provided a robust fit to the mussel growth data, enabling quantitative analysis of seasonal biomass accumulation under farmed conditions.

Table 1.
Comparison of M. edulis growth changes as measured and as expected.
While using regression analysis, the connection between shell length and time (t) was established:
The relationship between time and body weight W is:
Time increments were standardized to 15-day intervals for analysis (t = 1 corresponding to 15 May 2022).
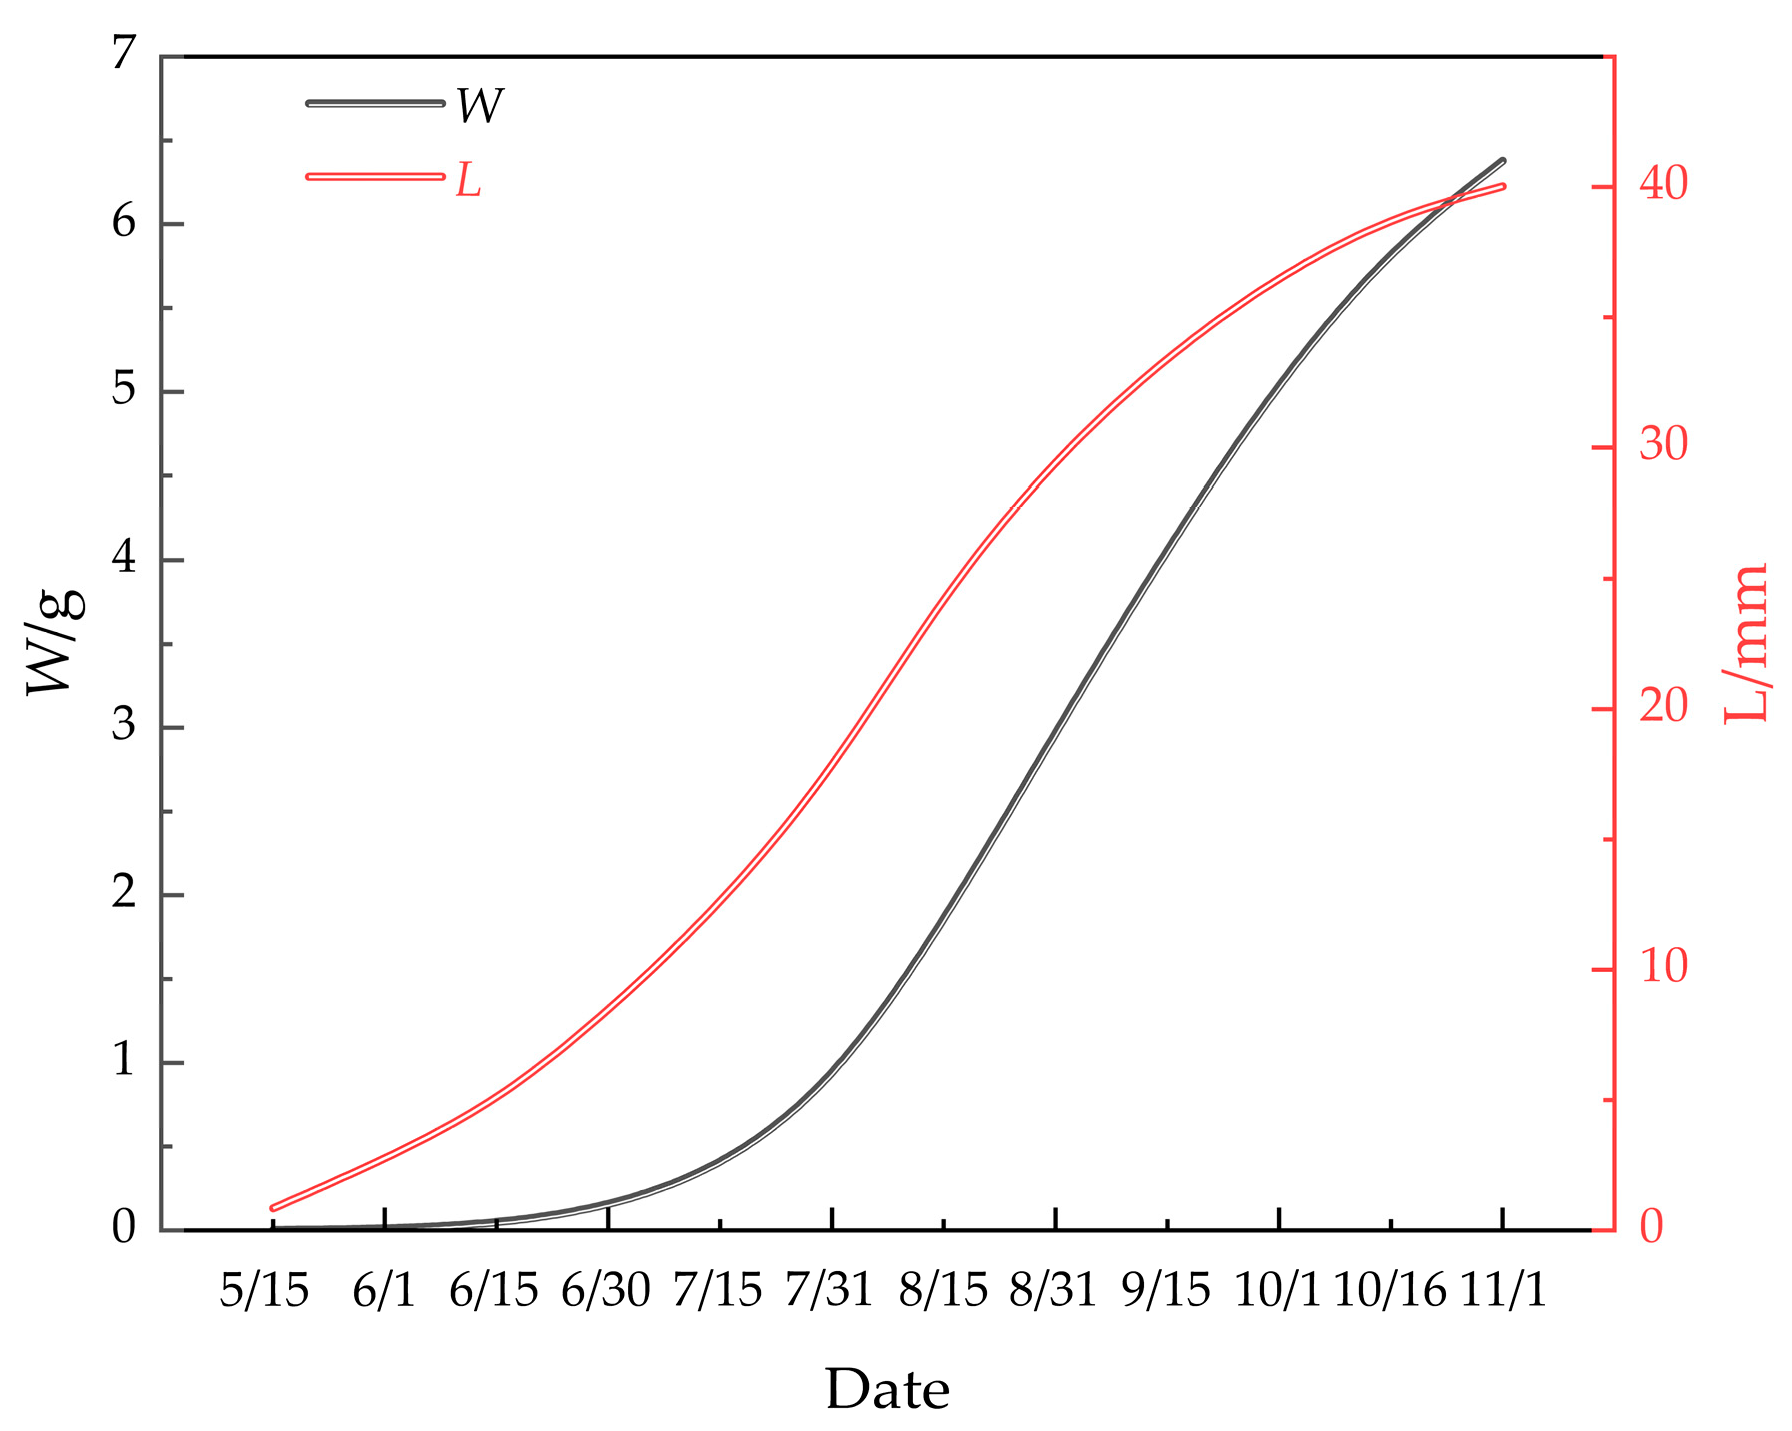
The shell length and body weight of M. edulis were predicted using the respective growth equations, with results shown in Table 1. These equations accurately modeled the growth patterns, with errors remaining within 5% of the measured values [28]. Figure 11 presents the growth curves of shell length and body weight, both of which exhibit an asymmetric ‘S’ shape. The growth of M. edulis was slow from 15 May to 15 June, followed by a rapid growth phase from 15 June to 15 October. Growth then plateaued from 15 October to 15 June, before slowing again. These patterns align with studies by Paz-Andrate [29] and Kittner [30], which suggest that M. edulis thrives in water temperatures between 10 °C and 20 °C. In this study, growth was slow during the cooler spring and autumn months and faster during the warmer spring and summer months in the waters of Wangjia Island.
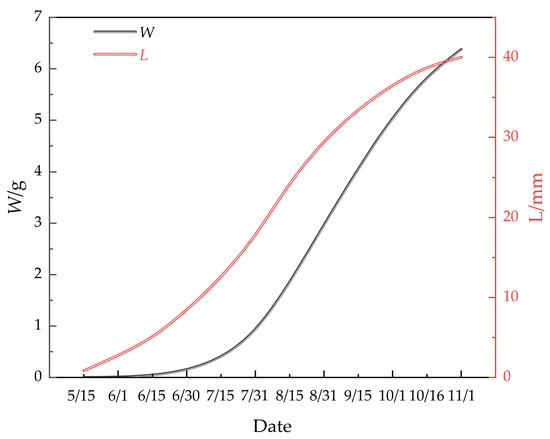
Figure 11.
Growth equations for L and W of M. edulis.
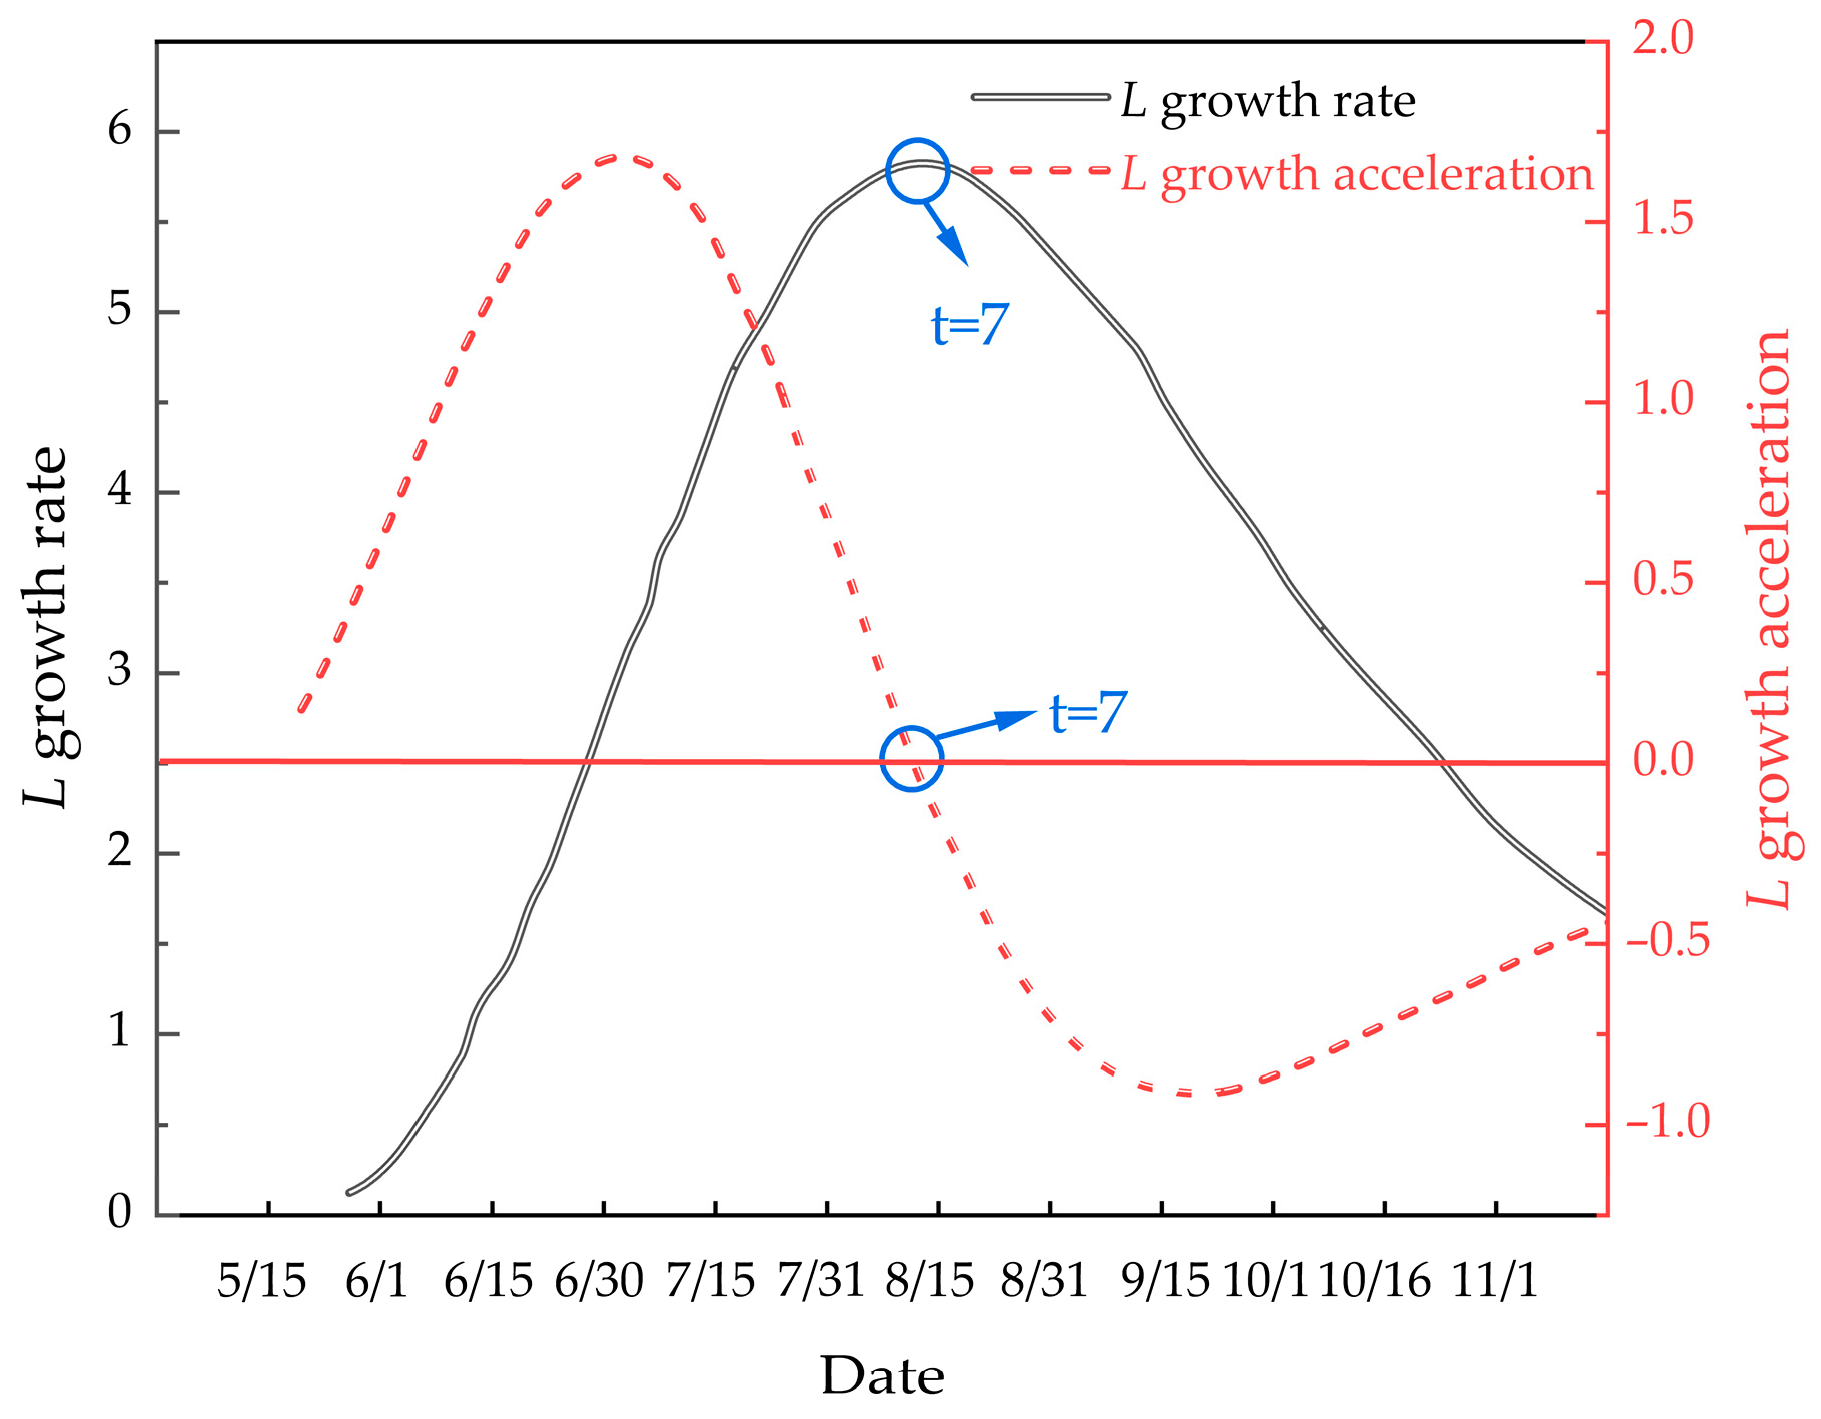
3.4.3. M. edulis Growth Rate, Acceleration, and Inflection Point
Understanding the growth pattern of M. edulis during the attachment process is crucial for optimizing net cleaning operations. The inflection point, where the growth rate peaks, is an important indicator of the organism’s biological physiology and environmental conditions. To analyze growth rate and acceleration, first- and second-order equations were derived for M. edulis shell length and body weight over time. The growth rate equation for shell length is:
The growth acceleration equation for shell length is:
These curves are depicted in Figure 12.

Figure 12.
Illustrates the growth rate and growth acceleration curves of M. edulis shell length.
As shown in Figure 12, the growth rate of M. edulis shell length initially increased before declining, indicating the presence of an inflection point. This inflection point occurred around 15 August, after which shell length growth began to slow. This observation is consistent with the data presented in Table 1.
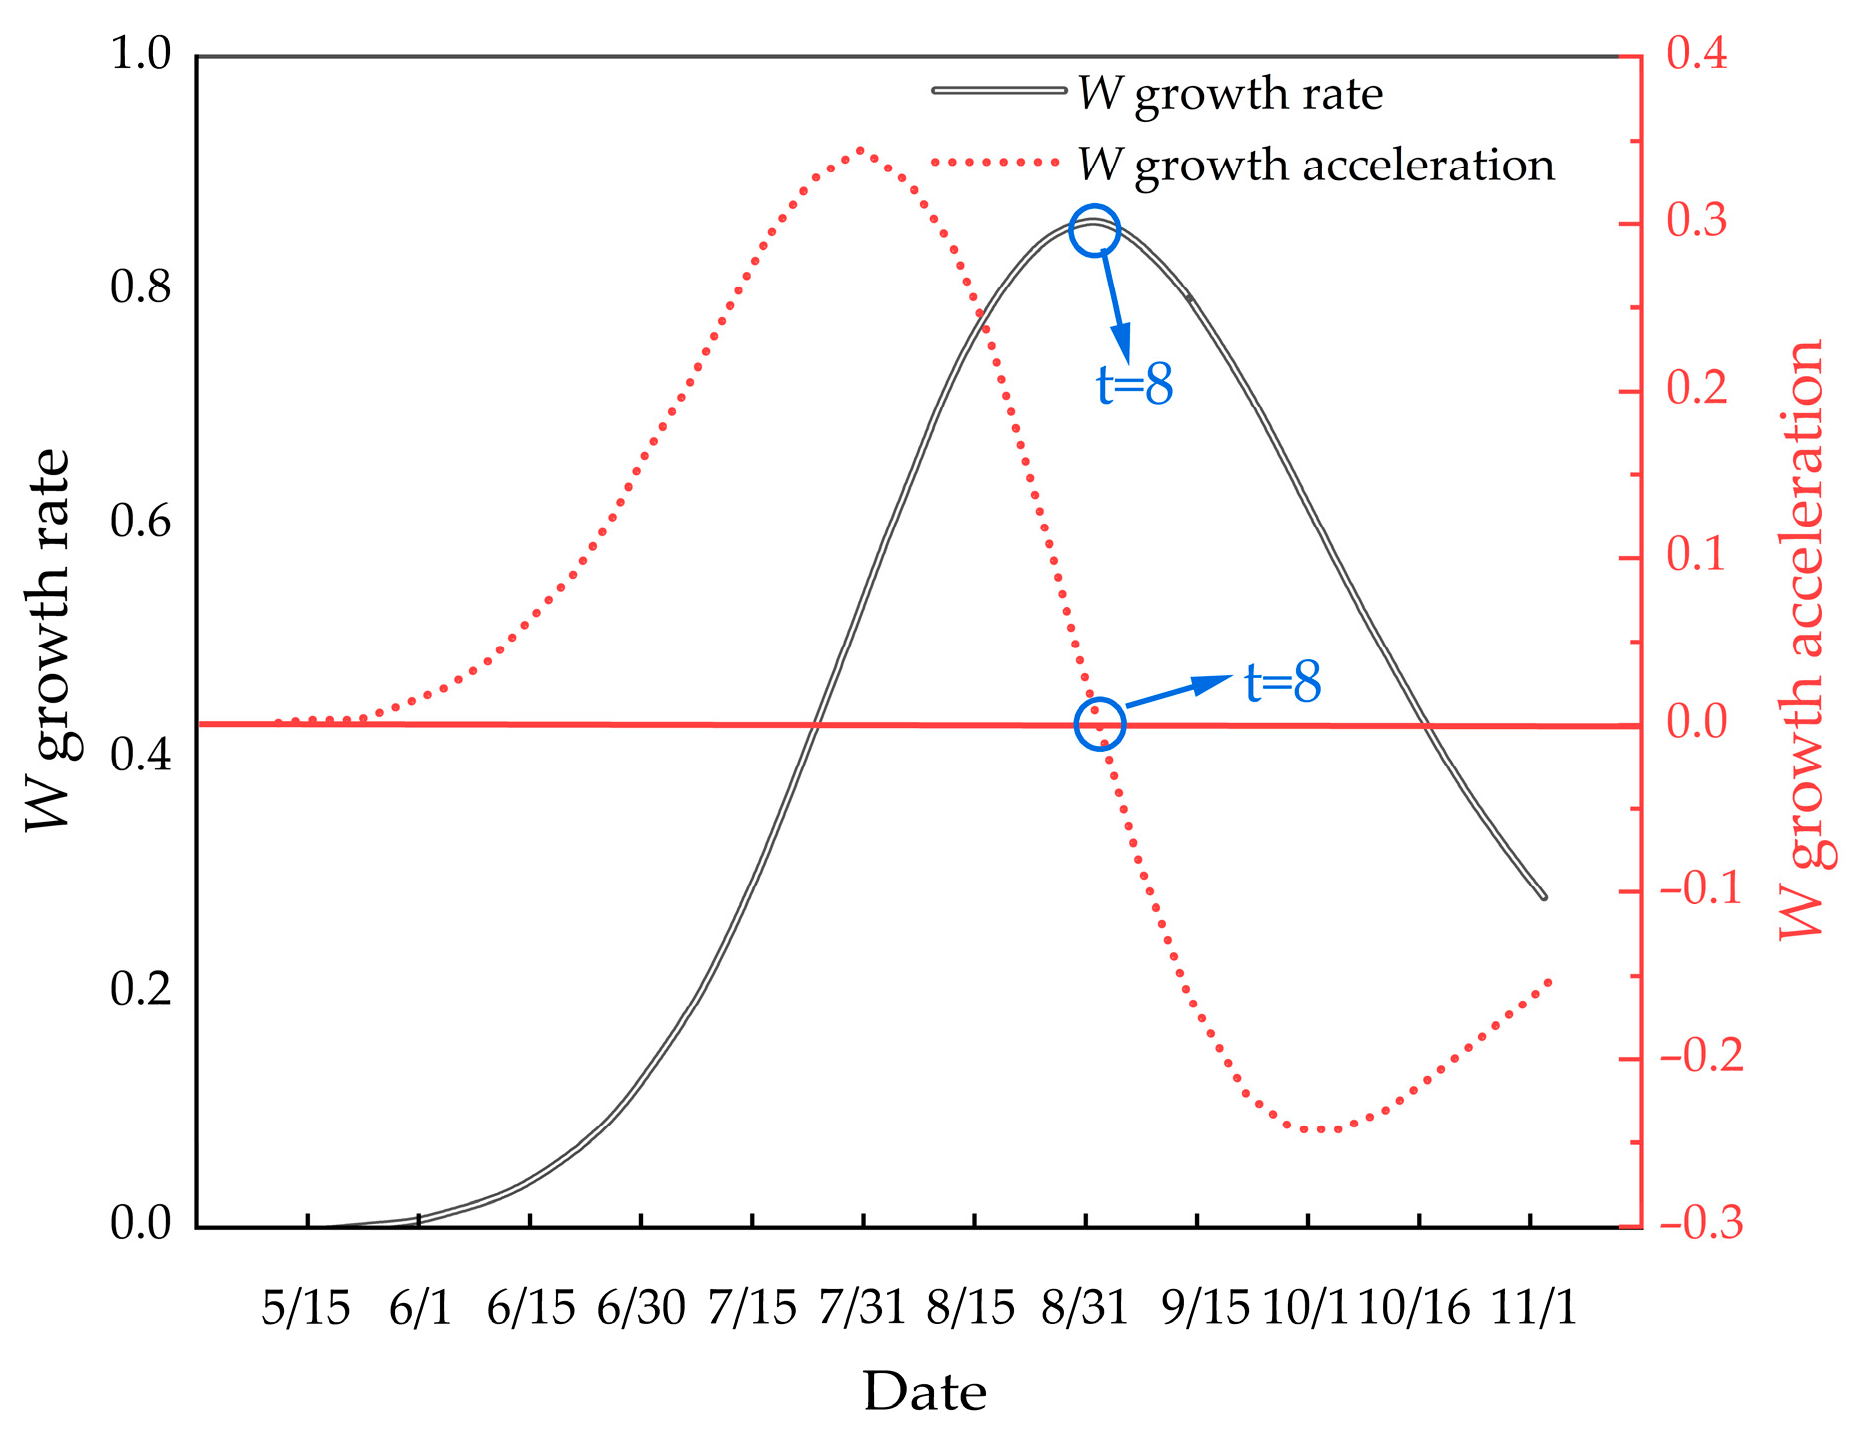
The growth rate equation for M. edulis body weight is given by:
The growth acceleration equation for body weight is:
These growth curves are illustrated in Figure 13.
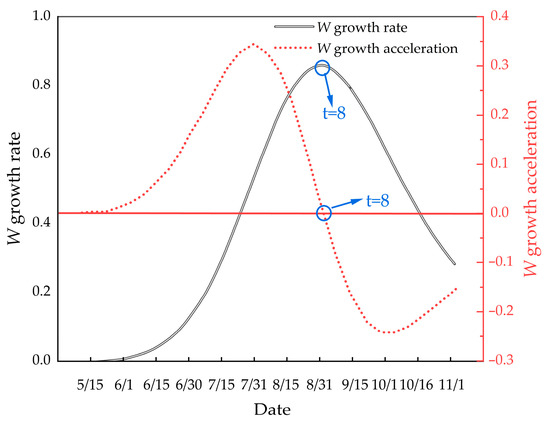
Figure 13.
Illustrates the growth rate and growth acceleration curves of M. edulis body weight.
Figure 13 illustrates that the growth rate of M. edulis body weight similarly exhibited an initial increase followed by a decline, with an inflection point observed. This inflection point occurred around 31 August, approximately half a month later than the inflection point observed for shell length growth.
3.4.4. Mechanical Properties of M. edulis
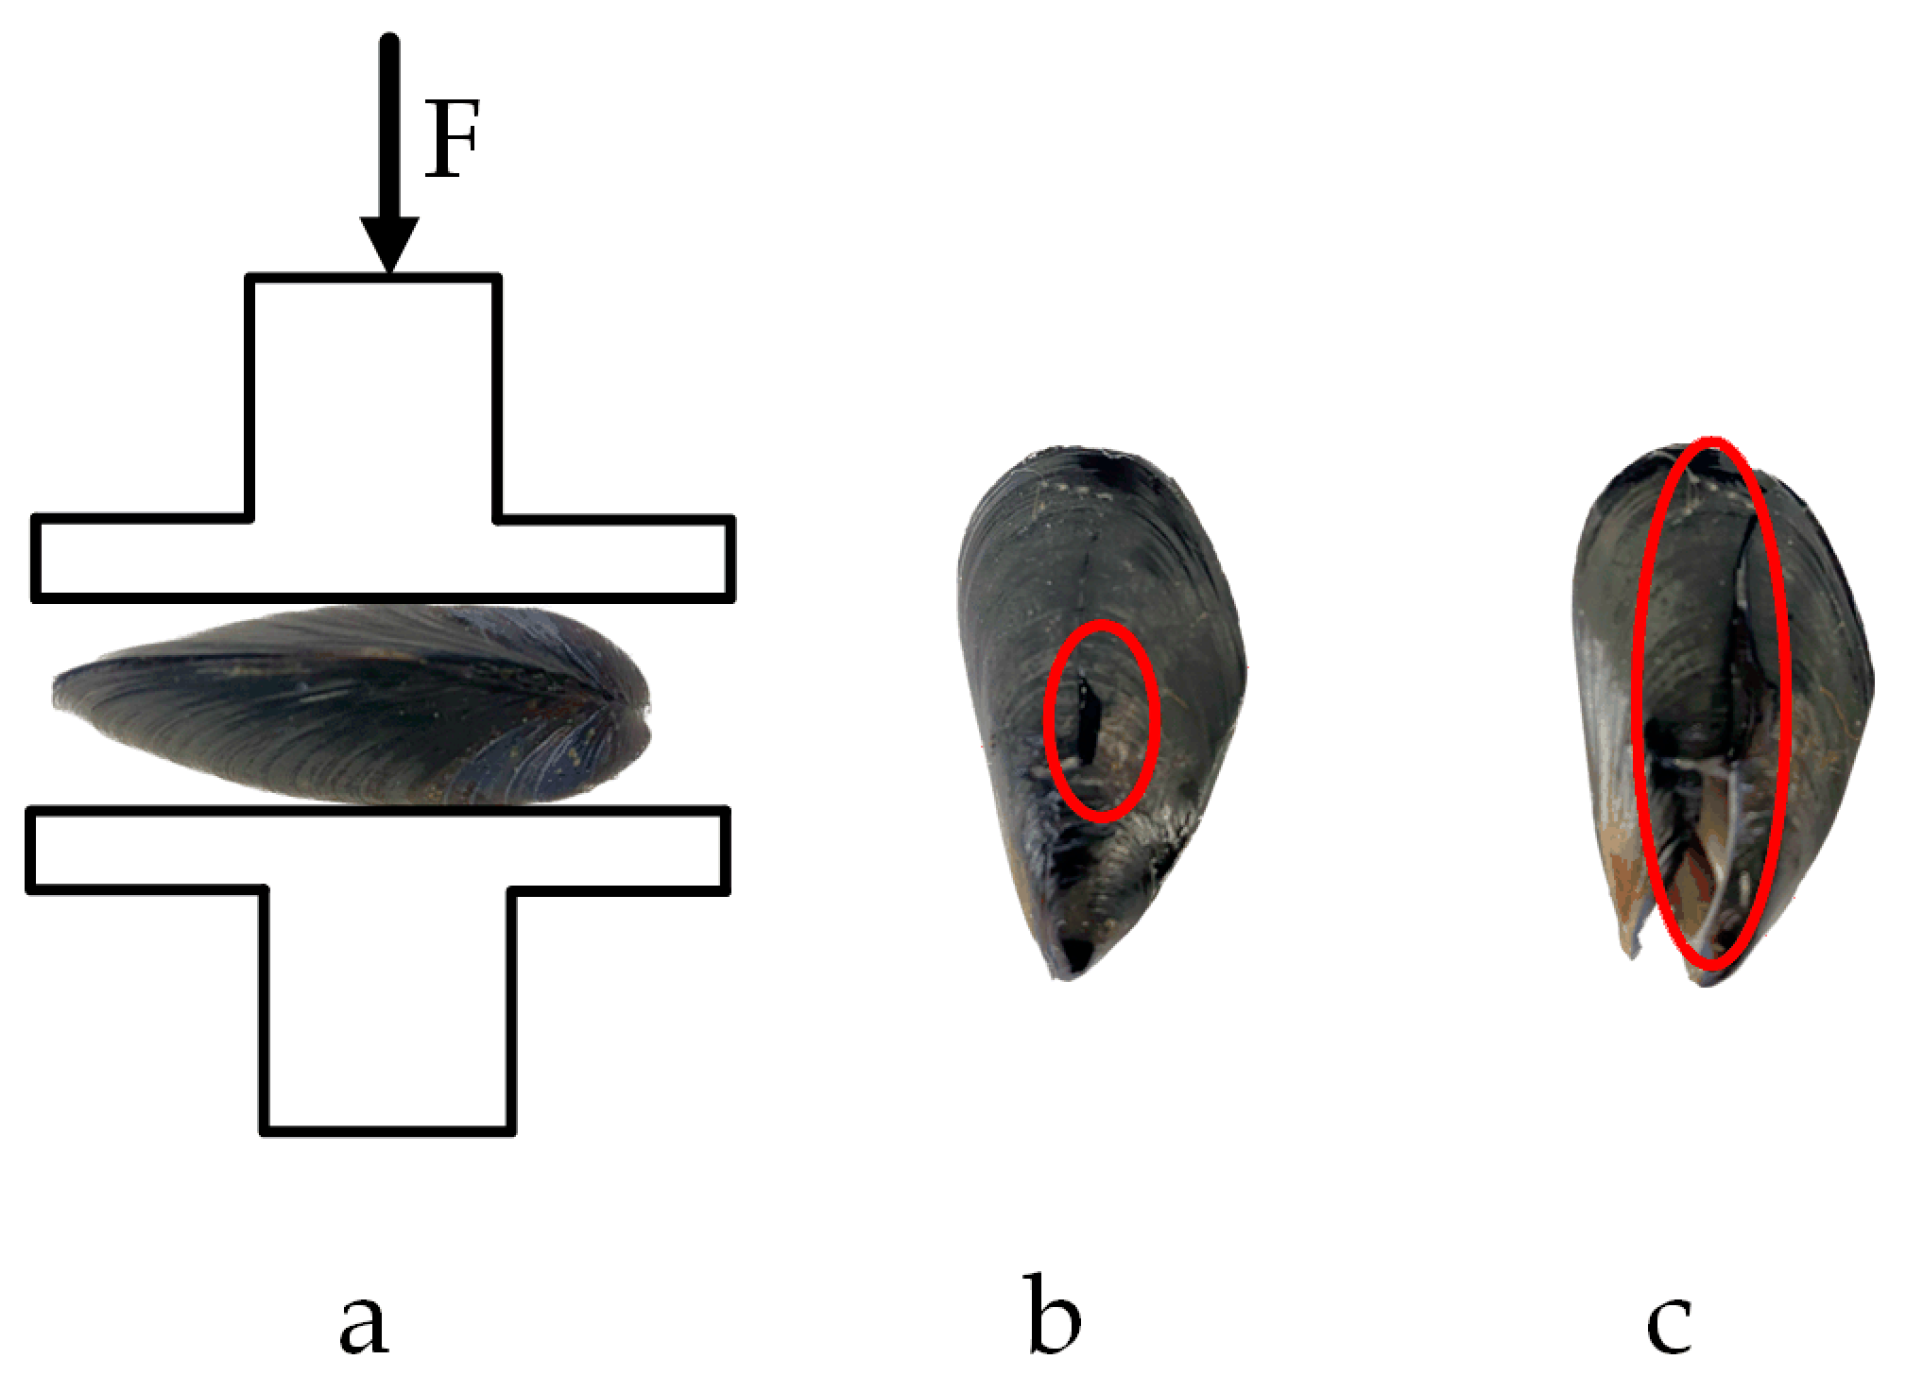
The mechanical properties of M. edulis directly influence the design of net-cleaning equipment. This study examines the triaxial compression force (F) of M. edulis. Since the shell lengths of M. edulis collected from aquaculture nets primarily ranged between 20 mm and 30 mm, specimens with a shell length of 25 mm were selected for axial compression testing. The relationship between compression force and displacement is presented in Figure 14.
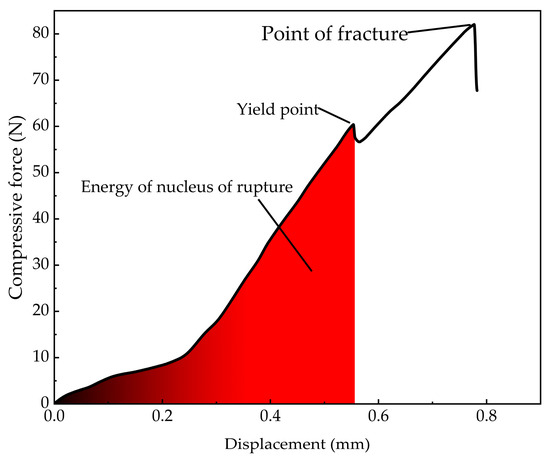
Figure 14.
Curve of Mytilus edulis rectangular F-displacement.
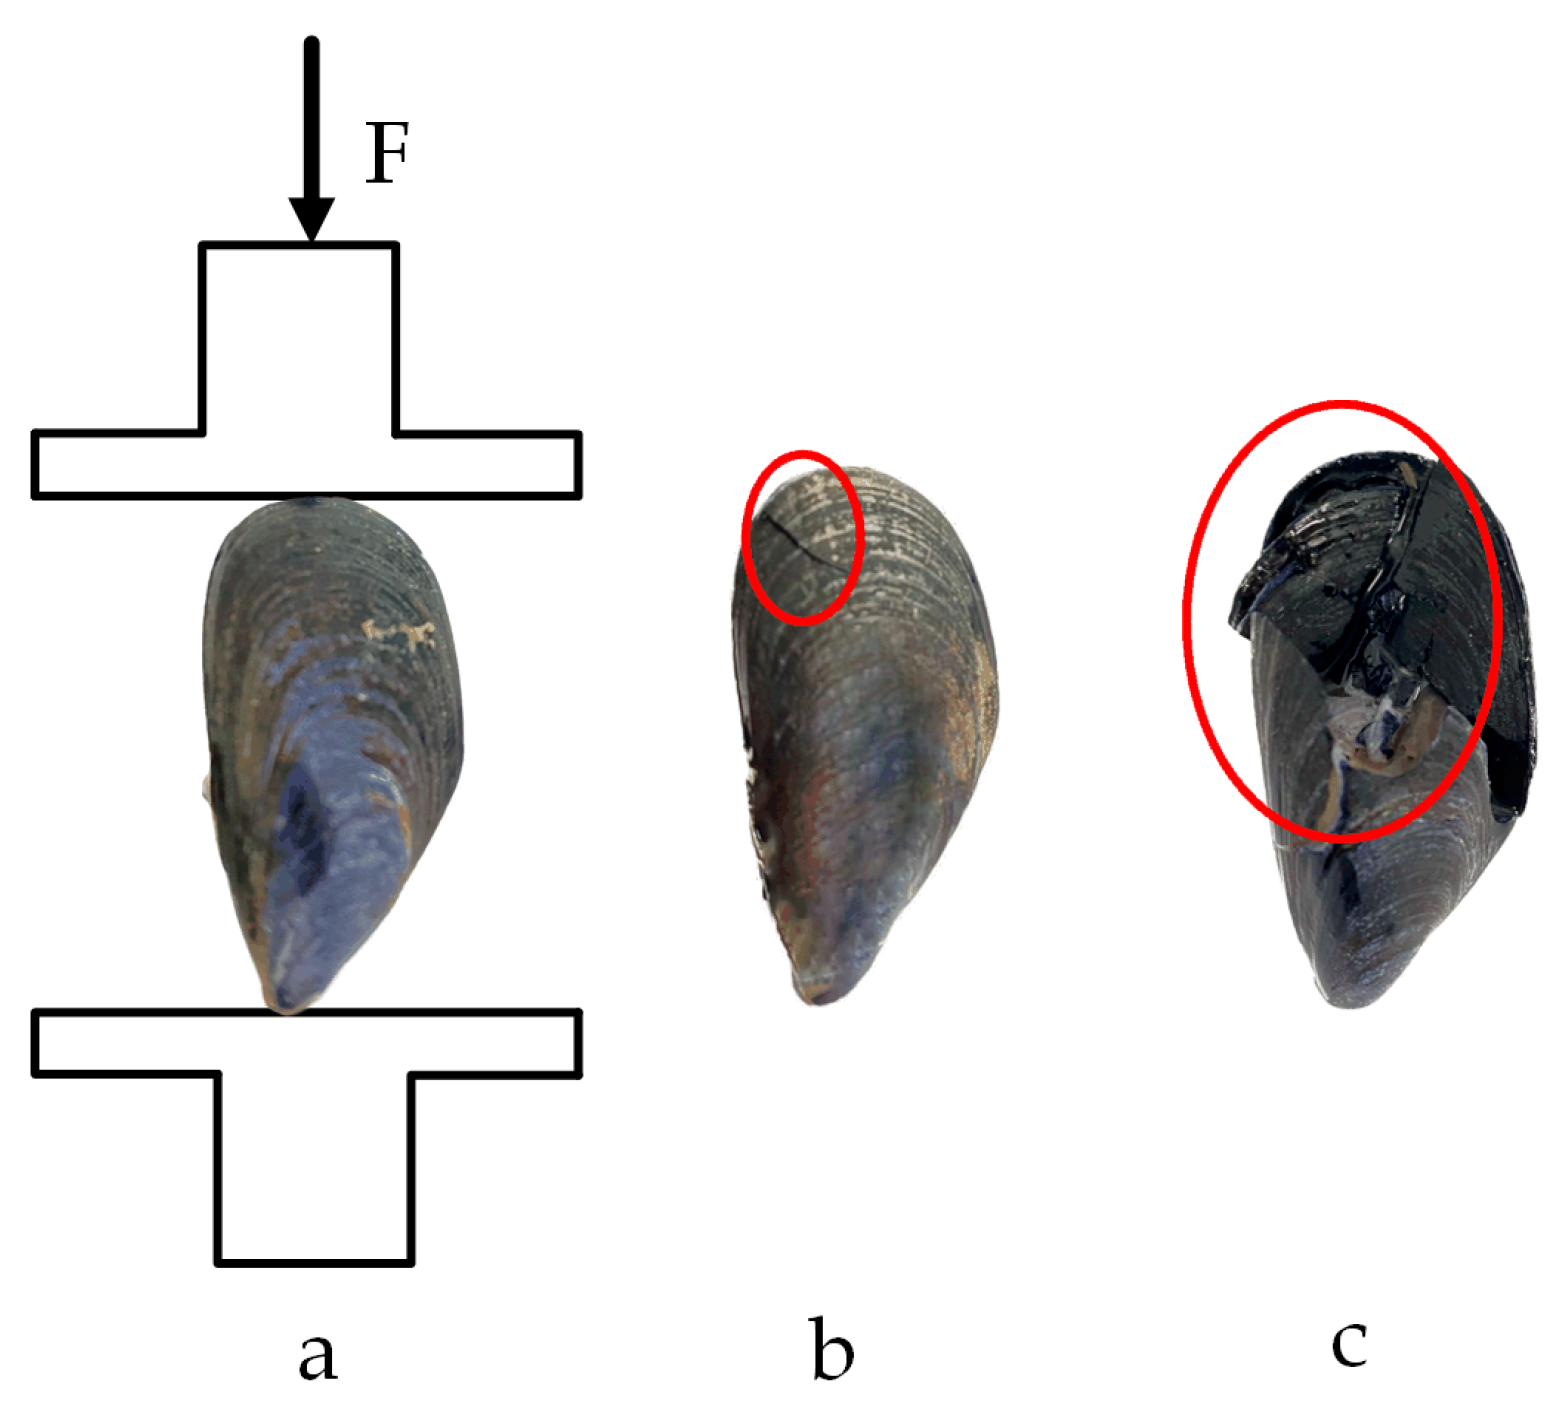
The compression force curve exhibits a distinct yield point. Prior to reaching this point, the compression force increased with displacement. The yield point, corresponding to the first peak in compression force, marked the onset of shell misalignment at the apex of M. edulis, followed by the formation of fine cracks along the shell, as shown in Figure 15b. This yield point represents the threshold for significant damage, and the corresponding compression force is defined as the yield load. The area under the curve up to this point, as indicated by the red region in Figure 14, represents the energy required for initial damage. Beyond the yield point, the force initially decreased slightly before rising again, with displacement continuing to increase. During this phase, cracks propagated and extended, and the compression force increased linearly until multiple fractures led to complete shell failure, as illustrated in Figure 15c.
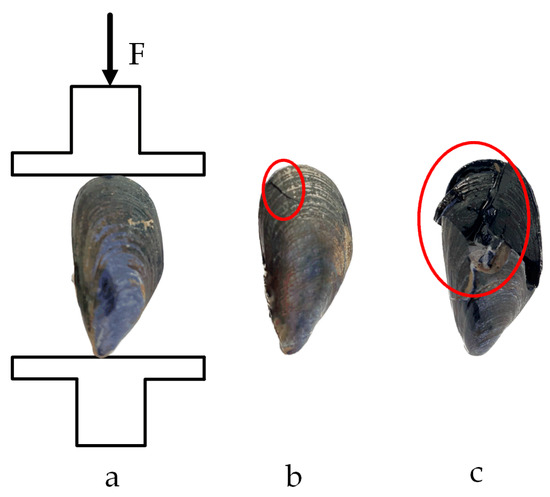
Figure 15.
Compression test in the shell length direction: (a) loading situation; (b) yield point; (c) fracture point.
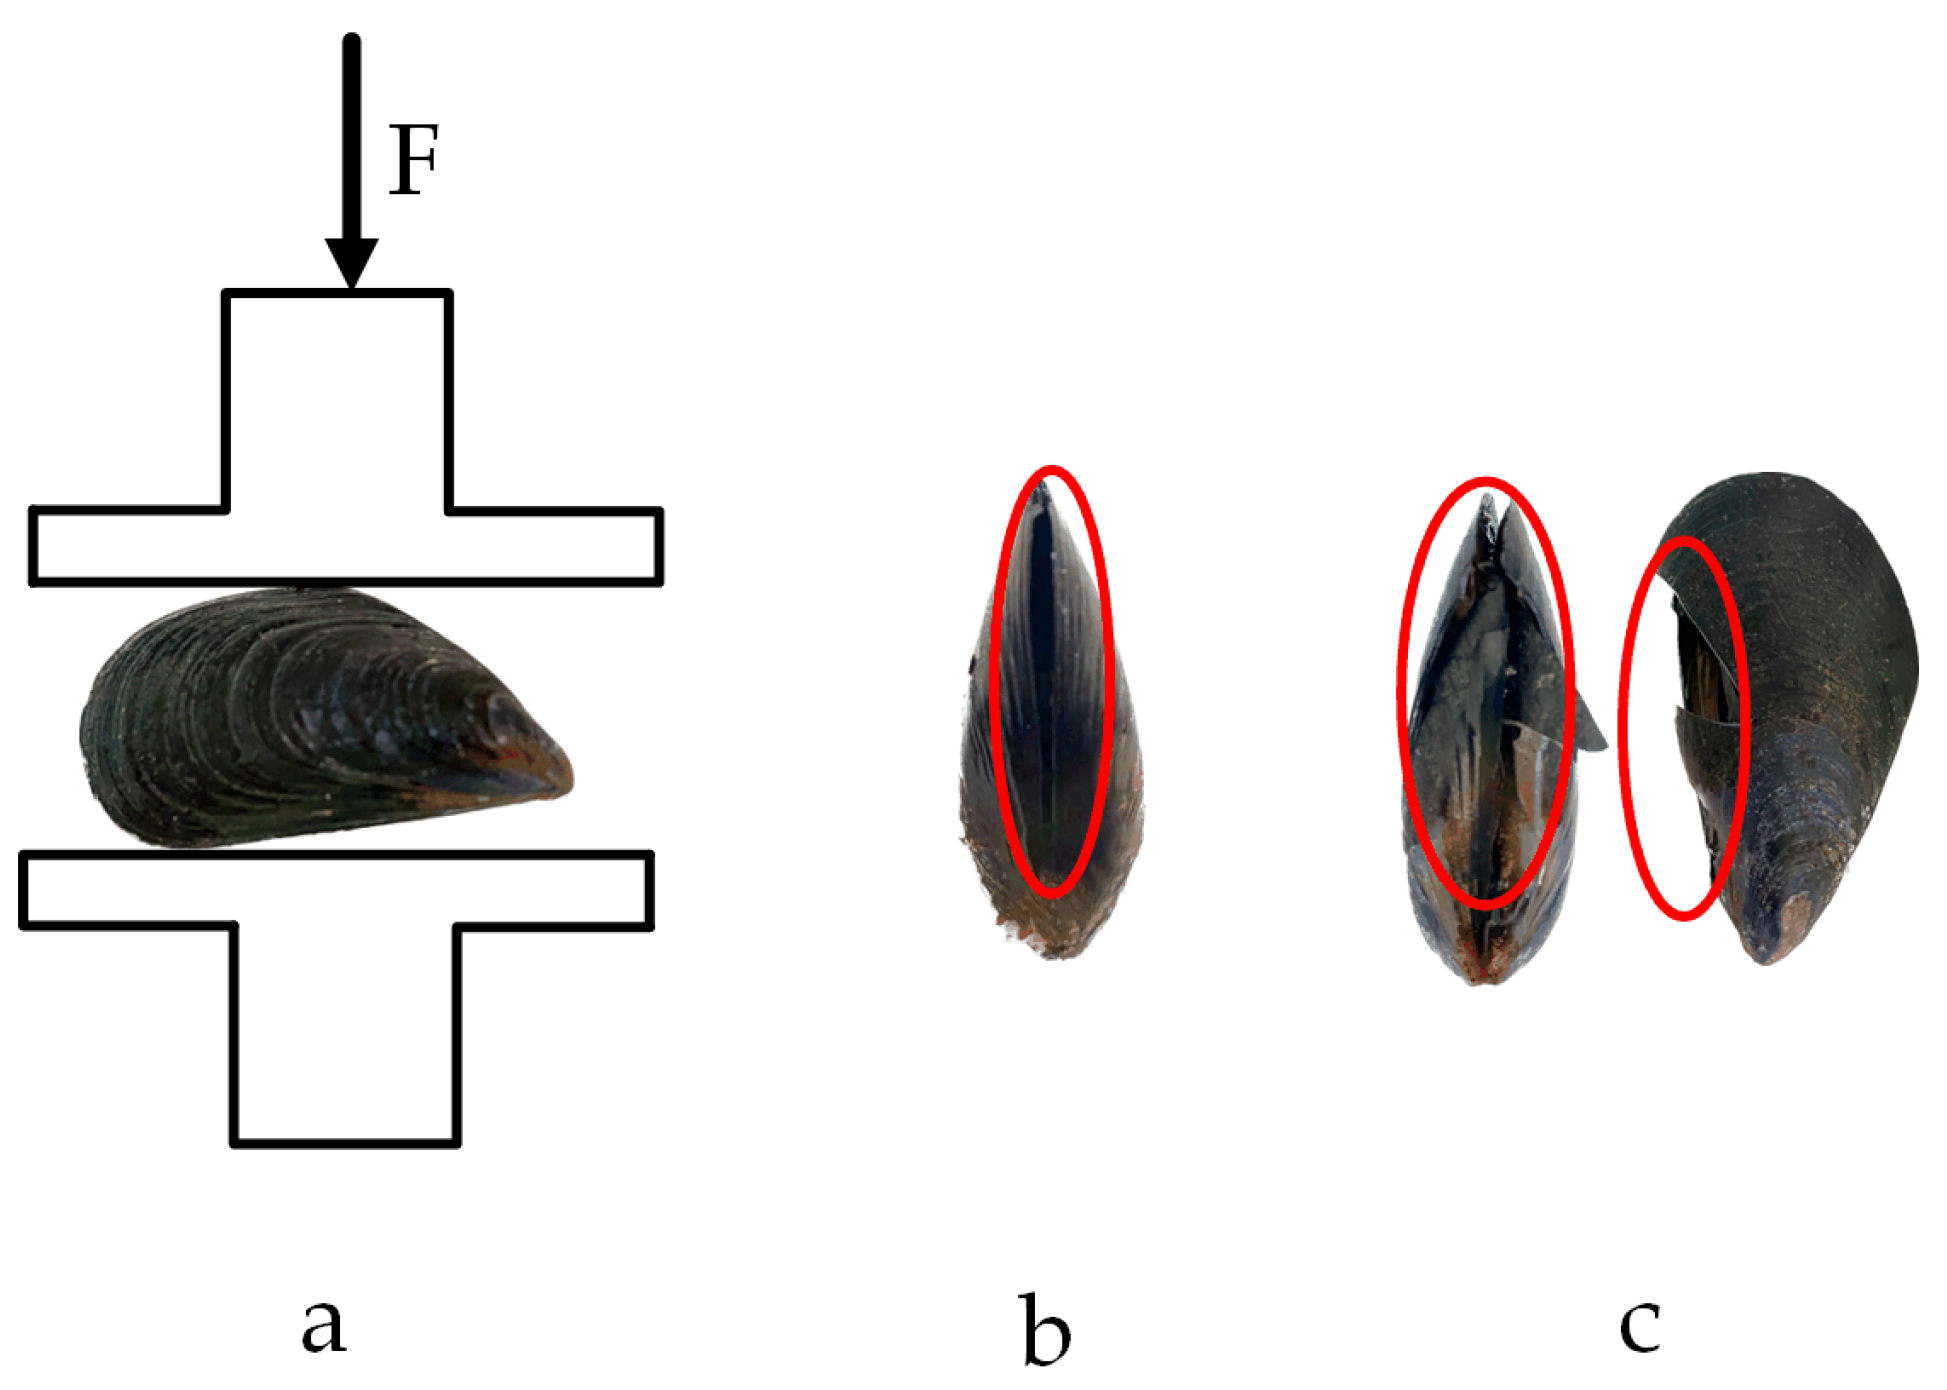
The compression test results of M. edulis in the direction of shell width are shown in Figure 16.
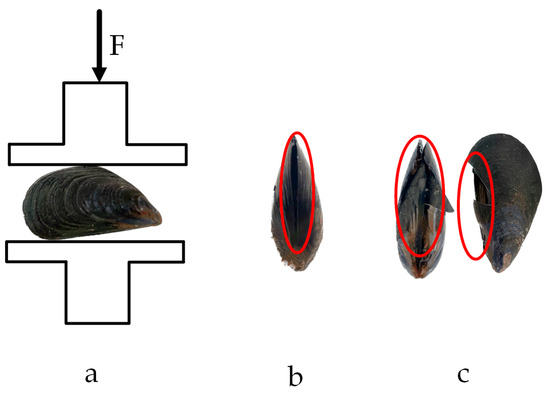
Figure 16.
Compression test in the shell width direction: (a) loading situation; (b) yield point; (c) fracture point.
When compression was applied along the shell width direction, the crack formed a concave shape, which, when viewed on the shell length surface, resembled a diagonal tangent line. The crack initiated at the contact point between the protruding part of the belly of M. edulis and the base of the stripping tester. Stress concentration at these contact points caused a localized increase in stress, leading to the formation of microcracks. These microcracks, concave along the axial direction, eventually developed into a crack that appeared as a diagonal tangent line on the ventral surface, as shown in Figure 16c.
The compression test results of M. edulis in the direction of shell thickness are shown in Figure 17.

Figure 17.
Compression test in the shell thickness direction: (a) loading situation; (b) yield point; (c) fracture point.
When compression was applied along the shell thickness direction, the crack formed an approximate straight line connecting the tip crown to the tail. The protruding point at the center of the backside was the first to make contact with the peel tester probe and was less resistant to compression when oriented upwards. Cracking began at this protruding point and, as the load increased, the crack extended toward both the tip crown and the tail, eventually forming a straight line, as shown in Figure 17c.
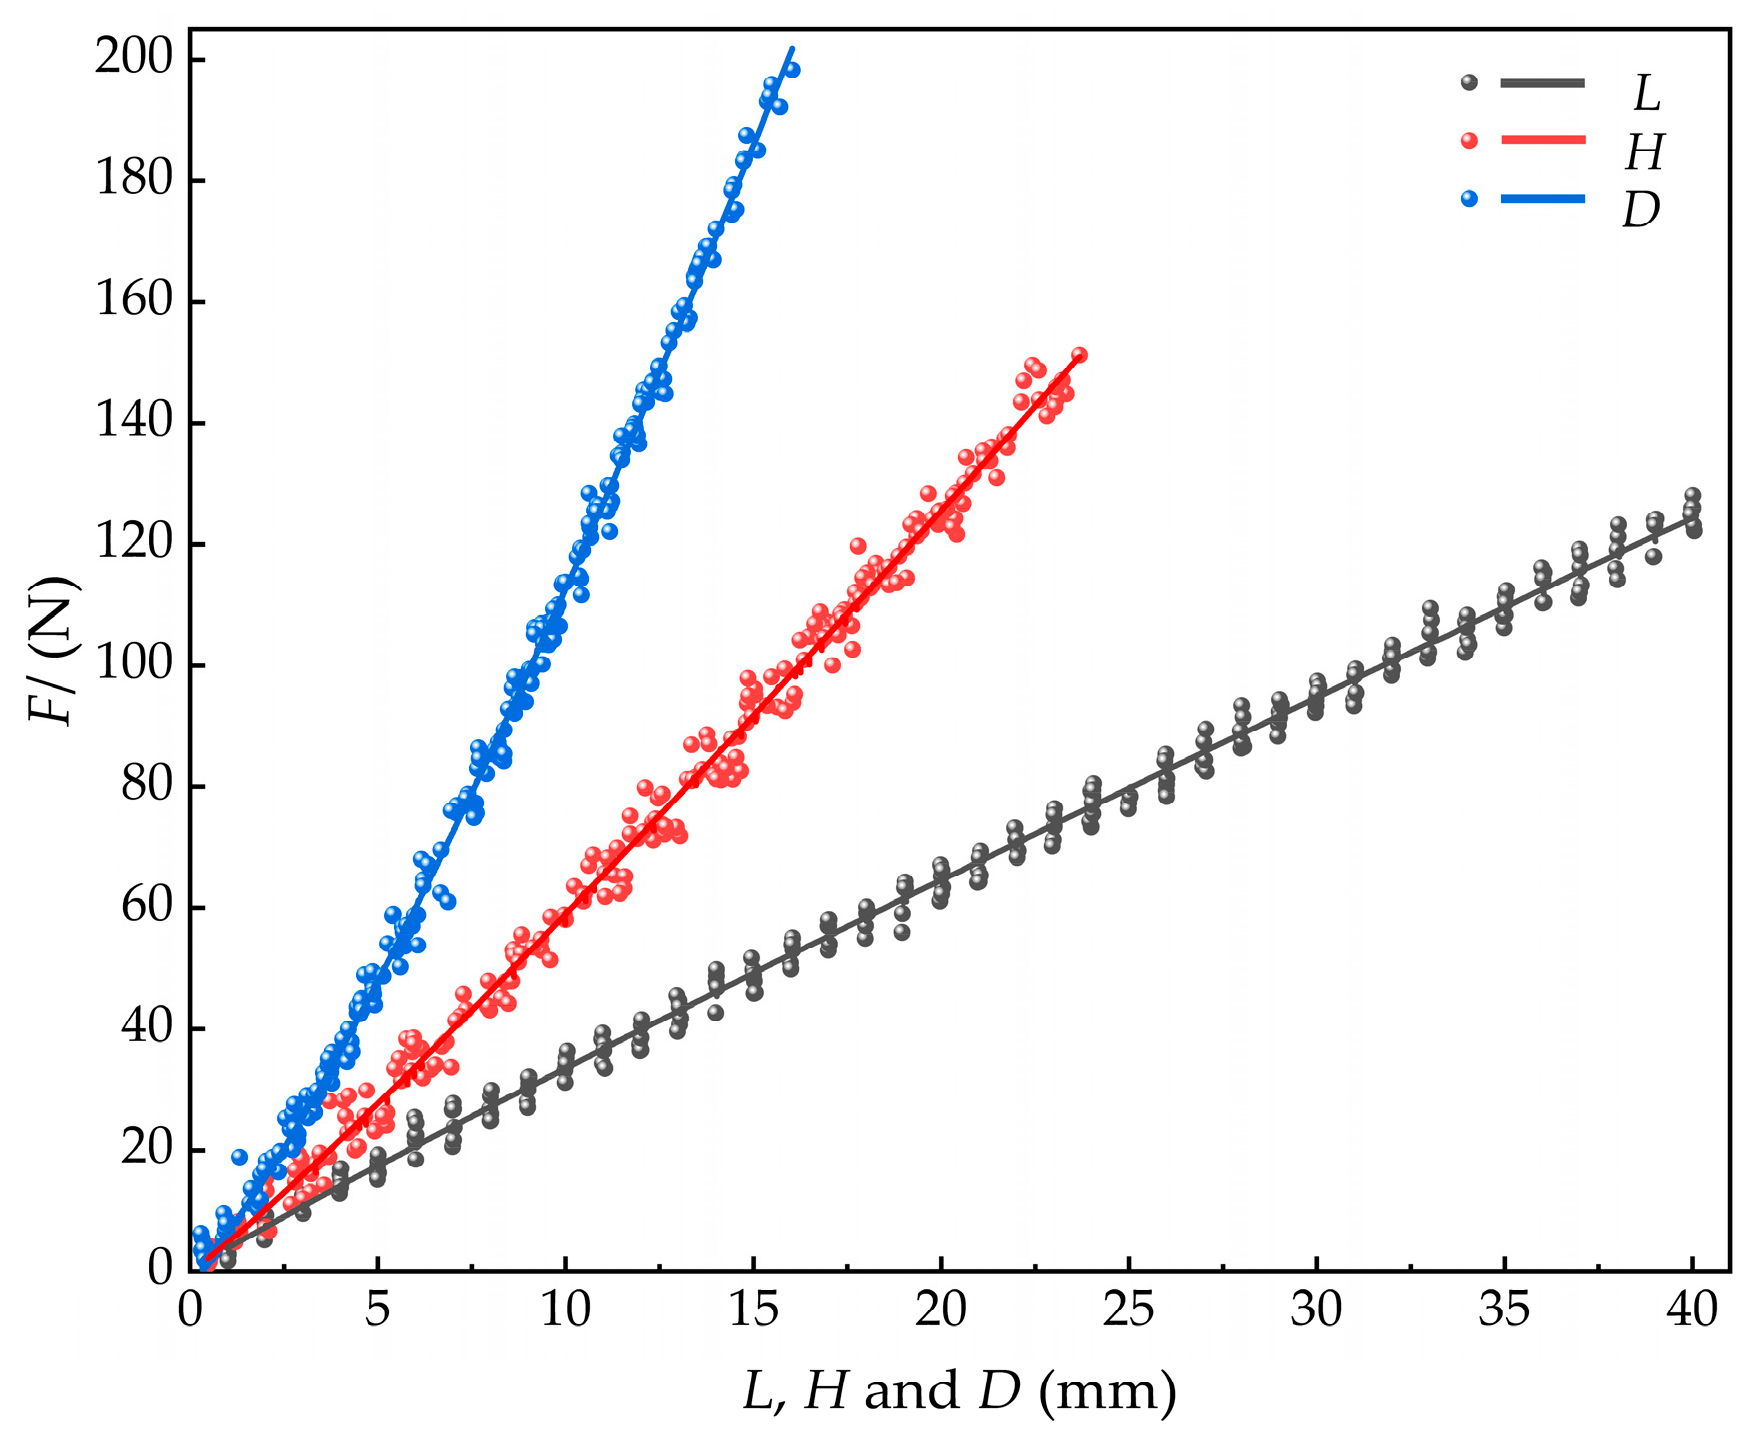
Samples of M. edulis were collected in 82 different sizes, with shell length ranging from 1 mm to 40 mm, shell width from 1 mm to 26 mm, and shell thickness from 1 mm to 16 mm. For each size category, ten samples were collected for compression force. Regression analysis was used to establish the relationships between shell length, width, thickness, and compression force based on the measured compression values. The equation for the relationship between shell length and compression force was:
with a coefficient of a = 3.8084 ± 0.0732 and a power index of b = 0.950 ± 0.006.
For the relationship between shell width and compression force, the equation was:
with a = 4.7987 ± 0.1200 and b = 1.0899 ± 0.008.
The relationship between shell thickness and compression force was given by:
with a = 6.5677 ± 0.0987 and b = 1.2346 ± 0.006.
The fitted curves for these relationships are shown in Figure 18.

Figure 18.
Relationships between compression force and shell dimensions (length, width, thickness) in M. edulis.
The maximum compression force on M. edulis occurred in the shell thickness direction, followed by the shell width direction, and with the smallest in the shell length direction, as shown in Figure 18. This difference can be attributed to the following factors. In the shell thickness direction, compression concentrates the internal tissues near the shell thickness prominence, which increases local compressive resistance. In the shell width direction, the compressive load is distributed across the apical crown and tail, while in the shell length direction, the load is transferred only between the apical crown and the tail, resulting in the smallest force. The maximum force in the shell thickness direction reached 195.91 N. Additionally, the growth points at the tip crown and tail are more susceptible to stress concentration.
4. Discussion
4.1. Fouling Organisms in Wangjia Island Mariculture Zone: Species Composition and Colonization Dynamics
A total of 21 fouling organisms were identified in the net-pen culture waters of Wangjia Island. The dominant species, based on biomass, were M. edulis, U. lactuca, E. clathrata, S. latiuscula, C. scaura, E. capillare, and C. intestinalis.
De Sá et al. [9] identified algae as the dominant fouling species in their study on mussel seedling culture in southeast Brazil. Similarly, Levenets et al. [31] found 16 species of algae attached to scallop farms across 14 culture zones in Peter the Great Bay. In contrast, the waters around Wangjia Island host fewer algal species but a greater diversity of fouling organisms. These differences are influenced by regional environmental conditions and the feeding habits of farmed species [32].
Studies by Chen et al. [33] in Haizhou Bay and Liu et al. [16] in the South China Sea both identified M. edulis as the predominant fouling organism, aligning with observations from Wangjia Island. As an invasive species, M. edulis presents significant challenges for aquaculture due to its strong attachment, high biomass, extended colonization period, and difficulty in removal. Its proliferation negatively impacts cage farming operations in China.
In the Wangjia Island Sea area, the coverage rates of fouling organisms on net cages vary across time, water depth, and net materials. The fouling coverage on nylon netting was significantly higher than on polyethylene (PE) netting. This difference may account for the prevalent use of PE netting in China’s cage aquaculture industry [34]. Over time, the coverage rate initially increases before gradually declining, peaking between June and October, with values ranging from 26.33% to 98.45%. Coverage rates differ by water depth, following the pattern −0.5 m > −2 m > −3.5 m > −5 m. At −0.5 m, the coverage rate ranges from 75.14% to 98.45%, approximately 20.64% higher than at −5 m.
During summer, the coverage rate increases significantly from 50.51% to 90.65%, before slightly decreasing in autumn to 75.36%. This trend aligns with Antoniadou et al. [35], who observed a rise in macroalgae attachment on scallops and oysters in the northern Aegean Sea during summer. The warmer seawater temperatures promote the rapid growth and reproduction of fouling organisms, establishing a direct link between temperature and attachment rates.
Huang et al. [36] reported the highest attachment rates (70–100%) between April and November in the South Yellow Sea. However, in the North Yellow Sea, where Wangjia Island is located, the peak attachment period occurs two months later and ends one month later, with lower coverage rates. The lower coverage rates in the North Yellow Sea compared to the South Yellow Sea are attributed to latitude-driven variations in environmental factors, such as temperature and light availability, resulting in a shorter attachment growth period and lower biomass. These findings provide a theoretical basis for developing efficient cage cleaning equipment and methods.
4.2. M. edulis Biological Properties
A significant linear correlation was observed between the shell length, width, and thickness of M. edulis. The relationship between body weight and shell dimensions is commonly described using the Taylor formula [37,38], which was applied in this study to fit the correlation between mussel body weight and shell length, width, and thickness.
According to Ricker [39], the parameter b in the power function model can indicate the type of growth. When b = 3, the organism exhibits isometric growth, where body weight is proportional to the cube of its shell dimensions. If b ≠ 3, the organism displays allometric growth. The power indices calculated for body weight in relation to shell length, width, and thickness were 2.9937, 3.075, and 2.9875, respectively. These values are close to 3, suggesting that M. edulis exhibits approximately uniform, isometric growth across its shell dimensions.
The growth pattern of M. edulis was modeled using the Logistic function [25], which provides high fitting accuracy and strong alignment with key biological parameters, such as the growth inflection point, as well as the start and end points of rapid growth phases. The results indicate that the mussel growth season spans from mid-June to mid-September, with the inflection point for body weight growth occurring in late August.
Previous studies by Kittner et al. [30] demonstrated a linear relationship between water temperature (4.6–20 °C) and the filtration rate of mussels, with higher temperatures accelerating filtration. Similarly, Sensurat-Genc et al. [40] reported that M. edulis in the Mediterranean achieve optimal growth at temperatures between 10 and 20 °C. These findings support the present study’s observation that mussels exhibit faster growth during the warmer spring and summer months compared to the cooler spring and autumn periods.
Biologically, the inflection point is associated with sexual maturity or the onset of aging [41]. In this study, the shell length and body weight of M. edulis showed accelerated growth before mid-August and late August, respectively, followed by a gradual decline. This suggests that mussels reach sexual maturity around mid-August. To mitigate mussel fouling on net cages, it is recommended to increase the cleaning frequency of aquaculture cages from mid-June to late September, coinciding with the mussels’ peak growth period.
4.3. Engineering Applications of the Effects of M. edulis Size and Loading Direction on Compression Force
This study reveals that the load on M. edulis increases with displacement, reaching a yield point where the load initially decreases before rising again as deformation continues. The rupture point, where the load drops sharply with further deformation, occurs at a maximum compression force of 195.91 N. MaYH et al. [42] studied the microstructure and compression force of the clam shell and found it to be brittle, with a critical crushing force of 120 N. The difference in compression forces between M. edulis and clams may be due to variations in species and environmental conditions [43]. While clams feed on benthic organisms along the shore, M. edulis are typically attached to various substrates, which could lead to differences in the composition of their shell materials.
The compression force test conducted on M. edulis in this study showed that the greatest force was applied in the direction of shell thickness, followed by shell width, with the least force in the direction of shell length. A similar pattern was observed by Mu et al. [44] in their study of the biomechanical properties of Ruditapes philippinarum (A. Adams & Reeve, 1850). When the shell of M. edulis is compressed in the thickness direction, it has a large force area, making it more resistant to breakage under the same load.
The force experienced by M. edulis is influenced by both the compression direction and its morphological structure, as variations in hardness and structure occur along the shell length, width, and thickness axes. When designing mesh cleaning equipment, it is essential to account for these directional differences in mechanical properties, alongside the natural growth pattern of M. edulis. Our observations indicate that hydrodynamic forces acting on aquaculture nets promote dense colonization by M. edulis, with peak fouling occurring between July and September. To optimize biofouling mitigation, we recommend two key strategies: (1) designing cleaning equipment based on the maximum crushing force (195.91 N) required along the shell thickness axis of M. edulis, and (2) implementing increased cleaning frequency during this peak fouling period. This approach accounts for both the mechanical properties of the dominant fouling organism and its seasonal population dynamics. The design should prioritize the maximum mechanical properties to improve cleaning efficiency.
5. Conclusions
This study analyzed biofouling in Takifugu rubripes aquaculture cages at Wangjia Island, identifying 21 fouling species, with M. edulis, U. lactuca, E. clathrata, S. latiuscula, C. scaura, E. capillare, and C. intestinalis dominating biomass. Net coverage varied seasonally and with depth, peaking at 75.14–98.65% at −0.5 m from June to October but declining by 20.64% at −5 m. Nylon nets showed 8.2% higher fouling (29.41–98.65%) than polyethylene (PE) nets (26.33–90.45%), likely due to surface texture differences. M. edulis growth exhibited linear correlations between shell dimensions (length > width > thickness) and mass. Shell length growth followed , while the growth rate of weight over time was described by . Mid-August and the end of August, corresponding to t = 6 and t = 7, marked the turning points in both growth periods.
During compression testing, the force-displacement curve of M. edulis showed a distinct yield point. When compressed along the shell length, cracks propagated from the apex toward the posterior. In the shell width direction, a concave crack formed along the ventral side, while in the shell thickness direction, the crack appeared as a straight line connecting the apex to the posterior. The compression force increased in the order of shell length, width, and thickness, with the maximum recorded force of 195.91 N. These results emphasize seasonal and depth-driven fouling patterns, with nylon nets accumulating more biomass. Mechanical data highlight the need for cleaning devices to withstand >195 N forces when targeting M. edulis. Practical applications include prioritizing net cleaning from June to October and designing equipment aligned with mussel biomechanics.
Author Contributions
Conceptualization, H.Z. and S.H.; methodology, H.Z.; software, S.H.; validation, Q.X., Z.F., L.B. and K.L.; formal analysis, S.H.; investigation, S.H., Q.X., Z.F., L.B. and K.L.; resources, H.Z.; data curation, S.H.; writing—original draft preparation, S.H.; writing—review and editing, H.Z. and G.Z.; visualization, H.Z. and G.Z.; supervision, H.Z.; project administration, H.Z. and T.Q.; funding acquisition, H.Z. and T.Q. All authors have read and agreed to the published version of the manuscript.
Funding
This research was supported by the National Key Research and Development Program of China (2021YFB3901304); Science and Technology Tackling Program of Liaoning Province (2024JH2/102600069) and Key Scientific Research Project of Anhui Vocational College of Defense Technology (2024GFZR005).
Data Availability Statement
Data are available upon reasonable request from the corresponding author (zhanghanbing@dlou.edu.cn).
Conflicts of Interest
The authors declare no conflicts of interest.
References
- 2023 National Fishery Economic Statistics Bulletin. Available online: https://www.yyj.moa.gov.cn/gzdt/202407/t20240705_6458486.htm (accessed on 15 July 2024). (In Chinese)
- 2022 National Fishery Science and Technology Statistics Bulletin. Available online: https://www.yyj.moa.gov.cn/kjzl/202306/t20230628_6431131.htm (accessed on 15 July 2024). (In Chinese)
- Bannister, J.; Sievers, M.; Bush, F.; Bloecher, N. Biofouling in marine aquaculture: A review of recent research and developments. Biofouling 2019, 35, 631–648. [Google Scholar] [CrossRef] [PubMed]
- Madin, J.; Chong, V.C.; Hartstein, N.D. Effects of water flow velocity and fish culture on net biofouling in fish cages. Aquac. Res. 2010, 41, 602–617. [Google Scholar] [CrossRef]
- Cabre, L.M.; Hosegood, P.; Attrill, M.J. Offshore longline mussel farms: A review of oceanographic and ecological interactions to inform future research needs, policy and management. Rev. Aquac. 2021, 13, 1864–1887. [Google Scholar] [CrossRef]
- Zhang, J.; Sun, M.; Wan, R. Research progress of biofouling prevention techniques for marine fishery equipment. J. Fish. Sci. China 2022, 28, 1489–1503. [Google Scholar]
- Cornejo, P.; Guerrero, N.M.; Montes, R.M.; Quinones, R.A.; Sepulveda, H.H. Hydrodynamic effect of biofouling in fish cage aquaculture netting. Aquaculture 2020, 526, 735367. [Google Scholar] [CrossRef]
- Atalah, J.; Fletcher, L.M.; Davidson, I.C. Artificial habitat and biofouling species distributions in an aquaculture seascape. Aquac. Environ. Interact. 2020, 12, 495–509. [Google Scholar] [CrossRef]
- De Sá, F.S.; Nalesso, R.C.; Paresgue, K. Fouling organisms on Perna perna mussels: Is it worth removing them. Braz. J. Oceanogr. 2007, 55, 155–161. [Google Scholar]
- Carraro, J.L.; Rupp, G.S.; Mothes, B.; Lerner, C.; Wurdig, N.L. Characterization of the fouling community of macroinvertebrates on the scallop Nodipecten nodosus (Mollusca, Pectinidae) farmed in Santa Catarina, Brazil. Cienc. Mar. 2012, 38, 577–588. [Google Scholar] [CrossRef]
- Bloecher, N.; Olsen, Y.; Guenther, J. Variability of biofouling communities on fish cage nets: A 1-year field study at a Norwegian salmon farm. Aquaculture 2013, 416, 302–309. [Google Scholar] [CrossRef]
- Ba-Akdah, M.A.; Satheesh, S.; El-Sherbiny, M.M.O. Biofouling Community Development on Commercial Cage Nets Submerged in a Cage Aquaculture Facility in the Red Sea. Thalassas 2020, 36, 667–675. [Google Scholar] [CrossRef]
- Salama, A.J.; Satheesh, S.; Balqadi, A.A. Development of Biofouling Communities on Nylon Net Panels Submerged in the Central Red Sea: Effects of Season and Depth. Thalassas 2018, 34, 199–208. [Google Scholar] [CrossRef]
- Xu, W.J.; Xu, J.Z.; Chen, L.Y. Main Fouling Organisms Attaching to Net Cage and Their Seasonal Change in Zhejiang Sea Areas. J. Zhejiang Ocean Univ. (Nat. Sci.) 2003, 22, 167–170. [Google Scholar]
- Shui, B.L.; Guo, D.F. Seasonal variation analysis of fouling organisms on offshore cages in Zhoushan. South. China Fish. Sci. 2008, 4, 36–41. [Google Scholar]
- Liu, M.L.; Yan, T. A Review of Marine Fouling Communities in the South China Sea. Mar. Sci. Bull. 2006, 25, 84–91. [Google Scholar]
- Zhou, J.L.; Fu, J.R.; Zeng, J.W.; Chen, Z.; Wang, X.; Liu, L. Species composition and seasonal characteristics of the fouling organisms in the cage culturing waters of Leizhou Bay, Guangdong Province. Fish. Res. 2023, 45, 133–146. [Google Scholar]
- Geng, H.X.; Yan, T.; Yu, R.C.; Zhang, Q.; Kong, F.; Zhou, M. Comparative study on germination of Ulva prolifera spores on different substrates. Oceanol. Limnol. Sin. 2018, 49, 1006–1013. [Google Scholar]
- Yu, W.; Liu, Y.L.; Wang, L.; Shi, J.G. Cu nanoparticle-modified high-density polyethylene monofilament and its antifouling performance on fishing netting. Int. J. Polym. Sci. 2019, 2019, 1–10. [Google Scholar] [CrossRef]
- Tu, C.; Chen, T.; Zhou, Q.; Liu, Y.; Wei, J.; Waniek, J.J.; Luo, Y.M. Biofilm formation and its influences on the properties of microplastics as affected by exposure time and depth in the seawater. Sci. Total Environ. 2020, 734, 139237. [Google Scholar] [CrossRef]
- Worms Editorial Board. World Register of Marine Species. Available online: http://www.marinespecies.org (accessed on 1 May 2022).
- Xu, B.Y.; Huang, X.F.; Xu, K. Spatial and Seasonal Dynamics of Plankton Community and Its Relationship with Environmental Factors in an Urban River: A Case Study of Wuxi City, China. Water 2025, 17, 527–536. [Google Scholar] [CrossRef]
- Alcicek, Z.; Balaban, M.O. Estimation of whole volume of green shelled mussels using their geometrical attributes obtained from image analysis. Int. J. Food Prop. 2014, 17, 1987–1997. [Google Scholar] [CrossRef]
- Cristini, P.A.; Frontini, P.M.; Ballarre, J. Shell strength of freshwater molluscs and its implication on preservation potential. Hist. Biol. 2020, 33, 2668–2682. [Google Scholar] [CrossRef]
- Delgado-Vences, F.; Baltazar-Larios, F.; Vargas, A.O. Inference for a discretized stochastic logistic differential equation and its application to biological growth. J. Appl. Stat. 2022, 50, 1231–1254. [Google Scholar] [CrossRef] [PubMed]
- Audino, J.A.; Serb, J.M.; Marian, J.E.A.R. Hard to get, easy to lose: Evolution of mantle photoreceptor organs in bivalves (Bivalvia, Pteriomorphia). Evolution 2020, 74, 2105–2120. [Google Scholar] [CrossRef]
- Wen, C.L.; Li, H.; Wang, P.B.; Li, W.; Zhao, J.Q. Progress in phototaxis mechanism research and micromanipulation techniques of algae cells. Prog. Nat. Sci. Mater. Int. 2007, 17, 254–260. [Google Scholar]
- Ersoy, I.E.; Mendes, M.; Keskin, S. Estimation of parameters of linear and nonlinear growth curve models at early growth stage in California Turkeys. Arch. Geflugelkd. 2007, 71, 175–180. [Google Scholar] [CrossRef]
- Paz-Andrate, A.; Labarta, U.; Vinseiro, V. Mussel production management: Raft culture without thinning-out. World Fish. 1968, 3, 50–52. [Google Scholar]
- Kittner, C.; Riisgard, H.U. Effect of temperature on filtration rate in the mussel Mytilus edulis: No evidence for temperature compensation. Mar. Ecol. Prog. Ser. 2005, 305, 147–152. [Google Scholar] [CrossRef]
- Levenets, I.R.; Lebedev, E.B.; Baranov, A.Y. Epibiotic Macroalgae on Scallops and Oysters in Shallow Waters of Southern Primorye. Inland. Water Biol. 2021, 14, 528–535. [Google Scholar] [CrossRef]
- Ansari, F.A.; Guldhe, A.; Gupta, S.K. Improving the feasibility of aquaculture feed by using microalgae. Environ. Sci. Pollut. Res. 2021, 28, 43234–43257. [Google Scholar] [CrossRef]
- Chen, Y.H.; Dong, Z.G.; Li, X.Y. Study on Fouling Organisms in Pacific Oysters (Crassostrea gigas) Culture Area of the Haizhou Bay. Genom. Appl. Biol. 2019, 38, 1572–1579. [Google Scholar]
- Shi, J.G.; Yu, W.W.; Zhao, K. Progress in research of antifouling technology of offshore cage netting. J. Fish. China 2021, 45, 472–485. [Google Scholar]
- Antoniadou, C.; Voultsiadou, E.; Rayann, A. Sessile biota fouling farmed mussels: Diversity, spatiotemporal patterns, and implications for the basibiont. J. Mar. Biol. Assoc. UK 2013, 93, 1593–1607. [Google Scholar] [CrossRef]
- Huang, G.F.; Zheng, G.F.; Wei, G.Y. Fouling organisms in the open ocean cage culture area in Weitou Bay Fujian Province in China. Acta Oceanol. Sin. 2007, 29, 98–104. [Google Scholar]
- Lopez-Perez, C.; Olivar, M.P.; Hulley, P.A. Length-weight relationships of mesopelagic fishes from the equatorial and tropical Atlantic waters: Influence of environment and body shape. J. Fish. Biol. 2020, 96, 1388–1398. [Google Scholar] [CrossRef]
- Gumus, B.; Gumus, E.; Balaban, M.O. Image Analysis to Determine Length-Weight and Area-Weight Relationships, and Color Differences in Scaled Carp and Mirror Carp Grown in Fiberglass and Concrete Tanks. Turk. J. Fish. Aquat. Sci. 2022, 23, TRJFAS21260. [Google Scholar] [CrossRef]
- Ricker, W.E. Computation and interpretation of biological statistics of fish population. Bull. Fish. Res. Board. Can. 1975, 191, 1–382. [Google Scholar]
- Sensurat-Genc, T.; Karadal, O.; Oruc, A.C. Effects of seasonal changes and depth on growth parameters of the Mediterranean mussel (Mytilus galloprovincialis) on a shipwreck in the Eastern Mediterranean Sea. Oceanol. Hydrobiol. Stud. 2021, 50, 441–454. [Google Scholar] [CrossRef]
- Alcantara-Lopez, F.; Fuentes, C.; Chavez, C. Fractional Growth Model Applied to COVID-19 Data. Mathematics 2021, 9, 1915. [Google Scholar] [CrossRef]
- Ma, Y.H.; Chai, X.W.; Yan, Z.F. Clam shell compression characteristics and bond strength. Adv. Mater. Res. 2012, 472–475, 2554–2557. [Google Scholar] [CrossRef]
- Zhao, Z.F.; Mao, Z.D.; Xing, P. Intrahabitat Differences in Bacterial Communities Associated with Corbicula fluminea in the Large Shallow Eutrophic Lake Taihu. Appl. Environ. Microbiol. 2022, 88, e0232821. [Google Scholar] [CrossRef]
- Mu, G.; Duan, F.H.; Zhang, G.C. Microstructure and mechanical property of Ruditapes philippinarum shell. J. Mech. Behav. Biomed. Mater. 2018, 85, 209–217. [Google Scholar] [CrossRef] [PubMed]


Disclaimer/Publisher’s Note: The statements, opinions and data contained in all publications are solely those of the individual author(s) and contributor(s) and not of MDPI and/or the editor(s). MDPI and/or the editor(s) disclaim responsibility for any injury to people or property resulting from any ideas, methods, instructions or products referred to in the content. |
© 2025 by the authors. Licensee MDPI, Basel, Switzerland. This article is an open access article distributed under the terms and conditions of the Creative Commons Attribution (CC BY) license (https://creativecommons.org/licenses/by/4.0/).