


The Effects of Reduced Wastewater Load in the Marine Area off Turku in the Archipelago Sea During the Period 1965–2025
Abstract
:1. Introduction
2. Materials and Methods
2.1. Study Areas
2.2. Wastewater Treatment Plants and Load Data
2.3. Water Quality and Phytoplankton
2.3.1. Data and Analytics
2.3.2. Processing of Datasets
3. Results
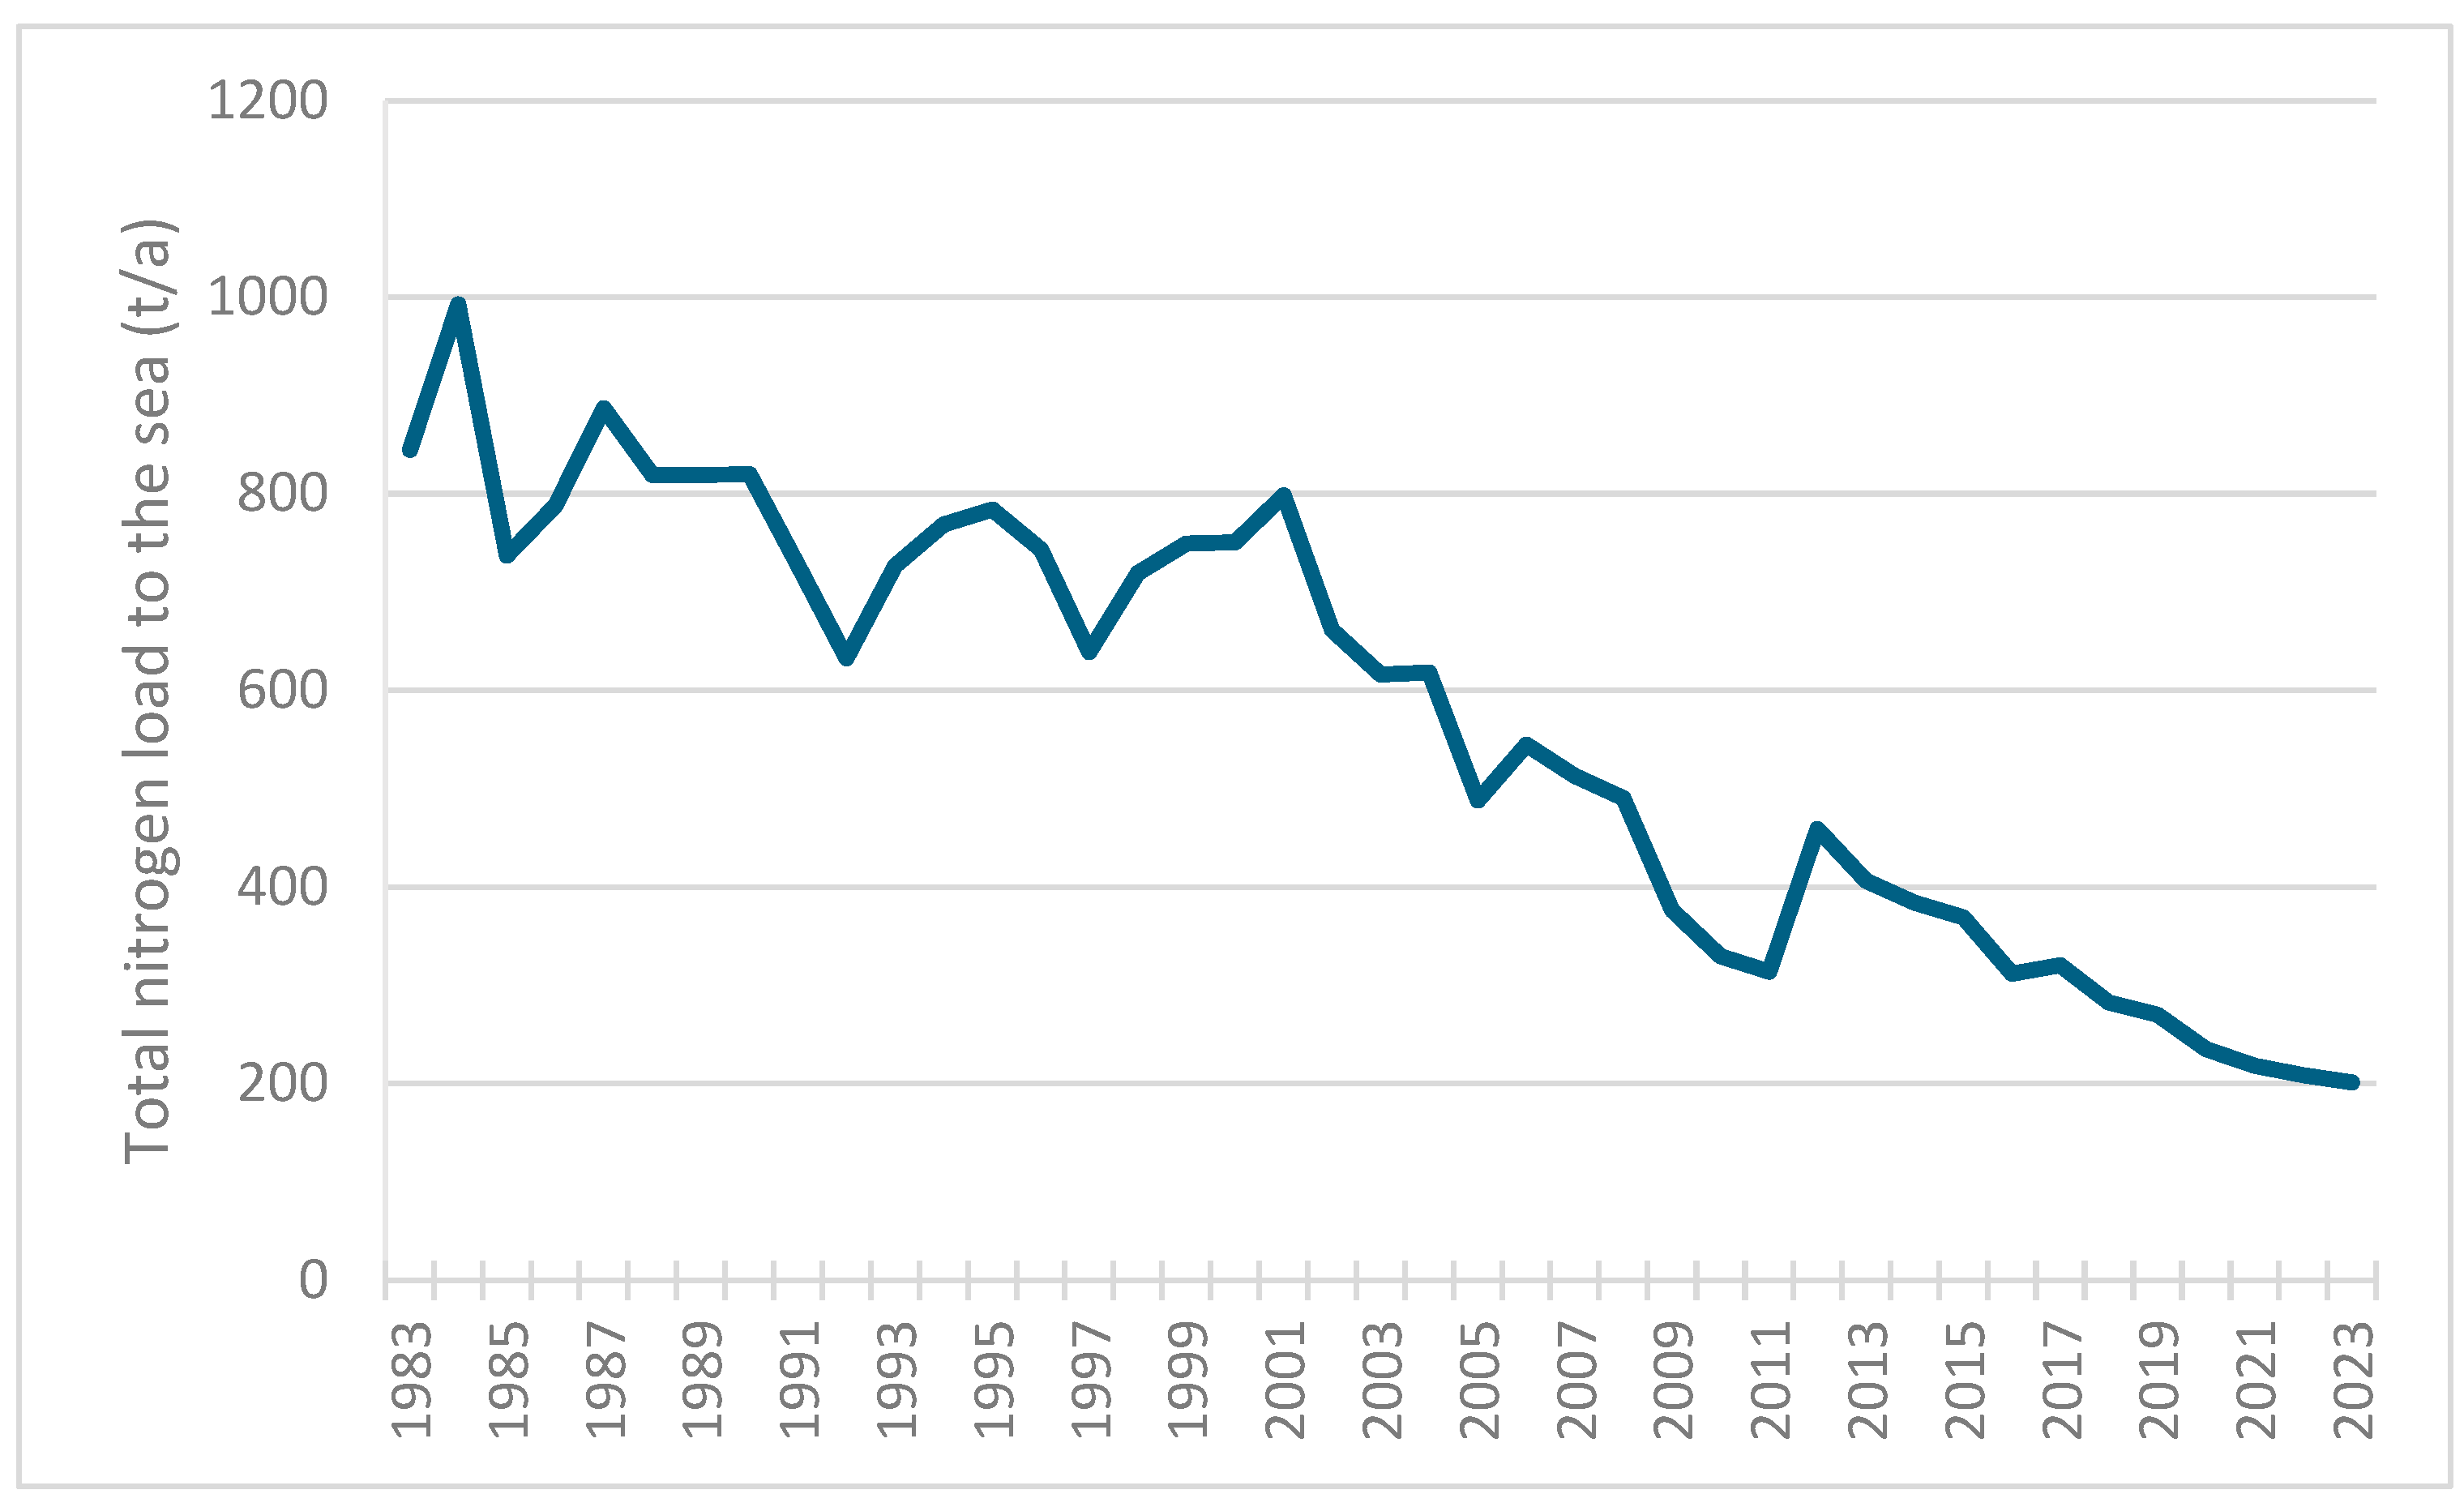
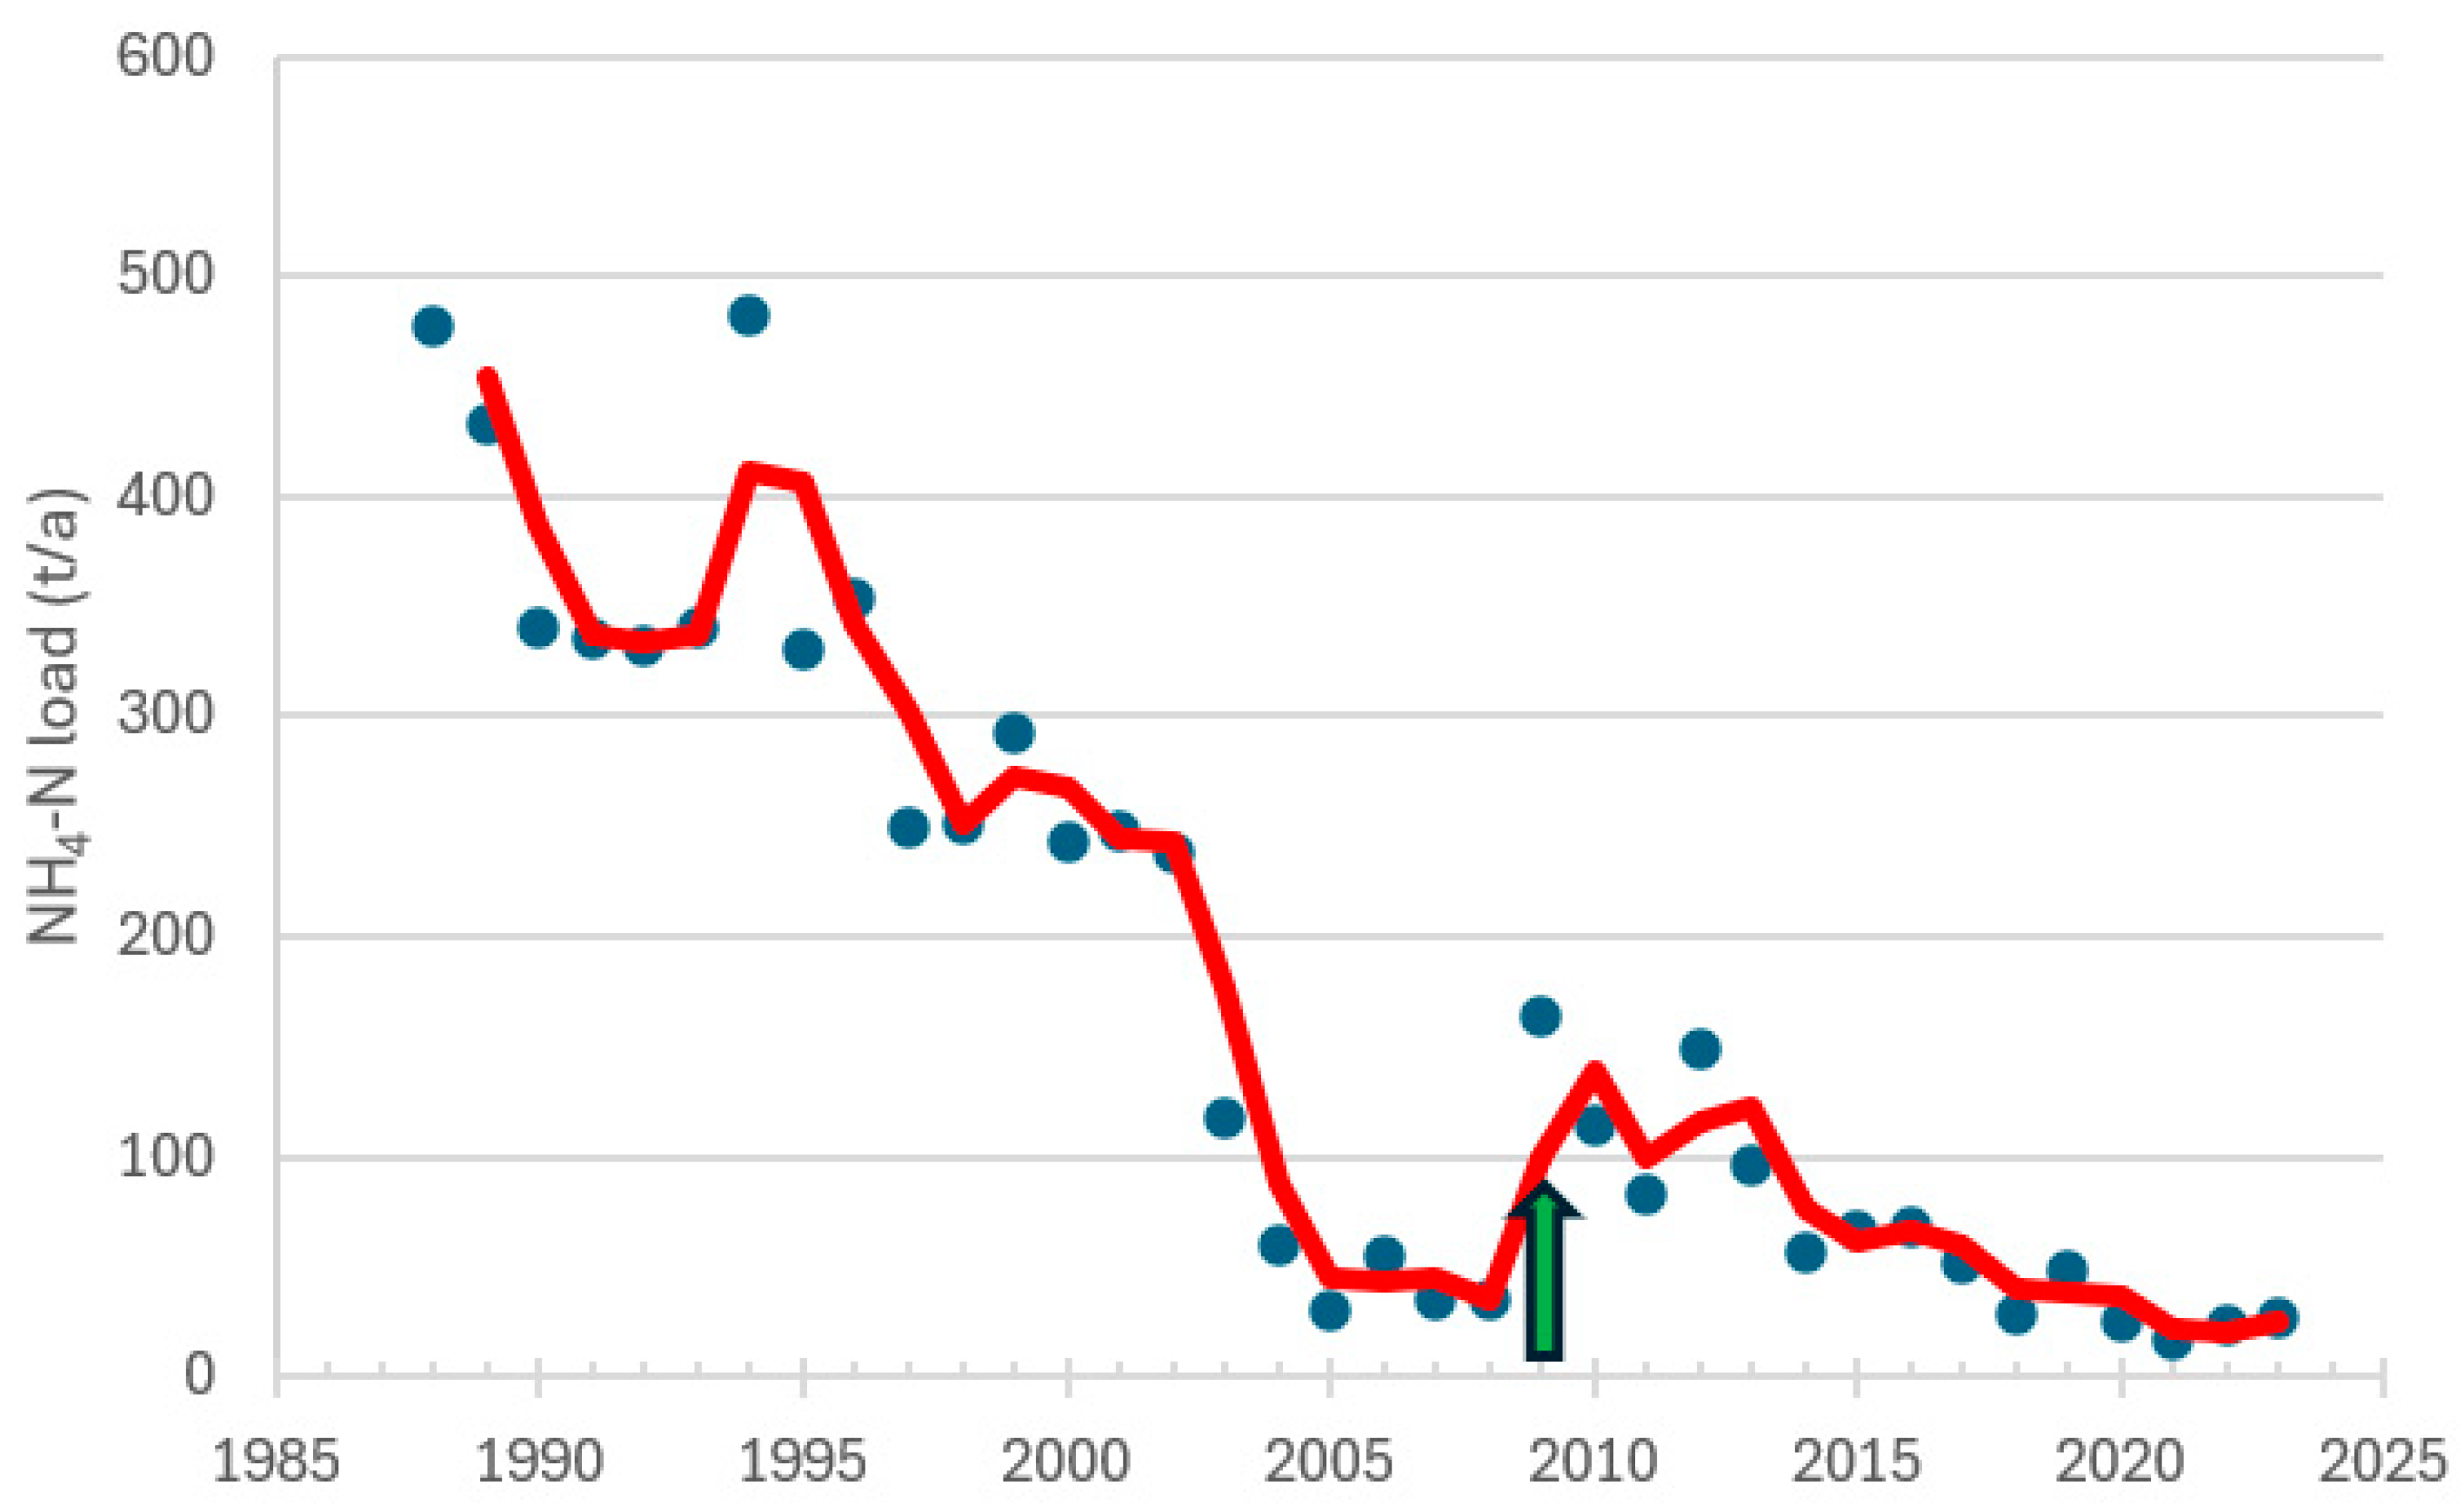
3.1. Nutrient Loads
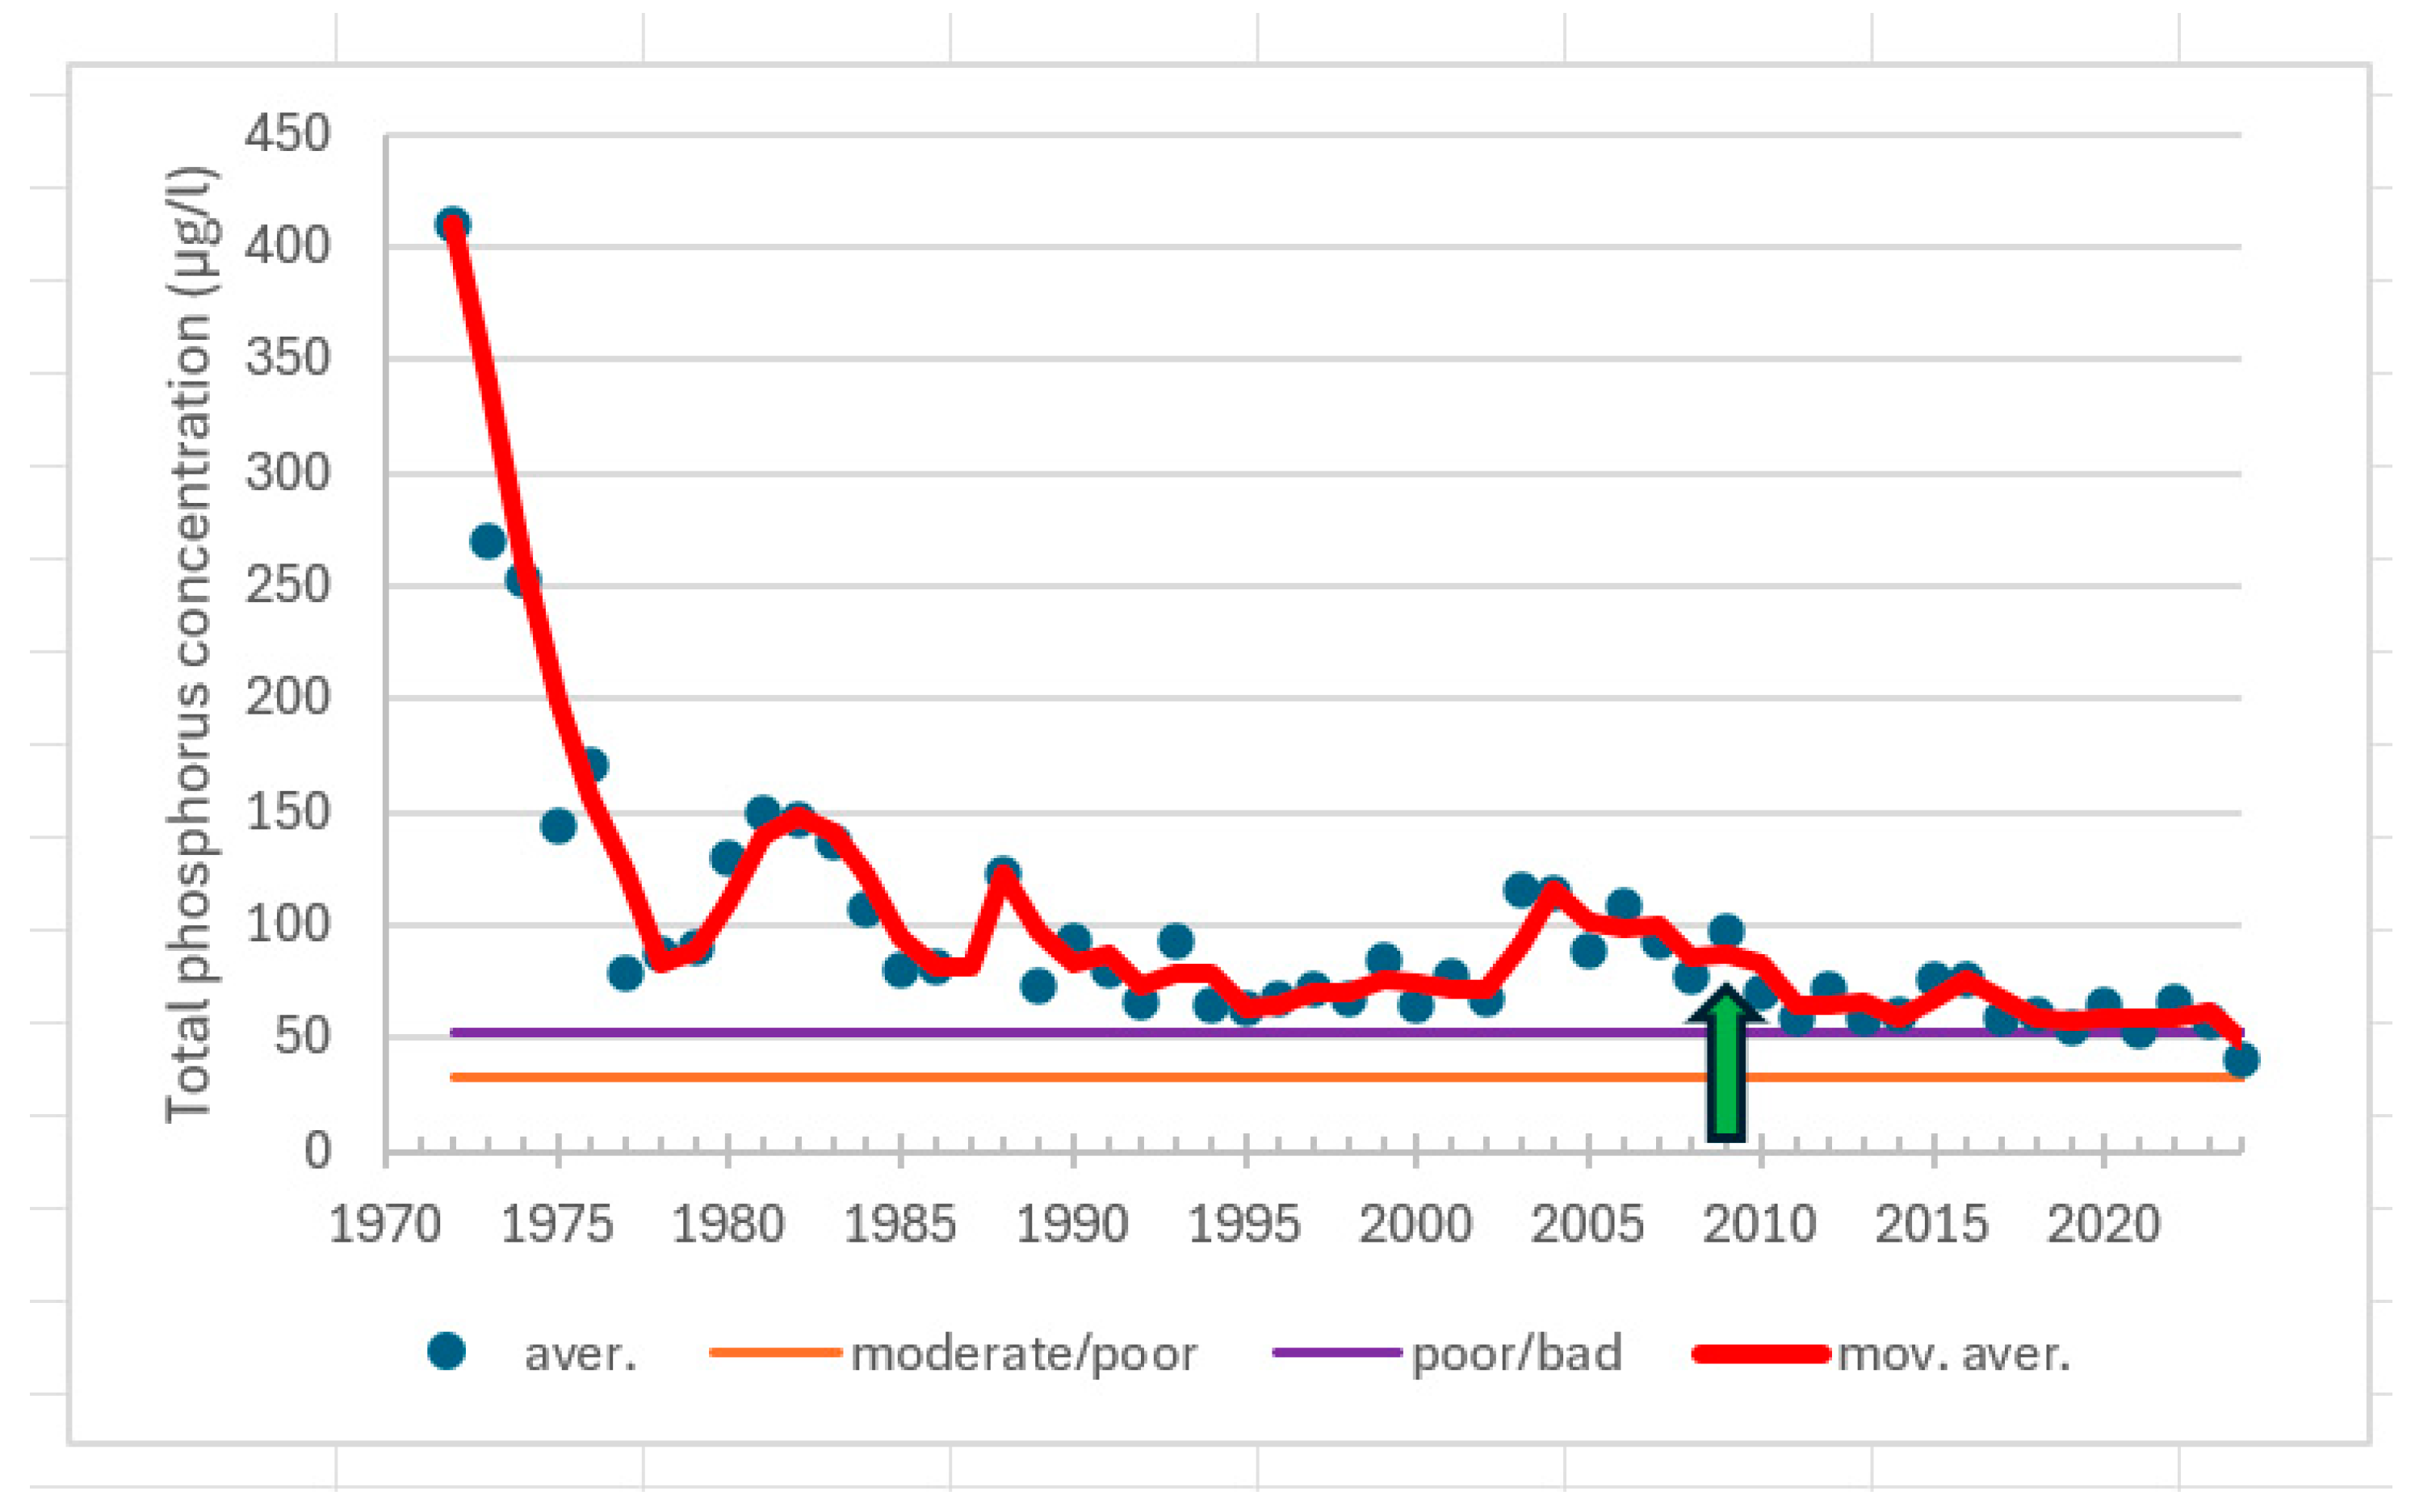
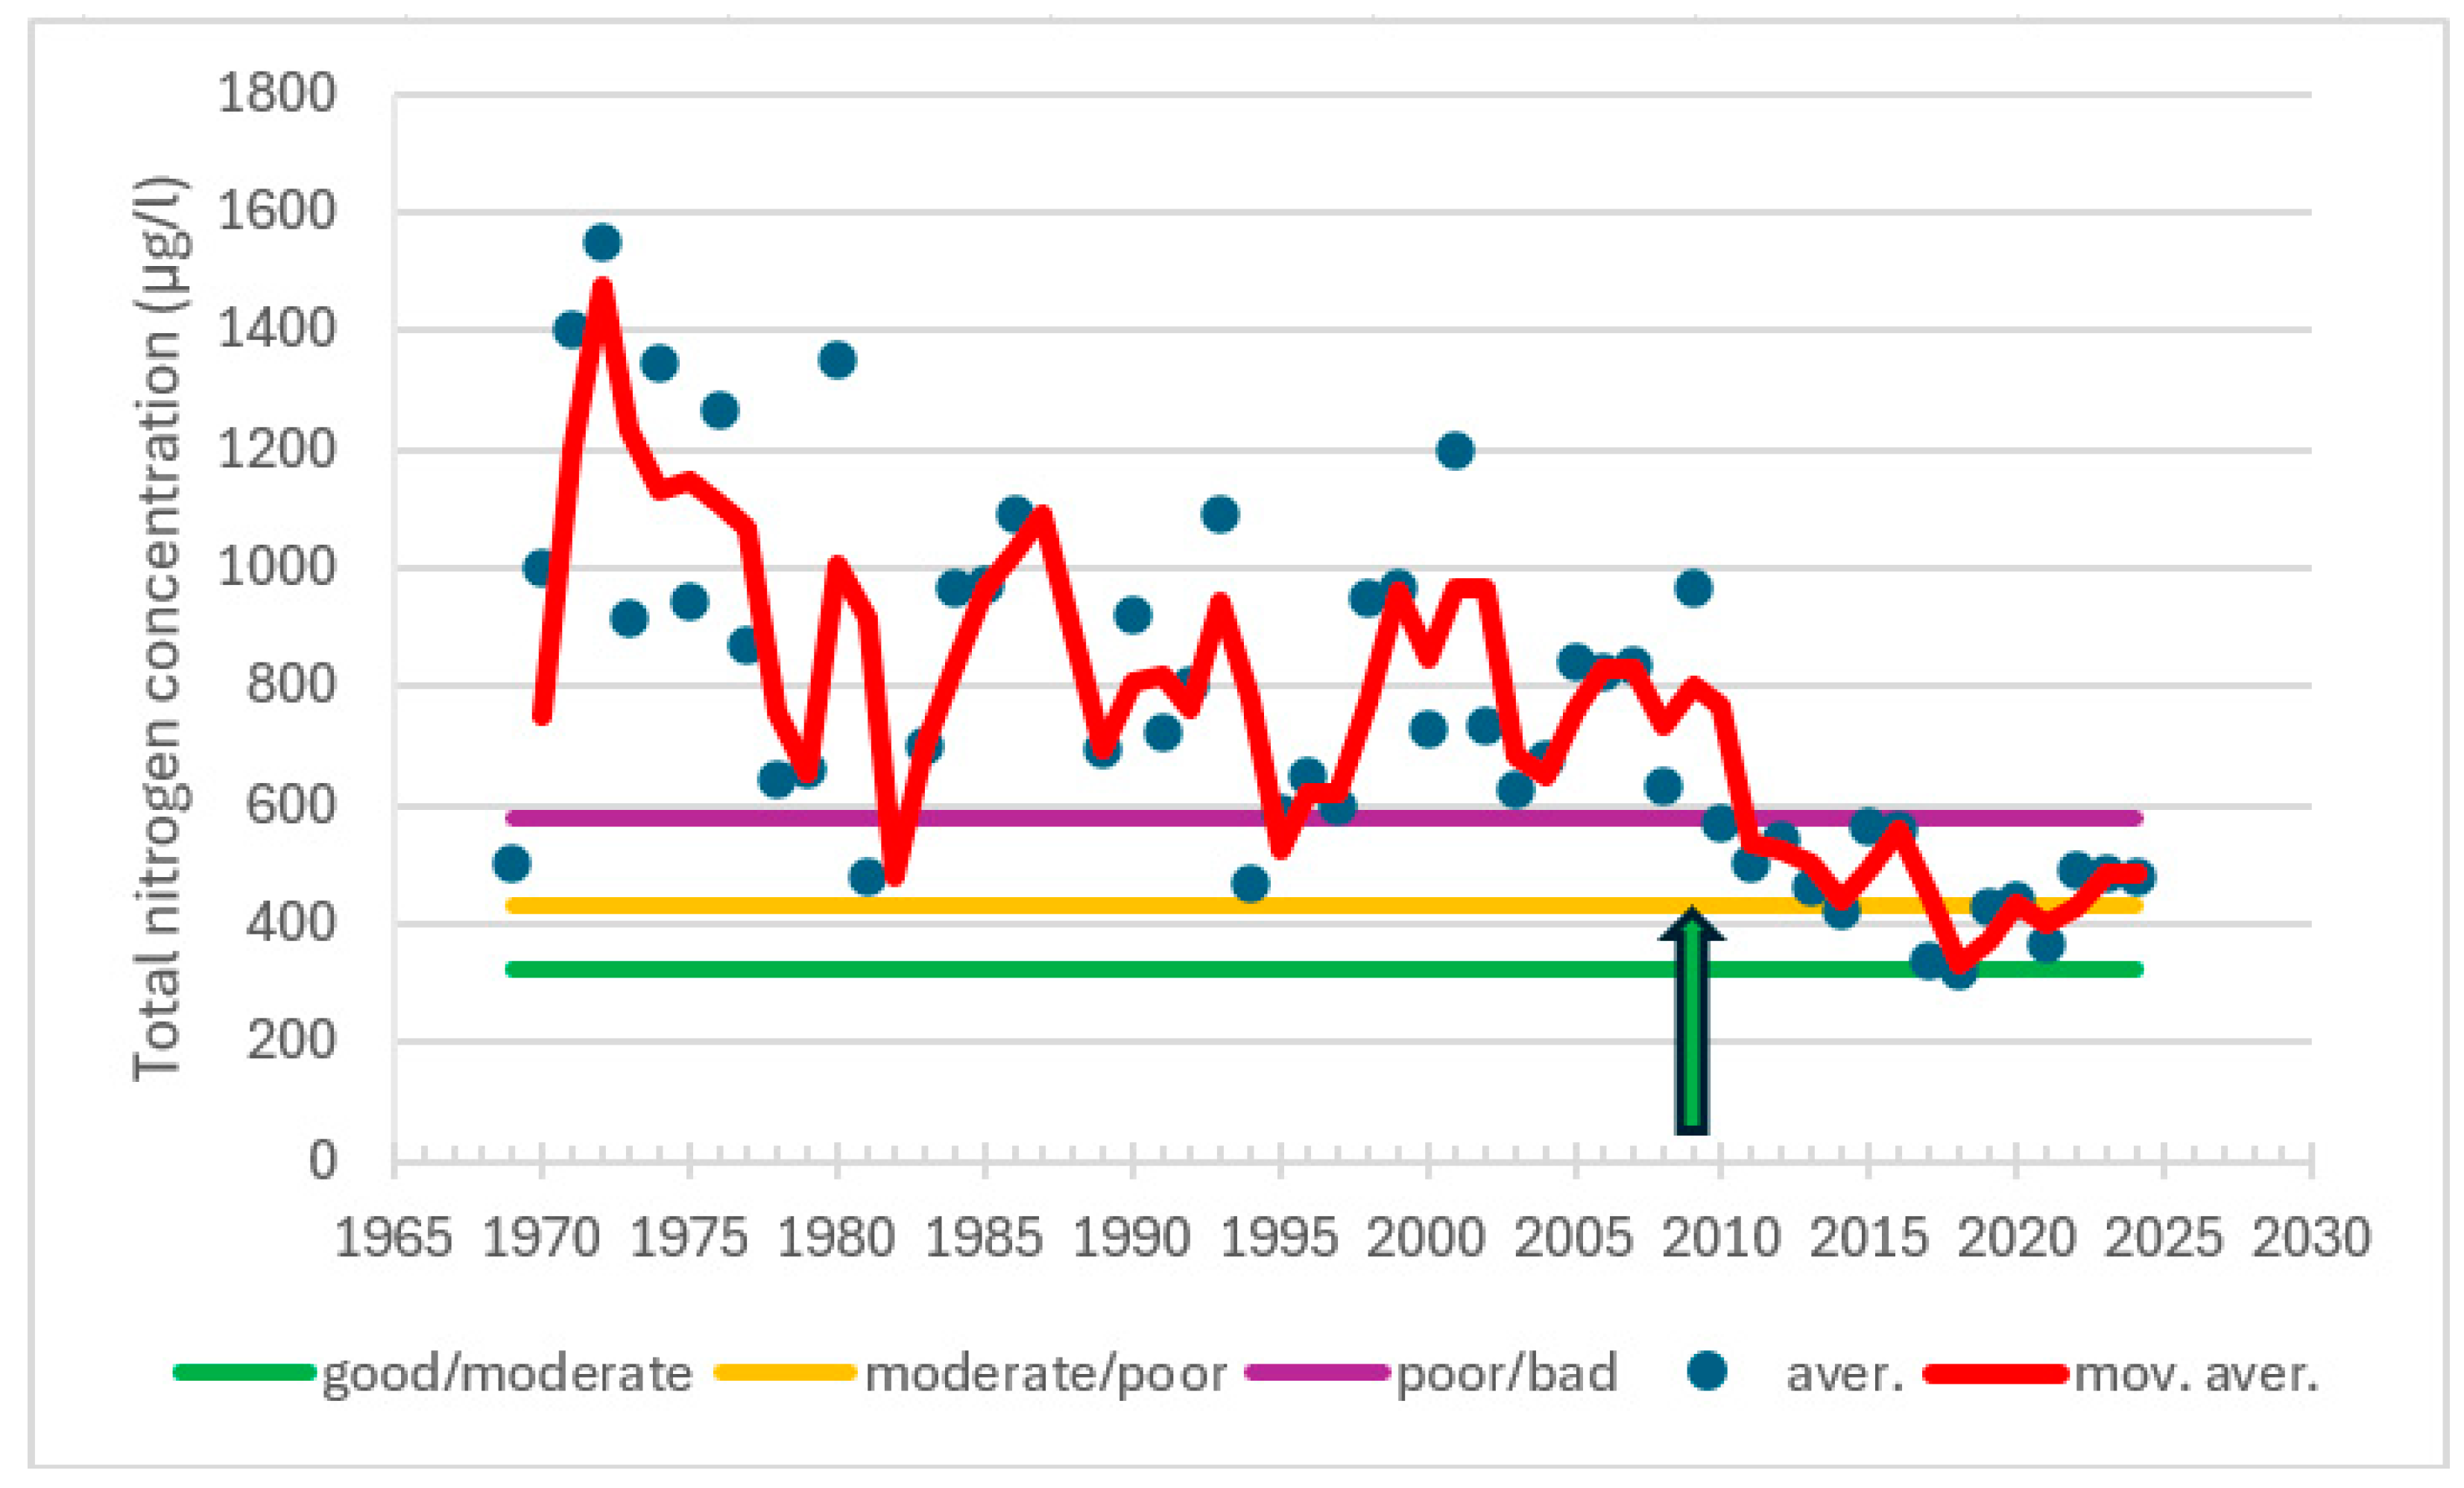
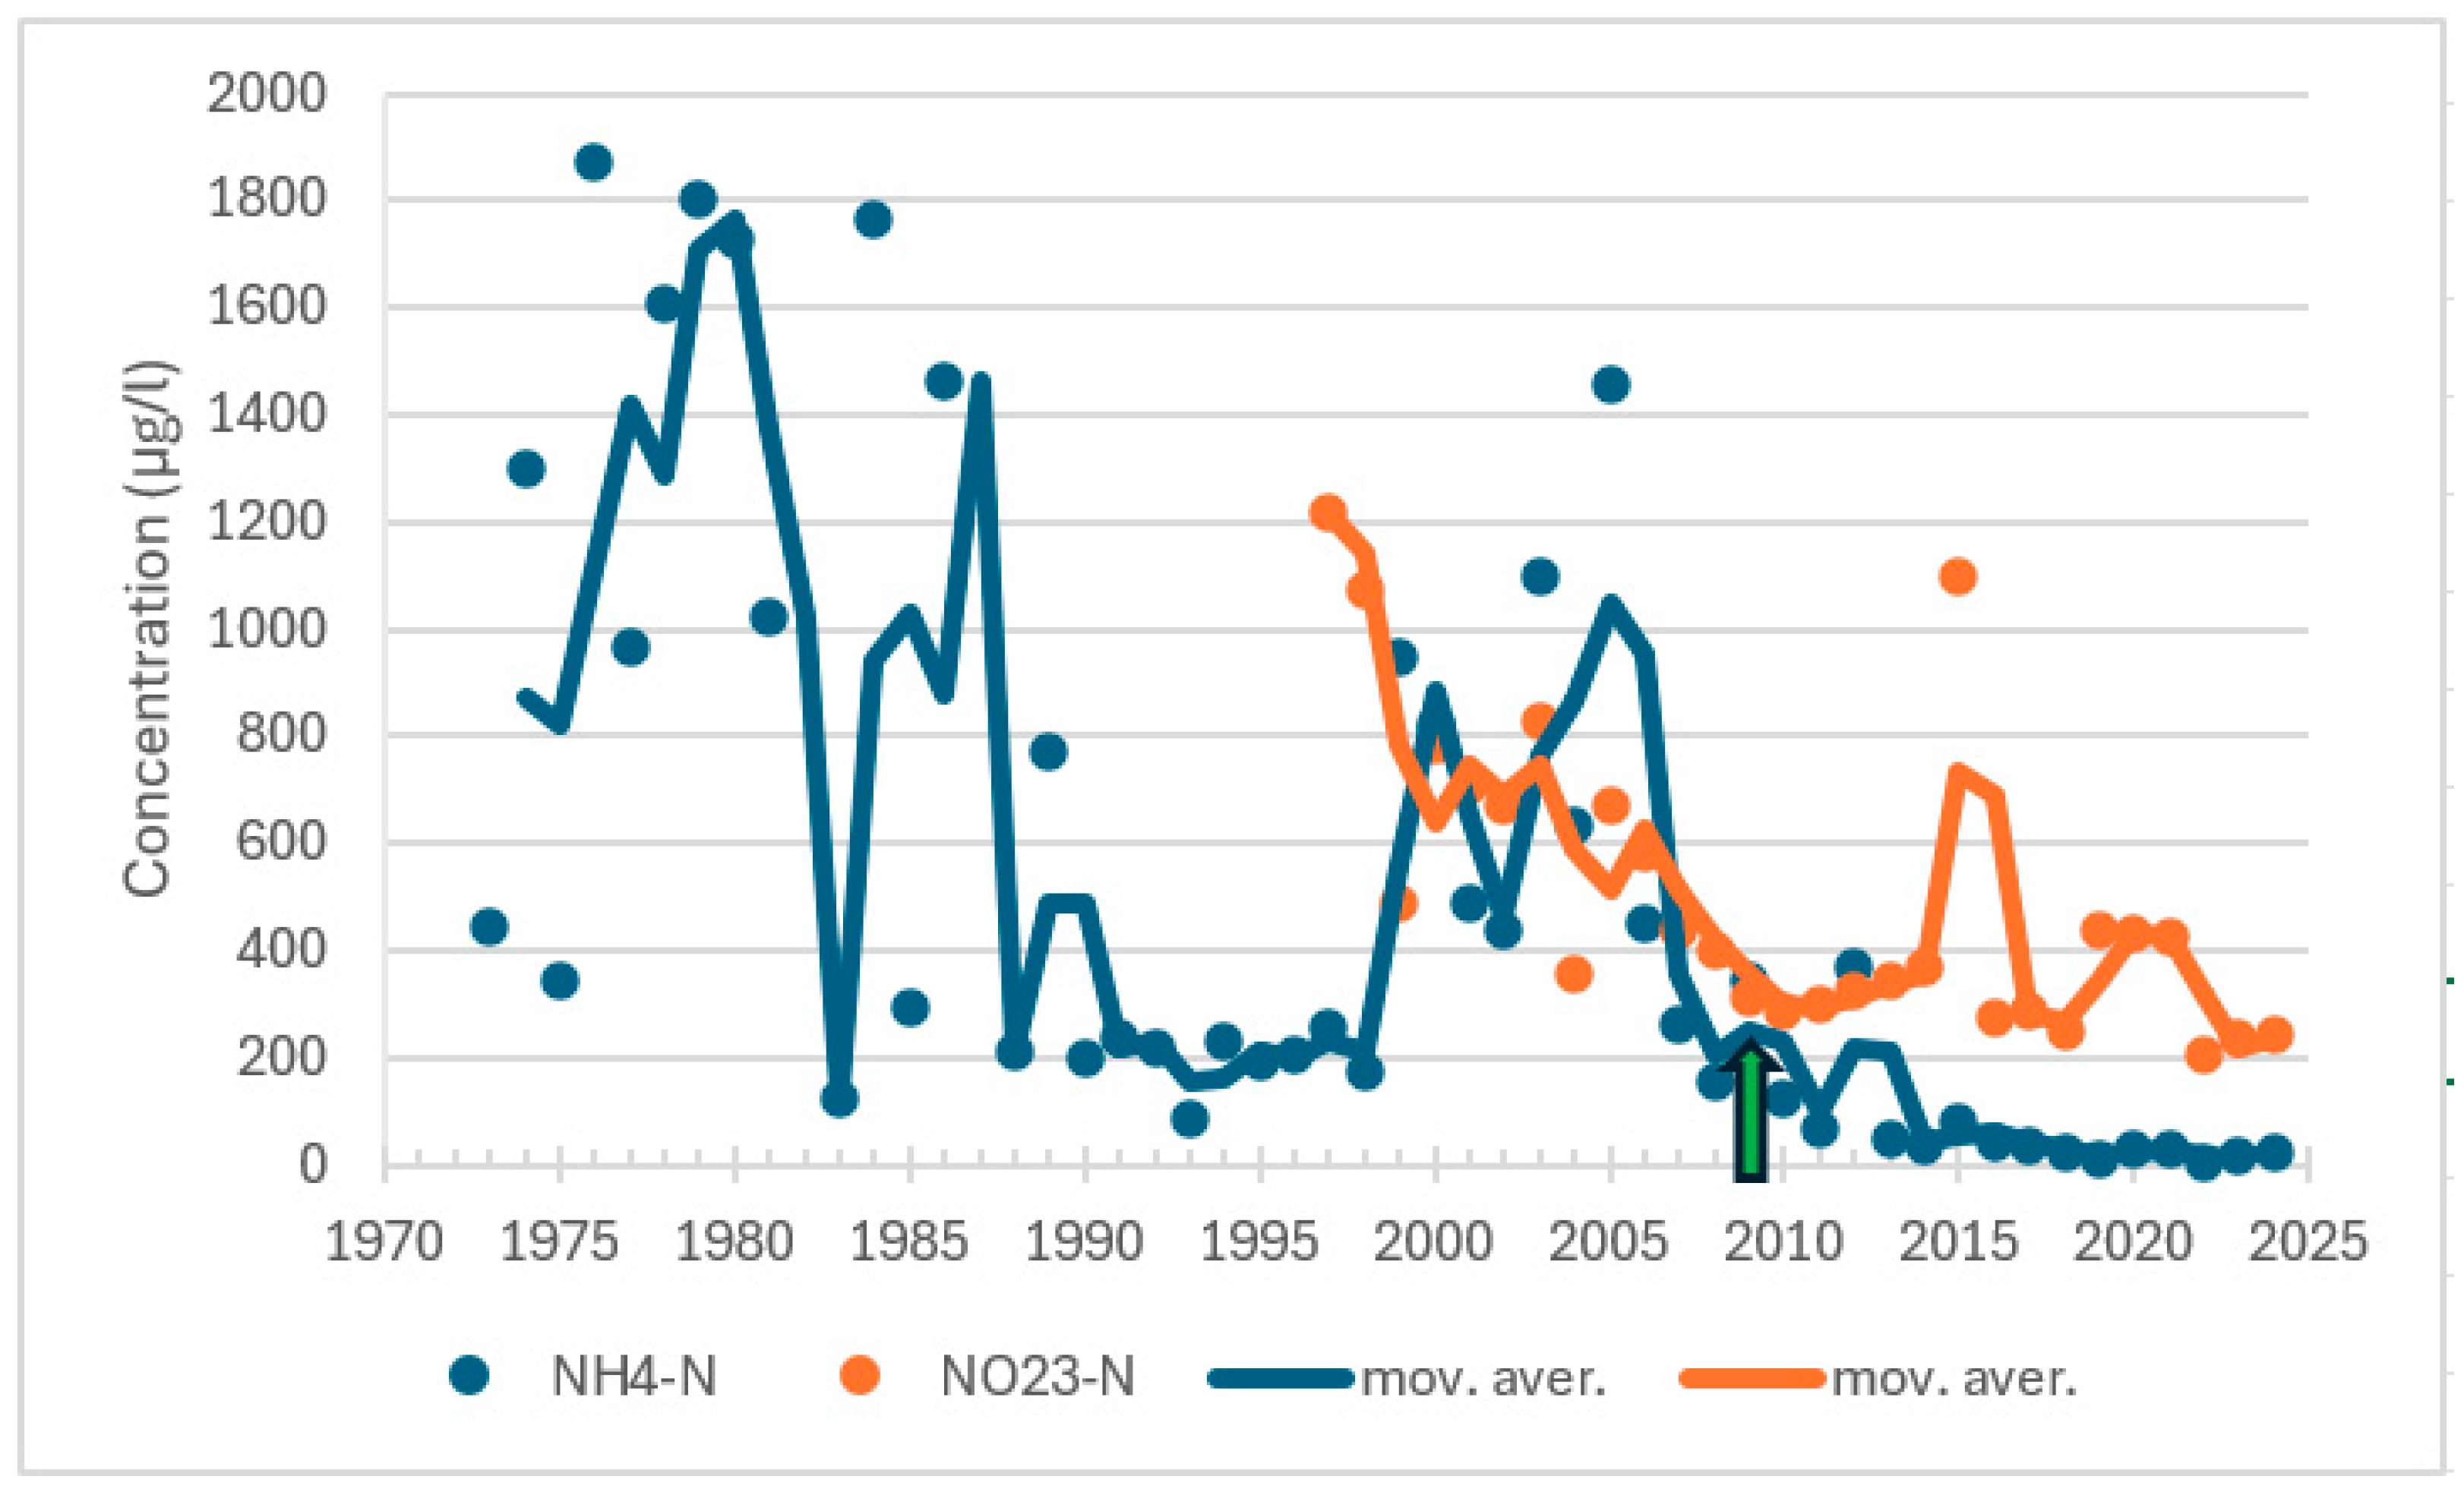
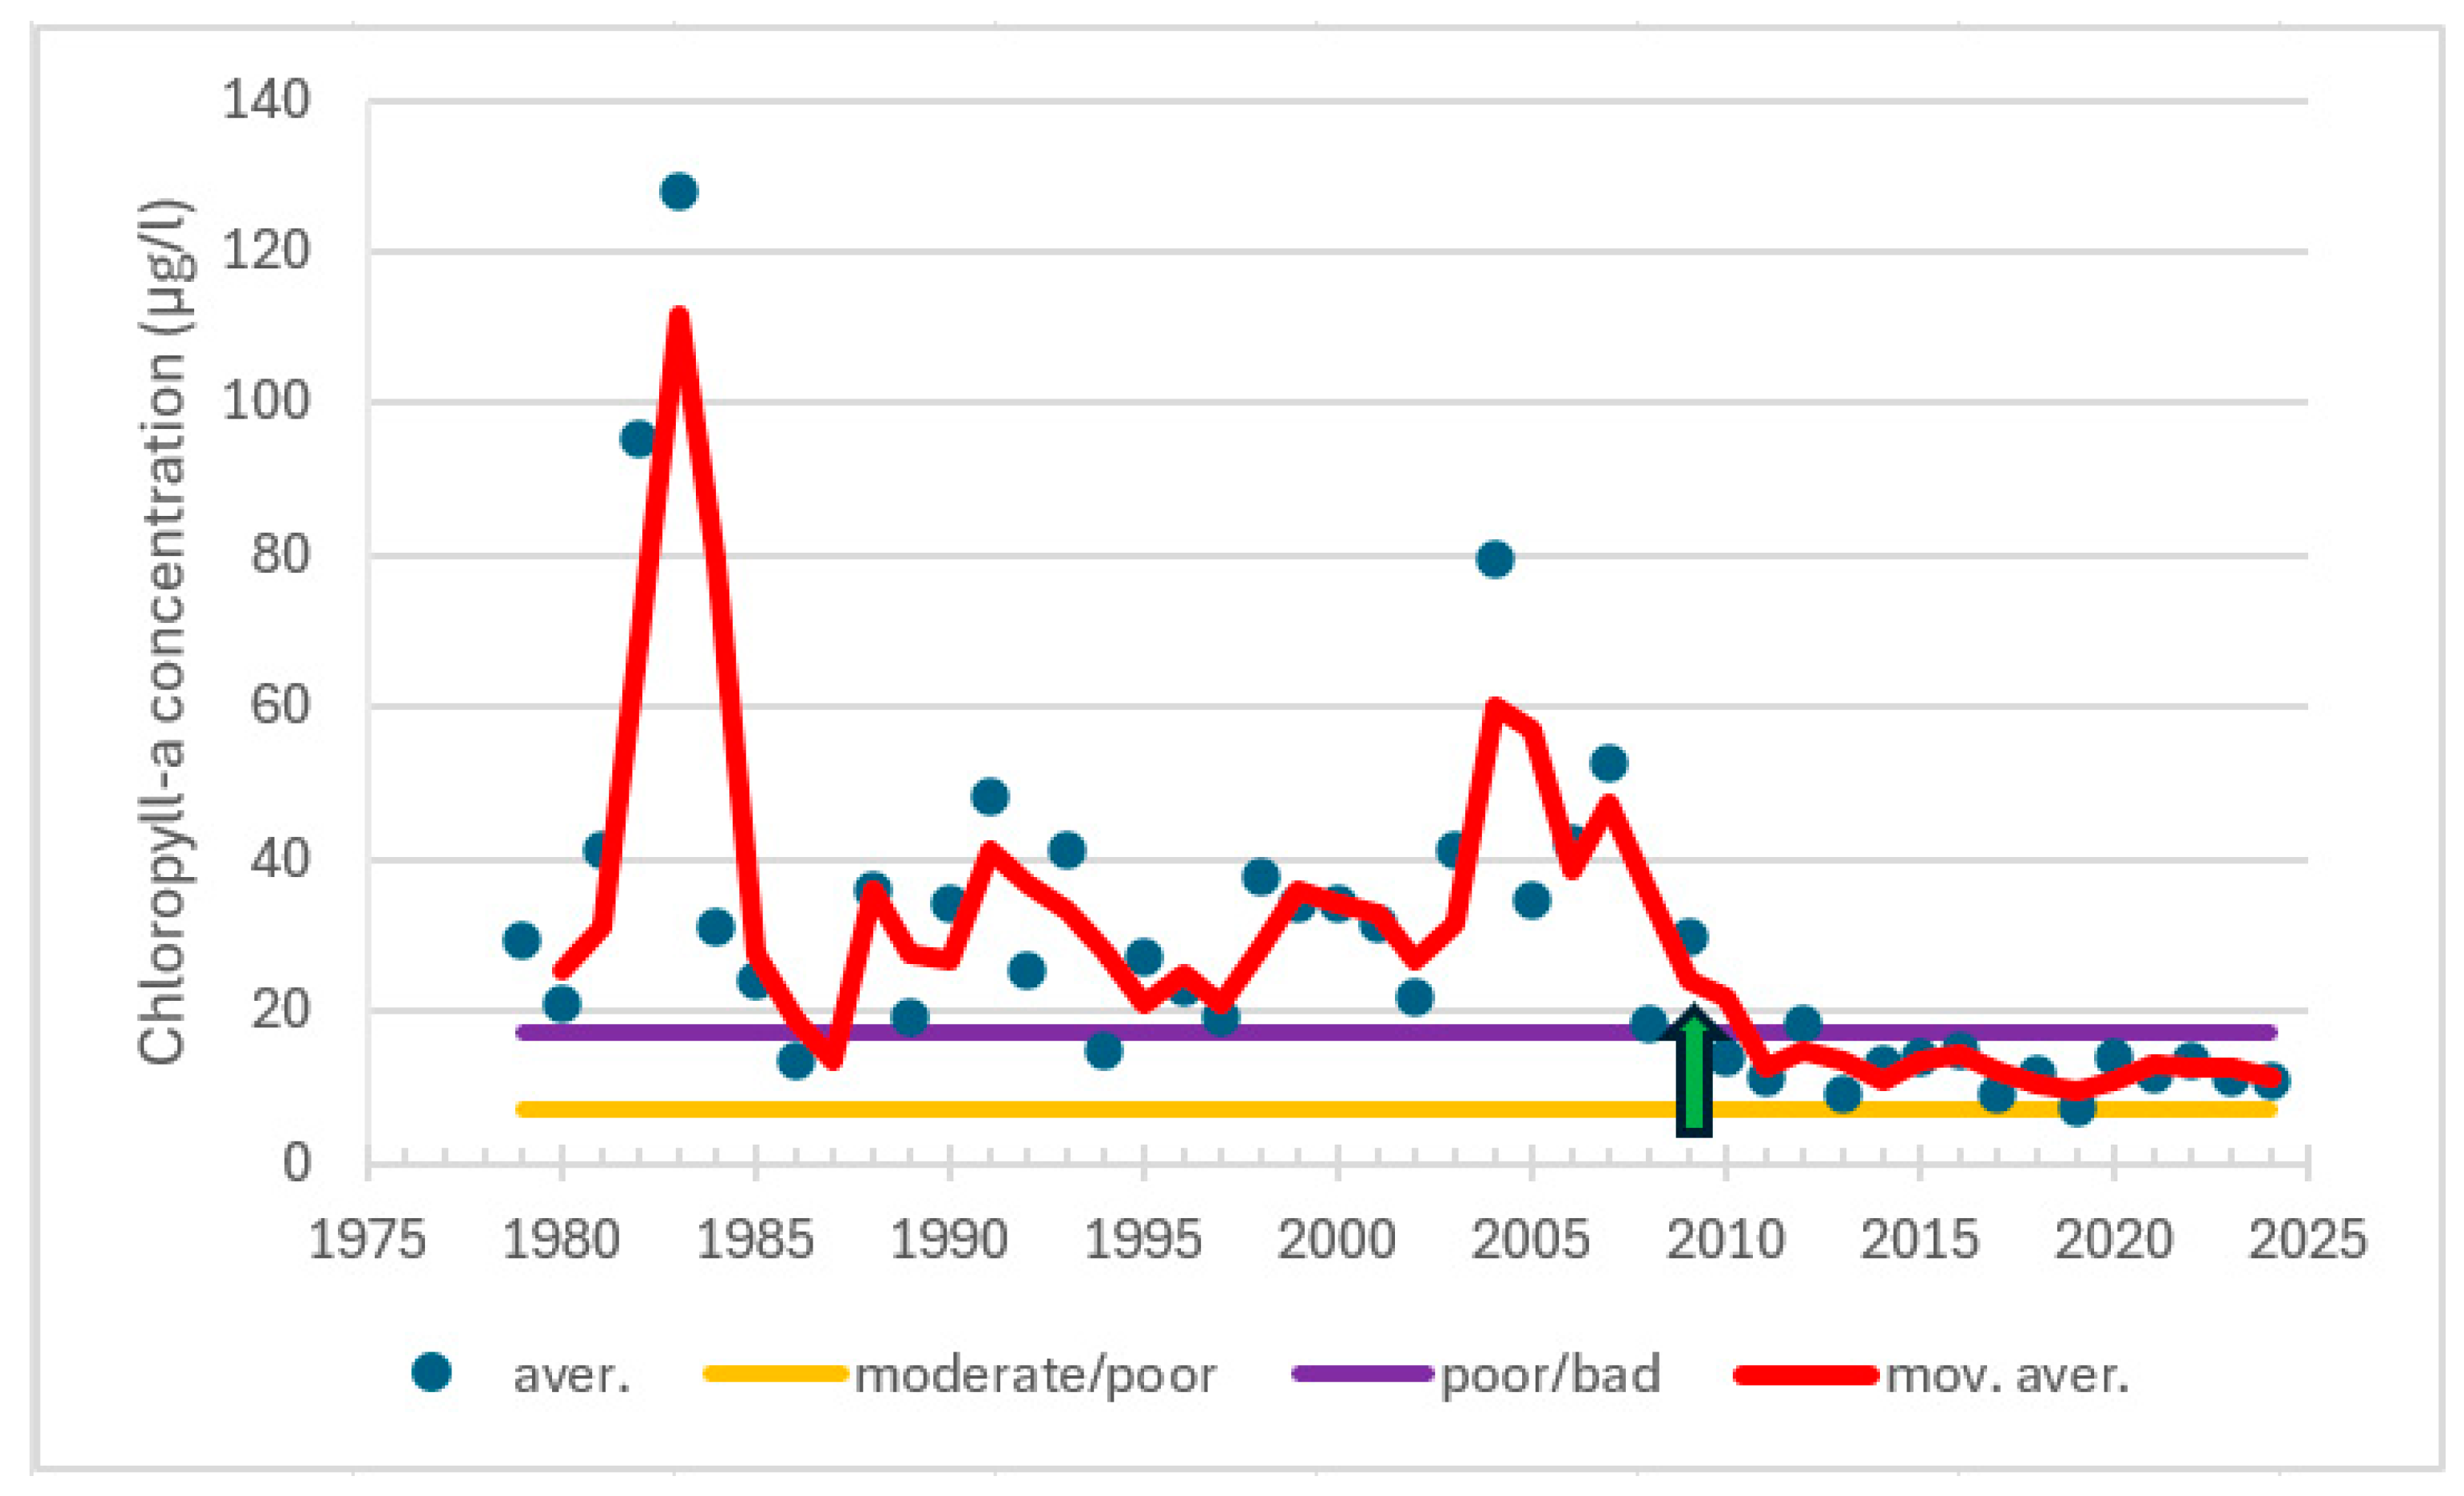
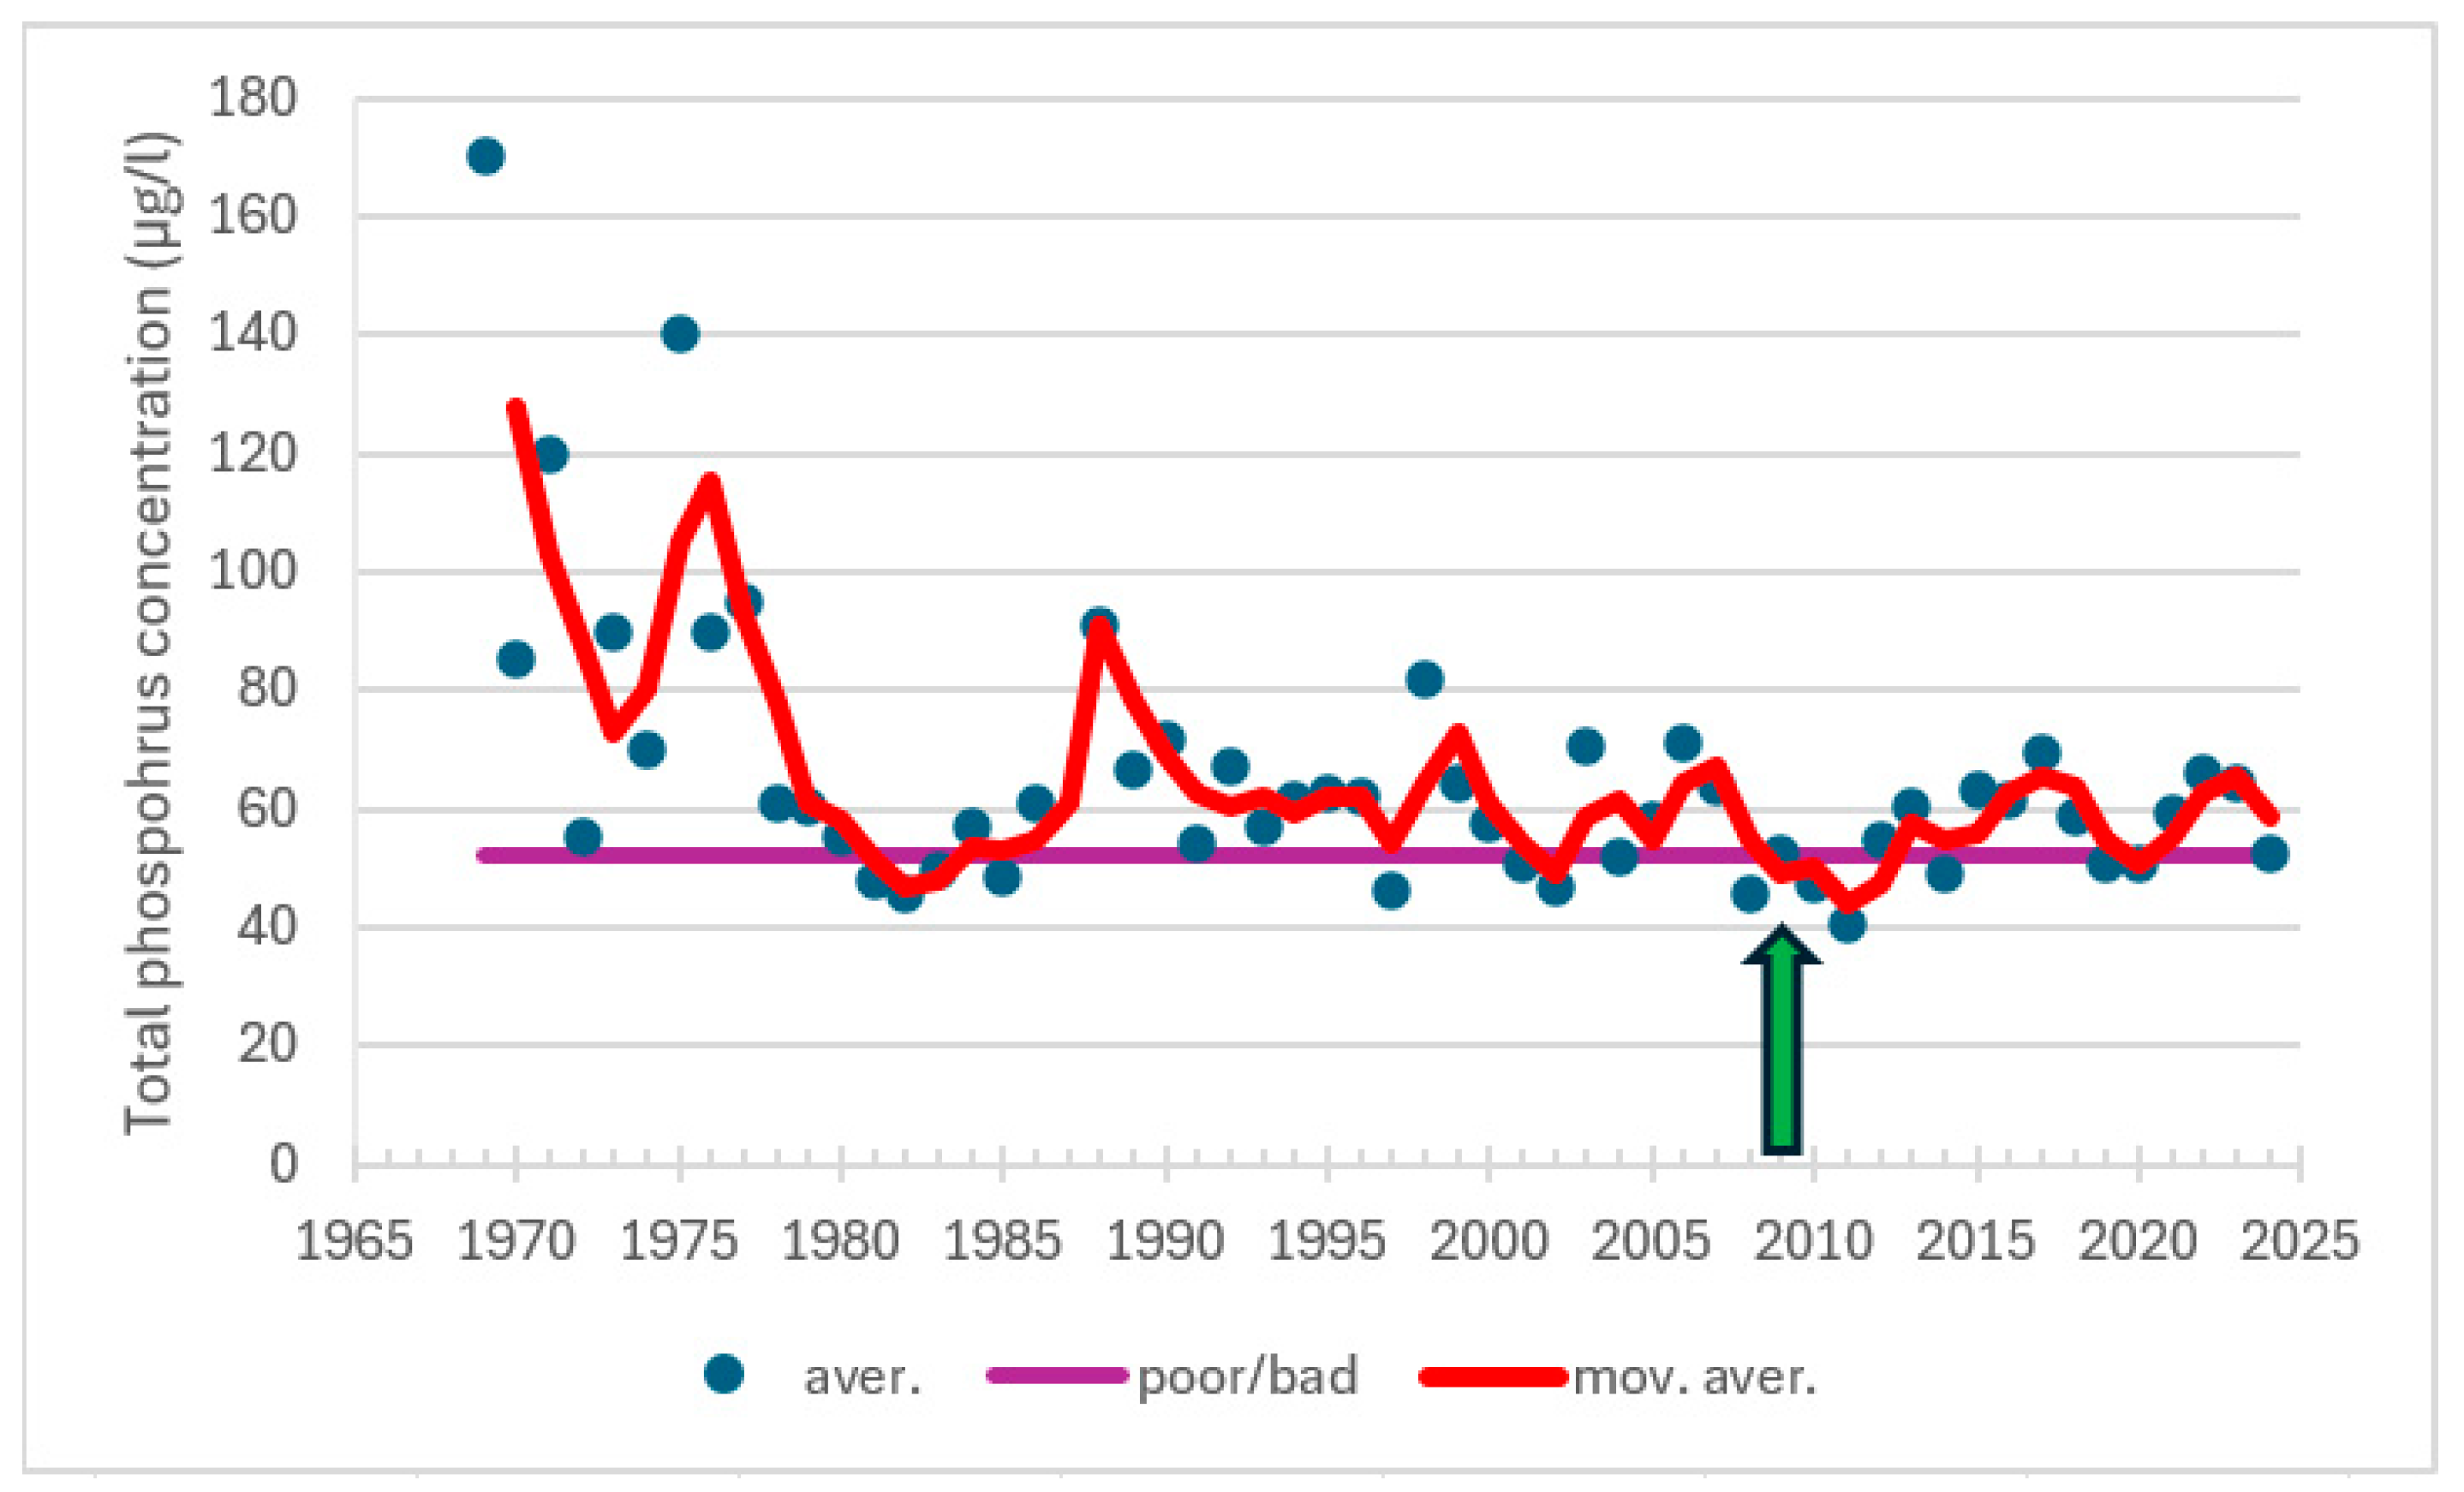
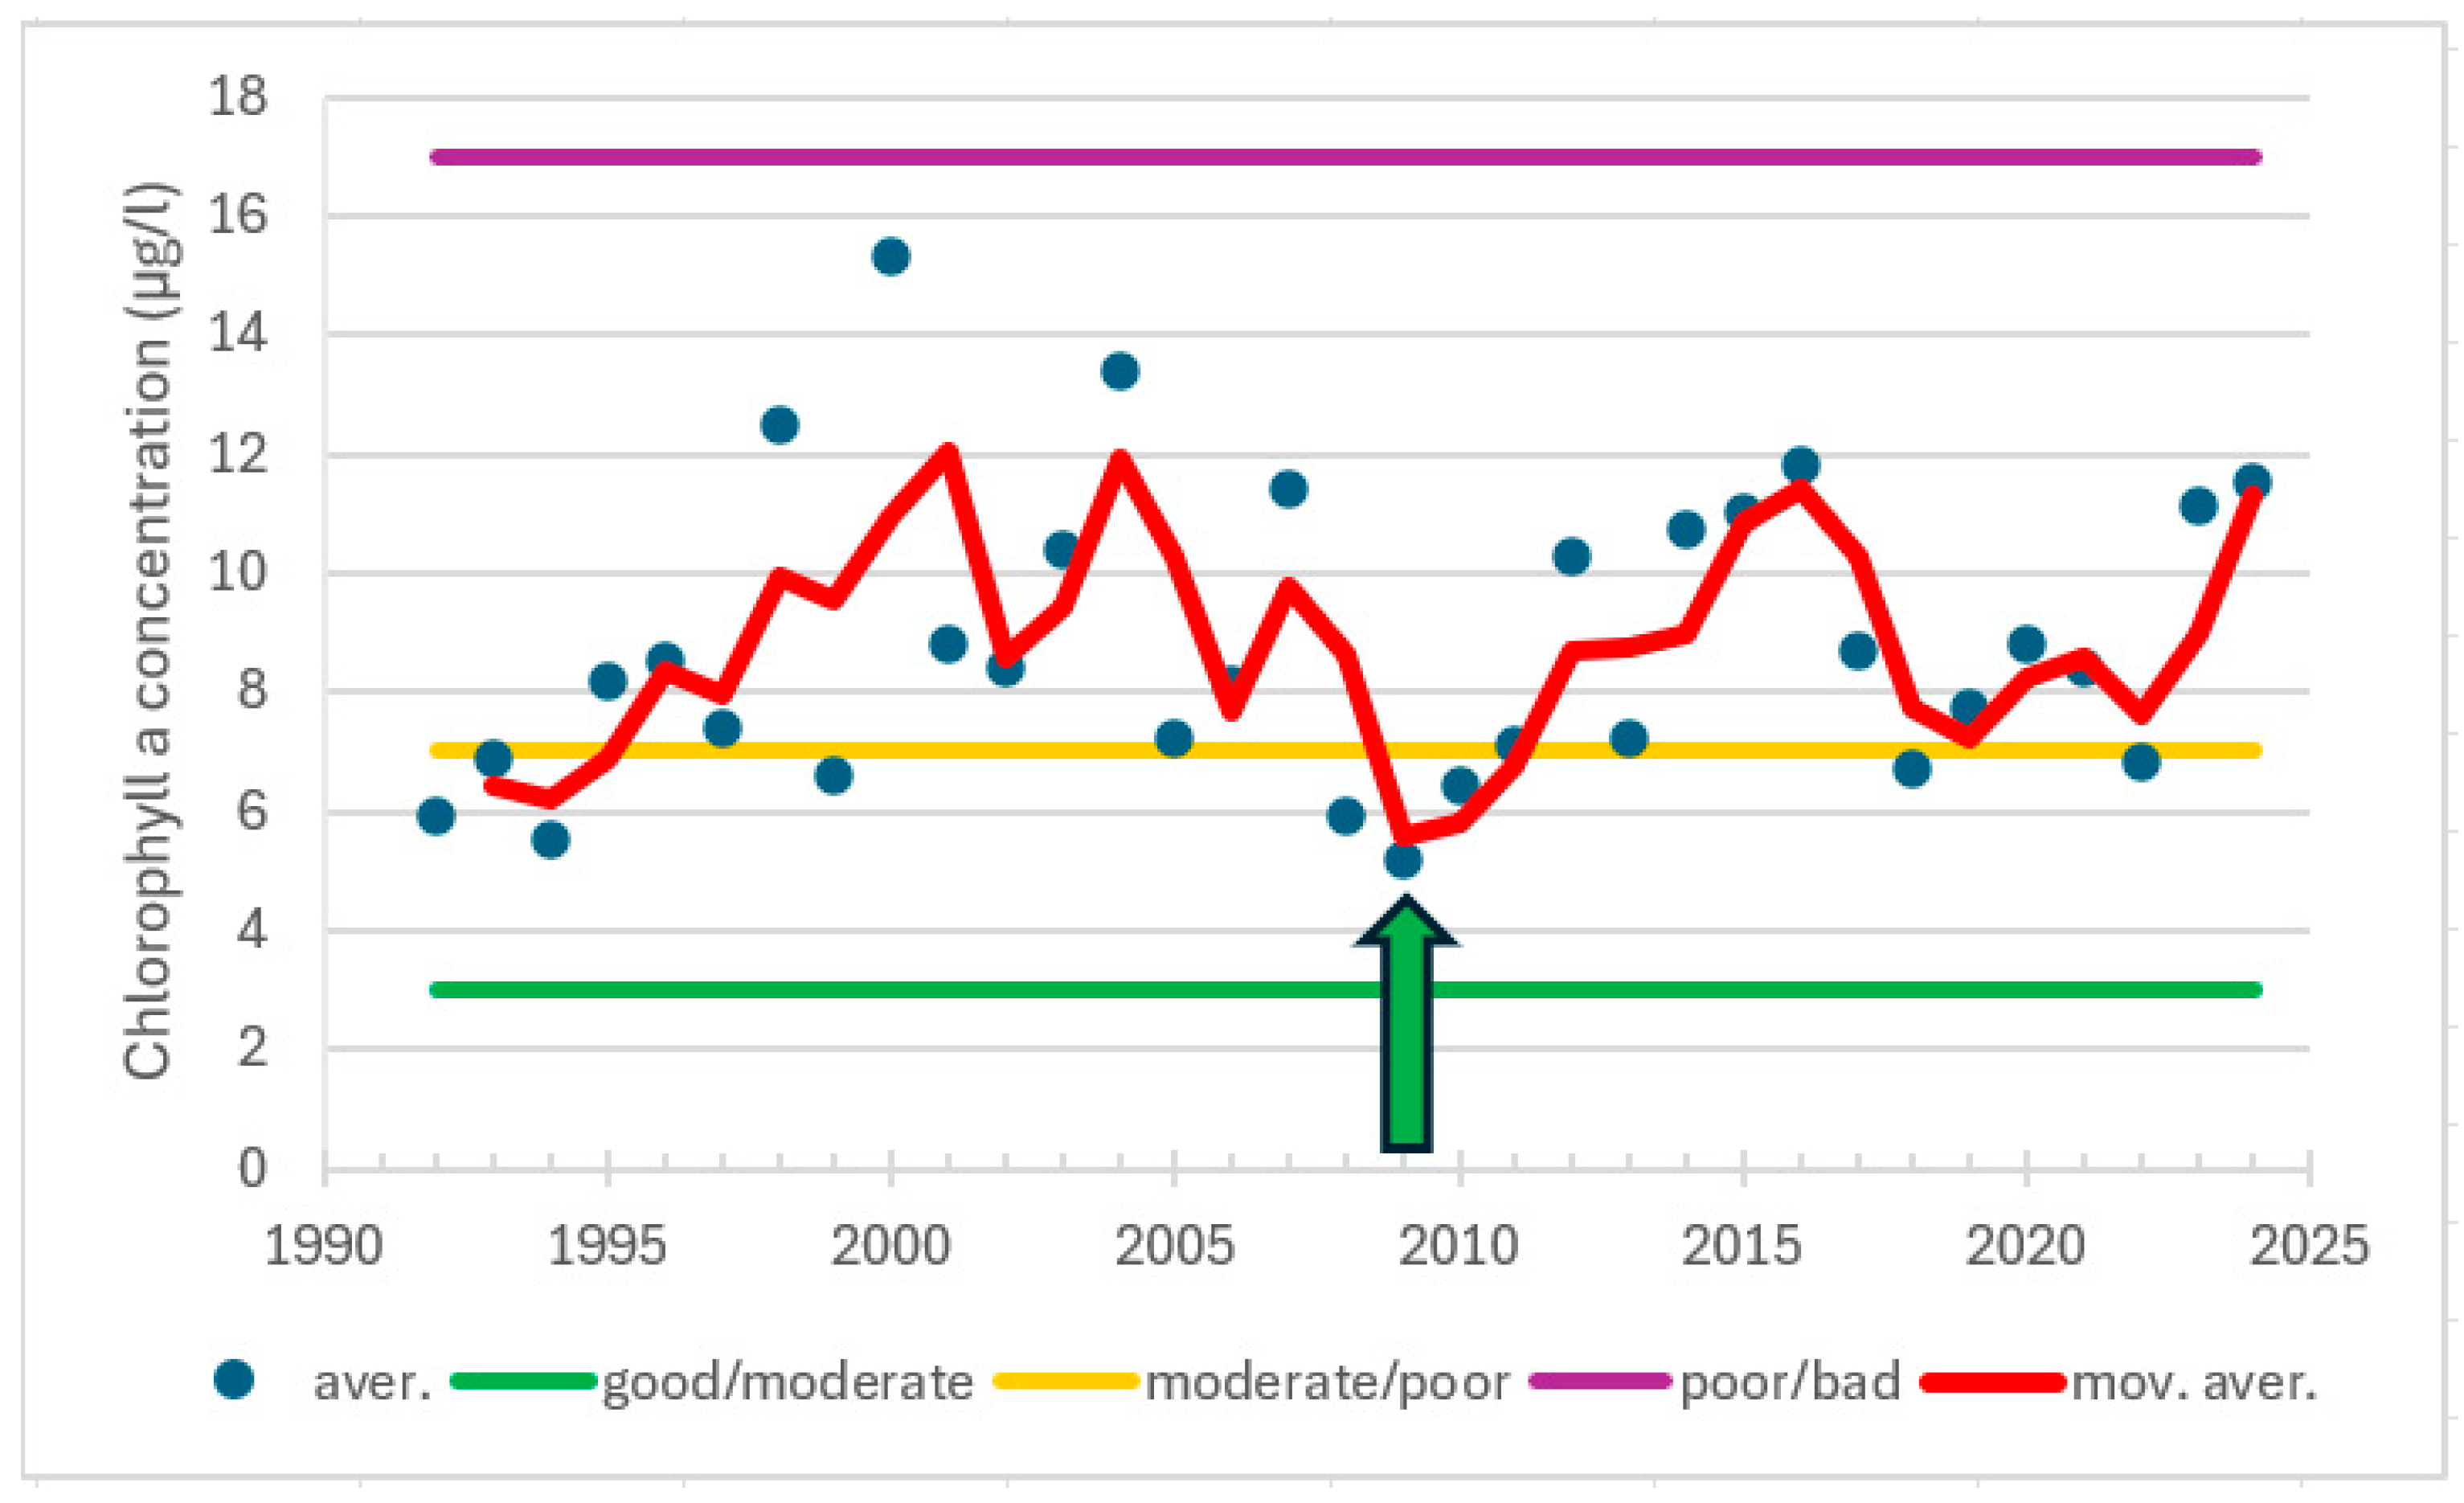
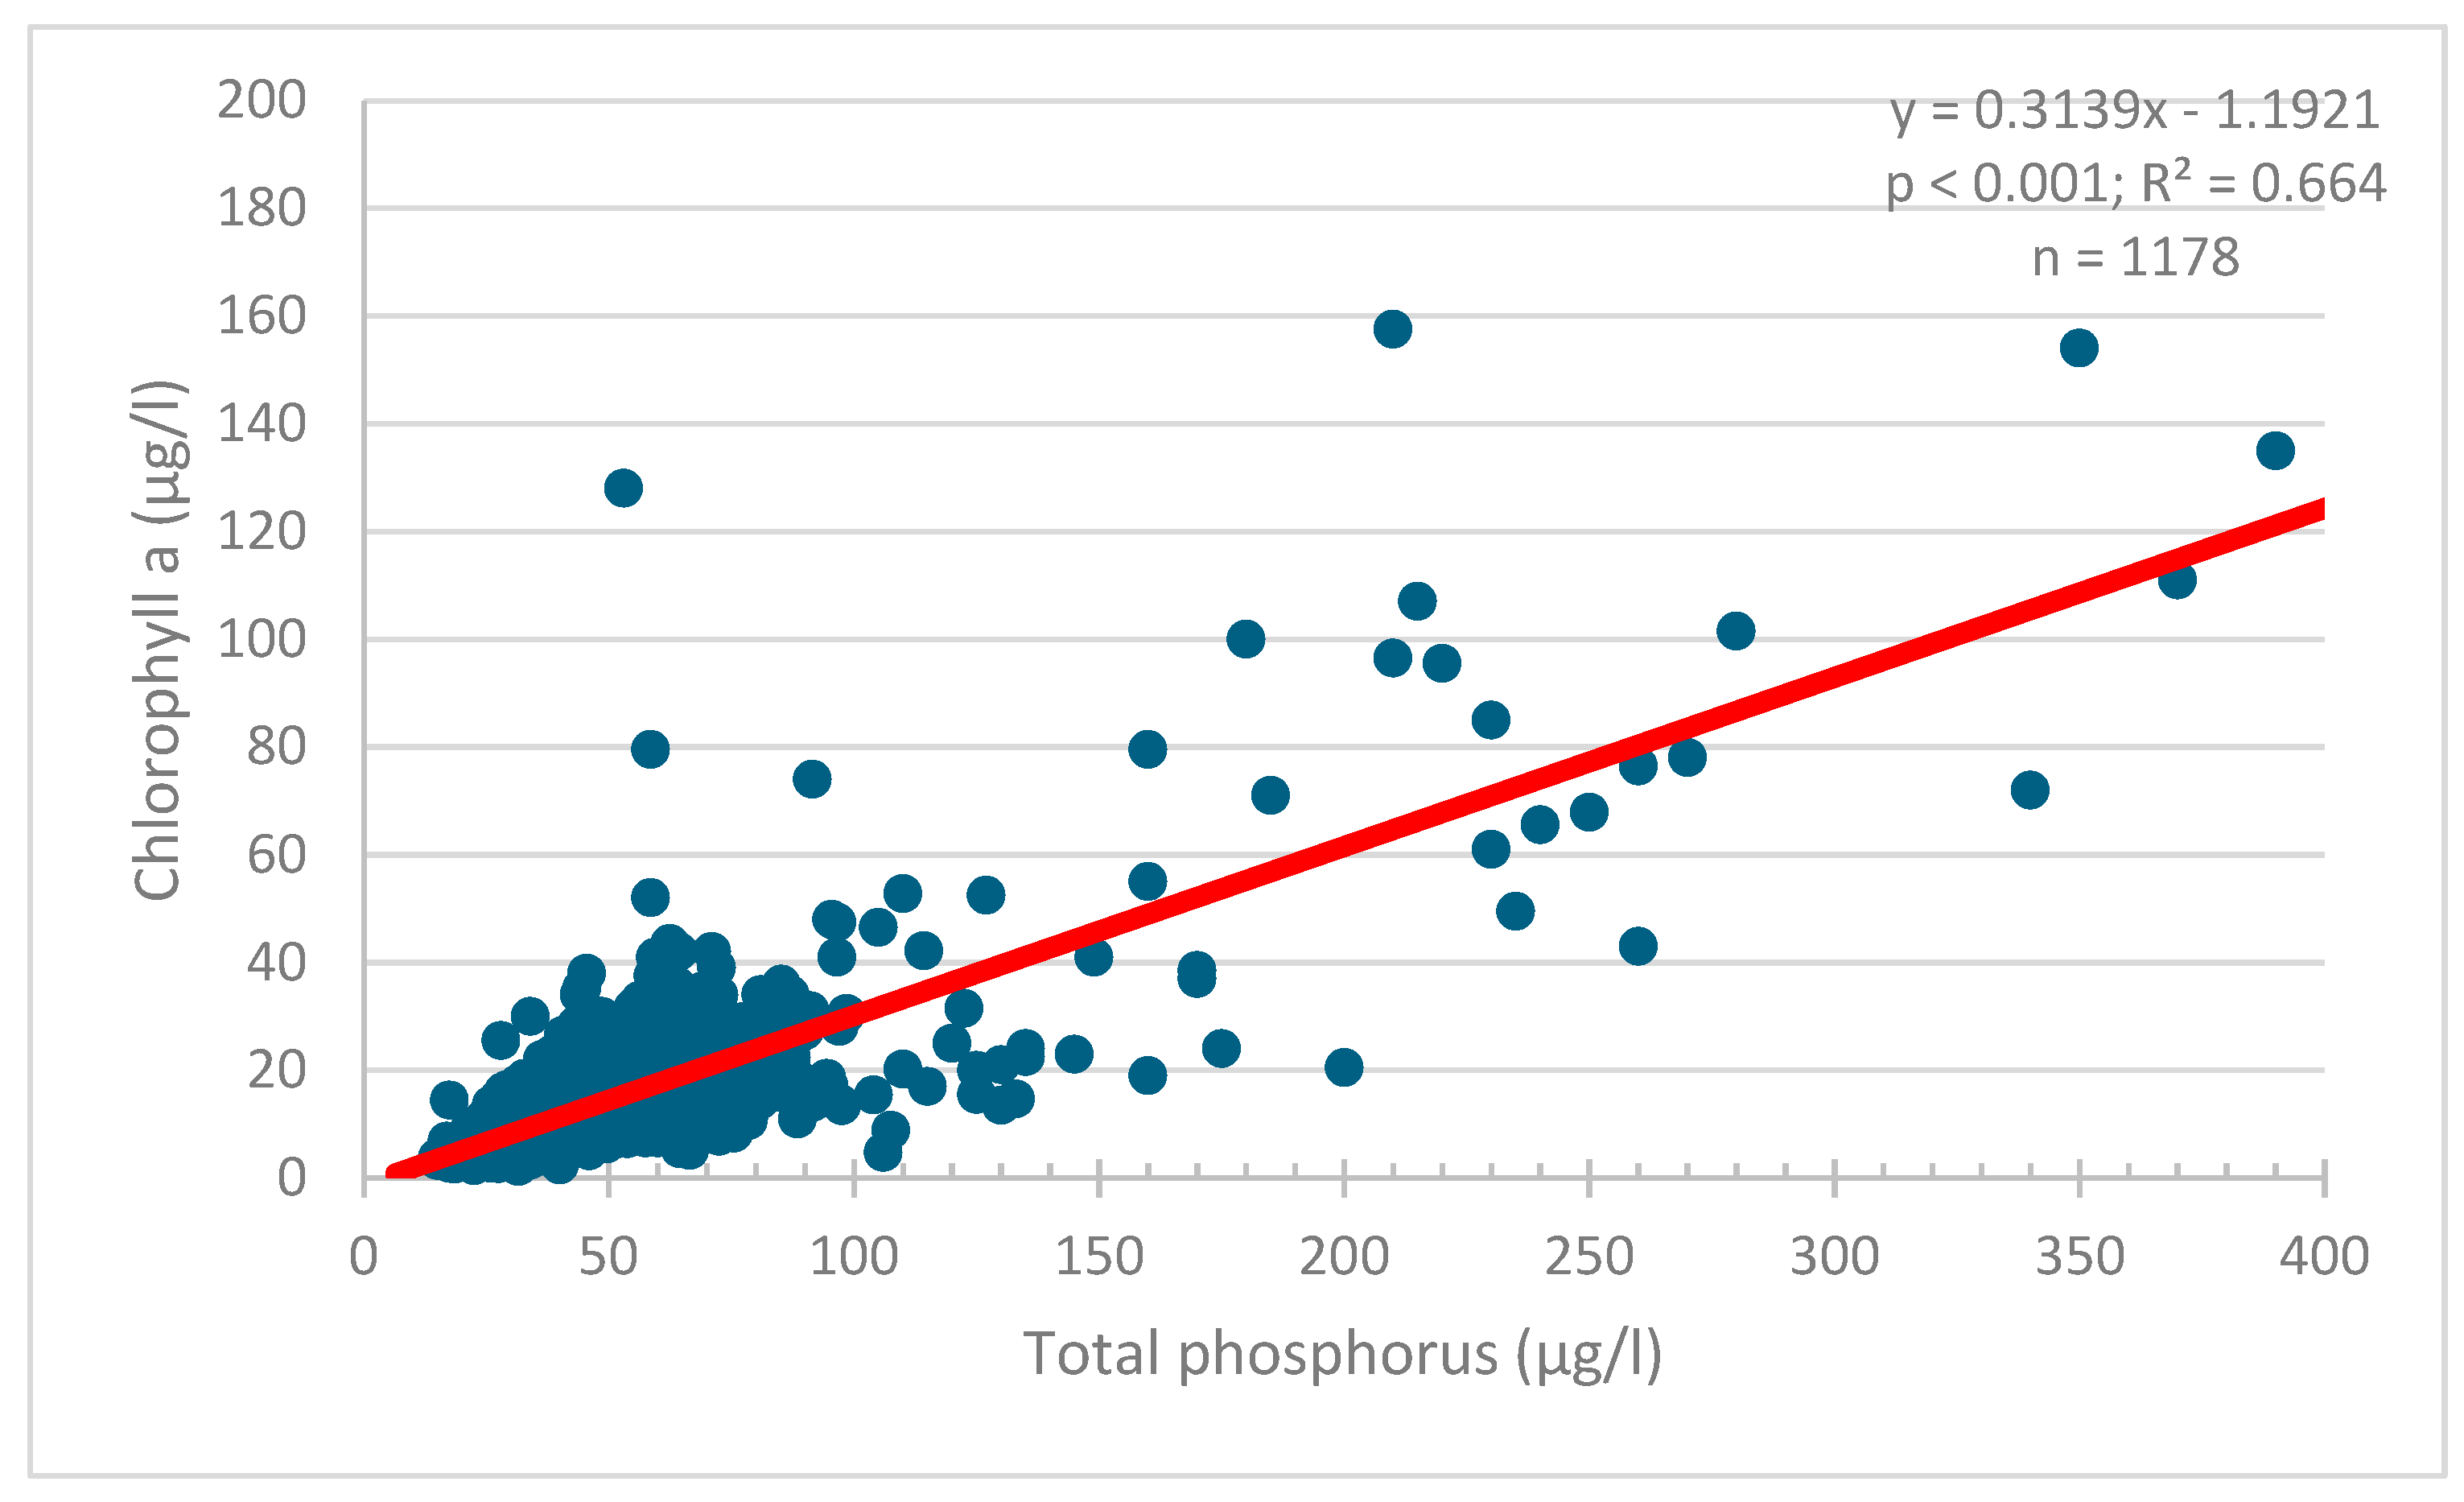
3.2. Responses in Water Quality
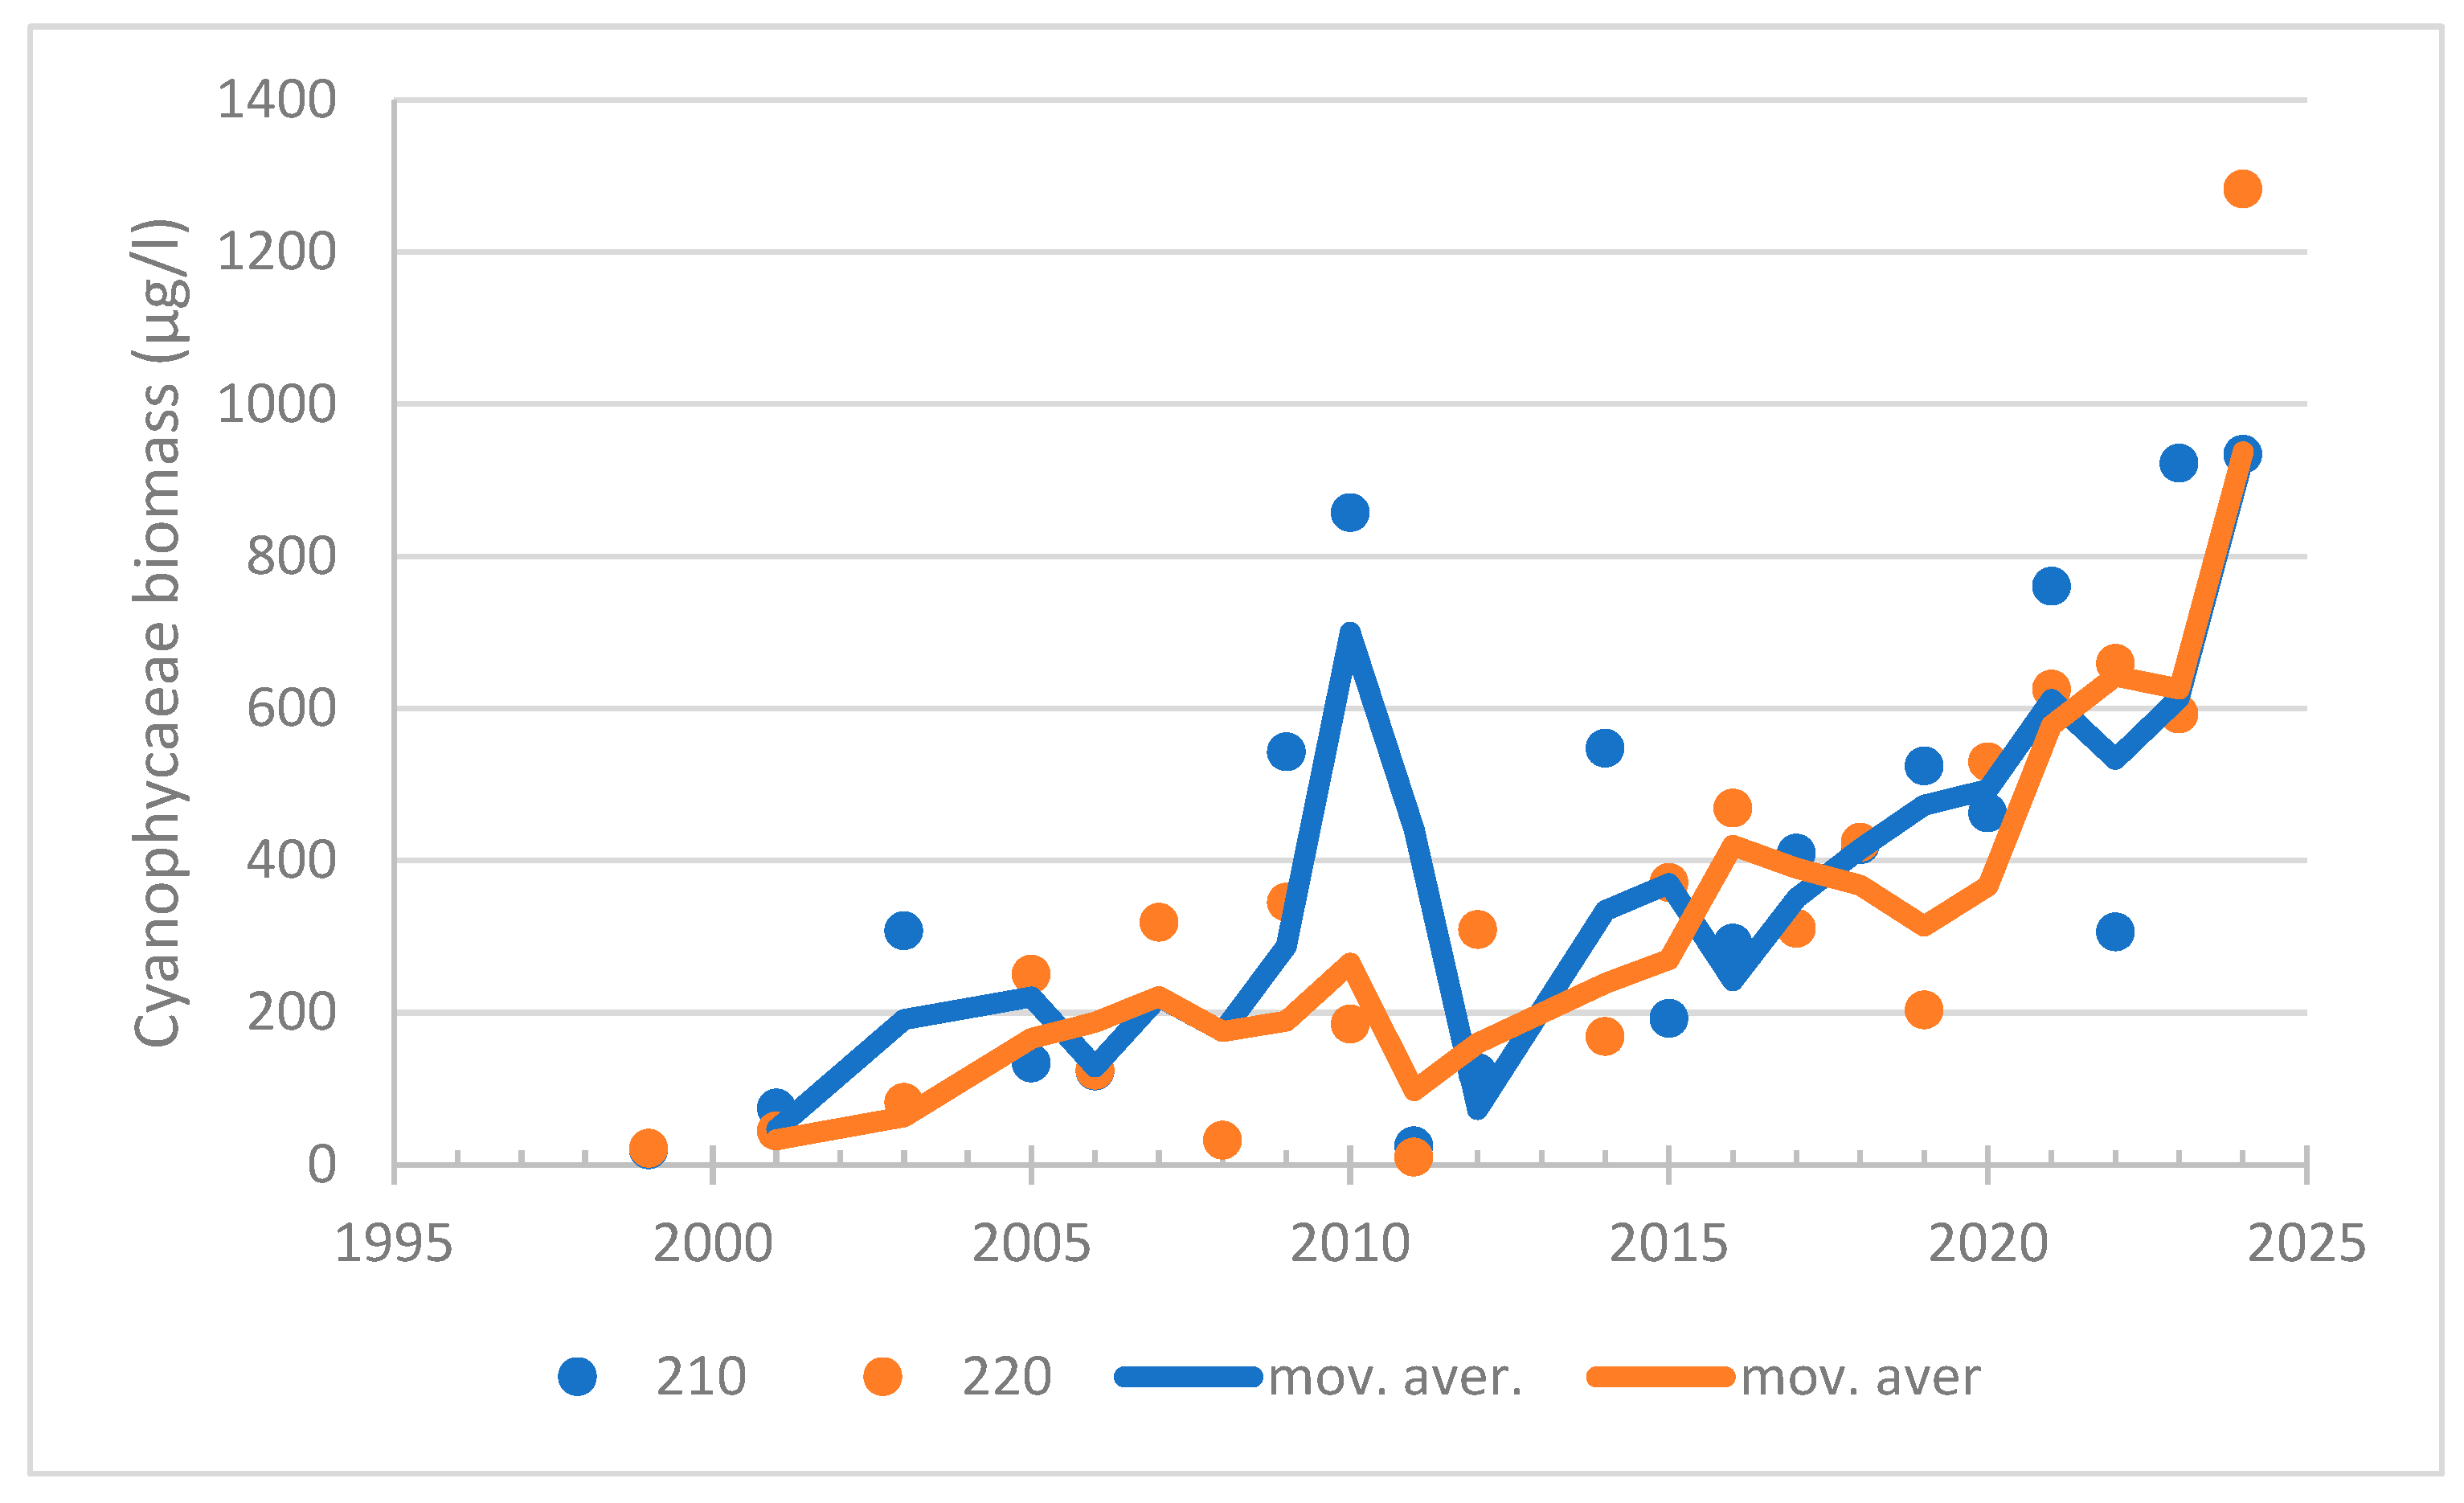
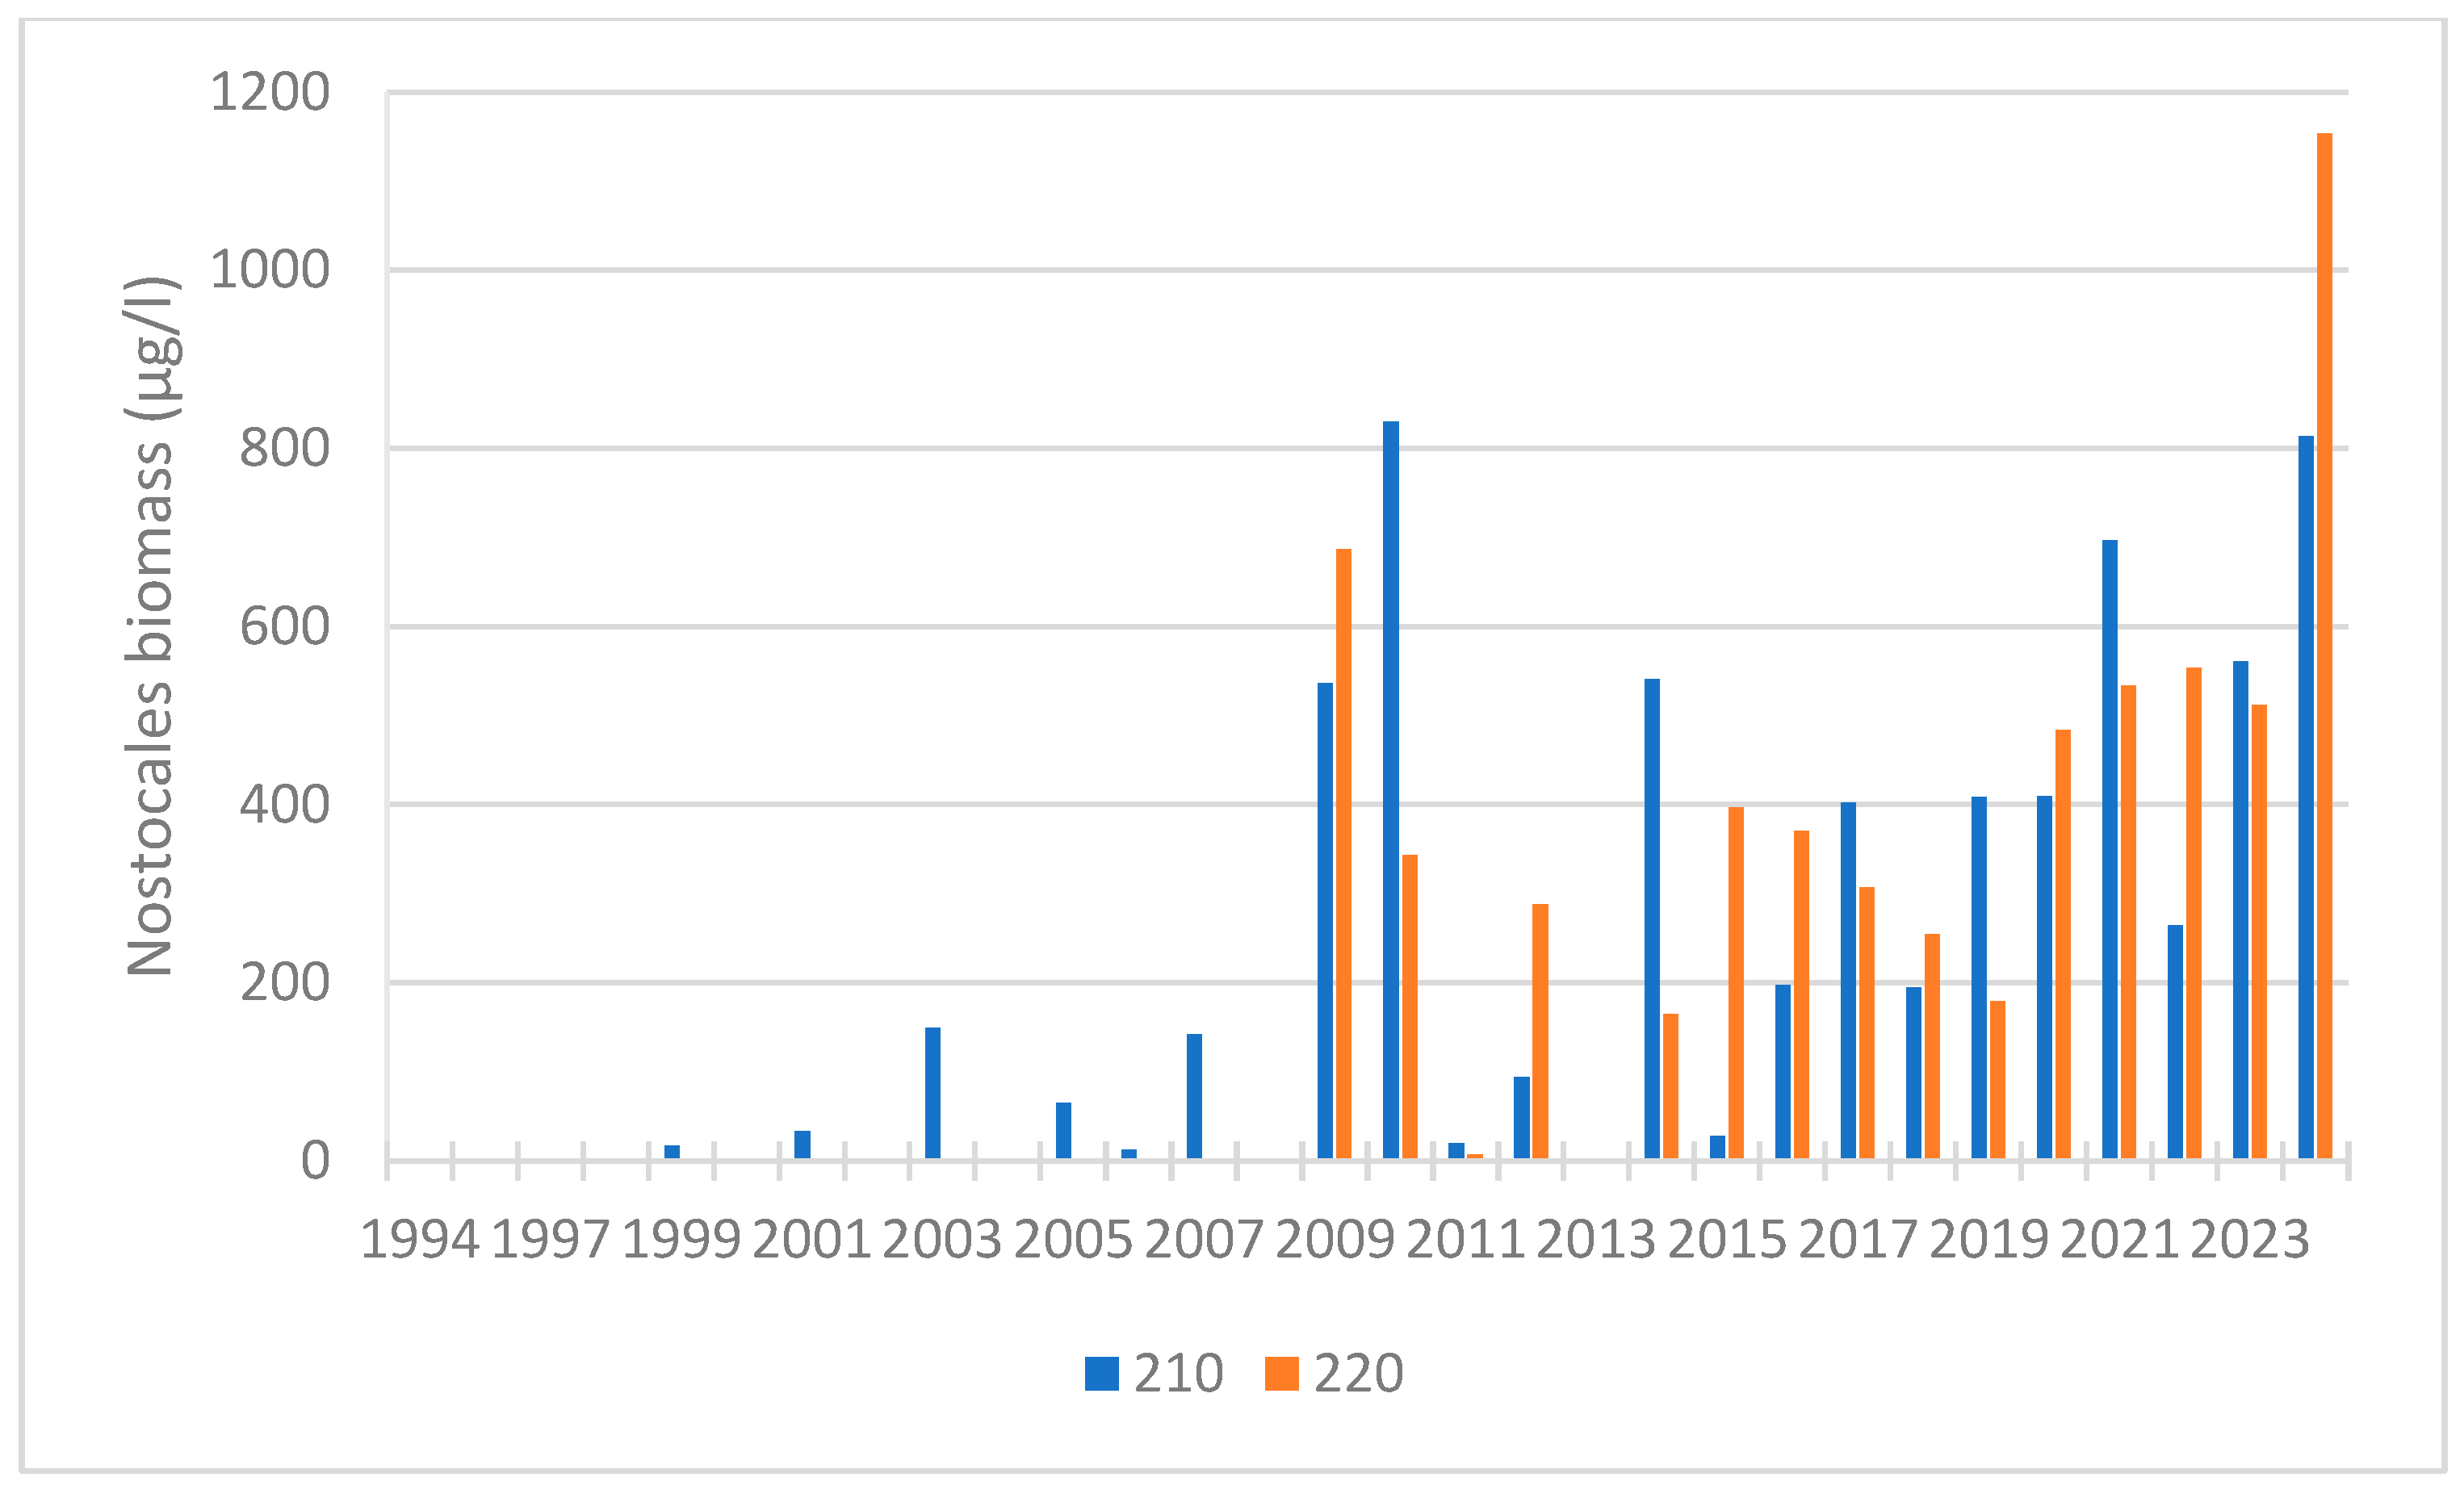
3.3. Nutrient Ratios and Cyanobacteria
3.4. Summary: Data Analysis of 34 Monitoring Stations
4. Discussion
5. Conclusions
Funding
Data Availability Statement
Acknowledgments
Conflicts of Interest
References
- Räsänen, T. Alarism and denialism in environmental science: The case of the nutrient pollution in the Baltic Sea in the 1960’s and 1970’s. Scand. J. Hist. 2018, 43, 646–665. [Google Scholar] [CrossRef]
- Pfister, C. The “1950s Syndrome” and the Transition from a Slow-Going to a Rapid Loss of Global Sustainability. In The Turning Points of Environmental History; Uekötter, F., Ed.; University of Pittsburgh Press: Pittsburgh, PA, USA, 2010. [Google Scholar]
- Myrberg, K.; Leppäranta, M.; Kuosa, H. Itämeren Fysiikka, tila ja Tulevaisuus; Yliopistopaino: Helsinki, Finland, 2006. (In Finnish) [Google Scholar]
- Kaiser, J.; Lerch, M. Sedimentary faecal lipids as indicators of Baltic Sea sewage pollution and population growth since 1860 AD. Environ. Res. 2022, 204, 112305. [Google Scholar] [CrossRef] [PubMed]
- Andersen, J.H.; Carstensen, J.; Conley, D.J.; Dromph, K.; Fleming-Lehtinen, V.; Gustafsson, B.G.; Josefson, A.B.; Norkko, A.; Villnäs, A.; Murray, C. Long-term temporal and spatial trends in eutrophication status of the Baltic Sea. Biol. Rev. 2017, 92, 135–149. [Google Scholar] [CrossRef] [PubMed]
- Räisänen, R. Turun Ympäristön Merialueen Velvoitetarkkailututkimus. Vuosiraportti 2023; Lounais-Suomen vesi- ja ympäristötutkimus Oy: Turku, Finland, 2024; nro 153-24-3683. (In Finnish) [Google Scholar]
- Helminen, H. The Role of Internal Phosphorus Loading in the Archipelago Sea Ecological Status. Water 2025, 17, 248. [Google Scholar] [CrossRef]
- Jumppanen, K.; Mattila, J. Saaristomeren tilan Kehitys ja Siihen Vaikuttavat Tekijät; Lounais-Suomen Vesiensuojeluyhdistys r.y.: Turku, Finland, 1994; p. 82. (In Finnish) [Google Scholar]
- Helminen, H.; Häkkilä, K.; Keränen, M.; Koponen, J.; Laihonen, P.; Ylinen, H. Turun Edustan Merialueen Virtaus- ja Vedenlaatumalli; Suomen Ympäristö: Helsinki, Finland, 1998; p. 203. [Google Scholar]
- Suomela, J. Kirkkaasta Sameaan. Meren Kuormitus ja tila Saaristomerellä ja Ahvenanmaalla; Varsinais-Suomen elinkeino-, liikenne- ja ympäristökeskuksen julkaisuja: Turku, Finland, 2011; Volume 6. (In Finnish) [Google Scholar]
- Regnier, P.; Arndt, S.; Goossens, N.; Volta, C.; Laruelle, G.G.; Lauerwald, R.; Hartmann, J. Modelling Estuarine Biogeochemical Dynamics: From the Local to the Global Scale. Aquat. Geochem. 2013, 19, 591–626. [Google Scholar] [CrossRef]
- Duarte, C.M.; Borja, A.; Carstensen, J.; Elliott, M.; Krause-Jensen, D.; Marba, N. Paradigms in the Recovery of Estuarine and Coastal Ecosystems. Estuar. Coast. 2015, 38, 1202–1212. [Google Scholar] [CrossRef]
- Walve, J.; Sandberg, M.; Larsson, U.; Lännergren, C. A Baltic Sea estuary as a phosphorus source and sink after drastic load reduction: Seasonal and long-term mass balances for the Stockholm inner archipelago for 1968–2015. Biogeosciences 2018, 15, 3003–3025. [Google Scholar] [CrossRef]
- Helminen, H.; Inkala, A. Modelled Water and Phosphorus Transports in the Archipelago Sea and through the Åland Sea and Northern Baltic Sea and Their Links to Water Quality. J. Mar. Sci. Eng. 2024, 12, 1252. [Google Scholar] [CrossRef]
- Available online: https://www.turunvesihuolto.fi/vesi-lehti/hyppaa-turkulaisen-juomaveden-historiaan/ (accessed on 10 April 2025). (In Finnish).
- Available online: https://www.vesilaitosmuseo.fi/historia/ (accessed on 10 April 2025). (In Finnish).
- Available online: https://issuu.com/vesihuolto/docs/vesipiste_1_2020_issuu/s/10577429 (accessed on 10 April 2025). (In Finnish).
- Becker, S.; Aoyama, M.; Woodward, E.M.S.; Bakker, K.; Coverly, S.; Mahaffey, C.; Tanhua, T. GO-SHIP Repeat Hydrography Nutrient Manual: The Precise and Accurate Determination of Dissolved Inorganic Nutrients in Seawater, Using Continuous Flow Analysis Methods. Front. Mar. Sci. 2020, 7, 581790. [Google Scholar] [CrossRef]
- Strickland, J.D.H.; Parsons, T.R. A Practical Handbook of Sea-Water Analysis, 2nd ed.; Fisheries Research Board of Canada: Ottawa, ON, USA, 1972; Volume 167, p. 311. [Google Scholar]
- SFS-EN ISO/IEC 17025:2017; General Requirements for the Competence of Testing and Calibration Laboratories. ISO: Geneva, Switzerland, 2017.
- SFS 3026; Determination of Phosphorus in Water. Finnish Standards Association SFS: Helsinki, Finland, 1986; 11p.
- SFS 3025; Determination of Phosphate in Water. Finnish Standards Association SFS: Helsinki, Finland, 1986; 10p.
- U.S. EPA. Methods for Chemical Analysis of Water and Wastes. EPA 600/4-79-020, Method 353.2; Environmental Protection Agency, Environmental Monitoring and Support Laboratory: Cincinnati, OH, USA, 1983.
- SFS 3032; Determination of Ammonia in Water. Finnish Standards Association SFS: Helsinki, Finland, 1976; 6p.
- SFS 5772; Determination of Chlorophyll a in Water. Extraction with Ethanol. Spectrophotometric Method. Finnish Standards Association SFS: Helsinki, Finland, 1993; 3p.
- Vuorio, K.; Lehtinen, S.; Järvinen, M.; Hällfors, H. Kasviplanktonseurannan Menetelmäohje Vesien- ja Merenhoitoon; Suomen Ympäristökeskus: Helsinki, Finland, 2022. (In Finnish) [Google Scholar]
- BS EN 15204:2006; Water Quality—Guidance Standard on the Enumeration of Phytoplankton Using Inverted Microscopy (Utermöhl Technique). British Standards Institute: London, UK, 2006. [CrossRef]
- HELCOM 2021. Guidelines Concerning Phytoplankton Species Composition, Abundance and Biomass. Updated November 2021. Manual for Marine Monitoring in the COMBINE Programme of HELCOM, Part C, Annex 6. Available online: https://helcom.fi/wp-content/uploads/2020/01/HELCOM-Guidelines-for-monitoring-of-phytoplankton-species-composition-abundance-and-biomass.pdf (accessed on 10 April 2025).
- Andersson, A.; Höglander, H.; Karlsson, C.; Huseby, S. Key role of phosphorus and nitrogen in regulating cyanobacterial community composition in the northern Baltic Sea. Estuar. Coast Shelf Sci. 2015, 164, 161–171. [Google Scholar] [CrossRef]
- Ptacnik, R.; Andersen, T.; Tamminen, T. Performance of the Redfield Ratio and a Family of Nutrient Limitation Indicators as Thresholds for Phytoplankton N vs. P Limitation. Ecosystems 2010, 13, 1201–1214. [Google Scholar] [CrossRef]
- Kendall, M.G. Rank Correlation Measures; Charles Griffin: London, UK, 1975. [Google Scholar]
- Fleming, V.; Berninger, K.; Aikola, T.; Huttunen, M.; Iho, A.; Kuosa, H.; Niskanen, L.; Piiparinen, J.; Räike, A.; Salo, M.; et al. Rannikkovesien Ravinteiden Kuormituskatot ja Kuormituksen Vähentämisen Keinoja: Loppuraportti; Valtioneuvoston Selvitys- ja Tutkimustoiminnan Julkaisusarja: Helsinki, Finland, 2023; Volume 45. (In Finnish) [Google Scholar]
- Lignell, R.; Miettunen, E.; Kuosa, H.; Ropponen, J.; Tuomi, L.; Puttonen, I.; Lukkari, K.; Korppoo, M.; Huttunen, M.; Kaurila, K.; et al. Modeling how eutrophication in northern Baltic coastal zone is driven by new nutrient inputs, internal loading, and 3D hydrodynamics. J. Mar. Syst. 2025, 249, 104049. [Google Scholar] [CrossRef]
- Kauppila, P. Phytoplankton Quantity as an Indicator of Eutrophication in Finnish Coastal Waters. Application Within the Water Framework Directive; Monographs of the Boreal Environment Research No. 31; Finnish Environment Institute: Helsinki, Finland, 2007; 58p, Available online: http://hdl.handle.net/10138/39341 (accessed on 12 April 2025).
- Zakrisson, A.; Larsson, U. Regulation of heterocyst frequency in Baltic Sea Aphanizomenon sp. J. Plankton Res. 2014, 36, 1357–1367. [Google Scholar] [CrossRef]
- Klawonn, I.; Nahar, N.; Walve, J.; Andersson, B.; Olofsson, M.; Sveden, J.B.; Littmann, S.; Whitehouse, M.J.; Kuypers, M.M.M.; Ploug, H. Cell-specific nitrogen- and carbon-fixation of cyanobacteria in a temperate marine system (Baltic Sea). Environ. Microbiol. 2016, 18, 4596–4609. [Google Scholar] [CrossRef] [PubMed]
- Granéli, E.; Granéli, W. Nitrogen in Inland Sea. In Nitrogen in the Marine Environment; Capone, D.G., Bronk, D.A., Mulholland, M.R., Carpenter, E.J., Eds.; Elsevier: Amsterdam, The Netherlands, 2008; pp. 683–704. [Google Scholar]
- Lagus, A.; Suomela, J.; Sipura, J.; Helminen, H. Impacts of nutrient enrichment and sediment on phytoplankton community structure in the northern Baltic Sea. Hydrobiologia 2007, 579, 351–368. [Google Scholar] [CrossRef]
- Vahtera, E.; Conley, D.J.; Gustafsson, B.G.; Kuosa, H.; Pitkänen, H.; Savchuk, O.P.; Tamminen, T.; Viitasalo, M.; Voss, M.; Wasmund, N.; et al. Internal ecosystem feedbacks enhance nitrogen-fixing cyanobacteria blooms and complicate management in the Baltic Sea. Ambio 2007, 36, 186–194. [Google Scholar] [CrossRef] [PubMed]
- Neumann, T.; Schernewski, G. An ecological model evaluation of two nutrient abatement strategies for the Baltic Sea. J. Mar. Syst. 2005, 56, 195–206. [Google Scholar] [CrossRef]
- Larsson, U.; Elmgren, R.; Wulff, F. Euthropication and the Baltic Sea: Causes and consequences. Ambio 1985, 14, 9–14. [Google Scholar]


| Station | Location ETRS-TM35FIN | Depth (m) | Chl (µg/L) | Ecol. Status |
|---|---|---|---|---|
| 260 | 6712516 231712 | 3 | 11.9 | poor |
| 190 | 6709098 237337 | 8 | 16.5 | poor |
| 175 | 6704772 240056 | 7.5 | 16.7 | poor |
| 210 | 6796584 231541 | 21.6 | 9.5 | poor |
| 220 | 6703331 230194 | 51.8 | 6.98 | moderate |
| Seili | 6690561 220867 | 50.6 | 5.3 | moderate |
| Station | Years | Season | Parameter | Kendall’s Tau | p-Value | S-Value | Result |
|---|---|---|---|---|---|---|---|
| Raisio, 260 | 2005−2024 | winter | NH4-N | −0.776 | <0.0001 | −147 | decreasing trend |
| 2004−2024 | summer | Chl | −0.558 | 0.001 | −116 | decreasing trend | |
| Kaarina, 175 | 1969−1985 | summer | TP | −0.578 | 0.001 | −78 | decreasing trend |
| 1986−2024 | summer | TP | 0.140 | 0.338 | 42 | no trend | |
| Turku, 190 | 1983−2008 | summer | Chl | −0.365 | 0.012 | −108 | decreasing trend |
| 2009−2024 | summer | Chl | −0.127 | 0.527 | −15 | no trend | |
| Airisto, 210 | 1981−2007 | summer | TP | 0.466 | 0.001 | 151 | increasing trend |
| Airisto, 220 | 1978−1998 | summer | Chl | 0.521 | 0.002 | 87 | increasing trend |
| 1998−2010 | summer | Chl | 0.520 | 0.017 | −40 | decreasing trend |
| Station | Years | Season | Parameter | Kendall’s tau | p-Value | S-Value | Result |
|---|---|---|---|---|---|---|---|
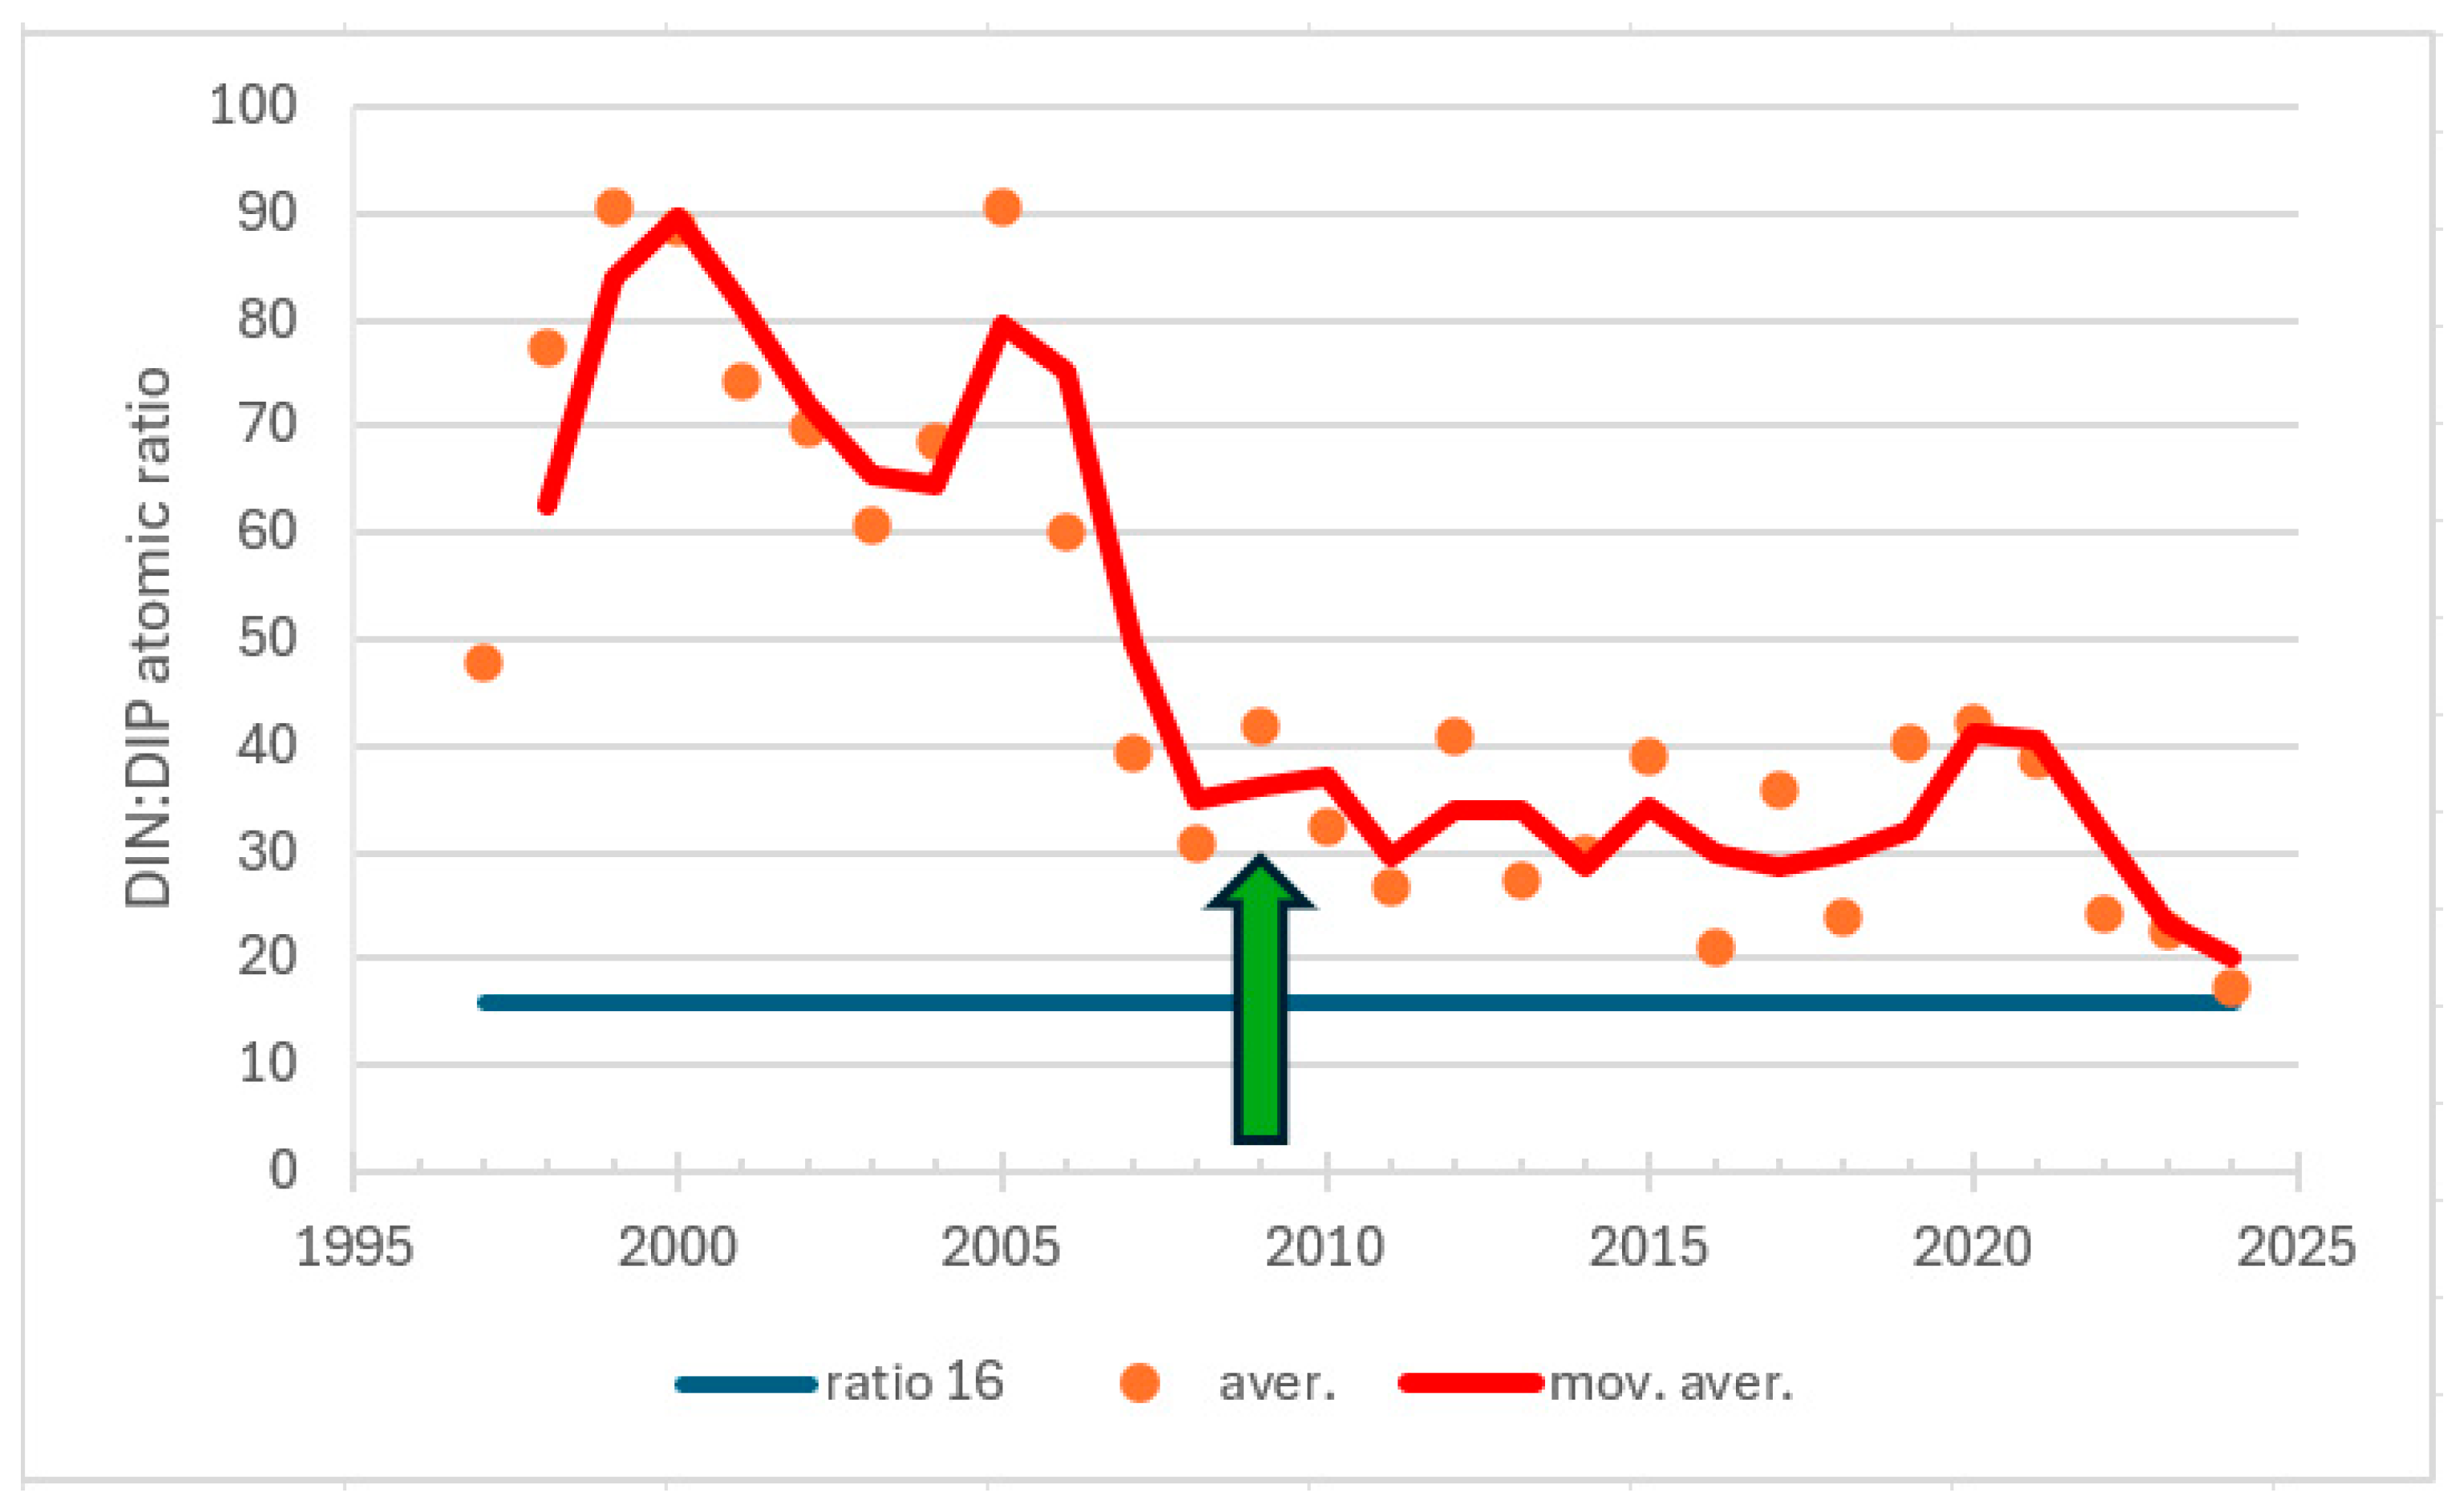
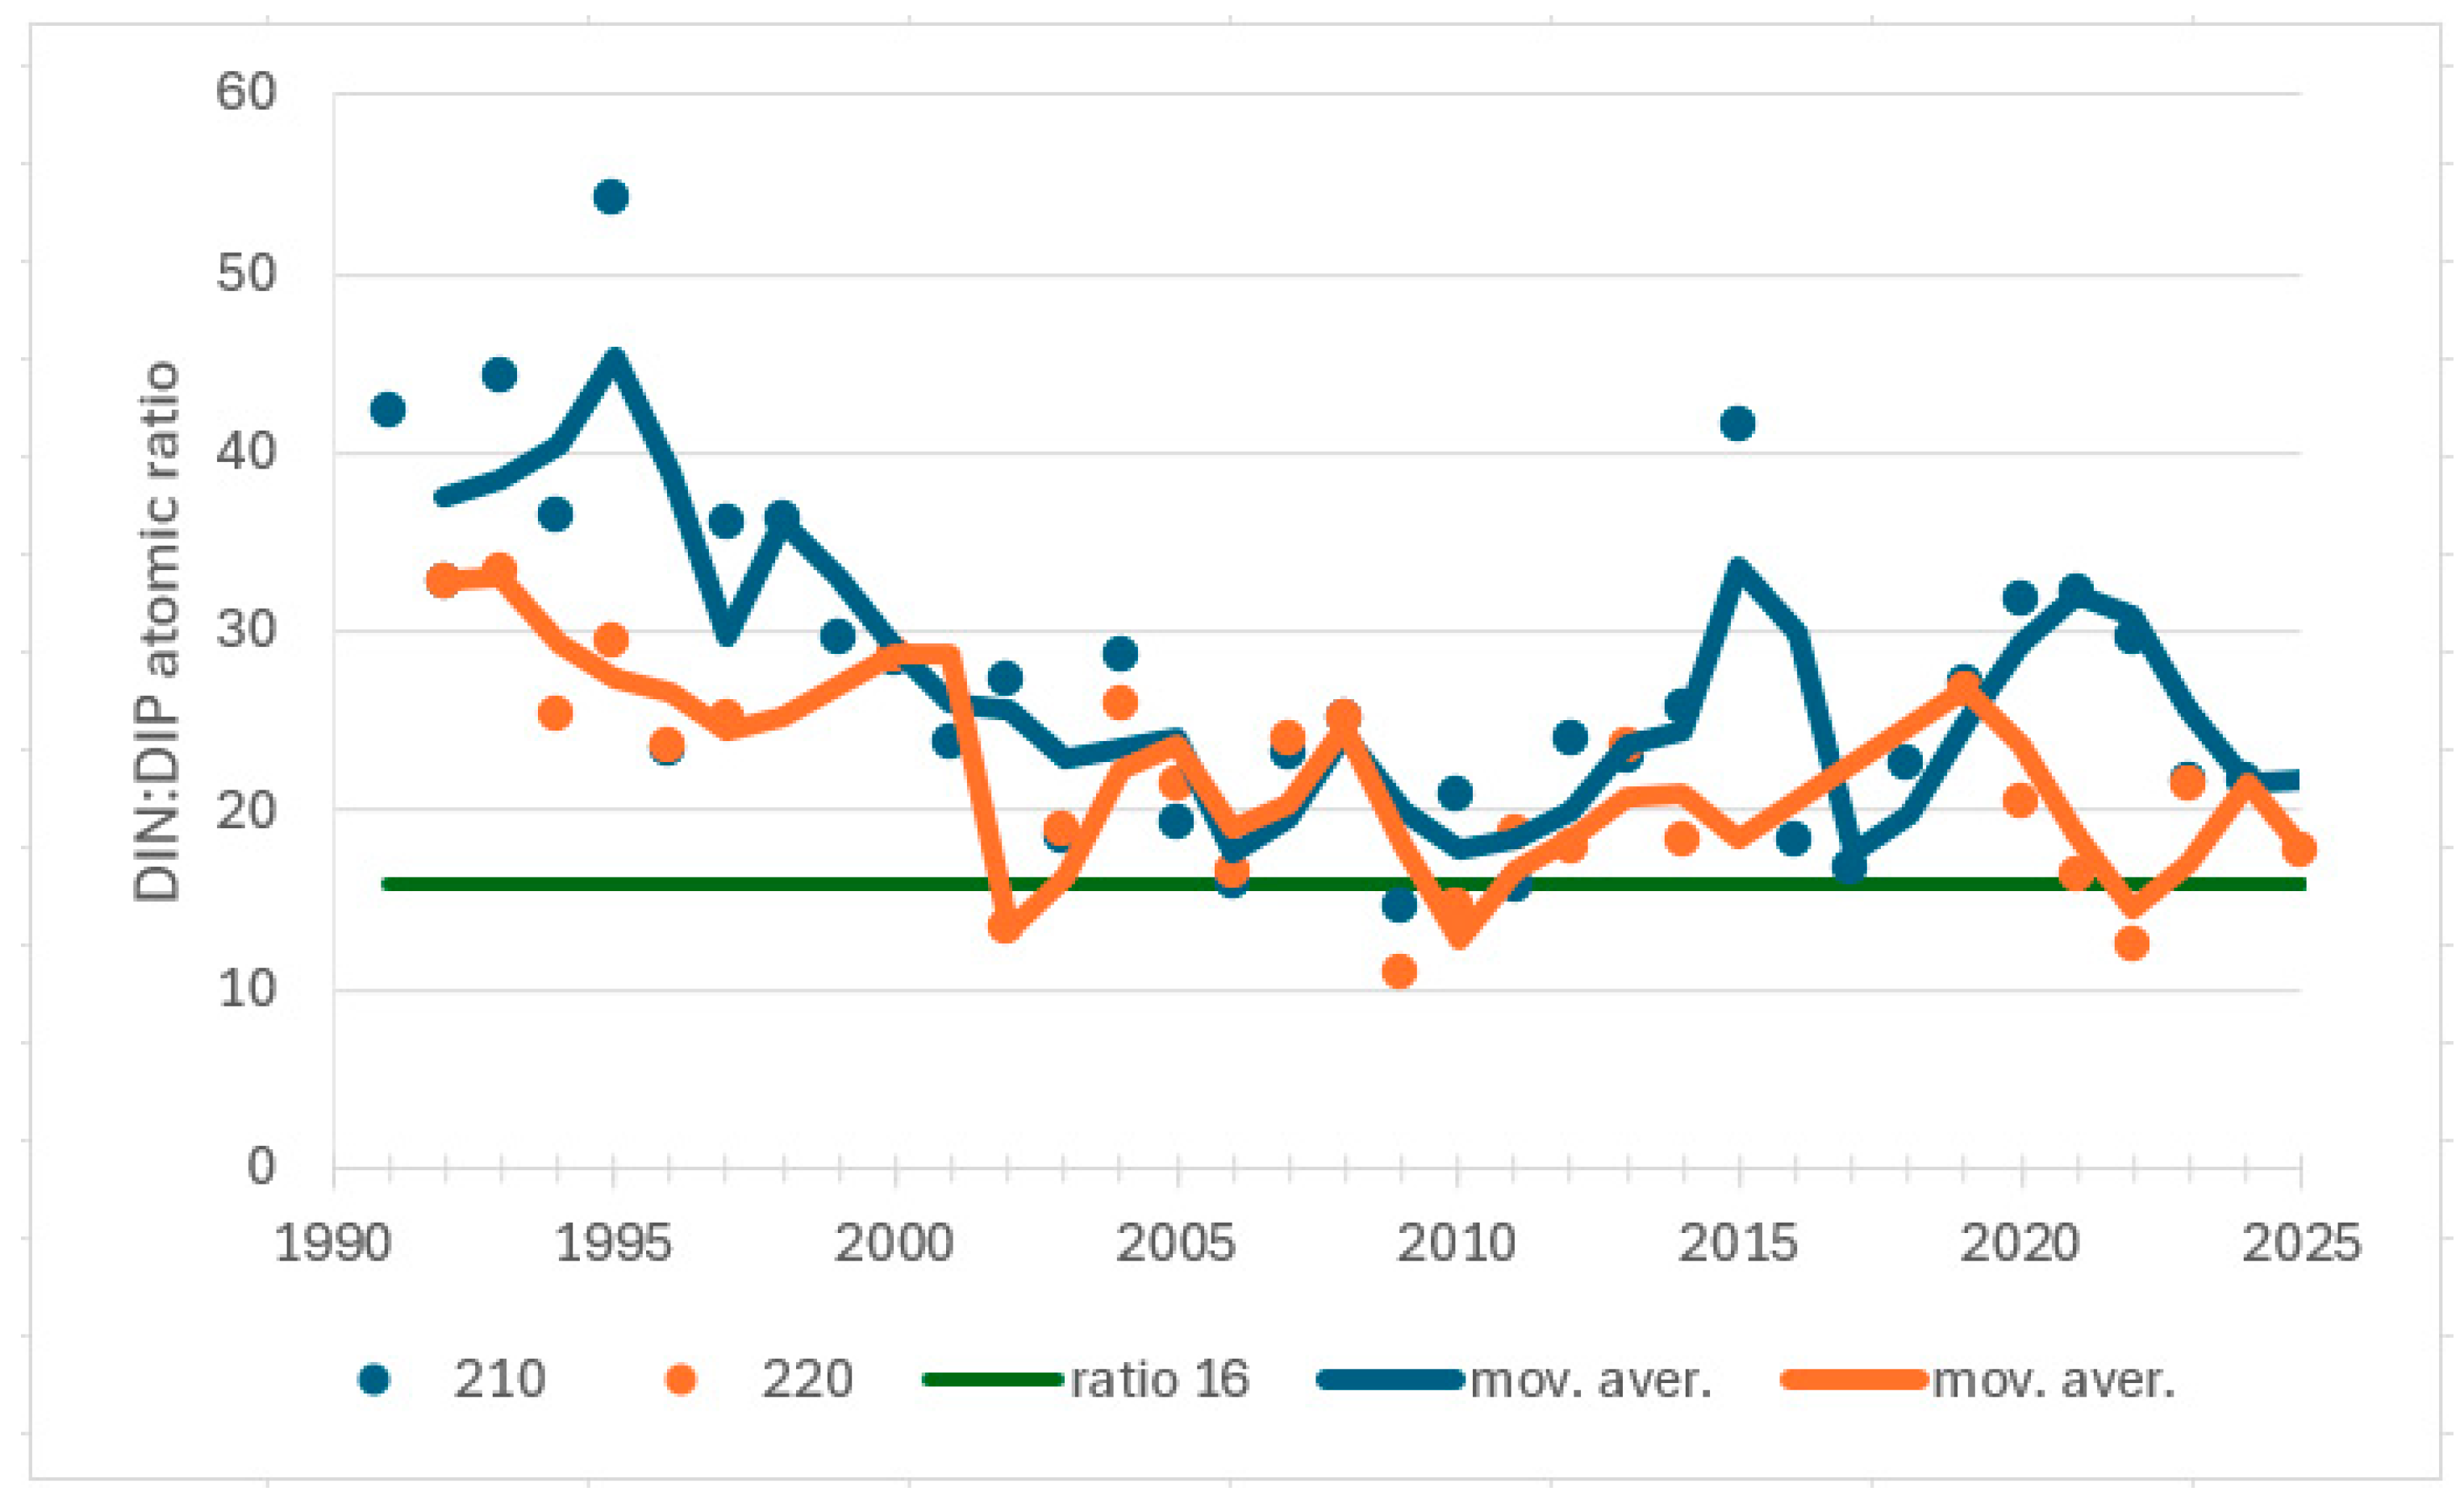
| Airisto, 210 | 1991–2009 | winter | DIN:DIP | −0.626 | <0.0001 | −107 | decreasing trend |
| 2010–2024 | winter | DIN:DIP | 0.219 | 0.276 | 23 | no trend | |
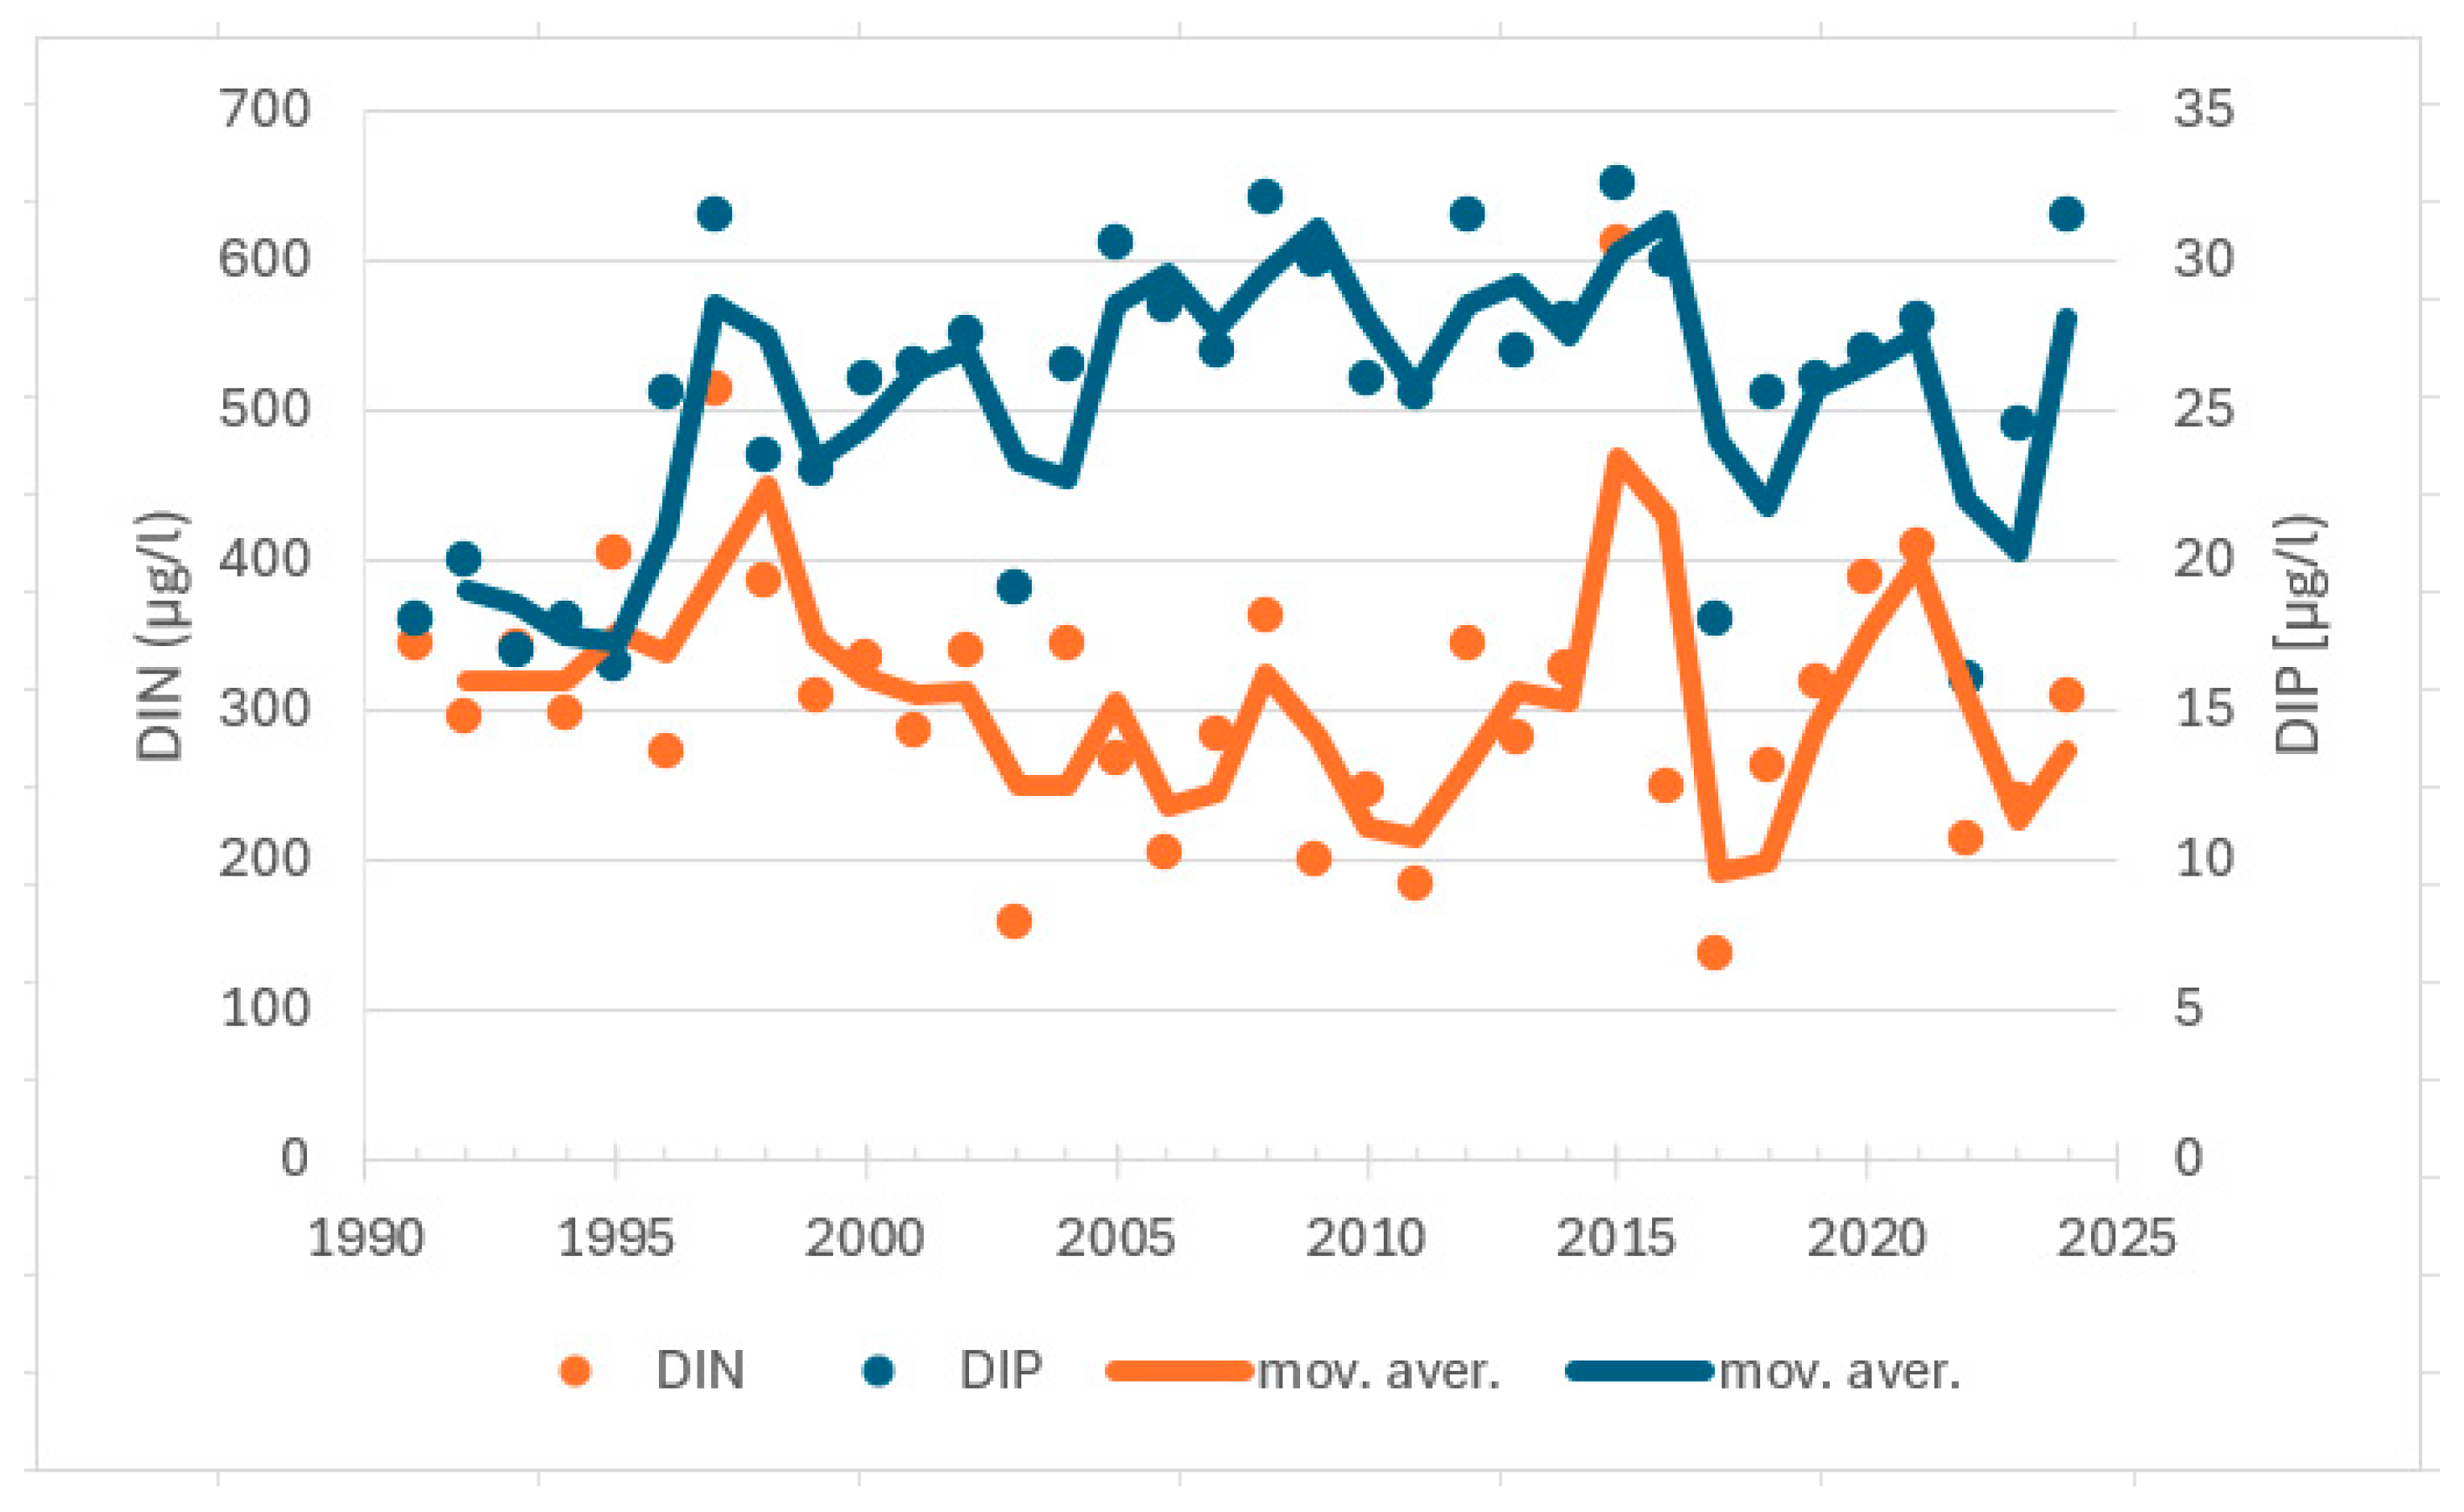
| 1991–2009 | winter | DIN | −0.287 | 0.093 | −49 | no trend | |
| 2010–2024 | winter | DIN | 0.067 | 0.767 | 7 | no trend | |
| 1991–2009 | winter | DIP | 0.582 | 0.001 | 99 | increasing trend | |
| 2010–2024 | winter | DIP | −0.078 | 0.727 | −8 | no trend | |
| 2011–2024 | summer | cyanob. Nostocales | 0.615 | 0.004 | 48 | increasing trend | |
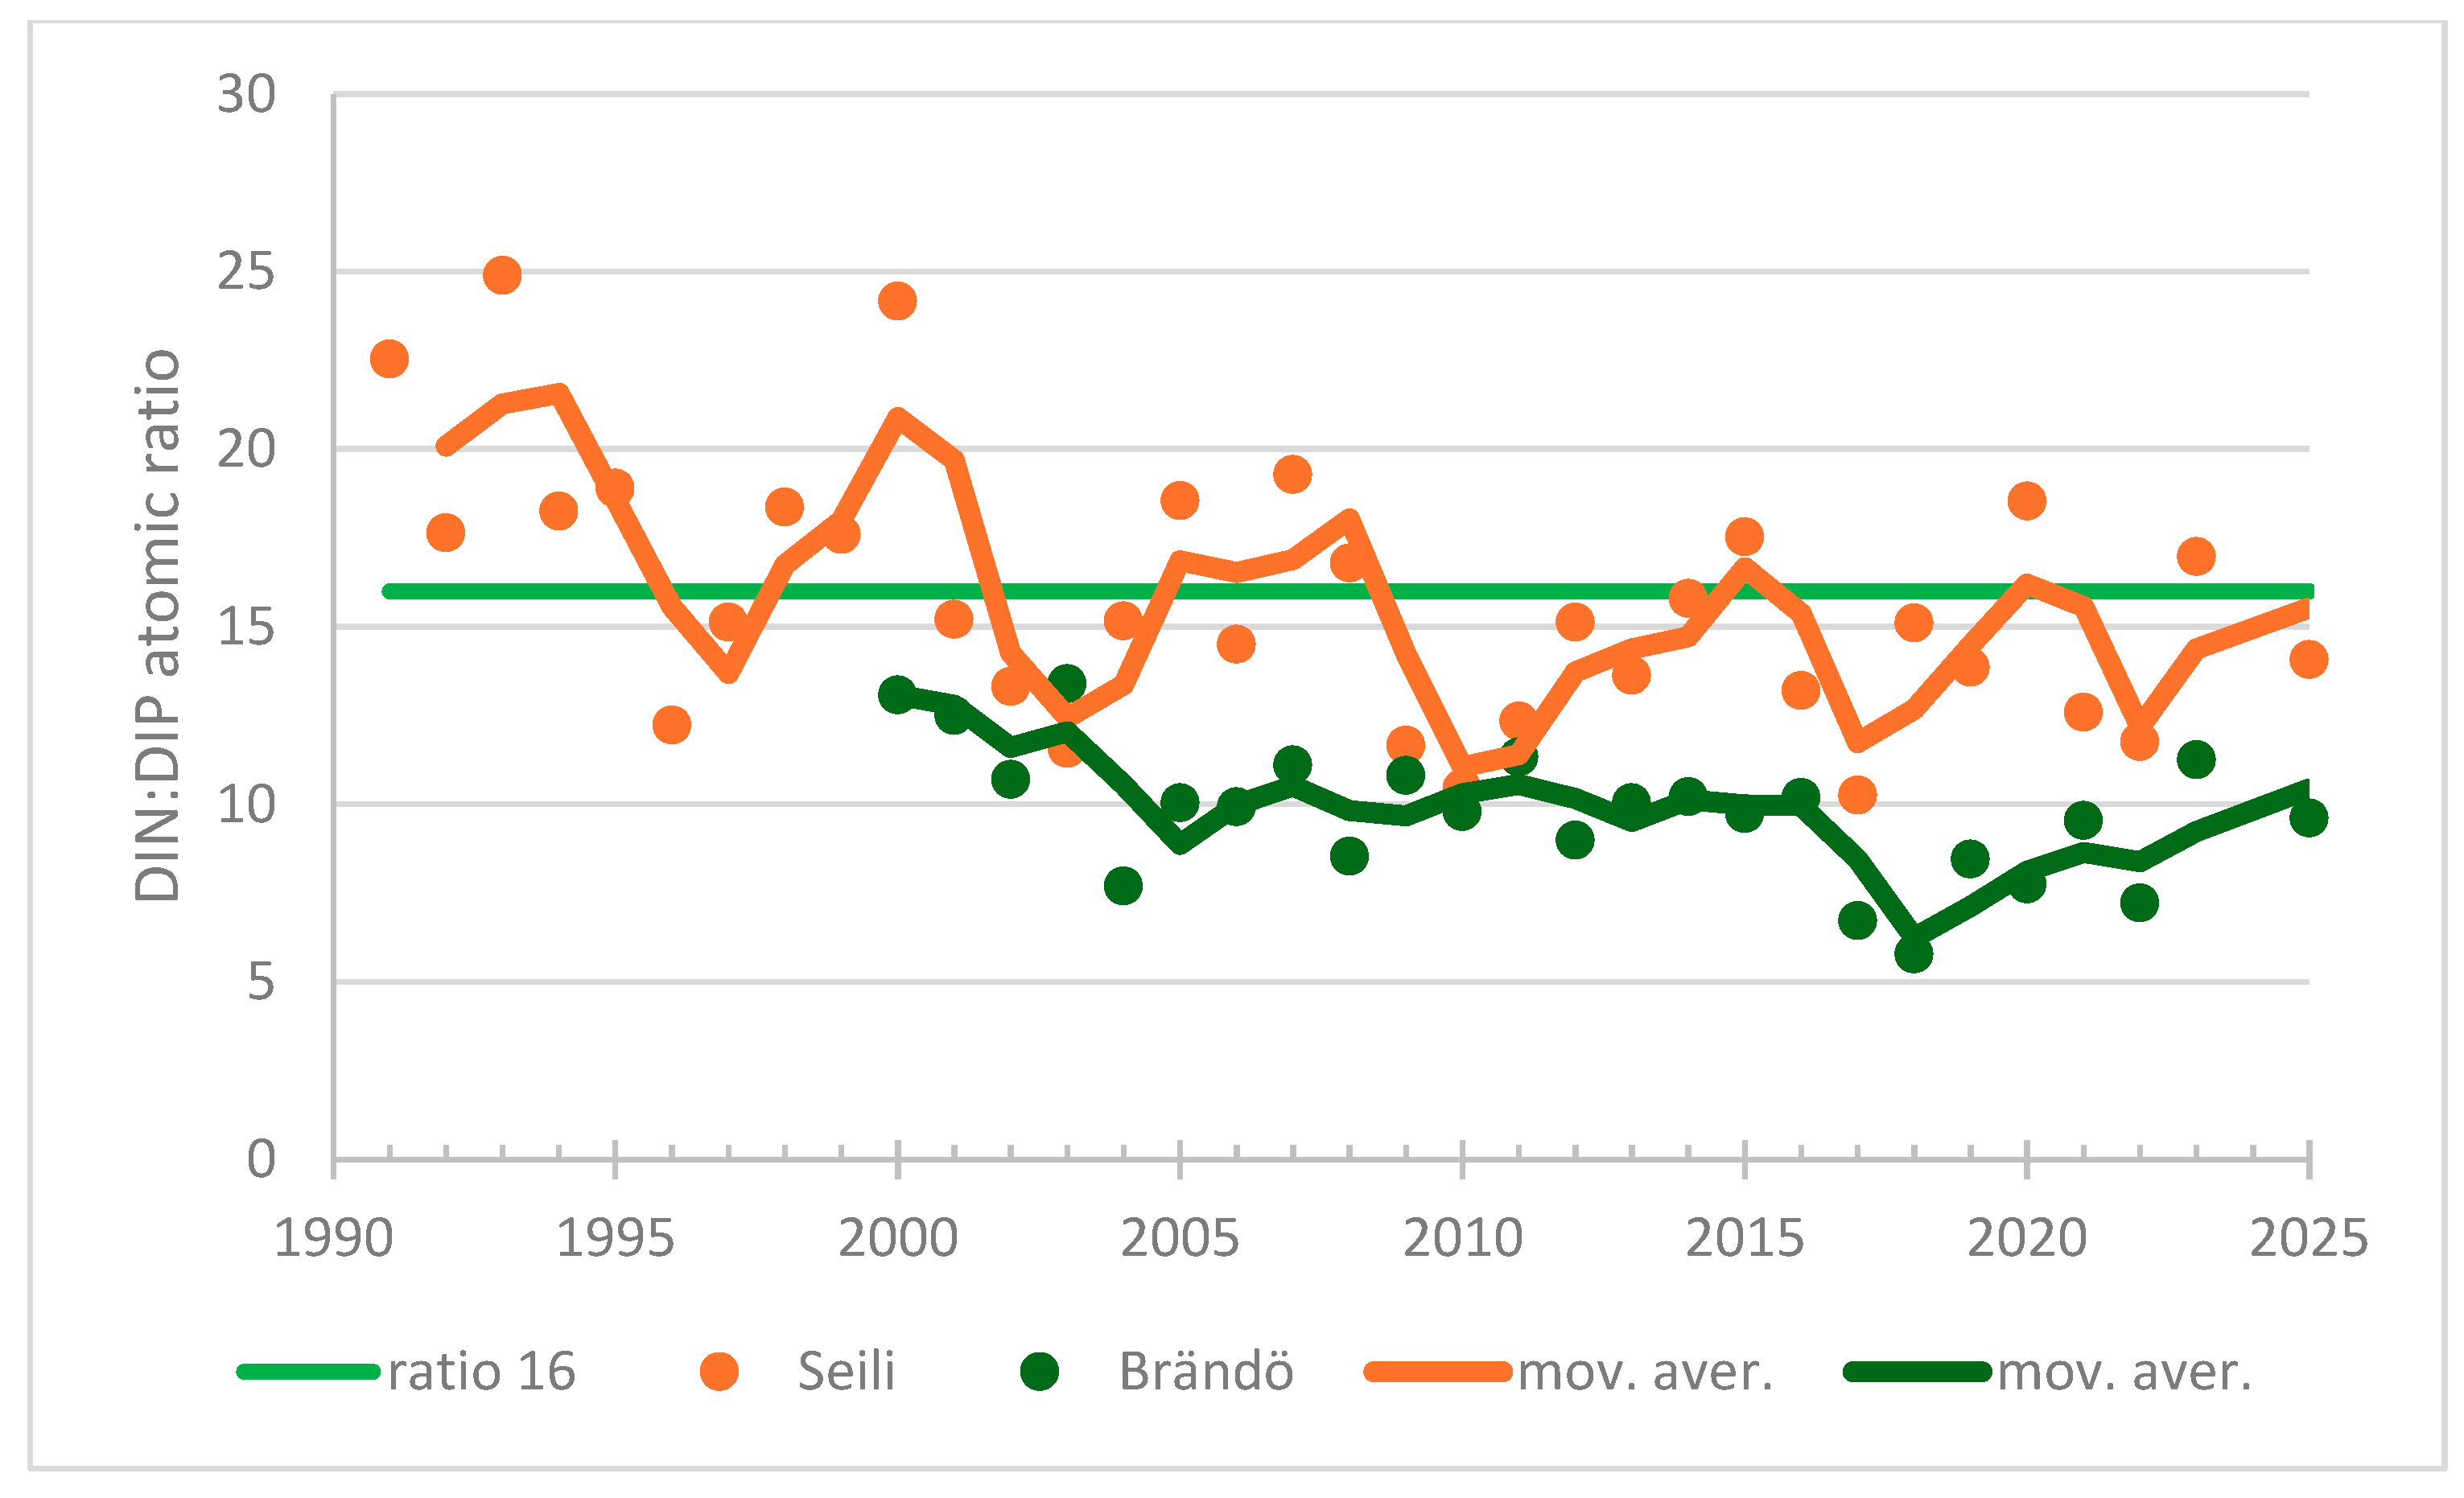
| Airisto, 220 | 1999–2014 | summer | DIN:DIP | −0.567 | 0.003 | −68 | decreasing trend |
| 2015–2024 | summer | DIN:DIP | 0.200 | 0.474 | 9 | no trend | |
| 1999–2024 | summer | cyanob. | 0.654 | <0.0001 | 151 | increasing trend | |
| 2011–2024 | summer | cyanob. Nostocales | 0.615 | 0.004 | 48 | increasing trend |
Disclaimer/Publisher’s Note: The statements, opinions and data contained in all publications are solely those of the individual author(s) and contributor(s) and not of MDPI and/or the editor(s). MDPI and/or the editor(s) disclaim responsibility for any injury to people or property resulting from any ideas, methods, instructions or products referred to in the content. |
© 2025 by the author. Licensee MDPI, Basel, Switzerland. This article is an open access article distributed under the terms and conditions of the Creative Commons Attribution (CC BY) license (https://creativecommons.org/licenses/by/4.0/).
Share and Cite
Helminen, H. The Effects of Reduced Wastewater Load in the Marine Area off Turku in the Archipelago Sea During the Period 1965–2025. Water 2025, 17, 1251. https://doi.org/10.3390/w17091251
Helminen H. The Effects of Reduced Wastewater Load in the Marine Area off Turku in the Archipelago Sea During the Period 1965–2025. Water. 2025; 17(9):1251. https://doi.org/10.3390/w17091251
Chicago/Turabian StyleHelminen, Harri. 2025. "The Effects of Reduced Wastewater Load in the Marine Area off Turku in the Archipelago Sea During the Period 1965–2025" Water 17, no. 9: 1251. https://doi.org/10.3390/w17091251
APA StyleHelminen, H. (2025). The Effects of Reduced Wastewater Load in the Marine Area off Turku in the Archipelago Sea During the Period 1965–2025. Water, 17(9), 1251. https://doi.org/10.3390/w17091251