Abstract
A quantitative assessment of the responses of hydrological processes to environmental change is vital for the sustainable utilization of groundwater and sustainable development under the dual influences of climate change and global greening. However, few studies have investigated the differences in hydrologic responses between karst and non-karst regions. Thus, we analyzed the spatiotemporal changes in potential groundwater recharge (PGR), potential groundwater recharge as a proportion of precipitation (PGR/P), and actual evapotranspiration (AET) in karst and non-karst regions for 1982–2020 using the V2karst model. The analysis revealed the following results: (1) The V2karst model efficiently monitored variations in the AET and groundwater depth (GWD), which indicated its suitability for use in karst areas. (2) The PGR, PGR/P, and AET increased at rates of 4.9 mm/y, 0.0011, and 1.4 mm/y in karst areas, and 3.8 mm/y, 0.00053, and 1.6 mm/y in non-karst areas, respectively, with the increasing trend in AET being significant in karst and non-karst regions. (3) The precipitation (P) and AET were significantly correlated with the PGR and PGR/P, while the minimum temperature (TMN) was strongly related to the AET. The Normalized Difference Vegetation Index (NDVI) moderately affected the PGR, PGR/P, and AET changes in humid catchments. Climate change is a primary factor for hydrological processes, whereas vegetation restoration has a relatively minor impact. The results of this study are beneficial toward the adoption of strategic groundwater utilization programs and ecological restoration measures for regions with a diverse geological setting.
1. Introduction
Karst regions cover 15% of the Earth’s surface area and provide drinking water for approximately a quarter of the world’s population [1]. The karst region of Southwestern China comprises one of the three major concentrated and contiguous karst distribution areas worldwide [2]. In recent decades, due to irrational land use, including deforestation, quarrying, limestone pit filling, and changing surface drainage patterns, the karst areas in Southwestern China have suffered from severe soil erosion and rocky desertification, which present critical ecological and environmental challenges for China [3]. In response to these serious issues, the Chinese government has formulated a series of strict ecological policies and initiatives (e.g., Karst Desertification Rehabilitation, Returning Cultivated Land to Forestry, and Natural Forest Conservation Projects), to alleviate these ecological/environmental problems in the region [4,5]. Consequently, the intensity of desertification in the karst area of Southwest China continuously decreased from 2005 to 2020 [4,5], which became one of the world’s most rapidly greening regions with the greatest accumulation of aboveground biomass [5]. However, a series of new ecological/environmental problems were subsequently triggered; the public was concerned as to whether this rapidly growing vegetation might exacerbate the shortage of water resources. Thus, it is critical to reassess the impacts of new land-use patterns on groundwater under climate change to facilitate the development of manageable regional groundwater use patterns.
In contrast to non-karst hydrological systems, karst counterparts exhibit various internal hydrogeological properties, such as a diversity of groundwater recharge pathways, high heterogeneity of water-bearing media, and the frequent conversion of surface water to groundwater [6], which may translate to variable hydrological responses to climate change and greening [7]. Groundwater recharge is mediated by numerous factors, including climate change, land cover/use change (LUCC), and the structural geological characteristics of aquifers in catchments [8]. Climate and LUCC impact precipitation, evapotranspiration, and geological structures, whereas soil properties determine whether the differences between precipitation and evapotranspiration may be effectively converted to groundwater storage [8]. Precipitation is a primary driver of groundwater recharge, which tends to vary, contingent on precipitation levels [9,10,11,12]. The influences of climate change on water resources in both karst and non-karst basins have been explored in many studies [7,13,14]. Liu et al. [14] observed that within the same watershed, increased precipitation (P) stimulated increased evapotranspiration in karst areas, while inducing its decrease in non-karst areas. Chang et al. [7] indicated that AET in karst areas responded far more sensitively to variations in P and potential evapotranspiration (PET) than in non-karst areas under identical climatic circumstances. Liu et al. [13] revealed that the fraction of karst landforms was the primary factor that determined AET, and found that AET in karst catchments exhibited greater sensitivity to variations in P, and was less affected by changes in PET than non-karst catchments. Further, vegetation dynamics are an important component of evapotranspiration [14,15,16], which directly influences groundwater recharge via interception [17]. Most studies unanimously concur that vegetation greening leads to increased evapotranspiration, particularly in terms of transpiration [14,18,19]. However, preceding studies examined the distinct impacts of changes in climate and vegetation on hydrological processes, whereas both climate and vegetation led to variations in evapotranspiration. Few investigations have studied the differences in hydrological responses to climate change and global greening between karst and non-karst regions. Groundwater volumes have diminished due to increased vegetation coverage despite higher rainfall [20,21,22], which further increases public concerns regarding groundwater access and vegetation greening. Thus, it is urgent to research how groundwater dynamics respond to increasing rainfall [23] and widespread vegetation greening in Southwestern China karst and non-karst regions. This study provides experience and strategies for groundwater management in Southwest China, as well as other karst regions globally.
To date, many hydrological models utilizing distinct conceptual frameworks have been employed to simulate hydrological processes in catchments [24]. Lumped, semi-distributed, and fully distributed models are considered process-based, which can reflect changes in the hydrological attributes of karst areas over prolonged temporal scales [6,25]. Lumped models require less data and typically focus on variables such as precipitation, recharge, and discharge, while neglecting the spatial variability in the hydrodynamic properties of karst systems; thus, they cannot assess irregularities in spatial recharge and discharge [26]. In contrast, fully distributed models demand highly precise parameters to enable the articulation of karst hydrological processes, and have been extensively utilized to investigate hydrological processes in small well-explored karst systems [27,28,29]. However, they are difficult to use broadly for large karst watersheds due to the lack of characteristic hydraulic parameters and structural data related to underground karst systems [6]. Semi-distributed models transition between lumped and fully distributed models, which require less data and can consider spatial changeability in subsurface hydrological variables [24,30,31]. Most conventional hydrological models (based on a large number of parameters) lack simulation of the recharge process of epikarst zone, even though their spatial parameters are sufficiently flexible to reflect the heterogeneous nature of the karst region [32]. The Varkarst model (parsimoniously semi-distributed) considers karst hydrological properties and uses a statistical distribution function to describe spatial variability in soil, epikarst, and subsurface dynamics [33]. Therefore, the Varkarst model is considered to be one of the best among the 13 available models in the Karst Modeling Challenge (KMC) [24]. However, Varkarst computes potential evapotranspiration based on empirical formulas, without separately calculating its three inherent elements (bare soil evaporation, plant transpiration, and intercepted evaporation). Furthermore, empirical formulas cannot parse the impacts of climate and land cover on each of the evapotranspiration components, which makes it difficult to elucidate their responses to climate change and land-use changes. V2karst was improved based on the simplicity of Varkast (using the Penman–Monteith equation) to compute potential evapotranspiration by evaluating each of its main elements to analyze the influences of changes in climate and land use/cover on groundwater recharge in karst regions [32]. V2Karst was employed to locally assess the impacts of climate and land-use changes on karst groundwater resources [34,35].
Consequently, the V2karst model was utilized to simulate the spatial and temporal variability in potential groundwater recharge (PGR) and actual evapotranspiration (AET) under two different hydrogeological backgrounds based on historical and observational data from the Lijiang River Basin (LRB) in Southwestern China under a subtropical monsoon climate. Our primary research objectives were to (1) contrast the spatial patterns and temporal trends in PGR, PGR/P, and AET in karst and non-karst areas; (2) understand the impacts of vegetation restoration on changes in PGR, PGR/P, and AET; and (3) determine the relative contributions of climatic change and vegetation restoration to PGR, PGR/P, and AET under two distinct hydrogeological backgrounds. The results of this research aim to provide a key reference for groundwater preservation and management under ecological restoration and climate change.
2. Study Area and Data
2.1. Study Area
The LRB is located in Guilin, of the Guangxi Zhuang Autonomous Region, in Southwest China (109°45′ E–110°40′ E, 24°18′ N–25°41′ N), which extends for 164 km and encompasses ~5690 km2 with the karst region being 3886 km2, which comprises 68% of the total area. The basin has typical karst geomorphological attributes (Figure 1). The LRB originates in the Mao’er Mountains in the northeastern section of Guilin City, which ultimately runs into the Pearl River system, with mostly loamy mid-stream and subsurface runoff; the surface runoff is minor and negligible [36,37]. This region has a subtropical humid monsoon climate with an annual average temperature of 18–19 °C and precipitation of 1925 mm, ~65% of which occurs between April and August. Forests and cropland are the primary land-use types in the LRB, comprising 68% and 26% of the total area, respectively.
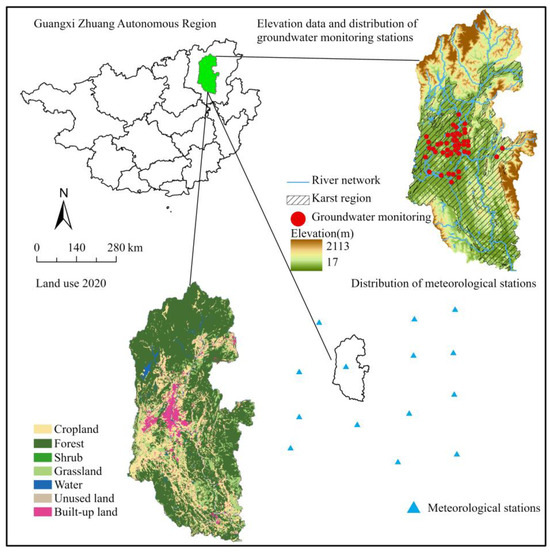
Figure 1.
Generalized maps of the study area.
2.2. Data Preparation
For this study, the data used are provided in Table 1. The topographic data for the basin were obtained from the Shuttle Radar Topographic Mapping Mission (SRTM.1) at a spatial resolution of 30 m (https://earthexplorer.usgs.gov (accessed on 23 April 2024)). Daily meteorological data from 14 meteorological stations were collected from the China Meteorological Station Data Center (CMA, https://data.cma.cn (accessed on 23 April 2024)) for 1980–2020, including precipitation; maximum, mean, and minimum temperatures; wind speed; relative humidity; and sunlight duration. The meteorological data were interpolated to a precision of 0.1° × 0.1° via bimodal and spline interpolation. The vegetation parameters for a priori data were acquired from the Global Land Cover Characterization (GLCC) dataset (https://www.usgs.gov/centers/eros/science/usgs-eros-archive-land-cover-products-global-land-cover-characterization-glcc (accessed on 23 April 2024)) with a spatial resolution of 1 km. NDVI was obtained from the PKU GIMMS NDVI dataset (https://zenodo.org/records/8253971 (accessed on 23 April 2024)) with a spatial resolution of 1/12°. The China Forest Canopy Height Distribution Product (https://www.3decology.org/2023/06/21/forest-tree-height-map-of-china-2 (accessed on 23 April 2024)) provided data on the canopy height at a 30 m spatial resolution. Data on groundwater levels from 50 national groundwater monitoring wells in Guilin City (2019–2020) were obtained from the China Geological Survey (CGS, https://www.cgs.gov.cn). All groundwater types were karst water and all monitoring wells were submerged. The calibration and validation of the V2karst model based on ERA5_Land data (https://cds.climate.copernicus.eu (accessed on 23 April 2024)) builds on ERA5 data and combines it with observations to improve accuracy. For this study, ERA5_Land AET and soil moisture data for 1980–2020 were applied.

Table 1.
Basic data information used in this study.
3. Methodology
3.1. V2karst V1.1 Model
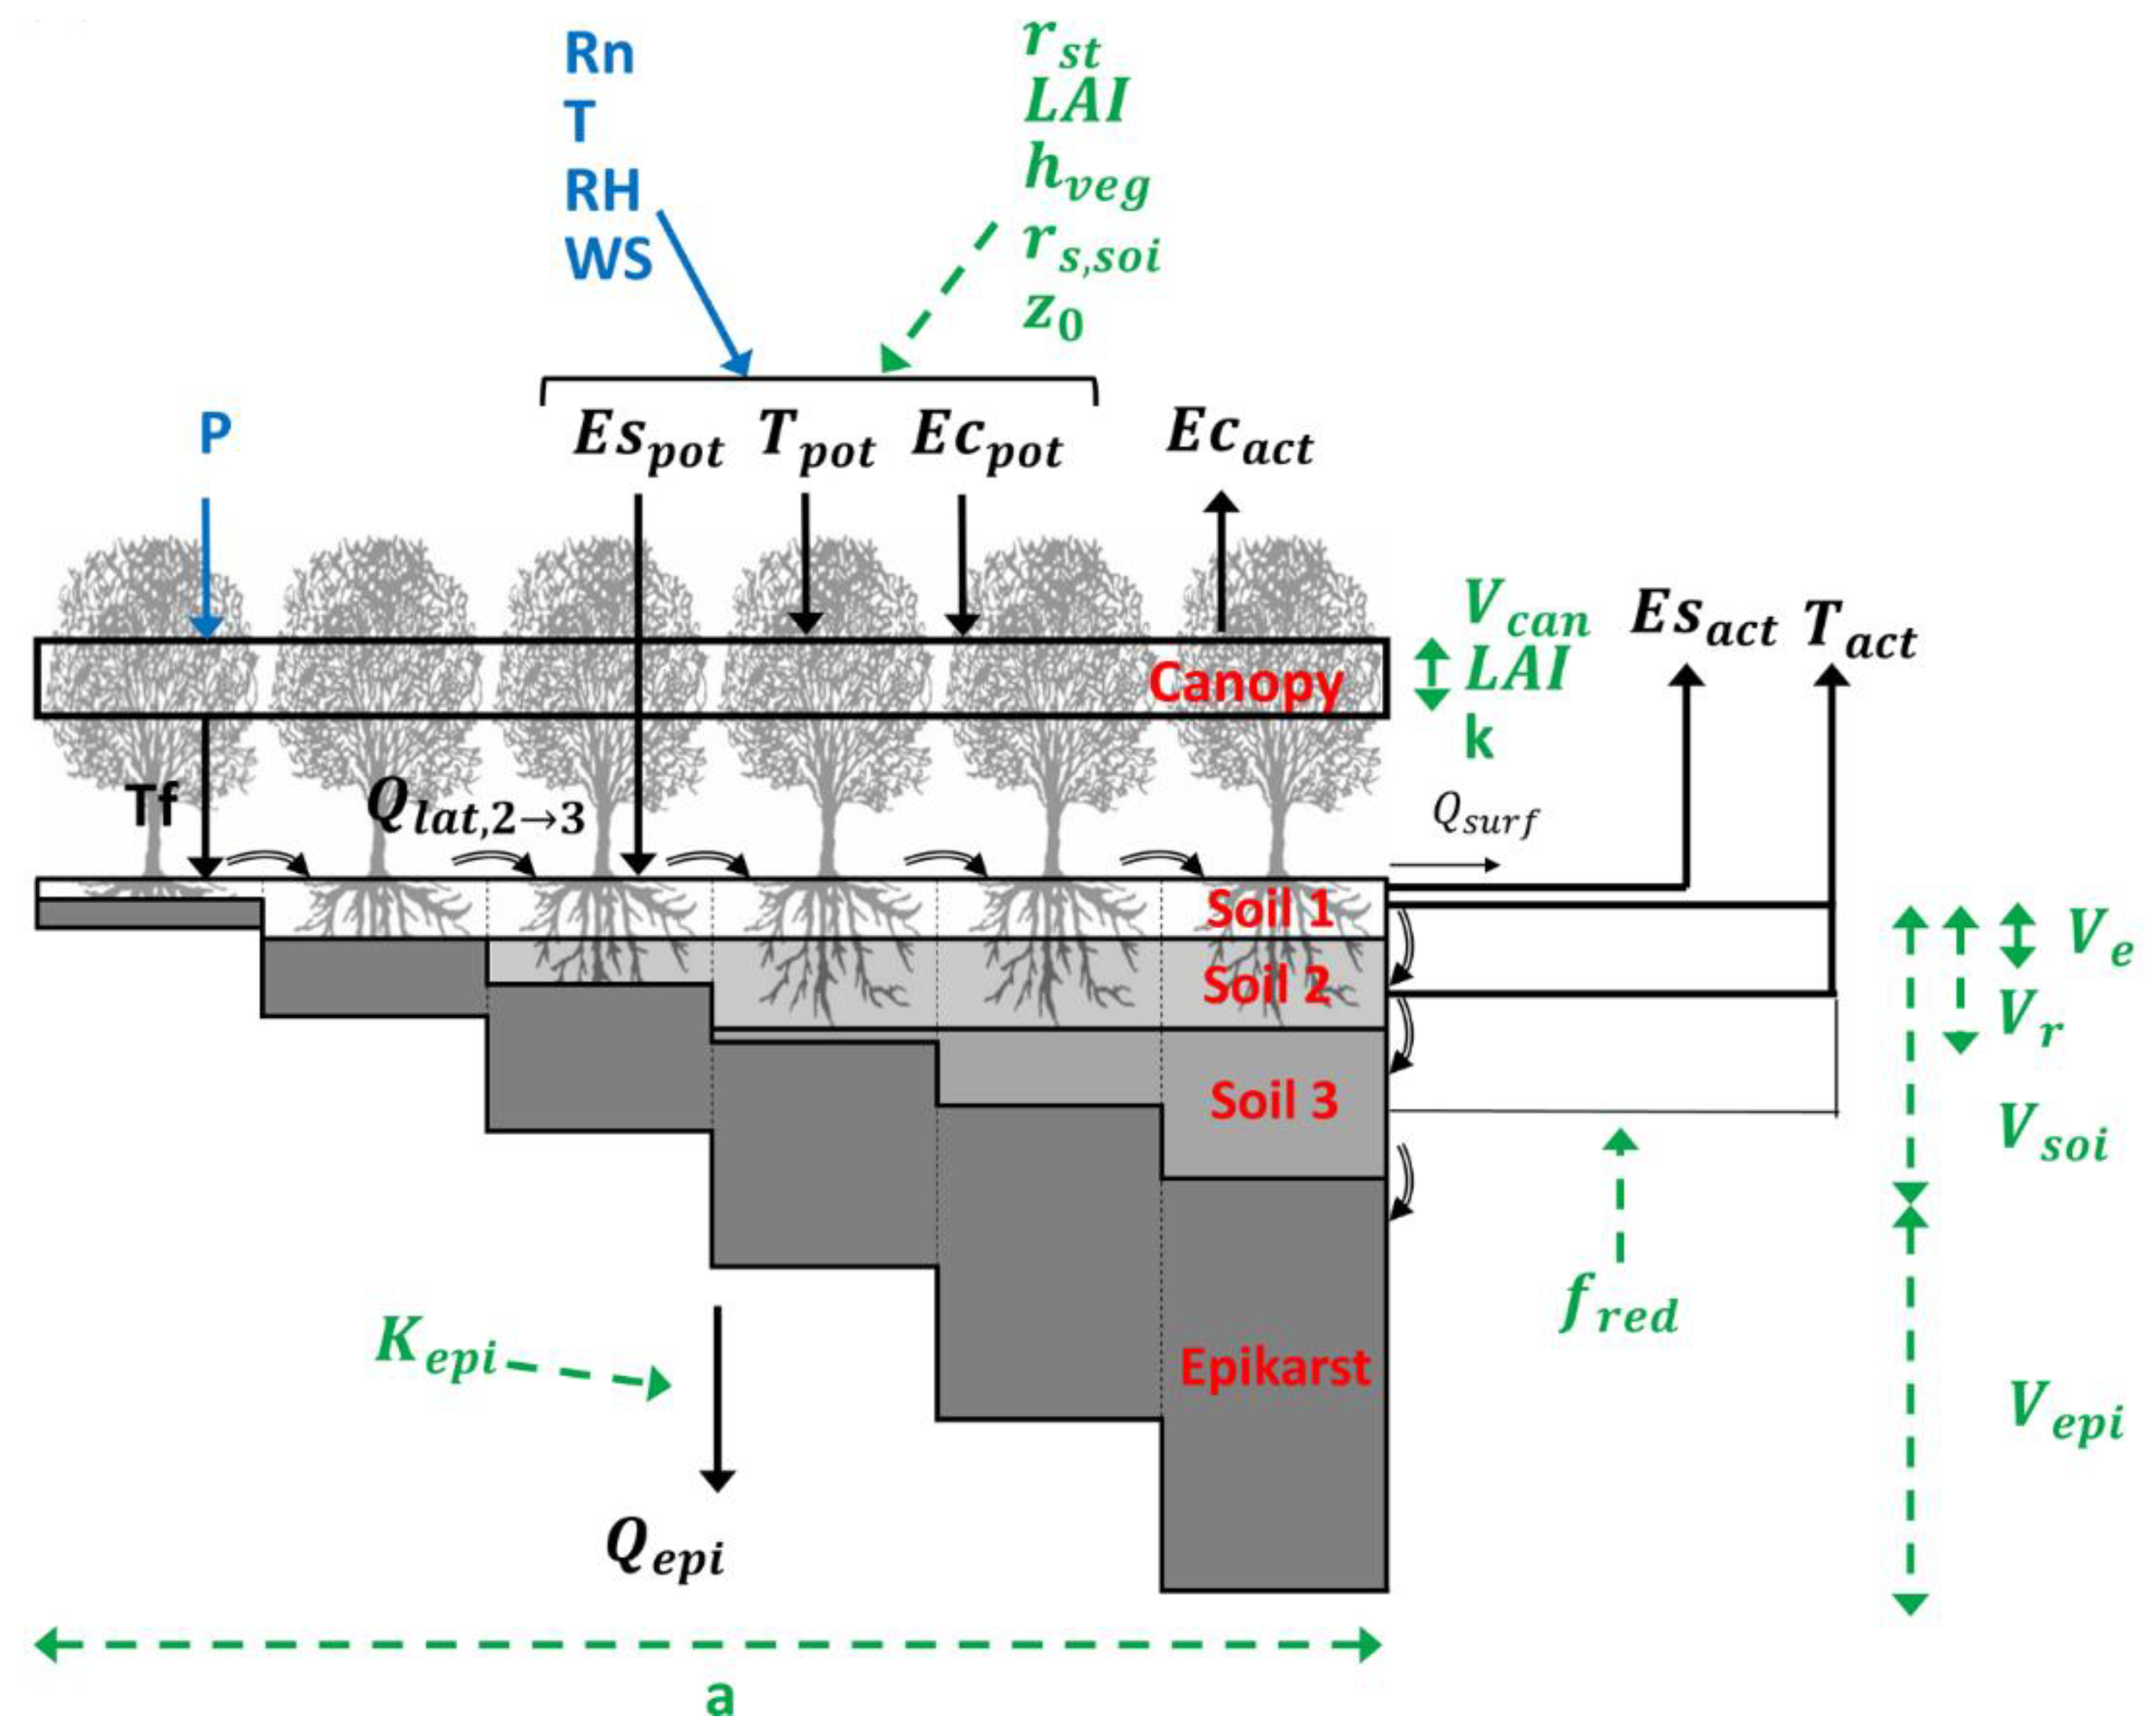
Varkarst is a karst recharge model developed for large-scale groundwater applications in karst regions. This semi-distributed model simulates potential groundwater recharge from karst systems and represents the heterogeneity of karst features through a statistical distribution function. Hartmann et al. [33] developed the model’s initial version. Subsequently, Sarrazin et al. [32] advanced the V2karst model in conjunction with the Matt–Shuttleworth method, which uses physical process-based PET equations. These assume that vegetation attributes are uniformly distributed across the model compartments, divide evapotranspiration into three components (vegetation transpiration, soil evaporation, and canopy interception evaporation), segment soil into three soil layers, and incorporate an epikarst layer (Figure 2). The parameters required by the model and their ranges are shown in Table 2. The model was used for area studies in Germany, Spain, and France [32]. For this study, we used a 0.1° × 0.1° grid cell to simulate potential groundwater recharge using the V2karst model at a daily time step, which required the following inputs: precipitation (P), mean temperature (TEM), minimum temperature (TMN), maximum temperature (TMX), net radiation (Rn), relative humidity (RH), and wind speed (WS), and outputs that included potential groundwater recharge (PGR) and actual evapotranspiration (AET).The parameters for model simulation, are provided in Table 2.

Figure 2.
Conceptual schematic of the V2karst model [32].
Table 2.
V2karst model parameter ranges. The parameter ranges are taken from the literature [32].
The structure of the model may be categorized into two main components: the soil water balance and the surface karst water balance, from which total evapotranspiration (ET) was calculated based on its three primary components (vegetation transpiration (T), soil evaporation (Ts), and canopy interception evaporation (T):
where is the mean value of vegetation transpiration () in soil layer () for all compartments; is the mean value of soil evaporation () for all compartments; and is the canopy interception evaporation.
The model assumes that the location where vegetation transpiration occurs is determined by the transpiration rates () in the upper two soil layers, and the transpiration rate () of the third soil layer at time step :
where is the soil water storage in the compartment and soil layer at time step , and is the throughfall at time step .
is calculated as follows:
where is the potential canopy interception evaporation at time step ; is the vegetation cover fraction coefficient; is the precipitation at time step ; is the interception storage over the vegetated fraction at time step ; and is the interception storage capacity over the vegetated fraction at time step .
The model assumes that soil evaporation has a higher priority than vegetation transpiration, and soil evaporation is estimated as follows:
where is the potential soil evaporation; denotes that the model assumes that soil evapotranspiration occurs only in the non-vegetated area of the soil; and is the soil water storage in the compartment and first soil layer.
At time step , at the end of the soil moisture equilibrium, the epikarst water storage in the compartment () is updated as follows:
where is the potential groundwater recharge; is the lateral runoff from compartment to compartment; and is the surface runoff from the compartment. Surface karst modeling follows the linear assumption [38] and is controlled by the outflow coefficient ().
where is the water from the soil to the epikarst at time step , when the soil water storage is fully saturated.
3.2. Model Calibration and Validation
The Latin hypercube sampling (LHS) method was employed to generate 100,000 parameter combinations for the 15 V2karst parameters. The model warm-up utilized 2 y of data (1980–1981), followed by a calibration period that utilized 25 y of data (1982–2006) and a validation phase based on 14 y of data (2007–2020). Similar to Hartmann et al. [33] and Sarrazin et al. [32], “soft rules” were employed to filter out acceptable parameter combinations, and the model outputs were screened based on the Nash coefficients (NSE) of ERA5_Land and the model-simulated AET. We established six soft rules to determine acceptable parameter combinations for calibrating the V2karst model:
- A bias of <20% between observed and simulated AET for calibration and validation:where is the set of daily timescales during the study period, is the simulated AET on day, and is the observed AET on day.
- The correlation coefficient between simulated and observed AET for calibration and validation > 0.6:
- The correlation coefficient between the simulated and observed soil moisture for the calibration and validation > 0.6:
- In karst regions, the total simulated surface runoff for the calibration and validation: <10% of total precipitation.
- The parameter values for soil and vegetation align with the a priori information.
- The NSE between simulated and observed AET for the calibration and validation > 0.6:where is the average of the observed AET.
The AET model performance was initially directly evaluated based on the coefficient of determination (R2) and percent bias (PBIAS). The formulas are expressed as follows:
where is total number of years; is the simulated ATE values in i year; is the average simulations during the study period; is the observed AET values in year; and is the average observations during the study period.
In addition to the direct calibration using ERA5_Land AET, an indirect validation was performed using the correlation coefficients based on GWD.
where is the monthly simulated PGR values in year, and is the monthly observed GWD values in i year.
3.3. Statistical Analyses
A linear regression approach that utilized the least squares method was employed to monitor the trends in PGR, PGR/P, and AET. This method can simulate changing trends in each grid cell and reflect spatial change patterns by analyzing their temporal characteristics, which provides an overall understanding of the spatiotemporal evolution [39]. Each grid cell in the image has a corresponding time series of values in the preprocessed PGR, PGR/P, and AET datasets for 1982–2020. The linear trend coefficients of these values reveal the evolutionary trends in each grid cell over the 39 y spatiotemporal sequence.
where is the change rate from 1982 to 2020; is the total number of years; is the number of years; and is the PGR, PGR/P, and AET value in year. When , it shows an increasing trend in PGR, PGR/P, and AET; conversely, it is a decreasing trend.
3.4. Correlation Analyses
Partial correlation analysis was employed to probe the response of groundwater and evapotranspiration with other hydrological units. When two variables display a connection while adjusting for the impacts of other factors, this relationship is recognized as a partial correlation [40]. The formula for partial correlation is as follows:
where is the partial correlation coefficient of and ; is the correlation coefficient of and ; is the correlation coefficient of and ; and is the correlation coefficient of and . For the set of controllable variables, Z is . When , it reflects a positive correlation between and of this time series; conversely, a negative correlation.
3.5. Attribution Analysis
In this study, there was an issue of multicollinearity among the climate variables, which reduced the confidence in the regression coefficients, or the stability and performance of the model. This issue could be addressed by using ridge regression, which is a least squares method with L2 regularization:
Ridge regression was used to quantify the connection of PGR, PGR/P, and AET with meteorological variables and NDVI, and to establish the relative contribution of each climate factor and NDVI to PGR, PGR/P, and AET [41]:
where is the normalized PGR, PGR/P, and AET; are the normalized climate variables and NDVI; and is the regression coefficient. The relative contribution of each component to PGR, PGR/P, and AET was estimated from the regression coefficients and the standardized trends in the climate factors and NDVI:
where is the relative contribution of climatic factors and NDVI.
4. Results
4.1. Model Validation and Evaluation
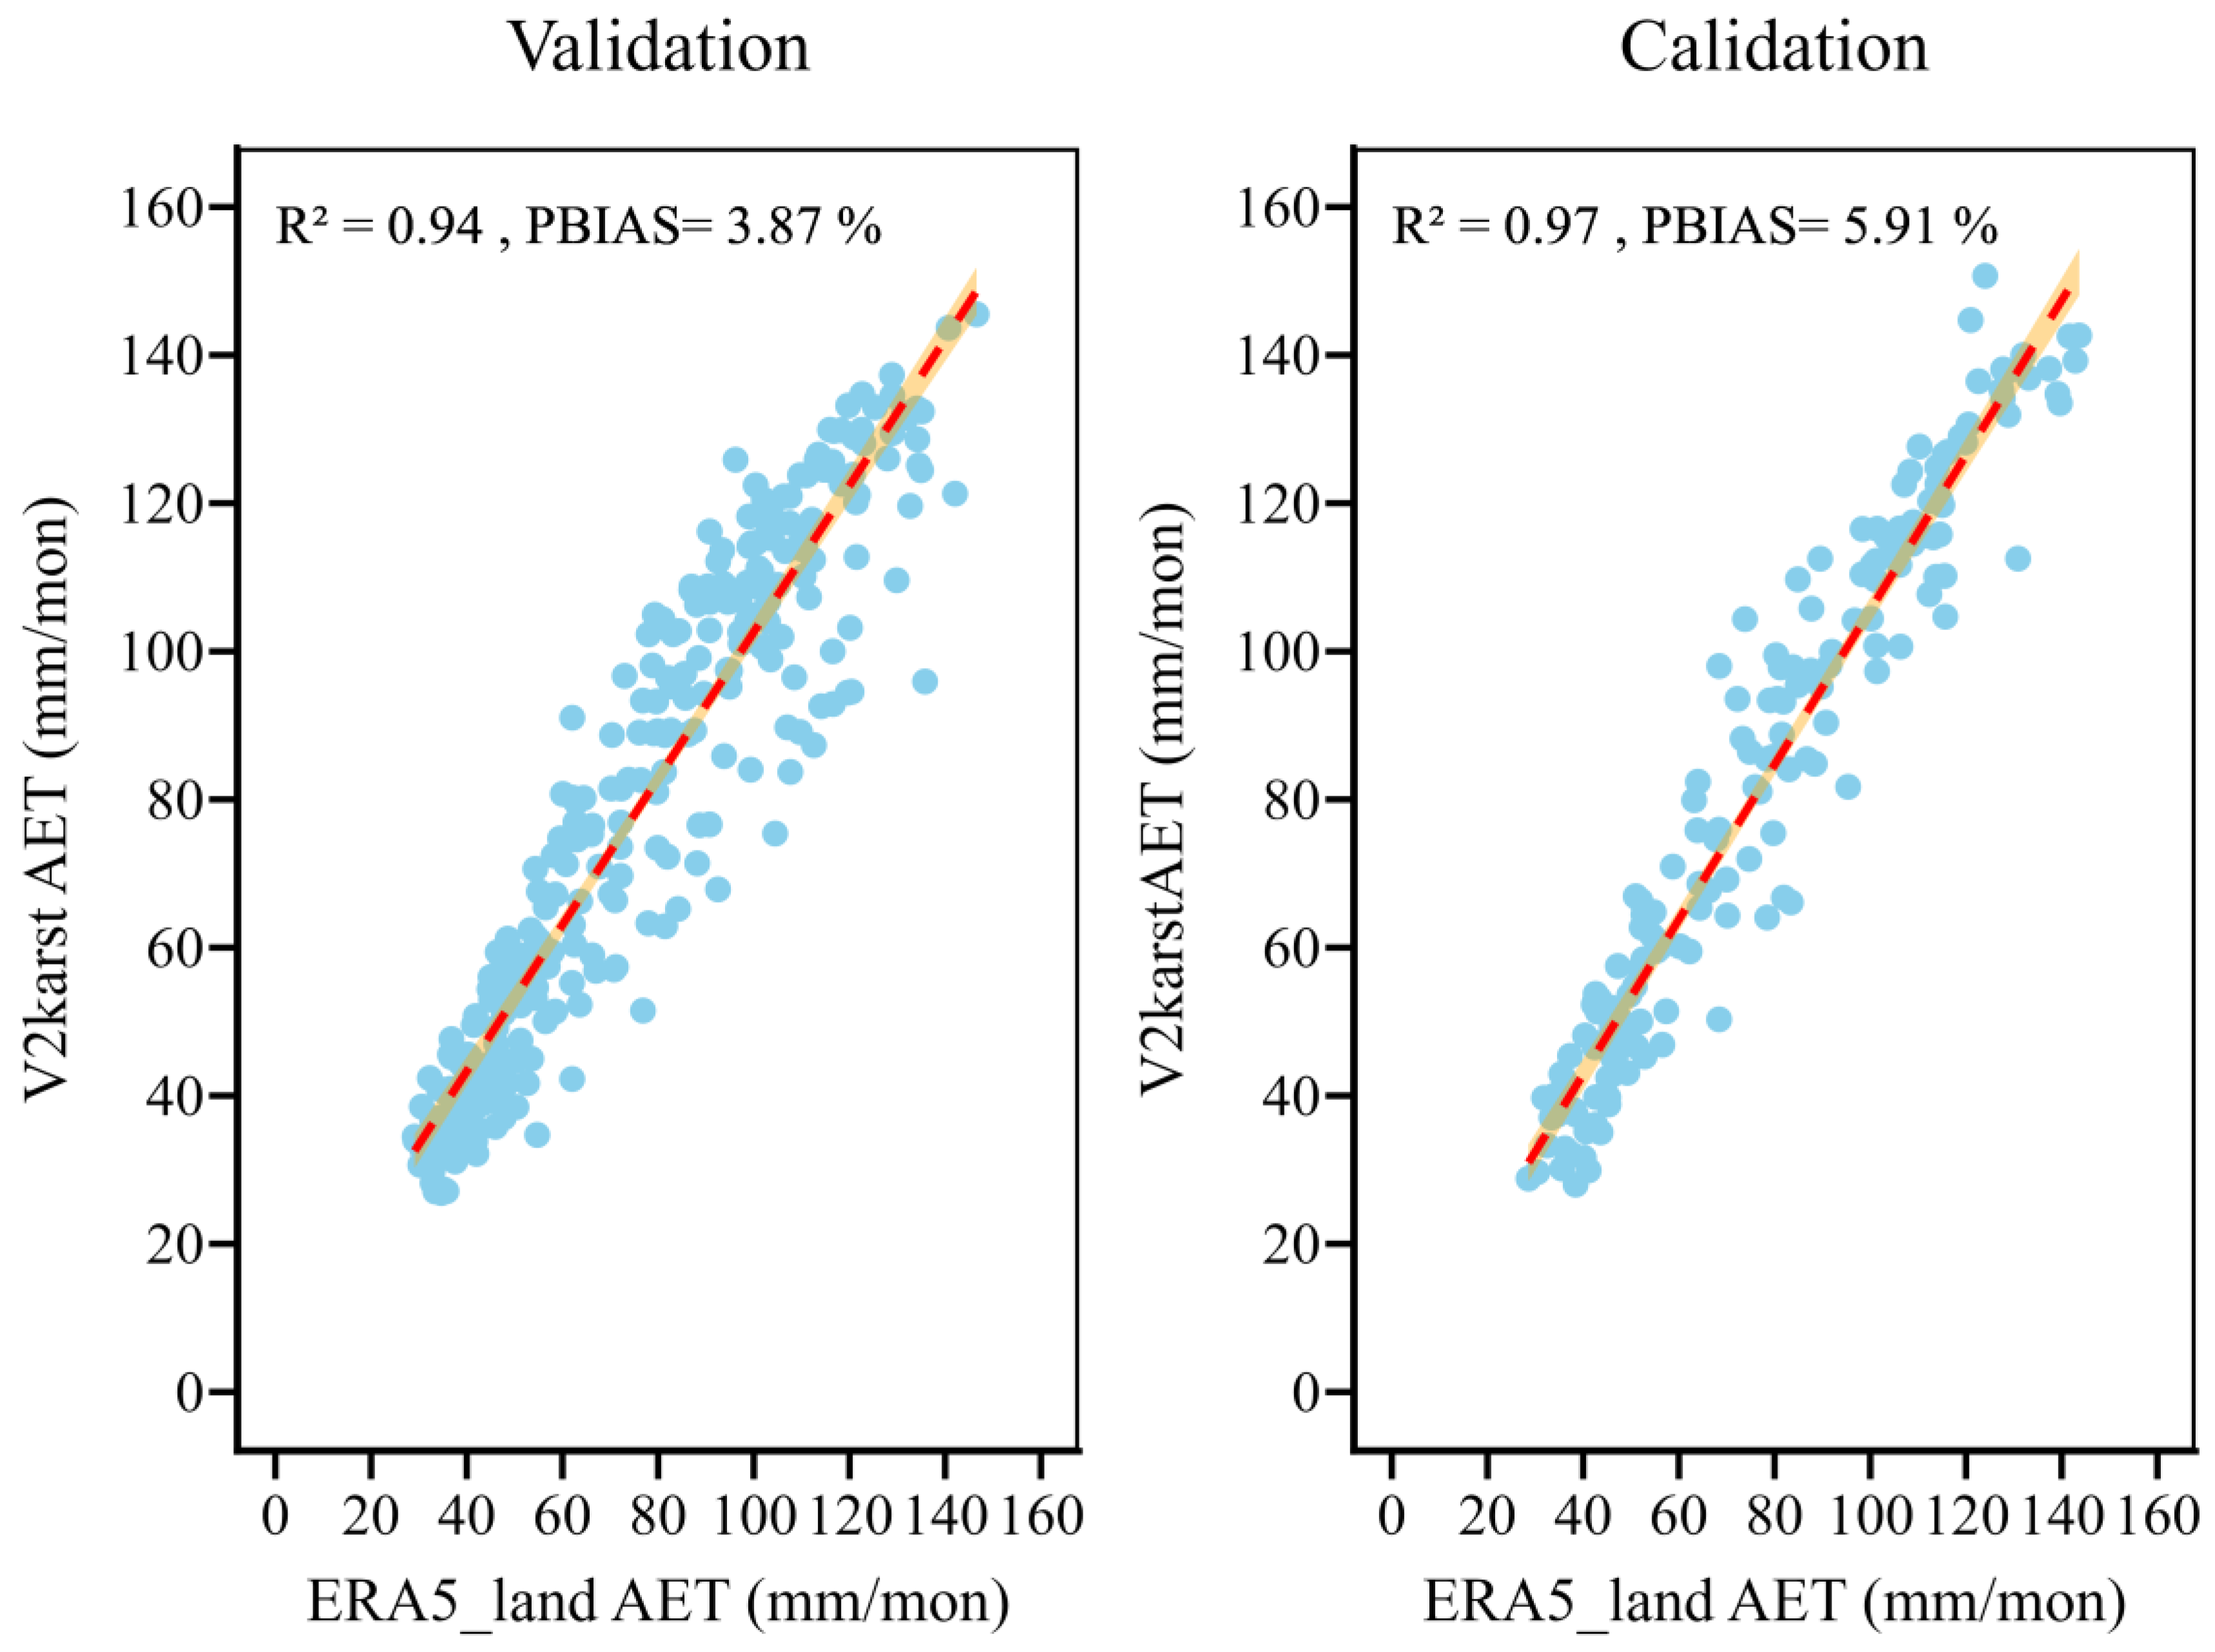
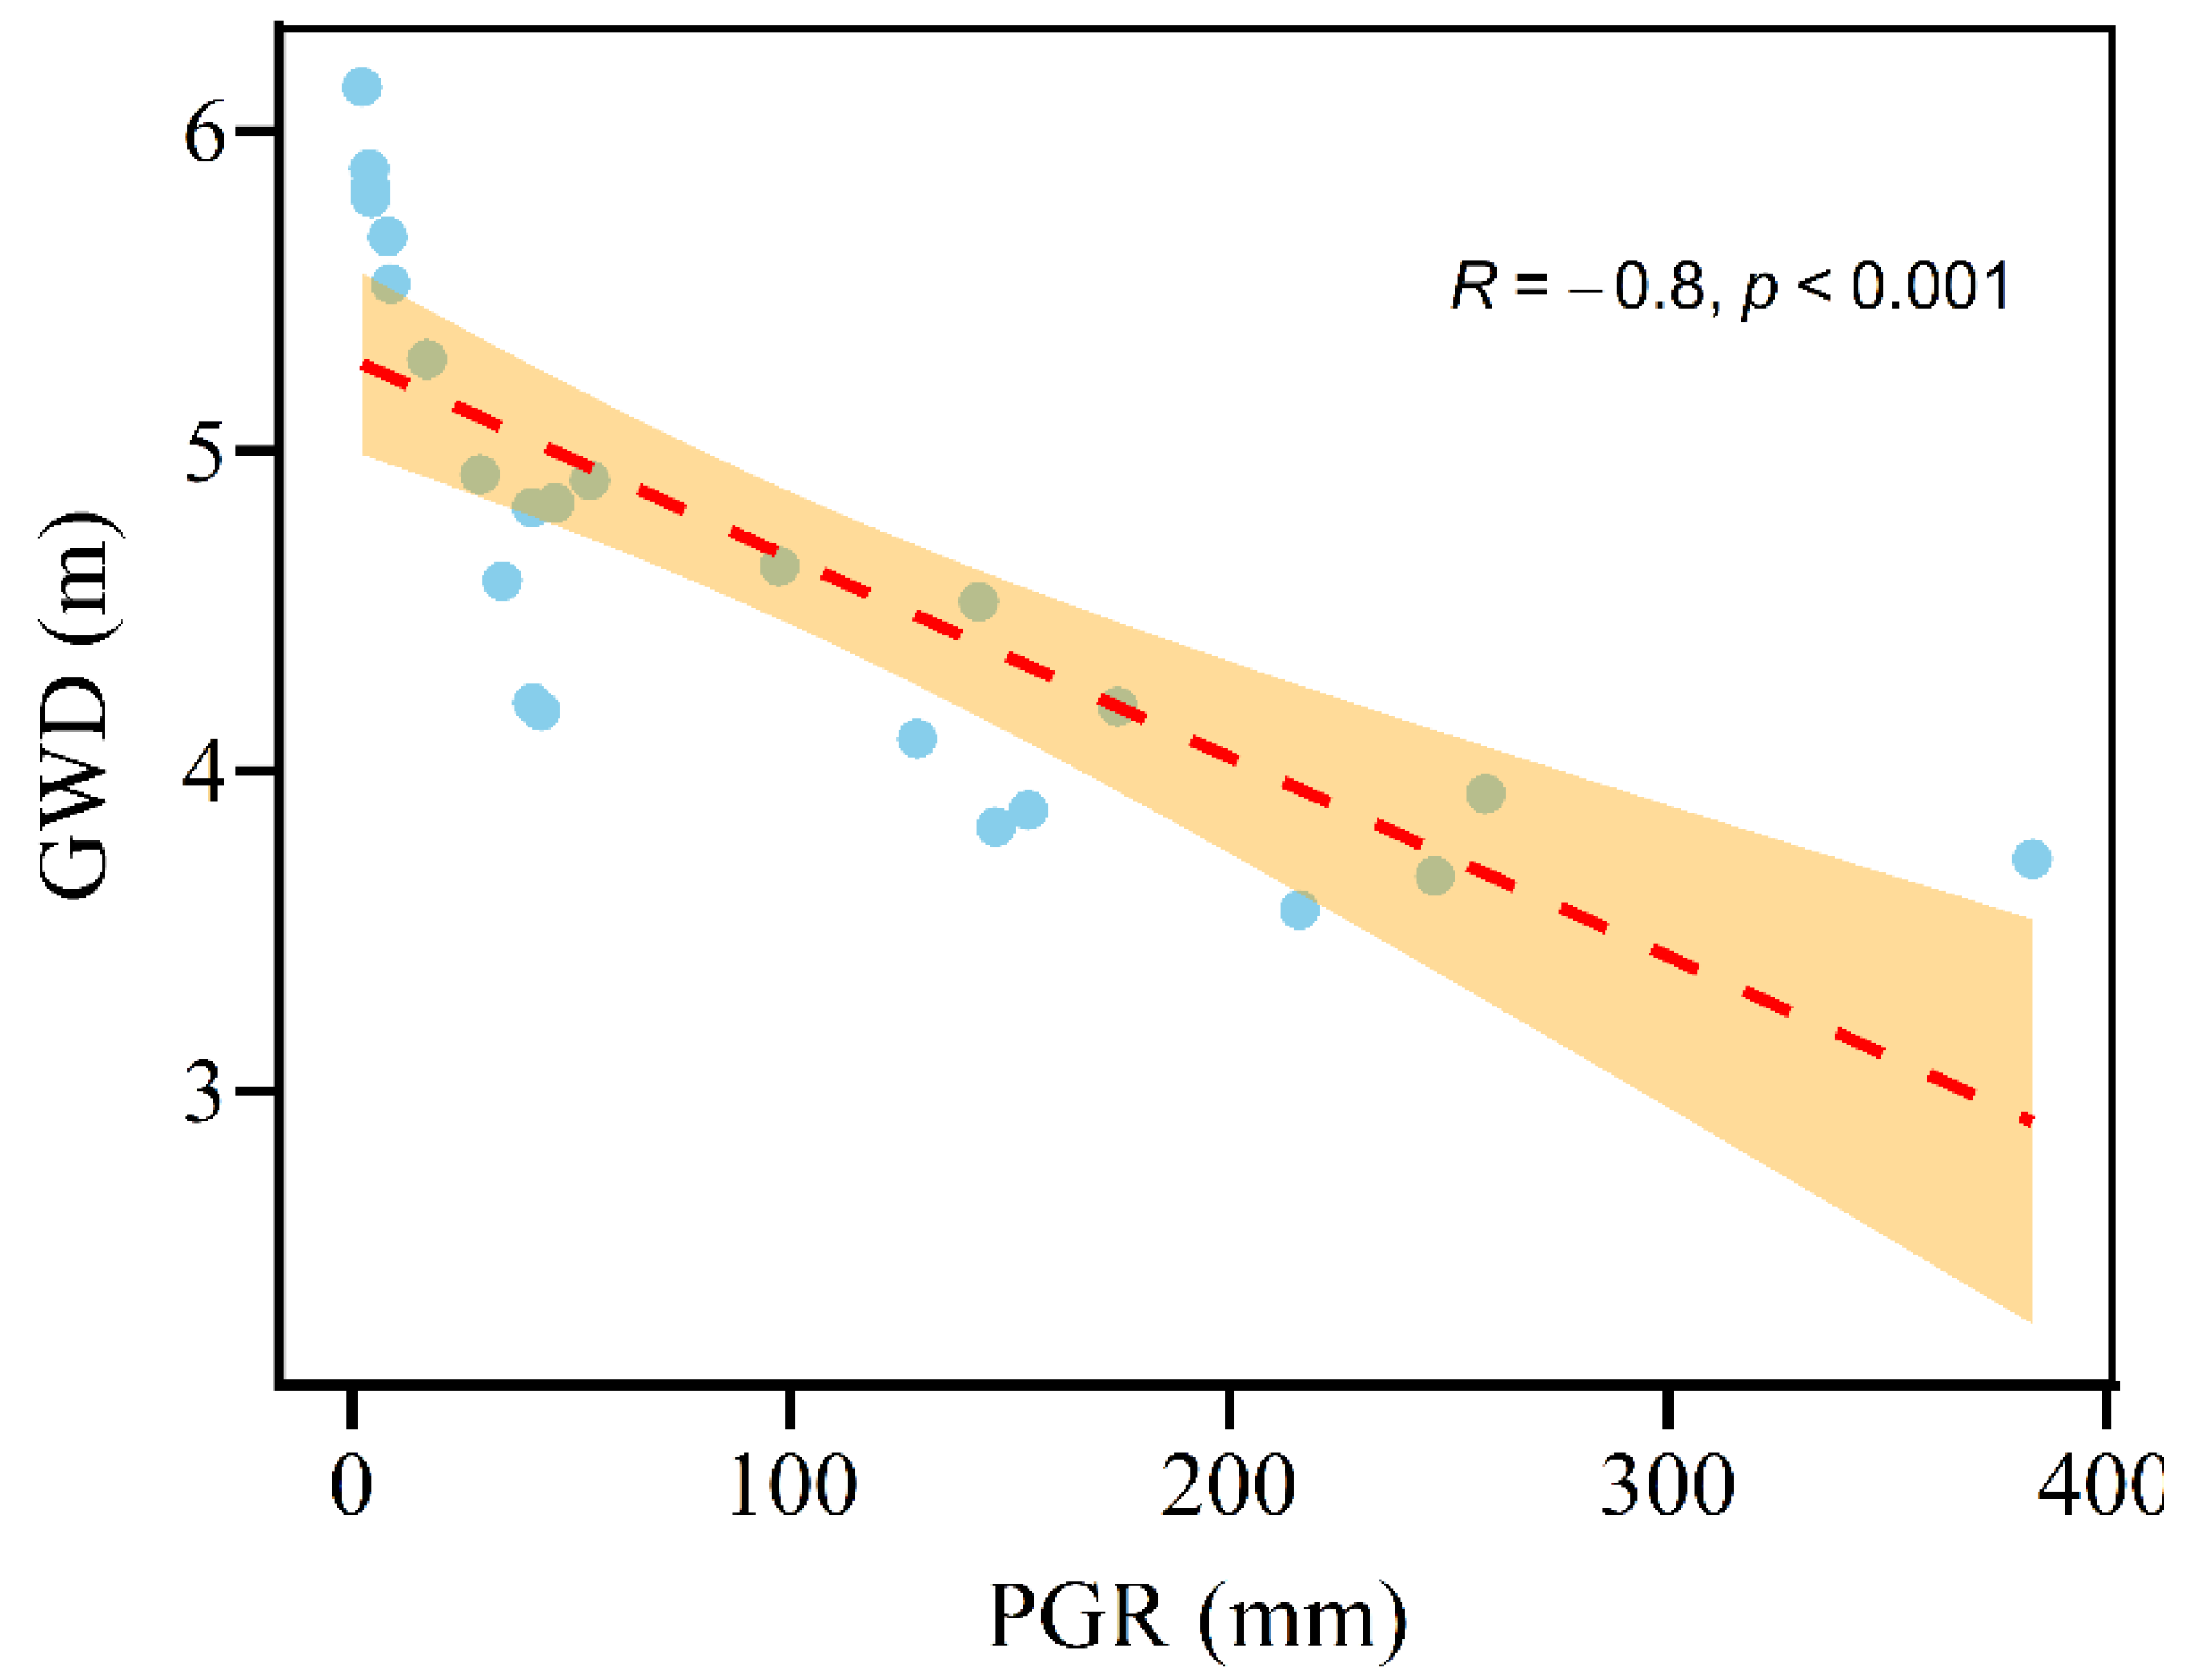
Firstly, we evaluated the model’s efficacy in reproducing AET, since precision is essential for assessing the effects of global greening and climate variables on PGR and AET. In addition to the direct calibration of the simulated AET to the observed AET, an indirect validation was performed based on the monthly simulated PGR and observed GWD. The model evaluation results revealed that the model had a strong tracking capacity for AET dynamics for 1982–2020. Simulated and ERA5_Land outputs were all around the 1:1 line, with Figure 3 revealing that R2 was 0.94 and the PBIAS was 3.87%. The comparison results of PGR and GWD for monthly simulations are given in Figure 4. Similarly, results indicated that the correlation coefficient (R) of GWD and PGR for 2019–2020 was −0.8, which is statistically significant, and the model was highly accurate in tracking groundwater changes.
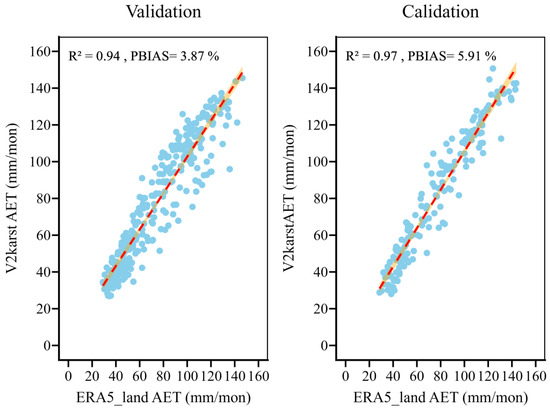
Figure 3.
Monthly comparison of AET from V2karst simulations and ERA5_Land-derived values for 1982–2020. Shaded areas indicate 95% confidence intervals.
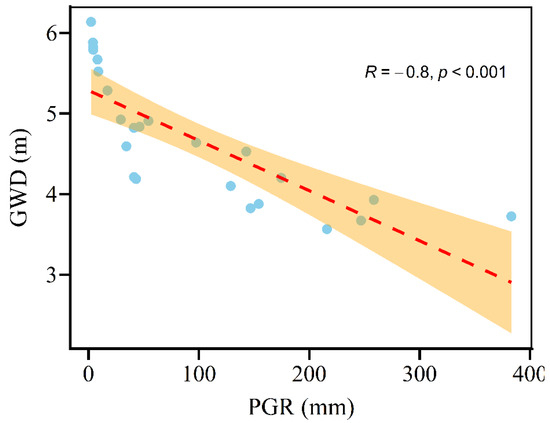
Figure 4.
Monthly comparison of PGR and GWD for 2019–2020. Shaded areas indicate 95% confidence intervals.
4.2. Spatiotemporal Variability of PGR, PGR/P, and AET
The regional average time series (1982–2020) exhibited increasing trends in PGR, PGR/P, and AET, at a rate of 4.4 mm/year, 0.00086, and 1.5 mm/year, respectively (Figure 5a–c). The annual average PGR values ranged from 547.39 mm to 990.44 mm, while the annual average PGR/P varied from 0.32 to 0.55097, and the annual average AET values ranged from 794.61 mm to 1090 mm for 1982–2020. PGR and PGR/P were lower in the southeastern region with dense karst distribution, and higher in the northern region with dense non-karst distribution. From the northwest to southeast, both PGR and PGR/P gradually decreased. Conversely, AET was higher in the southern portion of the densely distributed karst areas, which steadily decreased toward the north. This variation may be attributed to differences in elevation and the relationships among precipitation, karst aquifer structure, and vegetation [42] (Figure 5d–f). The yearly PGR and PGR/P trends gradually increased in the northern and western regions. In contrast, the yearly AET had a significant trend in the LRB, with higher trends in the southwestern and northwest areas, and lower trends in the central region (Figure 5g–i).
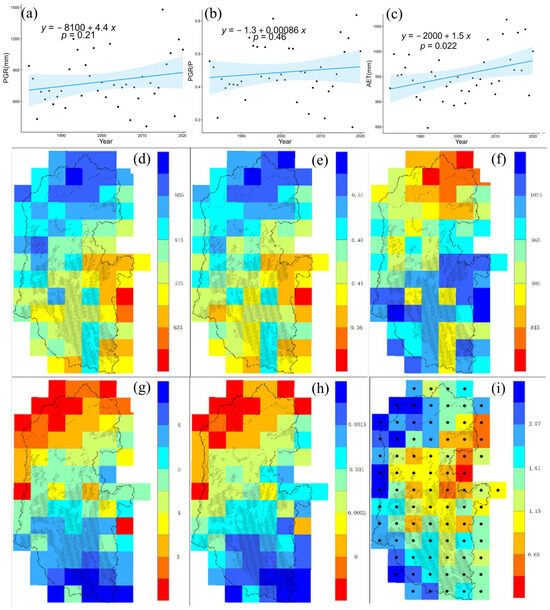
Figure 5.
Linear trends in annual PGR, PGR/P, and AET for 1982–2020 (a–c) are shown. The spatial distribution of average yearly PGR, PGR/P, and AET is also shown (d–f), and that based on the linear regression trend (g–i). Dots indicate regions with significant changes (p < 0.05) based on t-tests. The lined regions represent karst regions.
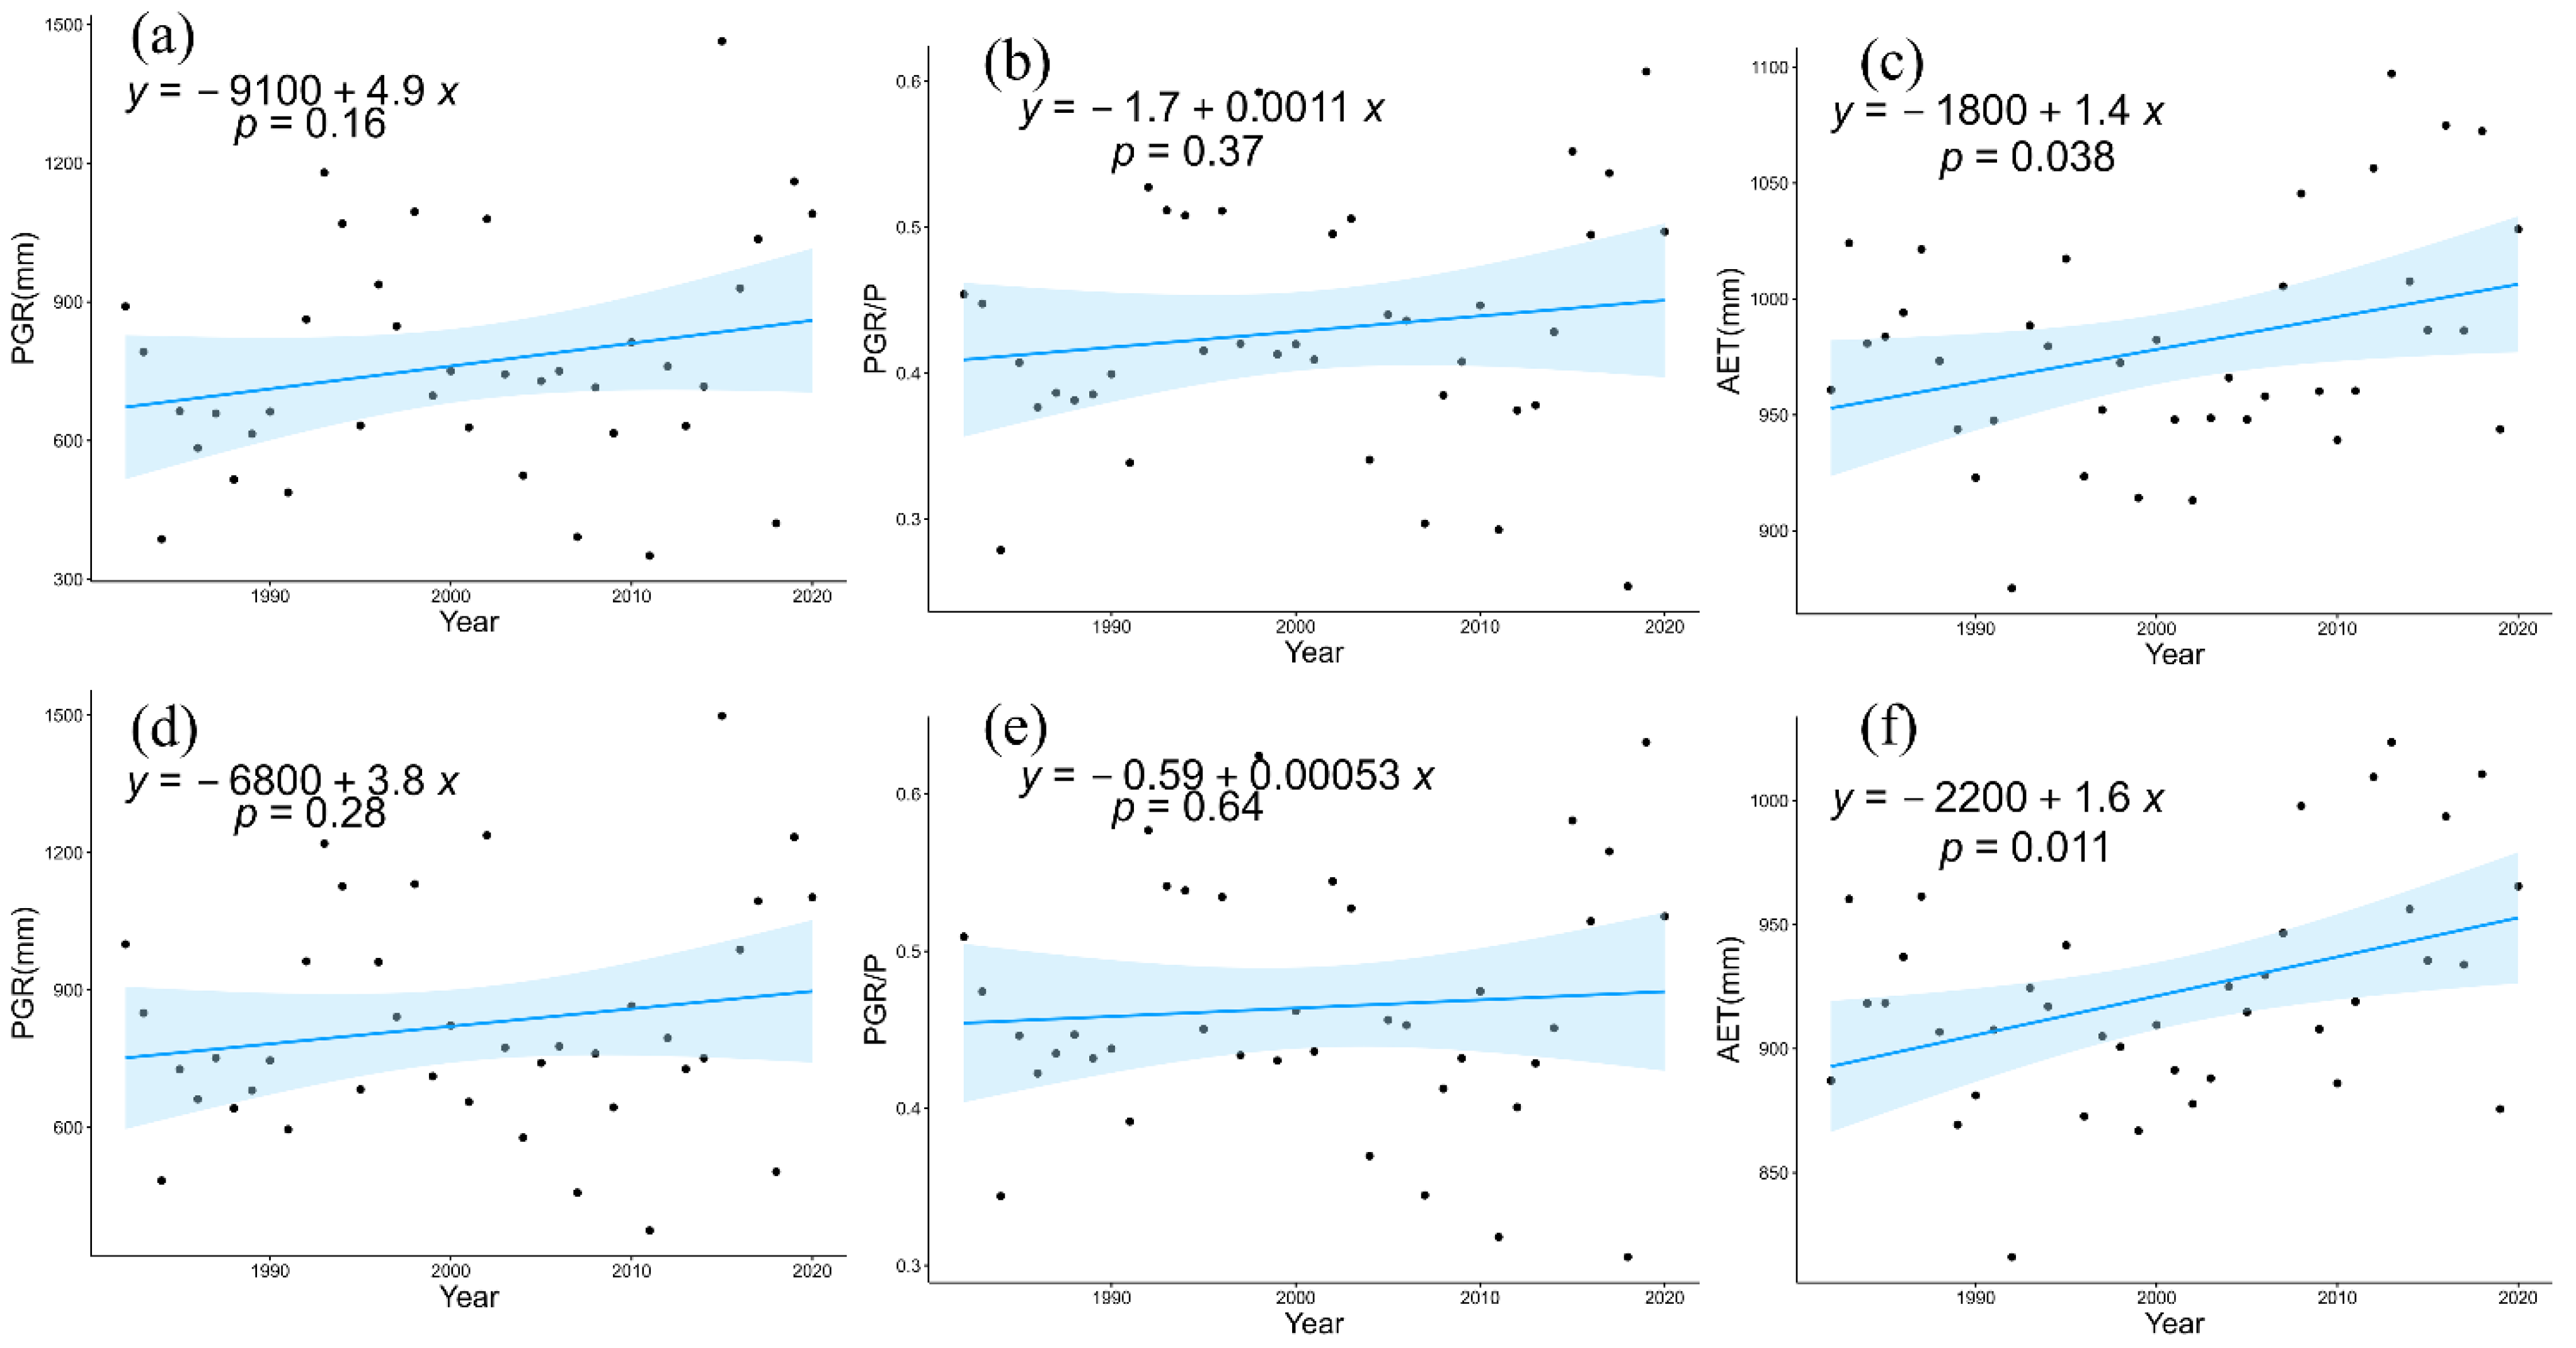
The trends in PGR, PGR/P, and AET for 1982–2020 in the karst and non-karst areas of the basin are depicted in Figure 6. The trends in the three fluxes were comparable in both areas. PGR, PGR/P, and AET grew at rates of 4.9 mm/y, 0.0011, and 1.4 mm/y in the karst regions, and 3.8 mm/y, 0.00053, and 1.6 mm/y, respectively, in the non-karst regions. AET in both regions exhibited significant increasing trends, while PGR and PGR/P were not statistically significant. AET in the non-karst areas grew 14% faster annually than in the karst areas; however, whereas PGR and PGR/P increased more rapidly in the karst areas compared with non-karst areas, these trends were not statistically significant. This resulted in a more significant increase in AET within non-karst areas in contrast to karst areas, with smaller increases in PGR and PGR/P over the entire watershed.
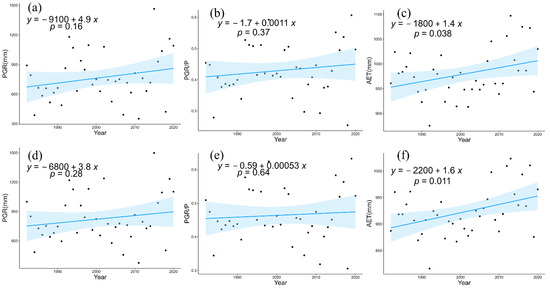
Figure 6.
One-dimensional linear regression trends in PGR, PGR/P, and AET for karst (a–c) and non-karst regions (d–f) from 1982 to 2020.
4.3. Responses of PGR, PGR/P, and AET to Climate Change and NDVI
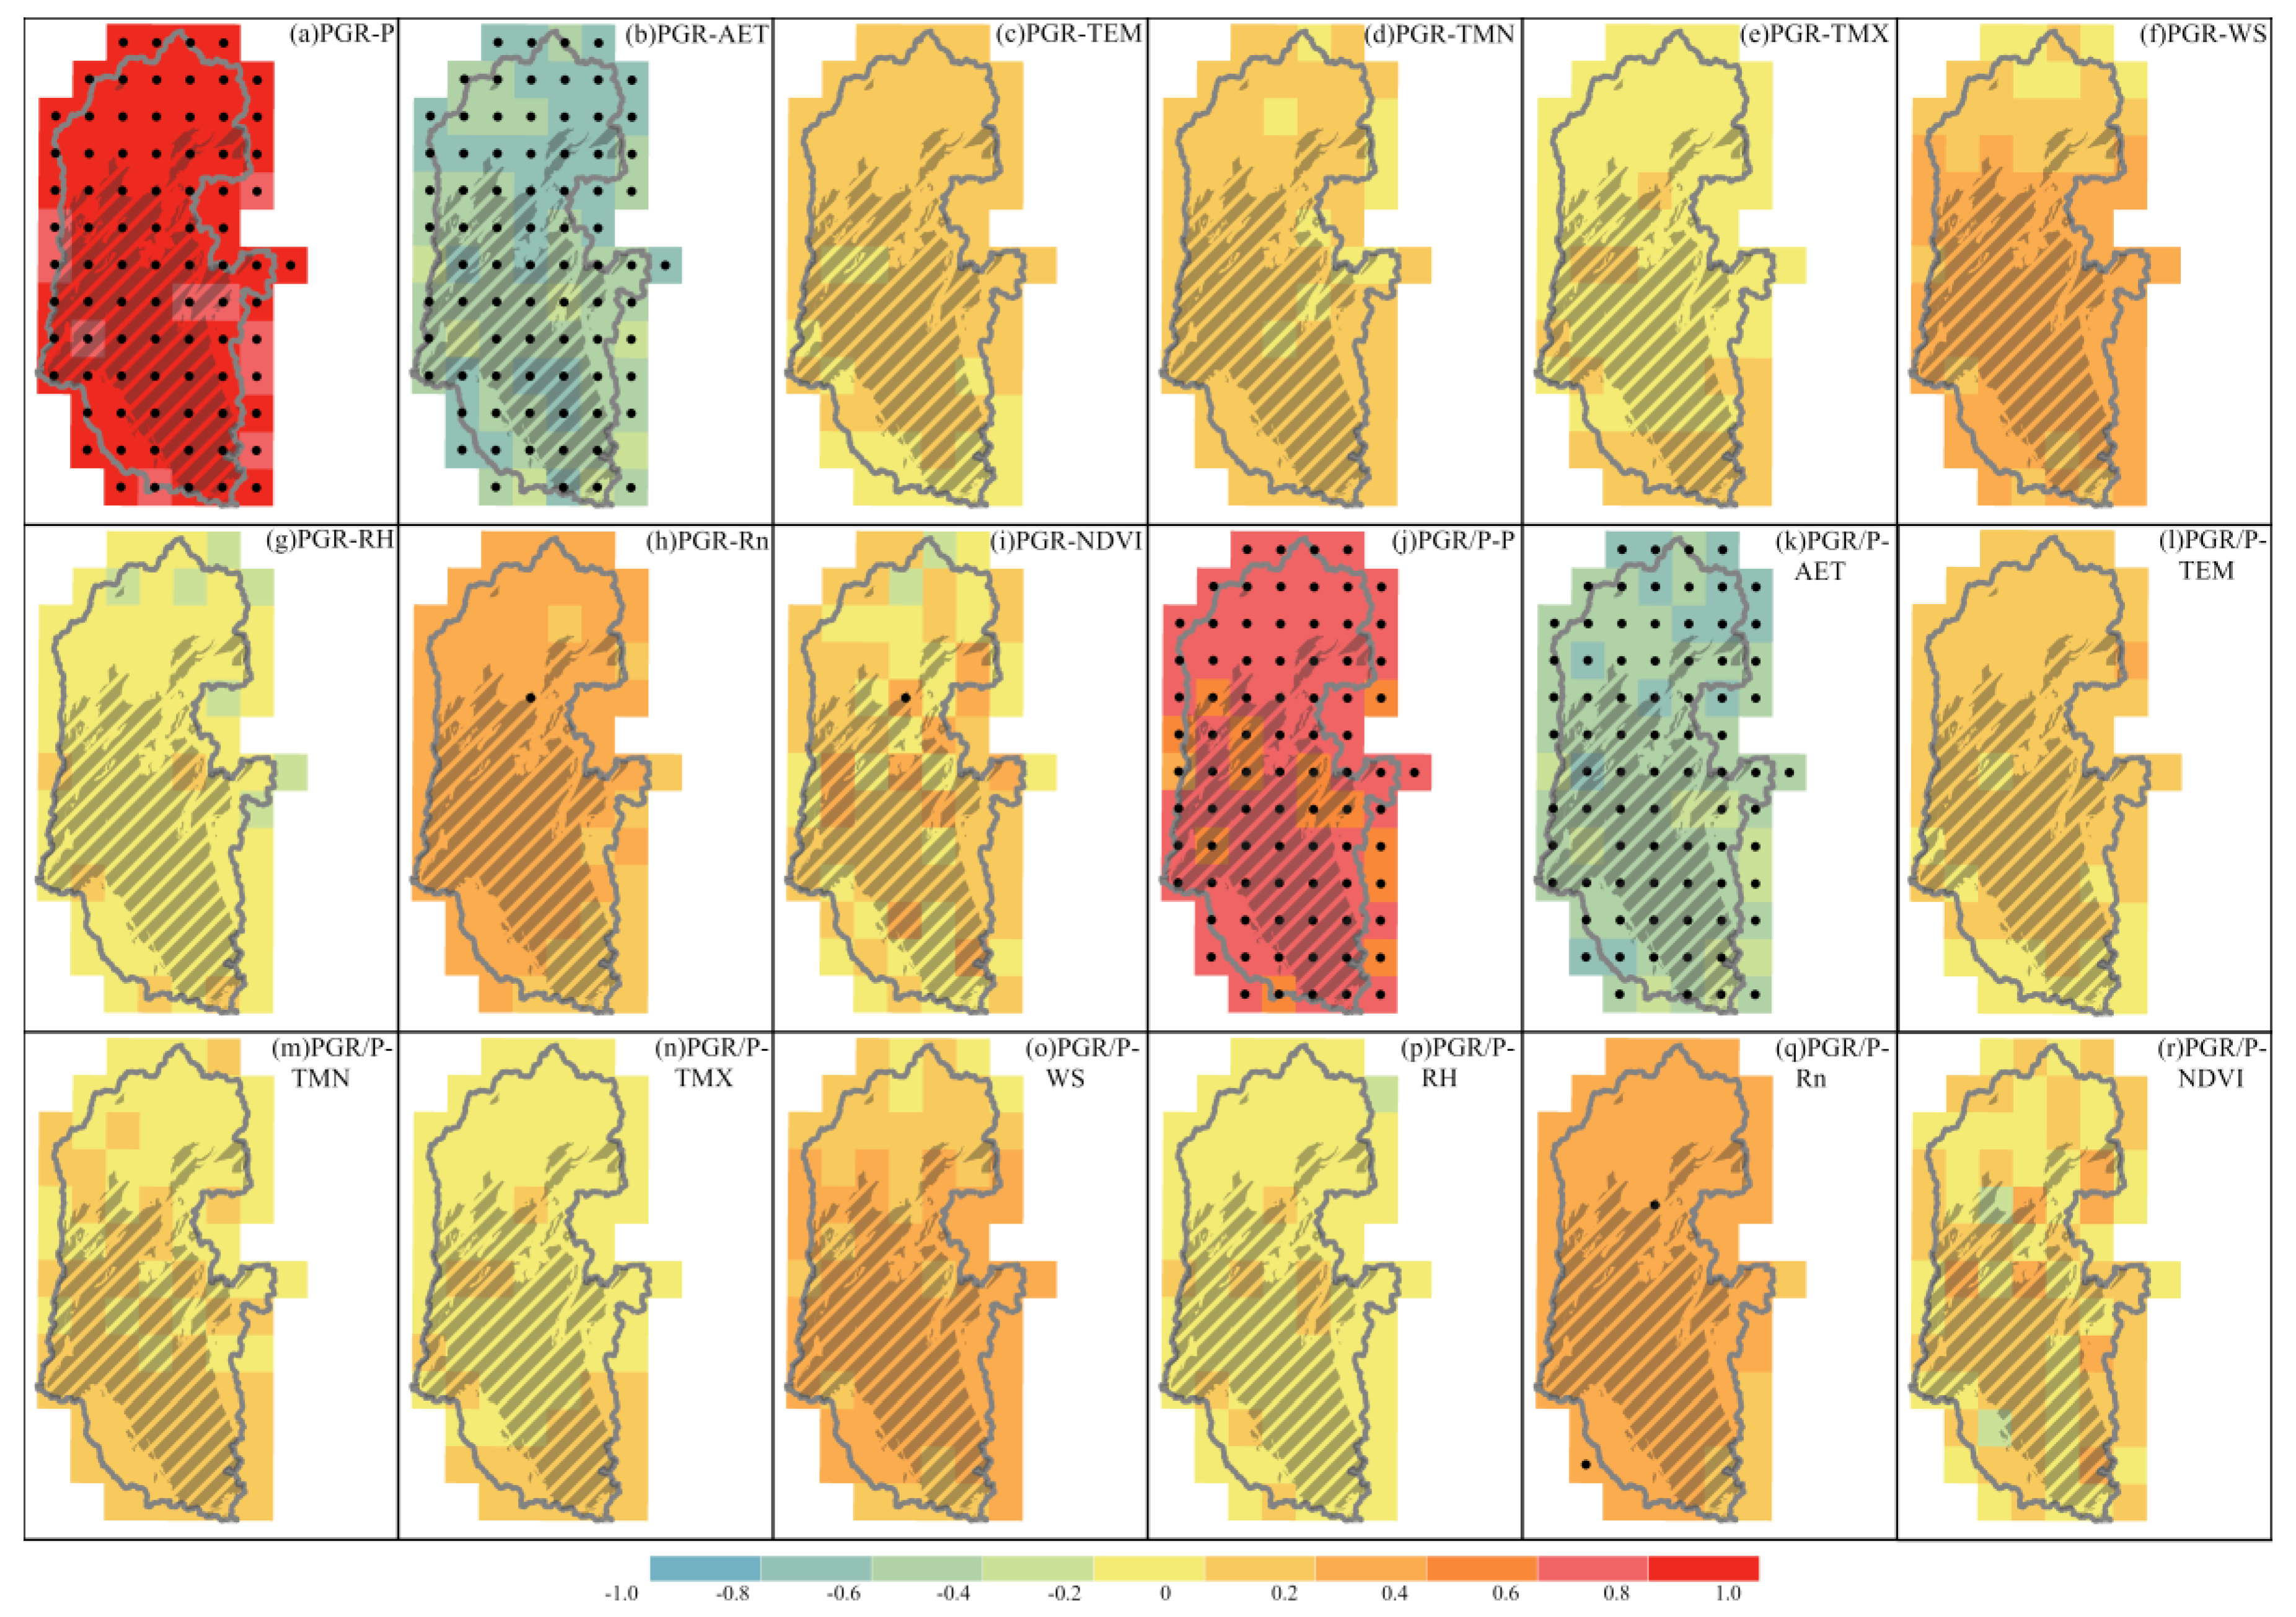
To analyze the spatial impacts of different driving factors on the PGR process, a partial correlation analysis was conducted between PGR, PGR/P, and AET with meteorological factors and NDVI for each pixel for 1982–2020 (Figure 7 and Figure 8). Overall, PGR and PGR/P exhibited a negative correlation with AET, TMX, and RH. Conversely, other driving forces exhibited a positive correlation with PGR and PGR/P (Figure 7a–r). Across the basin, PGR and PGR/P were strongly correlated with P and AET, albeit PGR and PGR/P showed no statistically significant correlation with NDVI. Thus, changes in PGR and PGR/P were mainly influenced by changes in P and AET in the LRB.
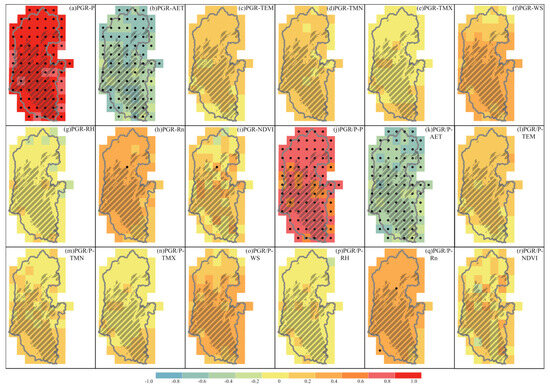
Figure 7.
Spatial distribution of partial coefficients between PGR and PGR/P and P (a–j), AET (b–k), TEM (c–i), TMN (d–m), TMX (e–n), WS (f–o), RH (g–p), Rn (h–q), and NDVI (i–r) from 1982 to 2020. Areas with significant change (p < 0.05) based on the t-test are stippled. Lined areas represent karst regions.
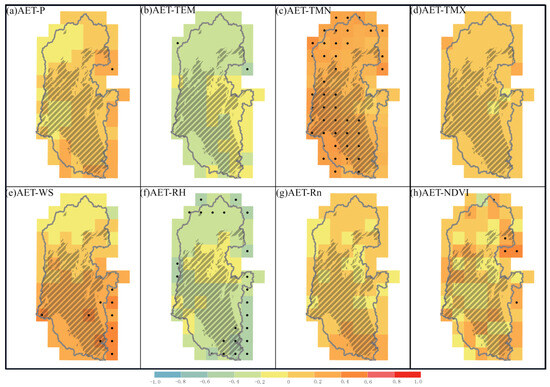
Figure 8.
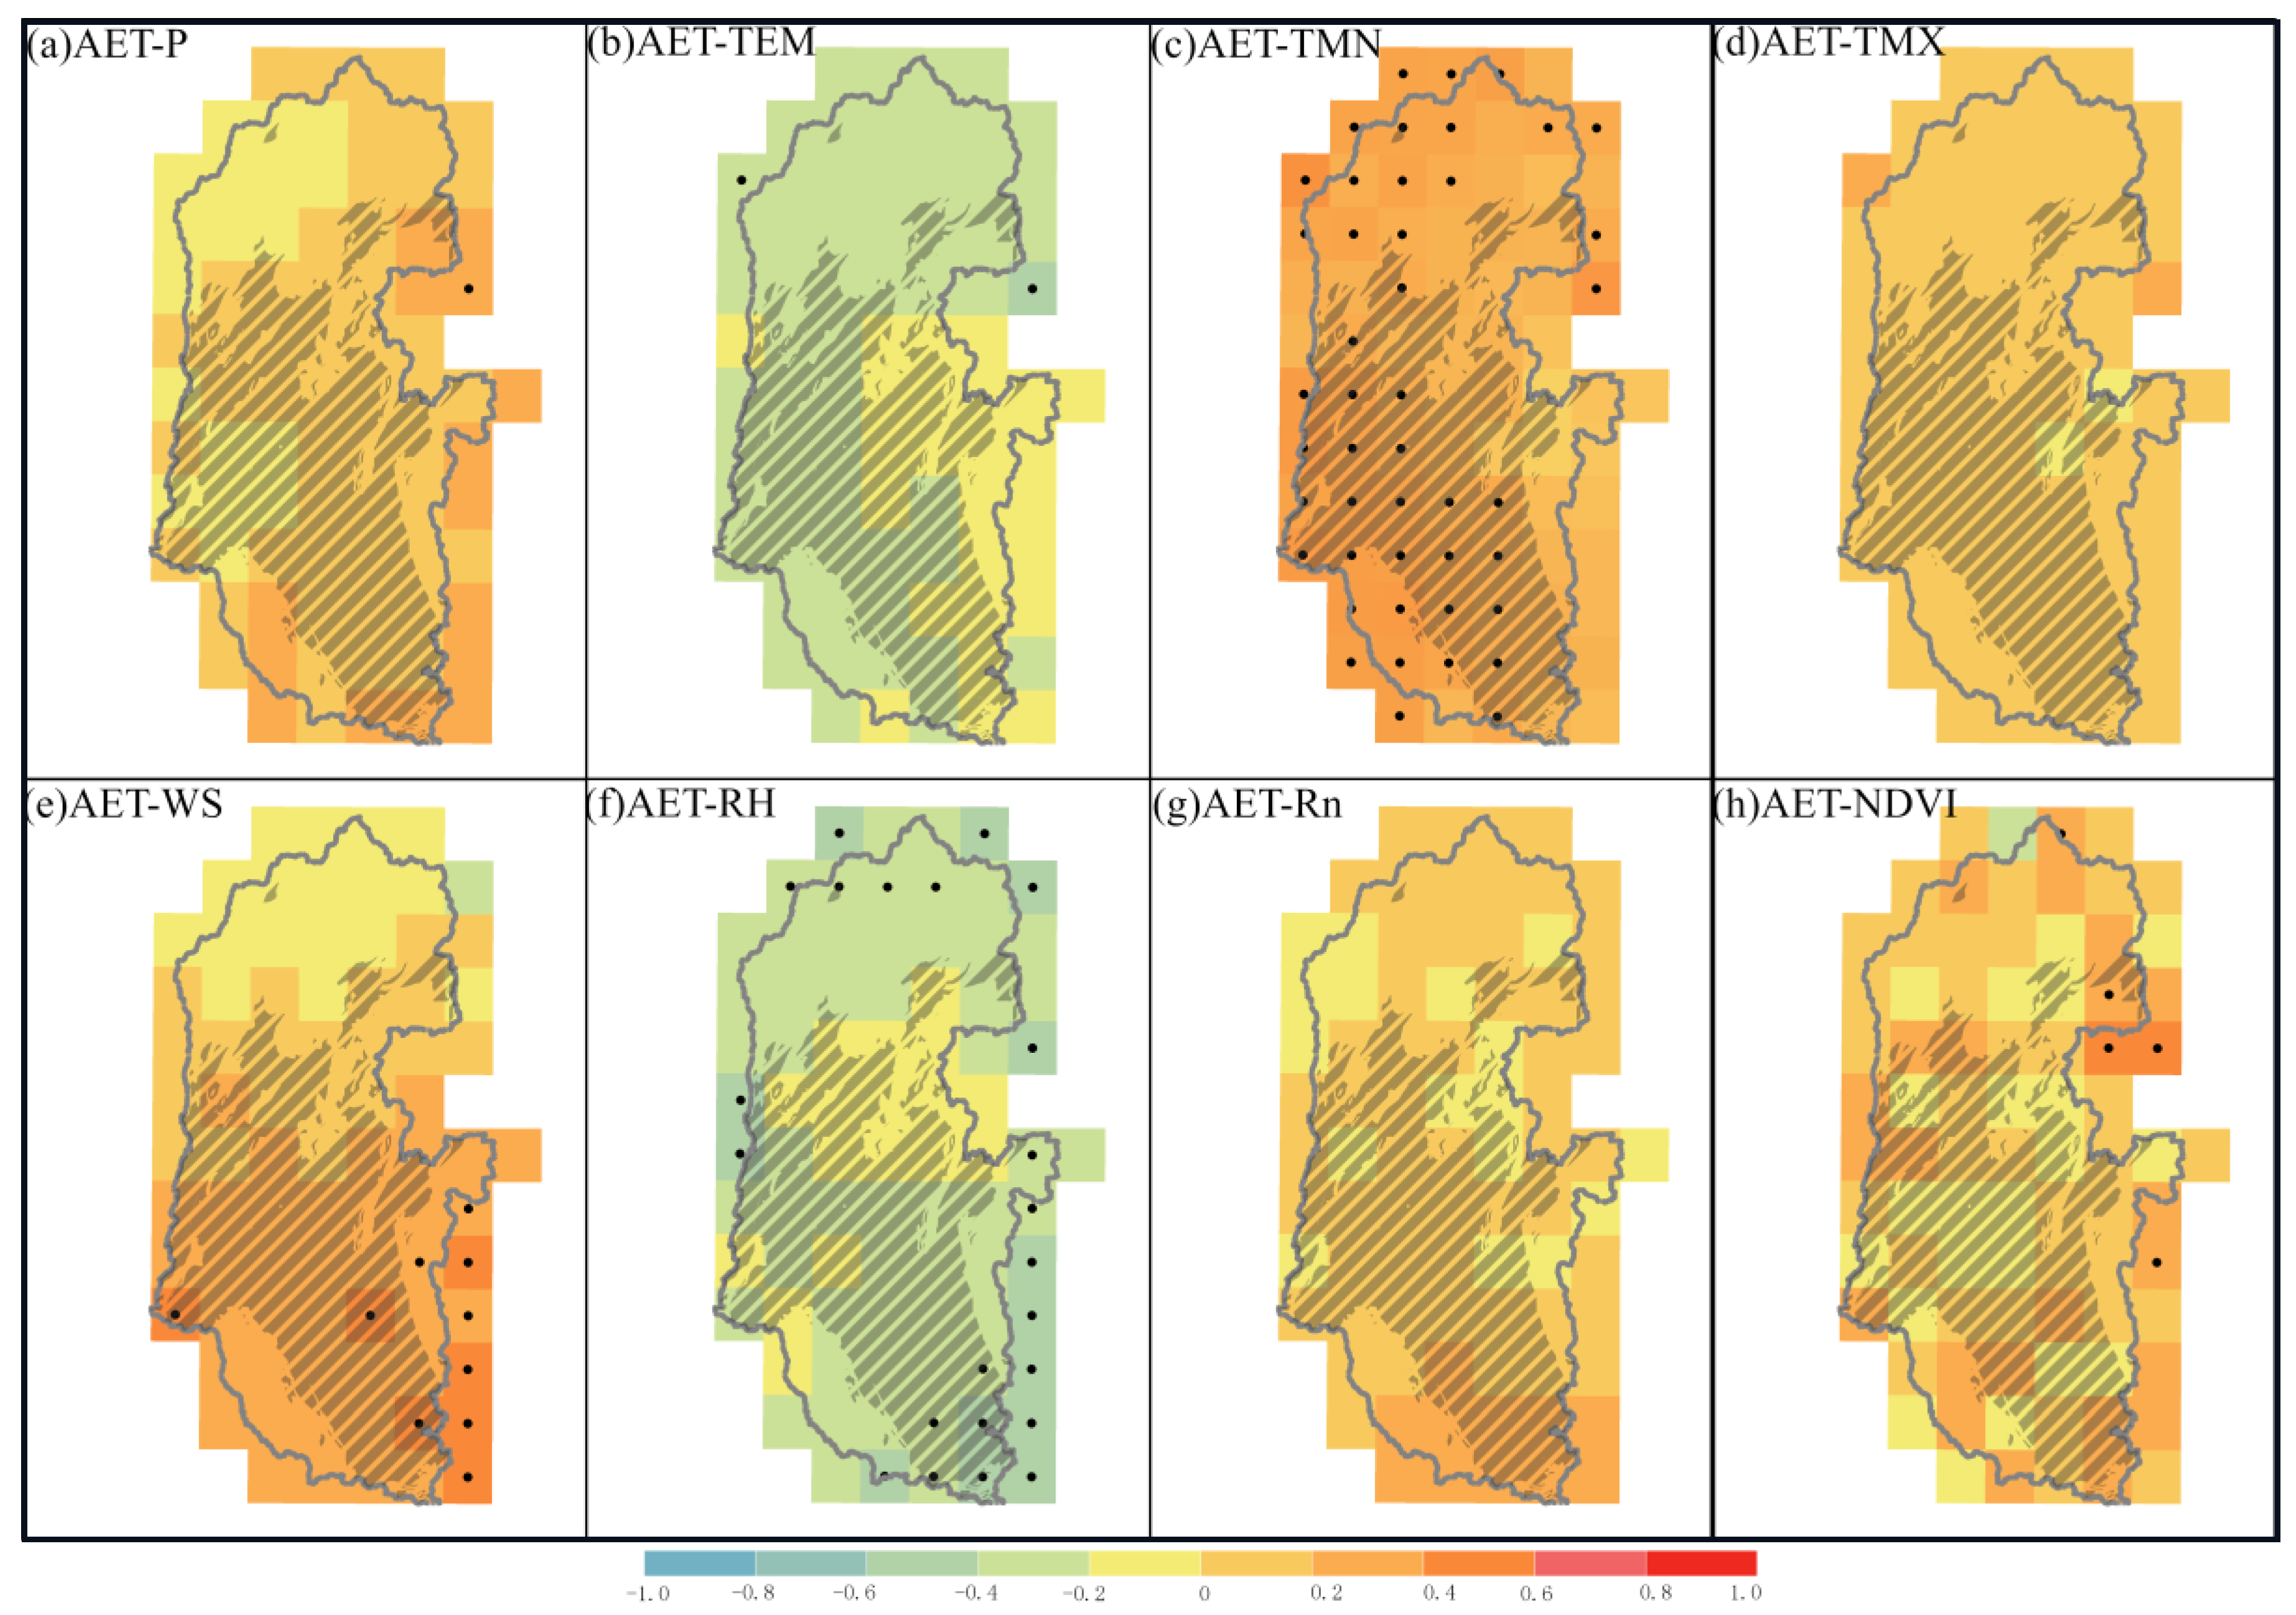
Spatial distribution of partial coefficients between AET and P (a), TEM (b), TMN (c), TMX (d), WS (e), RH (f), Rn (g), and NDVI (h) from 1982 to 2020. Areas with significant change (p < 0.05) based on the t-test are stippled. Lined areas represent karst regions.
AET was negatively correlated with TEM and RH, whereas all other factors were positively correlated with AET (Figure 8a–h). AET was typically significantly correlated with TMN in the southeastern region of the LRB, as well as with WS in both the southeastern and northern areas, and with RH. However, NDVI was generally not significantly correlated with AET. Thus, in the LRB, changes in AET are primarily influenced by change in TMN, WS, and RH.
4.4. Causes of the Variability in PGR, PGR/P, and AET
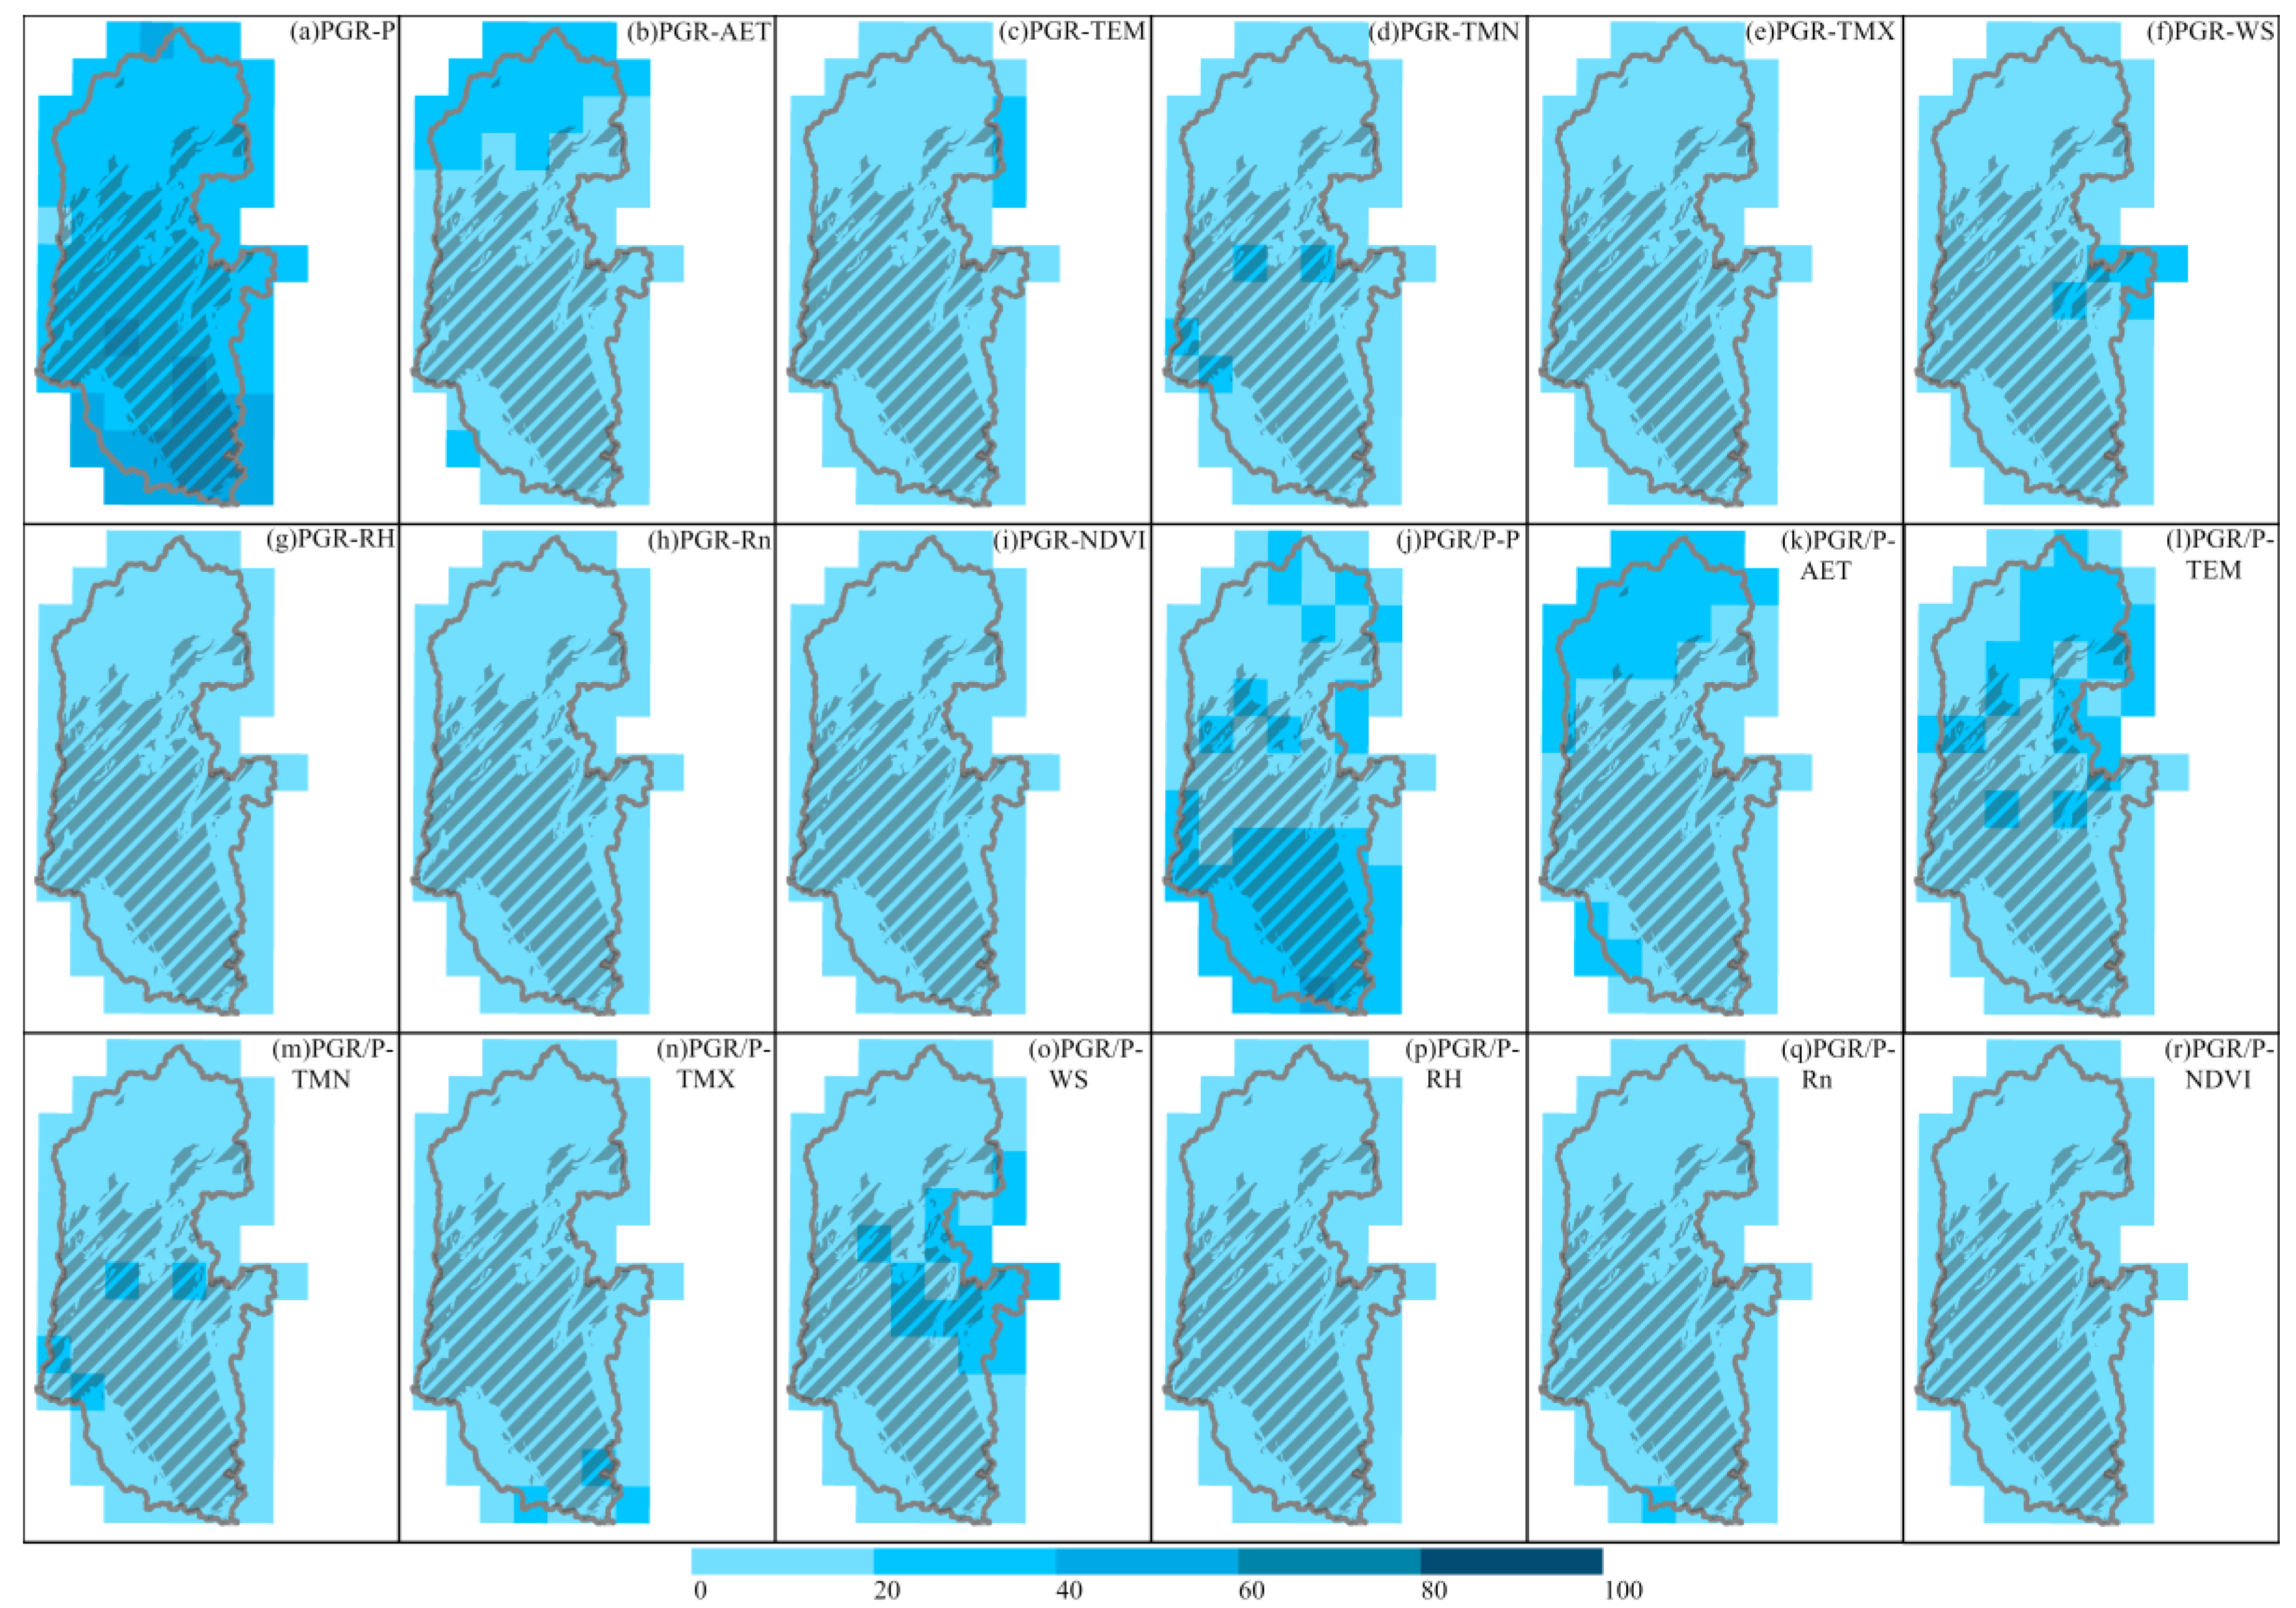
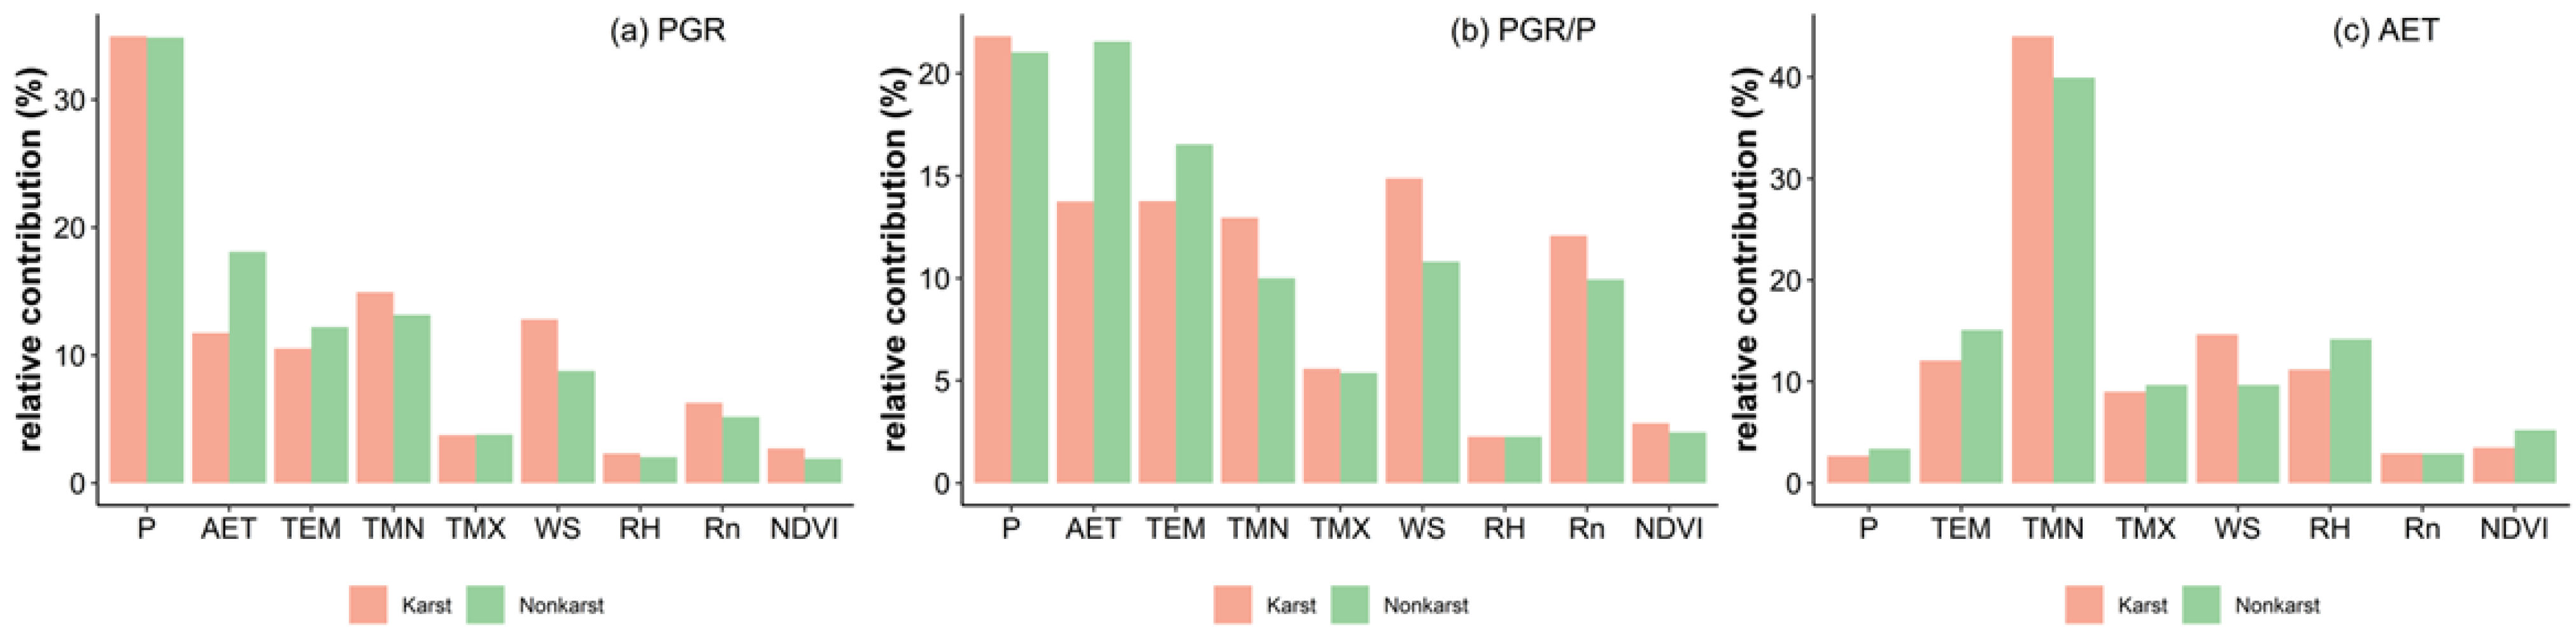
A ridge regression of PGR, PGR/P, and AET on each pixel for 1982–2020 was undertaken to evaluate the relative impacts of meteorological factors and NDVI on changes in PGR, PGR/P, and AET (Figure 9 and Figure 10). The results indicated that in the LRB, the climatic variables and NDVI contributed the most to PGR, followed by P (34.89%), AET (14.92%), TMN (14.04%), and RH having the lowest contribution (2.17%), with vegetation dynamics also having a low contribution (2.34%) (Figure 9). TMN and WS in the karst areas contributed more to PGR, while AET and TEM contributed less than in the non-karst areas. (Figure 11a).

Figure 9.
Spatial distribution of P (a–j), AET (b–k), TEM (c–l), TMN (d–m), TMX (e–n), WS (f–o), RH (g–p), Rn (h–q), and NDVI (i–r) on the relative contributions to PGR and PGR/P trends for 1982–2020. Lined areas represent karst regions.
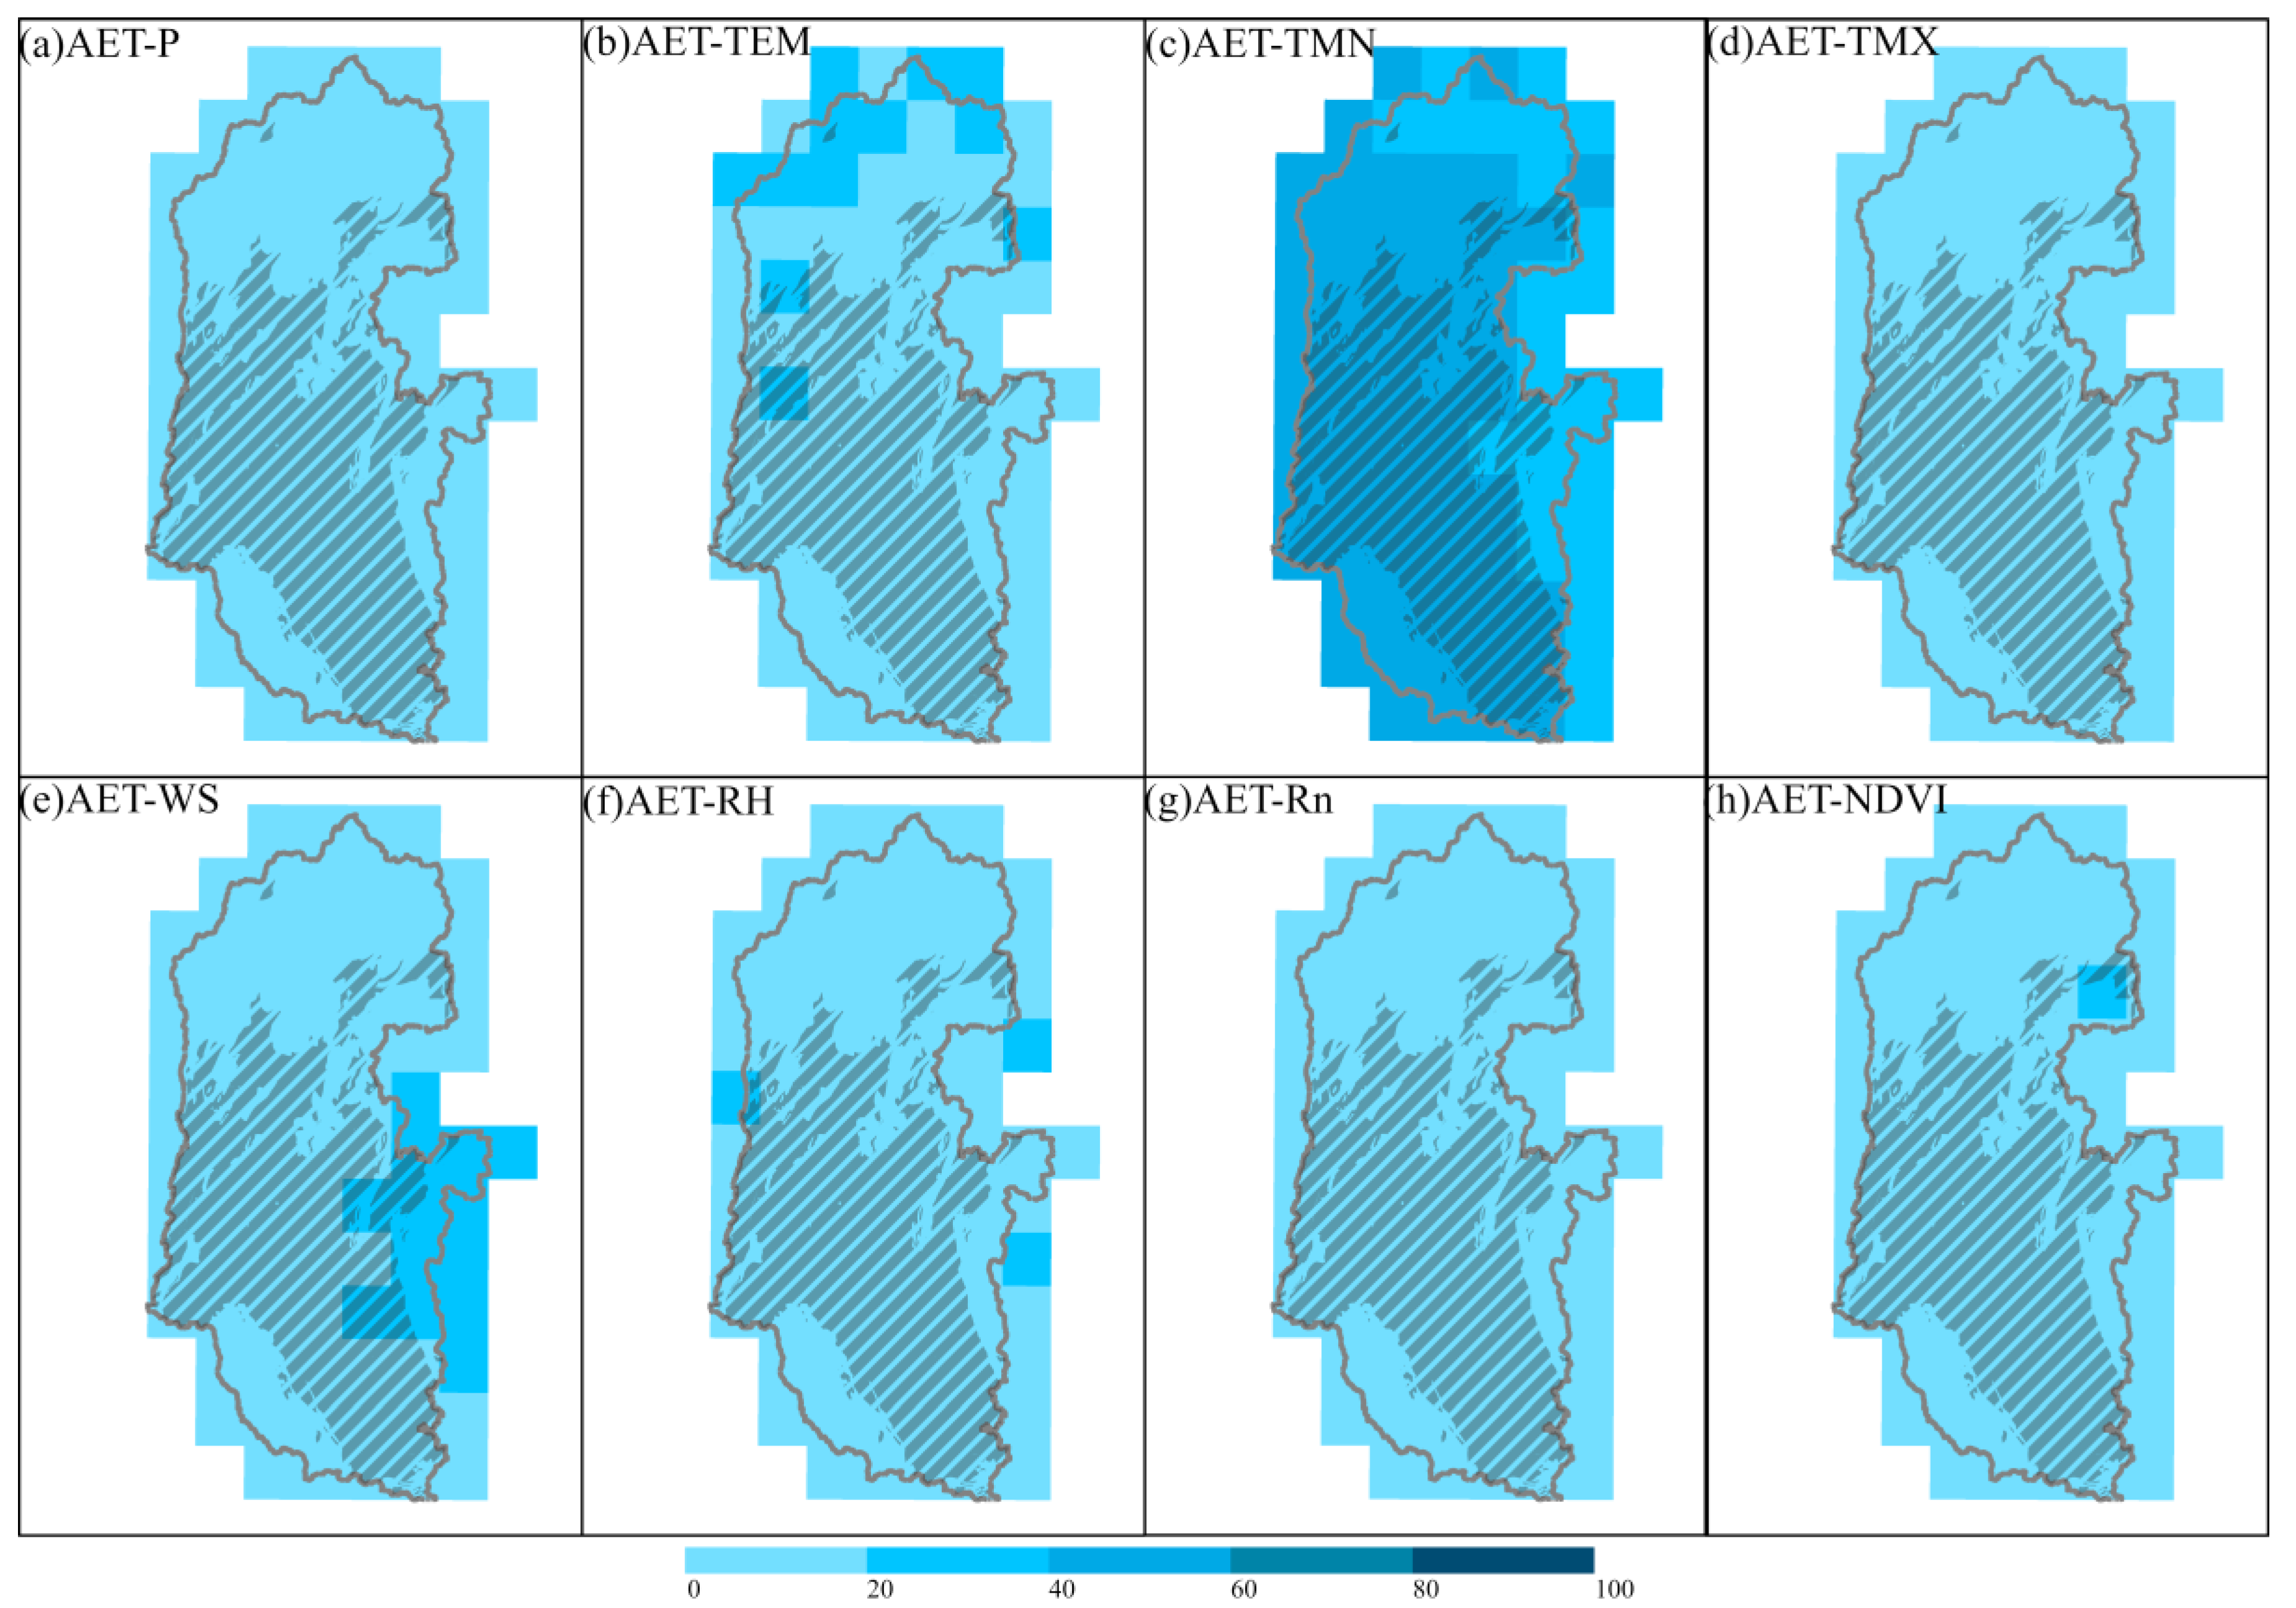
Figure 10.
Spatial distribution of P (a), TEM (b), TMN (c), TMX (d), WS (e), RH (f), Rn (g), NDVI (h) on those of relative contributions to AET trends for 1982–2020. Lined regions represent karst regions.
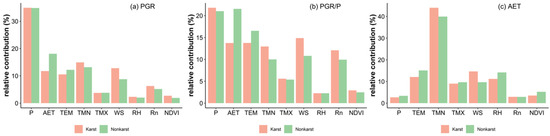
Figure 11.
Mean relative contribution of climatic factors and NDVI to trends in PGR (a), PGR/P (b), and AET (c) for karst and non-karst regions for 1982–2020.
The results of the ridge regression analysis implied that the climatic variables and NDVI contributed the most to PGR/P in the LRB, followed by P (21.42%), AET (17.65%), and TEM (15.15%), with RH having the lowest contribution (2.27%). Vegetation dynamics had a lower contribution (2.71%) (Figure 9). TMN, WS, and Rn in karst areas contributed more to PGR/P, while AET and TEM contributed less than in the non-karst areas (Figure 11b).
The results from the ridge regression analysis indicated that the climatic variables and NDVI contributed the most to AET in the LRB, followed by TMN (42.14%) and TEM (13.45%). Rn showed the lowest contribution (2.90%), with vegetation dynamics also having a low contribution (4.29%) (Figure 10). TMN and WS in karst areas contributed more to AET, while RH and TEM contributed less than in the non-karst areas (Figure 11c).
4.5. Temporal Variability of PGR and GWD
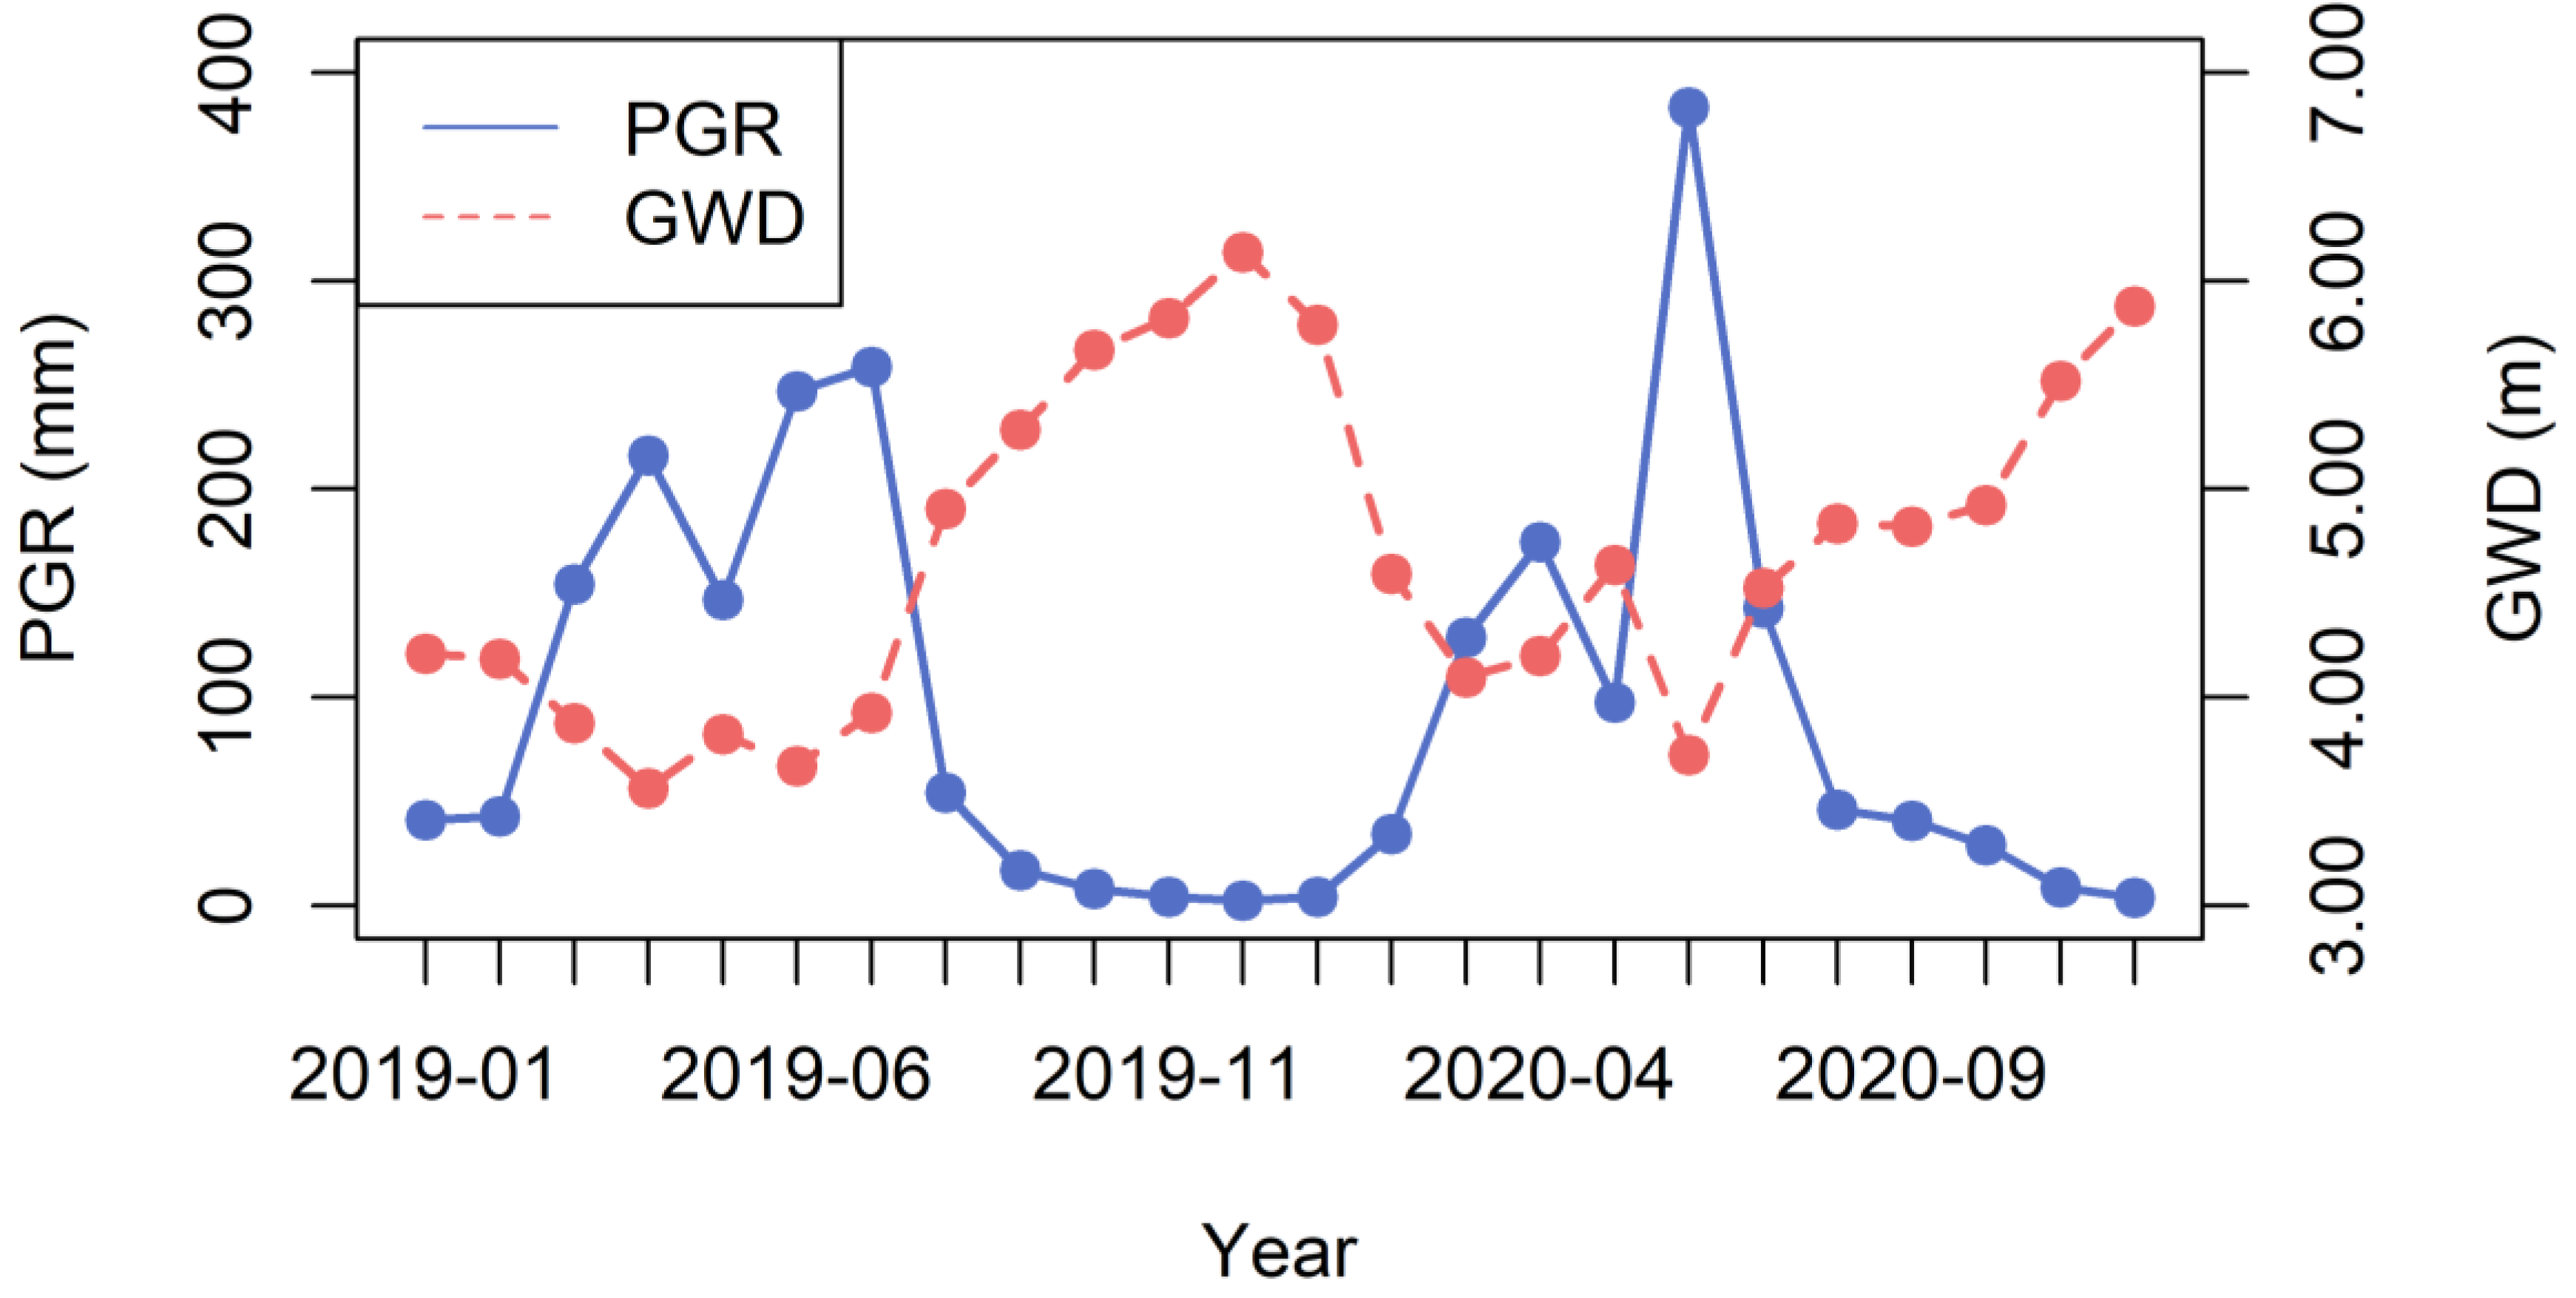
To explain the negative correlation between PGR and GWD, the trends in PGR and GWD for 2019–2020 were plotted. As can be seen in Figure 12, the trends in PGR and GWD were consistent, which indicated that PGR was good match for the changes in GWD (Figure 12). The historical PGR maximum (June 2020) and minimum (December 2019) were 383.08 mm and 2.45 mm, respectively, while the historical GWD maximum (December 2020) and minimum (April 2019) were 6.14 m and 3.56 m, respectively. With the arrival of summer, rainfall increased, the potential groundwater recharge improved, and groundwater storage was restored. However, the groundwater depth steadily increased in winter as adequate rainfall could not recharge it.
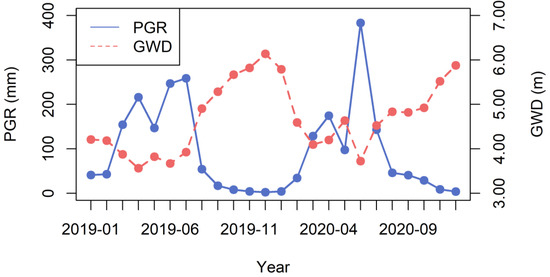
Figure 12.
Trends in PGR and GWD in the LRB for 2019–2020.
5. Discussion
5.1. Spatiotemporal Variations and Influencing Factors of PGR, PGR/P, and AET
PGR and AET are important elements of hydrological processes, which are both influenced by climate change and shifts in vegetation. From 1982 to 2020, the rates of increase in PGR, PGR/P, and AET in karst areas were recorded at 4.9 mm/y, 0.0011, and 1.4 mm/y, respectively. In non-karst areas, these indicators exhibited increases of 3.8 mm/y, 0.00053, and 1.6 mm/y, respectively. The increasing trends in PGR and AET have been confirmed in multiple studies [43,44]. The results indicate that the rate of change in PGR within karst areas was greater than in non-karst areas, while conversely, the rate of change in AET was greater in non-karst areas compared with karst areas. Moreover, the trend in AET growth was statistically significant for both regions (p < 0.05).
This study revealed that rainfall was the dominant driver behind the changes in PGR, PGR/P, with close and dominant contributions in both karst and non-karst regions, which is consistent with many other findings [9,10,11]. In Oemau Spring, Rote Island, Klaas et al. [12] estimated a 2.48% drop in groundwater recharge for 2020–2059 due to a 5.24% decrease in rainfall, and a 12.85% rise in recharge for 2060–2079 due to a 17.81% increase in rainfall. The dominant driver varies with climatic characteristics in different areas. The LRB is located in a monsoon and humid region, where changes in PGR are mainly influenced by variations in rainfall. However, in arid regions, changes in evapotranspiration are the dominant factors affecting PGR [45]. In addition, the karst landforms widely distributed in the LRB have high-permeability characteristics (such as the development of fractures and pipeline systems), which enable rainfall to rapidly recharge groundwater. The abundant precipitation and the high-permeability formation determine the dominant position of rainfall in the recharge process of humid karst basins. In the same climatic setting, changes in the recharge and recharging rate in the non-karst region were more responsive to AET than in the karst region, although the contribution of the remaining meteorological elements to the two regions was less diverse. In general, most of the AET was consumed by vegetation [18,46,47]. Karst landscapes are typically distinguished by thin soil layers, deep water tables, and high infiltration capacities [48]. Thin soil layers translate to a low soil water-holding capacity, while soil resident water is the main water resource for vegetation, albeit vegetation in karst regions can also take up water from the epikarst [49]. The greater susceptibility of non-karst recharge to AET is partly due to the fact that when the demand for AET increases, the low water-holding capacity of the soil in karst areas limits the amount of water available to meet the AET demand, and partly because non-karst areas are dominated by forests. In contrast, karst areas are dominated by arable land and grassland; thus, non-karst areas have a greater demand for AET than do karst areas.
The results of our research also revealed that variations in the AET of the two regions were predominantly driven by meteorological factors, the contributions of which were similar with TMN playing a prominent role (42.14%). The results of this paper were similar to those of previous authors [47,50,51]. According to the Budyko theory, in humid locations, the quantity of accessible energy has a considerable effect on AET due to significant water supplies [52]. Zhang et al. [52] employed numerical experimental techniques and sensitivity analyses to estimate the impacts of climate change and the contributions of vegetation greening to AET changes. They reported that the contribution of climate change was >90%, with temperature being the most critical factor, followed by ambient atmospheric water stress. In our study area, the LRB had an average annual rainfall of 1941.5 mm, a maximum annual rainfall of 2460.7 mm, and relative air humidity ranging from 79 to 82%. The humid climatic conditions stimulated the growth of dense vegetation, which made TMN dominant and the role of other climatic factors relatively weak and different from the outcomes of preceding studies.
5.2. Implications of Vegetation Restoration Activities
This study employed NDVI as a metric for assessing the restoration of vegetation, with the results indicating that the correlations between NDVI and both recharge and evapotranspiration were weaker than those observed with most meteorological factors in both karst and non-karst areas (Figure 11a–c). This phenomenon was also observed in earlier studies [52,53,54]. Vegetation exhibits a strong correlation with certain physical variables, including soil moisture, runoff capacity, and porosity, which thereby augment its explanatory significance and establish it as the second most influential factor that impacts groundwater recharge [55,56,57]. Vegetation dynamics are intimately involved with evapotranspiration and groundwater recharge [15,16,17]. However, in humid catchments, NDVI was found to have a reduced impact on hydrological processes [52]. In humid locations, vegetation dynamics had minimal effects on changes in the AET, but modified the proportion of its constituents [52]. At the same time, in our study area, the area with LUCC is relatively small. From 1995 to 2015, the proportion of area changes in forests and cropland was less than 1% [58]. Therefore, the impact of NDVI on the hydrological processes in the watershed is extremely weak. In subsequent studies, we need to increase the resolution of the data to obtain more accurate results.
In addition, the interrelationships between vegetation and climatic conditions remain a significant consideration that cannot be overlooked [54]. Changes in vegetation directly impact PGR via interception, and can also indirectly influence PGR by affecting soil water cycling and evapotranspiration [55,59,60]. Theoretically, temperature and precipitation are also affected by vegetation cover [61]. Based on satellite observations, Li et al. [62] discovered that deforestation led to a significant increase in average temperatures in tropical areas by 0.28 K/decade, and a reduction in average temperatures in boreal areas by −0.55 K/decade. Further, Yu et al. [61]) reported that summer precipitation increased by 0.02 mm/d as a result of China’s widespread greening efforts. Additionally, Anurag et al. [55] observed that vegetation may modify the effects of climate anomalies on recharge variability, which made temperature more relevant than precipitation in terms of recharge variability. The detailed dynamics of land-use and land-cover changes, together with the indirect effects of vegetation dynamics on recharge through the coordination of climate anomalies, warrant further exploration in the future.
5.3. Uncertainty Analysis
Direct and indirect validation (Figure 3 and Figure 4) revealed that the V2karst model was able to efficiently simulate AET and PGR dynamics in karst basins. There was substantially strong negative correlation between GWD and PGR, which could be used as a soft rule to ensure that changes in groundwater recharge were consistent with observations toward improving model accuracy. However, the acquisition of large-scale/long-term series of groundwater level data is time-consuming and labor-intensive for karst watersheds with high spatial heterogeneity. Furthermore, the V2karst model still has limitations when simulating karst hydrological processes, which require improvement in the future.
Firstly, Varkarst models may exhibit inadequate forecasts during low flow conditions as the result of recharge modeling [24]. Xu et al. [63] reported that the integration of karst landscapes with different hydrological processes (hillslopes and depressions) into karst models improved the simulation of peak and recession hydrological phases. Secondly, the corrected data used in this research were from ERA5_Land, which has variable performance in different regions [64]. To reduce uncertainty, some researchers employ indirect evaluation methods (e.g., Three Cornered Hat, averaging, and machine learning) to assess the performance of multiple products to determine which is best [65]. Thirdly, relative contribution analyses consider drivers that are relatively independent of each other, without considering the interactions between factors (e.g., greening influencing alterations in surface temperature and albedo [66], as well as complex interactions that exist between temperature and precipitation [67]).
In summary, the V2karst model is recommended for use in karst areas, as it effectively simulates hydrological processes with high spatial heterogeneity (Figure 3 and Figure 4). This research analyzed the hydrological responses to climate change and greening solely in the karst and non-karst areas of the Chinese Karst Basin; a region with abundant precipitation (~2000 mm/y) and rain–heat symbiosis. To address potential uncertainties in the model structure, it is recommended that the V2karst model be utilized for a comprehensive analysis of karst and non-karst differences across various latitudes and climatic zones. The objective is to derive general conclusions related to the hydrological responses of both karst and non-karst systems regarding climate change and global greening. It is also suggested that future research should employ improved models and highly precise data that is enhanced through fitting or machine learning to advance simulation accuracy for other karst areas.
6. Conclusions
The spatiotemporal patterns of PGR, PGR/P, and ATE were analyzed utilizing a locally calibrated V2karst model for 1982–2020, which focused on karst and non-karst regions. Using partial correlation and attribution analysis, this study evaluated the primary driving factors that influenced PGR and AET, and evaluated the effects of vegetation restoration on these metrics. Overall, the V2karst model demonstrated a strong capacity to accurately track changes in AET and GWD in the LRB, which is suitable for use in karst areas. The following conclusions are drawn:
- (1)
- During the study period, PGR, PGR/P, and AET exhibited increases at rates of 4.4 mm/y, 0.00086, and 1.6 mm/y, respectively. The growth rate of AET in non-karst areas was 14% faster than that in karst areas, and the growth rate of PGR in karst areas was 12.8% faster than that in non-karst areas.
- (2)
- In the case of a humid climate and stable LUCC, NDVI exhibited modest effects on PGR, PGR/P, and AET changes in humid catchments.
- (3)
- TMN was the key factor that determined the changes in AET in the LRB (42.14%). P and AET were the key factors that determined the changes in PGR and PGR/P in the LRB, where P was dominant (34.89%). Moreover, changes in the recharge and recharging rate in the non-karst region were more responsive to AET than in the karst region. Generally, climate change was the primary driving factor of hydrological processes in the basin, while vegetation restoration had a less significant impact.
Author Contributions
X.T.: investigation, methodology, software, and writing—original draft; Y.D.: conceptualization, methodology, funding acquisition, and writing—review and editing; Y.W.: investigation and writing—review and editing; L.P.: methodology; Y.C.: investigation; J.C.: investigation. All authors have read and agreed to the published version of the manuscript.
Funding
Financial support for this research was provided by the Key Projects of Guangxi Natural Science Foundation (2022GXNSFDA035067) and the National Natural Science Foundation of China (42272298).
Data Availability Statement
The datasets used in the current study are available from the corresponding author on reasonable request.
Conflicts of Interest
The authors declare that they have no known competing financial interests or personal relationships that might have appeared to influence the work reported in this paper.
Abbreviations
| PGR | Potential groundwater recharge |
| PGR/P | Potential groundwater recharge as a proportion of precipitation |
| AET | Actual evapotranspiration |
| PER | Potential evapotranspiration |
| GWD | Groundwater depth |
| P | Precipitation |
| TEM | Mean temperature |
| TMN | Minimum temperature |
| TMX | Maximum temperature |
| Rn | Net radiation |
| RH | Relative humidity |
| WS | Wind speed |
| NDVI | Normalized Difference Vegetation Index |
| LUCC | Land cover/use change |
| LRB | Lijiang River Basin |
References
- Ford, D.; Williams, P.W. Karst Hydrogeology and Geomorphology, rev. ed.; John Wiley & Sons: Chichester, UK; Hoboken, NJ, USA, 2007; ISBN 978-0-470-84996-5. [Google Scholar]
- Zeng, F.; Jiang, Z.; Shen, L.; Chen, W.; Yang, Q.; Zhang, C. Assessment of Multiple and Interacting Modes of Soil Loss in the Karst Critical Zone, Southwest China (SWC). Geomorphology 2018, 322, 97–106. [Google Scholar] [CrossRef]
- Deng, Y.; Jiang, Z.C. Characteristic of Rocky Desertification and Comprehensive Improving Model in Karst Peak-Cluster Depression in Guohua, Guangxi, China. Procedia Environ. Sci. 2011, 10, 2449–2452. [Google Scholar] [CrossRef]
- Chang, J.; Li, Q.; Zhai, L.; Liao, C.; Qi, X.; Zhang, Y.; Wang, K. Comprehensive Assessment of Rocky Desertification Treatment in Southwest China Karst. Land Degrad. Dev. 2024, 35, 3461–3476. [Google Scholar] [CrossRef]
- Yue, Y.; Qi, X.; Wang, K.; Liao, C.; Tong, X.; Brandt, M.; Liu, B. Large Scale Rocky Desertification Reversal in South China Karst. Prog. Phys. Geogr. Earth Environ. 2022, 46, 661–675. [Google Scholar] [CrossRef]
- Hartmann, A.; Goldscheider, N.; Wagener, T.; Lange, J.; Weiler, M. Karst Water Resources in a Changing World: Review of Hydrological Modeling Approaches: KARST WATER RESOURCES PREDICTION. Rev. Geophys. 2014, 52, 218–242. [Google Scholar] [CrossRef]
- Chang, Y.; Liu, Y.; Liu, L. Contrasting Hydrological Responses to Climate Change in Two Adjacent Catchments Dominated by Karst and Nonkarst. J. Hydrol. 2023, 625, 130013. [Google Scholar] [CrossRef]
- Taylor, R.G.; Scanlon, B.; Döll, P.; Rodell, M.; Van Beek, R.; Wada, Y.; Longuevergne, L.; Leblanc, M.; Famiglietti, J.S.; Edmunds, M.; et al. Ground Water and Climate Change. Nat. Clim. Change 2013, 3, 322–329. [Google Scholar] [CrossRef]
- Hu, W.; Wang, Y.Q.; Li, H.J.; Huang, M.B.; Hou, M.T.; Li, Z.; She, D.L.; Si, B.C. Dominant Role of Climate in Determining Spatio-Temporal Distribution of Potential Groundwater Recharge at a Regional Scale. J. Hydrol. 2019, 578, 124042. [Google Scholar] [CrossRef]
- Muhumure, J.; Pohl, E.; Schulz, S. Assessing the Impact of Climate Change on Spring Discharge Using Hydrological Modelling in Musanze District, Rwanda. Hydrogeol. J. 2024, 32, 1909–1923. [Google Scholar] [CrossRef]
- Ndehedehe, C.E.; Adeyeri, O.E.; Onojeghuo, A.O.; Ferreira, V.G.; Kalu, I.; Okwuashi, O. Understanding Global Groundwater-Climate Interactions. Sci. Total Environ. 2023, 904, 166571. [Google Scholar] [CrossRef]
- Klaas, D.K.S.Y.; Imteaz, M.A.; Sudiayem, I.; Klaas, E.M.E.; Klaas, E.C.M. Assessing Climate Changes Impacts on Tropical Karst Catchment: Implications on Groundwater Resource Sustainability and Management Strategies. J. Hydrol. 2020, 582, 124426. [Google Scholar] [CrossRef]
- Liu, M.; Xu, X.; Wang, D.; Sun, A.Y.; Wang, K. Karst Catchments Exhibited Higher Degradation Stress from Climate Change than the Non-Karst Catchments in Southwest China: An Ecohydrological Perspective. J. Hydrol. 2016, 535, 173–180. [Google Scholar] [CrossRef]
- Liu, Y.; Lian, J.; Luo, Z.; Chen, H. Spatiotemporal Variations in Evapotranspiration and Transpiration Fraction Following Changes in Climate and Vegetation in a Karst Basin of Southwest China. J. Hydrol. 2022, 612, 128216. [Google Scholar] [CrossRef]
- Ashraf, S.; Ali, M.; Shrestha, S.; Hafeez, M.A.; Moiz, A.; Sheikh, Z.A. Impacts of Climate and Land-Use Change on Groundwater Recharge in the Semi-Arid Lower Ravi River Basin, Pakistan. Groundw. Sustain. Dev. 2022, 17, 100743. [Google Scholar] [CrossRef]
- Salem, A.; Abduljaleel, Y.; Dezső, J.; Lóczy, D. Integrated Assessment of the Impact of Land Use Changes on Groundwater Recharge and Groundwater Level in the Drava Floodplain, Hungary. Sci. Rep. 2023, 13, 5061. [Google Scholar] [CrossRef] [PubMed]
- Yan, X.; Sun, J.; Li, S.; Ning, T.; Li, Z. Indirect Effects of Revegetation Dominate Groundwater Recharge Change at the Basin Scale. J. Clean. Prod. 2024, 456, 142396. [Google Scholar] [CrossRef]
- Li, X.; Gentine, P.; Lin, C.; Zhou, S.; Sun, Z.; Zheng, Y.; Liu, J.; Zheng, C. A Simple and Objective Method to Partition Evapotranspiration into Transpiration and Evaporation at Eddy-Covariance Sites. Agric. For. Meteorol. 2019, 265, 171–182. [Google Scholar] [CrossRef]
- Lian, X.; Piao, S.; Huntingford, C.; Li, Y.; Zeng, Z.; Wang, X.; Ciais, P.; McVicar, T.R.; Peng, S.; Ottlé, C.; et al. Partitioning Global Land Evapotranspiration Using CMIP5 Models Constrained by Observations. Nat. Clim. Change 2018, 8, 640–646. [Google Scholar] [CrossRef]
- Li, R.; Zheng, H.; O’Connor, P.; Xu, H.; Li, Y.; Lu, F.; Robinson, B.E.; Ouyang, Z.; Hai, Y.; Daily, G.C. Time and Space Catch up with Restoration Programs That Ignore Ecosystem Service Trade-Offs. Sci. Adv. 2021, 7, eabf8650. [Google Scholar] [CrossRef]
- Lu, C.; Zhao, T.; Shi, X.; Cao, S. Ecological Restoration by Afforestation May Increase Groundwater Depth and Create Potentially Large Ecological and Water Opportunity Costs in Arid and Semiarid China. J. Clean. Prod. 2018, 176, 1213–1222. [Google Scholar] [CrossRef]
- Zhao, M.; Geruo, A.; Zhang, J.; Velicogna, I.; Liang, C.; Li, Z. Ecological Restoration Impact on Total Terrestrial Water Storage. Nat. Sustain. 2020, 4, 56–62. [Google Scholar] [CrossRef]
- Sun, Y.; Zhang, X.; Ding, Y.; Chen, D.; Qin, D.; Zhai, P. Understanding Human Influence on Climate Change in China. Natl. Sci. Rev. 2022, 9, nwab113. [Google Scholar] [CrossRef]
- Jeannin, P.-Y.; Artigue, G.; Butscher, C.; Chang, Y.; Charlier, J.-B.; Duran, L.; Gill, L.; Hartmann, A.; Johannet, A.; Jourde, H.; et al. Karst Modelling Challenge 1: Results of Hydrological Modelling. J. Hydrol. 2021, 600, 126508. [Google Scholar] [CrossRef]
- Anderson, M.; Woessner, W.; Hunt, R. Applied Ground Water Modeling: Simulation of Flow and Advective Transport; Academic Press: San Diego, CA, USA, 2015; ISBN 978-0-12-058103-0. [Google Scholar]
- Jourde, H.; Wang, X. Advances, Challenges and Perspective in Modelling the Functioning of Karst Systems: A Review. Environ. Earth Sci. 2023, 82, 396. [Google Scholar] [CrossRef]
- Al Aamery, N.; Adams, E.; Fox, J.; Husic, A.; Zhu, J.; Gerlitz, M.; Agouridis, C.; Bettel, L. Numerical Model Development for Investigating Hydrologic Pathways in Shallow Fluviokarst. J. Hydrol. 2021, 593, 125844. [Google Scholar] [CrossRef]
- Chen, L.; Deng, J.; Yang, W.; Chen, H. Hydrological Modelling of Large-Scale Karst-Dominated Basin Using a Grid-Based Distributed Karst Hydrological Model. J. Hydrol. 2024, 628, 130459. [Google Scholar] [CrossRef]
- Liu, Y.; Wagener, T.; Hartmann, A. Assessing Streamflow Sensitivity to Precipitation Variability in Karst-Influenced Catchments with Unclosed Water Balances. Water Resour. Res. 2021, 57, e2020WR028598. [Google Scholar] [CrossRef]
- Ollivier, C.; Olioso, A.; Carrière, S.D.; Boulet, G.; Chalikakis, K.; Chanzy, A.; Charlier, J.-B.; Combemale, D.; Davi, H.; Emblanch, C.; et al. An Evapotranspiration Model Driven by Remote Sensing Data for Assessing Groundwater Resource in Karst Watershed. Sci. Total Environ. 2021, 781, 146706. [Google Scholar] [CrossRef]
- Pardo-Igúzquiza, E.; Dowd, P.; Bosch, A.P.; Luque-Espinar, J.A.; Heredia, J.; Durán-Valsero, J.J. A Parsimonious Distributed Model for Simulating Transient Water Flow in a High-Relief Karst Aquifer. Hydrogeol. J. 2018, 26, 2617–2627. [Google Scholar] [CrossRef]
- Sarrazin, F.; Hartmann, A.; Pianosi, F.; Rosolem, R.; Wagener, T. V2Karst V1.1: A Parsimonious Large-Scale Integrated Vegetation–Recharge Model to Simulate the Impact of Climate and Land Cover Change in Karst Regions. Geosci. Model Dev. 2018, 11, 4933–4964. [Google Scholar] [CrossRef]
- Hartmann, A.; Gleeson, T.; Rosolem, R.; Pianosi, F.; Wada, Y.; Wagener, T. A Large-Scale Simulation Model to Assess Karstic Groundwater Recharge over Europe and the Mediterranean. Geosci. Model Dev. 2015, 8, 1729–1746. [Google Scholar] [CrossRef]
- Kovačič, G.; Petrič, M.; Ravbar, N. Evaluation and Quantification of the Effects of Climate and Vegetation Cover Change on Karst Water Sources: Case Studies of Two Springs in South-Western Slovenia. Water 2020, 12, 3087. [Google Scholar] [CrossRef]
- Wagener, T.; Sarrazin, F.; Hartmann, A.J.; Pianosi, F.; Rosolem, R. Data Mining a Large Ensemble of Groundwater Recharge Projections under Climate and Land Use Changes across Europe. In Proceedings of the AGU Fall Meeting Abstracts, Washington, DC, USA, 10–14 December 2018; Volume 2018, p. H31F-04. [Google Scholar]
- Duan, W.; Li, H.F.; Wang, J.; Zhao, L.; Li, G.; Wang, S. The Regulation Effect of Typical Forest on Rainfall-Runoff in Upper Reaches of Lijiang River. Shengtai Xuebao 2015, 35, 663–669. [Google Scholar]
- Yang, Y.; Zhai, L.; Jia, Y.; Xue, K. An Analysis of the Change of Rainfall-Runoff Characteristics in the Lijiang River Basin under Different Types of Landuse. China Rural Water Hydropower 2022, 8, 97–105. [Google Scholar]
- Hartmann, A.; Lange, J.; Weiler, M.; Arbel, Y.; Greenbaum, N. A New Approach to Model the Spatial and Temporal Variability of Recharge to Karst Aquifers. Hydrol. Earth Syst. Sci. 2012, 16, 2219–2231. [Google Scholar] [CrossRef]
- He, Y.; Fan, G.; Zhang, X.; Liu, M.; Gao, D. Variation of Vegetation NDVI and Its Response to Climate Change in Zhejiang Province. Shengtai Xuebao/Acta Ecol. Sin. 2012, 32, 4352–4362. [Google Scholar]
- Adeyeri, O.E.; Zhou, W.; Wang, X.; Zhang, R.; Laux, P.; Ishola, K.A.; Usman, M. The Trend and Spatial Spread of Multisectoral Climate Extremes in CMIP6 Models. Sci. Rep. 2022, 12, 21000. [Google Scholar] [CrossRef]
- Zhao, Y.; Chen, Y.; Wu, C.; Li, G.; Ma, M.; Fan, L.; Zheng, H.; Song, L.; Tang, X. Exploring the Contribution of Environmental Factors to Evapotranspiration Dynamics in the Three-River-Source Region, China. J. Hydrol. 2023, 626, 130222. [Google Scholar] [CrossRef]
- Ruggieri, G.; Allocca, V.; Borfecchia, F.; Cusano, D.; Marsiglia, P.; De Vita, P. Testing Evapotranspiration Estimates Based on MODIS Satellite Data in the Assessment of the Groundwater Recharge of Karst Aquifers in Southern Italy. Water 2021, 13, 118. [Google Scholar] [CrossRef]
- Fu, J.; Gong, Y.; Zheng, W.; Zou, J.; Zhang, M.; Zhang, Z.; Qin, J.; Liu, J.; Quan, B. Spatial-Temporal Variations of Terrestrial Evapotranspiration across China from 2000 to 2019. Sci. Total Environ. 2022, 825, 153951. [Google Scholar] [CrossRef]
- Zhang, D.; Liu, X.; Simmons, C.T.; Zhang, L.; Zhang, Q. Changes in Groundwater Levels across China from 2005 to 2016. J. Hydrol. 2023, 623, 129781. [Google Scholar] [CrossRef]
- Wu, W.-Y.; Lo, M.-H.; Wada, Y.; Famiglietti, J.S.; Reager, J.T.; Yeh, P.J.-F.; Ducharne, A.; Yang, Z.-L. Divergent Effects of Climate Change on Future Groundwater Availability in Key Mid-Latitude Aquifers. Nat. Commun. 2020, 11, 3710. [Google Scholar] [CrossRef] [PubMed]
- Stoy, P.C.; El-Madany, T.S.; Fisher, J.B.; Gentine, P.; Gerken, T.; Good, S.P.; Klosterhalfen, A.; Liu, S.; Miralles, D.G.; Perez-Priego, O.; et al. Reviews and Syntheses: Turning the Challenges of Partitioning Ecosystem Evaporation and Transpiration into Opportunities. Biogeosciences 2019, 16, 3747–3775. [Google Scholar] [CrossRef]
- Zhao, F.; Ma, S.; Wu, Y.; Qiu, L.; Wang, W.; Lian, Y.; Chen, J.; Sivakumar, B. The Role of Climate Change and Vegetation Greening on Evapotranspiration Variation in the Yellow River Basin, China. Agric. For. Meteorol. 2022, 316, 108842. [Google Scholar] [CrossRef]
- Zhang, Z.; Chen, X.; Huang, Y.; Zhang, Y. Effect of Catchment Properties on Runoff Coefficient in a Karst Area of Southwest China. Hydrol. Process. 2014, 28, 3691–3702. [Google Scholar] [CrossRef]
- Cai, L.; Xiong, K.; Liu, Z.; Li, Y.; Fan, B. Seasonal Variations of Plant Water Use in the Karst Desertification Control. Sci. Total Environ. 2023, 885, 163778. [Google Scholar] [CrossRef]
- Chen, Y.; Xue, Y.; Hu, Y. How Multiple Factors Control Evapotranspiration in North America Evergreen Needleleaf Forests. Sci. Total Environ. 2018, 622–623, 1217–1224. [Google Scholar] [CrossRef]
- Liu, Y.J.; Chen, J.; Pan, T. Analysis of Changes in Reference Evapotranspiration, Pan Evaporation, and Actual Evapotranspiration and Their Influencing Factors in the North China Plain During 1998–2005. Earth Space Sci. 2019, 6, 1366–1377. [Google Scholar] [CrossRef]
- Zhang, D.; Liu, X.; Zhang, L.; Zhang, Q.; Gan, R.; Li, X. Attribution of Evapotranspiration Changes in Humid Regions of China from 1982 to 2016. J. Geophys. Res. Atmos. 2020, 125, e2020JD032404. [Google Scholar] [CrossRef]
- Liu, Y.; Lu, C.; Qiu, B.; Wang, J.; Chen, J.; Zhang, Y.; Wu, C.; Liu, B.; Shu, L. Spatiotemporally Non-Stationary Evolution of Groundwater Levels in Poyang Lake Basin Driven by Meteorological and Hydrological Factors. Sci. Total Environ. 2024, 950, 175244. [Google Scholar] [CrossRef]
- Yifru, B.A.; Chung, I.-M.; Kim, M.-G.; Chang, S.W. Assessing the Effect of Land/Use Land Cover and Climate Change on Water Yield and Groundwater Recharge in East African Rift Valley Using Integrated Model. J. Hydrol. Reg. Stud. 2021, 37, 100926. [Google Scholar] [CrossRef]
- Anurag, H.; Ng, G.H.C.; Tipping, R.; Tokos, K. Modeling the Impact of Spatiotemporal Vegetation Dynamics on Groundwater Recharge. J. Hydrol. 2021, 601, 126584. [Google Scholar] [CrossRef]
- Mohan, C.; Western, A.W.; Wei, Y.; Saft, M. Predicting Groundwater Recharge for Varying Land Cover and Climate Conditions—A Global Meta-Study. Hydrol. Earth Syst. Sci. 2018, 22, 2689–2703. [Google Scholar] [CrossRef]
- Riedel, T.; Weber, T.K.D. Review: The Influence of Global Change on Europe’s Water Cycle and Groundwater Recharge. Hydrogeol. J. 2020, 28, 1939–1959. [Google Scholar] [CrossRef]
- Li, N.; Wang, J.; Wang, H.; Fu, B.; Chen, J.; He, W. Impacts of Land Use Change on Ecosystem Service Value in Lijiang River Basin, China. Environ. Sci Pollut Res 2021, 28, 46100–46115. [Google Scholar] [CrossRef]
- Douinot, A.; Tetzlaff, D.; Maneta, M.; Kuppel, S.; Schulte-Bisping, H.; Soulsby, C. Ecohydrological Modelling with EcH2O-iso to Quantify Forest and Grassland Effects on Water Partitioning and Flux Ages. Hydrol. Process. 2019, 33, 2174–2191. [Google Scholar] [CrossRef]
- Ellison, D.; Morris, C.E.; Locatelli, B.; Sheil, D.; Cohen, J.; Murdiyarso, D.; Gutierrez, V.; Noordwijk, M.V.; Creed, I.F.; Pokorny, J.; et al. Trees, Forests and Water: Cool Insights for a Hot World. Glob. Environ. Change 2017, 43, 51–61. [Google Scholar] [CrossRef]
- Yu, L.; Liu, Y.; Liu, T.; Yan, F. Impact of Recent Vegetation Greening on Temperature and Precipitation over China. Agric. For. Meteorol. 2020, 295, 108197. [Google Scholar] [CrossRef]
- Li, Y.; Zhao, M.; Mildrexler, D.J.; Motesharrei, S.; Mu, Q.; Kalnay, E.; Zhao, F.; Li, S.; Wang, K. Potential and Actual Impacts of Deforestation and Afforestation on Land Surface Temperature. J. Geophys. Res. Atmos. 2016, 121, 14,372–14,386. [Google Scholar] [CrossRef]
- Xu, C.; Xu, X.; Liu, M.; Li, Z.; Zhang, Y.; Zhu, J.; Wang, K.; Chen, X.; Zhang, Z.; Peng, T. An Improved Optimization Scheme for Representing Hillslopes and Depressions in Karst Hydrology. Water Resour. Res. 2020, 56, e2019WR026038. [Google Scholar] [CrossRef]
- Yang, Y.; Lijuan, W.; Xiaoyan, H.; Yue, Q.; Rui, X. Analysis on Spatio-Temporal Variation of Evapotranspiration in the Yellow River Basin Based on ERA5-Land Products. J. Arid Meteorol. 2023, 41, 390. [Google Scholar]
- Abhishek; Kinouchi, T.; Sayama, T. A Comprehensive Assessment of Water Storage Dynamics and Hydroclimatic Extremes in the Chao Phraya River Basin during 2002–2020. J. Hydrol. 2021, 603, 126868. [Google Scholar] [CrossRef]
- Piao, S.; Wang, X.; Park, T.; Chen, C.; Lian, X.; He, Y.; Bjerke, J.W.; Chen, A.; Ciais, P.; Tømmervik, H.; et al. Characteristics, Drivers and Feedbacks of Global Greening. Nat. Rev. Earth Environ. 2019, 1, 14–27. [Google Scholar] [CrossRef]
- Ma, N.; Zhang, Y. Increasing Tibetan Plateau Terrestrial Evapotranspiration Primarily Driven by Precipitation. Agric. For. Meteorol. 2022, 317, 108887. [Google Scholar] [CrossRef]


Disclaimer/Publisher’s Note: The statements, opinions and data contained in all publications are solely those of the individual author(s) and contributor(s) and not of MDPI and/or the editor(s). MDPI and/or the editor(s) disclaim responsibility for any injury to people or property resulting from any ideas, methods, instructions or products referred to in the content. |
© 2025 by the authors. Licensee MDPI, Basel, Switzerland. This article is an open access article distributed under the terms and conditions of the Creative Commons Attribution (CC BY) license (https://creativecommons.org/licenses/by/4.0/).