Abstract
Climate change is projected to increase global temperatures and alter rainfall patterns. In Peru, these changes could adversely affect the central basin of the Huallaga River by increasing pest and disease incidence, evapotranspiration, and water consumption. This basin is one of the country’s main rice-producing regions, where the crop is traditionally cultivated using inefficient practices, such as continuous flood irrigation. This study evaluated the effects of different irrigation management strategies on the growth and yield of rice (Oryza sativa var. INIA 516 LM1-La Unión 23), the water footprint as an indicator of water use efficiency, and the incidence of pests and diseases associated with irrigation regimes. Three irrigation treatments were implemented: Traditional flooding T1 (maintenance of a 0.15 m water layer with replenishment every 4 days), Optimized flooding T2 (replenishment every 7 days), and Intermittent rainfed irrigation T3 (replenishment every 14 days). Although no significant differences were observed in biometric parameters, yield, or pest and disease incidence, a trend of decreasing yield with longer irrigation intervals was noted: traditional flooding (7.91 t∙ha−1) > reduced flooding (7.82 t∙ha−1) > intermittent rainfed (7.14 t∙ha−1). The incidence of white leaf virus and Burkholderia glumae was highest in the intermittent rainfed treatment, followed by optimized flooding, with the lowest incidence in traditional flooding. Yield reduction and the use of rainwater to cover water requirements resulted in a lower total water footprint for traditional flooding (834.0 m3∙t−1), followed by optimized flooding (843.6 m3∙t−1) and intermittent rainfed (923.9 m3∙t−1). This reflects an improvement in rainwater use efficiency. The findings suggest intermittent rainfed irrigation enhances water use efficiency without significantly compromising rice yield or increasing disease incidence in rice var. INIA 516 LM1-La Unión 23 in the central basin of the Huallaga River.
1. Introduction
The seasonality of climate variables, such as rainfall and temperature, is expected to become more pronounced due to climate change, with intensification projected toward the end of the 21st century [1]. Predictions remain inconclusive in regions with complex topography, such as the Andes and adjacent high-rainforest areas. However, multiple studies suggest increased temperature extremes and significant variability in rainfall patterns [1,2,3]. In Peru’s northern rainforest, the frequency of hot days and nights is projected to rise, while rainfall is expected to increase [2,4]. The intensity of these changes will depend on the adopted Shared Socioeconomic Pathway for the global development [5]. Thus, the potential increases of water supply would occur alongside an increase in vegetation evapotranspiration due to the temperature increasing.
While these changes may have a limited impact in high-rainfall areas, regions with dry or semi-arid climates will likely experience more severe consequences, such as the central Huallaga River basin in Peru where an increase in water consumption [6,7] is expected. These climatic shifts could lead to a higher incidence of pests and diseases, increased evapotranspiration of vegetation coverage, and, consequently, greater water consumption and more frequent droughts [8,9,10].
In this context, the efficient management of water resources is a pressing need in a world facing increasing environmental, climatic, and social challenges. As the primary water-consuming activity, agriculture is crucial in pursuing sustainable alternatives to optimize water use [11]. To this end, improving water use efficiency and increasing productivity is essential [12]. In Peru, national irrigation efficiency is estimated at approximately 35%, mainly due to inadequate hydraulic infrastructure, low revenue from distribution tariffs, and the widespread use of traditional irrigation methods [13]. However, these figures must be assessed locally, considering agricultural practices and water availability [14]. Although Peru possesses around 4.6% of South America’s freshwater resources [15], their uneven distribution adversely affects crop yields and food security in certain regions [16].
Rice (Oryza sativa) is a globally significant cereal valued for its high caloric and nutritional content and widespread cultivation [17]. It is one of the most important crops, with approximately 43% of national production occurring in the Peruvian rainforest [18]. In Peru, during 2022, rice production in the Amazon accounted for 50.5% of the national output, with approximately 87% coming from the regions of San Martín, Amazonas, Cajamarca, and Huánuco [19]. Among these, San Martín was the leading rice-producing region in the country with almost 860.5 thousands of tons of rice for the 2024 campaign [18]. In the San Martín region, agriculture contributes 29% to the gross value added, with rice being the dominant crop, accounting for 32.5% of total production volume until September 2024 [18].
Flood irrigation remains the dominant method of rice cultivation, despite the diverse ecosystems in which rice is grown and extensive research aimed at reducing its water consumption and environmental impact [20]. This persistence is attributed mainly to the low adoption rate of alternative irrigation techniques, primarily due to high initial implementation costs [21]. However, flood irrigation significantly strains local and regional water resources, undermines agricultural sustainability, and increases crop vulnerability to pests. These factors, in turn, negatively impact community livelihoods and ecosystem health, mainly through the diffuse pollution it can generate [22,23,24]. Despite these drawbacks, saturated systems use and standing water provide effective weed control, significantly reducing herbicide need [25,26].
Given the continued reliance on flood irrigation, it is essential to explore strategies for optimizing its efficiency and assessing the additional benefits that may arise from improved management practices. In this context, the Water Footprint (WF) concept in agriculture provides a valuable framework for evaluating irrigation sustainability regarding water use efficiency [27]. This approach quantifies the total freshwater volume directly and indirectly consumed in agricultural production, expressed in m3∙t−1 [14]. The water footprint consists of three components: Green WF, which considers rainwater evaporated or incorporated into the production process; Blue WF, which represents the volume of surface or groundwater used for irrigation that subsequently evaporates or is incorporated into the crop; and Grey WF, which refers to the amount of water required to dilute pollutants generated during production to meet environmental quality standards [28].
The amount of water required for rice production varies depending on the cultivation method, local environmental conditions, and the agricultural practices used [29]. Therefore, complementary assessments are necessary to evaluate the impact of different restricted irrigation management strategies on factors such as rice pests and disease incidence. In this context, this study aimed to quantify the impact of saturated and stagnant water systems on rice crop development and yield, using the water footprint as a key indicator and assessing its influence on pest and disease incidence.
2. Materials and Methods
2.1. Study Scope
The research was conducted at the El Porvenir Agrarian Experimental Station of the Instituto Nacional de Innovación Agraria (INIA) in the Juan Guerra district, San Martín department. The experimental plot was established at 6°35′00″ S, 76°19′46″ W (Figure 1). The study area has a semi-arid climate, with average minimum and maximum temperatures ranging from 19 to 34.5 °C. Mean annual rainfall is 1123 mm, with an average monthly rainfall between 43 mm (July) and 151 mm (February). The monthly average relative humidity (RH) varies between 69% to 75%, and the average wind speed is 2.4 m s−1. Historical averages and daily meteorological records during research were obtained from the El Porvenir station (6°35′20.62″ S, 76°19′5.66″ W) of the National Meteorological and Hydrological Service of Peru (SENAMHI, 2024) as shown in Figure 2.

Figure 1.
Study area located in the Juan Guerra district, San Martin province, San Martin department in Peru. An aerial view of the experimental plots is shown.
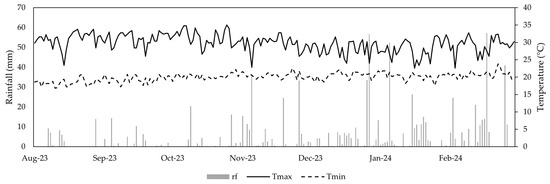
Figure 2.
Daily scale meteorological data from El Porvenir weather station for the 2023–2024 season, including rainfall (rf), maximum temperature (Tmax), and minimum temperature (Tmin).
2.2. Experimental Design
A completely randomized block design (CRBD) was employed. The experiment consisted of three irrigation management treatments for rice cultivation: T1 (traditional flooding): maintaining a 0.15 m floodwater layer with replenishment every 4 days; T2 (optimized flooding): replenishment of the 0.15 m floodwater layers every 7 days; and T3 (intermittent rainfed irrigation): replenishment of the 0.15 m floodwater layers every 14 days. Each experimental unit comprised a 10 m × 12 m pit with 0.20 m high borders. With three replicates per treatment, the experiment included nine experimental units. The irrigation water was provided by furrows (Figure 3).
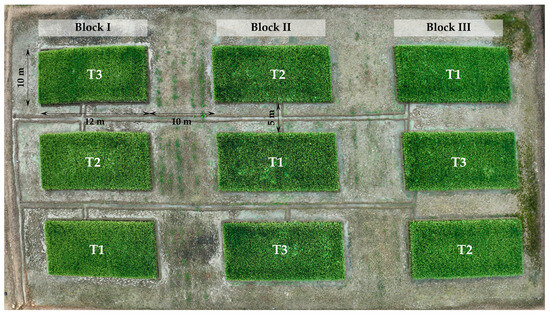
Figure 3.
Field distribution of the experimental units.
2.3. Soil Physicochemical Characteristics
Before installation, a 1 m × 1 m × 1.2 m trench was excavated in the designated experimental plot area. After identifying the soil horizons, soil samples were collected from the central zone of each horizon and analyzed at the Soil, Water, and Foliar Laboratory (LABSAF)-INIA El Porvenir. The analyzed parameters included texture [30], pH [31], electrical conductivity (EC) [32], organic matter (OM) [30], total nitrogen [33], available phosphorus [30], available potassium [34], and exchangeable cation concentrations (Ca2+, Mg2+, K+, and Na+) [30]. The soil was predominantly clay-textured, with a pH of 7.6 and medium fertility (Table S1).
2.4. Experimental Plot Management
The experimental plot was established between October 2023 and February 2024 using an indirect sowing system (transplanting). Seedbeds were prepared with pre-germinated seeds of Oryza sativa var. INIA 516 LM1-La Unión 23 [35] that underwent pre-soaking in water for 24 h followed by 12 h in shelter. The seeds were sown at an 80 kg∙ha−1 density in manually constructed soil pits. Phytosanitary control in the seedbeds involved applying lambda-cyhalothrin and thiamethoxam (0.3 L∙ha−1) and fipronil (0.2 L∙ha−1) to manage Hydrellia wirthi and Tagosodes oryzicolus. Fertilization with urea (200 kg∙ha−1) was applied in sheet water 12 days after sowing (DAS).
Before transplanting, the soil was ploughed and turned over using a semi-heavy harrow pulled by a tractor. It was then leveled with a mechanical power tiller, while the pit’s edges (0.20 m high) and irrigation channels were shaped using hand tools. At 21 DAS, transplanting was conducted with a spacing of 0.20 m between plants and 0.25 m between rows, placing four seedlings per stroke. Soil fertilization was applied based on the soil’s physicochemical characterization: diammonium phosphate (DAP) at 150 kg∙ha−1 before transplanting, potassium chloride (KCl) at 150 kg∙ha−1 before transplanting, urea at 150 kg∙ha−1 15 days after transplanting and 200 kg∙ha−1 25 days after transplanting, and Sulpomag at 150 kg∙ha−1 75 days after transplanting. For weed control, Butachlor was applied at a dose of 4 L∙ha−1 2 days after transplanting. During the flowering stage, propineb was applied at 2 kg∙ha−1 dose to prevent grain spotting, and imidacloprid at 200 cc∙ha−1 to control Hydrellia wirthi and Tagosodes oryzicolus.
2.5. Morphological Variables Determination
Plants were evaluated within a cumulative area of 10 m2, consisting of 10 representative zones of 1 m2 each, located in the central area of each experimental unit to assess morphological and agronomic variables. Evaluations followed the methods described by Rosero [36]. During stage 2 (tillering), the number of tillers per stroke (NTS) was recorded. At stage 9 (mature grain), plant height (PH), number of panicles per stroke (NPS), panicle length (PL), and panicle fertility (PF) were measured.
2.6. Phytosanitary Variables Determination
For the evaluation of phytosanitary diseases, a similar approach was used as for the assessment of morphological and agronomic variables, focusing on the main diseases affecting the crop. During stage 2 (tillering), the incidence (WLV_2) of white leaf virus were recorded. To identify symptoms associated with this disease in plants, a visual assessment of the leaves was conducted. Observations focused on the presence of mottling or variegation in leaf coloration, characteristic of viral infections, with particular attention to the appearance of longitudinal stripes or bands ranging in color from yellowish green to whitish yellow, lacking well-defined borders. At stage 9 (mature grain) the incidence (BG2) of bacterial infections by Burkholderia glumae were assessed. The evaluation of disease symptoms was conducted visually through field observations focused on the identification of panicle discoloration associated with chlorosis.
2.7. Agronomic Variables Determination
To assess harvest variables, we followed the method described by Rosero [36]. Plants were collected from a total of 10 m2, distributed across 10 representative 1 m2 zones located in the central part of each experimental unit, avoiding border rows. The grain commercial yield (FY2) was then determined in kg/ha of paddy rice, standardized to 14% grain moisture content.
2.8. Water Footprint Determination
The three components of the water footprint (WF) (m3 t−1) were calculated: green water footprint (WFgreen), blue water footprint (WFblue), and grey water footprint (WFgrey). To achieve this, a crop development model was parameterized using the CROPWAT 8.0 software developed by the FAO, enabling the differentiation of rainfall and irrigation inputs based on the proposed treatments. The climate and rainfall modules were completed with daily-scale data from the El Porvenir weather station (6°35′20.62″ S; 76°19′5.66″ W), incorporating rainfall, maximum and minimum temperature, wind speed, relative humidity, and sunshine hours. Reference evapotranspiration (ET0) was estimated using the Penman–Monteith equation [37], while effective rainfall (Pef) was determined following the USDA Soil Conservation Service methodology [38]. The crop module was updated based on the FAO data for rice cultivation [39]. In this module the information on phenology, transplanting date, rooting depth, and maximum plant height was updated based on observations from the experimental plot and expert consultation. In addition, the crop coefficient for the initial stage (Kc ini), the mid-season stage (Kc mid), and for the end of the late-season stage (Kc end) were updated based on the corrections proposed by the FAO for semi-humid areas [37]. The soil module was completed using the AquaCrop model database, selecting soil parameters based on texture analysis [40]. The proposed treatments were simulated by adjusting irrigation intervals in independent simulations. The model facilitated calculating crop water requirements as a function of evapotranspiration (ETc) and enabled the determination of WFgreen, WFblue, and WFgrey inputs, following the methodology outlined by Martins et al. [41].
WFgreen is determined by the volume of precipitated water stored in the soil’s root zone, which is subsequently evapotranspired or incorporated into the plants. WFblue represents the volume of water supplied through the irrigation system and subsequently evapotranspired by the crop. WFgrey indicates the water volume required to assimilate the pollutant load in receiving water bodies. In the equation, Y denotes the commercial yield (t∙ha−1), n represents the number of days in the crop cycle, C is the final day of the cycle, and ET refers to evapotranspiration. Accordingly, the green and blue components of WF were estimated as the daily accumulation of crop evapotranspiration (ETc) over the crop cycle:
The volume of water required to dilute pollutants returning to the environment (WRdilution) was calculated as a function of the applied dose (AR, kg∙ha−1), the loss fraction (α), the natural concentration of the pollutant in the receiving medium (cnat, kg∙m−3), and its acceptable limit concentration (cmax, kg∙m−3) [28]:
The WRdilution was calculated individually for each analyzed compound using Equation (4). Subsequently, the highest WRdilution value was selected to determine the crop’s WFgreen [42]. The α value was estimated based on local conditions according the methodology of Franke et al. [43]. The cnat value was estimated based on water quality monitoring assessed by the National Water Authority of Peru (ANA) for Huallaga River middle basin in 2021 [44]. The cmax value was obtained from the Environmental Quality Standard for Water [45].
2.9. Statistical Analysis
Soil variables, along with the morphological, phenological, agronomic, phytosanitary, and harvesting variables of the rice crop, were analyzed using R (version 4.1.1) with the dplyr [46] and agricolae [47] packages. The analyzed variables included NTS, PH, NPS, PL, PF, and FY2. The assumptions of normality and homogeneity of variances were assessed for these variables. When these assumptions were met, an ANOVA with mean comparisons was performed using Fisher’s LSD test (p < 0.05). The non-parametric Kruskal–Wallis test was applied if the assumptions were unmet (p < 0.05).
3. Results
3.1. Treatment Effects over the Evaluated Parameters
The analysis of variance (p < 0.05) conducted for the parameters NTS, PH, NPS, PL, PF and FY2 revealed no significant differences among the evaluated treatments (Table 1). However, T2 exhibited the highest values for NTS (12.27 tillers per stroke), PL (32.05 cm), and PF (83.00%), followed by treatments T1 and T3. In contrast, for NTS, treatments T1 and T3 recorded the highest values (16.45 tillers per stroke), while T2 had the lowest (15.92 tillers per stroke). Regarding PH, treatment T1 achieved the greatest height (120.32 cm), followed by T3 (119.22 cm) and T2 (118.21 cm). In terms of FY2, a trend was observed in which T1 attained the highest values (FY2: 8.69 t∙ha−1), followed by T2 (FY2: 7.82 t∙ha−1), and finally, T3 (FY2: 7.14 t∙ha−1).

Table 1.
Comparison of morphological and agronomic variables according to treatment.
3.2. Effect on Pest and Disease Incidence
The analysis of variance (p < 0.05) conducted for the parameter WLV_2 revealed no significant differences among the evaluated treatments (Table 2). Similarly, the Kruskal–Wallis test (p < 0.05) for BG2 also showed no significant differences (Table 2). However, the highest incidence of viral and bacterial infections was observed in T3 (WLV_2: 1.21%, BG2: 2.52%), followed by T2 (WLV_2: 0.9, BG2: 2.34%), and the lowest in T1 (WLV_2: 0.53%, BG2: 1.34%). These results suggest that the incidence of viral and bacterial infections was highest in T3, intermediate in T2, and lowest in T1.
Table 2.
Comparison of phytosanitary variables.
3.3. Water Footprint Quantification
For all treatments, the effective rainfall input (Reff) exceeded the irrigation requirement (IR) as shown in Figure 4A. In the case of T3, the absence IR indicates that the crop can develop solely with rainfall input without significantly affecting commercial yield. Consequently, WFgreen is directly related to irrigation intervals, with more widely spaced irrigations resulting in higher WFgreen values (Figure 4B). Conversely, WFblue values were lower when irrigation intervals were longer, as observed in T3. Regarding WFgrey, the estimated volume of percolated nitrogen required more water to meet the proposed quality standard than phosphorus. Accordingly, the WFgrey footprint ranged from 216 to 240 m3∙t−1, with the highest values recorded for T3, corresponding to a slight FY2 reduction. The total WF values calculated for each treatment were as follows: T1: 806.3 m3∙t−1, T2: 815.5 m3∙t−1, and T3: 893.2 m3∙t−1.
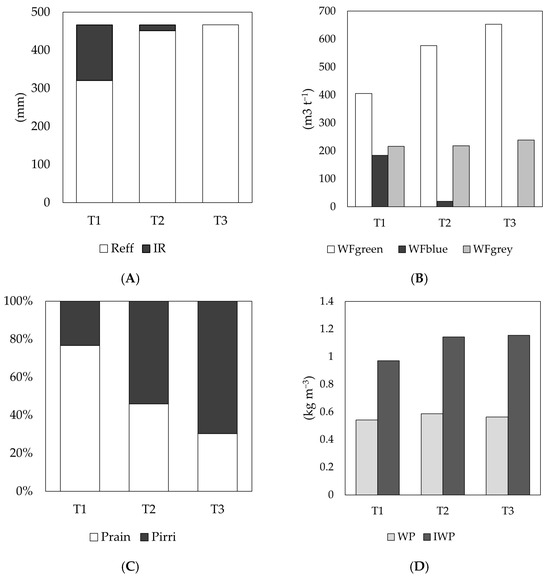
Figure 4.
Components of the water balance, water footprint, and water productivity of the rice crop under the evaluated treatments. (A) Components of the effective water footprint. (B) Relationship between effective rainfall and irrigation requirements. (C) Composition of percolation losses. (D) Total water productivity and irrigation. T1, T2, and T3 represent the evaluated irrigation management treatments. WFgreen, WFblue, and WFgrey denote the green, blue, and grey water footprints, respectively. Reff: effective rainfall; IR: irrigation requirement; Prain: percolated layer of rainfall; Pirri: percolated layer of irrigation water; WP: total water productivity; IWP: irrigation water productivity.
Percolation losses remained constant across all three treatments (425.4 mm). However, their composition varied depending on the irrigation intervals, with more widely spaced irrigations resulting in higher losses referred to the applied volume (Figure 4C). Total water productivity (WP) exhibited similar values across treatments, ranging from 0.54 to 0.59 kg∙m−3 (Figure 4D). In contrast, irrigation water productivity (IWP) was notably higher in T2 (1.14 kg∙m−3) and T3 (1.15 kg∙m−3) compared to T1 (0.97 kg m−3).
4. Discussion
The results for the evaluated parameters indicate that different treatments did not significantly affect the number of tillers or panicle production, as all treatments adequately met the crop’s water requirements. Consequently, tiller and panicle production remained stable, with no significant differences across the applied flooding levels. These findings align with those reported by Sarwar and Khanif [48], who stated that water stress does not impact tiller and panicle production as long as the crop is maintained above the saturation level. This is reinforced by the observations of Zhang et al. [49], who showed that controlled irrigation with rain harvesting can preserve stable physiological parameters in rice, even under water-saving strategies. Regarding plant height, our results differ from those of Talpur et al. [50], who observed significant differences during the crop’s intermediate growth stage in a containerized system. They further noted that plant height was greatest in treatments with a lower water layer. In contrast, for panicle length, Konaté et al. [51] reported that this parameter remains unaffected even under water stress conditions. In our study, although irrigation intervals were extended, water stress situations were not reached, as the water table did not drop below the saturation point.
Despite no significant differences having been found between the evaluated treatments, a trend was observed in which T3 exhibited lower yields (FY2: 7.14 t∙ha−1) compared to the optimized flooding system (FY2: 7.82 t∙ha−1) and the continuously flooded irrigation system (FY2: 8.69 t∙ha−1). This trend can be attributed to the limitations associated with irrigation systems with spaced replenishment intervals, similar to rainfed conditions, where prolonged droughts or erratic rainfall, along with the proliferation of pests, diseases, and weeds, pose significant challenges to rice cultivation [52]. In addition to these agronomic constraints, socioeconomic factors contribute to reduced technical efficiency in crop management [53]. Aligned with that, Autovino et al. [54] showed that to optimize the water irrigation management, it is necessary to consider agronomic and economic factors (e.g., the crop yield, field distribution uniformity, economic evaluations). However, despite these limitations, our results indicate that the obtained yields surpass the global averages reported for both rainfed (2.3 t∙ha−1) and irrigated (5.0 t∙ha−1) rice systems, as well as the estimated averages for the district of Juan Guerra in the San Martín region of Peru (7–8 t∙ha−1) [18,55,56]. This trend can be explained by the climatic conditions in the study area, as rainfall during the experimental period was sufficient to meet the water requirements of the rice crop. In that sense, Kima et al. [57] showed that a saturated soil with weekly irrigation can achieve high levels of water efficiency without significant yield losses. Moreover, water-saving technologies, like alternate wetting and drying, have proven effective not only in reducing water use but also in delivering broader agronomic and environmental benefits such as lower methane emissions, reduced pest and disease incidence, improved grain quality, and increased yields [58]. Furthermore, studies such as that of Gao et al. [59] demonstrated that moderate water-saving strategies (20% reduction) can even outperform conventional irrigation in grain yield and quality, thanks to improved physiology and reactive oxygen species balance.
The previously mentioned importance of rice crop production in the Peruvian rainforest highlights the need to develop and assess rice varieties that are well-suited to the specific conditions of the Amazon region. Although INIA 516 LM1-La Unión 23 rice variety was developed for the San Martin Region under the specific irrigation conditions of the Alto Mayo Valley [35], our findings suggest that it has the potential to adapt to other irrigation regimes used across different Amazonian regions with, in average, a better water availability. Furthermore, our yield results show higher yields than other varieties adapted to similar conditions such as Esperanza, Conquista, and Capirona [60]. This adaptability makes it a promising candidate for broader cultivation in diverse environments within the Amazon. Moreover, although using water-saving irrigation patterns such as intermittent irrigation may affect certain agronomic parameters, a meta-analysis showed that these techniques reduce CH4 emissions by 52.3% and CO2-equivalent emissions by 18.6% [61].
Regarding the incidence of white leaf virus and bacterial infections, the T3 treatment had a higher disease prevalence, although the differences were not statistically significant. This may, in turn, negatively impact yield parameters, as reflected in the obtained results. However, no significant differences were detected, which aligns with studies suggesting that rainfed lowland systems do not provide optimal conditions for developing diseases and insect pests [62]. Additionally, Zhang et al. [49] and Tyagi et al. [63] agree that controlled irrigation systems, when properly managed with moisture monitoring and adjusted fertilization, do not increase plant health stress levels, especially when a balance is maintained between moisture and efficient rain harvesting.
The water footprint provides a comprehensive view of the contributions of rainfall and irrigation to crop water consumption and the potential impact of nutrient and pollutant mobilization into receiving water bodies [64]. Its analysis must consider the regional water context’s opportunities and challenges while accounting for agriculture’s sensitivity to spatiotemporal variations [65,66]. Specifically for rice cultivation, climatic, edaphic, and management variations significantly influence water productivity [31]. This heterogeneity complicates the extrapolation of results and the development of strategies for optimizing water use [66]. Traditionally, rice is cultivated under continuous flooding, which can maximize production due to increased water consumption and a larger blue water footprint [64]. This study quantified WFgreen and WFblue based on the volumes of water consumed by plant evapotranspiration while excluding percolation losses [28]. However, the validity of this assumption largely depends on soil factor and irrigation frequency. In particular, the low permeability of clay soils limited water movement to deeper horizons. An estimated percolation volume of 4254 m3∙ha−1 was recorded for the study area, representing 29–34% of the total water input (i.e., rainfall + effective irrigation). Percolation losses simulation was similar across all treatments, as once the soil reached saturation and a surface water layer was maintained, water movement through the soil occurred at a nearly constant rate (Ksat, saturated hydraulic conductivity) [67]. In this context, it is essential to analyze how rainfall and irrigation inputs influence percolation volume change depending on the frequency and timing of their application. Under the traditional T1 treatment, rainfall accounted for the highest proportion of percolation, whereas in T2 and T3, this percentage decreased. With frequent irrigation replenishment every 4 days (T1), rainwater use efficiency was lower (49.6%). However, with longer irrigation intervals (T3), rainfall was utilized more efficiently, reducing percolation losses and achieving an efficiency of approximately 80.0%. Additionally, the irrigation replenishment layer per event was greater in T3 than in T1. However, the total accumulated irrigation requirement was lower by allowing the rainfall layer to replenish and maintain the water level. While T1 had a higher irrigation requirement than T2 (Figure 4A), this was due to the management strategy of maintaining a water layer above soil saturation rather than the crop’s actual water needs. In T3, irrigation was unnecessary, as timely rainfall supply was sufficient to meet the rice crop’s water requirements. Consequently, the model did not simulate yield reductions, and no significant yield losses were observed in the field.
Water consumption patterns are determined by the crop’s evapotranspiration, which in turn depends on the crop coefficient (Kc). This factor integrates the effects of the crop’s biometric and physiological characteristics, management practices, and the associated soil and climatic conditions [68]. For the present study, the initial (Kc ini: 1.10), mid-season (Kc mid: 1.21), and end-season (Kc end: 0.89) crop coefficients were estimated based on the FAO’s adjustment method for local climatic conditions [37]. However, it is necessary to expand the calibration efforts of crop coefficients (Kc) through field observations that capture the specific characteristics of the variety, as well as the local soil, climatic, and management conditions [69,70]. On one hand, the recent release of the variety INIA 516 LM1–La Unión 23 [71] limited the availability of previous publications. In addition, there is limited scientific information available on the crop coefficients (Kc) of rice under semi-arid and sub-humid climates in South America [72,73]. Among them, both differentiated and FAO-similar tabulated values have been reported, reinforcing the need to expand research in this line of work.
Concerning the water footprint, the previously described findings are reflected in a WFgreen greater than WFblue across all treatments. This indicates that rainfall significantly met the crop’s water requirements under the study conditions and proposed irrigation strategies (T1, T2, and T3). Accordingly, in this study, WFgreen increased as WFblue decreased, ultimately covering the total water consumption of the crop in T3. This suggests that, given the meteorological conditions of the study area, a more spaced irrigation schedule allowed for better utilization of rainfall while reducing the volume of irrigation water applied. These findings align with previous studies demonstrating that intermittent irrigation techniques can reduce water consumption by up to 30% compared to continuous flooding irrigation without significantly affecting yield [30,74,75], even in tropical regions [30,41]. In addition, Silalertruksa et al. [76] showed that rainwater harvesting in tropical regions can decrease the water scarcity footprint by up to 17%, particularly in systems employing alternate-array irrigation. Historically and ecologically, Iriarte et al. [77] also emphasizes that sustainable forms of water management based on the efficient use of available water have long existed in the Amazon, as exemplified by the early domestication of rice in Amazonian wetlands.
Flood irrigation, although effective in terms of yield, involves high water consumption, which increases the blue water footprint and compromises water availability in water-stressed areas [31]. The ratio between WFgreen and WFblue inputs can vary considerably due to temporal and spatial variations of agro-climatic, geomorphological, and edaphic factors [32,64]. For instance, in nearby districts of India, the consumptive water footprint (WFgreen + WFblue) has been reported to range between 3,980.43 and 5924.77 m3∙t−1 [32], while estimates for localities in the Indo-Gangetic Plains range between 1920 and 2660 m3∙t−1 [33]. Comparatively, the WF values calculated in this study are similar to those reported by Mboyerwa et al. [30] for tropical Africa (Ethiopia) but lower than those reported by Martins et al. [41] for southeastern Brazil (1554 m3∙t−1), a region with similar climatic conditions. By the same way, Recktenwalt et al. [78] determined the WF of rice between 783–1348 m3∙t−1 with a low participation of the WFgrey. On the other hand, previous studies of WF carried out in Peruvian coast contrast with our findings, due to the small accumulated volume of rainfall that results in a non-significant contribution of WFgreen [79]. This suggests that the INIA 516 LM1-La Unión 23 variety has successfully adapted to local conditions, demonstrating efficient available water use while maintaining the regional average yield (7.87 t∙ha−1) across all treatments [18].
On the other hand, the inherent challenges associated with in situ data collection and methodological constraints related to standardized boundaries often result in WFgrey being overlooked in water footprint analyses [34,66,80,81]. In rice cultivation, nutrient losses through leaching and runoff depend on factors such as the type and dosage of the applied fertilizer, as well as irrigation water management [82]. This study determined the crop’s nutritional requirements based on soil analysis, and fertilizer recommendations followed local practices. Irrigation was managed in ponds without post-transplanting drainage, limiting nutrient transport via surface runoff. Consequently, leaching became the dominant process. However, given the clayey nature of the soil, infiltration rates remained low. As previously mentioned, simulated percolation losses were similar across treatments. Under these conditions, fertilizer loss coefficients were estimated based on Franke et al. [43]. Additionally, fertilizer utilization and transformation processes influence leaching and nutrient losses to the environment. Regarding nitrogen, the anaerobic conditions resulting from the soil saturation constant, inhibited nitrifying microorganisms while promoting denitrification, leading to ammonium production (NH4+-N) as the predominant ionic form of leached nitrogen [82]. In this context, the estimated nitrogen leaching factor of 10.6% closely aligns with the values reported by Qi et al. [82] for different nitrogen forms under traditional flooding (10.7%) and shallow-irrigation with deep-sluice management (7.3%). Meanwhile, the high clay and organic matter content and the low concentration of available phosphorus in surface horizons affected phosphorus diffusion and mobility, thereby limiting its leaching losses to a factor of 0.26%.
In this study, the WFgrey accounted for approximately 22% of the total water footprint of rice production. However, its estimation through indirect assessment should be complemented with water quality monitoring at both the entry and exit points of the plots, as well as in receiving water bodies, to evaluate their purification capacity. The most common tools to measure leaching pollutant in experimental plots include both the ceramic suction cup extraction and drainage lysimeter methodologies [83]. However, the inherent economic limitations of these techniques must be addressed by research that provides methodologies for quantifying leaching water quality and quantity [83]. This would enable more precise adjustments to fertilizer recommendations tailored to tropical agroecosystems. Additionally, integrating environmental studies on carbon footprint and greenhouse gas emissions would be valuable, given their link to flooding processes [84]. Given these considerations, the water footprint concept has a strong environmental component, which farmers’ priorities may overshadow, as their primary focus is maximizing yields and ensuring profitability [85]. Water is not perceived as a limiting resource in the study area, resulting in a low-opportunity cost. Consequently, potential improvements in water productivity should aim to allocate surplus water to high-value crop production [86]. The transition toward more water-efficient production systems must consider economic viability, the energy efficiency of associated management activities (i.e., fuel consumption for water extraction and distribution), and the accessibility of sustainable technologies across diverse socio-economic contexts. While rice productivity has been widely studied, the release of the INIA 516 LM1-La Unión 23 variety is relatively recent [71], highlighting the need for further research to develop a comprehensive support package for farmers.
Our findings indicate that replenishing the water layer every 15 days did not result in significant commercial yield losses compared to continuous flooding with a 4-day replenishment interval. The non-significant trend in commercial yield reduction justifies the higher water footprint observed in this treatment (T3). However, this irrigation strategy also optimized water resource use by enhancing the efficiency of rainwater utilization. These results suggest that, for the INIA 516 LM1 rice variety grown during the October–February season, irrigation management can be adjusted to 15-day replenishment intervals, provided that rainfall maintains the soil-saturation layer within the ponds. In the context of climate change, it has been observed that the optimal temperature range for rice cultivation is approximately 28–32 °C. Beyond this range, further temperature increases can become detrimental, with a critical threshold around 35 °C. [87]. For the October–February growing seasons in the study area, climate models estimate average temperatures of 29.3 °C and 33.1 °C under the most optimistic (SSP1-2.6) and most pessimistic (SSP5-8.5) climate change scenarios, respectively; as well as average maximum temperatures of 35.0 °C and 38.6 °C [5]. This presents a challenging outlook that compels us to expand research efforts toward improved rice cultivation management in the South American rainforest, with a particular focus on optimizing water management as an adaptive strategy [87]. Future research should investigate more stringent water management strategies, broaden evaluation campaigns to incorporate dry-season trials, implement soil moisture sensors at varying depths, compare with water-stress resistant varieties, and evaluate the potential impacts of climate change under different projected scenarios. Furthermore, it is essential to highlight the importance of developing research that considers various nitrogen fertilization patterns in conjunction with irrigation management [59,63] and in situ measurements of nitrate leaching, the primary contaminant in rice fields. Also, it would be beneficial to include complementary indexes such as the Water Degradation Footprint (WDF) or the Pollution Water Indicator (PWI) to integrate the toxicity of elements and their effect on water functionality in potentially affected ecosystems; or the Water Scarcity Footprint (WSF) [76], which allows for the identification of regions where intensive agricultural water use could generate imbalances. Implementing efficient rice irrigation management is essential for advancing multiple Sustainable Development Goals (SDGs), including SDG 2 (Zero Hunger), SDG 6 (Clean Water and Sanitation), SDG 12 (Responsible Consumption and Production), and SDG 13 (Climate Action) [88].
5. Conclusions
If climatic conditions remain favorable, implementing longer-term irrigation strategies could represent a viable alternative to reducing water consumption without significantly compromising rice production. Future projections support this alternative by ensuring water availability most of the time. However, temperature increases should be deeply analyzed as a crop failure factor. Optimizing rainfall utilization in irrigation management can lower the blue water footprint and enhance crop sustainability, particularly in water-stressed regions. However, the potential for increased incidence of diseases and pests in systems with reduced irrigation frequency must be considered. This underscores the importance of integrating effective phytosanitary management strategies to mitigate potential risks and ensure stable yields.
This study provides essential insights into the impact of different irrigation strategies on rice yield and water efficiency. The ability of the INIA 516 LM1-La Unión 23 variety to adapt to extended irrigation intervals without significantly reducing commercial yield highlights its potential for cultivation under limited water availability conditions. These findings are particularly relevant for enhancing crop sustainability and optimizing water resource management in the San Martín region and other areas with similar agroclimatic conditions.
Long-term studies are recommended to evaluate the effects of intermittent irrigation strategies on grain quality and soil sustainability. Additionally, the influence of climate variability on rice response to different irrigation regimes should be explored to develop predictive models for optimal water management. Considering the upward trend in precipitation and temperatures estimated under various climate change scenarios for this study region, future research should focus primarily on heat stress management in rice. To this end, tools such as crop development models have proven robust and allow for the evaluation of irrigation strategies as an adaptive alternative. Future research should also assess the impact of irrigation practices on greenhouse gas emissions associated with rice cultivation, aiming to reduce its environmental footprint and contribute to climate change mitigation.
In conclusion, this study’s findings support the feasibility of implementing more efficient irrigation strategies for rice cultivation. These results provide valuable evidence for developing policies and agronomic practices that optimize water use efficiency while promoting the sustainability of rice production.
Supplementary Materials
The following supporting information can be downloaded at: https://www.mdpi.com/article/10.3390/w17091262/s1, Table S1. Textural analysis of the test pit at six horizons.
Author Contributions
Conceptualization, R.F.-M. and R.d.C.B.; Methodology, R.F.-M., R.d.C.B. and E.E.T.-C.; Formal analysis, Y.A.-A.; Investigation, R.F.-M., J.G., A.A. and A.C.; Writing—original draft preparation, R.F.-M., R.d.C.B. and Y.A.-A.; Writing—review and editing, R.S.-A.; Supervision, R.S.-A. and C.L. All authors have read and agreed to the published version of the manuscript.
Funding
This research was funded by the INIA project CUI 2487112 “Mejoramiento de los servicios de investigación y transferencia tecnológica en el manejo y recuperación de suelos agrícolas degradados y aguas para riego en la pequeña y mediana agricultura en los departamentos de Lima, Áncash, San Martín, Cajamarca, Lambayeque, Junín, Ayacucho, Arequipa, Puno y Ucayali”.
Data Availability Statement
The data presented in this study are available on request from the corresponding author.
Conflicts of Interest
The authors declare no conflicts of interest.
References
- Almazroui, M.; Ashfaq, M.; Islam, M.N.; Rashid, I.U.; Kamil, S.; Abid, M.A.; O’Brien, E.; Ismail, M.; Reboita, M.S.; Sörensson, A.A.; et al. Assessment of CMIP6 Performance and Projected Temperature and Precipitation Changes Over South America. Earth Syst. Environ. 2021, 5, 155–183. [Google Scholar] [CrossRef]
- SENAMHI. Escenarios Climaticos en el Perú para el año 2030; Proyecto Segunda Comunicación Nacional del Perú a la Convención Marco de las Naciones Unidas sobre Cambio Climático; SENAMHI: Lima, Peru, 2009; Available online: https://hdl.handle.net//20.500.12542/141 (accessed on 27 December 2024).
- ANA; Consorcio Typsa—Tecnoma—Engecorps. Grupo Inclam Evaluación de Recursos Hídricos en la Cuenca de Huallaga; Autoridad Nacional del Agua: San Isidro, Peru, 2015. [Google Scholar]
- SENAMHI. Escenarios Climaticos en la cuenca del río Mayo para el año 2030; Proyecto Segunda Comunicación Nacional del Perú a la Convención Marco de las Naciones Unidas sobre Cambio Climático; SENAMHI: Lima, Peru, 2009; Available online: https://hdl.handle.net/20.500.12542/122 (accessed on 27 December 2024).
- Fernandez-Palomino, C.A.; Hattermann, F.F.; Krysanova, V.; Vega-Jácome, F.; Menz, C.; Gleixner, S.; Bronstert, A. High-resolution climate projection dataset based on CMIP6 for Peru and Ecuador: BASD-CMIP6-PE. Sci. Data 2024, 11, 34. [Google Scholar] [CrossRef]
- Vargas Rivera, J. Memoria Descriptiva de Clima; Zonificación Ecológica Económica de la Región San Martín; Gobierno Regional de San Martín: Moyobamba, Peru, 2005; p. 59. [Google Scholar]
- Castro, A.; Davila, C.; Laura, W.; Cubas, F.; Avalos, G.; López-Ocaña, C.; Villena, D.; Valdez, M.; Urbiola, J.; Trebejo, I.; et al. Climas Del Perú—Mapa de Clasificación Climática Nacional, 1st ed.; SENAMHI: Lima, Peru, 2021; ISBN 978-612-48315-3-9. Available online: https://www.senamhi.gob.pe/load/file/01404SENA-4.pdf (accessed on 27 December 2024).
- Ahmed, M.; Islam, M.K.; Das, S. Climate Change Effects on Crop Area Dynamics in the Cachar District of Assam, India: An Empirical Study. Nat. Environ. Pollut. Technol. 2024, 23, 2435–2440. [Google Scholar] [CrossRef]
- Ritchie, P.D.L.; Parry, I.; Clarke, J.J.; Huntingford, C.; Cox, P.M. Increases in the Temperature Seasonal Cycle Indicate Long-Term Drying Trends in Amazonia. Commun. Earth Environ. 2022, 3, 199. [Google Scholar] [CrossRef]
- Ukkola, A.M.; De Kauwe, M.G.; Roderick, M.L.; Abramowitz, G.; Pitman, A.J. Robust Future Changes in Meteorological Drought in CMIP6 Projections Despite Uncertainty in Precipitation. Geophys. Res. Lett. 2020, 47, e2020GL087820. [Google Scholar] [CrossRef]
- Rocha, L.O.D.S.; Guimarães, C.R.R.; Oliveira, R.A.P.D. Exploração Do Uso Eficiente de Recursos Hídricos Na Agricultura: Investigação de Técnicas de Irrigação e Tecnologias Para a Minimização Do Desperdício de Água. Rev. Foco 2024, 17, e4950. [Google Scholar] [CrossRef]
- Xue, J.; Guan, H.; Huo, Z.; Wang, F.; Huang, G.; Boll, J. Water Saving Practices Enhance Regional Efficiency of Water Consumption and Water Productivity in an Arid Agricultural Area with Shallow Groundwater. Agric. Water Manag. 2017, 194, 78–89. [Google Scholar] [CrossRef]
- ANA. Plan Nacional de Recursos Hídricos del Perú; Carrillo Mendoza, J.L., Inga Colonia, C., Eds.; ANA: San Isidro, Peru, 2013. [Google Scholar]
- Mekonnen, M.M.; Pahlow, M.; Aldaya, M.M.; Zarate, E.; Hoekstra, A.Y. Sustainability, Efficiency and Equitability of Water Consumption and Pollution in Latin America and the Caribbean. Sustainability 2015, 7, 2086–2112. [Google Scholar] [CrossRef]
- MINAM. Tercera Comunicación Nacional del Perú a la Convención Marco de las Naciones Unidas Sobre el Cambio Climático; MINAM: Lima, Perú, 2016. [Google Scholar]
- Raico Arce, V.; Stehli Torrecilla, H.; Sulca Contreras, R. Estudio Prospectivo sobre el Estrés Hídrico y la Inseguridad Alimentaria en el Perú; Centro Nacional de Planeamiento Estratégico: Lima, Peru, 2023. [Google Scholar]
- Mohidem, N.A.; Hashim, N.; Shamsudin, R.; Che Man, H. Rice for Food Security: Revisiting Its Production, Diversity, Rice Milling Process and Nutrient Content. Agriculture 2022, 12, 741. [Google Scholar] [CrossRef]
- MIDAGRI. Perfil Productivo y Competitivo de los Principales Cultivos del Sector. 2025. Available online: https://siea.midagri.gob.pe/siea_bi/ (accessed on 27 December 2024).
- Romero, C.A. Observatorio de Siembras y Perspectivas de la Producción—Arroz: Campaña Agrícola 2023/2024; Ministerio de Desarrollo Agrario y Riego (MIDAGRI): Lima, Peru, 2024; Available online: https://repositorio.midagri.gob.pe/bitstream/20.500.13036/1673/1/Observatorio-de%20siembras%20y%20perspectivas%20de%20produccion%20arroz%20enero%202024.pdf (accessed on 11 April 2025).
- Arouna, A.; Dzomeku, I.K.; Shaibu, A.-G.; Nurudeen, A.R. Water Management for Sustainable Irrigation in Rice (Oryza sativa L.) Production: A Review. Agronomy 2023, 13, 1522. [Google Scholar] [CrossRef]
- Liu, T.; Bruins, R.; Heberling, M. Factors Influencing Farmers’ Adoption of Best Management Practices: A Review and Synthesis. Sustainability 2018, 10, 432. [Google Scholar] [CrossRef] [PubMed]
- Gavilánez Luna, F.C.; Barzola Ordinola, C.M.; Falconí Zambrano, C.J.; Loqui Sánchez, A.J. Efecto Del Riego Tradicional En La Producción, Eficiencia Hídrica y Emisión de Metano Del Cultivo de Arroz. Bioagro 2024, 36, 15–26. [Google Scholar] [CrossRef]
- FAO. Recomendaciones de Política Pública para Enfrentar el Cambio Climático y la Vulnerabilidad de la Seguridad Alimentaria; FAO: Rome, Italy, 2017. [Google Scholar]
- Williams, J.F.; Roberts, S.R.; Hill, J.E.; Scardaci, S.C.; Tibbits, G. IPM: Managing water for weed control in rice. Calif. Agric. 1990, 44, 7–10. [Google Scholar] [CrossRef]
- Wickramasinghe, D.; Devasinghe, U.; Suriyagoda, L.D.B.; Egodawatta, C.; Benaragama, D.I. Weed Dynamics under Diverse Nutrient Management and Crop Rotation Practices in the Dry Zone of Sri Lanka. Front. Agron. 2023, 5, 1211755. [Google Scholar] [CrossRef]
- Rao, A.N.; Wani, S.P.; Ahmed, S.; Haider Ali, H.; Marambe, B. An Overview of Weeds and Weed Management in Rice of South Asia. In Weed Management in Rice in the Asian-Pacific Region; Asian-Pacific Weed Science Society (APWSS); The Weed Science Society of Japan: Japan; Indian Society of Weed Science: India, 2017; pp. 247–281. ISBN 978-81-931978-4-4. Available online: https://core.ac.uk/download/pdf/219475058.pdf (accessed on 16 January 2025).
- Laphatphakkhanut, R.; Puttrawutichai, S.; Dechkrong, P.; Preuksakarn, C.; Wichaidist, B.; Vongphet, J.; Suksaroj, C. IoT-Based Smart Crop-Field Monitoring of Rice Cultivation System for Irrigation Control and Its Effect on Water Footprint Mitigation. Paddy Water Environ. 2021, 19, 699–707. [Google Scholar] [CrossRef]
- Aldaya, M.M.; Chapagain, A.K.; Hoekstra, A.Y.; Mekonnen, M.M. The Water Footprint Assessment Manual; Routledge: Abingdon, UK, 2012. [Google Scholar]
- Riccetto, S.; Capurro, M.C.; Roel, Á. Estrategias Para Minimizar El Consumo de Agua Del Cultivo de Arroz En Uruguay Manteniendo Su Productividad. Agrociencia Urug. 2017, 21, 109–119. [Google Scholar] [CrossRef]
- Mboyerwa, P.; Kibret, K.; Mtakwa, P.; Aschalew, A. Evaluation of Growth, Yield, and Water Productivity of Paddy Rice with Water-Saving Irrigation and Optimization of Nitrogen Fertilization. Agronomy 2021, 11, 1629. [Google Scholar] [CrossRef]
- Bouman, B.A.M.; Humphreys, E.; Tuong, T.P.; Barker, R. Rice and Water. Adv. Agron. 2007, 92, 187–237. [Google Scholar]
- Ghosh, A.; Warwade, P. Impact of forest cover and human intervention on crop water footprint. J. Water Clim. Change 2024, 15, 5998–6012. [Google Scholar] [CrossRef]
- Chakrabarti, B.; Mina, U.; Chakraborty, D.; Pathak, H.; Sharma, D.K.; Jain, N.; Jatav, R.S.; Dixit, P.; Katiyar, R.; Harit, R.C. Water, Carbon and Nitrogen Footprints of Major Crops in Indo-Gangetic Plains. In Geospatial Infrastructure, Applications and Technologies: India Case Studies; Sarda, N.L., Acharya, P.S., Sen, S., Eds.; Springer: Singapore, 2018; pp. 401–411. [Google Scholar]
- Gil, R.; Bojacá, C.R.; Schrevens, E. Uncertainty of the Agricultural Grey Water Footprint Based on High Resolution Primary 585 Data. Water Resour. Manag. 2017, 31, 3389–3400. [Google Scholar] [CrossRef]
- Torres-Chávez, E.E. ARROZ INIA 516—LM1 LA UNIÓN 23 Nueva Variedad de Arroz de Riego Para La Selva Alta Del Perú; 587 Programa Nacional de Arroz; Instituto Nacional de Innovacion Agraria: San Martin, Peru, 2023. [Google Scholar]
- Rosero, M. Sistema de Evaluación Estandar Para Arroz. 1983. Available online: https://hdl.handle.net/10568/69571 (accessed on 23 January 2025).
- Allen, R.G.; Pereira, L.S.; Raes, D.; Smith, M. Crop Evapotranspiration: Guidelines for Computing Crop Water Requirements; FAO Irrigation and Drainage Paper 56; FAO: Rome, Italy, 1988; Volume 300, p. D05109. ISBN 92-5-104219-5. [Google Scholar]
- Dastane, N.G. Effective Rainfall in Irrigated Agriculture; FAO Irrigation and Drainage Paper; FAO: Rome, Italy, 1978; ISBN 527 978-92-5-100272-8. [Google Scholar]
- Steduto, P.; Hsiao, T.C.; Fereres, E.; Raes, D. Crop Yield Response to Water; FAO Irrigation and Drainage Paper 66; FAO: Rome, Italy, 2012; ISBN 978-92-5-107274-5. [Google Scholar]
- Raes, D.; Steduto, P.; Hsiao, T.C.; Fereres, E. Chapter 2—Users guide. In Reference Manual AquaCrop Version 71; FAO: Rome, Italy, 2023. [Google Scholar]
- Martins, M.A.; Tomasella, J.; Bassanelli, H.R.; Paiva, A.C.E.; Vieira, R.M.S.P.; Canamary, E.A.; Alvarenga, L.A. On the Sustainability of Paddy Rice Cultivation in the Paraíba Do Sul River Basin (Brazil) under a Changing Climate. J. Clean. Prod. 2023, 386, 135760. [Google Scholar] [CrossRef]
- Roudbari, M.V.; Dehnavi, A.; Jamshidi, S.; Yazdani, M. A Multi-Pollutant Pilot Study to Evaluate the Grey Water Footprint of Irrigated Paddy Rice. Agric. Water Manag. 2023, 282, 108291. [Google Scholar] [CrossRef]
- Franke, N.A.; Boyacioglu, H.; Hoekstra, A.Y. Grey Water Footprint Accounting. Tier 1 Supporting Guidelines; Value of Water Research Report Series No. 65; UNESCO-IHE: Delft, The Netherlands, 2013; Available online: https://www.waterfootprint.org/resources/Report65-GreyWaterFootprint-Guidelines.pdf (accessed on 12 February 2025).
- ANA. Visor por Cuenca—Sistema Nacional de Información de Recursos Hídricos. 2025. Available online: https://snirh.ana.gob.pe/VisorPorCuenca/ (accessed on 14 April 2025).
- ANA. Decreto Supremo N° 004-2017-MINAM: Aprueban Estándares de Calidad Ambiental (ECA) para Agua y Estableceden Disposiciones Complementarias. Available online: https://www.minam.gob.pe/wp-content/uploads/2017/06/DS-004-2017-MINAM.pdf (accessed on 14 April 2025).
- Wickham, H.; François, R.; Henry, L.; Müller, K.; Vaughan, D. Dplyr: A Grammar of Data Manipulation, Version 1.1.4. 2023. Available online: https://cran.r-project.org/web/packages/dplyr/index.html (accessed on 14 April 2025). [CrossRef]
- de Mendiburu, F. Agricolae: Statistical Procedures for Agricultural Research, Version 1.3-7. 2023. Available online: https://cran.r-project.org/web/packages/agricolae/index.html (accessed on 14 April 2025). [CrossRef]
- Sarwar, M.J.; Khanif, Y.M. Low Water Rice Production and Its Effect on Redox Potential and Soil pH. J. Agron. 2005, 4, 142–146. [Google Scholar] [CrossRef][Green Version]
- Zhang, S.; Rasool, G.; Wang, S.; Guo, X.; Zhao, Z.; Zhang, Y.; Wei, Z.; Xia, Q. Effect of Irrigation and Cultivation Modes on Growth, Physiology, Rice Yield Parameters and Water Footprints. Agronomy 2024, 14, 1747. [Google Scholar] [CrossRef]
- Talpur, M.A.; Changying, J.; Junejo, S.A.; Tagar, A.A.; Ram, B.K. Effect of Different Water Depths on Growth and Yield of Rice Crop. Afr. J. Agric. Res. 2013, 8, 4654–4659. [Google Scholar] [CrossRef]
- Konaté, A.K.; Zongo, A.; Sangaré, J.R.; Dardou, A.; Audebert, A. Effect of Water Stress on Growth, Yield and Yield Components 545 of Rice (Oryza sativa L.) Genotypes. Int. J. Sci. Res. Arch. 2022, 5, 028–038. [Google Scholar] [CrossRef]
- Dianga, A.I.; Musila, R.N.; Joseph, K.W. Rainfed Rice Farming Production Constrains and Prospects, the Kenyan Situation. In Integrative Advances in Rice Research; Huang, M., Ed.; IntechOpen: London, UK, 2021. [Google Scholar] [CrossRef]
- Mkanthama, J.; Makombe, G.; Kihoro, J.; Ateka, E.M.; Kanjere, M. Technical Efficiency of Rainfed and Irrigated Rice Production in Tanzania. Irrig. Drain. 2018, 67, 233–241. [Google Scholar] [CrossRef]
- Autovino, D.; Provenzano, G.; Monserrat, J.; Cots, L.; Barragán, J. Determining Optimal Seasonal Irrigation Depth Based on Field Irrigation Uniformity and Economic Evaluations: Application for Onion Crop. J. Irrig. Drain. Eng. 2016, 142, 04016037. [Google Scholar] [CrossRef]
- Maclean, J.; Hardy, B.; Hettel, G. Rice Almanac: Source Book for One of the Most Important Economic Activities on Earth, 4th ed.; International Rices Research Institute: Los Baños, Philippines, 2013; ISBN 978-971-22-0300-8. [Google Scholar]
- Arévalo-Aranda, Y.; Rodríguez Toribio, E.; Rosillo Cordova, L.; Díaz-Chuquizuta, H.; Torres Chávez, E.E.; Cruz-Luis, J.; Siqueira Bahia, R.D.C.; Pérez, W.E. Green Manuring and Fertilization on Rice (Oryza sativa L.): A Peruvian Amazon Study. Rev. FCA UNCUYO 2024, 56, 1–13. [Google Scholar] [CrossRef]
- Kima, A.S.; Chung, W.G.; Wang, Y.-M. Improving Irrigated Lowland Rice Water Use Efficiency under Saturated Soil Culture for Adoption in Tropical Climate Conditions. Water 2014, 6, 2830–2846. [Google Scholar] [CrossRef]
- Belder, P.; Bouman, B.; Cabangon, R.; Guoan, L.; Quilang, E.; Yuanhua, L.; Spiertz, J.; Tuong, T. Effect of water-saving irrigation on rice yield and water use in typical lowland conditions in Asia. Agric. Water Manag. 2004, 65, 193–210. [Google Scholar] [CrossRef]
- Gao, C.; Lin, M.; He, L.; Tang, M.; Ma, J.; Sun, W. The Impact of Water-Saving Irrigation on Rice Growth and Comprehensive Evaluation of Irrigation Strategies. Agronomy 2024, 14, 1363. [Google Scholar] [CrossRef]
- Goigochea-Pinchi, D.; Justino-Pinedo, M.; Vega-Herrera, S.S.; Sanchez-Ojanasta, M.; Lobato-Galvez, R.H.; Santillan-Gonzales, M.D.; Ganoza-Roncal, J.J.; Ore-Aquino, Z.L.; Agurto-Piñarreta, A.I. Yield Prediction Models for Rice Varieties Using UAV Multispectral Imagery in the Amazon Lowlands of Peru. AgriEngineering 2024, 6, 2955–2969. [Google Scholar] [CrossRef]
- Livsey, J.; Kätterer, T.; Vico, G.; Lyon, S.W.; Lindborg, R.; Scaini, A.; Manzoni, S. Do alternative irrigation strategies for rice cultivation decrease water footprints at the cost of long-term soil health? Environ. Res. Lett. 2019, 14, 074011. [Google Scholar] [CrossRef]
- Mackill, D.J.; Coffman, W.R.; Garrity, D.P. Rainfed Lowland Rice Improvement; International Rice Research Institute: Manila, Philppines, 1996; ISBN 971-22-0071-X. [Google Scholar]
- Tyagi, S.; Naresh, R.K.; Bhatt, R.; Chandra, M.S.; Alrajhi, A.A.; Dewidar, A.Z.; Mattar, M.A. Tillage, Water and Nitrogen Management Strategies Influence the Water Footprint, Nutrient Use Efficiency, Productivity and Profitability of Rice in Typic Ustochrept Soil. Agronomy 2022, 12, 1186. [Google Scholar] [CrossRef]
- Chapagain, A.K.; Hoekstra, A.Y. The Green, Blue and Grey Water Footprint of Rice from Both a Production and Consumption Perspectives. Ecol. Econ. 2011, 70, 749–758. [Google Scholar] [CrossRef]
- Mao, Y.; Liu, Y.; Zhuo, L.; Wang, W.; Li, M.; Feng, B.; Wu, P. Quantitative Evaluation of Spatial Scale Effects on Regional Water Footprint in Crop Production. Resour. Conserv. Recycl. 2021, 173, 105709. [Google Scholar] [CrossRef]
- Demir, M.S.; Muratoglu, A. Water Footprint Concept, Approaches, and Applications: A Comprehensive Review for the Agricultural Sector. Water Environ. J. 2025. early view. [Google Scholar] [CrossRef]
- Elango, L. Hydraulic Conductivity: Issues, Determination and Applications; InTech: Rijeka, Croatia, 2011. [Google Scholar] [CrossRef]
- Irmak, S. Evapotranspiration. In Encyclopedia of Ecology; Jørgensen, S.E., Fath, B.D., Eds.; Academic Press: Oxford, UK, 2008; pp. 1432–1438. [Google Scholar]
- Pereira, L.S.; Allen, R.G.; Smith, M.; Raes, D. Crop evapotranspiration estimation with FAO56: Past and future. Agric. Water Manag. 2015, 147, 4–20. [Google Scholar] [CrossRef]
- Neira Huamán, E.; Ramos Fernández, L.; Razuri Ramírez, L.R. Coeficiente del cultivo (Kc) del arroz a partir de lisímetro de drenaje en La Molina, Lima-Perú. Idesia 2020, 38, 49–55. [Google Scholar] [CrossRef]
- INIA. Resolución Jefatural N° 097-2024-INIA: Aprueba la Liberación de la Variedad de Arroz “INIA 516—LM1 La Unión 23”. 2024. Available online: https://busquedas.elperuano.pe/dispositivo/NL/2301059-1 (accessed on 27 February 2025).
- Timm, A.U.; Roberti, D.R.; Streck, N.A.; Gustavo, G.; de Gonçalves, L.; Acevedo, O.C.; Moraes, O.L.L.; Moreira, V.S.; Degrazia, G.A.; Ferlan, M.; et al. Energy Partitioning and Evapotranspiration over a Rice Paddy in Southern Brazil. J. Hydrometeorol. 2014, 15, 1975–1988. [Google Scholar] [CrossRef]
- Petry, M.T.; Tonetto, F.; Martins, J.D.; Slim, J.E.; Werle, R.; Gonçalves, A.F.; Paredes, P.; Pereira, L.S. Evapotranspiration and crop coefficients ofsprinkler-irrigated aerobic rice in southern Brazil using the SIMDualKc water balancemodel. Irrig. Sci. 2024, 42, 1–22. [Google Scholar]
- Mekonnen, M.M.; Hoekstra, A.Y. The green, blue and grey water footprint of crops and derived crop products. Hydrol. Earth Syst. Sci. 2011, 15, 1577–1600. [Google Scholar] [CrossRef]
- Lampayan, R.M.; Rejesus, R.M.; Singleton, G.R.; Bouman, B.A.M. Adoption and economics of alternate wetting and drying water management for irrigated lowland rice. Field Crops Res. 2015, 170, 95–108. [Google Scholar] [CrossRef]
- Silalertruksa, T.; Gheewala, S.H.; Mungkung, R.; Nilsalab, P.; Lecksiwilai, N.; Sawaengsak, W. Implications of Water Use and Water Scarcity Footprint for Sustainable Rice Cultivation. Sustainability 2017, 9, 2283. [Google Scholar] [CrossRef]
- Iriarte, J.; Elliott, S.; Maezumi, S.Y.; Alves, D.; Gonda, R.; Robinson, M.; de Souza, J.G.; Watling, J.; Handley, J. The origins of Amazonian landscapes: Plant cultivation, domestication and the spread of food production in tropical South America. Quat. Sci. Rev. 2020, 248, 106582. [Google Scholar] [CrossRef]
- Recktenwalt, F.; Moraes, F.; Pereira, M. Water footprint of irrigated rice in the state of Rio Grande do Sul, 2019/2020 crop2023. Environ. Monit. Assess. 2023, 195, 1532. [Google Scholar] [CrossRef]
- Hidalgo Burga, X.A.; Mauricio Gutierrez, L.E.; Campos Vasquez, N. Determination of the Impact of Water Footprint on Rice Crops in Northern Peru. In Proceedings of the 22nd LACCEI International Multi-Conference for Engineering, Education, and Technology: Sustainable Engineering for a Diverse, Equitable, and Inclusive Future at the Service of Education, Research, and Industry for a Society 5.0, San Jose, Costa Rica, 17–19 July 2024. [Google Scholar] [CrossRef]
- Johnson, J.-M.; Becker, M.; Kaboré, J.E.P.; Dossou-Yovo, E.R.; Saito, K. Alternate wetting and drying: A water-saving technology for sustainable rice production in Burkina Faso? Nutr. Cycl. Agroecosystems 2024, 129, 93–111. [Google Scholar] [CrossRef]
- Chenoweth, J.; Hadjikakou, M.; Zoumides, C. Quantifying the human impact on water resources: A critical review of the water footprint concept. Hydrol Earth Syst. Sci. 2014, 18, 2325–2342. [Google Scholar] [CrossRef]
- Qi, D.; Wu, Q.; Zhu, J. Nitrogen and phosphorus losses from paddy fields and the yield of rice with different water and nitrogen management practices. Sci. Rep. 2020, 10, 9734. [Google Scholar] [CrossRef] [PubMed]
- Zheng, S.; Ni, K.; Chai, H.; Ning, Q.; Cheng, C.; Kang, H.; Ruan, J. Comparative research on monitoring methods for nitrate nitrogen leaching in tea plantation soils. Sci. Rep. 2024, 14, 20747. [Google Scholar] [CrossRef] [PubMed]
- Rajbonshi, M.P.; Mitra, S.; Bhattacharyya, P. Agro-technologies for greenhouse gases mitigation in flooded rice fields for promoting climate smart agriculture. Environ. Pollut. 2024, 350, 123973. [Google Scholar] [CrossRef] [PubMed]
- Farstad, M.; Melås, A.M.; Klerkx, L. Climate considerations aside: What really matters for farmers in their implementation of climate mitigation measures. J. Rural. Stud. 2022, 96, 259–269. [Google Scholar] [CrossRef]
- Amarasinghe, U.A.; Smakhtin, V. Water productivity and water footprint: Misguided concepts or useful tools in water management and policy? Water Int. 2014, 39, 1000–1017. [Google Scholar] [CrossRef]
- Liu, Z.; Xu, D.; Wang, R.; Guo, X.; Song, Y.; Wang, M.; Cai, Y. Effects of Temperature Fluctuations on the Growth Cycle of Rice. Agriculture 2025, 15, 99. [Google Scholar] [CrossRef]
- CGIAR. CGIAR Research Program RICE contributions to the United Nations Sustainable Development Goals. Available online: https://ricecrp.org/wp-content/uploads/2017/03/RICE-and-SDGs.pdf (accessed on 27 February 2025).


Disclaimer/Publisher’s Note: The statements, opinions and data contained in all publications are solely those of the individual author(s) and contributor(s) and not of MDPI and/or the editor(s). MDPI and/or the editor(s) disclaim responsibility for any injury to people or property resulting from any ideas, methods, instructions or products referred to in the content. |
© 2025 by the authors. Licensee MDPI, Basel, Switzerland. This article is an open access article distributed under the terms and conditions of the Creative Commons Attribution (CC BY) license (https://creativecommons.org/licenses/by/4.0/).