Article

Effects of Salinity Level on Microplastic Removal in Simulated Waters Using Agglomeration–Micro-Flotation

by
Theerayut Phengsaart
1,2,*,
Palot Srichonphaisarn
1,
Worada Khwathichak
1,
Chanatip Bumrungsak
1,
Ilhwan Park
3,
Mayumi Ito
3,
Mylah Villacorte-Tabelin
4,5,6,
Carlito Baltazar Tabelin
7,8,
Sanghee Jeon
9,
Kazutoshi Haga
9 and
Onchanok Juntarasakul
1,10,*
1
Department of Mining and Petroleum Engineering, Faculty of Engineering, Chulalongkorn University, Bangkok 10330, Thailand
2
Applied Mineral and Petrology Research Unit (AMP RU), Department of Geology, Faculty of Science, Chulalongkorn University, Bangkok 10330, Thailand
3
Division of Sustainable Resources Engineering, Faculty of Engineering, Hokkaido University, Sapporo 080-8628, Japan
4
Center for Natural Products and Drug Discovery, PRISM, Mindanao State University-Iligan Institute of Technology, Tibanga, Iligan City 9200, Philippines
5
Center for Microbial Genomics and Proteomics Innovation, PRISM, Mindanao State University-Iligan Institute of Technology, Tibanga, Iligan City 9200, Philippines
6
Department of Biological Sciences, College of Science and Mathematics, Mindanao State University-Iligan Institute of Technology, Tibanga, Iligan City 9200, Philippines
7
Department of Materials and Resources Engineering and Technology, College of Engineering, Mindanao State University-Iligan Institute of Technology, Tibanga, Iligan City 9200, Philippines
8
Resource Processing and Technology Center, RIEIT, Mindanao State University-Iligan Institute of Technology, Tibanga, Iligan City 9200, Philippines
9
Department of Earth Resource Engineering and Environmental Science, Faculty of International Resources Science, Akita University, Akita 010-0865, Japan
10
Carbon Dioxide Capture, Transportation, Subsurface Utilization and Storage Research Center, Department of Mining and Petroleum Engineering, Faculty of Engineering, Chulalongkorn University, Bangkok 10330, Thailand
*
Authors to whom correspondence should be addressed.
Water 2025, 17(9), 1264; https://doi.org/10.3390/w17091264
Submission received: 17 March 2025 / Revised: 19 April 2025 / Accepted: 22 April 2025 / Published: 23 April 2025

Abstract

:
This study investigates the removal of microplastics (MPs) from simulated freshwater, brackish water, and seawater using a novel agglomeration–micro-flotation technique. This method combines particle size enlargement, facilitated by kerosene as a bridging agent, with bubble size reduction through column flotation to enhance the removal rate. Six common MP types—polypropylene (PP), polyethylene (PE), acrylonitrile butadiene styrene (ABS), polystyrene (PS), polyethylene terephthalate (PET), and polyvinyl chloride (PVC)—were evaluated under varying salinity levels and kerosene dosages. Results showed that increasing kerosene dosage significantly improved removal rates, achieving up to ~99% recovery at 10 µL for low- and medium-density MPs (PP, PE, ABS, and PS), while a higher dosage of 30 µL was required for high-density MPs (PET and PVC). Elevated salinity levels (50–100%) promoted bubble stabilization and reduced coalescence, enhancing particle–bubble collisions and the overall flotation performance. This work addresses a key research gap in flotation-based MP removal under saline conditions and highlights the dual benefits of using kerosene—not only to enhance the removal rate but also to enable energy recovery, as both kerosene and plastics are combustible. The proposed technique presents a promising approach for microplastic remediation in aquatic environments, supporting sustainable water treatment and circular resource utilization.

Graphical Abstract

1. Introduction

Microplastics (MPs) are emerging pollutants with severe global consequences, posing significant threats to both human health and aquatic ecosystems. These tiny plastic particles have been shown to increase the risk of cancer and developmental abnormalities in humans while also proving toxic to many freshwater and marine organisms [1,2]. The widespread reliance of modern society on plastic products like face masks, disposable containers, and packaging materials has created a pressing dilemma: how to manage plastic-derived pollutants like MPs in a more sustainable manner.
MPs are defined as plastic particles ranging from approximately 1 µm to 5 mm in size, originating from both primary and secondary sources. Primary MPs are intentionally manufactured in small-sized pellets or microspheres for industrial applications, packaging, cosmetics, and personal care products. In contrast, secondary MPs are those inadvertently generated when large plastics degrade in the environment, catalyzed by factors such as ultraviolet (UV) radiation, mechanical abrasion, and bio-chemical processes [3]. Additionally, anthropogenic activities significantly contribute to plastic degradation and MP pollution. For example, fishing equipment, such as plastic nets and ropes, frequently exposed to mechanical stress and prolonged UV irradiation, degrades rapidly, releasing MPs into marine environments [4]. Similarly, everyday activities like the laundry of clothes made of polyester (polyethylene terephthalate; PET) in washing machines have been shown to release MP fibers, a major source of MPs, into water bodies [5,6]. Moreover, improper disposal of plastic-dominated municipal solid wastes, widespread use of plastic mulch films and MP-contaminated fertilizers in agriculture, urban runoffs, and industrial activities like plastic manufacturing and recycling all contribute to the influx of MPs into terrestrial and aquatic ecosystems [7,8].
Two key properties of MPs, hydrophobicity and small size, govern their environmental distribution, including how they interact with terrestrial and aquatic organisms. Being inherently hydrophobic, or water-repelling, MPs readily adsorb organic matter, carbon-rich suspended particles, and dissolved organic pollutants, such as persistent organic pollutants (POPs), through hydrophobic–hydrophobic interactions [9,10]. Additionally, organic functional groups, such as phenyl-OH, amino, and carboxyl groups, present on MP surfaces enhance heavy metal sorption via cation exchange, electrostatic interactions, and complexation reactions [11].
The combination of their pollutant-carrying capacity and small size has made MPs a growing environmental concern. Their minute dimensions facilitate long-range transport through atmospheric currents, ocean currents, wind, and flowing water. Niu et al. [12], for example, identified MPs in the remote Geladandong region of the Tibetan Plateau, reporting concentrations of 0.13–19.8 items/L, consisting primarily of polypropylene (PP) and PET in film and fiber forms, with sizes below 330 µm. The extensive distribution of MPs across soil, surface waters, sediments, and marine environments has led to their introduction into the food chain and bioaccumulation in higher trophic levels, including the digestive systems of fish, duck embryos, and human blood and organs [11,13,14,15,16]. A recent study by Nihart et al. [17] detected microplastics (MPs) and nanoplastics (NPs) in various human organs, including the kidney (~400 µg/g), liver (~430 µg/g), and brain (~3340 µg/g), raising serious health concerns, particularly regarding potential neurological effects.
Humans are exposed to MPs through multiple pathways, including dietary intake, drinking water, inhalation, and dermal contact [17,18,19]. MPs have been detected in bottled water and tap water, salt, and even the air we breathe [20,21]. While the full extent of their health effects is still under investigation, preliminary studies suggest that MPs may induce inflammatory responses, disrupt cellular processes, and facilitate the accumulation of harmful chemicals in bodily tissues. Given the increasing evidence of MP contamination in various environmental matrices, urgent action is needed to mitigate their sources and impacts.
Reducing human exposure to MPs necessitates effective pollution control, especially in the world’s oceans, which receive an estimated 64,000 tonnes/year and 140,000 tonnes/year of MPs via riverine and atmospheric transport, respectively [22]. Addressing this issue requires a multifaceted approach, including reducing plastic production, promoting sustainable alternatives, and improving waste management systems. Public awareness campaigns and policy interventions play crucial roles in fostering responsible plastic consumption and disposal practices. In addition, advancements in wastewater treatment technologies are essential for limiting MP release and decontaminating polluted water bodies [23]. Traditional separation techniques used in wastewater treatment, such as filtration, sedimentation, and coagulation, have demonstrated varying degrees of success in removing MPs, but they often struggle to capture particles smaller than 1 mm.
One promising alternative for MP removal is flotation, a technique widely adopted in mineral processing to separate hydrophobic and hydrophilic particles [24,25]. Flotation works by introducing air bubbles into a slurry (i.e., a mixture of ground materials and water), allowing the target hydrophobic material to attach to the bubbles and rise to the surface, where they can be skimmed off. Because plastics are inherently hydrophobic, flotation techniques present a viable solution for MP removal from water. However, conventional flotation methods exhibit reduced efficiency when applied to MPs due to their small size, which lowers their collision probability with large bubbles [25].
To address this challenge, two strategies developed for the flotation of coal and valuable minerals like chalcopyrite could be adapted for MP removal. The first involves reducing bubble size to enhance particle–bubble interactions, employing techniques such as nanobubble generator flotation [26], carbon dioxide and hydrogen flotation [27,28], electroflotation [29], and column flotation [30]. The second strategy focuses on increasing particle size through carrier flotation [31,32], electrocoagulation [33,34], and agglomeration using bridging agents, such as kerosene, potassium amyl xanthate, sodium dodecyl sulfate, and fibers [35,36,37]. However, previous studies have predominantly focused on coal and sulfide minerals like chalcopyrite, with limited studies exploring MP removal. In addition, most flotation studies have been conducted in controlled freshwater environments, leaving a significant research gap regarding MP removal in seawater or under saline conditions. The presence of salts in seawater and estuarine environments can alter bubble formation and size, the surface properties of MPs, and agglomeration dynamics, potentially reducing flotation efficiency.
The specific objectives of this study are (i) to develop and apply a novel agglomeration–micro-flotation technique—combining bubble-size reduction with particle-size enlargement—for the removal of MPs, applied in this context for the first time; (ii) to evaluate the effects of kerosene dosage on the removal efficiency of six common MP types—polypropylene (PP), polyethylene (PE), acrylonitrile butadiene styrene (ABS), polystyrene (PS), polyethylene terephthalate (PET), and polyvinyl chloride (PVC)—using column flotation, and to compare the required dosage with the authors’ previous work using mechanical flotation [35]; and (iii) to investigate the effects of salinity levels (0%, 50%, and 100%, representing freshwater, brackish water, and seawater, respectively) on MP removal efficiency, in order to assess the technique’s versatility under environmentally relevant conditions and to address the current knowledge gap in flotation performance under saline conditions. Finally, the recovered MP–kerosene agglomerates may be repurposed as a secondary fuel, as both kerosene and plastics are combustible, highlighting the sustainability potential of this approach.

2. Materials and Methods

2.1. Samples

2.1.1. Microplastic Samples

The samples used in this study consisted of six types of plastics, namely PP, PE, ABS, PS, PET, and PVC (Table 1), representing plastics commonly found in waste streams, including wastewater [21]. To generate MPs, boards (1000 × 2000 × 2 mm) of the six different plastic types were cut into smaller sizes using a reciprocating saw. These cut plastics were crushed by a two-shaft shredder (Y. Yong Hahheng Ltd., Part, Bangkok, Thailand) and a cutting mill (PAT Engineering and Service Co., Ltd., Nonthaburi, Thailand) to produce approximately 1 cm plastic fragments. These plastic fragments then underwent cryogenic grinding in liquid nitrogen and screening to obtain particles ranging in size from 100 to 1000 µm.

2.1.2. Environmental Matrices

The environmental matrices used in this study were simulated freshwater (distilled water), brackish water, and seawater with salinity levels equal to 0, 50, and 100%, respectively. The preparation of these matrices began with distilled water containing specific trace elements (Table 2). Synthetic seawater was prepared by adding 880 g of seawater solution powder (SEALIFE, MARINETECH, Tokyo, Japan) to 25 L of distilled water in a bucket, followed by mixing with a mechanical stirrer (R 50, Ingenieurbüro CAT, Ballrechten-Dottingen, Germany) for 10 min. The simulated brackish water was prepared by mixing simulated freshwater and seawater at a 1:1 ratio to achieve half of the salinity of seawater (Table 3).

2.2. Microplastic Removal Experiments

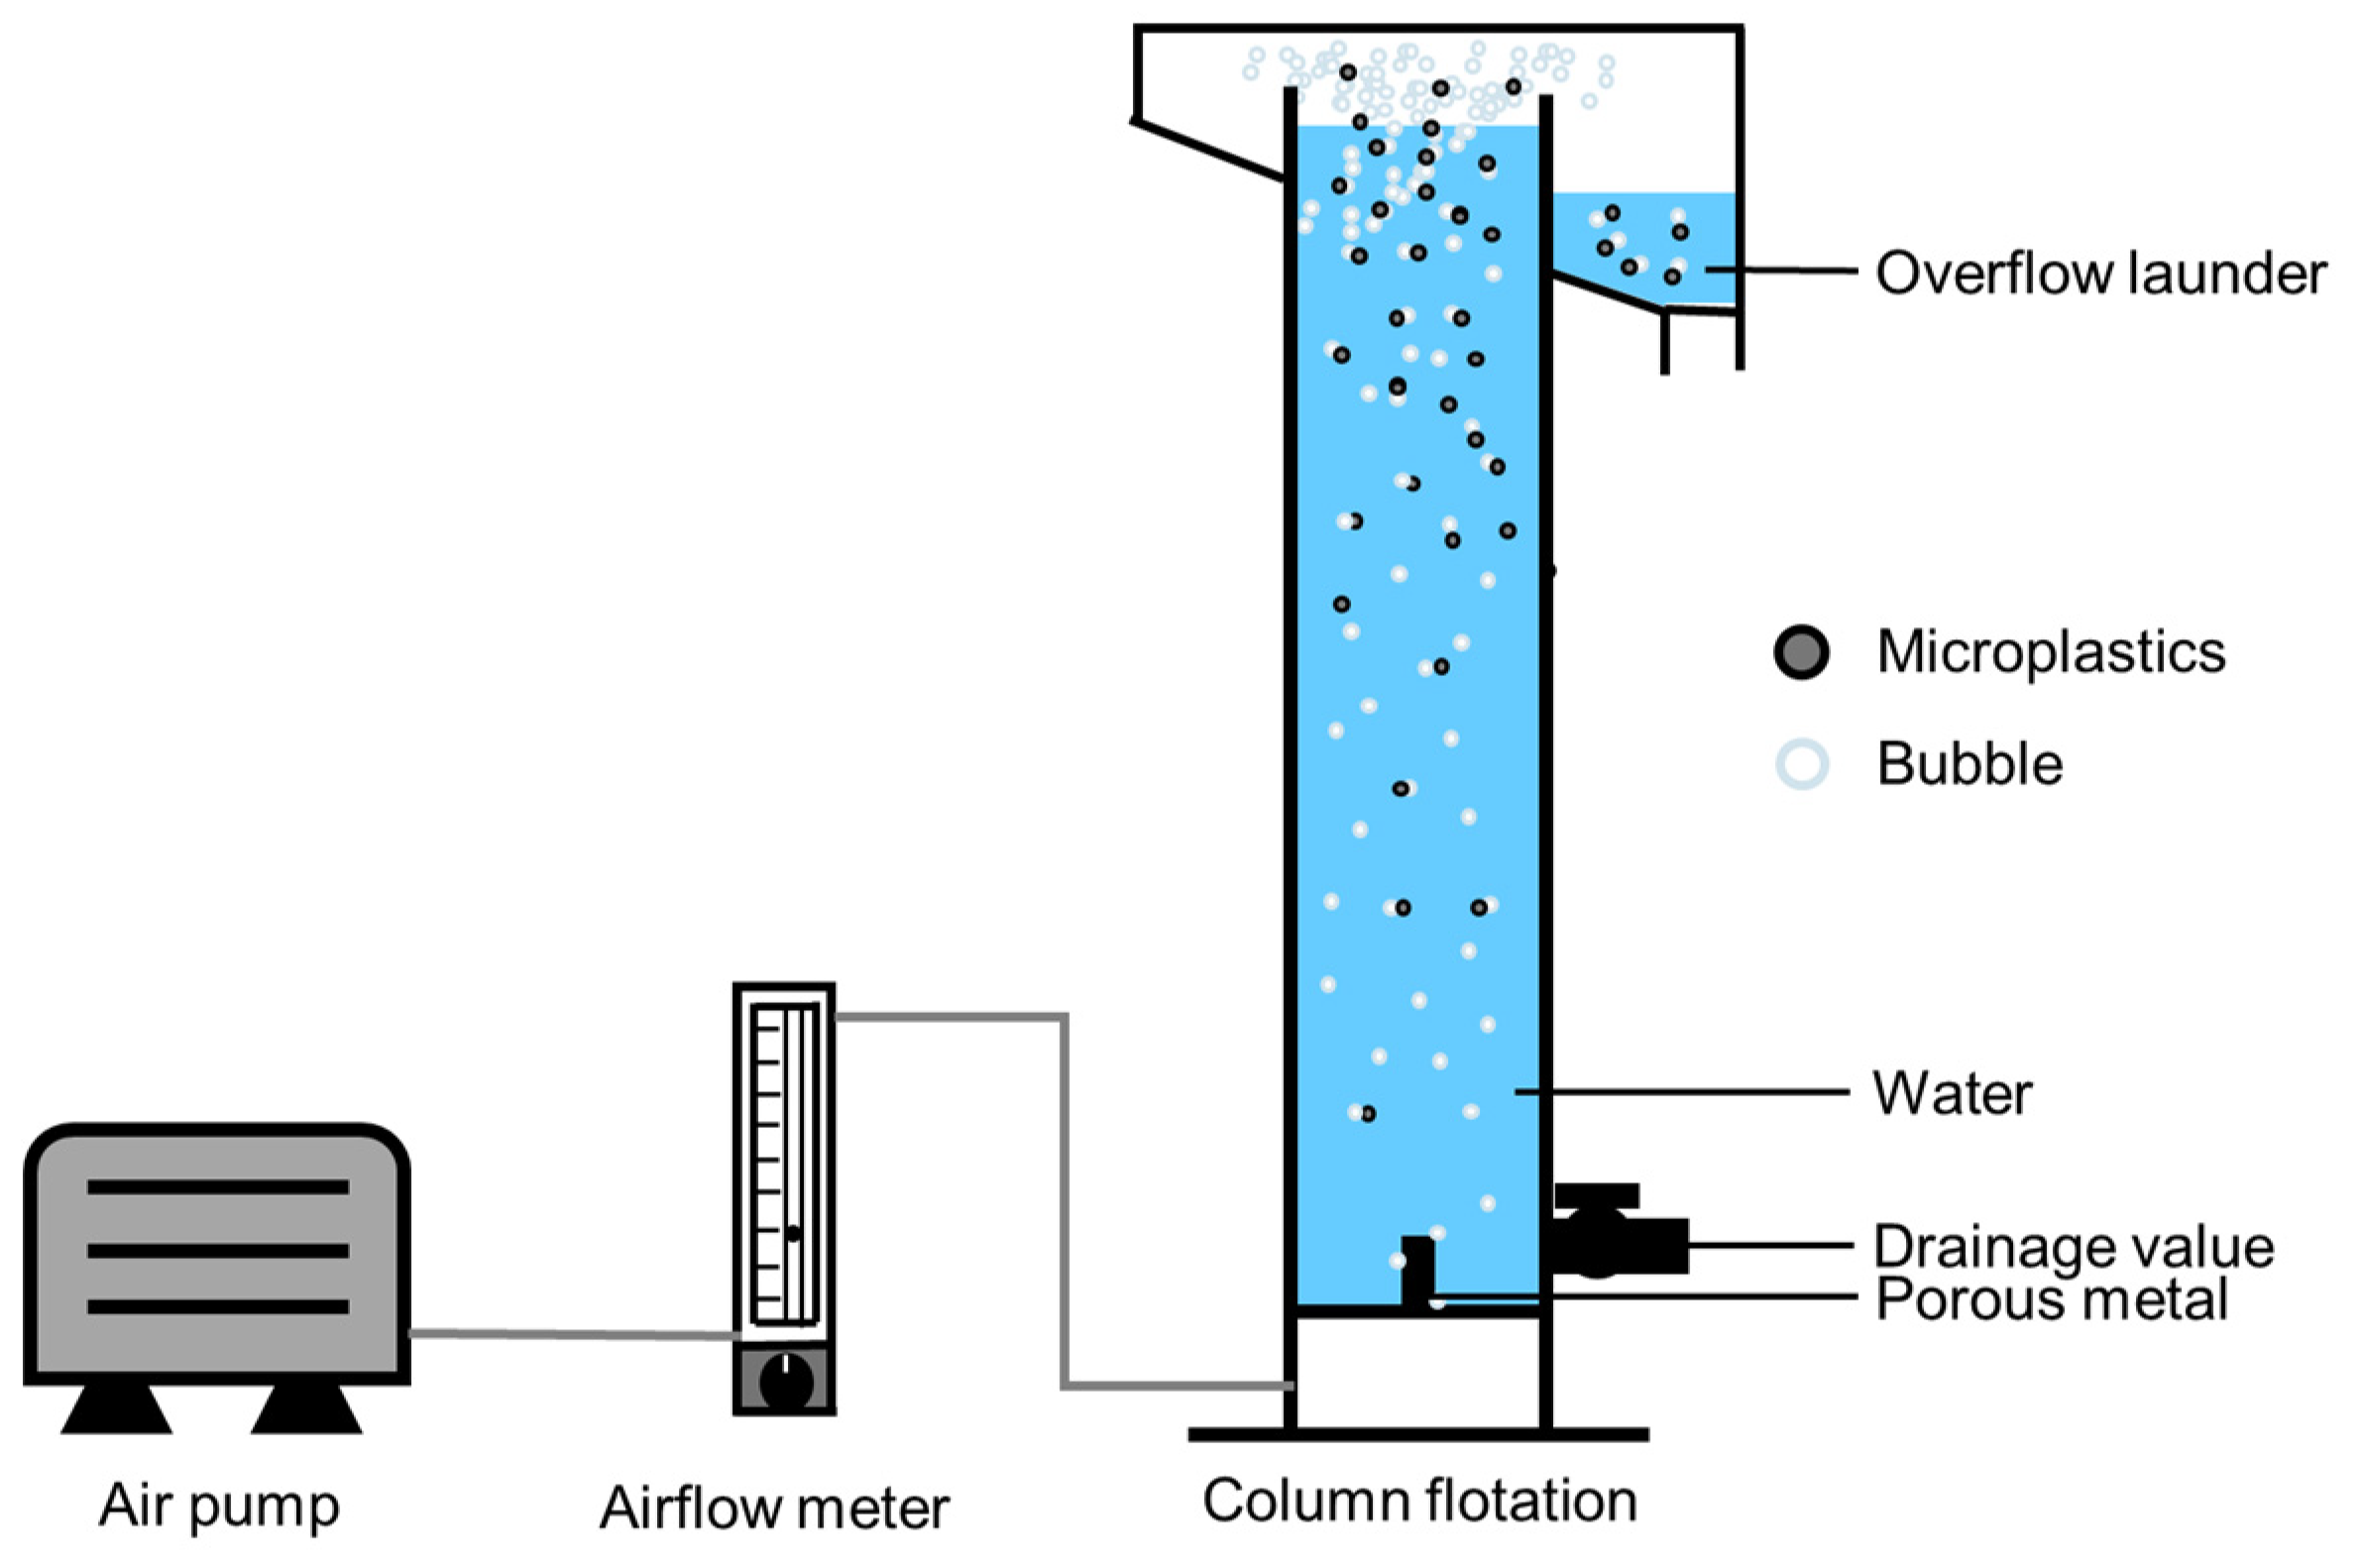
2.2.1. Agglomeration Procedure and Column Flotation Setup

For agglomeration, emulsified kerosene (Alfa Aesar, Hetsham, England) was added as a bridging agent to the MP-contaminated freshwater, brackish water, or seawater and then mixed at 900 rpm using a mechanical stirrer for 10 min as the conditioning step. A total of 42 µL (20 ppm) of methyl isobutyl carbinol (MIBC) (Sigma-Aldrich, Isere, France) was then added as the frother, and the mixture was stirred for 1 min before column flotation, as reported in the previous study of the authors [35].
The column flotation setup used in this study comprises a 51 × 51 × 765 mm flotation cell made from polymethyl methacrylate (PMMA or acrylic) with a porous metal bottom, an air pump, and an airflow meter connected to the air pump and flotation cell (Figure 1). The flotation process was conducted for 1 min at an airflow rate of 3 L/min. The MPs that floated to the froth layer were collected and labeled as the “removed product”, which was dried in an oven at 50 °C for 24 h and weighed to determine the removal rate.

2.2.2. Series Experiments

The series experiments were conducted under controlled conditions with 1.5 g of MPs and 2100 mL of freshwater, brackish water, or seawater. MP samples were placed into a 2500 mL beaker with 2100 mL of water. For the conditioning step, kerosene was added at dosages of 0, 1, 2, 5, 10, 15, 20, 25, and 30 µL (i.e., 0, 0.48, 0.95, 2.38, 4.76, 7.14, 9.52, 11.90, and 14.29 ppm in water or 0, 0.67, 1.33, 3.33, 6.67, 10, 13.33, 16.67, and 20 L/T MPs) sequentially to evaluate the proper amount of kerosene addition. The mixture was then transferred into the flotation cell. The removed product was collected, while the remaining mixture was reconditioned (i.e., the conditioning step), adjusting the water volume to 2100 mL with higher kerosene dosages, and the flotation step was repeated.

2.2.3. Parallel Experiments

For the parallel experiments, kerosene was added in different dosages (0, 5, 10, 20, and 30 µL) to evaluate its effects on the removal rate. After conditioning, the mixture containing MPs was transferred into the flotation column. The removed products were collected, dried, and weighed to determine the removal rate.

2.2.4. Bubble Size Measurements

The bubble size measurement was carried out in water with different salinity levels (i.e., freshwater, brackish water, and seawater) using a high-speed (2000 frames per second) digital camera (HAS-L1, DITECT, Tokyo, Japan) with the condition of 20 ppm of MIBC and the aeration rate at 0.1 L/min (Figure 2). The video was then analyzed using an image analysis software (WinRoof v.5, MITANI Corporation, Tokyo, Japan) to determine the bubble size generated under different salinity levels.

3. Results and Discussion

3.1. Effects of Plastic Type and Kerosene Dosage on the Removal Rate in Simulated Freshwater

The MP removal rate in simulated freshwater was influenced by not only the density (i.e., SG) of MPs but also the kerosene dosage, as illustrated in Figure 3. In excess, however, kerosene negatively influenced the removal rate by increasing hydrophobicity, causing MPs to attach to the plastic components of the column flotation cell. The removal rates of lighter MPs (i.e., PP and PE) were the highest even without kerosene and reached complete removal at a kerosene dosage of 10 µL. For medium-density MPs (i.e., ABS and PS), the removal rate was lower than the low-density MPs, but complete removal was also achieved at 10 µL of kerosene dosage. In contrast, heavy MPs (i.e., PET and PVC) exhibited the lowest removal rates among all MP types, which was in line with the previous research of the authors studied about the agglomeration flotation using mechanical flotation [35]. In mechanical flotation, the removal rate of MPs exceeded 89% without kerosene, increasing further with higher kerosene dosages, indicating that agglomeration could increase MPs removal or their floatability via size enlargement [35]. The increase in removal efficiency can be described using the bubble–particle collision probability (Pc) equation [39].
P C = A ( D p D b ) n
where Dp is the particle diameter, Db is the bubble diameter, and A and n are the empirical constants.
To enhance the removal rate of MPs, the process can be improved by either increasing the particle size (Dp) or decreasing the bubble size (Db), as discussed in the introduction. In our previous study using mechanical flotation [35], agglomeration using kerosene could increase Dp, improving PC.
For column flotation, which produces smaller bubbles (via porous materials or a cavitation tube) than that of mechanical flotation (via air-charging or self-suction), having Db less than that of mechanical flotation [30]. This means that PC should be enhanced, but in this case, the collision of this study using column flotation may be lower due to not only Dp and Db but also the water flow direction influencing bubble movement and collision efficiency. In mechanical flotation, the water flow caused by the agitator is more turbulent, increasing the collision rate between bubbles and particles, while water flow in column flotation is more laminar and relies solely on vertically rising bubbles without additional enhancement from water flow in the horizontal direction [40].
For the combination of particle enlargement and fine bubble generation, PC should be higher and improve the MP removal or their floatability. The highest removal rate in mechanical flotation was 96% for PP and PE at a kerosene dosage of 2 mL (i.e., 1333.33 ppm in water or 2000 L/T MPs), while the removal rates for ABS, PS, PET, and PVC were 89%, 93%, 96%, and 89%, respectively, at the same kerosene dosage [35]. In comparison, all types of MPs could reach about 99% in column flotation at kerosene dosages of 10–30 µL (i.e., 4.76–14.29 ppm in water or 6.67–20 L/T MPs). These results indicate that column flotation consumes around 100 times less kerosene dosage at 0.03 mL than mechanical flotation at 2 mL. This large difference between the two types of flotation setups could be attributed to the already small Db in column flotation, which necessitates small kerosene dosages to increase Dp and improve PC, making this approach more environmentally friendly and cost-efficient.

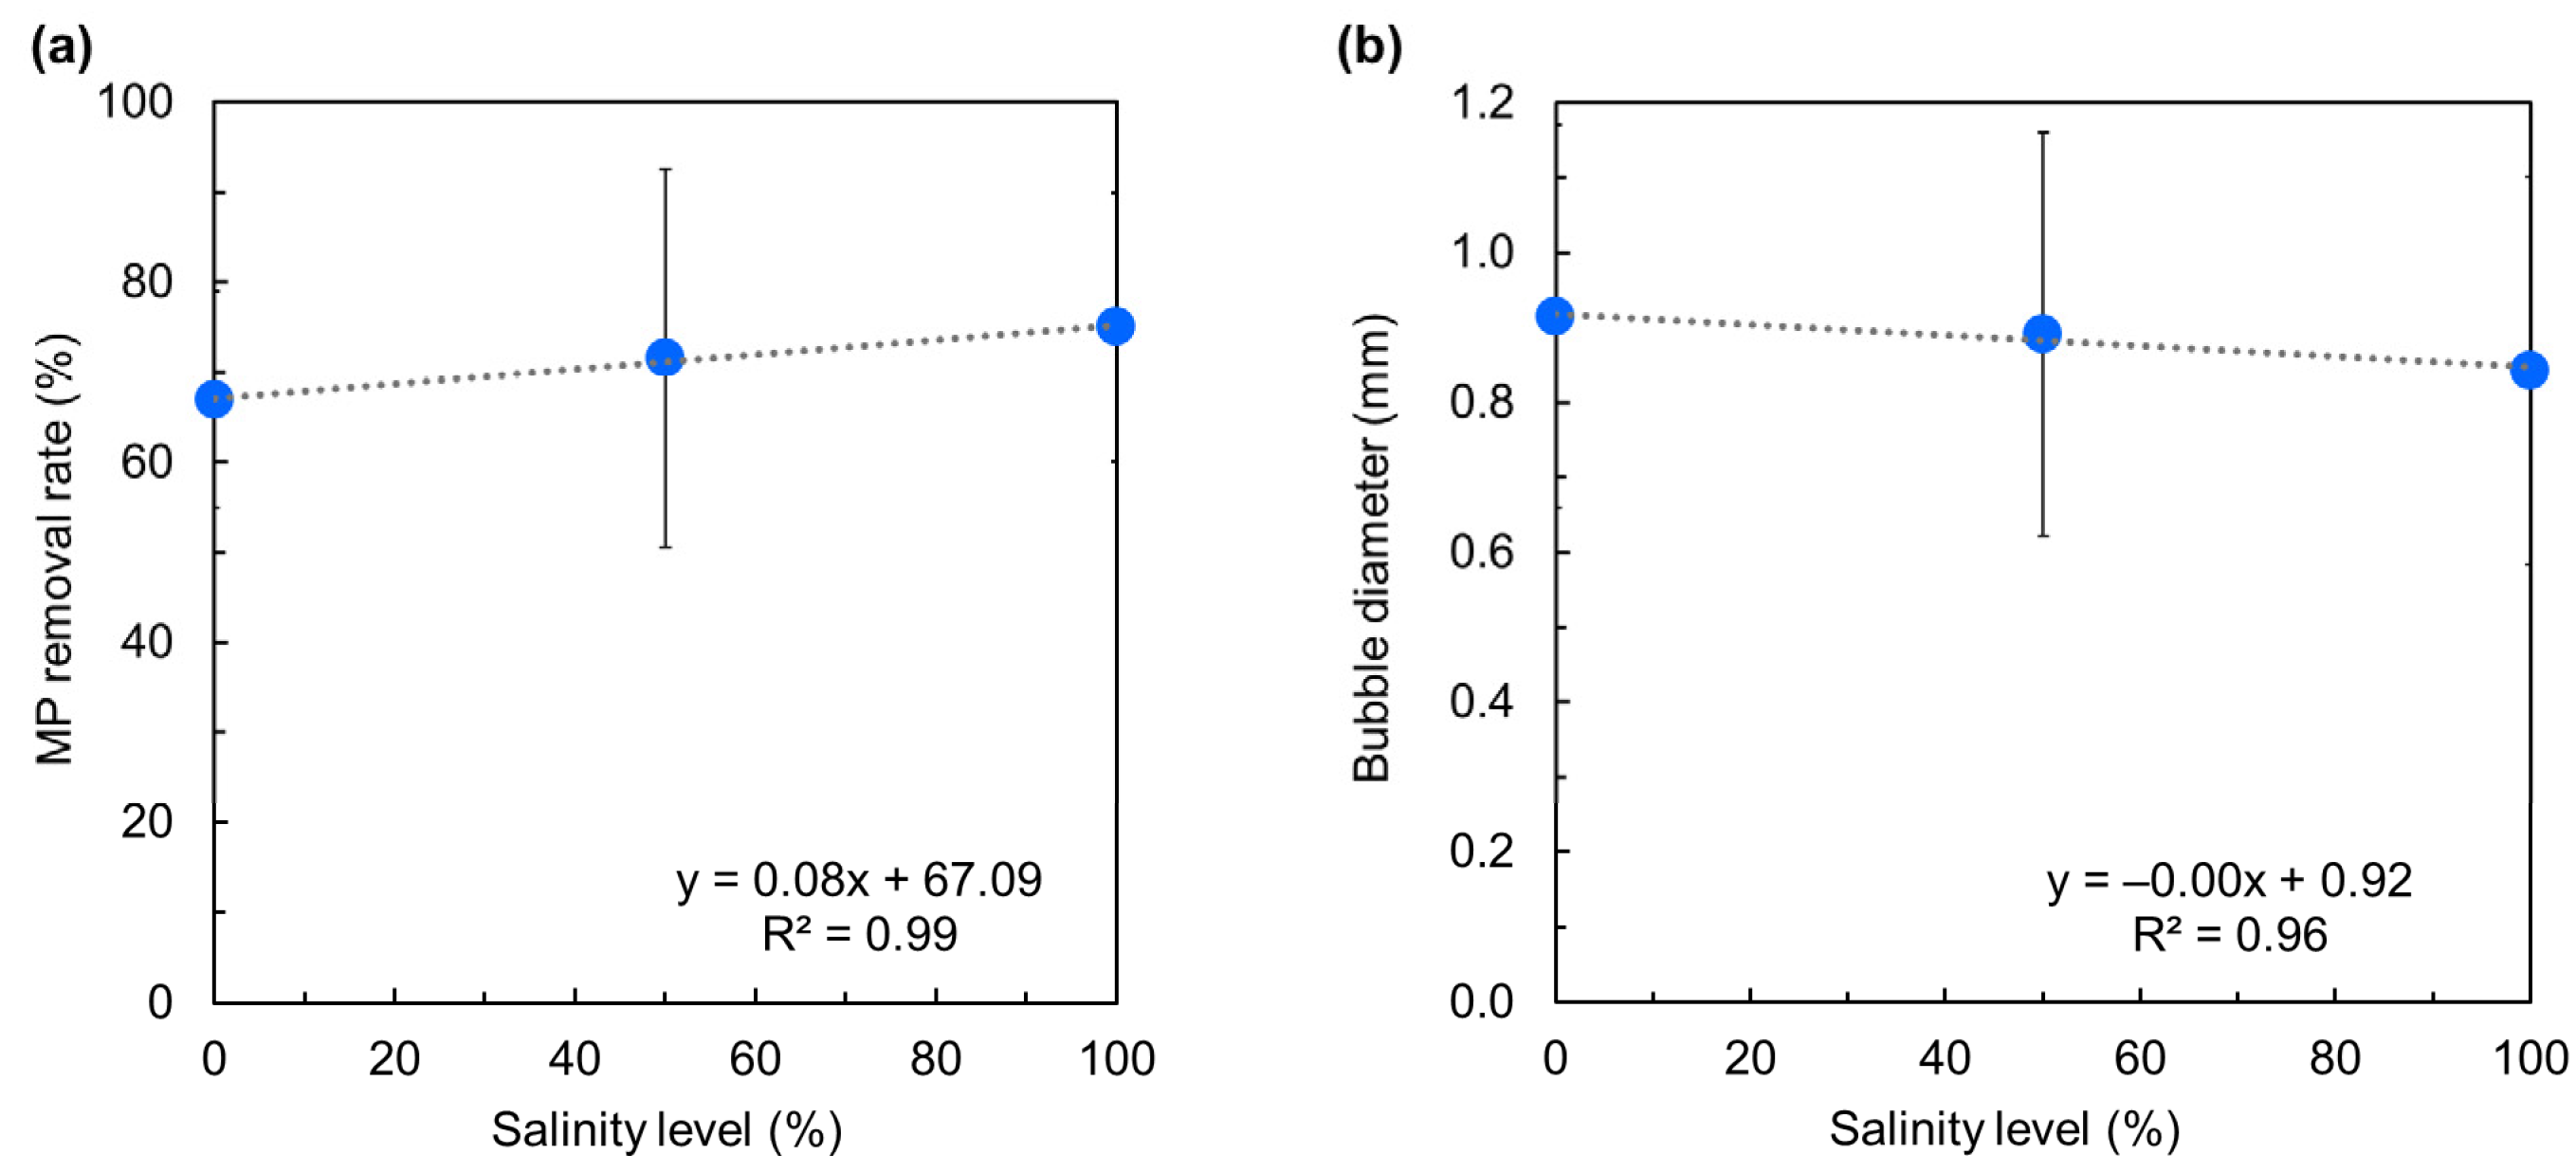
3.2. Effects of Salinity Levels on the Removal Rate of Microplastics

Without kerosene, higher salinity levels promoted MP removal, as shown in Figure 4a. This increase in MP removal rate could be attributed to the smaller bubble size generated as the salinity level increased (Figure 4b). As explained in Equation (1), the collision probability increases as bubble size decreases, improving the removal rate of MPs [39]. The decrease in bubble size as the salinity level increased could be explained by the higher concentrations of dissolved ions that not only stabilized bubbles but also limited their merging and coalescence [41].

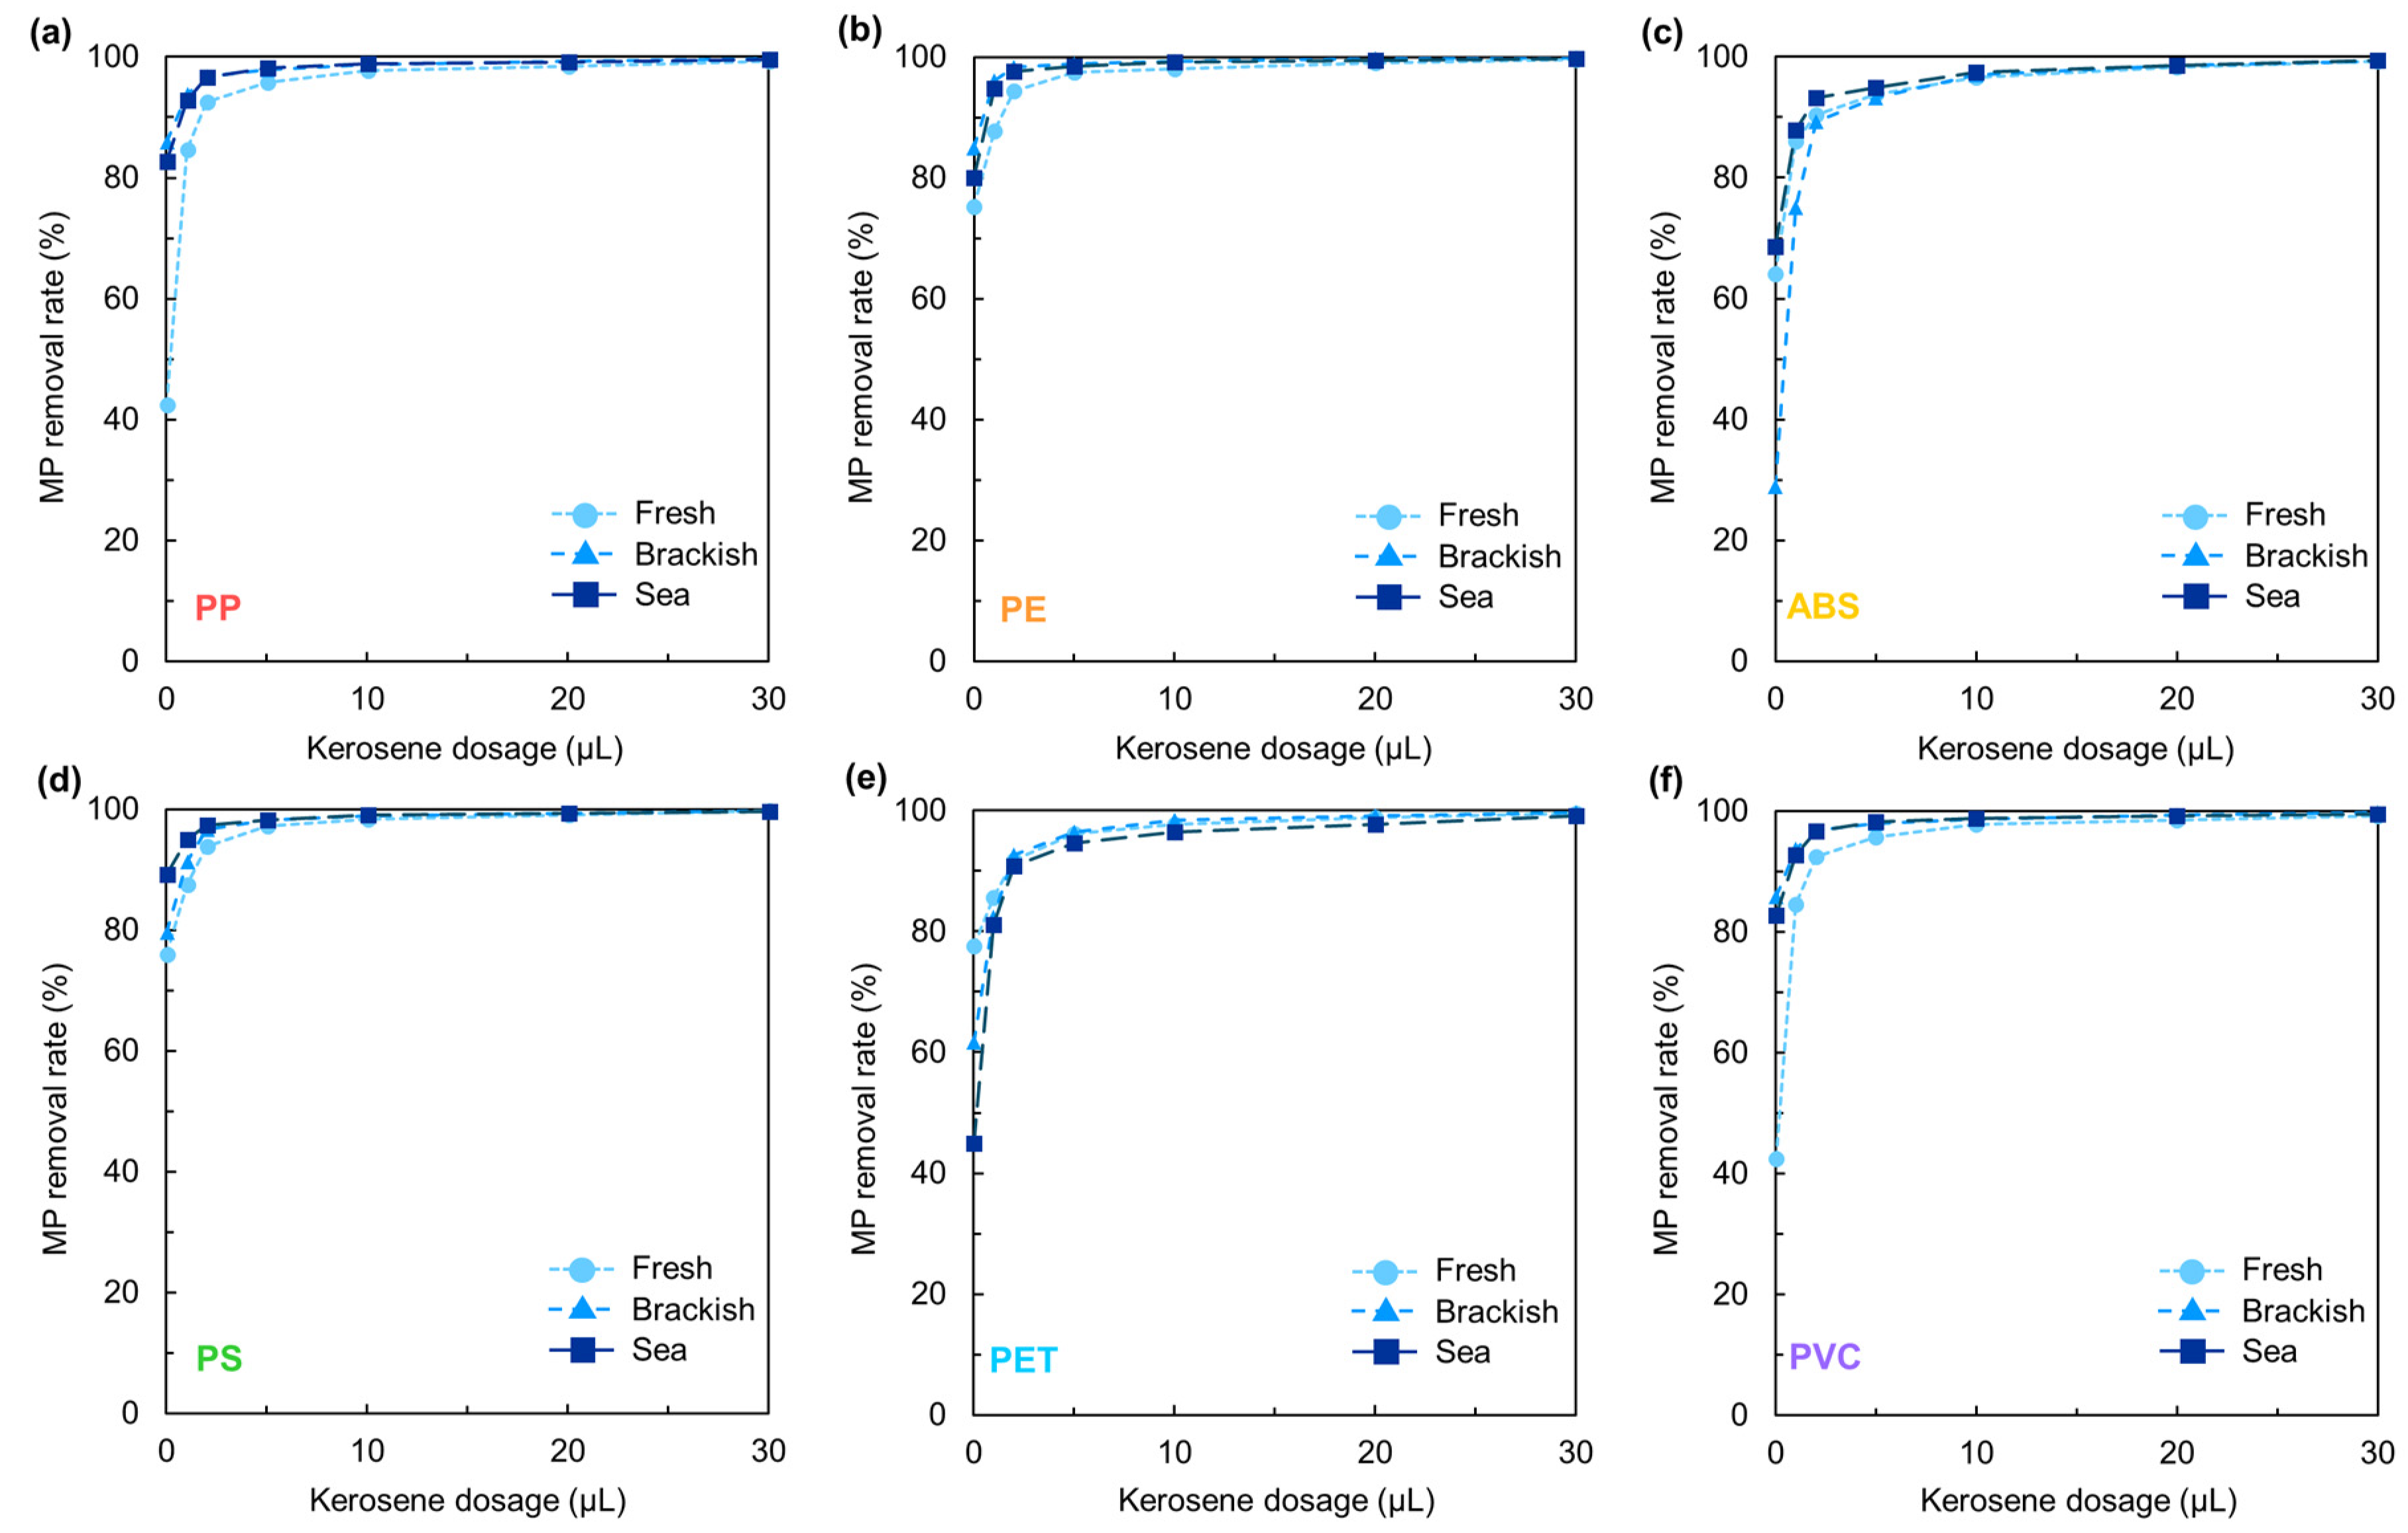
3.3. Effects of Kerosene Dosage on the Removal Rate of Microplastics at Different Salinity Levels

3.3.1. Series Experiments

The effects of kerosene dosage in the series experiments at different salinity levels are shown in Figure 5. Increasing the kerosene dosage promoted MP removal, regardless of the salinity level. The removal rate of MPs rapidly increased at kerosene dosages of 1, 2, and 5 µL, reaching 92% in simulated freshwater and 95% in simulated brackish water and seawater. The removal of MPs was lowest in simulated freshwater when the kerosene dosage was below 10 µL. As the dosage of kerosene increased above 10 µL, however, the removal rates of the three environmental matrices became similar. These results suggest that kerosene was effective as a bridging liquid not only in freshwater but also in brackish water and seawater, improving MP removal rate via agglomeration.
The removal rates for the different types of MPs were generally higher in simulated brackish water and seawater than in freshwater. Around 99% of the lighter MPs (Figure 6a,b) were removed above 10 µL of kerosene dosage, regardless of the salinity level. At less than 10 µL, however, the removal of PP and PE was better at higher salinity levels. For medium-density MPs (Figure 6c,d), the removal rates were similar for all salinity levels at a kerosene dosage of 10 µL. Comparing PS and ABS, the removal rate of the former was slightly higher, reaching approximately 99% at 10 µL of kerosene (Figure 6d), while the latter achieved around 99% removal at 20 µL of kerosene (Figure 6c). Similar to the lighter MPs, the removal rates of the medium-density MPs were better at higher salinity levels. The removal rates of high-density MPs (Figure 6e,f) had similar trends with the medium- and low-density MPs. High removal rates of PVC (Figure 6f) and PET (Figure 6e) were also achieved using the agglomeration–micro-flotation technique but at higher kerosene dosages of >30 µL.

3.3.2. Parallel Experiments

The MP removal rates in simulated brackish water and seawater were higher than those in simulated freshwater for the parallel experiments (Figure 7). Although the removal rates of MPs fluctuated as the dosage of kerosene increased, the trends showed similar removal rates ranging from 62% to 75%, which were higher than those measured in simulated freshwater (45−55%).
In terms of plastic type, the removal rate for PP and PE exceeded 60% even without kerosene. For PP (Figure 8a), the removal rates were higher in simulated brackish water and seawater than in simulated freshwater. In contrast, the removal trends for PE (Figure 8b) in simulated freshwater, brackish water, and seawater were similar. For medium-density MPs (i.e., ABS and PS), the results showed similar trends as illustrated in Figure 8c,d. The removal rates were initially high at low kerosene dosages but decreased as kerosene dosage increased. As noted earlier, this decrease in removal rates at higher kerosene dosages could be attributed to an increase in hydrophobicity that inadvertently promoted the sticking of MPs to the column cell, which limited their removal. For the high-density MPs (i.e., PET and PVC), their removal rates followed a similar trend to that of the low-density MPs (Figure 8e,f). The removal rates in simulated brackish water and seawater were higher than in simulated freshwater, though the results fluctuated across different kerosene dosages.
In general, the removal of MPs increased at higher salinity levels because of bubble size reduction effects, enhancing the probability of bubble–particle collision. Meanwhile, increasing the kerosene dosage had a positive effect on the removal of MPs by particle size enlargement. In excess, however, kerosene lowered the efficiency of the agglomeration–micro-flotation technique by coating the column flotation cell surface with an oil film that promoted MP attachment. This phenomenon caused the retention of a substantial portion of MPs in the column flotation setup.

4. Conclusions

This study developed the agglomeration–micro-flotation to remove six common types of MPs—PP, PE, ABS, PS, PET, and PVC—from simulated freshwater, brackish water, and seawater. The key findings of this work are summarized below:
  • Without kerosene, low-density MPs (i.e., PP and PE) exhibited the highest removal rates, followed by medium-density MPs (i.e., ABS and PS) and high-density MPs (i.e., PET and PVC).
  • Increasing kerosene dosage significantly improved removal rates by promoting MP agglomeration, increasing apparent particle size, and enhancing particle–bubble collision probability.
  • Higher salinity levels (i.e., 50–100%) improved MP removal due to bubble stabilization and suppressed bubble coalescence caused by dissolved ions.
  • The technique remained effective across all salinity levels, and the influence of MP density on removal rate diminished at higher salinities.
These findings demonstrate that the agglomeration–micro-flotation technique is effective and adaptable for MP remediation in both freshwater and high-salinity environments, such as brackish water and seawater. This supports its applicability in real-world aquatic systems, including estuaries and marine ecosystems, in line with Sustainable Development Goal (SDG) 14: Life Below Water [42]. Additionally, the MP–kerosene agglomerates recovered in this process can be repurposed as secondary fuels, promoting circular resource use and sustainable waste management. However, excessive kerosene may lead to undesired attachment to other hydrophobic surfaces, potentially reducing flotation efficiency. For future studies, this technique should be tested on real environmental samples, including wastewater and sediment-containing matrices, to validate its practical application and scalability in diverse environmental conditions.

Author Contributions

Conceptualization, T.P., K.H. and O.J.; methodology, T.P. and P.S.; validation, P.S., W.K. and C.B.; formal analysis, P.S., W.K. and C.B.; investigation, P.S., W.K., C.B. and I.P.; resources, T.P., M.I. and K.H.; data curation, P.S., W.K. and C.B.; writing—original draft preparation, T.P., P.S., I.P., M.I., M.V.-T., C.B.T., S.J. and K.H.; writing—review and editing, T.P., P.S., I.P., M.I., M.V.-T., C.B.T., S.J. and K.H.; visualization, T.P., P.S., W.K. and C.B.; supervision, T.P., M.I., K.H. and O.J.; project administration, T.P., P.S. and O.J.; funding acquisition, O.J. All authors have read and agreed to the published version of the manuscript.

Funding

This research is funded by Thailand Science Research and Innovation Fund Chulalongkorn University (No. 6641/2566).

Data Availability Statement

The original contributions presented in this study are included in the article. Further inquiries can be directed at the corresponding authors.

Acknowledgments

This research was funded by the Thailand Science Research and Innovation Fund, Chulalongkorn University (No. 6641/2566), and supported by the Postdoctoral Fellowship under the Second Century Fund (C2F), Chulalongkorn University, as well as the Tohoku Initiative for Fostering Global Researchers for Interdisciplinary Sciences (TI-FRIS) from Tohoku University. The authors gratefully acknowledge the Department of Mining and Petroleum Engineering, Faculty of Engineering, Chulalongkorn University, for providing laboratory facilities and resources; the Division of Sustainable Resources Engineering, Faculty of Engineering, Hokkaido University, for supplying the plastic samples; and the Department of Earth Resource Engineering and Environmental Science, Faculty of International Resource Science, Akita University, for providing the seawater solution powder. The authors also sincerely thank the editor and reviewers for their valuable insights and constructive feedback on this paper.

Conflicts of Interest

The authors declare no conflicts of interest.

References

  1. Jeong, E.; Lee, J.Y.; Redwan, M. Animal exposure to microplastics and health effects: A review. Emerg. Contam. 2024, 10, 100369. [Google Scholar] [CrossRef]
  2. Sun, S.; Shi, W.; Tang, Y.; Han, Y.; Du, X.; Zhou, W.; Zhang, W.; Sun, C.; Liu, G. The toxic impacts of microplastics (MPs) and polycyclic aromatic hydrocarbons (PAHs) on haematic parameters in a marine bivalve species and their potential mechanisms of action. Sci. Total Environ. 2021, 783, 147003. [Google Scholar] [CrossRef] [PubMed]
  3. Sutkar, P.R.; Gadewar, R.D.; Dhulap, V.P. Recent trends in degradation of microplastics in the environment: A state-of-the-art review. J. Hazard. Mater. Adv. 2023, 11, 100343. [Google Scholar] [CrossRef]
  4. Yin, K.; Wang, D.; Zhao, H.; Wang, Y.; Guo, M.; Liu, Y.; Li, B.; Xing, M. Microplastics pollution and risk assessment in water bodies of two nature reserves in Jilin Province: Correlation analysis with the degree of human activity. Sci. Total Environ. 2021, 799, 149390. [Google Scholar] [CrossRef]
  5. Julapong, P.; Srichonphaisarn, P.; Meekoch, T.; Tabelin, C.B.; Juntarasakul, O.; Phengsaart, T. The Influence of Textile Type, Textile Weight, and Detergent Dosage on Microfiber Emissions from Top-Loading Washing Machines. Toxics 2024, 12, 210. [Google Scholar] [CrossRef]
  6. Juntarasakul, O.; Julapong, P.; Srichonphaisarn, P.; Meekoch, T.; Janjaroen, D.; Tabelin, C.B.; Phengsaart, T. Weave structures of polyester fabric affect the tensile strength and microplastic fiber emission during the laundry process. Sci. Rep. 2025, 15, 2272. [Google Scholar] [CrossRef]
  7. Rafique, A.; Irfan, M.; Mumtaz, M.; Qadir, A. Spatial distribution of microplastics in soil with context to human activities: A case study from the urban center. Environ. Monit. Assess. 2020, 192, 671. [Google Scholar] [CrossRef]
  8. Karbalaei, S.; Hanachi, P.; Walker, T.R.; Cole, M. Occurrence, sources, human health impacts and mitigation of microplastic pollution. Environ. Sci. Pollut. Res. 2018, 25, 36046–36063. [Google Scholar] [CrossRef]
  9. Kong, W.; Jalalah, M.; Alsareii, S.A.; Harraz, F.A.; Almadiy, A.A.; Zheng, Y.; Thakur, N.; Salama, E.S. Microplastics (MPs) in wastewater treatment plants sludges: Substrates, digestive properties, microbial communities, mechanisms, and treatments. J. Environ. Chem. Eng. 2023, 11, 111408. [Google Scholar] [CrossRef]
  10. Li, Y.; Zhang, Y.; Su, F.; Wang, Y.; Peng, L.; Liu, D. Adsorption behaviour of microplastics on the heavy metal Cr (VI) before and after ageing. Chemosphere 2022, 302, 134865. [Google Scholar] [CrossRef]
  11. Menéndez-Pedriza, A.; Jaumot, J. Interaction of environmental pollutants with microplastics: A critical review of sorption factors, bioaccumulation and ecotoxicological effects. Toxics 2020, 8, 40. [Google Scholar] [CrossRef] [PubMed]
  12. Niu, X.; Wang, X.; Dong, H.; Ciren, N.; Zhang, H.; Chen, X.; Zhuoga, S.; Jia, X.; Xu, L.; Zhou, Y. Microplastics in remote region of the world: Insights from the glacier of Geladandong, China. Appl. Geochem. 2024, 168, 106026. [Google Scholar] [CrossRef]
  13. Bissen, R.; Chawchai, S. Microplastics on beaches along the eastern Gulf of Thailand—A preliminary study. Mar. Pollut. Bull. 2020, 157, 111345. [Google Scholar] [CrossRef]
  14. Heshmati, S.; Makhdoumi, P.; Pirsaheb, M.; Hossini, H.; Ahmadi, S.; Fattahi, H. Occurrence and characterization of microplastic content in the digestive system of riverine fishes. J. Environ. Manag. 2021, 299, 113620. [Google Scholar] [CrossRef]
  15. Campos, A.R.A.; Luza, K.M.B.; Subebe, M.J.B.; Tabelin, C.B.; Phengsaart, T.; Arima, T.; Sena, R.; Butalid, R.; Escabarte, A.B.; Mazahery, A.R.F.; et al. Polytetrafluoroethylene (PTFE) microplastics affect angiogenesis and central nervous system (CNS) development of duck embryo. Emerg. Contam. 2025, 11, 100433. [Google Scholar] [CrossRef]
  16. Ragusa, A.; Svelato, A.; Santacroce, C.; Catalano, P.; Notarstefano, V.; Carnevali, O.; Papa, F.; Rongioletti, M.C.A.; Baiocco, F.; Draghi, S.; et al. Plasticenta: First evidence of microplastics in human placenta. Environ. Int. 2021, 146, 106274. [Google Scholar] [CrossRef]
  17. Nihart, A.J.; Garcia, M.A.; El Hayek, E.; Liu, R.; Olewine, M.; Kingston, J.D.; Castillo, E.F.; Gullapalli, R.R.; Howard, T.; Bleske, B.; et al. Bioaccumulation of microplastics in decedent human brains. Nat. Med. 2025, 31, 1114–1119. [Google Scholar] [CrossRef]
  18. Nawab, A.; Ahmad, M.; Khan, M.T.; Nafees, M.; Khan, I.; Ihsanullah, I. Human exposure to microplastics: A review on exposure routes and public health impacts. J. Hazard. Mater. Adv. 2024, 16, 100487. [Google Scholar] [CrossRef]
  19. Li, Y.; Chen, L.; Zhou, N.; Chen, Y.; Ling, Z.; Xiang, P. Microplastics in the human body: A comprehensive review of exposure, distribution, migration mechanisms, and toxicity. Sci. Total Environ. 2024, 946, 174215. [Google Scholar] [CrossRef]
  20. Zhang, Q.; Xu, E.G.; Li, J.; Chen, Q.; Ma, L.; Zeng, E.Y.; Shi, H. A review of microplastics in table salt, drinking water, and air: Direct human exposure. Environ. Sci. Technol. 2020, 54, 3740–3751. [Google Scholar] [CrossRef]
  21. Zuri, G.; Karanasiou, A.; Lacorte, S. Microplastics: Human exposure assessment through air, water, and food. Environ. Int. 2023, 179, 108150. [Google Scholar] [CrossRef] [PubMed]
  22. Evangeliou, N.; Grythe, H.; Klimont, Z.; Heyes, C.; Eckhardt, S.; Lopez-Aparicio, S.; Stohl, A. Atmospheric transport is a major pathway of microplastics to remote regions. Nat. Commun. 2020, 11, 3381. [Google Scholar] [CrossRef] [PubMed]
  23. Dayal, L.; Yadav, K.; Dey, U.; Das, K.; Kumari, P.; Raj, D.; Mandal, R.R. Recent advancement in microplastic removal process from wastewater-a critical review. J. Hazard. Mater. Adv. 2024, 16, 100460. [Google Scholar] [CrossRef]
  24. Kyzas, G.Z.; Matis, K.A. Flotation in water and wastewater treatment. Processes 2018, 6, 116. [Google Scholar] [CrossRef]
  25. Fuerstenau, M.C.; Jameson, G.J.; Yoon, R.H. Froth Flotation: A Century of Innovation; SME: Littleton, CO, USA, 2007. [Google Scholar]
  26. Cheng, G.; Zhang, M.N.; Li, Y.L.; Lau, E.V. Improving micro-fine mineral flotation via micro/nano technologies. Sep. Sci. Technol. 2023, 58, 520–537. [Google Scholar] [CrossRef]
  27. Dai, Z.; Fornasiero, D.; Ralston, J. Influence of dissolved gas on bubble–particle heterocoagulation. J. Chem. Soc. Faraday Trans. 1998, 94, 1983–1987. [Google Scholar] [CrossRef]
  28. Kwak, D.H.; Kim, M.S. Feasibility of carbon dioxide bubbles as a collector in flotation process for water treatment. J. Water Supply Res. Technol.—AQUA 2013, 62, 52–65. [Google Scholar] [CrossRef]
  29. Sarkar, M.S.K.A.; Evans, G.M.; Donne, S.W. Bubble size measurement in electroflotation. Miner. Eng. 2010, 23, 1058–1065. [Google Scholar] [CrossRef]
  30. Finch, J.A.; Dobby, G. Column flotation. In Flotation Science and Engineering; CRC Press: Boca Raton, FL, USA, 1990; pp. 291–329. [Google Scholar]
  31. Subrahmanyam, T.V.; Forssberg, K.E. Fine particles processing: Shear-flocculation and carrier flotation—A review. Int. J. Miner. Process. 1990, 30, 265–286. [Google Scholar] [CrossRef]
  32. Bu, X.; Wang, X.; Zhou, S.; Li, B.; Zhan, H.; Xie, G. Discrimination of six flotation kinetic models used in the conventional flotation and carrier flotation of− 74 μm coal fines. ACS Omega 2020, 5, 13813–13821. [Google Scholar] [CrossRef]
  33. Shen, M.; Zhang, Y.; Almatrafi, E.; Hu, T.; Zhou, C.; Song, B.; Zeng, Z.; Zeng, G. Efficient removal of microplastics from wastewater by an electrocoagulation process. Chem. Eng. J. 2022, 428, 131161. [Google Scholar] [CrossRef]
  34. Mollah, M.Y.A.; Schennach, R.; Parga, J.R.; Cocke, D.L. Electrocoagulation (EC)—Science and applications. J. Hazard Mater. 2001, 84, 29–41. [Google Scholar] [CrossRef] [PubMed]
  35. Julapong, P.; Ekasin, J.; Katethol, P.; Srichonphaisarn, P.; Juntarasakul, O.; Numprasanthai, A.; Tabelin, C.B.; Phengsaart, T. Agglomeration-Flotation of Microplastics Using Kerosene as Bridging Liquid for Particle Size Enlargement. Sustainability 2022, 14, 15584. [Google Scholar] [CrossRef]
  36. Hornn, V.; Ito, M.; Shimada, H.; Tabelin, C.B.; Jeon, S.; Park, I.; Hiroyoshi, N. Agglomeration-Flotation of Finely Ground Chalcopyrite and Quartz: Effects of Agitation Strength during Agglomeration Using Emulsified Oil on Chalcopyrite. Minerals 2020, 10, 380. [Google Scholar] [CrossRef]
  37. Alioua, W.; Lapointe, M. Fiber-based super-bridging agents enable efficient contaminant removal via settling and screening: Impact on microplastics, textile fibers, and turbidity. J. Environ. Chem. Eng. 2023, 11, 110195. [Google Scholar] [CrossRef]
  38. HiMedia Laboratories. “Artificial Sea Water Salts Broth”. M1942 2013. Available online: https://exodocientifica.com.br/_technical-data/M1942.pdf (accessed on 20 February 2025).
  39. Yoon, R.H. The role of hydrodynamic and surface forces in bubble–particle interaction. Int. J. Miner. Process. 2000, 58, 129–143. [Google Scholar] [CrossRef]
  40. Mei, R.; Hu, K.C. On the collision rate of small particles in turbulent flows. J. Fluid Mech. 1999, 391, 67–89. [Google Scholar] [CrossRef]
  41. Castro, S.; Laskowski, J.S. Froth flotation in saline water. KONA Powder Part. J. 2011, 29, 4–15. [Google Scholar] [CrossRef]
  42. United Nations. The UN Sustainable Development Goals. United Nations, New York, 2015. Available online: http://www.un.org/sustainabledevelopment/summit/ (accessed on 5 March 2025).
Figure 1. A schematic diagram of the column flotation setup and its operation.
Water 17 01264 g001
Figure 2. A schematic diagram of the bubble size measurements.
Water 17 01264 g002
Figure 3. Removal rates of MPs in freshwater as a function of kerosene dosage.
Water 17 01264 g003
Figure 4. (a) MP removal rate as a function of salinity level, and (b) the average size of bubbles as a function of salinity without kerosene.
Water 17 01264 g004
Figure 5. MP removal rates as a function of kerosene dosage at different salinity levels in the series experiments using column flotation.
Water 17 01264 g005
Figure 6. MP removal rates as a function of kerosene dosage in series experiments at different salinity levels for (a) PP, (b) PE, (c) ABS, (d) PS, (e) PET, and (f) PVC.
Water 17 01264 g006
Figure 7. Removal rates of MPs as a function of kerosene dosage in parallel experiments at different salinity levels using agglomeration–micro-flotation.
Water 17 01264 g007
Figure 8. Removal rates of MPs as a function of kerosene dosage in parallel experiments at different salinity levels for (a) PP, (b) PE, (c) ABS, (d) PS, (e) PET, and (f) PVC.
Water 17 01264 g008
Table 1. The properties of microplastics used in this study.
Type of PlasticsSGD50 (µm)Provider
Polypropylene (PP)0.92~600Showa Denko Materials Co., Ltd., Tokyo, Japan
Polyethylene (PE)0.97~460Showa Denko Materials Co., Ltd., Tokyo, Japan
Acrylonitrile butadiene styrene (ABS)1.03~540Sumitomo Bakelite Co., Ltd., Shizuoka, Japan
Polystyrene (PS)1.06~590Kyoei Sangyo Co., Ltd., Tokyo, Japan
Polyethylene terephthalate (PET)1.31~600Sanplatec Corp., Osaka, Japan
Polyvinyl chloride (PVC)1.38~550Sanplatec Corp., Osaka, Japan
Note: “SG” means specific gravity; “D50” means median particle size.
Table 2. The specification of distilled water used in this study.
Test ItemSpecification
AppearanceClear
ColorColorless
pH5.2–7.0
Residual dissolved solids0–1.0 ppm
ChlorideNeg.
Electrical conductivity0–1.0 Microsiemens
IronNeg.
TinNeg.
CopperNeg.
HardnessNeg.
Note: “Neg.” means negative or cannot be detected.
Table 3. Compositions of standard seawater and simulated brackish water and seawater.
ComponentStandard
Seawater
Specification (g/L) [38]
Simulated Seawater
Specification (g/L)
Simulated Brackish Water
Specification (g/L)
Sodium chloride (NaCl)24.60~24.60~12.30
Magnesium chloride (MgCl2)4.66~4.66~2.33
Magnesium sulfate (MgSO4)6.29~6.29~3.15
Calcium chloride (CaCl2)1.36~1.36~0.68
Potassium chloride (KCl)0.67~0.67~0.34
Strontium (Sr)N/AN/A
Boron (B)N/AN/A
Lithium (Li)N/AN/A
Iodine (I)N/AN/A
Molybdenum (Mo)N/AN/A
Note: “N/A” means not specified; “–” means unidentified.
Disclaimer/Publisher’s Note: The statements, opinions and data contained in all publications are solely those of the individual author(s) and contributor(s) and not of MDPI and/or the editor(s). MDPI and/or the editor(s) disclaim responsibility for any injury to people or property resulting from any ideas, methods, instructions or products referred to in the content.

