
Achieving Water and Energy Independence, Economic Sustainability, and CO2 Reduction Through Hybrid Renewable Systems: A Case Study of Skyros Island


Abstract
:1. Introduction
- To what extent can an HRES ensure both water and energy independence for a remote, non-interconnected island such as Skyros?
- How do different energy storage configurations—pumped hydro, hydrogen, or a combination—compare in terms of technical performance, economic feasibility, and environmental impact?
- Can the integration of hydrogen storage enhance the flexibility and resilience of HRESs in small-scale, off-grid island settings, and what are the implications for CO2 emissions and seasonal reliability?
2. Materials and Methods
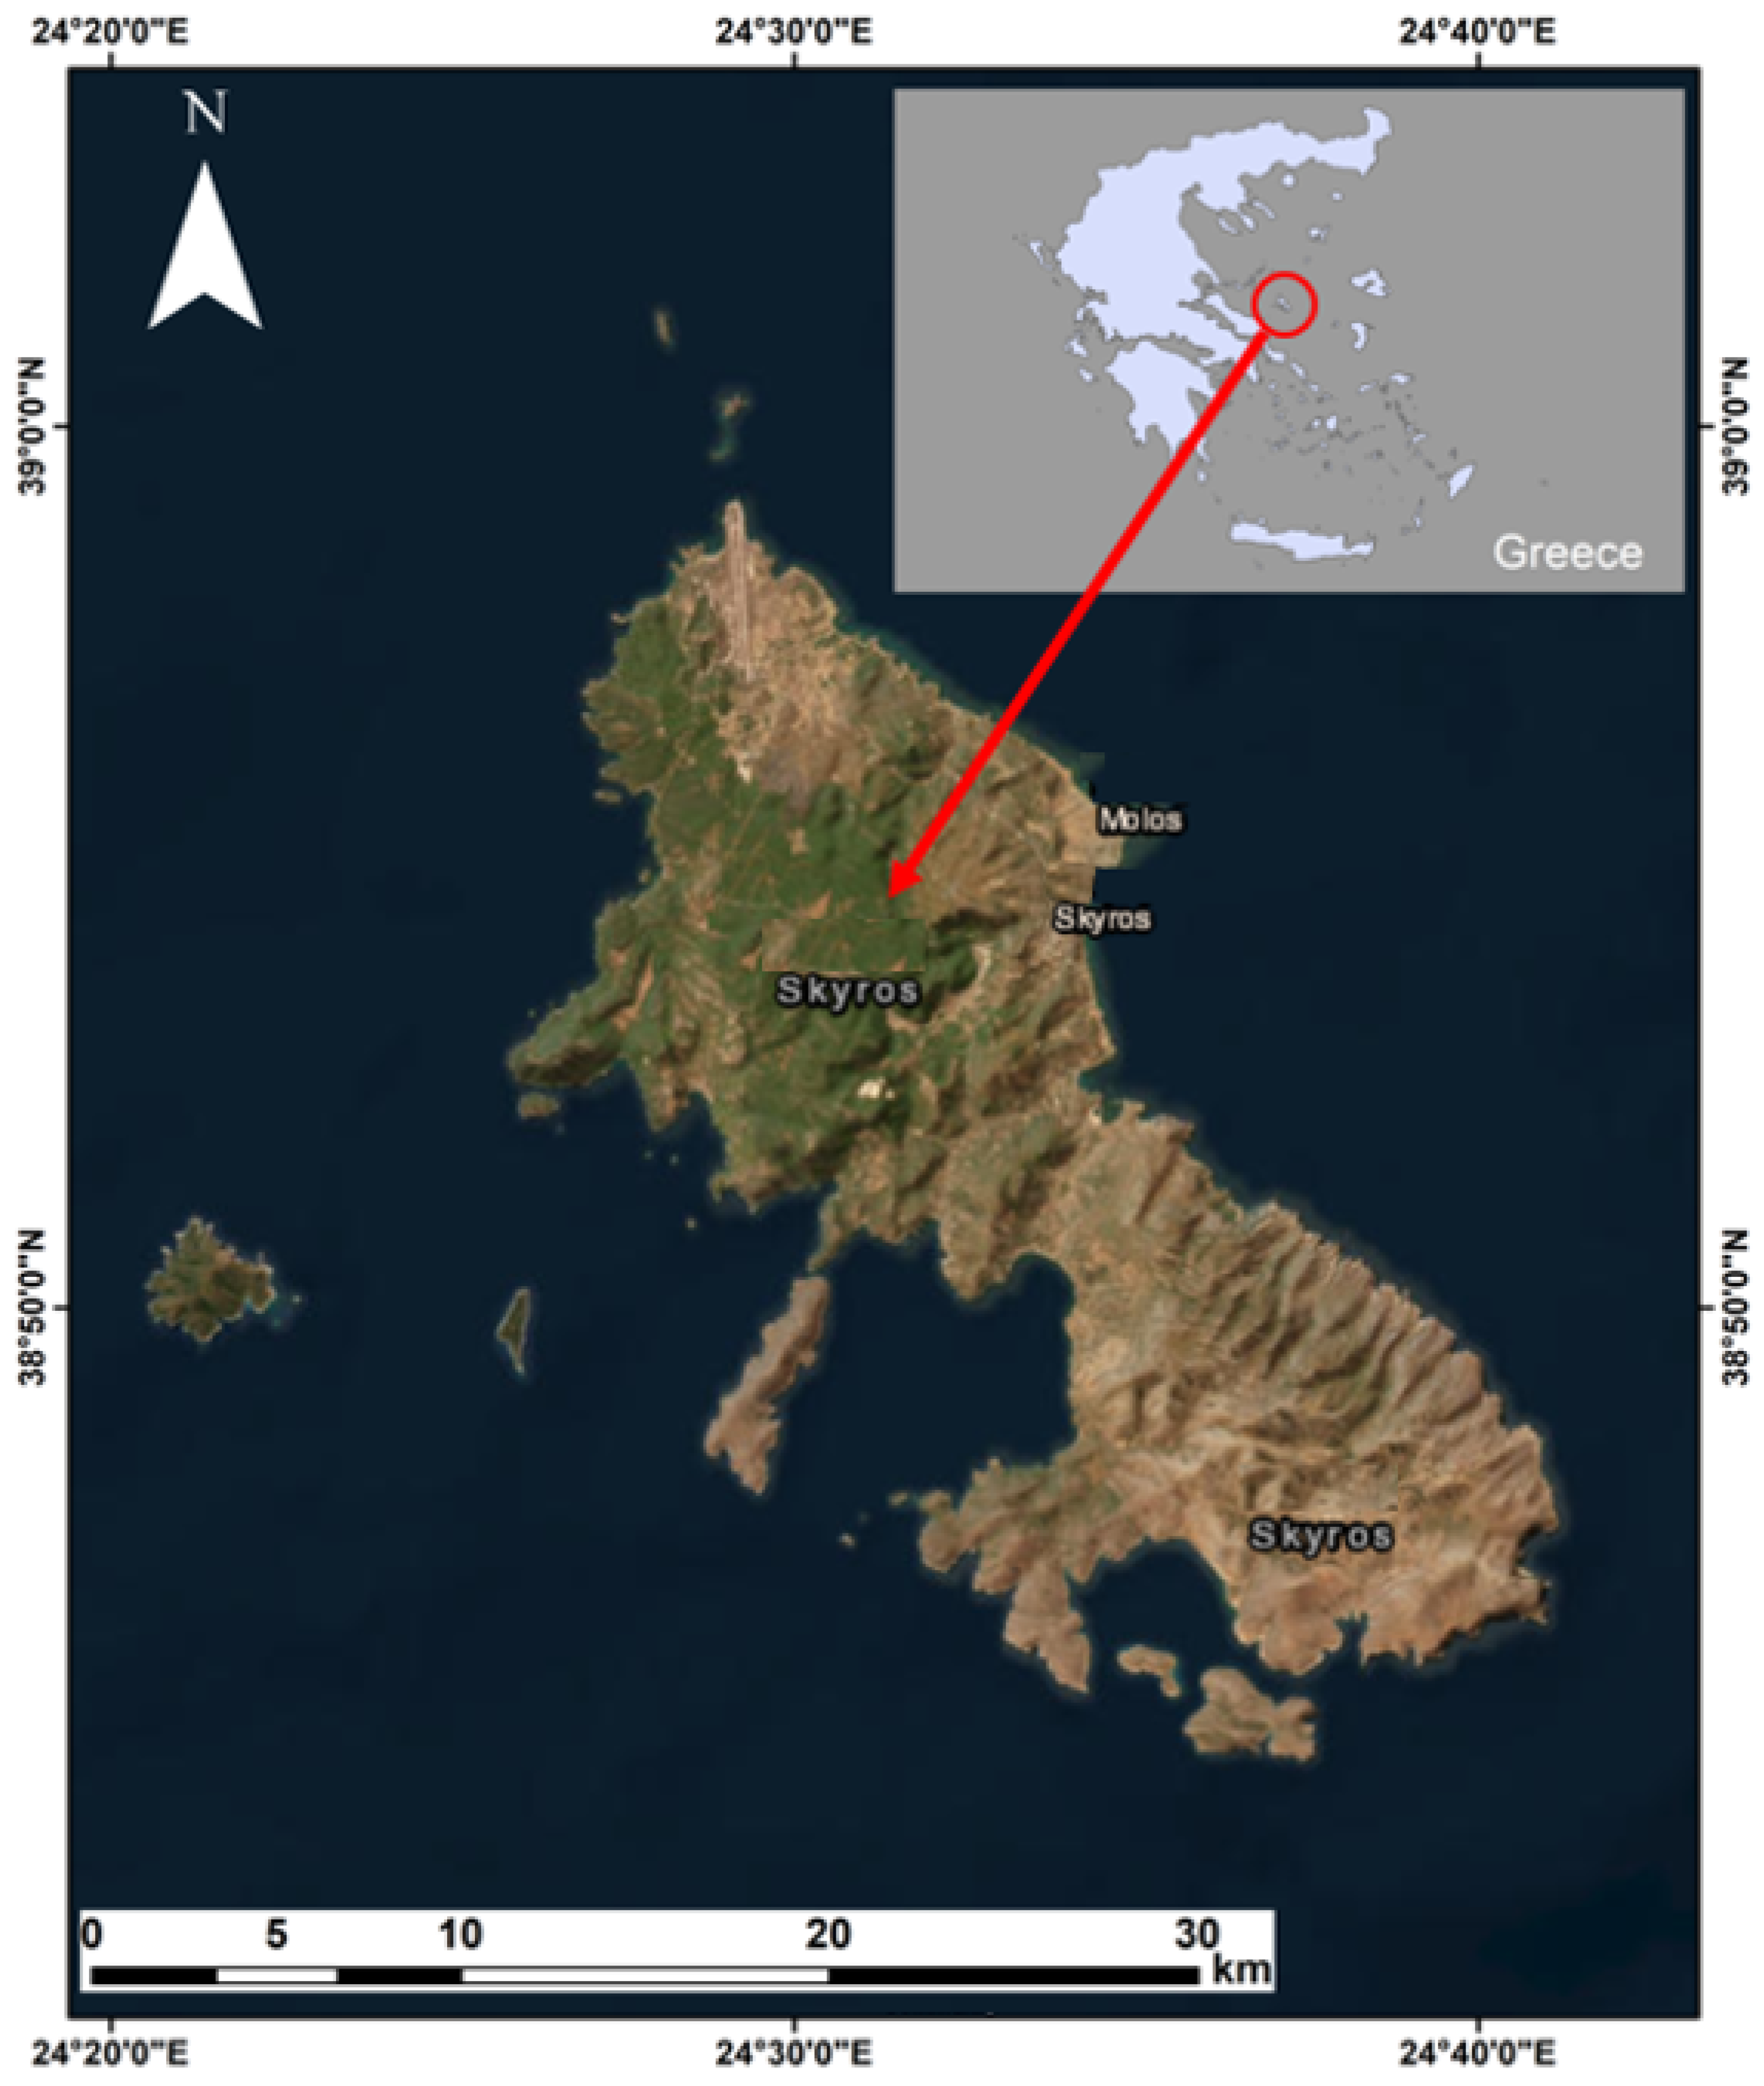
2.1. Study Area
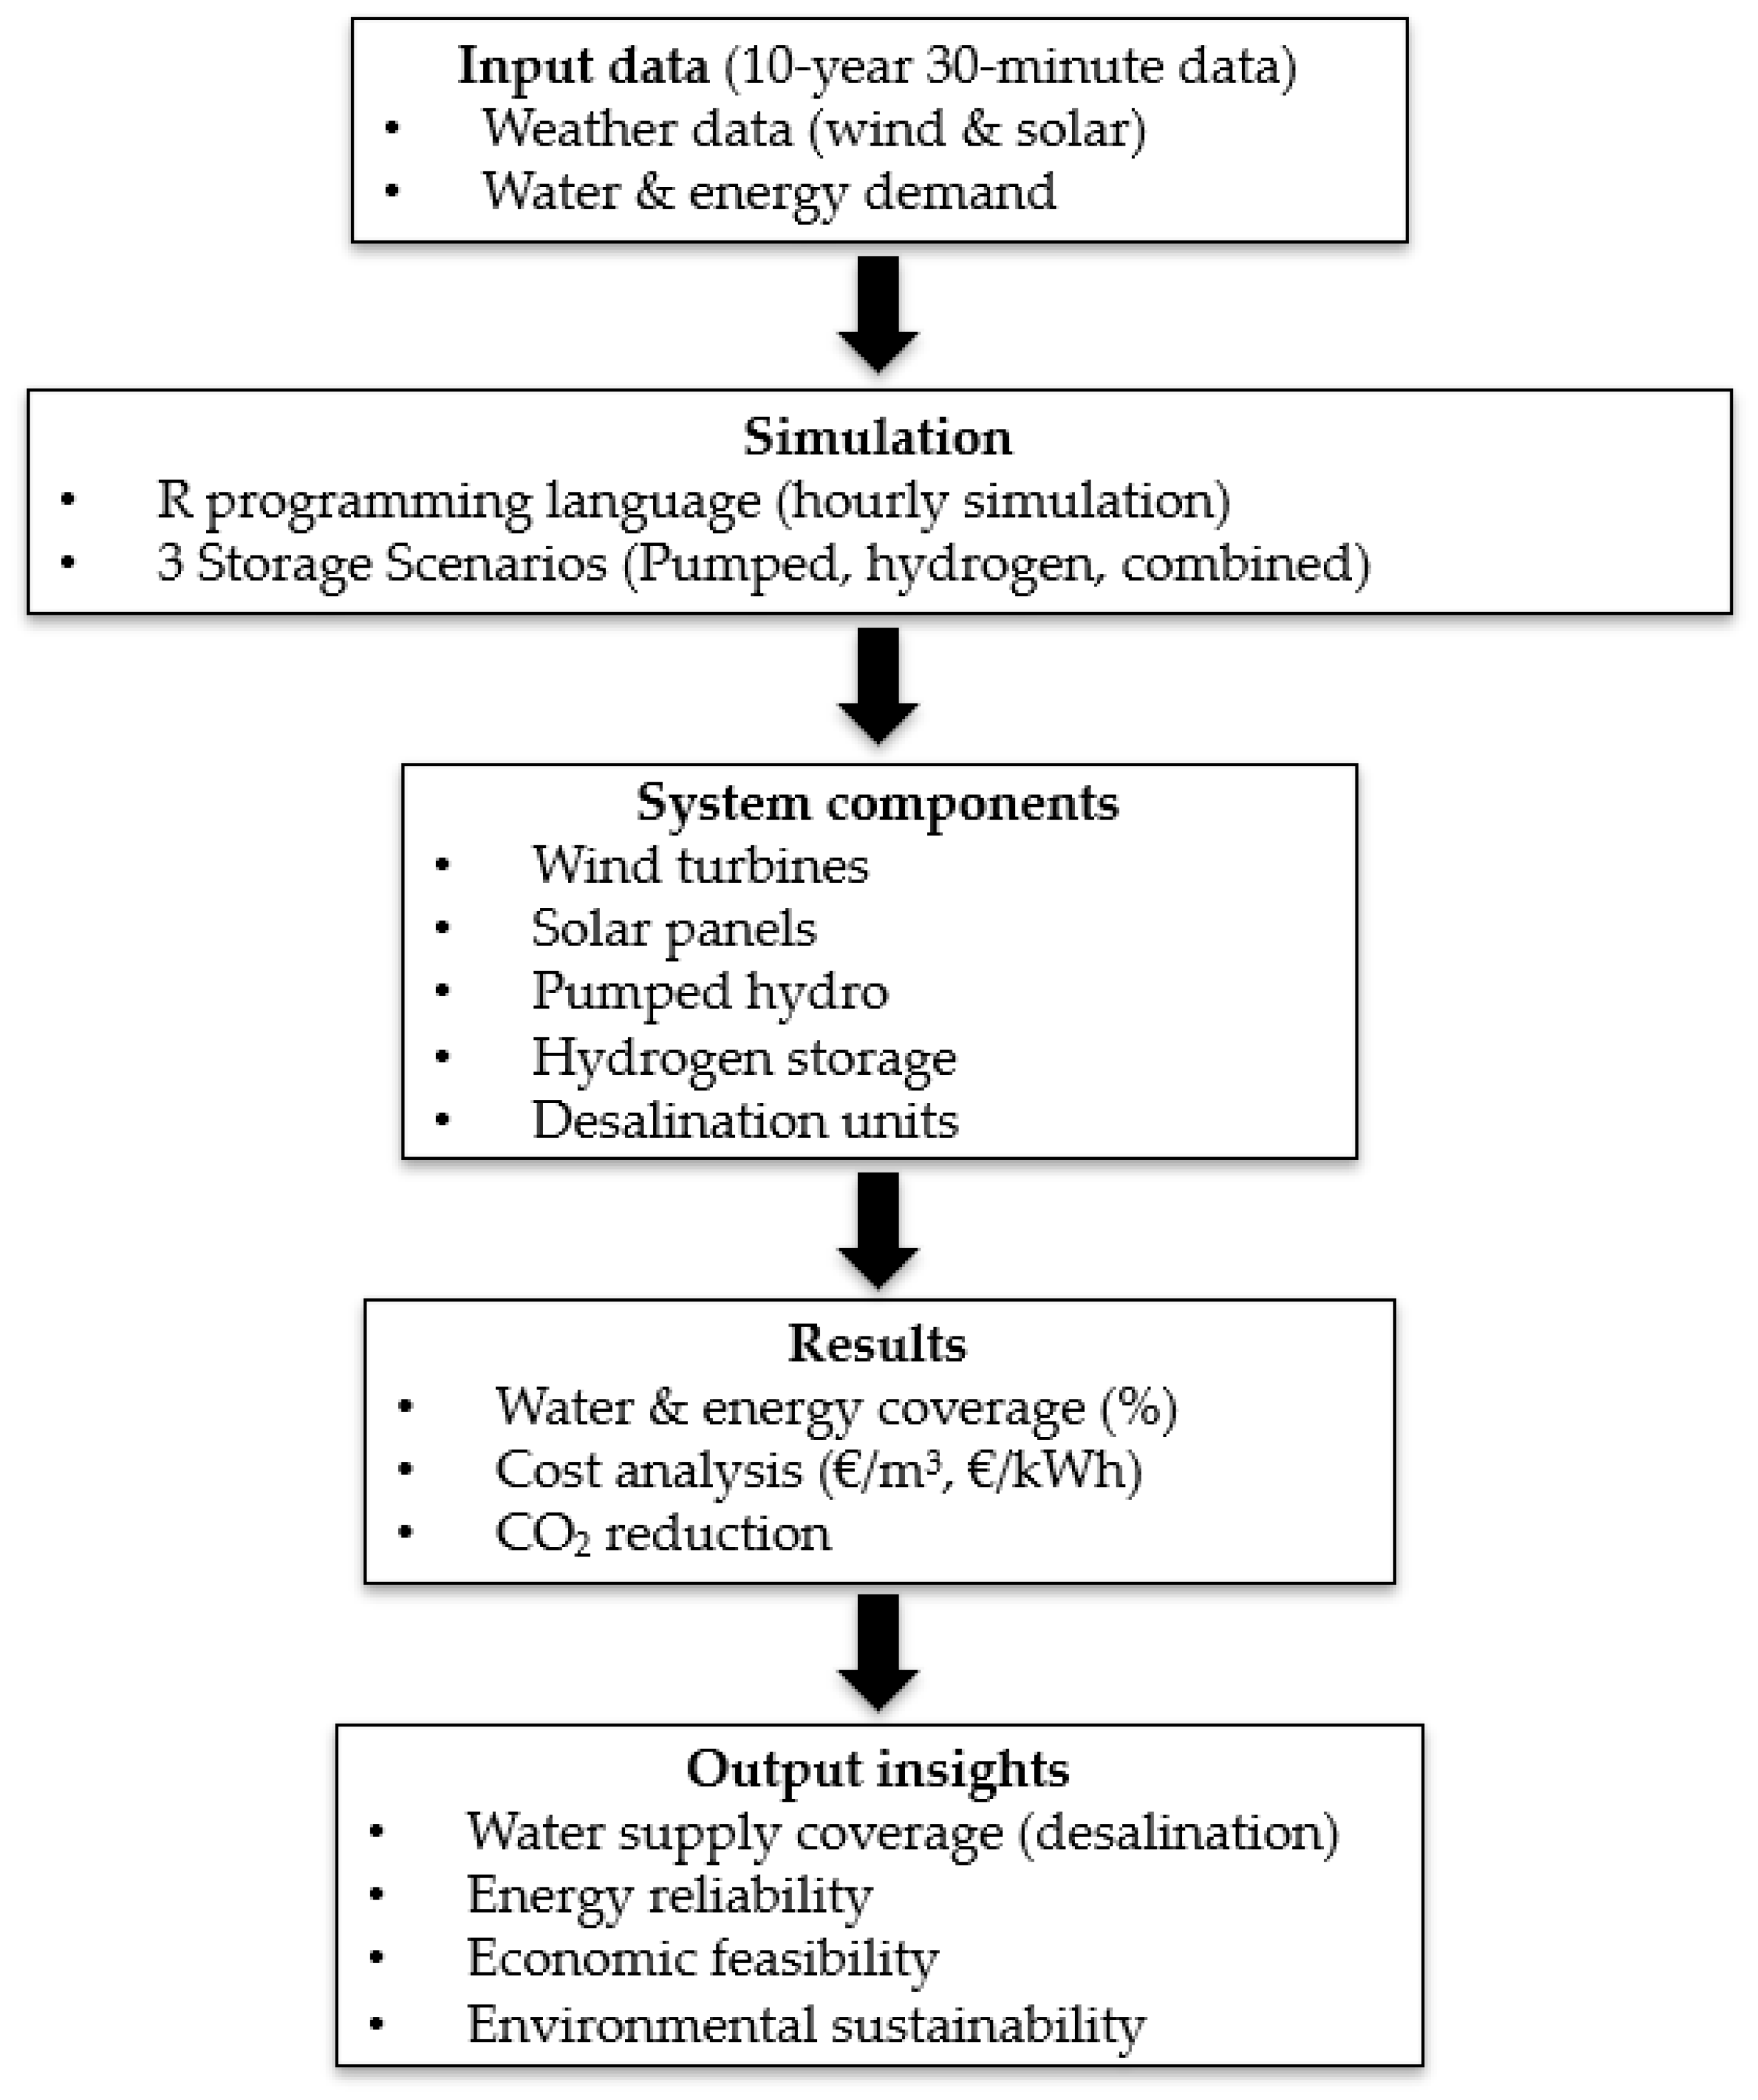
2.2. Methods
3. Results
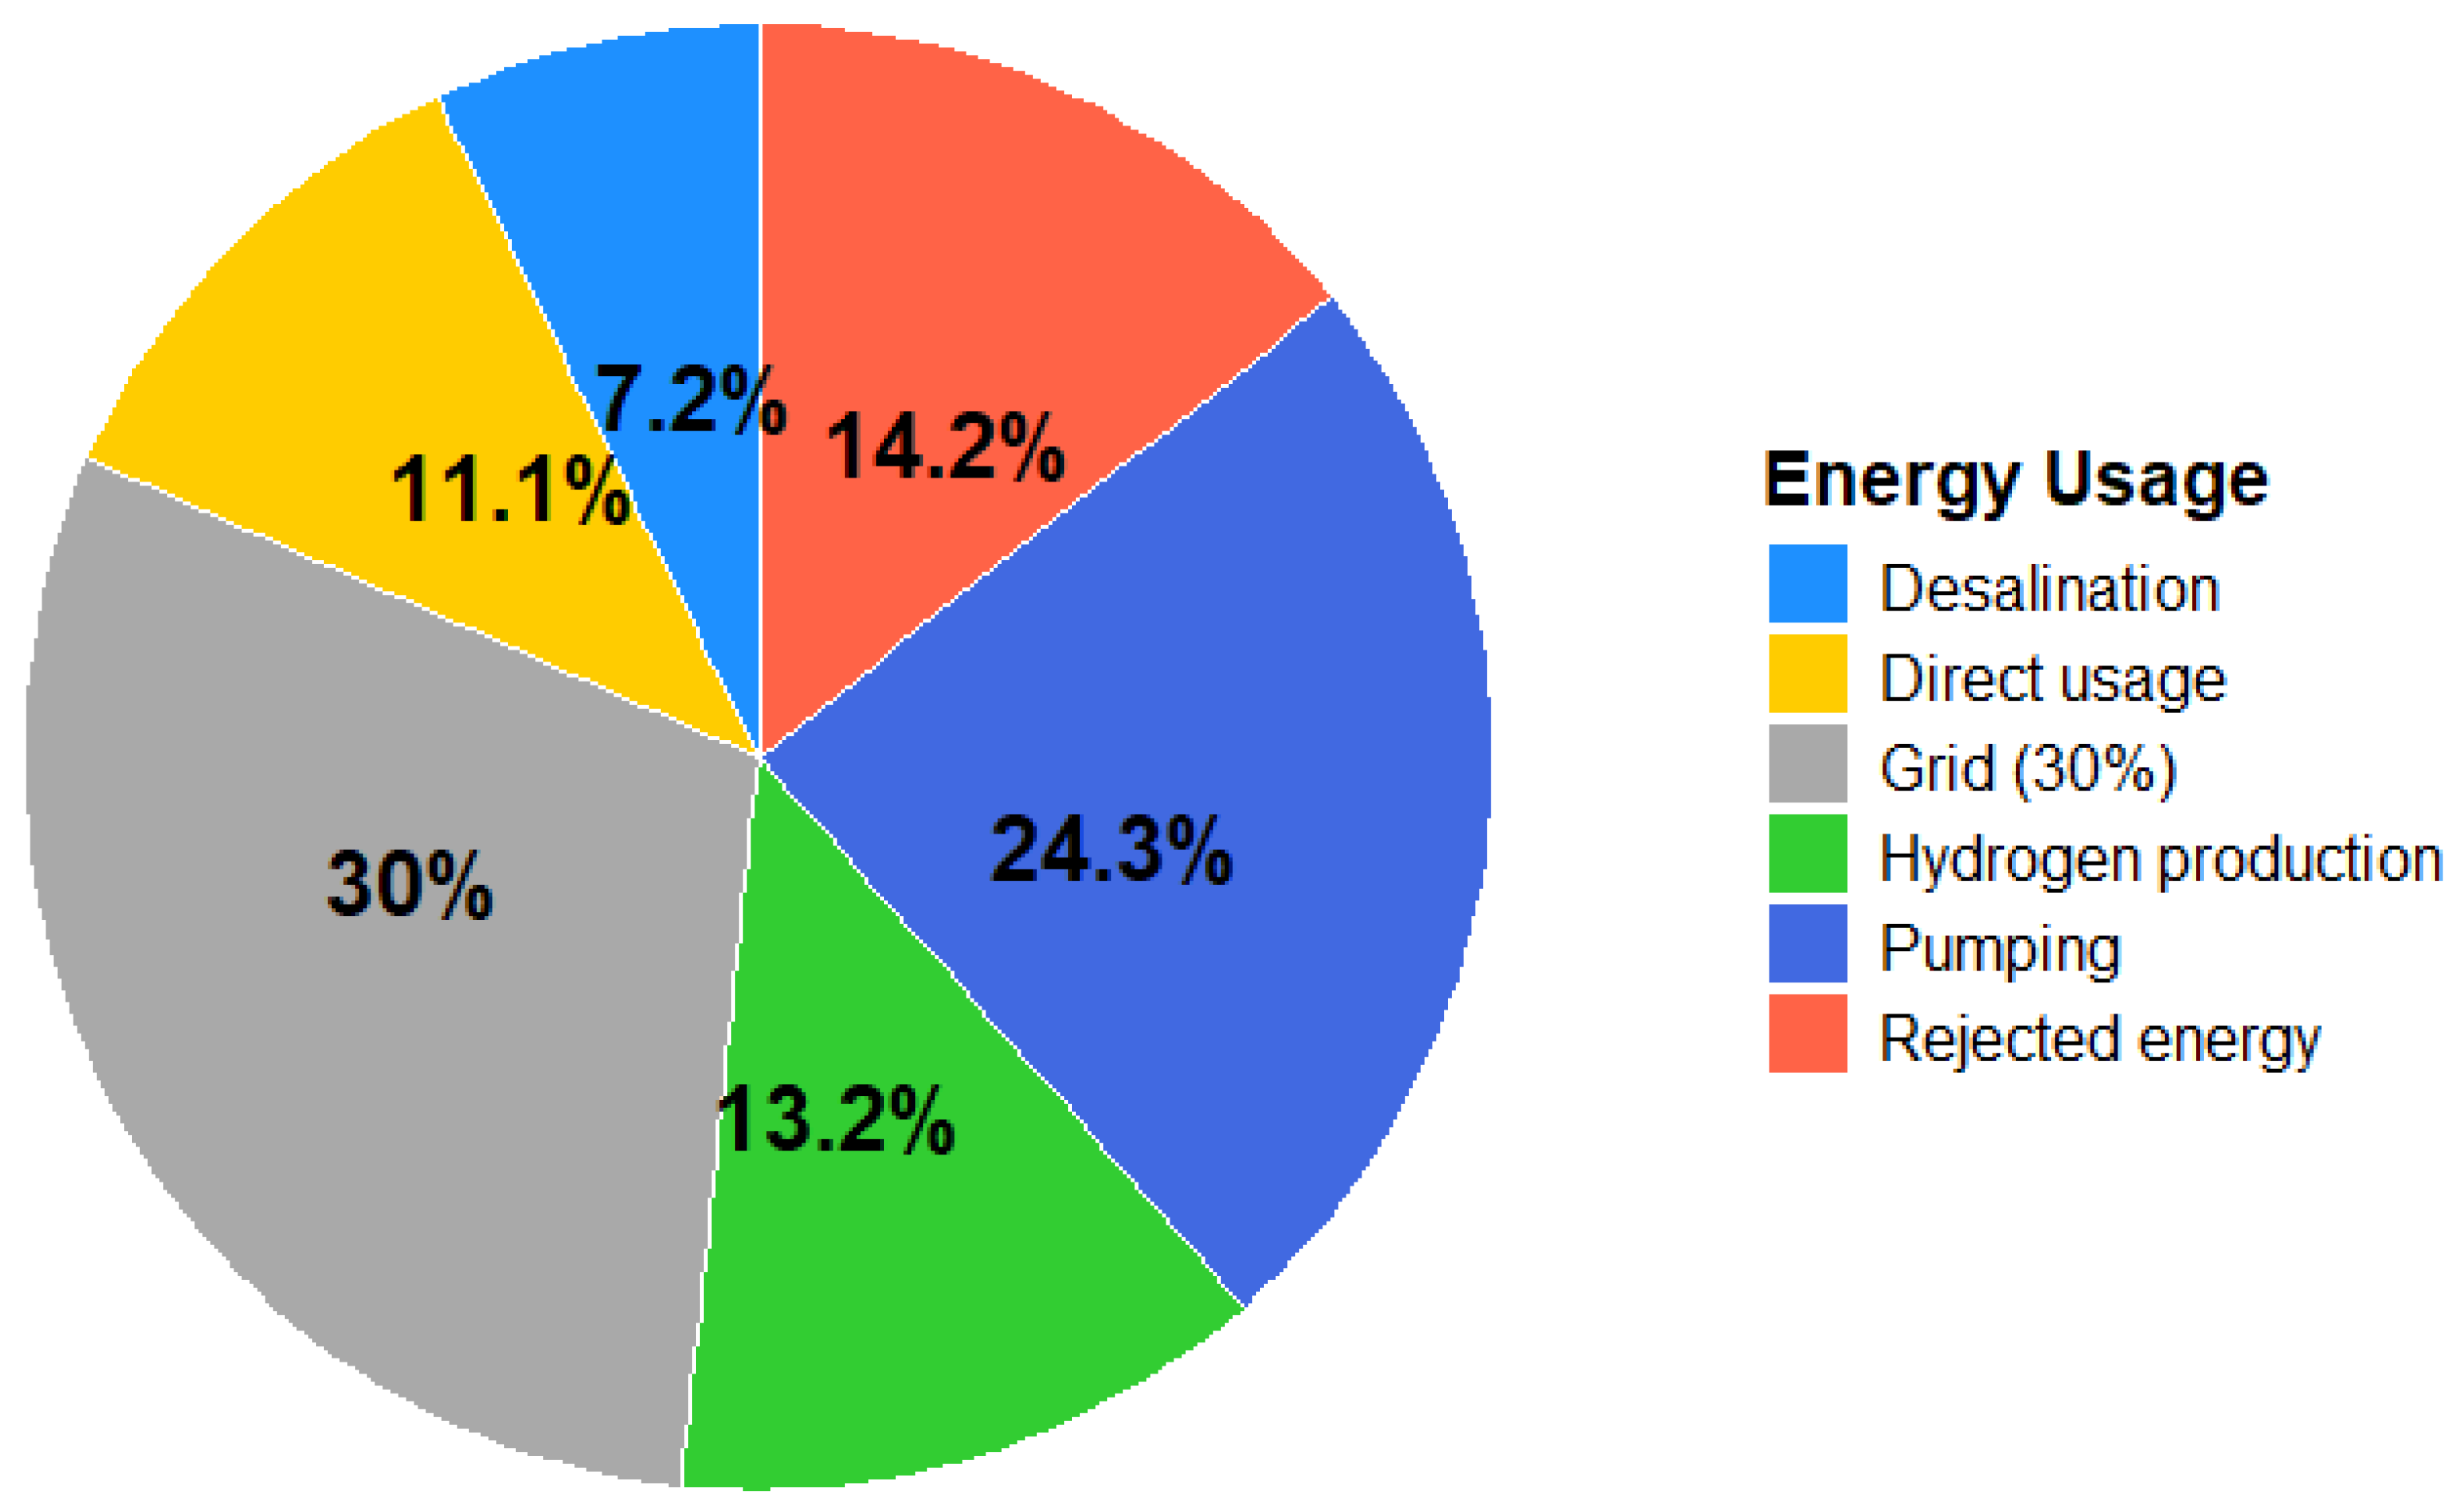
3.1. Scenario Analysis
3.2. Cost and CO2 Analysis
4. Discussion
5. Conclusions
Author Contributions
Funding
Data Availability Statement
Conflicts of Interest
Abbreviations
| CAPEX | Capital expenditures |
| CO2-eq | Carbon dioxide equivalent |
| EU | European Union |
| GRG | Generalized Reduced Gradient |
| HRES | Hybrid Renewable Energy System |
| HY4RES | Hybrid model for Renewable Energy Systems |
| ISABO | Improved Subtraction-Average-Based Optimizer |
| LCOE | Levelized Cost of Energy |
| NPV | Net Present Value |
| NSGA-II | Non-dominated Sorting Genetic Algorithm |
| OPEX | Operational expenditures |
| PVGIS | Photovoltaic Geographical Information System |
| SDGs | Sustainable Development Goals |
| UN | United Nations |
| Symbols | |
| A | Total surface area of photovoltaic panel (m2) |
| i | Discount rate (%) |
| Eelect | Surplus electrical energy used for electrolysis (kWh) |
| Ehydro | Energy produced by hydro turbine (Wh) |
| Ein | Energy required to store energy (kWh) |
| Eout | Energy recovered during discharge (kWh) |
| Ereq | Energy required to produce 1 kg of hydrogen (kWh) |
| Esolar | Energy produced by solar panels (Wh) |
| Ewind | Energy produced by wind turbines (MWh) |
| g | Acceleration due to gravity (m/s2) |
| H | Head of water (m) |
| H2 | Mass of hydrogen produced (kg) |
| IRR | Internal Rate of Return (%) |
| K | Initial investment (EUR) |
| n | Lifespan of the project (years) |
| ne | Efficiency of storage system (%) |
| nh | Efficiency of hydro turbine (%) |
| N | Number of photovoltaic panels |
| nelect | Efficiency of the electrolysis process (%) |
| P | Performance ratio of solar panels (%) |
| SI | Solar Irradiance (W/m2) |
| Q | Flow rate of water (m3/s) |
| t | Discounting period (years) |
| T | Hours of direct sunlight per day (s) |
| ρ | Density of water (kg/m3) |
| η | Efficiency or Yield of the Solar Panel (%) |
| ws | Wind speed (m/s) |
References
- THE 17 GOALS|Sustainable Development. Available online: https://sdgs.un.org/goals (accessed on 1 November 2024).
- Bertsiou, M.M.; Baltas, E. Power to Hydrogen and Power to Water Using Wind Energy. Wind 2022, 2, 305–324. [Google Scholar] [CrossRef]
- Triantafyllou, P.; Koroneos, C.; Kondili, E.; Kollas, P.; Zafirakis, D.; Ktenidis, P.; Kaldellis, J.K. Optimum Green Energy Solution to Address the Remote Islands’ Water-Energy Nexus: The Case Study of Nisyros Island. Heliyon 2021, 7, e07838. [Google Scholar] [CrossRef] [PubMed]
- Zafeirakou, A.; Karavi, A.; Katsoulea, A.; Zorpas, A.; Papamichael, I. Water Resources Management in the Framework of the Circular Economy for Touristic Areas in the Mediterranean: Case Study of Sifnos Island in Greece. Euro-Mediterr. J. Environ. Integr. 2022, 7, 347–360. [Google Scholar] [CrossRef]
- Travaglini, R.; Superchi, F.; Bianchini, A. Design of a Reverse Osmosis Desalination Plant Powered by Renewables for a Small Mediterranean Island. J. Phys. Conf. Ser. 2024, 2893, 012028. [Google Scholar] [CrossRef]
- Atay, I.; Saladié, Ò. Water Scarcity and Climate Change in Mykonos (Greece): The Perceptions of the Hospitality Stakeholders. Tour. Hosp. 2022, 3, 765–787. [Google Scholar] [CrossRef]
- Abedi, M.; Tan, X.; Klausner, J.F.; Bénard, A. Solar Desalination Chimneys: Investigation on the Feasibility of Integrating Solar Chimneys with Humidification–Dehumidification Systems. Renew. Energy 2023, 202, 88–102. [Google Scholar] [CrossRef]
- Lagaros, C.; Papathanasiou, A.-F.; Baltas, E. Implementing a Hybrid Renewable Energy System to Meet Water and Energy Demand in Serifos Island. Eur. Water 2024, 87/88, 33–47. [Google Scholar]
- Żołądek, M.; Figaj, R.; Kafetzis, A.; Panopoulos, K. Energy-Economic Assessment of Self-Sufficient Microgrid Based on Wind Turbine, Photovoltaic Field, Wood Gasifier, Battery, and Hydrogen Energy Storage. Int. J. Hydrogen Energy 2024, 52, 728–744. [Google Scholar] [CrossRef]
- Yang, Y.; Wu, Z.; Yao, J.; Guo, T.; Yang, F.; Zhang, Z.; Ren, J.; Jiang, L.; Li, B. An Overview of Application-Oriented Multifunctional Large-Scale Stationary Battery and Hydrogen Hybrid Energy Storage System. Energy Rev. 2024, 3, 100068. [Google Scholar] [CrossRef]
- de Moura Altea, C.; Yanagihara, J.I. Energy, Exergy and Environmental Impacts Analyses of Pumped Hydro Storage (PHS) and Hydrogen (H2) Energy Storage Processes. J. Energy Storage 2024, 76, 109713. [Google Scholar] [CrossRef]
- Roy, D.; Bhowmik, M.; Roskilly, A.P. Technoeconomic, Environmental and Multi Criteria Decision Making Investigations for Optimisation of off-Grid Hybrid Renewable Energy System with Green Hydrogen Production. J. Clean. Prod. 2024, 443, 141033. [Google Scholar] [CrossRef]
- Wang, Y.; He, X.; Liu, Q.; Razmjooy, S. Economic and Technical Analysis of an HRES (Hybrid Renewable Energy System) Comprising Wind, PV, and Fuel Cells Using an Improved Subtraction-Average-Based Optimizer. Heliyon 2024, 10, e32712. [Google Scholar] [CrossRef] [PubMed]
- Papathanasiou, A.-F.; Bertsiou, M.M.; Baltas, E. Pumped-Storage Hydropower and Hydrogen Storage for Meeting Water and Energy Demand through a Hybrid Renewable Energy System. Euro-Mediterr. J. Environ. Integr. 2024, 9, 1471–1483. [Google Scholar] [CrossRef]
- Skroufouta, S.; Baltas, E. Investigation of Hybrid Renewable Energy System (HRES) for Covering Energy and Water Needs on the Island of Karpathos in Aegean Sea. Renew. Energy 2021, 173, 141–150. [Google Scholar] [CrossRef]
- Bertsiou, M.M.; Baltas, E. Management of Energy and Water Resources by Minimizing the Rejected Renewable Energy. Sustain. Energy Technol. Assess. 2022, 52, 102002. [Google Scholar] [CrossRef]
- Coelho, J.S.T.; van de Loo, M.; Díaz, J.A.R.; Coronado-Hernández, O.E.; Perez-Sanchez, M.; Ramos, H.M. Multi-Objective and Multi-Variable Optimization Models of Hybrid Renewable Energy Solutions for Water–Energy Nexus. Water 2024, 16, 2360. [Google Scholar] [CrossRef]
- Main Page ELSTAT—ELSTAT. Available online: https://www.statistics.gr/en/home/ (accessed on 10 April 2025).
- Tzanes, G.; Zafirakis, D.; Makropoulos, C.; Kaldellis, J.K.; Stamou, A.I. Energy Vulnerability and the Exercise of a Data-Driven Analysis Protocol: A Comparative Assessment on Power Generation Aspects for the Non-Interconnected Islands of Greece. Energy Policy 2023, 177, 113515. [Google Scholar] [CrossRef]
- Fernández-Gil, G.; Petrakopoulou, F. Sustainable Water Generation on a Mediterranean Island in Greece. Energies 2019, 12, 4247. [Google Scholar] [CrossRef]
- JRC. Photovoltaic Geographical Information System (PVGIS)—European Commission. Available online: https://re.jrc.ec.europa.eu/pvg_tools/en/ (accessed on 31 October 2024).
- ArcMap Resources for ArcGIS Desktop|Documentation, Tutorials & More. Available online: https://www.esri.com/en-us/arcgis/products/arcgis-desktop/resources (accessed on 1 November 2024).
- Kleanthis, N.; Stavrakas, V.; Ceglarz, A.; Süsser, D.; Schibline, A.; Lilliestam, J.; Flamos, A. Eliciting Knowledge from Stakeholders to Identify Critical Issues of the Transition to Climate Neutrality in Greece, the Nordic Region, and the European Union. Energy Res. Soc. Sci. 2022, 93, 102836. [Google Scholar] [CrossRef]
- Kaldellis, J.K.; Ktenidis, P. The Clean-Green Decarbonization of Remote Islands: The GReco-Islands Concept. Environ. Sci. Proc. 2023, 26, 208. [Google Scholar] [CrossRef]
- Bardis, G.; Feloni, E.; Baltas, E. Simulation and Evaluation of a Hybrid Renewable Energy System for Supplying a Desalination Unit on the Island of Lipsi, Greece. Adv. Sci. Eng. 2020, 12, 1–12. [Google Scholar] [CrossRef]
- Feria-Díaz, J.J.; Correa-Mahecha, F.; López-Méndez, M.C.; Rodríguez-Miranda, J.P.; Barrera-Rojas, J. Recent Desalination Technologies by Hybridization and Integration with Reverse Osmosis: A Review. Water 2021, 13, 1369. [Google Scholar] [CrossRef]
- Kyriakarakos, G.; Papadakis, G.; Karavitis, C.A. Renewable Energy Desalination for Island Communities: Status and Future Prospects in Greece. Sustainability 2022, 14, 8176. [Google Scholar] [CrossRef]
- Kim, S.; Jang, J.; Lim, J.; Lee, D.; Kim, J.; Kim, J. Design and Optimization of Hybrid Seawater Reverse Osmosis–Solar-Driven Desalination–Pressure Retarded Osmosis System for Energy Efficient Desalination Maximizing Economic Potential. Water Res. 2025, 274, 123066. [Google Scholar] [CrossRef]
- Velaoras, D.; Zervakis, V.; Theocharis, A. The Physical Characteristics and Dynamics of the Aegean Water Masses. In The Aegean Sea Environment; Anagnostou, C.L., Kostianoy, A.G., Mariolakos, I.D., Panayotidis, P., Soilemezidou, M., Tsaltas, G., Eds.; The Handbook of Environmental Chemistry; Springer International Publishing: Cham, Switzerland, 2021; Volume 127, pp. 231–259. ISBN 978-3-031-53796-7. [Google Scholar]
- Al-Addous, M.; Bdour, M.; Rabaiah, S.; Boubakri, A.; Schweimanns, N.; Barbana, N.; Wellmann, J. Innovations in Solar-Powered Desalination: A Comprehensive Review of Sustainable Solutions for Water Scarcity in the Middle East and North Africa (MENA) Region. Water 2024, 16, 1877. [Google Scholar] [CrossRef]
- Shalaby, S.M.; Sharshir, S.W.; Kabeel, A.E.; Kandeal, A.W.; Abosheiasha, H.F.; Abdelgaied, M.; Hamed, M.H.; Yang, N. Reverse Osmosis Desalination Systems Powered by Solar Energy: Preheating Techniques and Brine Disposal Challenges—A Detailed Review. Energy Convers. Manag. 2022, 251, 114971. [Google Scholar] [CrossRef]
- Rodrigues, L.M.D. A Techno-Economic Feasibility Analysis of a Hydrogen Power Plant in a Market Environment. Master’s Thesis, Universidade do Porto, Porto, Portugal, 2023. Available online: https://www.proquest.com/openview/f82e8aa82bff83b1b19d6eadc25ba050/1?cbl=2026366&diss=y&pq-origsite=gscholar (accessed on 11 March 2025).
- ENERCON|Onshore Wind Turbines|Service for Your Wind Farm. Available online: https://www.enercon.de/en (accessed on 11 March 2025).
- Bathre, M.; Das, P.K. Water Supply Monitoring System with Self-Powered LoRa Based Wireless Sensor System Powered by Solar and Hydroelectric Energy Harvester. Comput. Stand. Interfaces 2022, 82, 103630. [Google Scholar] [CrossRef]
- Kourtis, I.M.; Kotsifakis, K.G.; Feloni, E.G.; Baltas, E.A. Sustainable Water Resources Management in Small Greek Islands under Changing Climate. Water 2019, 11, 1694. [Google Scholar] [CrossRef]
- Simão, M.; Ramos, H.M. Hybrid Pumped Hydro Storage Energy Solutions towards Wind and PV Integration: Improvement on Flexibility, Reliability and Energy Costs. Water 2020, 12, 2457. [Google Scholar] [CrossRef]
- Herdem, M.S.; Mazzeo, D.; Matera, N.; Baglivo, C.; Khan, N.; Afnan; Congedo, P.M.; De Giorgi, M.G. A Brief Overview of Solar and Wind-Based Green Hydrogen Production Systems: Trends and Standardization. Int. J. Hydrogen Energy 2024, 51, 340–353. [Google Scholar] [CrossRef]
- Wang, Z.; Wang, X.; Chen, Z.; Liao, Z.; Xu, C.; Du, X. Energy and Exergy Analysis of a Proton Exchange Membrane Water Electrolysis System without Additional Internal Cooling. Renew. Energy 2021, 180, 1333–1343. [Google Scholar] [CrossRef]
- Tashie-Lewis, B.C.; Nnabuife, S.G. Hydrogen Production, Distribution, Storage and Power Conversion in a Hydrogen Economy—A Technology Review. Chem. Eng. J. Adv. 2021, 8, 100172. [Google Scholar] [CrossRef]
- Shi, X.; Liao, X.; Li, Y. Quantification of Fresh Water Consumption and Scarcity Footprints of Hydrogen from Water Electrolysis: A Methodology Framework. Renew. Energy 2020, 154, 786–796. [Google Scholar] [CrossRef]
- Abdelmagid, T.I.M.; Siddig, M.H. Wind-Driven Pumped Storage System Design. Wind. Eng. 2025. [Google Scholar] [CrossRef]
- Mimikou, M.A.; Baltas, E.A. Assessment of Climate Change Impacts in Greece: A General Overview. Am. J. Clim. Change 2013, 2, 46–56. [Google Scholar] [CrossRef]
- Adefarati, T.; Bansal, R.C.; Shongwe, T.; Naidoo, R.; Bettayeb, M.; Onaolapo, A.K. Optimal Energy Management, Technical, Economic, Social, Political and Environmental Benefit Analysis of a Grid-Connected PV/WT/FC Hybrid Energy System. Energy Convers. Manag. 2023, 292, 117390. [Google Scholar] [CrossRef]
- Uyan, E. Tecno-Econo-Enviro-Social Assessment of Clean Electrification for a Marine Equipment Manufacturing Plant in Türkiye through Hybrid Renewable Energy System with Demand Response. Energy 2024, 304, 132015. [Google Scholar] [CrossRef]
- Papathanasiou, A.-F.; Ntemiri, K.; Baltas, E. Sustainable Water Resources Management and Energy Production in Small Mediterranean Islands. Environ. Process. 2025, 12, 19. [Google Scholar] [CrossRef]
- Pérez Uc, D.A.; de León Aldaco, S.E.; Aguayo Alquicira, J. Trends in Hybrid Renewable Energy System (HRES) Applications: A Review. Energies 2024, 17, 2578. [Google Scholar] [CrossRef]
- Shalaby, M.S.; Abdallah, H.; Wilken, R.; Shaban, A.M.; Abbas, W.; Sołowski, G.; Sotnyk, I. Economic Assessment for TFC-RO Membranes Production for Water Desalination. Chem. Eng. Sci. 2024, 288, 119805. [Google Scholar] [CrossRef]
- Tang, H.; Wang, H.; Li, C. Time-Varying Cost Modeling and Maintenance Strategy Optimization of Plateau Wind Turbines Considering Degradation States. Appl. Energy 2025, 377, 124464. [Google Scholar] [CrossRef]


| Subsystem | Parameter | Scenario 1 | Scenario 2 | Scenario 3 |
|---|---|---|---|---|
| Wind turbines | Total power | 9.4 MW | 9.4 MW | 9.4 MW |
| Number of units | 4 | 4 | 4 | |
| Solar panels | Total power | 0.25 MW | 0.25 MW | 0.25 MW |
| Number of units | 500 | 500 | 500 | |
| Desalination | Annual water production | 504,260 m3 | 504,260 m3 | 504,260 m3 |
| Energy consumption | 3.0 kWh/m3 | 3.0 kWh/m3 | 3.0 kWh/m3 | |
| Tank capacity | 50,000 m3 | 50,000 m3 | 50,000 m3 | |
| Pumped hydro storage | Reservoir capacity | 200,000 m3 | 200,000 m3 | |
| Height difference (head) | 300 m | 300 m | ||
| Hydrogen system | Tank capacity | 3000 kg | 3000 kg | |
| Energy consumption | 45 kWh/kg | 45 kWh/kg |
| Scenario 1 (EUR) | Scenario 2 (EUR) | Scenario 3 (EUR) | |
|---|---|---|---|
| Wind turbines | 10,000,000 | 10,000,000 | 10,000,000 |
| Solar panels | 800,000 | 800,000 | 800,000 |
| Desalination | 1,500,000 | 1,500,000 | 1,500,000 |
| Pumped storage | 3,000,000 | 3,000,000 | - |
| Hydrogen system | 1,500,000 | - | 1,500,000 |
| Total | 16,800,000 | 15,300,000 | 13,800,000 |
| Scenario 1 (EUR) | Scenario 2 (EUR) | Scenario 3 (EUR) | |
|---|---|---|---|
| Personnel | 200,000 | 150,000 | 150,000 |
| Wind turbines | 100,000 | 100,000 | 100,000 |
| Solar panels | 30,000 | 30,000 | 30,000 |
| Desalination | 150,000 | 150,000 | 150,000 |
| Pumped storage | 100,000 | 100,000 | - |
| Hydrogen system | 200,000 | - | 200,000 |
| Total | 780,000 | 530,000 | 630,000 |
Disclaimer/Publisher’s Note: The statements, opinions and data contained in all publications are solely those of the individual author(s) and contributor(s) and not of MDPI and/or the editor(s). MDPI and/or the editor(s) disclaim responsibility for any injury to people or property resulting from any ideas, methods, instructions or products referred to in the content. |
© 2025 by the authors. Licensee MDPI, Basel, Switzerland. This article is an open access article distributed under the terms and conditions of the Creative Commons Attribution (CC BY) license (https://creativecommons.org/licenses/by/4.0/).
Share and Cite
Papathanasiou, A.-F.; Baltas, E. Achieving Water and Energy Independence, Economic Sustainability, and CO2 Reduction Through Hybrid Renewable Systems: A Case Study of Skyros Island. Water 2025, 17, 1267. https://doi.org/10.3390/w17091267
Papathanasiou A-F, Baltas E. Achieving Water and Energy Independence, Economic Sustainability, and CO2 Reduction Through Hybrid Renewable Systems: A Case Study of Skyros Island. Water. 2025; 17(9):1267. https://doi.org/10.3390/w17091267
Chicago/Turabian StylePapathanasiou, Athanasios-Foivos, and Evangelos Baltas. 2025. "Achieving Water and Energy Independence, Economic Sustainability, and CO2 Reduction Through Hybrid Renewable Systems: A Case Study of Skyros Island" Water 17, no. 9: 1267. https://doi.org/10.3390/w17091267
APA StylePapathanasiou, A.-F., & Baltas, E. (2025). Achieving Water and Energy Independence, Economic Sustainability, and CO2 Reduction Through Hybrid Renewable Systems: A Case Study of Skyros Island. Water, 17(9), 1267. https://doi.org/10.3390/w17091267