Abstract
Increasing environmental variability and operational complexity in reservoir systems necessitate advanced optimization frameworks for flood control. This study proposes the ε-constrained Improved Zebra Optimization Algorithm (ε-IZOA), a novel metaheuristic algorithm integrating an enhanced Zebra Optimization Algorithm (ZOA) with adaptive ε-constraint handling, to address multi-reservoir flood control optimization. Three strategic modifications advance the standard ZOA: (1) Bernoulli chaotic mapping for diversified population initialization; (2) adaptive weight balancing for exploration-exploitation trade-off mitigation; and (3) golden sinusoidal vectorization for global search refinement, collectively forming the Improved ZOA (IZOA). The ε-IZOA synergizes IZOA with ε-dominance criteria to dynamically resolve constrained optimization conflicts. Applied to the Yellow River Basin’s five-reservoir cascade, ε-IZOA achieves a 52.97% peak shaving rate at Huayuankou Station, reducing the maximum discharge to 18,745.02 m3/s—a performance surpassing benchmark methods. The algorithm’s success stems from its bio-inspired hybrid architecture, which embeds swarm intelligence principles into nonlinear constraint management. This work establishes ε-IZOA as a computationally robust tool for large-scale reservoir optimization, with implications for mitigating flood risks in climate-sensitive basins. Future research should prioritize its integration with real-time hydrological forecasting systems.
1. Introduction
Optimal reservoir flood control scheduling serves as a critical non-structural flood mitigation strategy, enhancing the operational capacity of reservoir systems through peak flow regulation, floodwater conservation, and disaster risk reduction [1]. In practical applications, an optimal operation model is typically formulated and subsequently solved using specific optimization algorithms. Currently, commonly employed optimization algorithms can be categorized into mathematical programming methods and modern intelligent algorithms. In the field of reservoir operation, the primary mathematical programming methods applied include: linear programming (LP) [2,3], nonlinear programming (NLP) [4], and dynamic programming (DP) [5]. Since the 1960s, linear programming (LP) has been increasingly applied in reservoir operation. For instance, Lee et al. [6] introduced an LP-oriented optimization system for water allocation, which accounts for the storage heterogeneity of upstream reservoirs by integrating their capacity efficiency indices. This system enabled the dynamic management of water release to meet downstream needs. Dolter et al. [7] developed a linear programming (LP)-based capacity expansion and operational scheduling model, which was implemented in a practical study of an ongoing Canadian hydropower initiative. The results demonstrated the applicability of this methodology. However, LP possesses inherent limitations in that it is strictly confined to optimization problems with linear objective functions and constraints, rendering it ineffective for addressing nonlinear relationships in either objective formulation or constraint conditions. Therefore, prior to applying linear solution methods to optimization problems, the nonlinear components must undergo linearization processing or be subjected to reasonable approximation assumptions [8]. Ma et al. [9] addressed the optimal operation problem under multi-scenario inflow conditions by developing a Mixed-Integer Quadratically Constrained Programming (MIQCP)-based nonlinear programming approach. Given the inherent computational complexity and intensive resource requirements of nonlinear programming, hybrid algorithmic frameworks combining complementary methodologies are typically required to achieve viable solutions.
With the continuous advancement in scholarly research, modern intelligent algorithms have been extensively implemented in reservoir operation. Representative methodologies include Particle Swarm Optimization (PSO) [10], Genetic Algorithms (GA) [11], and Ant Colony Optimization (ACO) [12], among others, which have undergone significant developmental progress in this domain. Liu et al. [13] introduced an Integrated Multi-strategy Particle Swarm Optimization (IMPSO) algorithm to tackle the challenges of optimal operation in long-term power generation scheduling for cascade reservoir systems. Zhao et al. [14] proposed an optimization technique for units that utilizes a genetic algorithm for commitment and flow distribution. This approach improves operational efficiency by strategically allocating discharge and minimizing energy consumption, ultimately enhancing the overall effectiveness of pumping station operations. Wu et al. [15] addressed a combined approach utilizing Particle Swarm Optimization and Genetic Algorithms (PSO-GA) that was proposed to achieve ecological flow guarantees and efficient water resource allocation. Concurrently, biologically inspired intelligent algorithms have emerged as significant methodological advancements in reservoir operation. Zhang et al. [16] introduced an enhanced version of the Black-Winged Differential-Variant Whale Optimization Algorithm (BDWOA). Testing indicated that BDWOA achieves optimal solutions in fewer iterations, effectively preventing the premature convergence issues commonly encountered in traditional algorithms. Wang et al. [17] proposed the multiple populations artificial bee colony algorithm (MMaOABC). In the DTLZ/MaF benchmark tests (with 3–15 objectives), MMaOABC outperformed seven state-of-the-art many-objective optimization algorithms (MaOEAs). While intelligent optimization algorithms have overcome the drawbacks of conventional methods in addressing the “curse of dimensionality” through enhanced computational efficiency, they remain constrained by challenges inherent to flood control operations in multi-reservoir systems. These algorithms continue to exhibit inherent limitations, including solution instability and susceptibility to local optima entrapment, particularly when handling highly constrained problems with multiple nonlinear restrictions [18,19]. This study introduces an improved adaptive ε-constraint methodology to tackle the complex multi-constraint challenges inherent in reservoir flood control optimization models, significantly enhancing computational efficiency and solution feasibility.
The Zebra Optimization Algorithm (ZOA), a heuristic optimization methodology inspired by zebra herd behavior in natural ecosystems, was initially developed by Trojovská et al. [20]. The Zebra Optimization Algorithm is inspired by the survival strategies demonstrated by wild zebras in their natural savannah habitat. Groups of zebras protect themselves from predators by arranging themselves densely and maintaining relative positions. This adjustment of relative positions not only contributes to the safety of the group as a whole, but also provides better foraging conditions for individuals. The basic principle of the zebra optimization algorithm is to transform the problem into an optimization objective function and search for the best solution by simulating the zebra’s behavior. Each generation of the algorithm generates a set of candidate solutions, which are called zebras. The zebras collaborate with each other by exchanging information to find better solutions. The algorithm updates the solutions based on the fitness assessment of each zebra and gradually converges to the best solution. The ZOA demonstrates notable advantages in computational optimization. Primarily, its self-adaptive mechanism enables the automatic adjustment of search strategies to address the intricacies and variety inherent in optimization challenges. Secondly, the algorithm demonstrates superior global search capability, effectively navigating high-dimensional solution spaces to identify near-optimal solutions. Furthermore, the ZOA maintains robust convergence properties and operational stability across diverse problem domains and operational conditions. Nevertheless, the ZOA presents certain implementation challenges and inherent limitations. Specifically, the algorithm’s performance sensitivity to parameter calibration requires meticulous tuning, where problem-specific parameter configurations necessitate extensive empirical validation through iterative experimentation. More critically, dimensional scalability limitations emerge when addressing high-dimensional problems, as the exponential growth in computational complexity with increasing search space dimensionality significantly impacts algorithmic efficiency. Consequently, this study proposes an enhanced zebra optimization algorithm, designated as the adaptive ε-IZOA, which demonstrates superior performance in solving high-dimensional constrained optimization problems through its innovative dynamic constraint-handling mechanism. The ε-constrained Improved Zebra Optimization Algorithm (ε-IZOA), ε-constrained Zebra Optimization Algorithm (ε-ZOA), ε-Particle Swarm Optimization (ε-PSO), ε-Differential Evolution Algorithm (DE), and ε-Whale Optimization Algorithm (WOA) are applied to the Xiaolangdi Reservoir, the Sanmenxia Reservoir, the Luhun Reservoir, the Guxian Reservoir, and the Hekoucun Reservoir in the Yellow River Basin, respectively, for comparison. The benchmarking experiments demonstrate that the ε-IZOA algorithm achieves marked superiority in computational efficiency over four comparative methods, which constitutes an effective computational framework for the optimal scheduling of flood mitigation measures in reservoir cluster systems.
2. Optimization Scheduling Model for Flood Control in Multiple Reservoirs
2.1. Objective Function
The flood control mandate of reservoir systems is primarily oriented towards mitigating flood disasters in downstream, flood-prone areas while ensuring the structural integrity of hydraulic structures, thereby maximizing social benefits through coordinated operations [21]. Currently, the three most widely used objective function criteria in reservoir scheduling are the maximum peak shaving criterion, the shortest flood duration criterion, and the minimum flood damage loss or minimum flood control cost criterion. This article selects the maximum peak shaving criterion as the objective function. The maximum peak shaving criterion aims to minimize the maximum flow at the downstream flood control section while controlling the highest water level of the reservoir, thereby reducing the peak flow at the downstream section to the greatest extent possible [22]. Based on the principle of achieving the highest degree of peak shaving at the control point, the following objective function is constructed:
where: is the outflow process from the reservoir evolving to the flow process at the downstream control section.
2.2. Constraint Formulation
- (1)
- Water balance constraints
- (2)
- Maximum safe river discharge constraints
- (3)
- Gate downflow constraints
- (4)
- Starting water level
- (5)
- End-of-period water level constraints
- (6)
- Water level constraints
- (7)
- Non-negativity constraints: the aforementioned variables are constrained to take on non-negative values.
3. Improving the Zebra Algorithm
3.1. Zebra Optimisation Algorithm
The Zebra Optimization Algorithm (ZOA) is developed by mathematically modeling two behavioral phases of zebras: foraging behavior and defensive behavior against predator attacks.
3.1.1. Stages of Foraging Behavior
Zebras primarily feed on grasses and sedges, employing a communal foraging strategy to locate and freely graze on the most nutritious forage. Within the social group, zebras tend to congregate closely while systematically exploring grazing areas. They avoid prolonged stays in specific zones, instead migrating to new pastures in search of fresh vegetation. This behavioral pattern inspires the first-phase position update mechanism in our population-based optimization algorithm. Each population member updates its position through zebra-inspired foraging simulation, governed by the following equation:
where: is the new position of the i-th zebra generated in the first stage; denotes the j-th dimension value; denotes the objective function value; denotes the j-th dimension of the pioneer horse; is a random number on the interval (0, 1); is a randomly chosen integer between 1 or 2.
3.1.2. Stages of the Predator’s Defense Strategy
A zebra’s defense strategy varies from predator to predator. When faced with a predator that is larger and stronger than it, the zebra employs distinct strategies for evasion and confrontation based on the size of the predator. Specifically, when confronted by a smaller assailant, the zebra opts for an offensive approach, whereas it adopts a defensive strategy in other scenarios. Consequently, in the subsequent phase, the two defensive strategies employed by the zebra in response to predatory threats are simulated to adjust the positions of the members of the ZOA population within the search space. The relevant mathematical formulations are presented as follows:
where: denotes the new position of the i-th zebra generated in the second stage; denotes the j-th dimension value; denotes the objective function value; t is the number of iterations; T is the maximum number of iterations; R is a constant of 0.01; Ps is the probability of choosing one of the two randomly generated strategies in the interval [0, 1]; is the j-th dimension value of the zebra under attack.
3.2. Improved Zebra Algorithm
3.2.1. Bernoulli Chaos Mapping Initialization Population
Chaotic variables are ergodic and regular, which enables the algorithm to have a faster convergence rate, so they are often applied to optimization problems. The most commonly used chaotic models are logistic mapping [23] and tent mapping [24], but both of them have a limited number of collapses in the iteration region and suffer from uneven initialization. It is known through the literature that Bernoulli mapping populationization distribution is more uniform compared to logistic mapping and tent mapping [25]. Consequently, this study aims to incorporate Bernoulli mapping during the initialization phase of the population. The mathematical representation of Bernoulli mapping can be articulated as follows:
where: k is the number of chaotic iterations, generally taken as 0.4; is denoted as the position of the i-th zebra in the j-th dimension; are denoted as the upper and lower limits of the search domain, respectively; is denoted as the chaotic value generated by Equation (12).
3.2.2. Adaptive Weighting Factor Strategy
The weight factor is a critical component of the optimization algorithm and serves as a significant parameter within the optimization objective function. An increase in inertia weights enhances the algorithm’s global search capability, thereby promoting greater population diversity and enabling exploration over a broader search space. Conversely, a reduction in inertia weights strengthens the algorithm’s local search capability, facilitating a more refined search in proximity to the optimal solution and expediting the convergence process [26]. In this paper, the strategy of adaptive weights is integrated into the zebra algorithm, and the adaptive inertia weight formula is as follows:
where: t denotes the current iteration number; tmax is the maximum number of iterations set for the population; wmax is the initial inertia weight, which takes the value of 0.92 in the text; wmin is the inertia weight at the maximum number of iterations for the zebra population, which takes the value of 0.4 in the text; and Pi,new is the new position of the zebra.
3.2.3. Fusion Gold Sine Strategy Update Location
The golden sine algorithm (GoldenSA) is a new meta-heuristic algorithm proposed by Tanyildizi et al. [27]. This algorithm constructs a mathematical model based on the periodic motion characteristics of the sine function on the unit circle and achieves dynamic scaling of the search space by integrating the golden ratio coefficient, effectively balancing global exploration and local exploitation during the iterative process. Its core advantages are mainly reflected in three aspects: first, the algorithm uses a golden ratio parameter to adaptively adjust the step size, significantly improving convergence efficiency; second, it only requires the setting of two basic parameters: population size and number of iterations, resulting in low operational complexity; finally, the algorithm architecture incorporates the computational characteristics of trigonometric functions, ensuring optimization accuracy while possessing strong resistance to noise interference. Compared to traditional optimization algorithms, GoldenSA demonstrates superior stability and engineering applicability when solving high-dimensional nonlinear problems [28,29]. In this paper, the golden sine algorithm is integrated into the zebra algorithm, and the formula for the zebra update position is obtained as:
where: denotes the j-th dimension value; is the position of the i-th zebra in the j-th dimension; t is the number of iterations; T is the maximum number of iterations; R is a constant of 0.01; r is a random number on the interval (0, 1); ub and lb are the upper and lower bounds of the search space, respectively; Ps is the probability of choosing one of the two randomly generated strategies in the interval [0, 1]; MOP is the mathematical optimizer probability, and is the tuning of the search procedure control parameters.
3.2.4. Adaptive ε-Constraint Method
In classical optimization theory, the penalty function method forces the exclusion of infeasible solutions from the search domain by converting constraint violations into penalty terms in the objective function. However, this rigid handling mechanism has dual limitations: first, the fixed setting of the penalty coefficient can easily lead the algorithm into local optimum traps, creating blind spots in the search around the feasible domain boundaries; second, in complex scenarios with multiple coupled constraints, a static penalty strategy can severely weaken the exploration capability of the solution space, resulting in the missed detection of feasible solutions. In response, an adaptive constraint handling mechanism achieves the intelligent evolution of constraint management strategies by constructing a dynamic feedback system—utilizing a population evolution state perception module to monitor the distribution of constraint conflict intensity in real-time, thereby driving the collaborative optimization of a nonlinear decay strategy for the penalty coefficient and an auxiliary constraint injection strategy. This dual adjustment mechanism not only balances global exploration and local exploitation intensity through time-varying penalty factors but also introduces feasibility rules guided by elite solutions in the later stages of iteration, effectively breaking through high-dimensional constraint barriers and significantly enhancing the convergence reliability and solution quality of the algorithm in high-dimensional non-convex constraint optimization problems. In this paper, the adaptive ε-constraint method of [30] is used to improve the following:
- (1)
- To address the problem of low population diversity, an improved individual comparison criterion is utilized to increase the diversity of the population so that a globally optimal solution is found in the entire search space, ensuring convergence. The criterion formula is as follows:
In this formulation: G(x) denotes the degree of constraint violation; f(x) corresponds to the value of function fitness, and Ps represents a random parameter within the bounds of 0.9 to 1.
- (2)
- Use the ε constraint method to deal with the constraints and adaptively adjust the level parameter ε according to the degree of superiority of the group constraint violation, making full use of the effective information of the better infeasible individuals, and effectively improving the efficiency of the search for the feasible domain [31]. ε is formulated as follows:
3.3. Steps of the ε-IZOA Algorithm
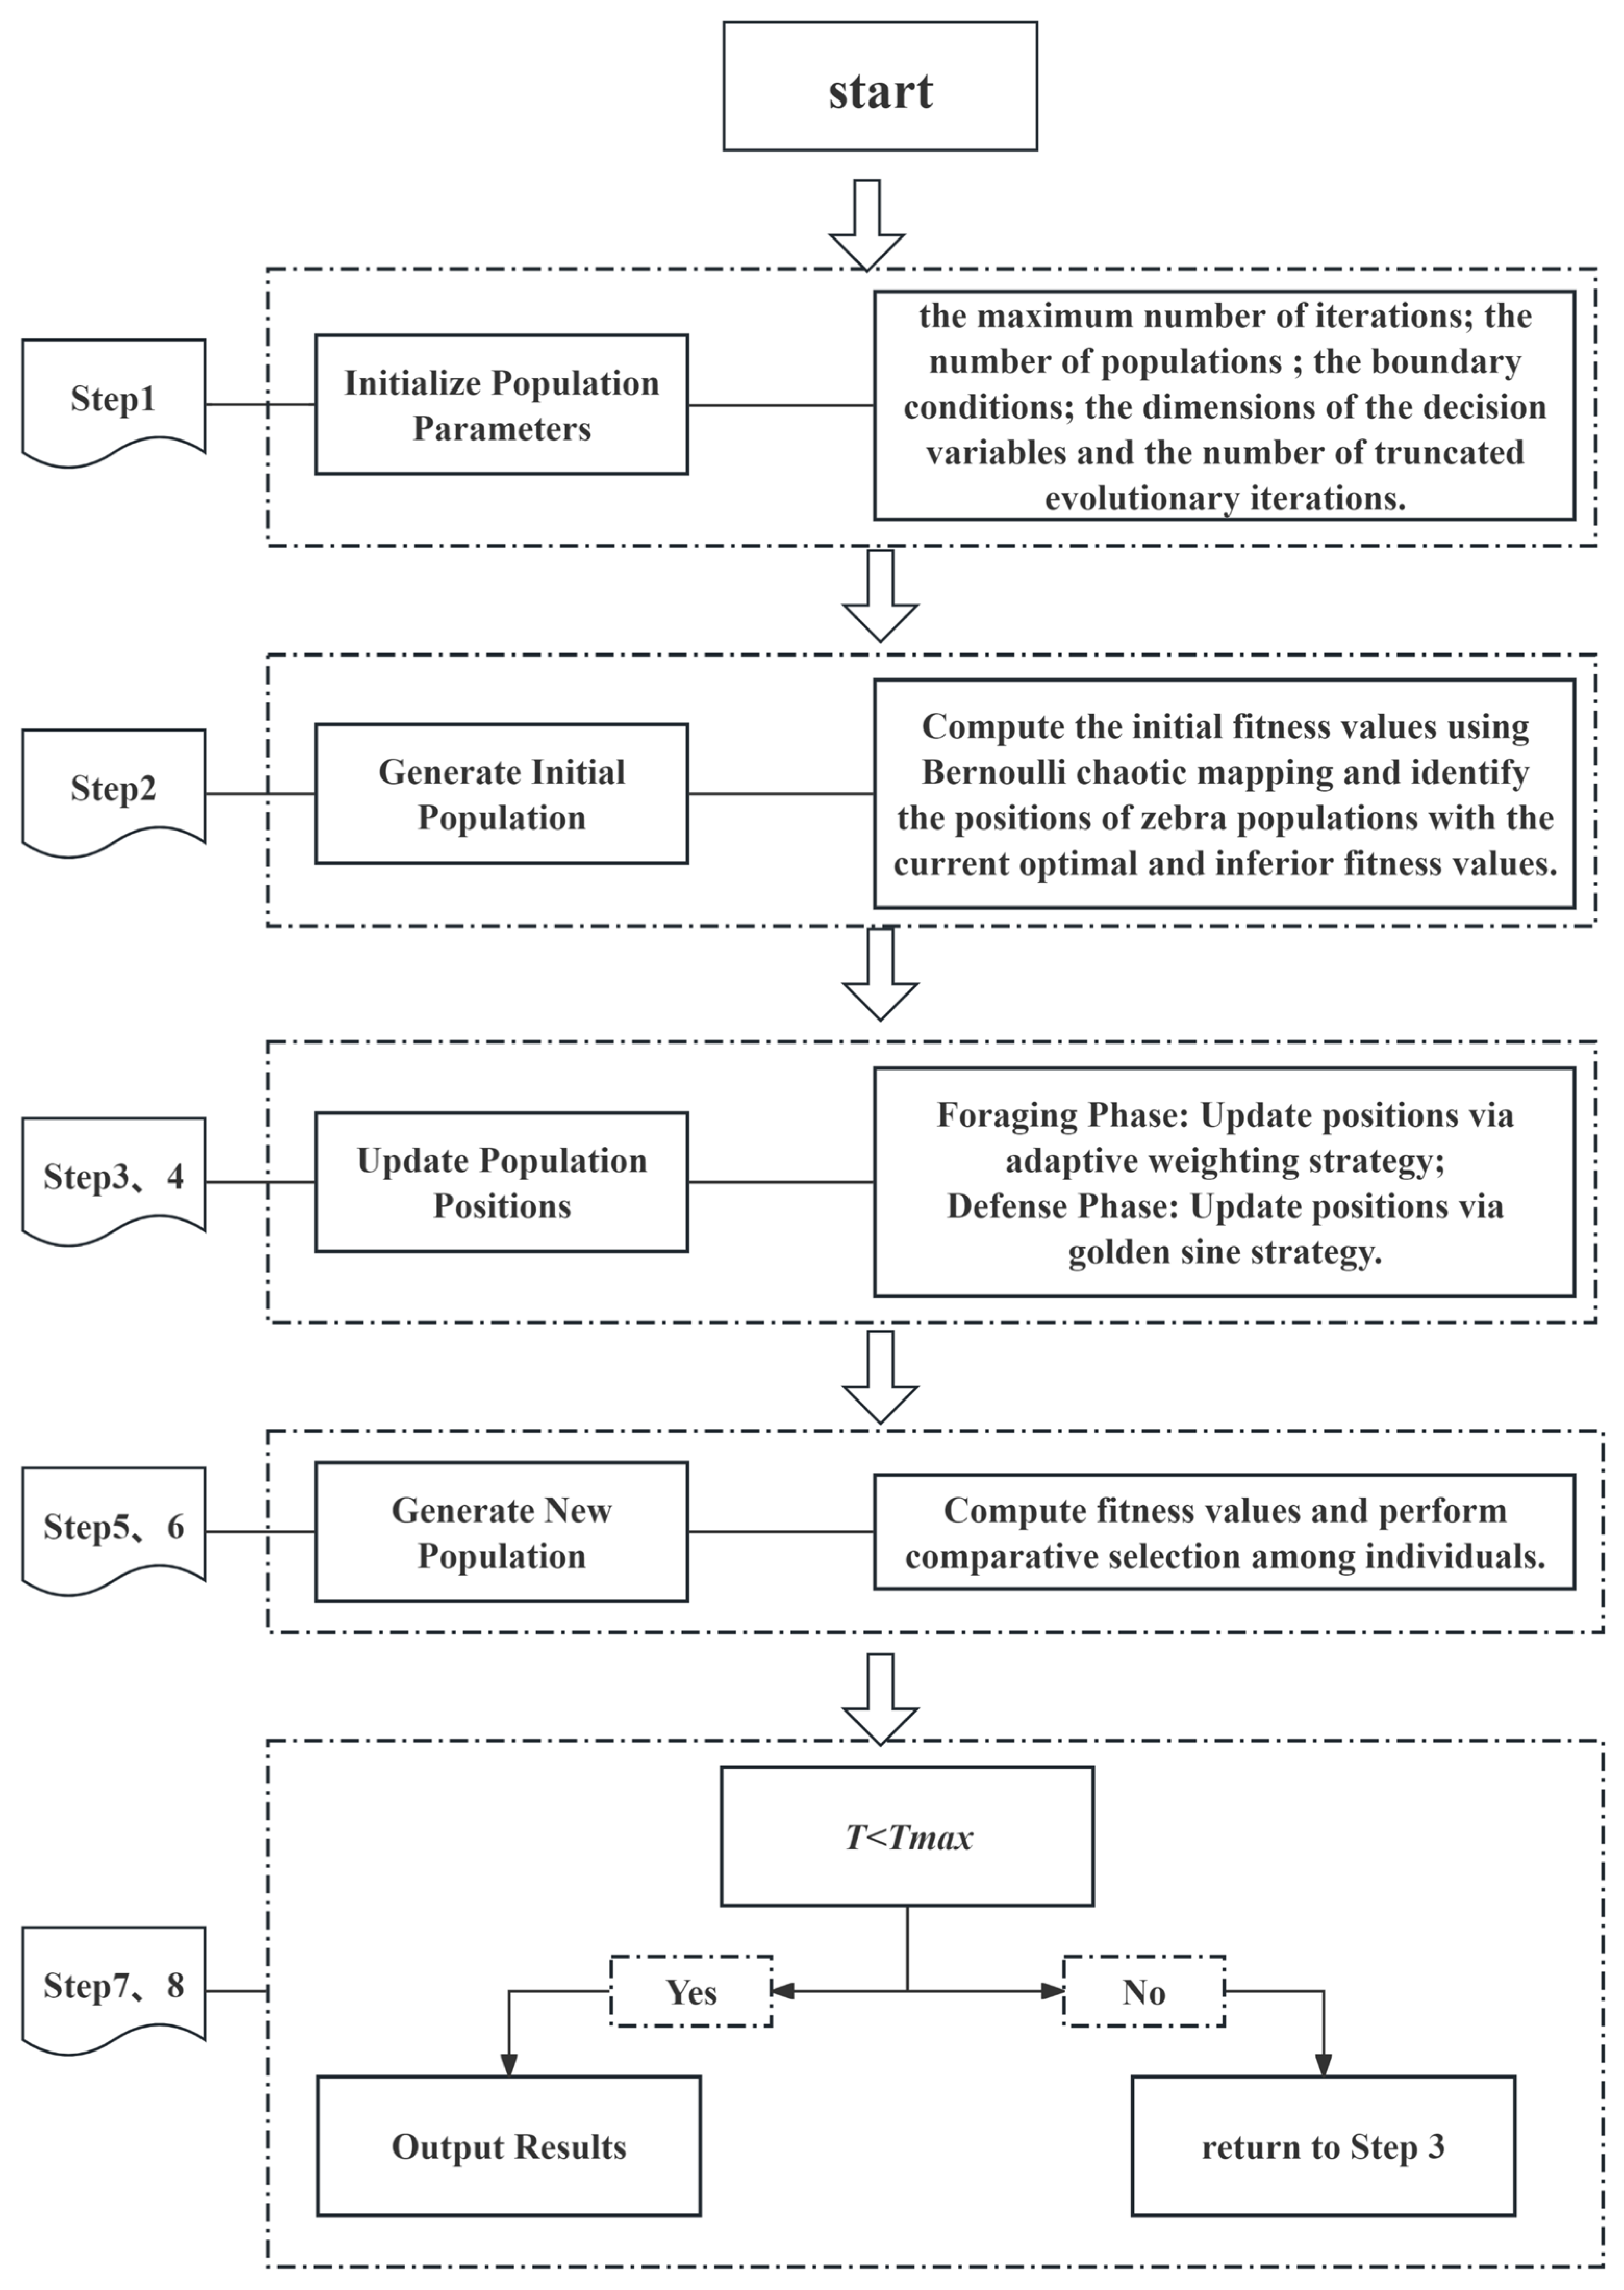
The algorithm workflow is defined as follows: Initialization inputs maximum iterations, population size, boundary conditions, decision variable dimensions, and truncated evolutionary iterations to generate parameter sets. Using these parameters, the initial population is computed via Bernoulli chaotic mapping, with outputs including initial fitness values and positions of optimal/inferior individuals. Population positions are iteratively updated through adaptive weighting (foraging phase) and golden sine strategies (defense phase), taking current positions and fitness as inputs to output adjusted positions. New populations are generated by comparing the fitness values of updated positions, followed by iterative selection. The loop terminates when reaching maximum iterations, outputting the final solution; otherwise, it continues updating positions until convergence (Figure 1).
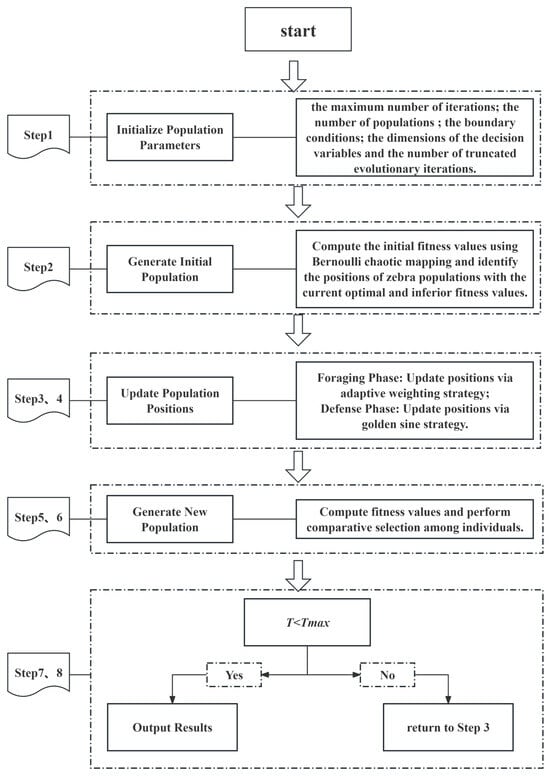
Figure 1.
IZOA algorithm flow chart.
Here are the specific steps of the ε-IZOA algorithm:
- Initialize Population Parameters: Set parameters involve the T, N, search space boundary constraints, decision variable dimensionality, and truncation evolution iteration count Te.
- Generate Initial Population: Initialize the population via Bernoulli chaotic mapping (Equation (12)), compute the initial fitness values, and identify the positions of zebra populations with the current optimal and inferior fitness values.
- Foraging Behavior Phase: Update zebra positions using the adaptive weighting factor strategy (Equations (14) and (15)).
- Predator Defense Phase: Update zebra positions based on the golden sine strategy (Equation (16)).
- Generate New Population: Modify the spatial configurations of newly generated zebra populations and then evaluate their evolutionary fitness metrics.
- Selection: Perform individual comparison and selection according to Equation (17).
- Termination Check: If satisfied, the result will be output; otherwise, the population position will be updated.
- Output Results: Record the best fitness score and its matching individual from the results.
3.4. Experimental Testing of ε-IZOA Simulation
To validate the superior convergence performance and solution accuracy of the improved ε-constrained Improved Zebra Optimization Algorithm (ε-IZOA) over the original Zebra Optimization Algorithm (ZOA), this study employs a suite of 24 test functions for evaluation. Comparative experiments with ε-ZOA, ε-PSO, ε-DE, and ε-WOA demonstrate that the proposed method achieves enhanced convergence behavior and precision. In this experiment, each test function is run independently 30 times, the population is set to 200, the maximum number of iterations is 10,000, the maximum number of function summations is 500,000, the number of truncated evolution iterations is 1000, and the equation constraint violation tolerance value is 0.0001. The experimental outcomes, summarized in Table 1, demonstrate the superior behavioral features of the ε-IZOA algorithm through comparative experiments with established optimization techniques. This analysis validates the effectiveness and operational feasibility of the proposed methodology in addressing complex multidimensional optimization problems.

Table 1.
Comparative Results of ε-ZOA, ε-PSO, ε-DE, ε-WOA, and ε-IZOA on 24 Constrained Optimization Test Functions.
Due to the significant solving difficulty of functions g20 and g22, no valid solutions could be obtained. Therefore, the final experimental results are reported for the remaining 22 functions only. Based on the experimental results of 22 benchmark functions, the ε-IZOA algorithm demonstrates superior performance compared to other optimization algorithms (ε-ZOA, ε-PSO, ε-DE, and ε-WOA). Across 30 independent runs, ε-IZOA achieves mean values identical to the theoretical optima for 15 functions. Notably, ε-IZOA exhibits zero standard deviation (SD) for seven functions (g1, g11, g12, g16, g21, g23, and g24), indicating absolute solution stability. For instance, in g12, ε-IZOA yields both the mean (−1.00E+00) and SD (0.00E+00) aligned with the theoretical optimum (−1.0000), whereas ε-ZOA and ε-PSO show deviations in mean values despite similar SDs. For the high-dimensional complex function g2 (theoretical optimum: −0.8036), ε-IZOA achieves a mean of −8.03E−01 with an SD of 2.88E−03, significantly outperforming ε-ZOA (mean: −7.27E−01, SD: 4.44E−02), demonstrating robustness in handling intricate multidimensional problems. In constrained optimization scenarios like g6 (theoretical optimum: −6961.8139), ε-IZOA attains a mean of −6.96E+03 (SD: 1.80E−05), while ε-DE yields a suboptimal mean of −7.96E+03 (SD: 9.13E+00), highlighting ε-IZOA’s precision advantage. The integration of the Bernoulli chaotic mapping adaptive weight factor enhances global exploration, effectively avoiding local optima. For example, in g20, ε-IZOA achieves a mean of −4.00E+02, surpassing ε-WOA’s −4.53E+02 despite not reaching the theoretical optimum. Concurrently, the golden sine hybrid strategy accelerates convergence and improves solution accuracy, as evidenced in g24 (theoretical optimum: 0.7499), where ε-IZOA produces a mean of 7.50E−01 (SD: 0.00E+00) versus ε-PSO’s 3.94E−03, which deviates markedly. In summary, ε-IZOA exhibits exceptional stability, precision, and adaptability in complex optimization tasks.
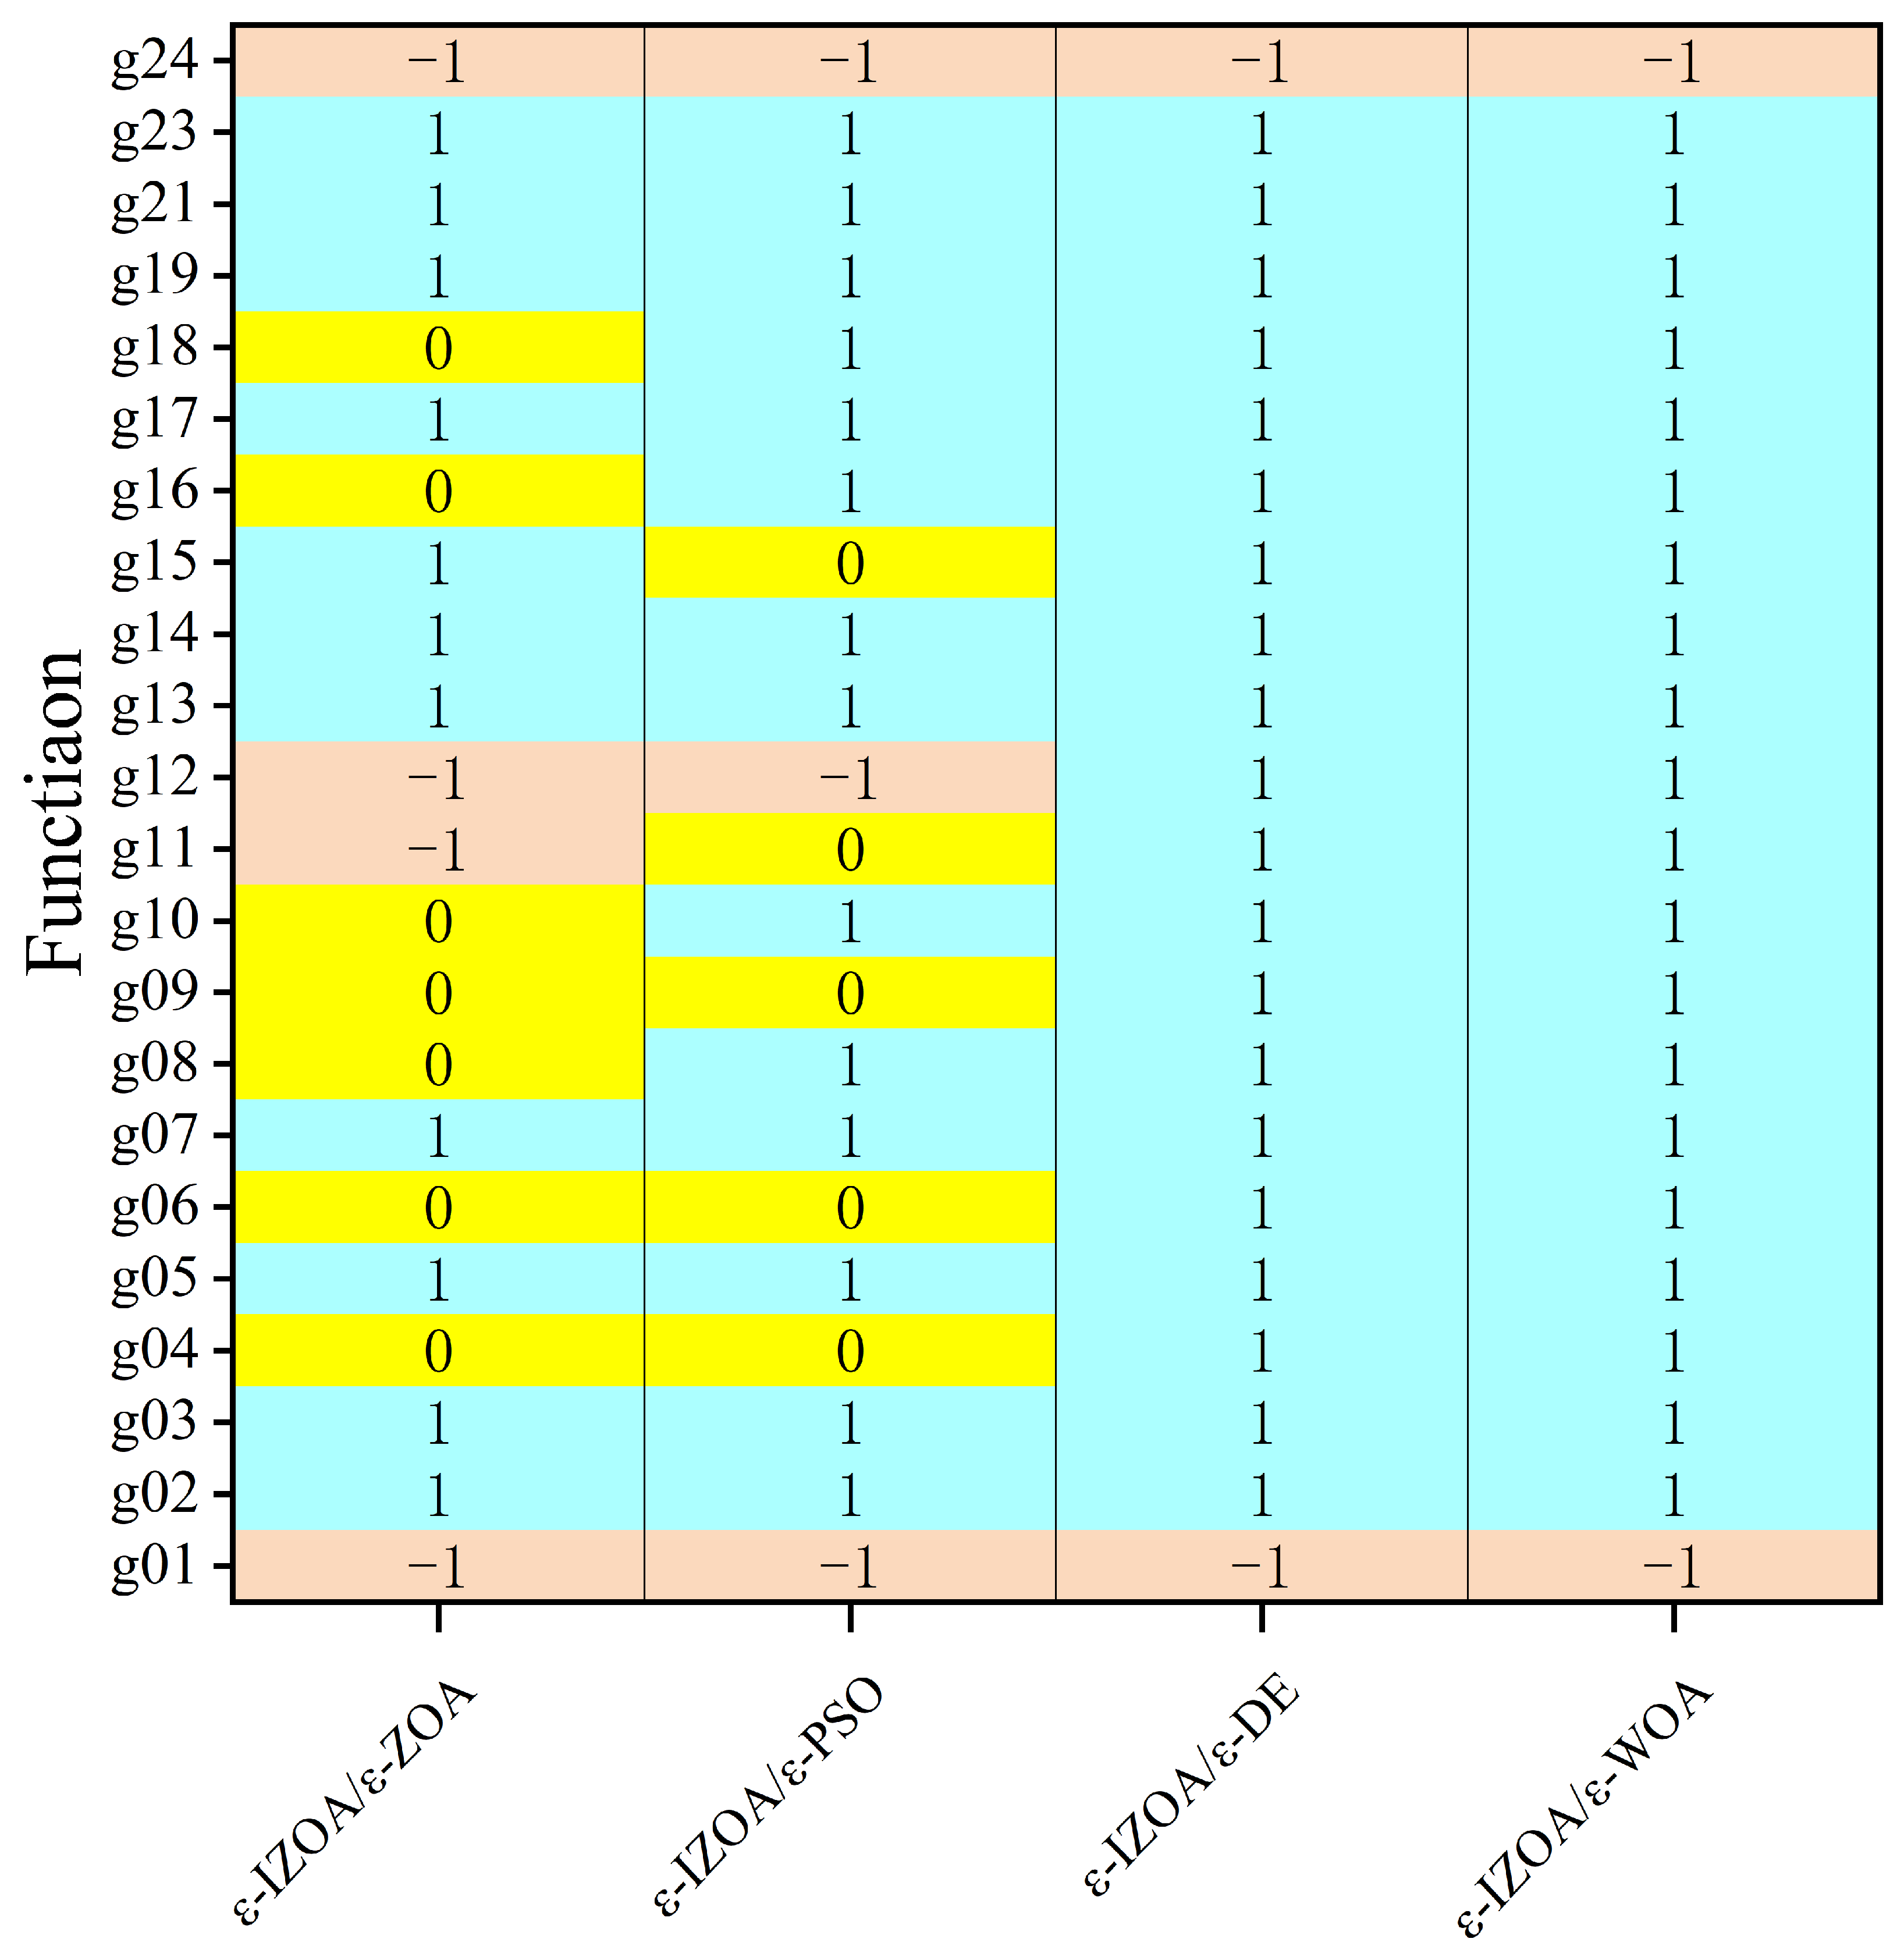
According to the significance test, the ε-IZOA algorithm significantly outperforms the comparison algorithms across 22 benchmark functions (g01–g24). In 12 functions, including g02, g03, g04, g05, g07, g13, g14, g17, g19–g21, and g23, the ε-IZOA algorithm performs significantly across all columns. Special cases refer to situations where the mean values match the theoretical optimal values exactly and there is no fluctuation.
4. Example Analyses
4.1. Overview of the Study Area
The Yellow River is one of the most important rivers in China. It originates from the Ba Yan Ka La Mountains of the China Range and has a total length of about 5464 km, flowing through eight provinces and regions, including Qinghai, Gansu, Ningxia, Inner Mongolia, Shaanxi, Shanxi, Henan, and Shandong, and eventually into the Bohai Sea. The Yellow River Basin has a high topography, with plateaus and mountainous regions dominating. Rainfall in the Yellow River Basin is mainly influenced by the monsoon and topography. In summer, under the influence of warm and humid air currents, precipitation is more concentrated, but due to its inland location, the amount of precipitation is limited. Winter precipitation is low, and most areas are dry.
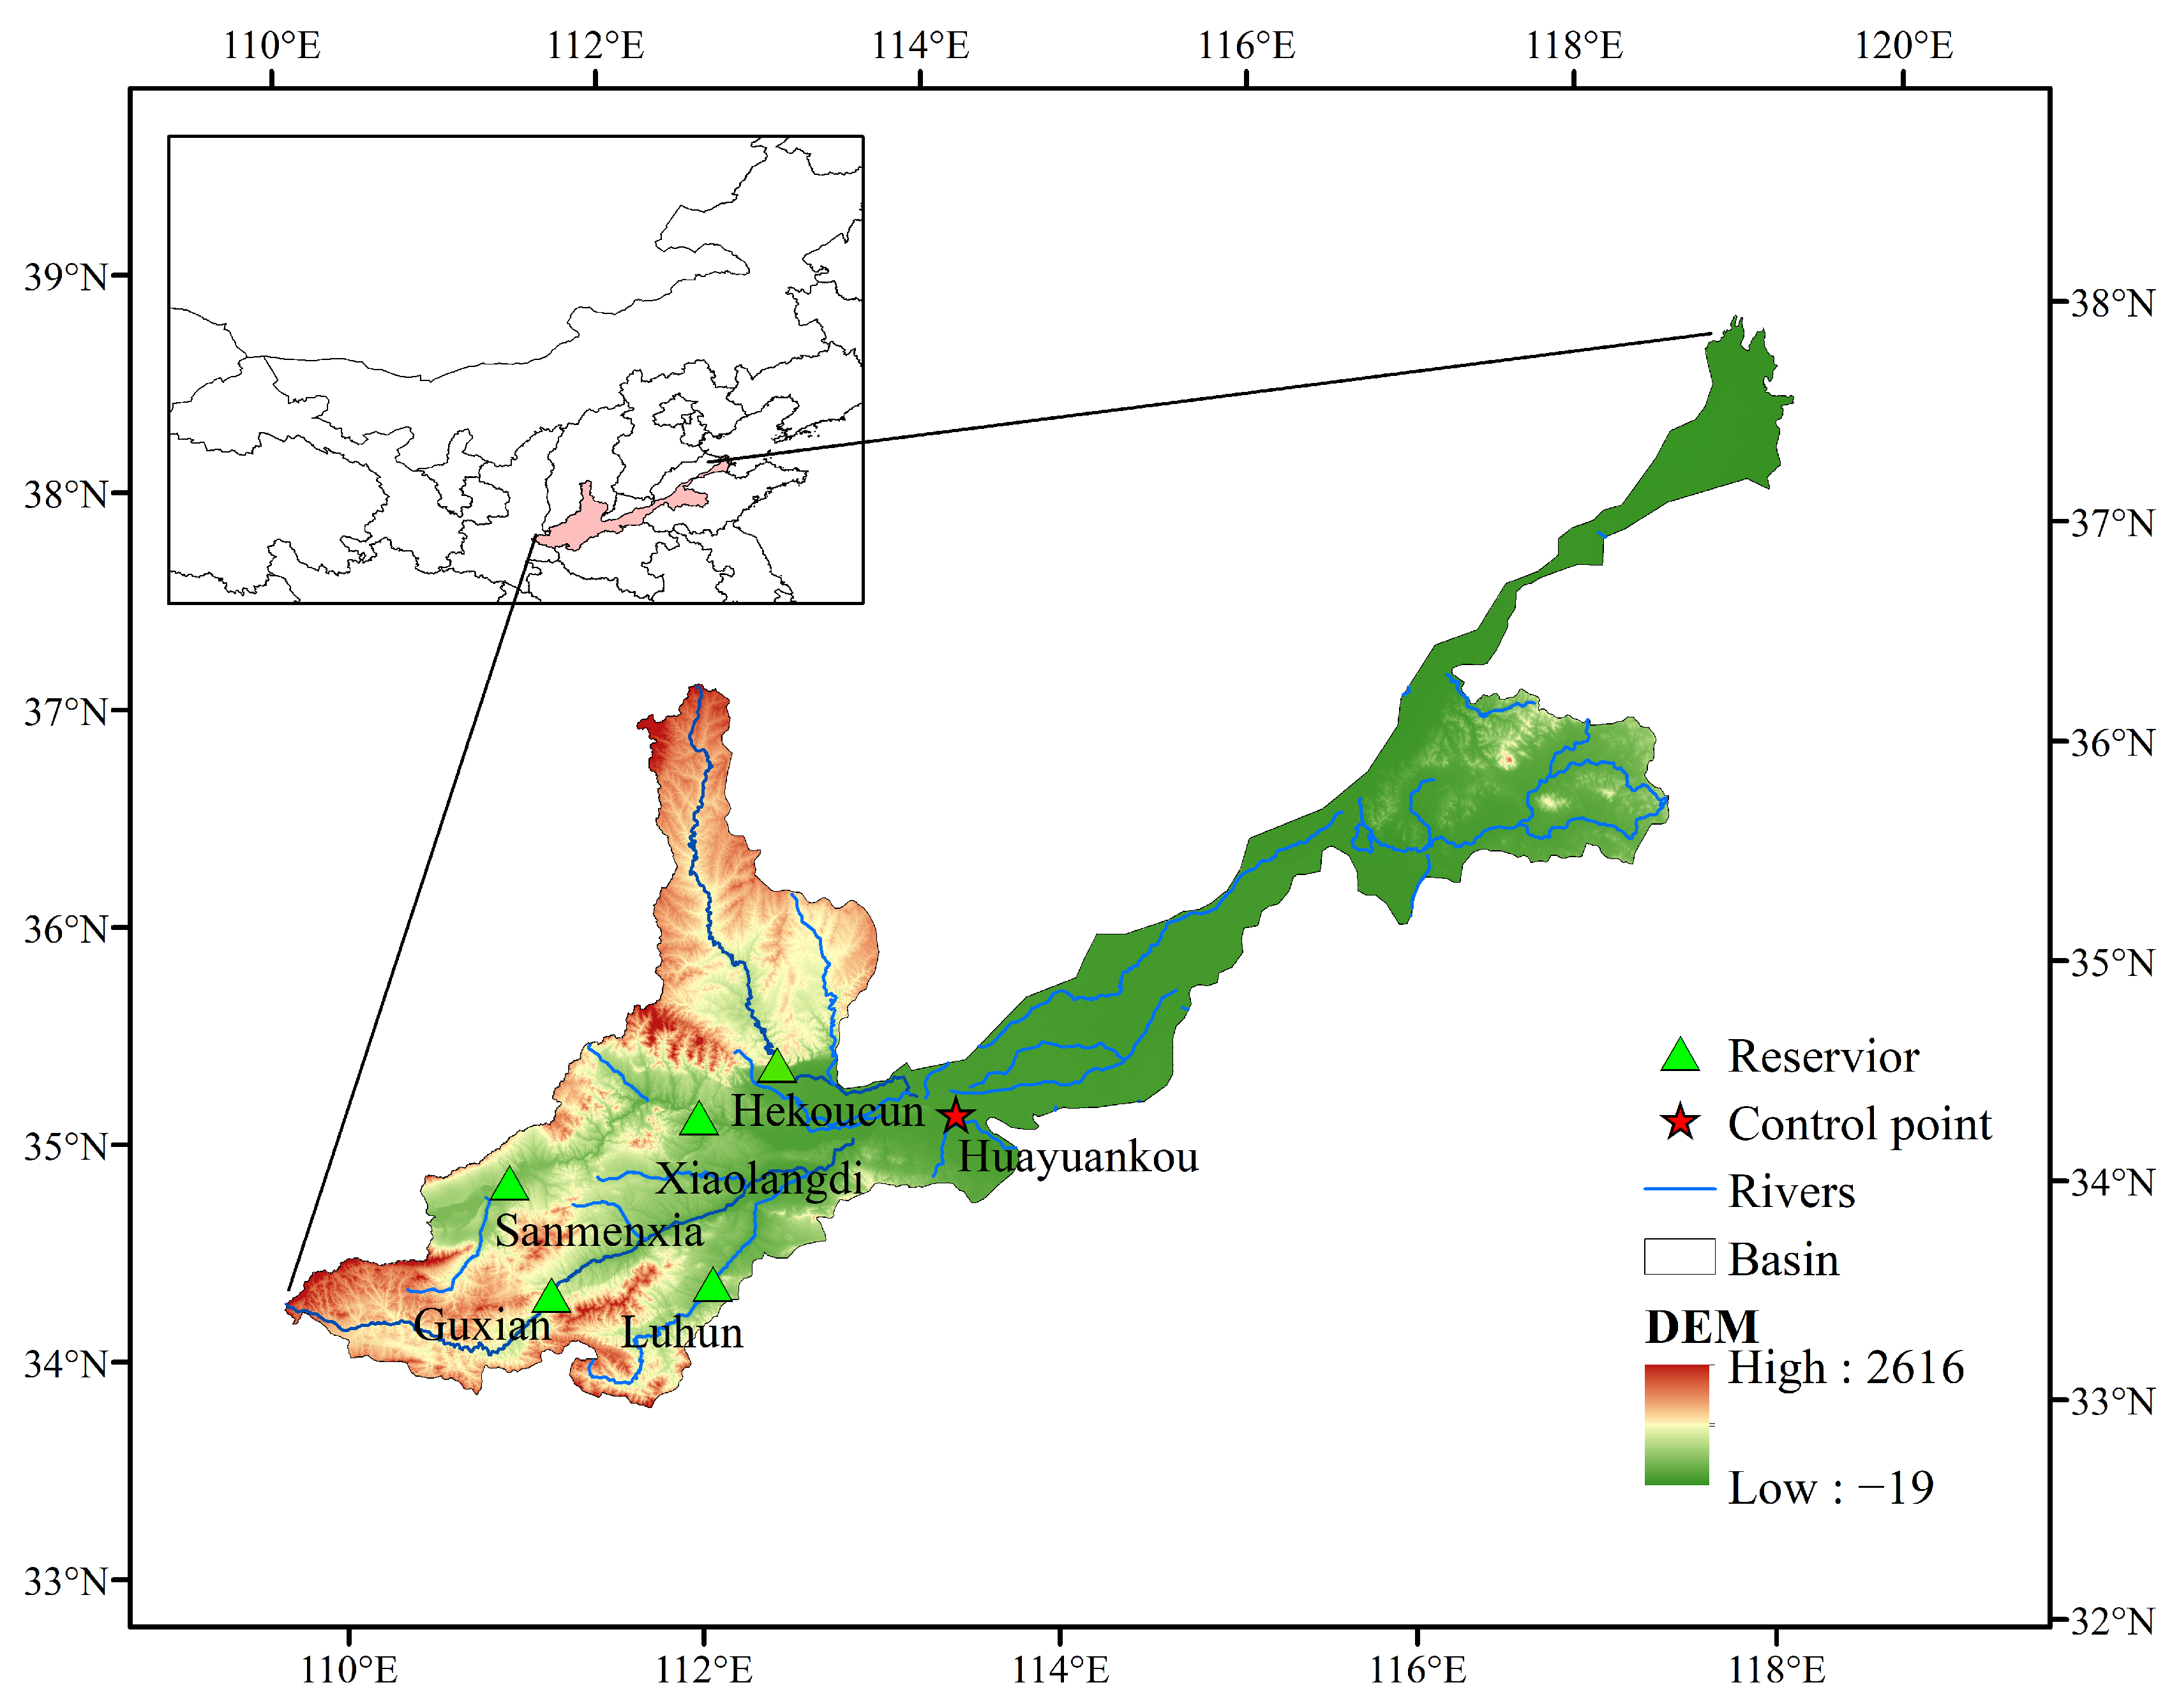
Guxian Reservoir is a large-scale, multi-purpose reservoir in China with flood control as its primary function. In addition to flood control, it can also be used for irrigation, water supply, and power generation, playing an important role in alleviating the flood threats in the upper reaches of the Yellow River. Luhun Reservoir is an indispensable water conservancy project on the main stream of the Yellow River. It undertakes the tasks of flood regulation, water supply, and power generation, effectively controlling the floods in the Yi River Basin and providing water use guarantees for the coastal areas. Sanmenxia Reservoir is one of the large-scale water conservancy hubs on the main stream of the Yellow River, mainly used for power generation dispatch, shipping, and flood control. Xiaolangdi Reservoir is located in Luoyang, Henan Province. Its main functions are to regulate the flow of the Yellow River and generate electricity, which is of great significance for reducing the flood pressure of the Yellow River, regulating the river channel flow, and ensuring the shipping safety in the lower reaches. Hekoucun Reservoir is located on the main stream of the Qin River in Jiyuan and is an important part of the flood control system of the Yellow River. The location of the reservoir in the Yellow River basin is shown in Figure 2; the characteristic parameters of the five reservoirs are shown in Table 2.
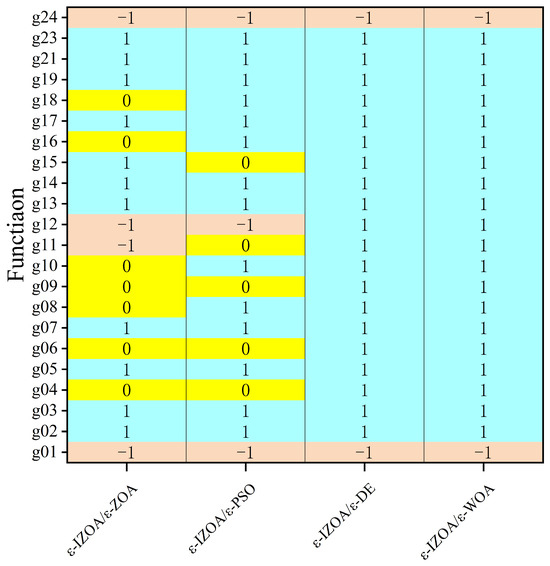
Figure 2.
Significance Test for Algorithm Comparison (Note: 1/Significant, −1/Not Significant, 0/Special Case).
Table 2.
Reservoir Characteristics.
4.2. Regional Flood Analysis
The flood evolution of the reservoir is shown in Figure 3.

Figure 3.
Reservoir Locations.
Q1, Q2, Q3, and Q4 represent the upper catchment flood volumes entering the following reservoirs: (1) Guxian, (2) Luhun, (3) Sanmenxia, and (4) Hekoucun; Q5, Q6, Q7, Q8, and Q9 are the inter-area floods from Guxian Reservoir to Longmen section, inter-area floods from Luhun Reservoir to Baemaji section, inter-area floods from Baemaji and Longmen to Heishiguan section, inter-area floods from Sanmenxia Reservoir to Xiaolangdi Reservoir, and inter-area floods from Hekoucun Reservoir to Wuzhi section, respectively. q1, q2, q3, q4, and q5 are the outflow. Floods discharged from every single reservoir, along with the floods in the intervening area, converge as they progress towards the Huayuankou section, jointly constituting the flood hydrograph at Huayuankou.
Flood evolution is a method used to study flood hydrology in a watershed by modeling surface runoff and flooding processes. It is used to assess flood defense capacity and predict possible flooding scenarios by calculating information, such as peak flood flow and flood inundation extent. As its basic principle, neglecting the inertia term, the dynamic equation can be simplified to the trough storage equation as follows:
where is the river storage; is the storage volume; is the duration of the computational time interval; is the flow proportion factor; K represents the channel storage coefficient; calculate the discharge of the downstream section at the beginning and end of the cycle, respectively; is the inflow from the upstream section at the beginning and end of the calculation cycle, respectively.
For the study river section, the values of parameters are the two most important parameters of the method, which are determined by the characteristics of the river section itself. The article directly selects the existing real parameter data. The values of the relevant parameters are shown in Table 3.
Table 3.
Parameters of the Muskingum Method.
5. Results and Discussion
5.1. Analyzing the Scheduling Results
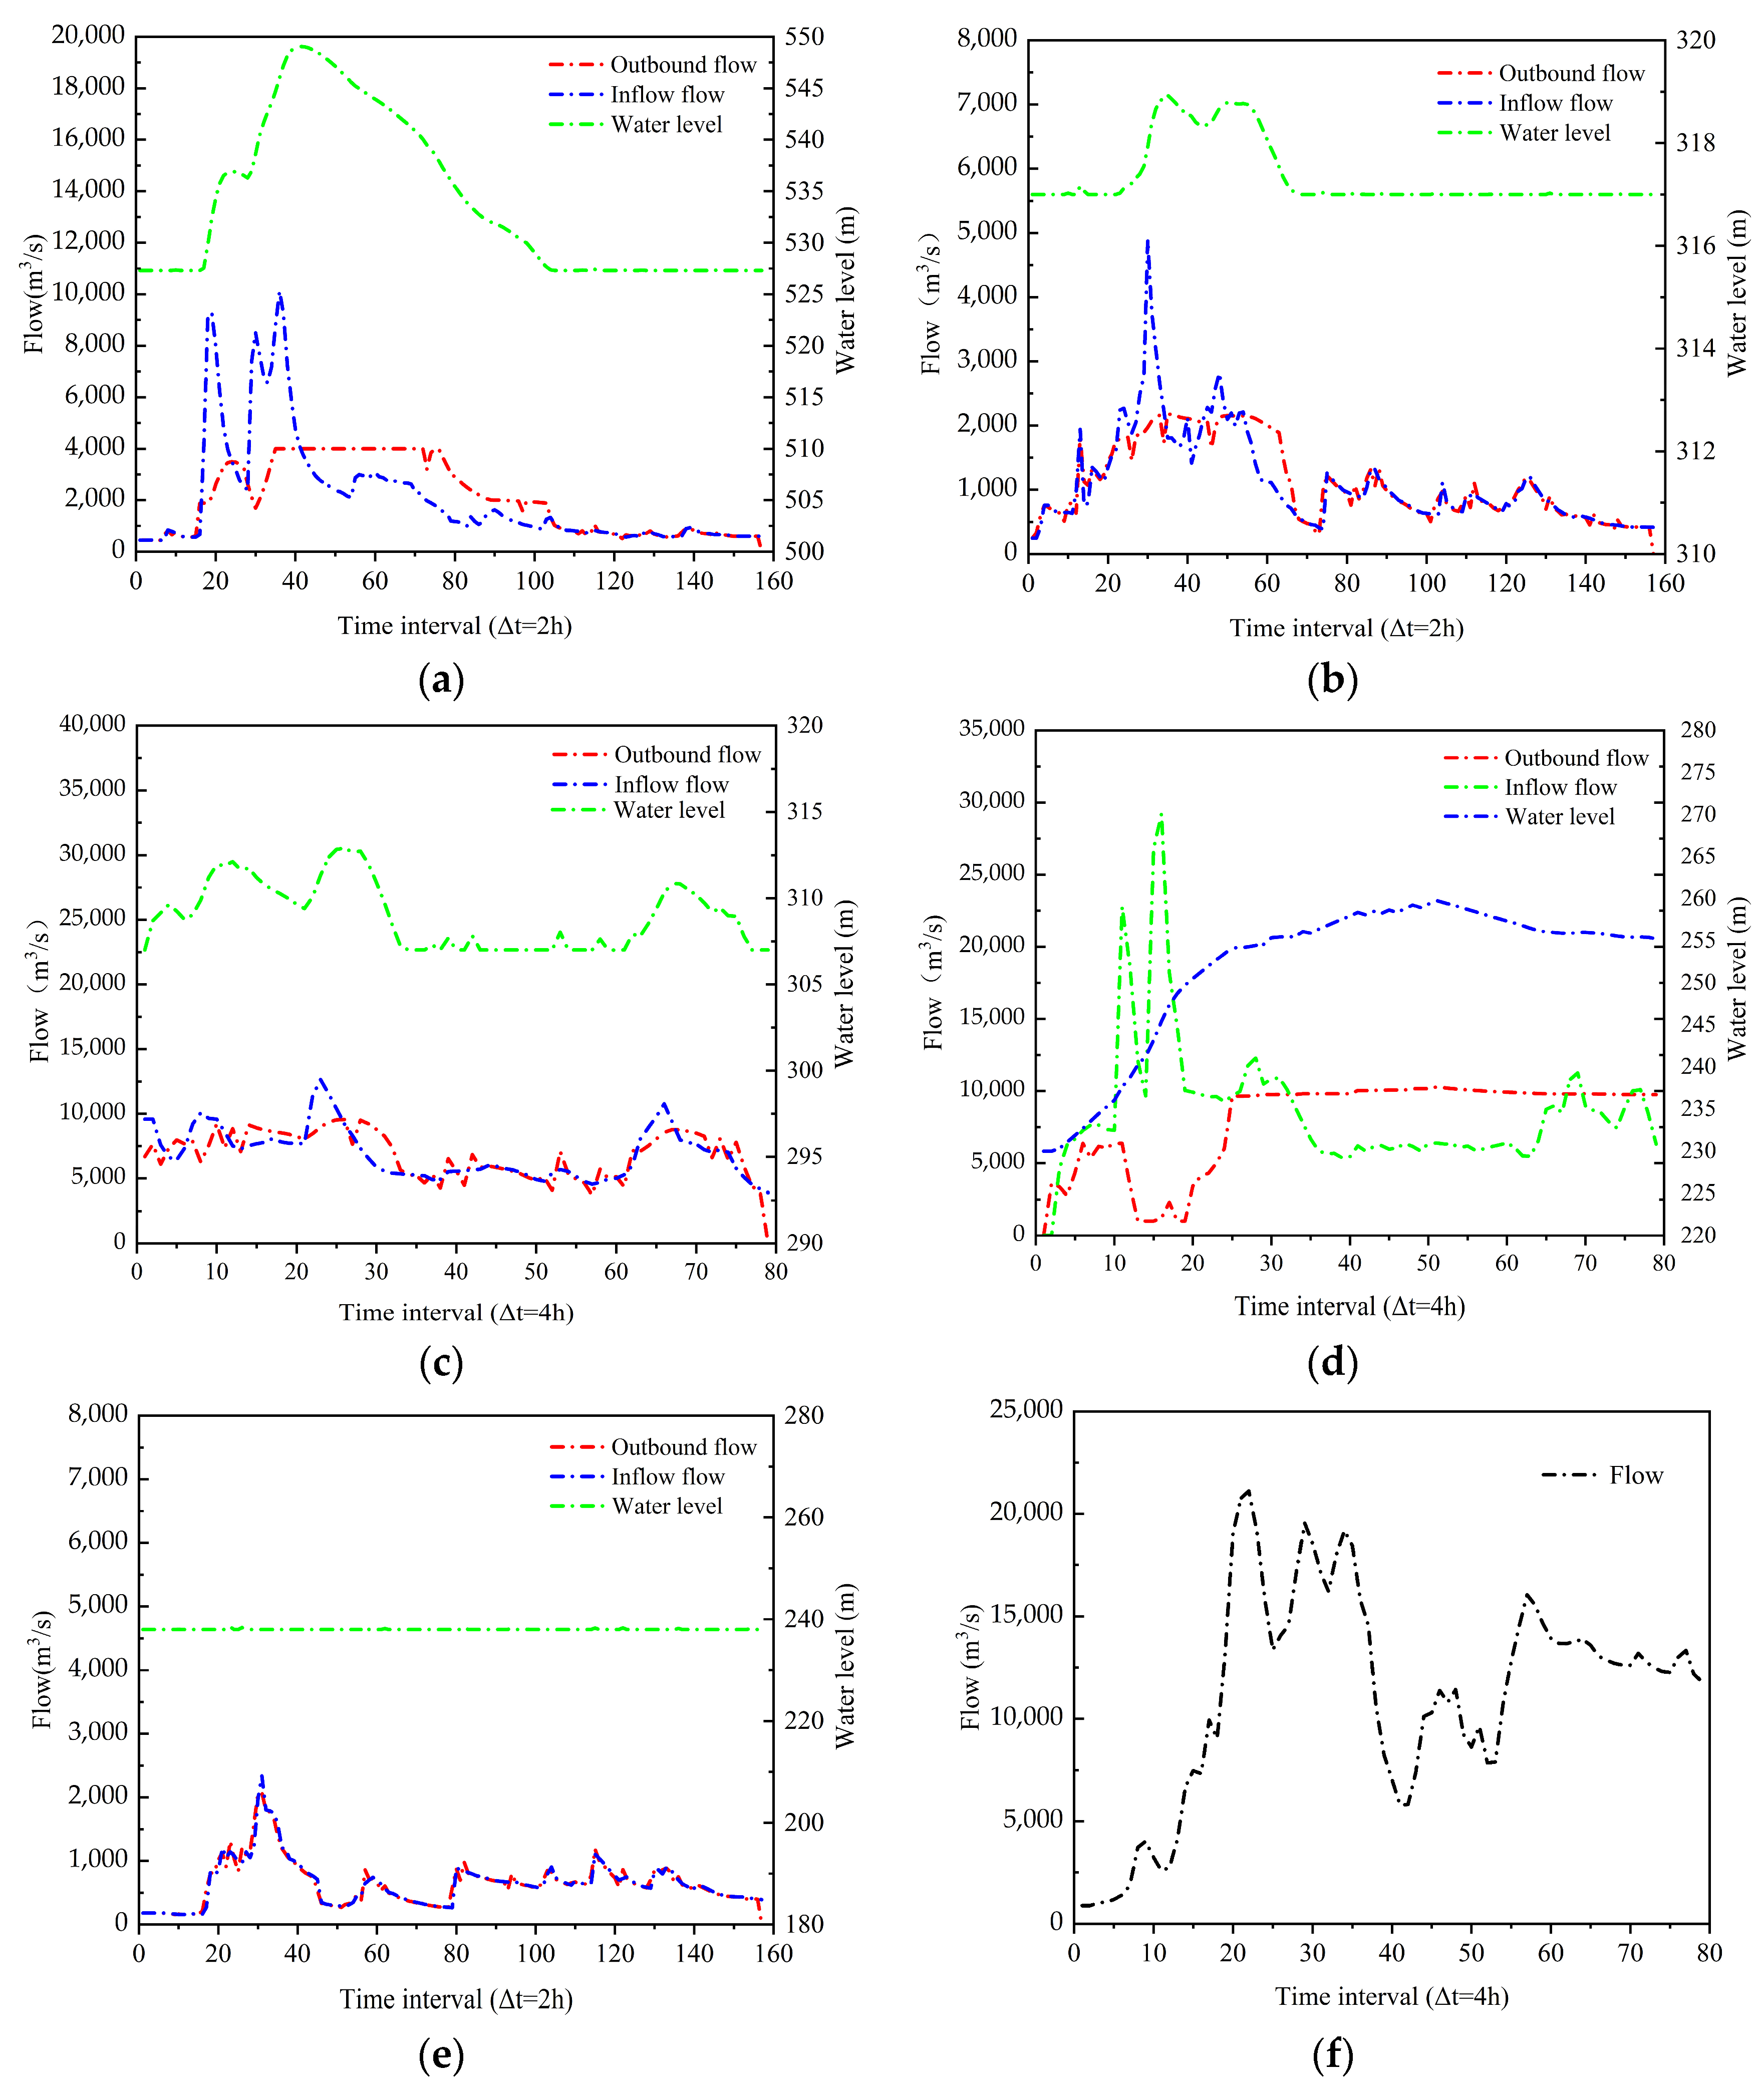
According to the improved algorithm IZOA based on the Bernoulli chaotic mapping adaptive weight factor and the fusion of golden sine strategy proposed in this paper, the joint flood control optimal scheduling calculation is carried out for Luhun, Guxian, Sanmenxia, Xiaolangdi, and Hekoucun. The measured flood data of one of a thousand years in 1958 is selected. Based on the observed hydrological data, the computational time interval for the main stream is set to 4 h. The optimal scheduling process for the joint flood control of the five reservoir groups is obtained through the calculations. As shown in Table 4, after the regulation of the reservoir, the flood peak is reduced to a certain degree, in which the peak cutting rates of the Guxian, Luhun, and Xiaolangdi reservoirs are higher, 60.47%, 55.42%, and 64.87%, respectively, and those of the Sanmenxia and Hekoucun reservoirs are relatively lower, 24.39% and 11.88%, respectively. Figure 4 represents the regulation process of Sanmenxia Reservoir, Xiaolangdi Reservoir, Luhun Reservoir, Hekoucun Reservoir, Guxian Reservoir, and Huayuankou using the solution of the ε-IZOA algorithm, respectively. The joint adjustment of the five reservoirs in the basin shows typical peak characteristics: the flow of the Xiaolangdi, Luhun, and Guxian reservoirs is relatively small; the flow of the Hekou Village reservoir reaches the maximum; the Luhun and Guxian reservoirs reach the maximum flow; and the outflow of the Xiaolangdi reservoir remains stable. Therefore, the scheduling scheme combined with the ε-IZOA algorithm can effectively reduce the flood peak flow and achieve a small effect in terms of staggered peaks in each reservoir.
Table 4.
Results of Joint Reservoir Operation.
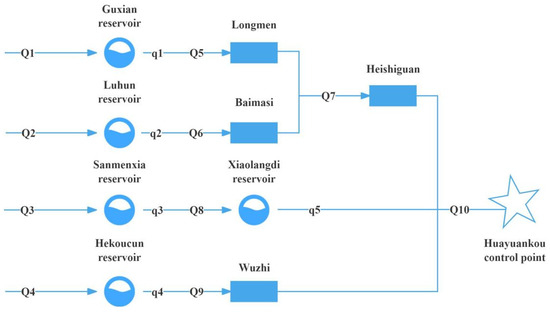
Figure 4.
Flood Propagation Simulation.
5.2. Analysis of Algorithm Results
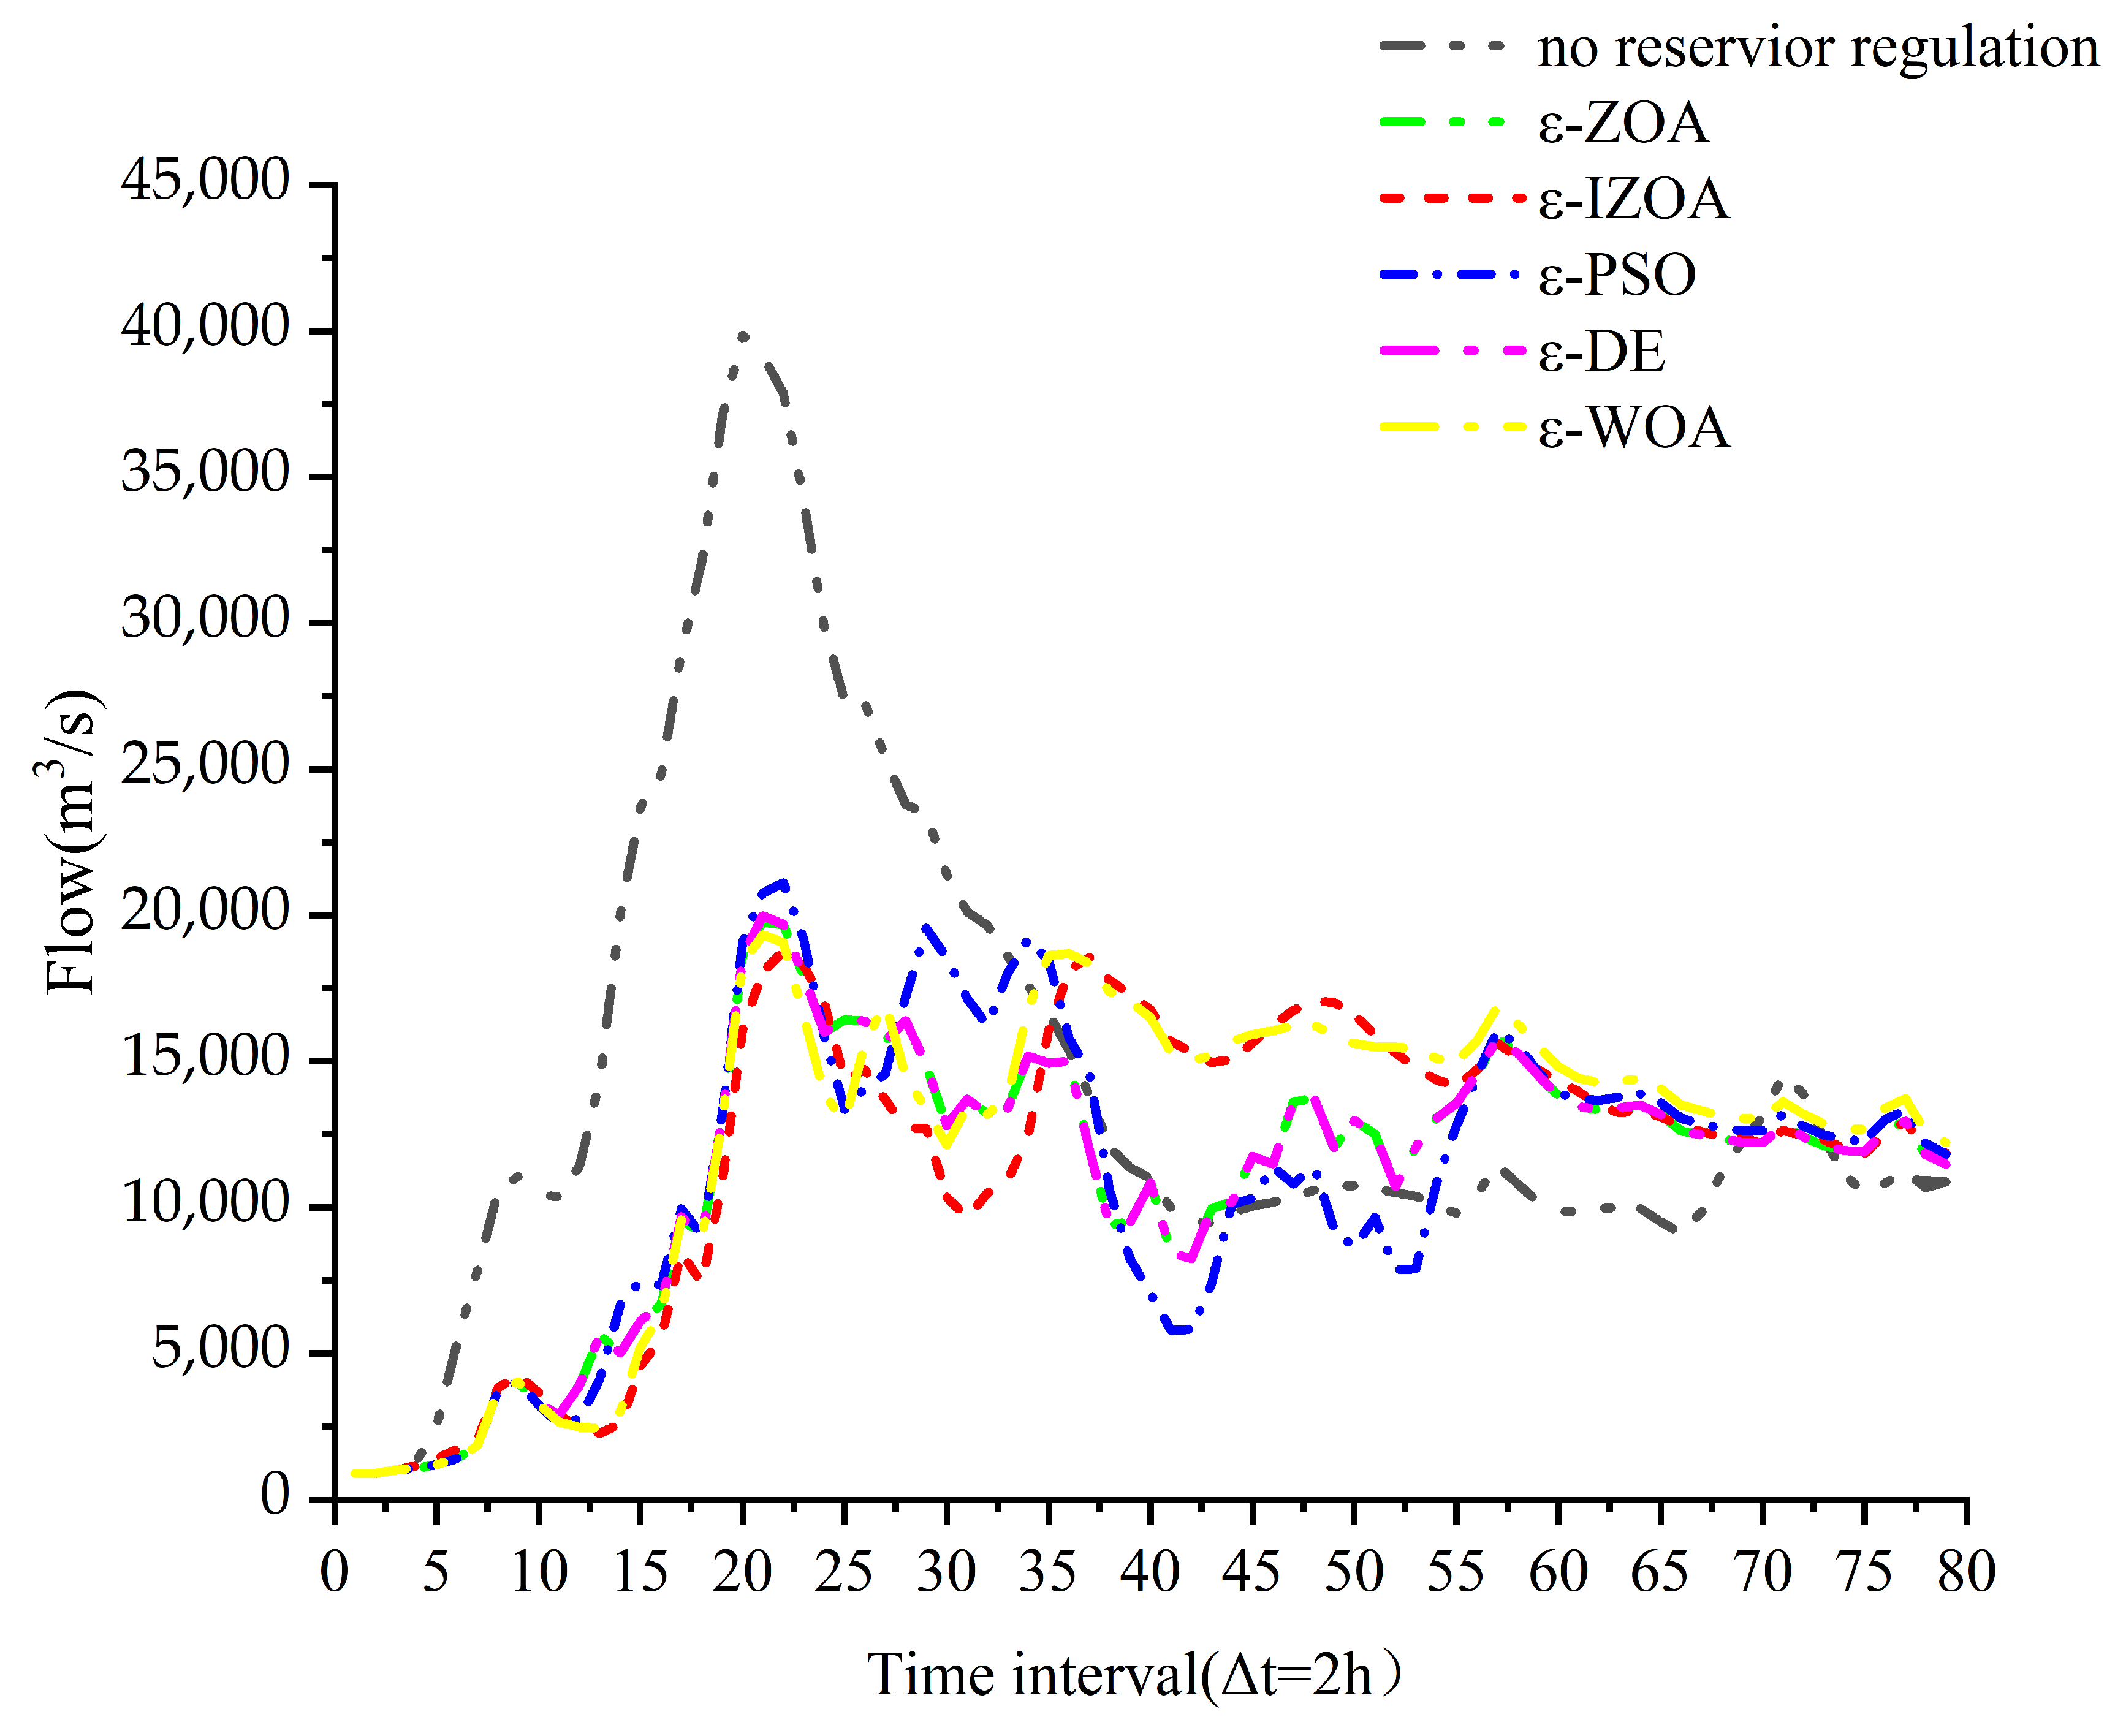
This paper tests the application effect of the ε-IZOA algorithm on reservoir flood regulation. As can be seen in Figure 5, for the biggest flood in a thousand years, the scheduling results obtained by applying algorithms can cut the safe discharge of 22,000 m3/s at the control point of Huayuankou to a certain extent. The five algorithms, in order to realize the purpose of maximal peak-cutting, realize a staggered peak at the moment of the maximal peak of the flood through the regulation of reservoirs, and reach the peak of the flood after two times; the flood process at the Huayuankou section gradually stabilizes (Figure 6). This stability is beneficial for flood control safety in the downstream river reaches. The peak-shaving ratios of various algorithms are presented in Table 5. The maximum flood peak flow at the control point of Huayuankou when solved by the ε-IZOA, ε-ZOA, ε-PSO, ε-DE, and ε-WOA algorithms are 18,745.02, 21,117.40, 19,768.11, 19,979.03, and 19,335.60 m3/s respectively, which all satisfy the flood control requirements of Huayuankou. Among them, the ε-IZOA algorithm has the highest peak shaving rate of 52.97.03%, and the four other algorithms are 50.40%, 47.01%, 49.87%, and 51.48%, respectively, which indicates that the ε-IZOA algorithm is better than the other two algorithms in solving the joint reservoir flood control scheduling problem.
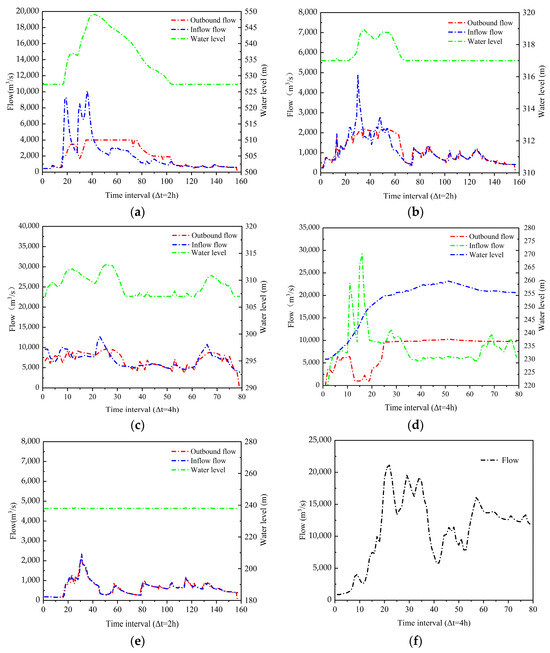
Figure 5.
Scheduling Results. (a) Guan xian; (b) Luhun; (c) San men xia; (d) Xiao lang di; (e) He kou cun; (f) Hua yuan kou.
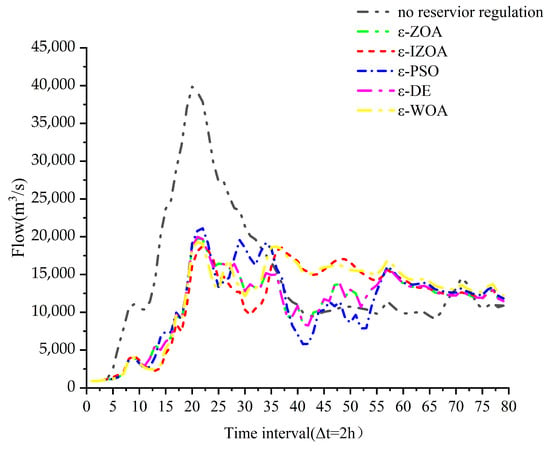
Figure 6.
Flood Process at the Huayuankou Section.
Table 5.
Peak Reduction Effects of Various Algorithms.
5.3. Conclusions
For the first time, this paper applies the improved ε-IZOA method to the optimization problem of a reservoir group consisting of five reservoirs in the Yellow River. Under the same conditions, the solutions of the four algorithms are compared and analyzed. The main conclusions are as follows:
- (1)
- The ε-IZOA algorithm, incorporating an adaptive weight factor based on Bernoulli chaotic mapping and the golden sinusoidal strategy, effectively addresses the traditional ZOA’s issues of performance instability due to parameter dependence, surges in computational complexity in high-dimensional spaces, susceptibility to local optima, and slow convergence, thereby significantly enhancing its adaptability in complex scenarios.
- (2)
- This paper makes use of the ε-IZOA algorithm for the first time in the optimal scheduling problem of reservoir group flood control. Comparing the ε-ZOA, ε-PSO, ε-DE, and ε-WOA algorithms, the results show that the ε-IZOA algorithm has a fast convergence speed and a higher probability of finding the optimal solution, and it is able to solve well the traditional mathematical planning methods for solving the problem of a more complex case of the dimensional disaster problem, showing the better performance of the algorithm.
- (3)
- The comparison results show that the ε-IZOA algorithm has better performance than the ε-ZOA, ε-PSO, ε-DE, and ε-WOA algorithms; the peak shaving rates of the five reservoirs are 60.47%, 55.42%, 24.39%, 64.87%, and 11.88%, which are obviously higher than the other two algorithms at the same time, which reflects the feasibility and validity of the ε-IZOA algorithm in solving the optimal scheduling problem of the flood control of the reservoir groups, and it provides an effective method for the optimal scheduling of the flood control of the reservoir groups.
5.4. Research Limitations and Future Perspectives
The case validation of this study was solely based on the operational effectiveness of the five-reservoir joint operation system in the Yellow River Basin under the 1958 millennium flood scenario. Although the algorithm demonstrated remarkable peak shaving capacity in this specific scenario, its applicability to different frequency floods (e.g., 100-year return period events and beyond-design-basis floods under extreme climate scenarios) and cross-basin reservoir group coordination remains unverified. Future research should incorporate optimization experiments driven by multi-frequency flood data and investigate the algorithm’s generalization capability under complex hydrological conditions (e.g., intensified rainfall-runoff nonlinearities under climate change) and heterogeneous reservoir networks (e.g., hybrid cascade-parallel configurations), thereby further validating the robustness and universality of the ε-IZOA algorithm.
The parameter configuration of the proposed algorithm primarily relied on empirical values, lacking systematic theoretical derivation or an experimental optimization basis. Parameter sensitivity may significantly affect the convergence rate, global search capability, and solution quality. Subsequent investigations should establish a parameter sensitivity analysis framework employing orthogonal experiments, a response surface methodology, or adaptive parameter tuning strategies to quantify the contribution of key parameters to algorithmic performance. Additionally, the influence mechanisms of the chaotic mapping parameters on population initialization diversity require further exploration to strengthen the theoretical foundation. While the ε-IZOA algorithm demonstrated superior peak shaving performance and computational stability in flood optimization operations for the Yellow River’s five-reservoir system, its theoretical advancement and engineering applications demand multidimensional exploration.
Author Contributions
H.C. revised the manuscript and conducted algorithm design. A.K. was responsible for the initial concept. N.C. processes data, runs algorithm models, and writes initial drafts of manuscript. All authors have read and agreed to the published version of the manuscript.
Funding
Seminar 3 of the National Key R&D Program “Prevention and Control of Major Natural Disasters and Public Safety”. (No: 2023YFC3006503).
Data Availability Statement
All authors made sure that all data and materials support our published claims and comply with field standards. Data sources are provided in the manuscript, and for anyone to request data for this study, contact nishi_chu@163.com.
Conflicts of Interest
The authors declare that they have no conflict of interest.
References
- He, J.; Guo, W.; Wang, S.; Chen, H.; Guo, X.; Li, S. Application of Multi-Strategy Based Improved DBO Algorithm in Optimal Scheduling of Reservoir Groups. Water Resour. Manag. 2024, 38, 1883–1901. [Google Scholar] [CrossRef]
- Chen, C.; Feng, S.; Liu, S.; Zheng, H.; Zhang, H.; Wang, J. A stochastic linear programming model for maximizing generation and firm output at a reliability in long-term hydropower reservoir operation. J. Hydrol. 2023, 618, 129185. [Google Scholar] [CrossRef]
- Raju, B.C.K.; Gowda, C.C.; Karthika, B.S. Optimization of Reservoir Operation using Linear Programming. Int. J. Recent Technol. Eng. 2020, 8, 1028–1032. [Google Scholar] [CrossRef]
- Aminabadi, M.J.; Séguin, S.; Fofana, I. Hybrid Genetic Algorithms and Heuristics for Nonlinear Short-Term Hydropower Optimization: A Comparative Analysis. Procedia Comput. Sci. 2024, 246, 282–291. [Google Scholar] [CrossRef]
- Chai, F.; Peng, F.; Zhang, H.; Zang, W. Stable Improved Dynamic Programming Method: An Efficient and Accurate Method for Optimization of Reservoir Flood Control Operation. Water Resour. Manag. 2023, 37, 5635–5654. [Google Scholar] [CrossRef]
- Lee, E.; Ji, J.; Lee, S.; Yoon, J.; Yi, S.; Yi, J. Development of an Optimal Water Allocation Model for Reservoir System Operation. Water 2023, 15, 3555. [Google Scholar] [CrossRef]
- Dolter, B.; Fellows, G.K.; Rivers, N. The cost effectiveness of new reservoir hydroelectricity: British Columbia’s Site C project. Energy Policy 2022, 169, 113161. [Google Scholar] [CrossRef]
- Kang, C.; Chen, C.; Wang, J. An Efficient Linearization Method for Long-Term Operation of Cascaded Hydropower Reservoirs. Water Resour. Manag. 2018, 32, 3391–3404. [Google Scholar] [CrossRef]
- Ma, H.; Liu, Y.; Lu, J.; Xu, Y.; Hua, X.; Wang, T. Research on optimal power generation operation of cascade reservoirs in Lower Jinsha River during impoundment period. Express Water Resour. Hydropower Inf. 2022, 43, 41–47. [Google Scholar] [CrossRef]
- Tharwat, A.; Schenck, W. A conceptual and practical comparison of PSO-style optimization algorithms. Expert Syst. Appl. 2021, 167, 114430. [Google Scholar] [CrossRef]
- Wahyuni, S.; Sisinggih, D.; Elhuda, I.; Souma, K.; Dasylva, I.Z. Optimization of reservoir release operation using genetic algorithm method. Results Eng. 2024, 23, 102610. [Google Scholar] [CrossRef]
- Dorigo, M.; Maniezzo, V.; Colorni, A. Ant system: Optimization by a colony of cooperating agents. IEEE Trans. Syst. Man Cybern. Part B (Cybern.) 1996, 26, 29–41. [Google Scholar] [CrossRef] [PubMed]
- Liu, Y.; Mo, L.; Yang, Y.; Tao, Y. Optimal Scheduling of Cascade Reservoirs Based on an Integrated Multistrategy Particle Swarm Algorithm. Water 2023, 15, 2593. [Google Scholar] [CrossRef]
- Zhao, Y.; Zhang, P.; Pu, Y.; Lei, H.; Zheng, X. Unit Operation Combination and Flow Distribution Scheme of Water Pump Station System Based on Genetic Algorithm. Appl. Sci. 2023, 13, 11869. [Google Scholar] [CrossRef]
- Wu, X.; Shen, X.; Wei, C.; Xie, X.; Li, J. Algorithm for Multiobjective Reservoir Ecological Dispatching. Water Resour. Manag. 2024, 38, 2229–2249. [Google Scholar] [CrossRef]
- Zhang, M.; Liu, Z.; Bao, R.; Zhu, S.; Mo, L.; Yang, Y. Application of Black-Winged Differential-Variant Whale Optimization Algorithm in the Optimization Scheduling of Cascade Hydropower Stations. Sustainability 2025, 17, 1018. [Google Scholar] [CrossRef]
- Wang, S.; Wang, H.; Liao, F.; Wei, Z.; Hu, M. Multi-population artificial bee colony algorithm for many-objective cascade reservoir scheduling. Concurr. Comput. Pract. Exp. 2024, 36, e8221. [Google Scholar] [CrossRef]
- Wang, W.; Tian, W.; Chau, K.; Zang, H.; Ma, M.; Feng, Z.; Xu, D. Multi-Reservoir Flood Control Operation Using Improved Bald Eagle Search Algorithm with ε Constraint Method. Water 2023, 15, 692. [Google Scholar] [CrossRef]
- Wu, C.; Wang, Z.; Yue, P.; Lai, Z.; Wang, Y. Research on Optimal Operation of Cascade Reservoirs under Complex Water-Level Flow Output Constraints. Water 2024, 16, 2963. [Google Scholar] [CrossRef]
- Trojovská, E.; Dehghani, M.; Trojovský, P. Zebra Optimization Algorithm: A New Bio-Inspired Optimization Algorithm for Solving Optimization Algorithm. IEEE Access 2022, 10, 49445–49473. [Google Scholar] [CrossRef]
- Wang, L.; Cui, S.; Li, Y.; Huang, H.; Manandhar, B.; Nitivattananon, V.; Fang, X.; Huang, W. A review of the flood management: From flood control to flood resilience. Heliyon 2022, 8, e11763. [Google Scholar] [CrossRef] [PubMed]
- He, Y.; Xu, Q.; Yang, S.; Liao, L. Reservoir flood control operation based on chaotic particle swarm optimization algorithm. Appl. Math. Model. 2014, 38, 4480–4492. [Google Scholar] [CrossRef]
- Gambhir, G.; Mandal, J.K. Shared memory implementation and performance analysis of LSB steganography based on chaotic tent map. Innov. Syst. Softw. Eng. 2021, 17, 333–342. [Google Scholar] [CrossRef]
- Zhang, C.; Ding, S. A stochastic configuration network based on chaotic sparrow search algorithm. Knowl.-Based Syst. 2021, 220, 106924. [Google Scholar] [CrossRef]
- Zhang, Y.; Long, Y.; Ji, M.; Gu, J. Chaotic Sparrow Search Algorithm and Application Based on Spiral Slime Mould Algorithm. Comput. Eng. Appl. 2023, 59, 124–133. [Google Scholar] [CrossRef]
- Ding, R.; Gao, J.l.; Zhang, Q. Bald Eagle Search Algorithm Combining Adaptive Inertial Weight and Cauchy Variation. J. Chin. Comput. Syst. 2023, 44, 910–915. [Google Scholar] [CrossRef]
- Tanyildizi, E.; Demir, G. Golden Sine Algorithm: A Novel Math-Inspired Algorithm. Adv. Electr. Comput. Eng. 2017, 17, 71–78. [Google Scholar] [CrossRef]
- Li, M.; Liu, Z.; Song, H. An improved algorithm optimization algorithm based on RungeKutta and golden sine strategy. Expert Syst. Appl. 2024, 247, 123262. [Google Scholar] [CrossRef]
- Liu, C.; He, Q. Golden sine chimp optimization algorithm integrating multiple strategies. Acta Autom. Sin. 2023, 49, 2360–2373. [Google Scholar] [CrossRef]
- Zheng, J.; Wang, X.; Liu, R. ε-Differential Evolution Algorithm for Constrained Optimization Problems. J. Softw. 2012, 23, 2374–2387. [Google Scholar] [CrossRef]
- Wang, W.; Tian, W.; Xu, L.; Liu, C.; Xu, D. Mε-OIDE algorithm for solving constrained optimization problems and its application in flood control operation of reservoir group. J. Hydraul. Eng. 2023, 54, 148–158. [Google Scholar] [CrossRef]

Disclaimer/Publisher’s Note: The statements, opinions and data contained in all publications are solely those of the individual author(s) and contributor(s) and not of MDPI and/or the editor(s). MDPI and/or the editor(s) disclaim responsibility for any injury to people or property resulting from any ideas, methods, instructions or products referred to in the content. |
© 2025 by the authors. Licensee MDPI, Basel, Switzerland. This article is an open access article distributed under the terms and conditions of the Creative Commons Attribution (CC BY) license (https://creativecommons.org/licenses/by/4.0/).