Article

Perfluorooctane Sulfonate (PFOS) and Perfluorooctanoic Acid (PFOA) in the Surface Waters of China: A Meta-Analysis

1
Key Laboratory for Water Quality and Conservation of the Pearl River Delta, Ministry of Education, School of Environmental Science and Engineering, Guangzhou University, Guangzhou 510006, China
2
Graduate School of Science and Technology, Shizuoka University, 836 Ohya, Suruga-ku, Shizuoka 422-8529, Japan
3
Department of Bioenvironmental Design, Faculty of Bioenvironmental Sciences, Kyoto University of Advanced Science, Kyoto 606-8501, Japan
4
State Key Laboratory of Geohazard Prevention and Geoenvironment Protection, Chengdu University of Technology, Chengdu 610059, China
*
Authors to whom correspondence should be addressed.
Water 2025, 17(9), 1275; https://doi.org/10.3390/w17091275
Submission received: 13 February 2025 / Revised: 20 April 2025 / Accepted: 22 April 2025 / Published: 24 April 2025
(This article belongs to the Section Water Quality and Contamination)

Abstract

:
Perfluorooctanoic acid (PFOA) and perfluorooctane sulfonate (PFOS) are recognized as persistent emerging pollutants worldwide, and long-term exposure will seriously harm natural ecosystems and human health. However, as the largest producer and consumer of fluorochemicals, China has limited research on the environmental fate and influencing factors of PFOA and PFOS in surface waters. To address this gap, a meta-analysis was conducted using 34 articles related to PFAS pollution in China’s surface waters, published between 2000 and 2023, selected from the PubMed and Web of Science databases. Existing investigations indicate that the average concentrations of PFOA and PFOS in the surface water from industrial areas in southeast China are 1615.17 ng/L and 8.41 ng/L, respectively, with industrial wastewater being the primary pollution source. Meanwhile, the analysis revealed that PFOA and PFOS concentrations are positively correlated with surface water pH but negatively correlated with dissolved oxygen, total organic carbon of sediment, and salinity. Additionally, monitoring data show that PFOA/PFOS pollution levels in European countries have declined since 2015, which is attributed to restrictive measures on the usage of PFAS. In conclusion, this study provides a scientific basis for developing PFOA/PFOS pollution control and management strategies for surface water in China.

1. Introduction

Perfluorinated and polyfluorinated compounds (PFAS) are a class of synthetic chemicals known for their thermal and chemical stability, corrosion resistance, and exceptional surface activity [1]. Due to their superior performance and diverse varieties, PFAS products have seen significant development in China in recent years and are widely used in various aspects of human life, such as lubricants, paints, polishes, firefighting foams, food packaging, and coatings [2,3,4]. However, PFAS are referred to as “forever chemicals” because they contain carbon–fluorine (C-F) bonds with extremely high bond energy [5,6], making their end product, perfluoroalkyl acids (PFAAs), nearly non-degradable in the environment [7]. As a result, PFOA and PFOS, as the most widely used PFAS, have been frequently detected in a variety of environmental samples around the world.
Numerous studies have demonstrated the negative effects of PFOA and PFOS on various animals, including aquatic organisms such as daphnia [8] and terrestrial organisms such as earthworms [9] and nematodes [10]. Meanwhile, given their environmental persistence (half-lives of decades), PFOA and PFOS can easily biomagnify through the food chain and bioaccumulate in the human body, posing long-term health risks [11,12]. Previous studies have found that the harmful effects of PFOA and PFOS on human health include developmental toxicity, lower birth weight, decreased fertility, and decreased immune system and antibody formation [13]. Therefore, the environmental distribution of PFOA and PFOS poses significant ecological and health risks.
In recent years, increasing attention has been paid to the sources, migration, and residual levels of PFOA and PFOS in the environment. Since the aquatic environment is the primary habitat of PFOA and PFOS, extensive investigations have been conducted on the pollution situation in surface water [14]. Previous studies have suggested that the sources of PFOA and PFOS in surface water are usually closely related to human activities, such as the discharge of production waste from fluorine chemical enterprises and the leaching of consumer products containing PFOA and PFOS [15]. Additionally, the transformation of PFOA and PFOS precursors contributes significantly to their presence in surface water [16,17]. Regarding the environmental migration of PFOA and PFOS, their rapid movement through surface runoff greatly extends the pollution range of them. Meanwhile, many studies have shown that sedimentation and percolation processes cause PFOA and PFOS in surface water to penetrate into soil and further pollute the groundwater environment [18].
Surface water pollution caused by PFOA and PFOS has also attracted significant research attention in China. A study on the Yellow River in Shandong Province revealed the PFOA concentration reaching 34.1 ng/L in water samples, substantially exceeding global background levels [19]. Similarly, in the Jinjiang River basin located in Southeastern China, PFOA and PFOS were detected in most water samples with concentrations averaging 15.1 ng/L and 7.01 ng/L, respectively [20]. However, current research primarily focuses on contamination monitoring, while systematic investigations into the environmental fate and influencing factors of PFOA and PFOS in surface waters remain limited.
In this study, 34 articles related to PFAS pollution of surface waters in China published between 2000 and 2023 were selected from the PubMed and Web of Science databases for the meta-analysis to address the above research gaps. This research focuses on analyzing spatial and temporal trends of PFOA and PFOS concentrations across China’s surface water and examining their relationship with key parameters, including pH, dissolved oxygen (DO), salinity, and total organic carbon of sediment (TOCs). Since meta-analysis is a systematic review method based on data collected by previous researchers, it provides an evidence-based perspective for assessing PFAS pollution impacts on surface water. In conclusion, the findings contribute to the sustainable PFAS management strategies and offer valuable insights for policymakers, industry professionals, and researchers in China and other regions confronting PFAS contamination.

2. Materials and Methods

2.1. Data Assembly

To study PFOA and PFOS in surface water, we conducted a targeted literature search of the PubMed and Web of Science databases up to 9 October 2023. The following search phrases were used: (((((polyfluoroalkyl substances[Title/Abstract]) OR (perfluoroalkyl substances[Title/Abstract])) AND (concentration[Title/Abstract])) AND ((water[Title/Abstract]) OR (stream[Title/Abstract]) OR (river[Title/Abstract]) OR (wetland[Title/Abstract]) OR (lake[Title/Abstract]) OR (sea[Title/Abstract]))) AND (China[Title/Abstract])) for PubMed database; (((TI = (perfluoroalkyl substances) OR TI = (polyfluoroalkyl substances)) AND TI = (concentration)) AND (TI = (water) OR TI = (stream) OR TI = (river) OR TI = (wetland) OR TI = (lake) OR TI = (sea))) for Web of Science database. A total of 107 publications were screened, and finally 34 publications were retained based on the following criteria: (1) only English papers were retained; (2) duplicate papers were removed; (3) irrelevant papers were carefully eliminated after reading the abstract; (4) papers without PFOA and PFOS sampling point data were deleted after reading the full text in detail; (5) papers with unknown concentrations of PFOA and PFOS in the water samples were removed after reading the supplementary documents; and (6) non-inland water sample data were removed.
From the selected publications, we extracted the following information: sampling time, location, the river in which the sampling site was located, hydrological parameters (pH, DO, salinity, and TOCs), and concentrations of PFOA and PFOS. PFOA and PFOS were detected in various water bodies such as open trenches, runoff in reservoirs, lakes, wetlands, rivers, estuaries, creeks, and agricultural areas during both the dry and rainy seasons. Plot Digitizer 4.2 software was used to extract values from charts and data from supplementary files.

2.2. Data Analysis

ArcGIS 3.4.2 software was used to geospatially represent the sampling sites on a map of China based on their longitude and latitude parameters (Figure 1). In cases where longitude and latitude parameters were not available, the sampling site names were used to extract the necessary geographical coordinates from Satellite Maps, ensuring accurate spatial representation of the data. The concentrations of PFOA and PFOS were standardized to ng/L for further analysis. Data analysis and meta-analysis were performed using the JMP statistical 14.0 software. The “Y-distribution” platform within JMP was used to summarize the concentration range and average concentration of PFOA and PFOS. Additionally, the “Fit Y by X” platform was used to test for significant differences between PFOA and PFOS concentrations and various environmental factors (pH, DO, salinity, and TOCs).

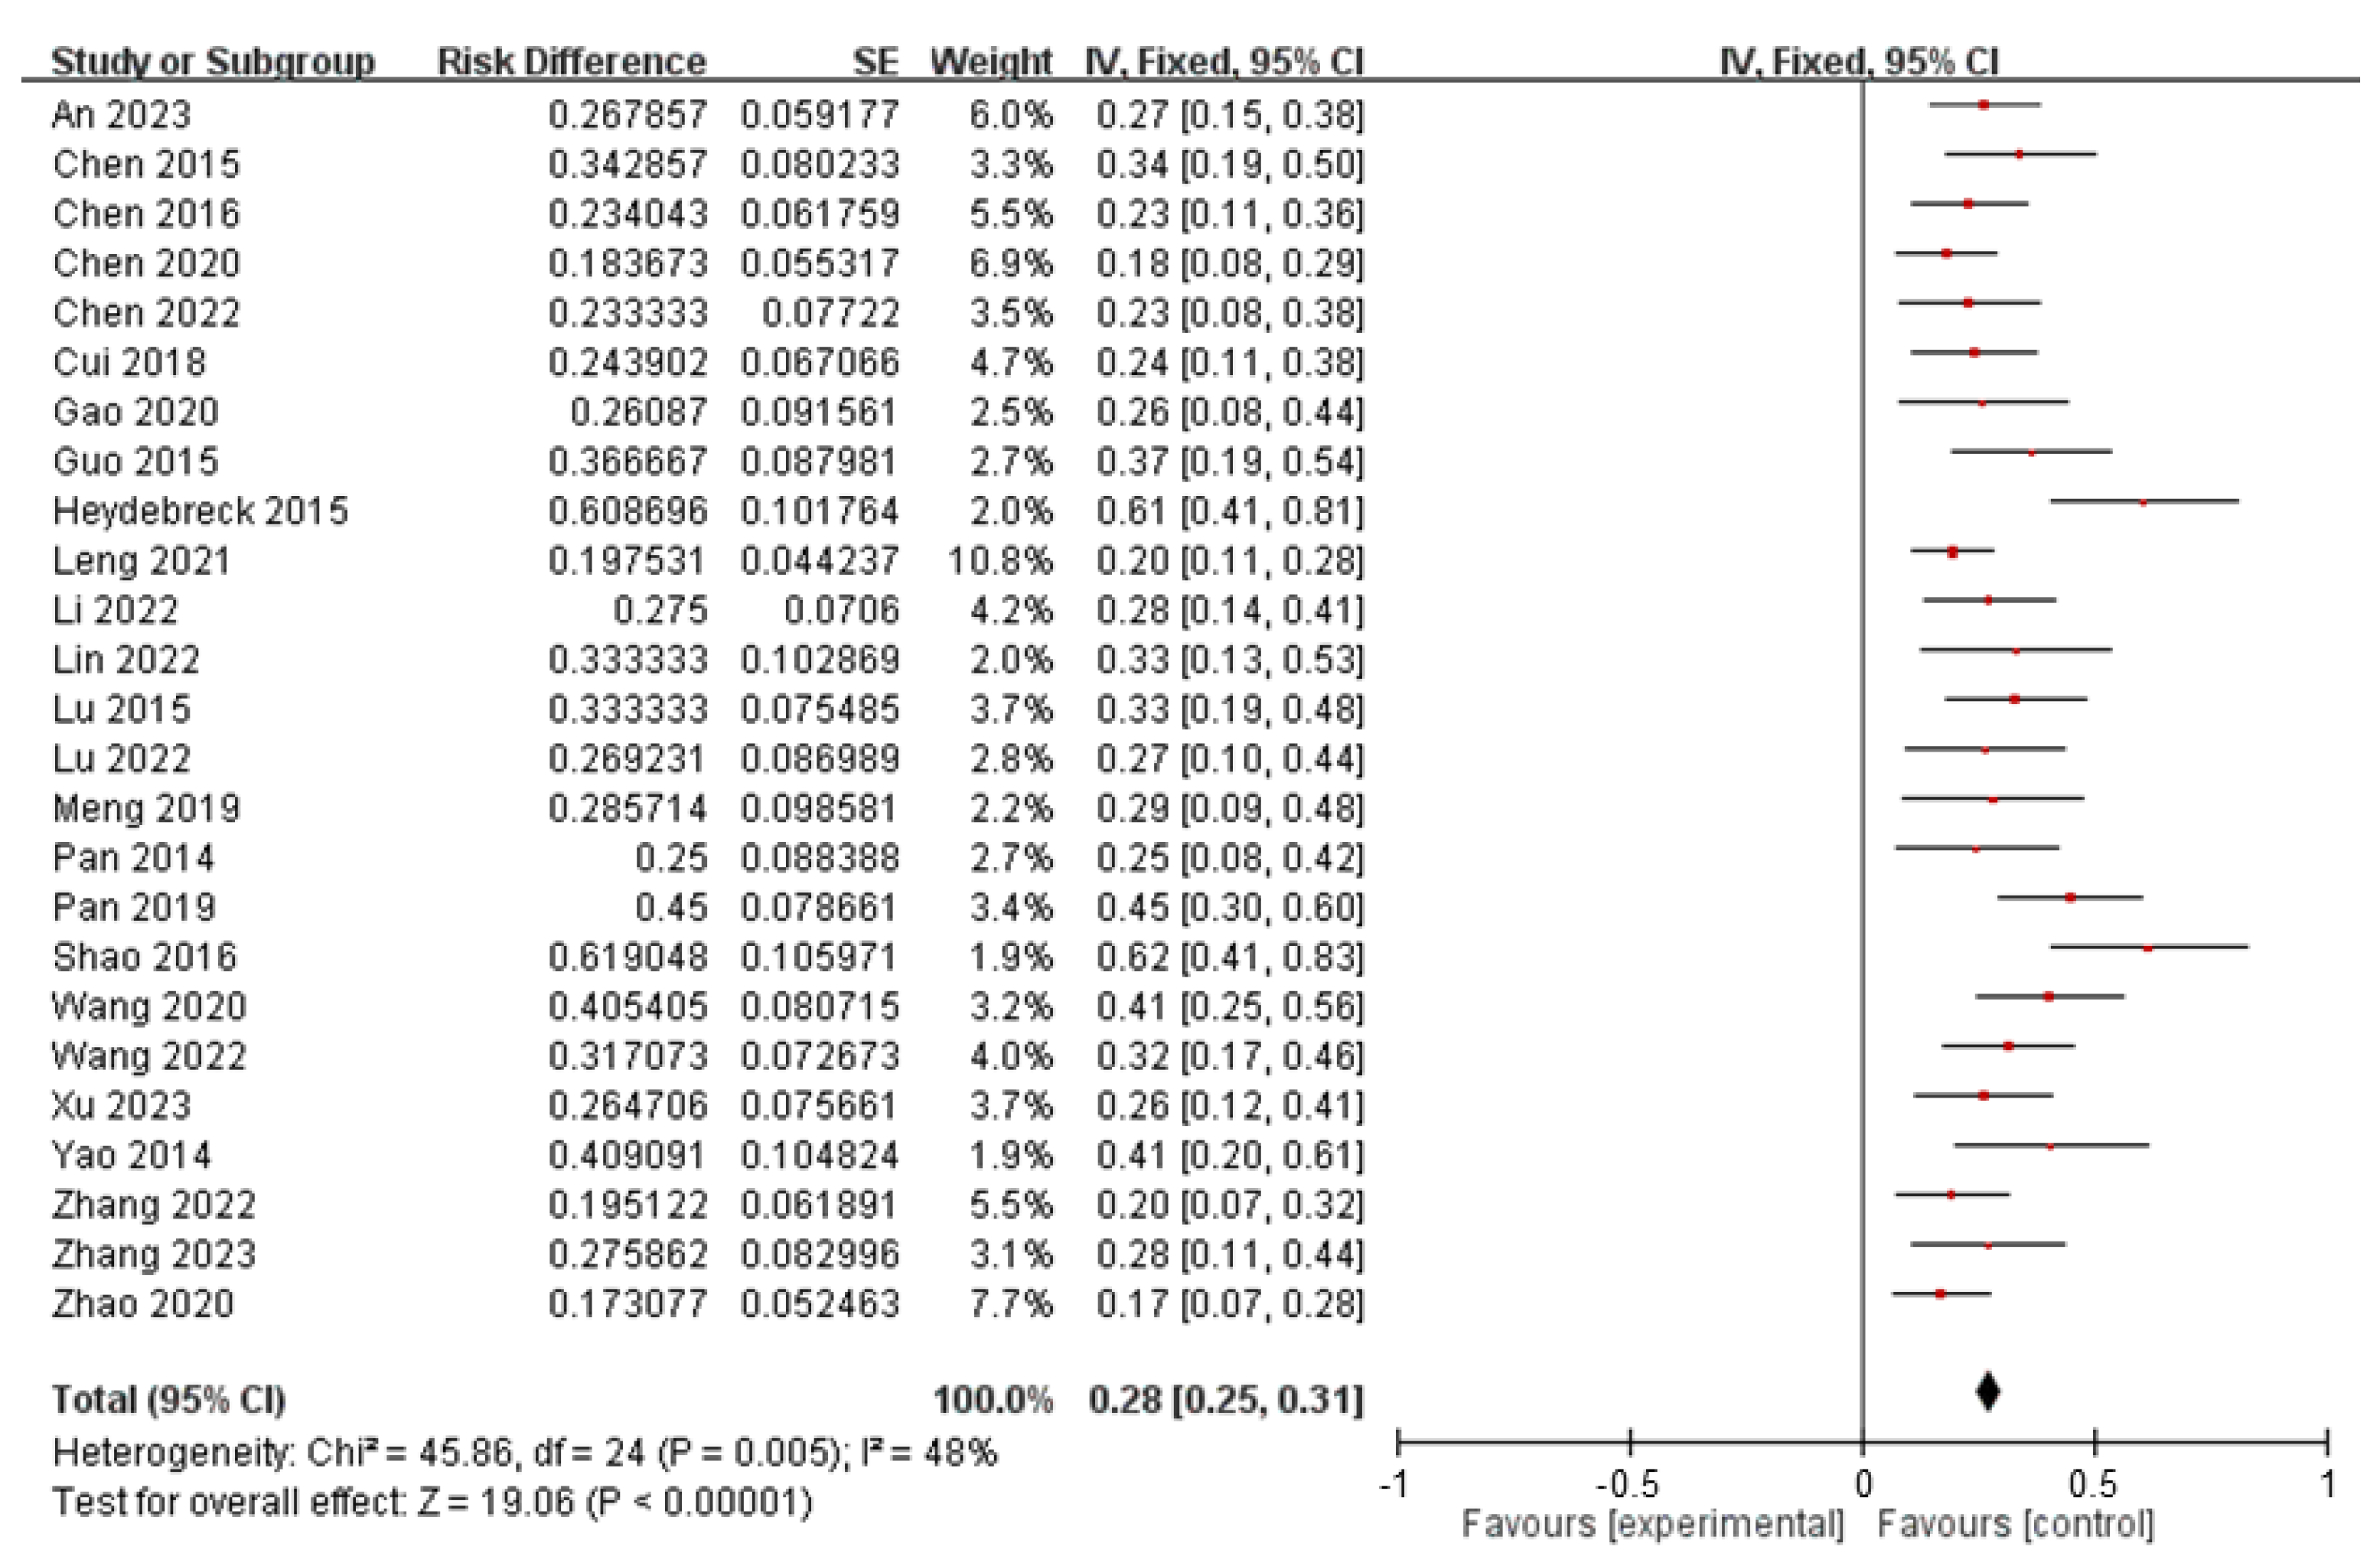
2.3. Heterogeneity Analysis and Publication Bias Assessment

In this study, heterogeneity and publication bias were assessed using Review Manager 5.3 software. To ensure the reliability of the meta-analysis, heterogeneity analysis and publication bias assessment were conducted only for studies with a sample size of ≥20. As this study was a single-group meta-analysis, event incidence rates (P) and standard error (SE) for each study were calculated as follows:
P = X n
S E = P ( 1 P ) / n
where n is the sample size, X is the number of events that occur (the event threshold was set at 70 ng/L for PFOA and 40 ng/L for PFOS).
Heterogeneity was determined using the I2 statistic as shown in Figure 2. The I2 value was 48% (less than 50%), indicating low heterogeneity. Therefore, a fixed effect model can be applied to estimate the summary effect size (represented as the mean effect distribution across included studies). In addition, the publication bias was evaluated via funnel plot analysis (Figure 3). The symmetrical distribution of sample points around the midline suggests no significant publication bias in the included studies.

3. Results and Discussion

3.1. Spatial Distribution Patterns

This study aimed to assess the prevalence and distribution of PFOA/PFOS contamination in China’s water bodies, with a focus on the eastern and southern regions of China, particularly the middle and lower reaches of the Yangtze and Yellow Rivers, as these areas are key industrial bases in China. Over 1000 water samples were collected from sampling points near PFOA/PFOS producing industries for analysis in this study. The concentration of PFOA/PFOS in water bodies across Guangdong, Zhejiang, Shandong, and Hebei provinces.
In addition, Figure 4 depicts the mean concentration distribution of PFOA and PFOS in water samples (measured in ng/L), and Table 1 summarizes detailed statistical data on these concentrations. PFOA levels ranged from 0.0001 to 578,970.00 ng/L, with a median concentration of 8.07 ng/L and a mean concentration of 1615.17 ng/L, while PFOS levels ranged from 0.003 to 1725.37 ng/L, with a median of 1.86 ng/L and a mean of 8.41 ng/L. Among the 34 studies reviewed, seven reported PFOA/PFOS concentrations exceeding 300 ng/L at various sampling points, including rivers/lakes such as Dongzhulong River, Baiyangdian Lake, and Xiaoqing River [21,26,27,46,47,48,49].
Considering that most of these sampled rivers supply water to surrounding towns, it is necessary to correlate the investigation results with health-based guidance levels for PFOA and PFOS. Although the Guidelines for Drinking-Water Quality developed by the World Health Organization (WHO) have not yet established limits of PFOA and PFOS, many developed countries have taken the lead. Canada recently proposed a limit of 30 ng/L for total PFAS based on a review of technical feasibility [50], while the U.S. EPA set limits of 4 ng/L for both PFOA and PFOS [51]. While the applicability of these standards to China requires further exploration, the current status of PFOA/PFOS pollution in China’s surface waters warrants urgent attention. Overall, establishing science-based regulatory standards for PFOS and PFOS in water systems is critical to safeguarding public health and aquatic ecosystems in China.

3.2. Pollution Sources Analysis

Pollutant tracing is central to solving environmental pollution problems, as it enables accurate management of PFOA/PFOS and shifts environmental governance from passive response to active prevention. The spatial distribution of PFOA/PFOS pollution reveals that local pollution hotspots are closely related to industries with significant PFAS emissions, such as petrochemical processing, electronics manufacturing, and steel production. For example, the maximum PFOA concentration recorded was 578,970.00 ng/L in the Xiaoqing River, which is attributed to the intensive fluoropolymer industry near the river [21]. Meanwhile, it is reported that the Xiaoqing River area also serves as a major hub for fluorinated refrigerants and polytetrafluoroethylene (PTFE) production [52]. In addition, Baiyangdian Lake, the largest freshwater wetland in Hebei Province, also faces severe PFOA and PFOS pollution, with PFOA and PFOS concentrations reaching 8397.23 ng/L and 1478.03 ng/L, respectively [26]. It was found that the concentrations of PFOA and PFOS were significantly different among the three tributaries of Baiyangdian Lake, and the highest concentrations of PFOA and PFOS were found in the Fuhe River. This is because the Fuhe River is located approximately 3 km downstream from one of the largest manufacturers of photographic film in China, and photographic lithography is recognized as a significant source of PFOS emissions [53,54].
In conclusion, industrial wastewater is the primary source of PFOA and PFOS contamination in surface waters. Stringent control of industrial wastewater discharge represents the most beneficial way to reduce environmental contamination by PFOS/PFOA in China. These findings highlight the urgent need for industry-specific regulations to control PFAS emissions at sources.

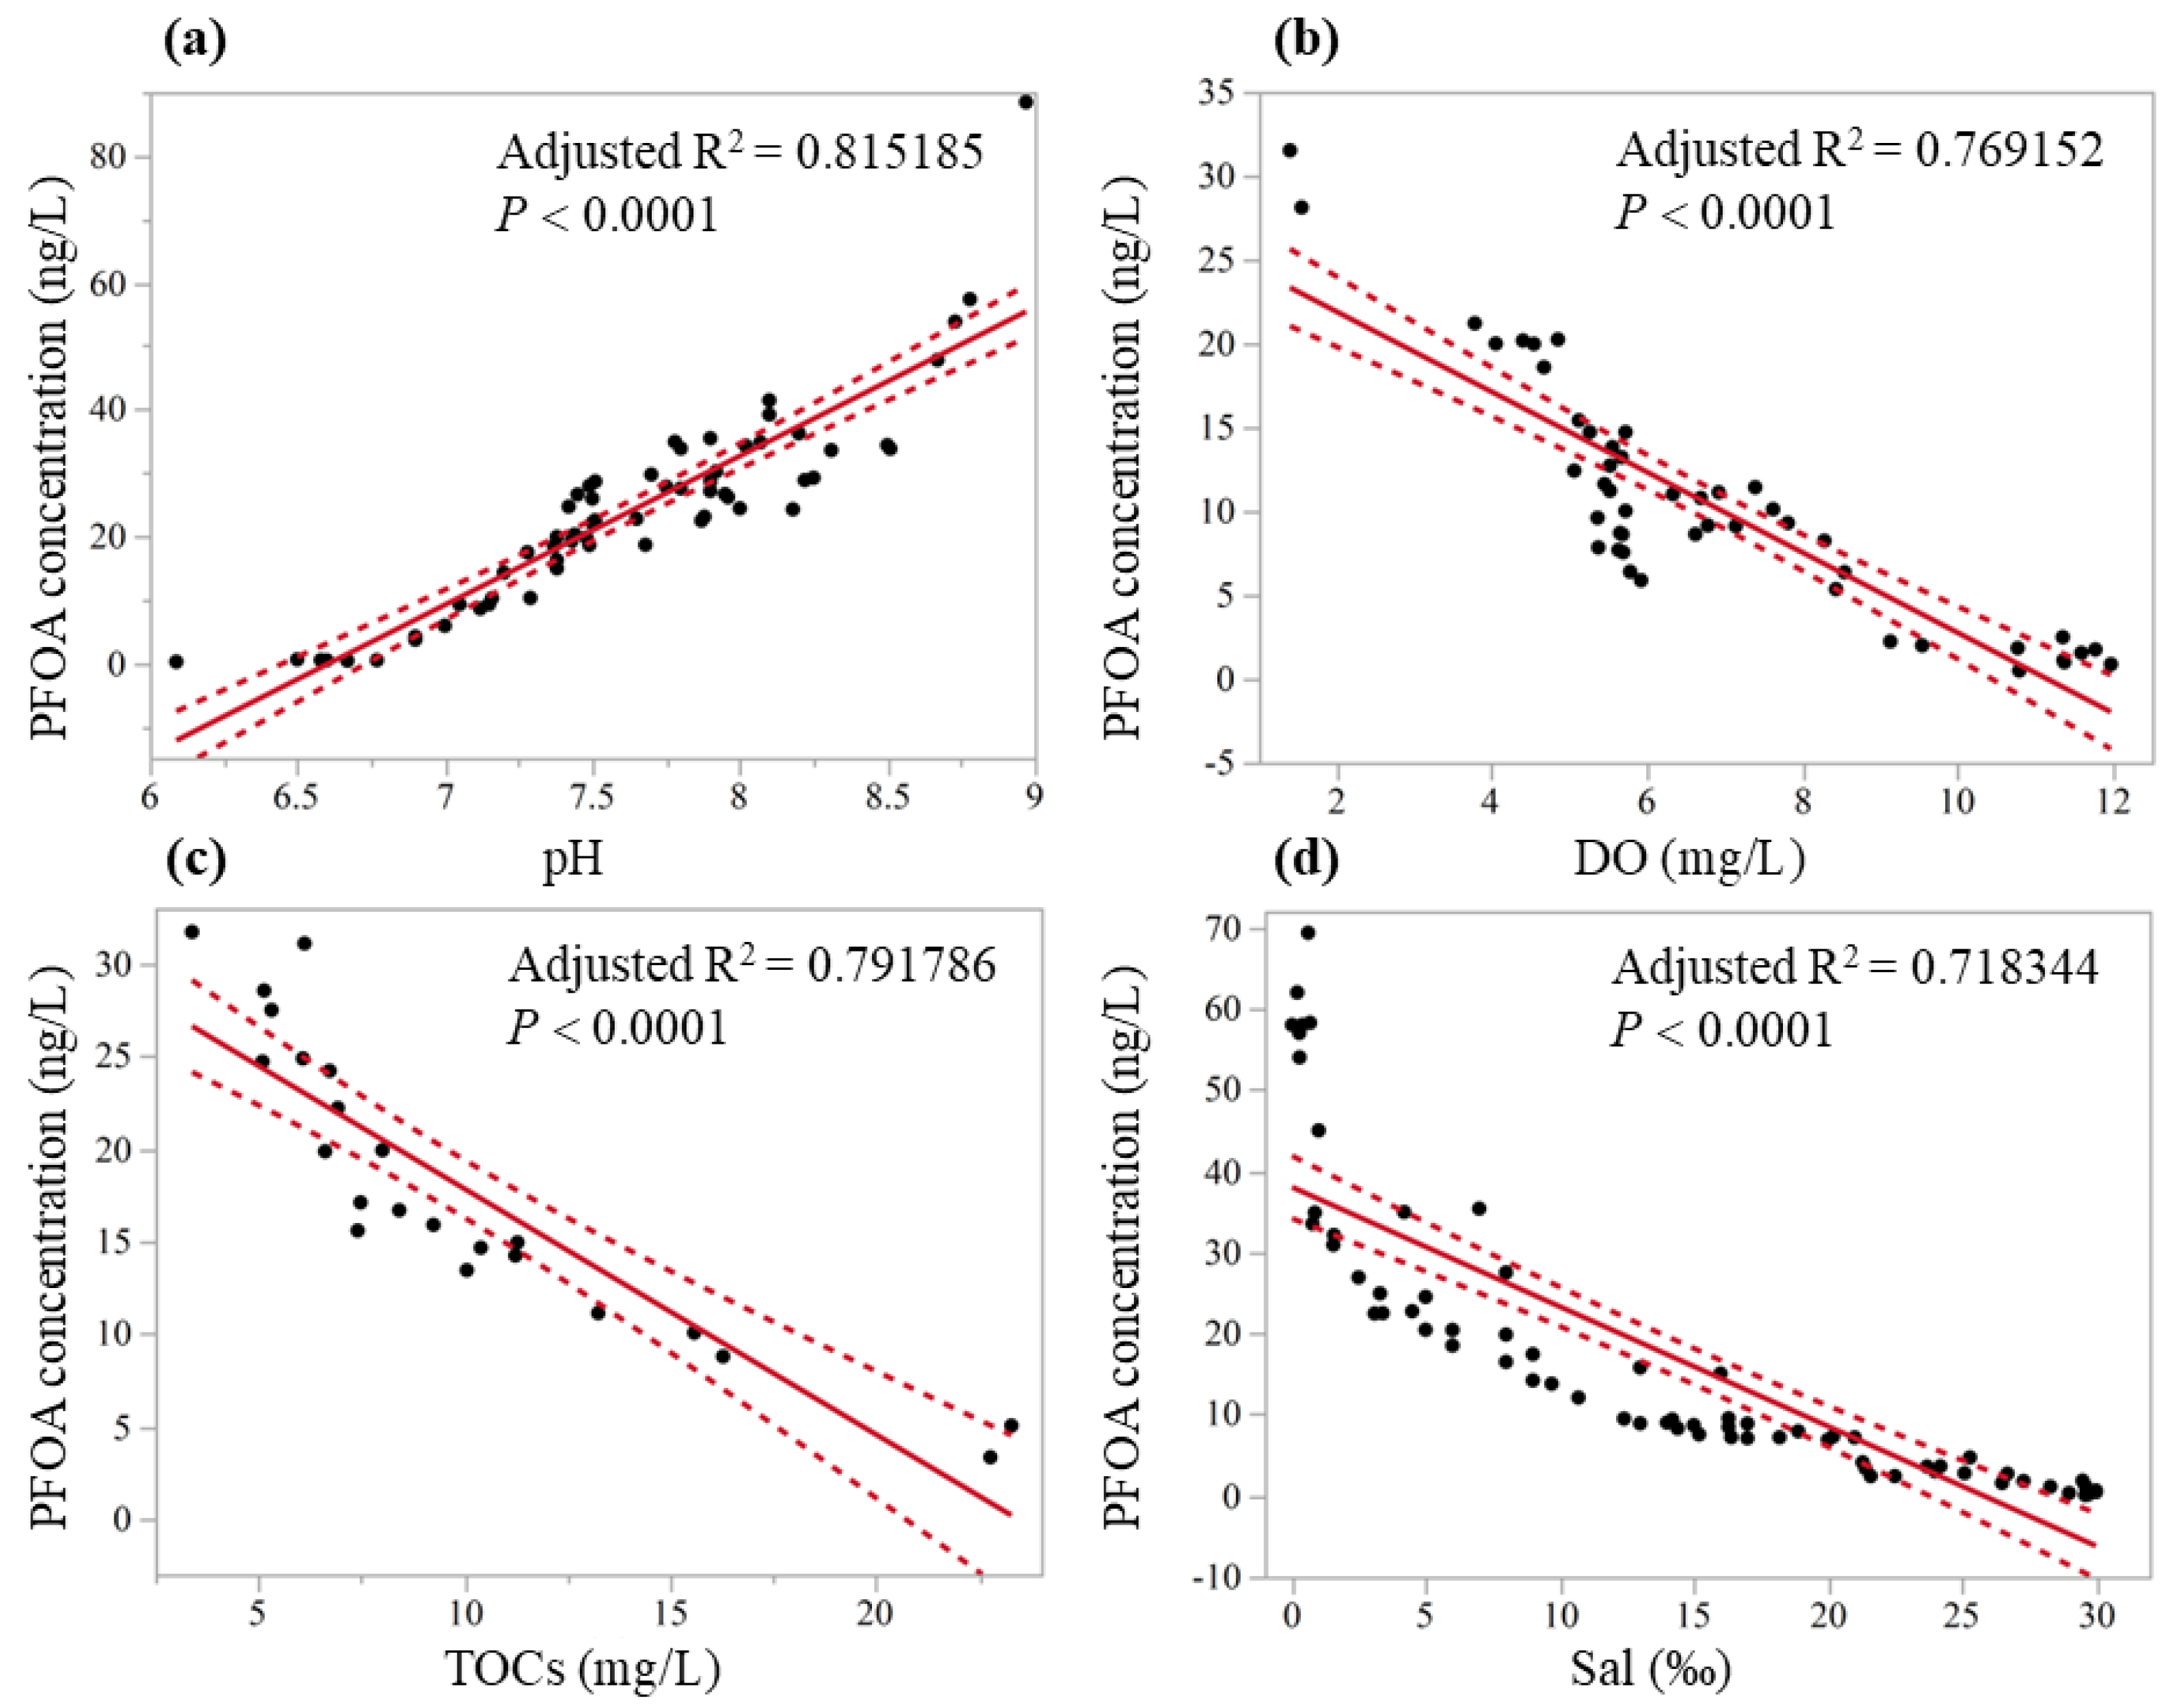
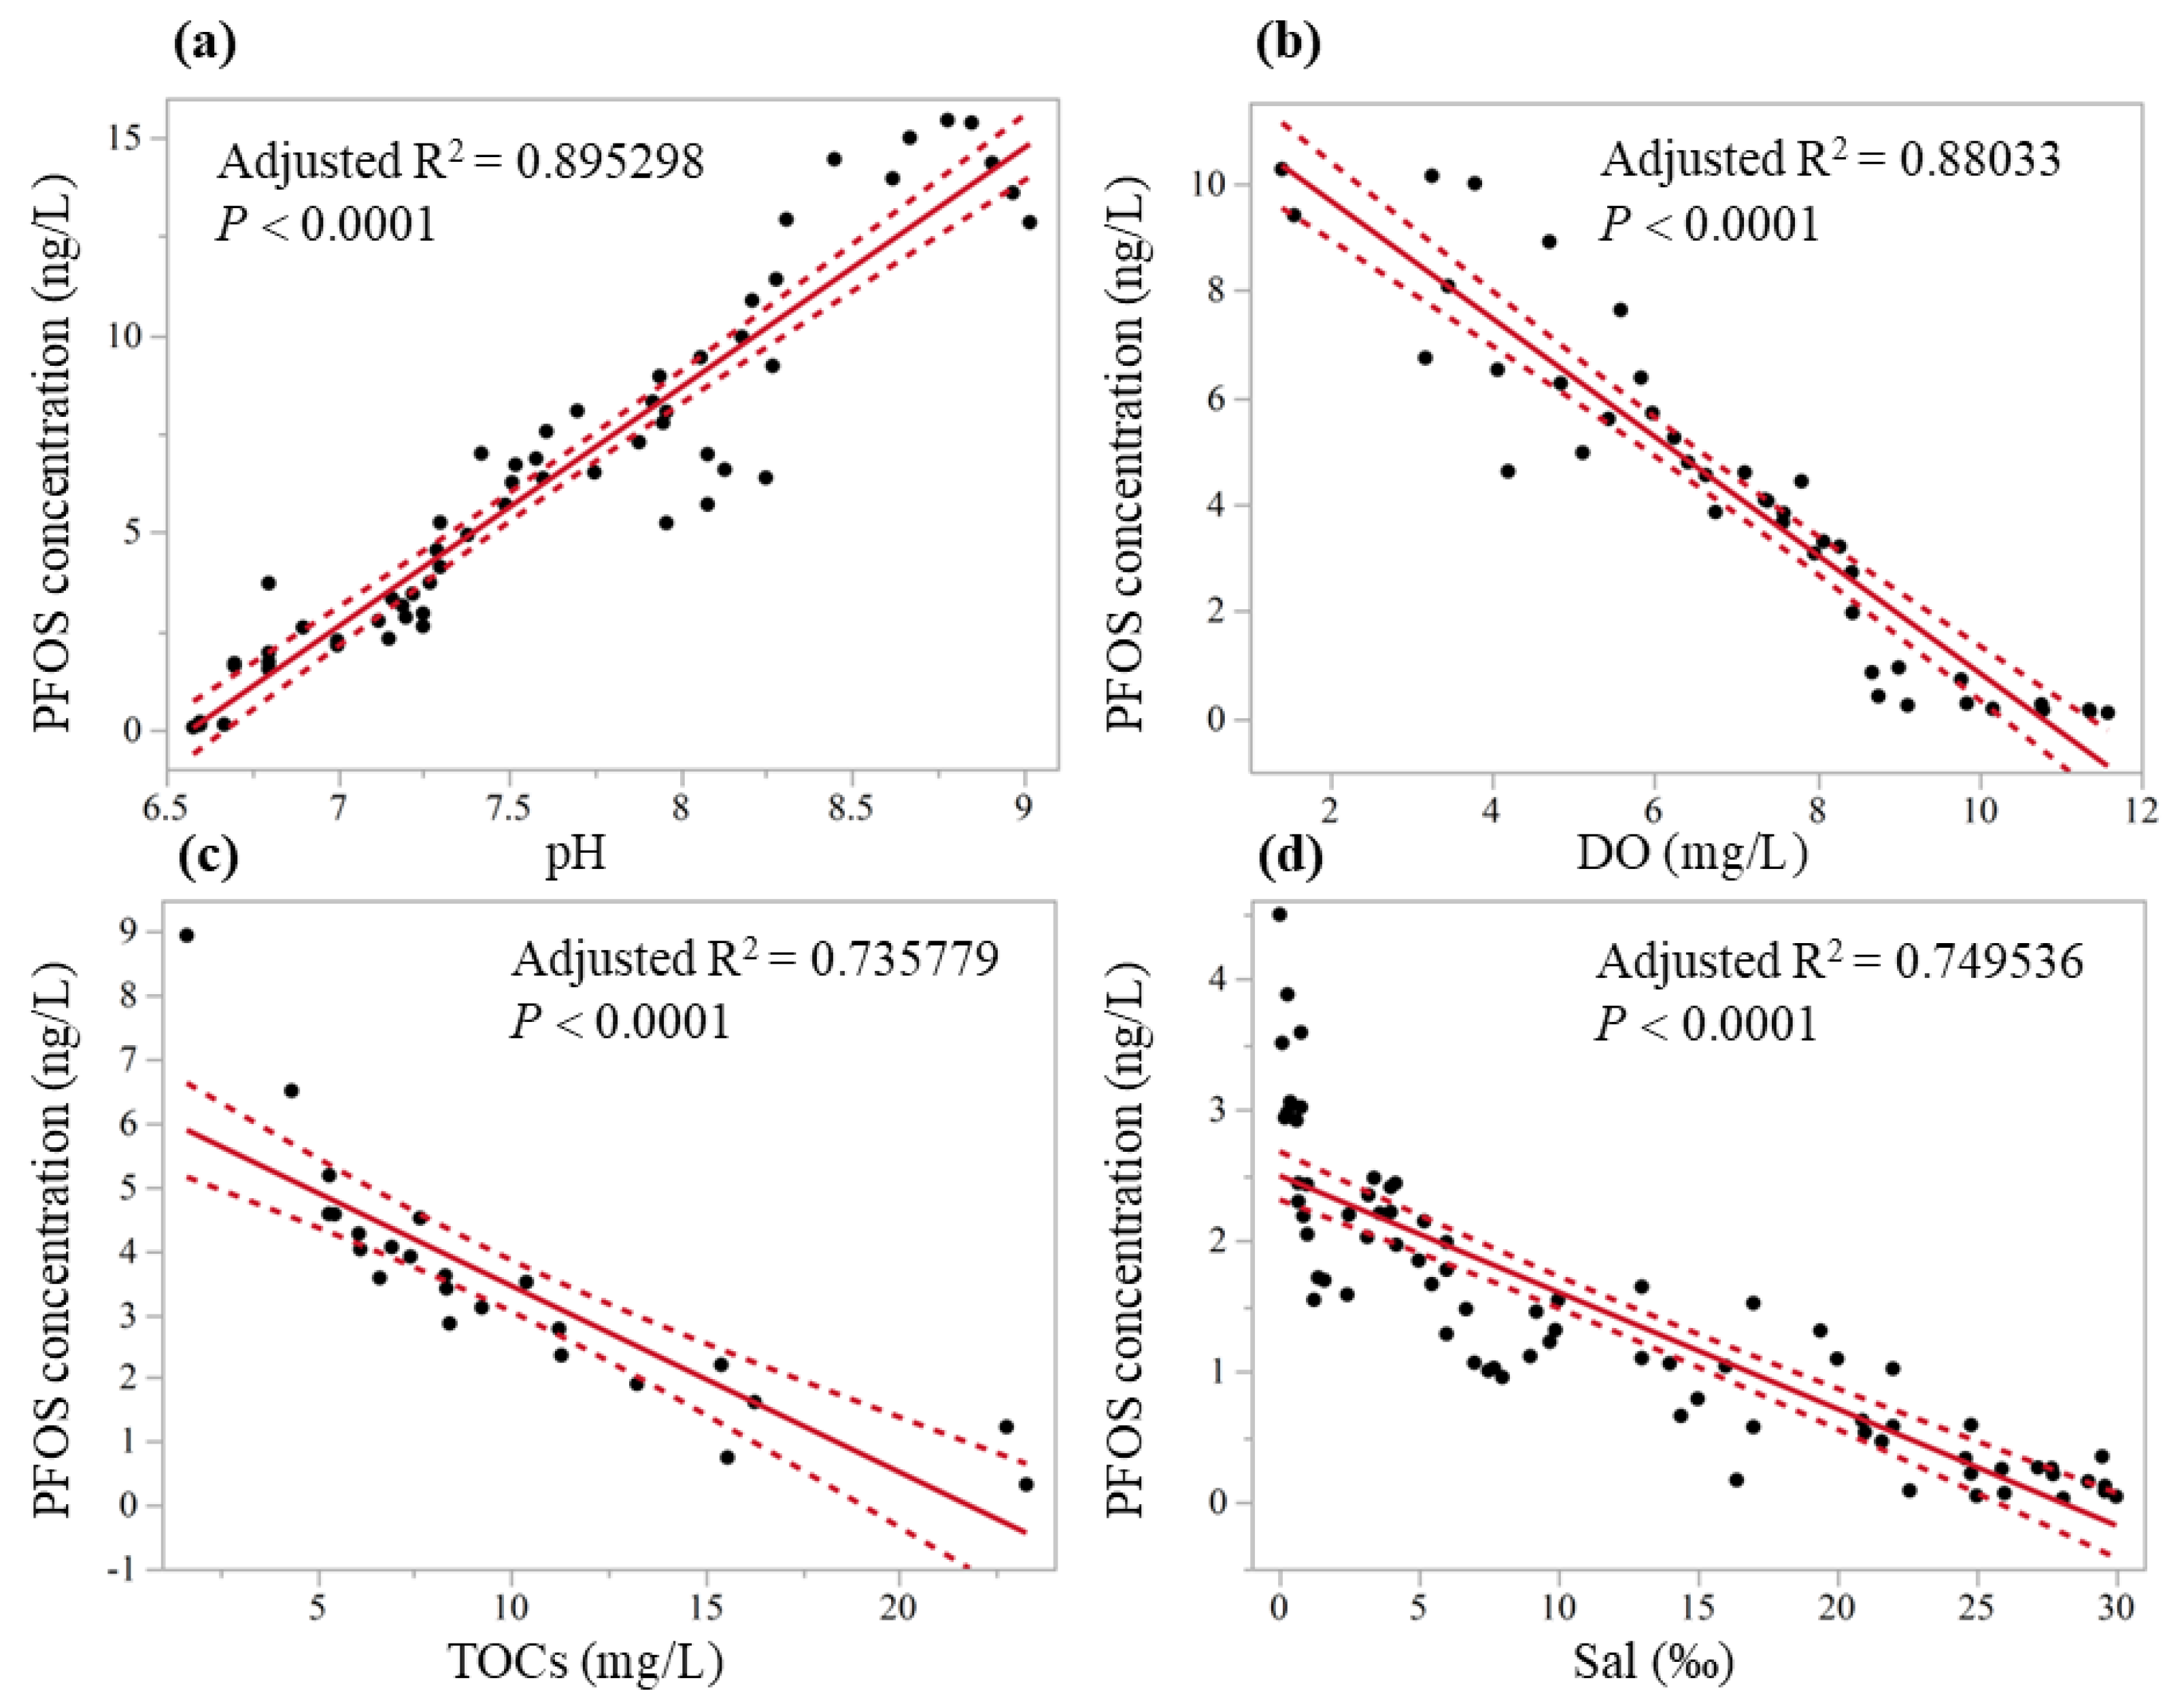
3.3. Correlation Between Pollution and Hydrological Parameters

Previous studies have indicated that the surface water pollution situation has a significant correlation with environmental parameters, and the evaluation of environmental factors is an important means to analyze pollution levels [48,55]. Therefore, to better clarify the migration and transformation mechanisms of PFOA and PFOS in surface water, this study collected key parameters such as pH, dissolved oxygen (DO), salinity, and total organic carbon of sediments (TOCs) from 34 selected studies and analyzed their correlation with PFOA/PFOS concentrations in surface water (Figure 5 and Figure 6).
The one-way analysis of variance results showed that the concentration of PFOA/PFOS in surface water was positively correlated with pH and negatively correlated with DO, TOCs, and salinity (Table 2 and Table 3). Due to the absorption of PFOA and PFOS by suspended solids and sediments, previous studies have suggested that the increase in PFOA/PFOS concentrations in surface water with rising pH is primarily attributed to the effect of pH on electrostatic attraction [56]. When pH rises, the surface charge of suspended solids and sediments shifts in a negative direction, which weakens the electrostatic attraction between them and the anionic PFOS/PFOA, thereby reducing their adsorption capacity of PFOA and PFOS [57]. Similarly, the decrease in PFOA/PFOS concentrations with the increase in TOCs is also closely related to sediment adsorption because sediments with higher TOC content have a stronger ability to adsorb persistent organic pollutants [58].
Furthermore, as shown in Figure 5 and Figure 6, PFOA/PFOS concentrations exhibit a clear downward trend with increasing salinity. This phenomenon can be explained by the salting-out effect [59], where the aqueous solubility of organic chemicals decreases with higher dissolved ion content. For example, the solubility of PFOS is 370 mg/L in freshwater but decreases to 25 mg/L in seawater. Therefore, increased salinity promotes PFOA and PFOS removal from the water and becomes irreversibly bound to sediments [60].
Additionally, the negative correlation between PFOA/PFOS concentration and DO has been reported in previous studies [61], which is mainly due to oxygen expenditure caused by chemical and biological degradation of pollutants, leading to a decrease in DO.
In summary, the correlation between the hydrological parameters investigated in this study and PFOA/PFOS concentrations in surface water is significant. Clarifying these interactions has important implications, including: (1) helping trace the input routes of PFOA and PFOS and identify the sources; (2) understanding the diffusion pathways and settlement behavior of PFOA and PFOS in surface water, thereby revealing their migration mechanisms; and (3) predicting contamination extent and high-risk zones to guide optimized monitoring programs. Overall, this analysis supports precise pollution control and targeted remediation strategies.

3.4. Comparison with Global Data

To provide a better reference for addressing PFOA/PFOS pollution in China’s surface water, this study analyzed the contamination levels in major countries across different regions. Among Asian countries, Japan and South Korea initiated investigations into surface water PFOA/PFOS pollution earlier than China [62]. For instance, researchers recorded a PFOA concentration of 2568 ng/L in the Katsura River within Japan’s Yodo River Basin, attributing the primary source to effluent discharges from a sewage treatment plant [63]. In a nationwide survey of South Korea, while PFOA/PFOS pollution was more pronounced in Gyeongsang Province due to the concentration of heavy industry, the average concentrations of PFOA and PFOS in all samples ranged from 1 to 7 ng/L and 1 to 22 ng/L, respectively, which were less than acceptable guideline values [64]. This suggests that South Korea is not a hot spot for PFOA and PFOS pollution compared to China and Japan.
In European countries, PFOA and PFOS concentrations in surface water have declined significantly in recent years. For example, in Germany’s Elbe River Basin, the annual average concentrations of PFOA and PFOS peaked during 2012–2014 and maintained decreasing trends after 2015. By 2024, the average concentrations dropped to 3.41 ng/L (PFOA) and 4.08 ng/L (PFOS), with annual decline rates of 4.98% and 7.36%, respectively [65]. Similarly, studies comparing data from the Danube River in 2007, 2013, 2019, and 2025 confirmed this downward trend, likely linked to the restrictive measures on the usage of PFAS in Europe [66]. In contrast, Australia has also banned the use of some types of PFAS. Unlike the blanket ban on all PFAS in Europe, Australia only has regulations on specific PFAS (e.g., PFOS, PFOA, and PFHxS). Consequently, while PFOA and PFOS concentrations in Melbourne’s surface water remain extremely low, the average concentration of PFAS still reaches 78.6 ng/L [67].
In summary, to promote the governance of PFOA and PFOS in surface water, policymakers should strengthen emission restrictions and encourage manufacturers to avoid using any PFAS or other potentially harmful compounds.

4. Conclusions

This study summarizes 34 publications analyzing the PFOA/PFOS pollution situation in China’s surface waters, and the results show average concentrations of 1615.17 ng/L for PFOA and 8.41 ng/L for PFOS. Spatial distribution of PFOA/PFOS pollution indicates that wastewater discharge is the primary source of these compounds, as pollution hotspots correlate strongly with PFAS-emitting industries. Linear regression analysis reveals that PFOA/PFOS concentrations increase with pH but decrease with DO, TOCs, and salinity. Correlation analysis between hydrological parameters and concentrations aids in tracing and targeted remediation of PFOA and PFOS. Monitoring of major European rivers suggests that PFAS use restrictions help mitigate PFOA/PFOS pollution. Thus, controlling these pollutants in China requires strict emission standards to limit releases at the source. In conclusion, this study elucidates the environmental behavior and influencing factors of PFOA and PFOS in China’s surface water, providing a scientific basis for policy-making and pollution control.

Author Contributions

Conceptualization, M.C., J.W. and T.X.; Methodology, M.C., R.Y., J.W. and Y.J.W.; Software, R.Y.; Formal analysis, M.C. and N.W.; Investigation, M.C., R.Y. and N.W.; Resources, J.W., M.Y., N.W., Y.J.W. and T.X.; Writing—original draft, M.C., J.W. and Y.J.W.; Supervision, M.Y. and T.X.; Project administration, J.W. and T.X.; Funding acquisition, J.W. and M.Y. All authors have read and agreed to the published version of the manuscript.

Funding

This work was funded by the Postdoctoral Scientific Research Program of Guangzhou (No. 624021-58), Guangdong Basic and Applied Basic Research Foundation (No. 2024A1515030098), National Natural Science Foundation of China (NSFC) Young Investigator Grant Program (No. 42407169), China Postdoctoral Science Foundation (No. 2024M760623), Kyoto University of Advanced Science: Overseas expansion type research and start up projects, and Asahi Shuzo Foundation Grant 2025.

Data Availability Statement

No new data were created or analyzed in this study. Data sharing is not applicable to this article.

Conflicts of Interest

The authors declare no conflict of interest.

References

  1. Wang, Z.; Buser, A.M.; Cousins, I.T.; Demattio, S.; Drost, W.; Johansson, O.; Ohno, K.; Patlewicz, G.; Richard, A.M.; Walker, G.W.; et al. A New OECD Definition for Per- and Polyfluoroalkyl Substances. Environ. Sci. Technol. 2021, 55, 15575–15578. [Google Scholar] [CrossRef] [PubMed]
  2. Abunada, Z.; Alazaiza, M.Y.D.; Bashir, M.J.K. An Overview of Per- and Polyfluoroalkyl Substances (PFAS) in the Environment: Source, Fate, Risk and Regulations. Water 2020, 12, 3590. [Google Scholar] [CrossRef]
  3. Dixit, F.; Dutta, R.; Barbeau, B.; Berube, P.; Mohseni, M. PFAS removal by ion exchange resins: A review. Chemosphere 2021, 272, 129777. [Google Scholar] [CrossRef] [PubMed]
  4. Zhang, L.; Wang, M.; Zhang, M.; Yang, D. Per- and polyfluoroalkyl substances in Chinese surface waters: A review. Ecotoxicol. Environ. Saf. 2023, 262, 115178. [Google Scholar] [CrossRef]
  5. D’eon, J.C.; Mabury, S.A. Exploring Indirect Sources of Human Exposure to Perfluoroalkyl Carboxylates (PFCAs): Evaluating Uptake, Elimination, and Biotransformation of Polyfluoroalkyl Phosphate Esters (PAPs) in the Rat. Environ. Health Perspect. 2011, 119, 344–350. [Google Scholar] [CrossRef]
  6. Kiplinger, J.L.; Richmond, T.G.; Osterberg, C.E.J.C.R. Activation of Carbon-Fluorine Bonds by Metal Complexes. Chem. Rev. 1994, 94, 373–427. [Google Scholar] [CrossRef]
  7. Washington, J.W.; Jenkins, T.M.; Rankin, K.; Naile, J.E. Decades-Scale Degradation of Commercial, Side-Chain, Fluorotelomer-Based Polymers in Soils and Water. Environ. Sci. Technol. 2015, 49, 915–923. [Google Scholar] [CrossRef]
  8. Logeshwaran, P.; Sivaram, A.K.; Surapaneni, A.; Kannan, K.; Naidu, R.; Megharaj, M. Exposure to perfluorooctanesulfonate (PFOS) but not perflurorooctanoic acid (PFOA) at ppb concentration induces chronic toxicity in Daphnia carinata. Sci. Total Environ. 2021, 769, 144577. [Google Scholar] [CrossRef]
  9. Jin, B.; Mallula, S.; Golovko, S.A.; Golovko, M.Y.; Xiao, F. In Vivo Generation of PFOA, PFOS, and Other Compounds from Cationic and Zwitterionic Per- and Polyfluoroalkyl Substances in a Terrestrial Invertebrate (Lumbricus terrestris). Environ. Sci. Technol. 2020, 54, 7378–7387. [Google Scholar] [CrossRef]
  10. Chen, S.; Jiao, X.-C.; Gai, N.; Li, X.-J.; Wang, X.-C.; Lu, G.-H.; Piao, H.-T.; Rao, Z.; Yang, Y.-L. Perfluorinated compounds in soil, surface water, and groundwater from rural areas in eastern China. Environ. Pollut. 2016, 211, 124–131. [Google Scholar] [CrossRef]
  11. Kwak, J.I.; Lee, T.-Y.; Seo, H.; Kim, D.; Kim, D.; Cui, R.; An, Y.-J. Ecological risk assessment for perfluorooctanoic acid in soil using a species sensitivity approach. J. Hazard. Mater. 2020, 382, 121150. [Google Scholar] [CrossRef] [PubMed]
  12. Yang, M.; Ye, J.; Qin, H.; Long, Y.; Li, Y. Influence of perfluorooctanoic acid on proteomic expression and cell membrane fatty acid of Escherichia coli. Environ. Pollut. 2017, 220, 532–539. [Google Scholar] [CrossRef] [PubMed]
  13. Cheng, W.; Yu, Z.; Feng, L.; Wang, Y. Perfluorooctane sulfonate (PFOS) induced embryotoxicity and disruption of cardiogenesis. Toxicol. Vitr. 2013, 27, 1503–1512. [Google Scholar] [CrossRef]
  14. Alam, M.S.; Abbasi, A.; Chen, G. Fate, distribution, and transport dynamics of Per- and Polyfluoroalkyl Substances (PFASs) in the environment. J. Environ. Manag. 2024, 371, 123163. [Google Scholar] [CrossRef]
  15. Tri, D.V.; Anh, N.T.; Luu, T.L.; Trippel, J.; Wagner, M. Electrochemical degradation of perfluorooctanoic acid (PFOA) and perfluorooctane sulfonate (PFOS) in water with persulfate catalyst support. Sep. Purif. Technol. 2025, 363, 132076. [Google Scholar] [CrossRef]
  16. Harding-Marjanovic, K.C.; Houtz, E.F.; Yi, S.; Field, J.A.; Sedlak, D.L.; Alvarez-Cohen, L. Aerobic Biotransformation of Fluorotelomer Thioether Amido Sulfonate (Lodyne) in AFFF-Amended Microcosms. Environ. Sci. Technol. 2015, 49, 7666–7674. [Google Scholar] [CrossRef]
  17. Mejia-Avendaño, S.; Duy, S.V.; Sauvé, S.; Liu, J. Generation of Perfluoroalkyl Acids from Aerobic Biotransformation of Quaternary Ammonium Polyfluoroalkyl Surfactants. Environ. Sci. Technol. 2016, 50, 9923–9932. [Google Scholar] [CrossRef]
  18. Armitage, J.M.; MacLeod, M.; Cousins, I.T. Comparative Assessment of the Global Fate and Transport Pathways of Long-Chain Perfluorocarboxylic Acids (PFCAs) and Perfluorocarboxylates (PFCs) Emitted from Direct Sources. Environ. Sci. Technol. 2009, 43, 5830–5836. [Google Scholar] [CrossRef]
  19. Wang, X.; Chen, W.; Guo, Q.; Peng, Z.; Sun, Q.; Zhao, C.; Zhang, R. Current status and risk assessment of perfluoroalkyl acids in surface water and sediments of the Yellow River in Shandong, China. Emerg. Contam. 2025, 11, 100391. [Google Scholar] [CrossRef]
  20. Li, Y.; Liu, Y.; Shi, G.; Liu, C.; Hao, Q.; Wu, L. Occurrence and Risk Assessment of Perfluorooctanoate (PFOA) and Perfluorooctane Sulfonate (PFOS) in Surface Water, Groundwater and Sediments of the Jin River Basin, Southeastern China. Bull. Environ. Contam. Toxicol. 2022, 108, 1026–1032. [Google Scholar] [CrossRef]
  21. Heydebreck, F.; Tang, J.; Xie, Z.; Ebinghaus, R. Alternative and Legacy Perfluoroalkyl Substances: Differences Between European and Chinese River/Estuary Systems. Environ. Sci. Technol. 2015, 49, 8386–8395. [Google Scholar] [CrossRef]
  22. Meng, J.; Liu, S.; Zhou, Y.; Wang, T. Are perfluoroalkyl substances in water and fish from drinking water source the major pathways towards human health risk? Ecotoxicol. Environ. Saf. 2019, 181, 194–201. [Google Scholar] [CrossRef]
  23. Xu, W.; Li, S.; Wang, W.; Sun, P.; Yin, C.; Li, X.; Yu, L.; Ren, G.; Peng, L.; Wang, F. Distribution and potential health risks of perfluoroalkyl substances (PFASs) in water, sediment, and fish in Dongjiang River Basin, Southern China. Environ. Sci. Pollut. Res. 2023, 30, 99501–99510. [Google Scholar] [CrossRef] [PubMed]
  24. Yao, Y.; Zhu, H.; Li, B.; Hu, H.; Zhang, T.; Yamazaki, E.; Taniyasu, S.; Yamashita, N.; Sun, H. Distribution and primary source analysis of per- and poly-fluoroalkyl substances with different chain lengths in surface and groundwater in two cities, North China. Ecotoxicol. Environ. Saf. 2014, 108, 318–328. [Google Scholar] [CrossRef] [PubMed]
  25. Guo, C.; Zhang, Y.; Zhao, X.; Du, P.; Liu, S.; Lv, J.; Xu, F.; Meng, W.; Xu, J. Distribution, source characterization and inventory of perfluoroalkyl substances in Taihu Lake, China. Chemosphere 2015, 127, 201–207. [Google Scholar] [CrossRef] [PubMed]
  26. Cui, Q.; Pan, Y.; Zhang, H.; Sheng, N.; Dai, J. Elevated concentrations of perfluorohexanesulfonate and other per- and polyfluoroalkyl substances in Baiyangdian Lake (China): Source characterization and exposure assessment. Environ. Pollut. 2018, 241, 684–691. [Google Scholar] [CrossRef]
  27. Zhao, Z.; Cheng, X.; Hua, X.; Jiang, B.; Tian, C.; Tang, J.; Li, Q.; Sun, H.; Lin, T.; Liao, Y.; et al. Emerging and legacy per- and polyfluoroalkyl substances in water, sediment, and air of the Bohai Sea and its surrounding rivers. Environ. Pollut. 2020, 263, 114391. [Google Scholar] [CrossRef]
  28. Zhang, Y.-H.; Ding, T.-T.; Huang, Z.-Y.; Liang, H.-Y.; Du, S.-L.; Zhang, J.; Li, H.-X. Environmental exposure and ecological risk of perfluorinated substances (PFASs) in the Shaying River Basin, China. Chemosphere 2023, 339, 139666. [Google Scholar] [CrossRef]
  29. Chen, X.; Zhu, L.; Pan, X.; Fang, S.; Zhang, Y.; Yang, L. Isomeric specific partitioning behaviors of perfluoroalkyl substances in water dissolved phase, suspended particulate matters and sediments in Liao River Basin and Taihu Lake, China. Water Res. 2015, 80, 235–244. [Google Scholar] [CrossRef]
  30. Li, W.; Li, H.; Zhang, D.; Tong, Y.; Li, F.; Cheng, F.; Huang, Z.; You, J. Legacy and Emerging Per- and Polyfluoroalkyl Substances Behave Distinctly in Spatial Distribution and Multimedia Partitioning: A Case Study in the Pearl River, China. Environ. Sci. Technol. 2022, 56, 3492–3502. [Google Scholar] [CrossRef]
  31. Chen, H.; Zhang, C.; Han, J.; Sun, R.; Kong, X.; Wang, X.; He, X. Levels and spatial distribution of perfluoroalkyl substances in China Liaodong Bay basin with concentrated fluorine industry parks. Mar. Pollut. Bull. 2015, 101, 965–971. [Google Scholar] [CrossRef] [PubMed]
  32. Gao, L.; Liu, J.; Bao, K.; Chen, N.; Meng, B. Multicompartment occurrence and partitioning of alternative and legacy per- and polyfluoroalkyl substances in an impacted river in China. Sci. Total Environ. 2020, 729, 138733. [Google Scholar] [CrossRef] [PubMed]
  33. Zhang, Y.; Qv, Z.; Wang, J.; Yang, Y.; Chen, X.; Wang, J.; Zhang, Y.; Zhu, L. Natural biofilm as a potential integrative sample for evaluating the contamination and impacts of PFAS on aquatic ecosystems. Water Res. 2022, 215, 118244. [Google Scholar] [CrossRef]
  34. Chen, H.; Munoz, G.; Duy, S.V.; Zhang, L.; Yao, Y.; Zhao, Z.; Yi, L.; Liu, M.; Sun, H.; Liu, J.; et al. Occurrence and Distribution of Per- and Polyfluoroalkyl Substances in Tianjin, China: The Contribution of Emerging and Unknown Analogues. Environ. Sci. Technol. 2020, 54, 14254–14264. [Google Scholar] [CrossRef]
  35. Shao, M.; Ding, G.; Zhang, J.; Wei, L.; Xue, H.; Zhang, N.; Li, Y.; Chen, G.; Sun, Y. Occurrence and distribution of perfluoroalkyl substances (PFASs) in surface water and bottom water of the Shuangtaizi Estuary, China. Environ. Pollut. 2016, 216, 675–681. [Google Scholar] [CrossRef]
  36. Leng, Y.; Xiao, H.; Li, Z.; Liu, Y.; Huang, K.; Wang, J. Occurrence and ecotoxicological risk assessment of perfluoroalkyl substances in water of lakes along the middle reach of Yangtze River, China. Sci. Total Environ. 2021, 788, 147837. [Google Scholar] [CrossRef]
  37. Wang, S.; Ma, L.; Chen, C.; Li, Y.; Wu, Y.; Liu, Y.; Dou, Z.; Yamazaki, E.; Yamashita, N.; Lin, B.-L.; et al. Occurrence and partitioning behavior of per- and polyfluoroalkyl substances (PFASs) in water and sediment from the Jiulong Estuary-Xiamen Bay, China. Chemosphere 2020, 238, 124578. [Google Scholar] [CrossRef]
  38. Lu, Z.; Song, L.; Zhao, Z.; Ma, Y.; Wang, J.; Yang, H.; Ma, H.; Cai, M.; Codling, G.; Ebinghaus, R.; et al. Occurrence and trends in concentrations of perfluoroalkyl substances (PFASs) in surface waters of Eastern China. Chemosphere 2015, 119, 820–827. [Google Scholar] [CrossRef]
  39. Lin, X.; Wang, S.; Li, Q.; Li, Y.; Yamazaki, E.; Yamashita, N.; Wang, X. Occurrence, partitioning behavior and risk assessments of per- and polyfluoroalkyl substances in water, sediment and biota from the Dongshan Bay, China. Chemosphere 2022, 291, 132735. [Google Scholar] [CrossRef]
  40. An, X.; Lei, H.; Lu, Y.; Xie, X.; Wang, P.; Liao, J.; Liang, Z.; Sun, B.; Wu, Z. Per- and polyfluoroalkyl substances (PFASs) in water and sediment from a temperate watershed in China: Occurrence, sources, and ecological risks. Sci. Total Environ. 2023, 890, 164341. [Google Scholar] [CrossRef]
  41. Lu, G.; Shao, P.; Zheng, Y.; Yang, Y.; Gai, N. Perfluoroalkyl Substances (PFASs) in Rivers and Drinking Waters from Qingdao, China. Int. J. Environ. Res. Public Health 2022, 19, 5722. [Google Scholar] [CrossRef] [PubMed]
  42. Pan, C.-G.; Yu, K.-F.; Wang, Y.-H.; Zhang, W.; Zhang, J.; Guo, J. Perfluoroalkyl substances in the riverine and coastal water of the Beibu Gulf, South China: Spatiotemporal distribution and source identification. Sci. Total Environ. 2019, 660, 297–305. [Google Scholar] [CrossRef] [PubMed]
  43. Chen, S.; Yan, M.; Chen, Y.; Zhou, Y.; Li, Z.; Pang, Y. Perfluoroalkyl substances in the surface water and fishes in Chaohu Lake, China. Environ. Sci. Pollut. Res. 2022, 29, 75907–75920. [Google Scholar] [CrossRef]
  44. Wang, S.; Cai, Y.; Ma, L.; Lin, X.; Li, Q.; Li, Y.; Wang, X. Perfluoroalkyl substances in water, sediment, and fish from a subtropical river of China: Environmental behaviors and potential risk. Chemosphere 2022, 288, 132540. [Google Scholar] [CrossRef]
  45. Pan, C.-G.; Ying, G.-G.; Zhao, J.-L.; Liu, Y.-S.; Jiang, Y.-X.; Zhang, Q.-Q. Spatiotemporal distribution and mass loadings of perfluoroalkyl substances in the Yangtze River of China. Sci. Total Environ. 2014, 493, 580–587. [Google Scholar] [CrossRef]
  46. Colomer-Vidal, P.; Jiang, L.; Mei, W.; Luo, C.; Lacorte, S.; Rigol, A.; Zhang, G. Plant uptake of perfluoroalkyl substances in freshwater environments (Dongzhulong and Xiaoqing Rivers, China). J. Hazard. Mater. 2022, 421, 126768. [Google Scholar] [CrossRef]
  47. Guo, R.; Liu, X.; Liu, J.; Liu, Y.; Qiao, X.; Ma, M.; Zheng, B.; Zhao, X. Occurrence, partition and environmental risk assessment of per- and polyfluoroalkyl substances in water and sediment from the Baiyangdian Lake, China. Sci. Rep. 2020, 10, 4691. [Google Scholar] [CrossRef]
  48. Liu, J.; Zhao, X.; Liu, Y.; Qiao, X.; Wang, X.; Ma, M.; Jin, X.; Liu, C.; Zheng, B.; Shen, J.; et al. High contamination, bioaccumulation and risk assessment of perfluoroalkyl substances in multiple environmental media at the Baiyangdian Lake. Ecotoxicol. Environ. Saf. 2019, 182, 109454. [Google Scholar] [CrossRef]
  49. Wang, Z.; Zhang, T.; Wu, J.; Wei, X.; Xu, A.; Wang, S.; Wang, Z. Male reproductive toxicity of perfluorooctanoate (PFOA): Rodent studies. Chemosphere 2021, 270, 128608. [Google Scholar] [CrossRef]
  50. Longpré, D.; Lorusso, L.; Levicki, C.; Carrier, R.; Cureton, P. PFOS, PFOA, LC-PFCAS, and certain other PFAS: A focus on Canadian guidelines and guidance for contaminated sites management. Environ. Technol. Innov. 2020, 18, 100752. [Google Scholar] [CrossRef]
  51. Southerland, E.; Birnbaum, L.S. What Limits Will the World Health Organization Recommend for PFOA and PFOS in Drinking Water? Environ. Sci. Technol. 2023, 57, 7103–7105. [Google Scholar] [CrossRef]
  52. Wang, P.; Lu, Y.; Wang, T.; Fu, Y.; Zhu, Z.; Liu, S.; Xie, S.; Xiao, Y.; Giesy, J.P. Occurrence and transport of 17 perfluoroalkyl acids in 12 coastal rivers in south Bohai coastal region of China with concentrated fluoropolymer facilities. Environ. Pollut. 2014, 190, 115–122. [Google Scholar] [CrossRef] [PubMed]
  53. Olsen, G.W.; Church, T.R.; Miller, J.P.; Burris, J.M.; Hansen, K.J.; Lundberg, J.K.; Armitage, J.B.; Herron, R.M.; Medhdizadehkashi, Z.; Nobiletti, J.B.; et al. Perfluorooctanesulfonate and other fluorochemicals in the serum of American Red Cross adult blood donors. Environ. Health Perspect. 2003, 111, 1892–1901. [Google Scholar] [CrossRef] [PubMed]
  54. Wang, T.; Wang, P.; Meng, J.; Liu, S.; Lu, Y.; Khim, J.S.; Giesy, J.P. A review of sources, multimedia distribution and health risks of perfluoroalkyl acids (PFAAs) in China. Chemosphere 2015, 129, 87–99. [Google Scholar] [CrossRef] [PubMed]
  55. Igwe, P.U.; Chukwudi, C.C.; Ifenatuorah, F.C.; Fagbeja, I.F.; Okeke, C.A. A Review of Environmental Effects of Surface Water Pollution. Int. J. Adv. Eng. Res. Sci. 2017, 4, 128–137. [Google Scholar]
  56. Wang, F.; Shih, K. Adsorption of perfluorooctanesulfonate (PFOS) and perfluorooctanoate (PFOA) on alumina: Influence of solution pH and cations. Water Res. 2011, 45, 2925–2930. [Google Scholar] [CrossRef]
  57. Xiao, F.; Simcik, M.F.; Gulliver, J.S. Mechanisms for removal of perfluorooctane sulfonate (PFOS) and perfluorooctanoate (PFOA) from drinking water by conventional and enhanced coagulation. Water Res. 2013, 47, 49–56. [Google Scholar] [CrossRef]
  58. Ahrens, L.; Yeung, L.W.Y.; Taniyasu, S.; Lam, P.K.S.; Yamashita, N. Partitioning of perfluorooctanoate (PFOA), perfluorooctane sulfonate (PFOS) and perfluorooctane sulfonamide (PFOSA) between water and sediment. Chemosphere 2011, 85, 731–737. [Google Scholar] [CrossRef]
  59. Li, C.; Zhang, C.; Gibbes, B.; Wang, T.; Lockington, D. Coupling effects of tide and salting-out on perfluorooctane sulfonate (PFOS) transport and adsorption in a coastal aquifer. Adv. Water Resour. 2022, 166, 104240. [Google Scholar] [CrossRef]
  60. You, C.; Jia, C.; Pan, G. Effect of salinity and sediment characteristics on the sorption and desorption of perfluorooctane sulfonate at sediment-water interface. Environ. Pollut. 2010, 158, 1343–1347. [Google Scholar] [CrossRef]
  61. Liu, W.-X.; He, W.; Qin, N.; Kong, X.-Z.; He, Q.-S.; Yang, B.; Yang, C.; Jorgensen, S.E.; Xu, F.-L. Temporal-spatial distributions and ecological risks of perfluoroalkyl acids (PFAAs) in the surface water from the fifth-largest freshwater lake in China (Lake Chaohu). Environ. Pollut. 2015, 200, 24–34. [Google Scholar] [CrossRef] [PubMed]
  62. Tang, Z.W.; Hamid, F.S.; Yusoff, I.; Chan, V. A review of PFAS research in Asia and occurrence of PFOA and PFOS in groundwater, surface water and coastal water in Asia. Groundw. Sustain. Dev. 2023, 22, 100947. [Google Scholar] [CrossRef]
  63. Lein, N.P.H.; Fujii, S.; Tanaka, S.; Nozoe, M.; Tanaka, H. Contamination of perfluorooctane sulfonate (PFOS) and perfluorooctanoate (PFOA) in surface water of the Yodo River basin (Japan). Desalination 2008, 226, 338–347. [Google Scholar] [CrossRef]
  64. Choi, G.-H.; Lee, D.-Y.; Jeong, D.-K.; Kuppusamy, S.; Lee, Y.B.; Park, B.-J.; Kim, J.-H. Perfluorooctanoic acid (PFOA) and perfluorooctanesulfonic acid (PFOS) concentrations in the South Korean agricultural environment: A national survey. J. Integr. Agric. 2017, 16, 1841–1851. [Google Scholar] [CrossRef]
  65. Zhu, X.; Li, H.; Luo, Y.; Li, Y.; Zhang, J.; Wang, Z.; Yang, W.; Li, R. Evaluation and prediction of anthropogenic impacts on long-term multimedia fate and health risks of PFOS and PFOA in the Elbe River Basin. Water Res. 2024, 257, 121675. [Google Scholar] [CrossRef]
  66. Orenibi, E.; Illés, Á.; Sandil, S.; Endrédi, A.; Szekeres, J.; Dobosy, P.; Záray, G. Temporal and spatial distribution of inorganic fluoride, total adsorbable organofluorine, PFOA and PFOS concentrations in the Hungarian section of the Danube River. J. Hazard. Mater. 2025, 485, 136820. [Google Scholar] [CrossRef]
  67. Paige, T.; De Silva, T.; Buddhadasa, S.; Prasad, S.; Nugegoda, D.; Pettigrove, V. Background concentrations and spatial distribution of PFAS in surface waters and sediments of the greater Melbourne area, Australia. Chemosphere 2024, 349, 140791. [Google Scholar] [CrossRef]
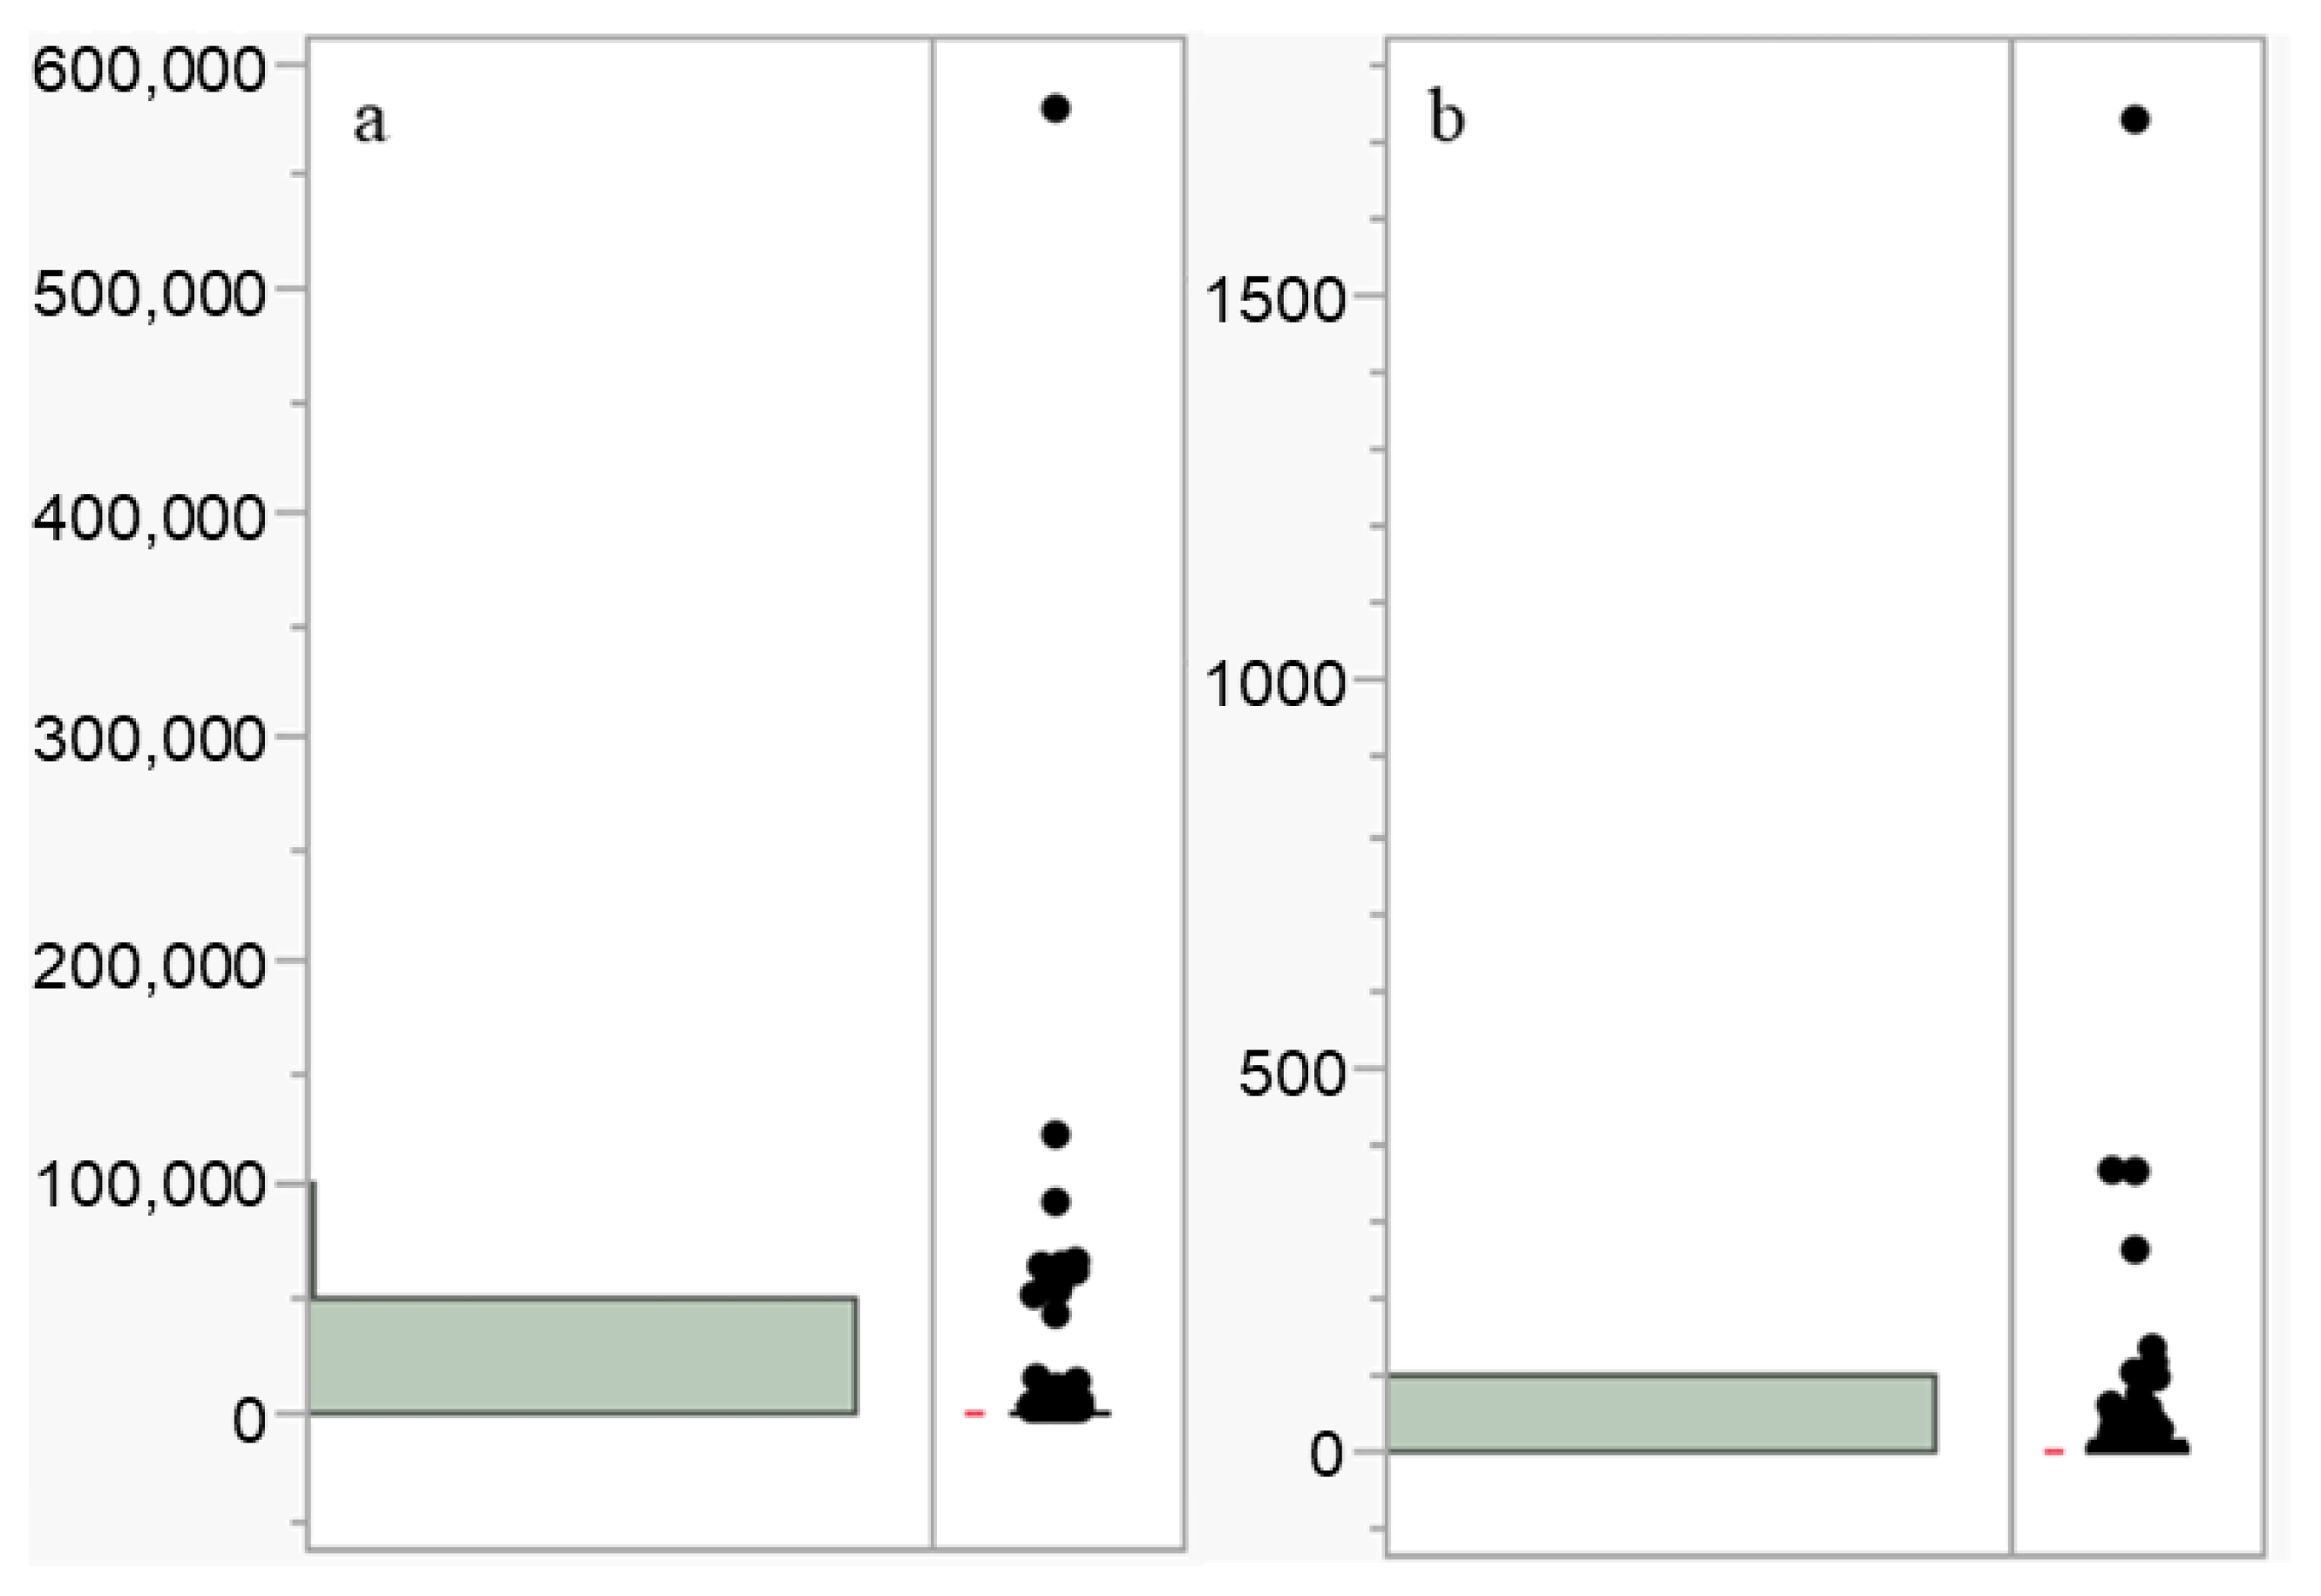
Figure 1. The location of the sampling point on a map of China.
Water 17 01275 g001
Figure 2. Forest plot for heterogeneity analysis of selected studies (red dots represent the weight of each study, and the diamond represents the combined effect size) [21,22,23,24,25,26,27,28,29,30,31,32,33,34,35,36,37,38,39,40,41,42,43,44,45].
Water 17 01275 g002
Figure 3. Funnel plot for publication bias assessment of selected studies.
Water 17 01275 g003
Figure 4. Distribution of mean concentration of PFOA and PFOS. ((a) PFOA; (b) PFOS).
Water 17 01275 g004
Figure 5. PFOA concentration responses to the effects of pH (a), DO (b), TOCs (c), and salinity (d).
Water 17 01275 g005
Figure 6. PFOS concentration responses to the effects of pH (a), DO (b), TOCs (c), and salinity (d).
Water 17 01275 g006
Table 1. Summary of the dataset indicating the number of statistics (mean ± standard error (SE), for PFOA/PFOS, and lower 95% confidence interval (LCI), upper 95% confidence interval (UCI)) and the ranges of concentrations of PFOA/PFOS type.
TypenMean (ng/L)SERange (ng/L)UCILCI
PFOA11411615.1703558.5725[0.0001, 578,970]2711.116519.2247
PFOS10158.408258.0018[0.003, 1725.37]11.99074.8422
Table 2. Description of the models that explain the relationships between mean concentrations of PFOA and pH, DO, pH, TOCs, and salinity (* represents a significant statistical difference).
ModelR2Adjusted R2F-Valuepn
Concentration = (−155.33 + 23.49 × pH)0.818−0.815F1,63 = 278.88<0.0001 *64
Concentration = (26.67 − 2.39 × DO)0.7740.769F1,47 = 157.59<0.0001 *48
Concentration = (31.13 − 1.33 × TOCs)0.8010.792F1,22 = 84.66<0.0001 *23
Concentration = (38.03 − 1.47 × Sal)0.7220.718F1,71 = 182.08<0.0001 *72
Table 3. Description of the models that explain the relationships between mean concentrations of PFOS and pH, DO, pH, TOCs, and salinity (* represents a significant statistical difference).
ModelR2Adjusted R2F-Valuepn
Concentration = (−39.89 + 6.07 × pH)0.8970.895F1,59 = 505.51<0.0001 *60
Concentration = (11.87 − 1.10 × DO)0.8830.880F1,41 = 302.61<0.0001 *42
Concentration = (6.37 − 0.29 × TOCs)0.7470.736F1,23 = 65.05<0.0001 *24
Concentration = (2.49 − 0.09 × Sal)0.7530.750F1,74 = 222.45<0.0001 *75
Disclaimer/Publisher’s Note: The statements, opinions and data contained in all publications are solely those of the individual author(s) and contributor(s) and not of MDPI and/or the editor(s). MDPI and/or the editor(s) disclaim responsibility for any injury to people or property resulting from any ideas, methods, instructions or products referred to in the content.

