Article

Source, Transport, and Fractionation of Rare Earth Elements in Fluvial Sediments from a Typical Small Urban Basin (East Tiaoxi River, Eastern China)

1
Institute for Frontiers and Interdisciplinary Sciences, Zhejiang University of Technology, Hangzhou 310014, China
2
Institute of Geographic Sciences and Natural Resources Research, Chinese Academy of Sciences, Beijing 100101, China
3
School of Environment and Energy, South China University of Technology, Guangzhou 510006, China
4
State Key Laboratory of Ocean Sensing, Zhejiang University, Hangzhou 310027, China
5
Institute of Quantum Sensing, Zhejiang University, Hangzhou 310027, China
6
School of Physics, Zhejiang University, Hangzhou 310027, China
*
Authors to whom correspondence should be addressed.
Water 2025, 17(9), 1279; https://doi.org/10.3390/w17091279
Submission received: 6 March 2025 / Revised: 17 April 2025 / Accepted: 23 April 2025 / Published: 25 April 2025

Abstract

:
As emerging contaminants, rare earth elements (REEs) have undergone significant anthropogenic enrichment in aquatic systems. This study investigates the REE concentrations, major metal elements, and grain size in surface sediments from the East Tiaoxi (ETX) River in eastern China, a small urban river subjected to substantial anthropogenic influences. Total REE concentrations of surface sediments ranged from 133.62 to 222.92 mg/kg with MREE enrichment and HREE depletion. REE concentration and fractionation were strongly correlated with Ca, Fe, Mg, and Mn, which may reflect the control of clay minerals, Fe-Mn oxides, and specific heavy minerals, and differences in REE behavior between riparian sediments and riverbed sediments highlighted the impact of hydrodynamic sorting and chemical weathering on REE distribution. Anthropogenic activities, particularly urbanization, were found to increase REE concentrations, especially at urban-adjacent sites (e.g., RBS2 and RS2), while natural processes such as soil transport and chemical weathering primarily contributed to REE variation at other sites. The enrichment factor and ecological risk assessment revealed that the enrichment and moderate risks associated with REEs occurred in river sediments adjacent to urbanized areas, though agricultural impacts were less pronounced. The findings emphasize the combined influence of urbanization and natural processes on REE distribution and ecological risks in the ETX River basin and underscore the need to prioritize urban-derived REE contamination in environmental management strategies.

1. Introduction

The rare earth elements (REEs), including La–Lu, exhibit coherent geochemical behaviors. Over the past 60 years, the study of REEs has been central to earth sciences [1], with these elements serving as powerful proxies for investigating the genesis of rocks, sediments, ocean water, and other geological formations [2,3,4]. Additionally, REEs have been instrumental in unraveling geochemical reactions and weathering processes within aquatic systems [5]. Concurrently, REEs have attained significant strategic importance, being designated as a critical metal by numerous nations. In recent decades, the demand for REEs has increased substantially in high-tech industries and agricultural applications, especially in green energy and military sectors [6]. The effluent discharge associated with these was identified as a potential risk factor for environmental contamination. For example, Gd is commonly used in magnetic resonance imaging, and REEs have been widely used in electronic products worldwide and as fertilizer additives in China and Brazil [7,8,9]. Consequently, the accumulation of anthropogenic REEs in the surficial environment is associated with the increasing number of electronics, manufacturing, medical facilities, technology industries, renewable energy, fertilizers, livestock feeds, etc. [10,11,12].
Recently, REEs have been identified as emerging contaminants, emphasizing their significance in ecotoxicological effects, such as trophic bioaccumulation [11]. This phenomenon has been observed in cultivated soils [9] and aquatic ecosystems, such as river water and sediments [13,14]. However, within the expansion of urban and agricultural areas, the integrated natural and anthropogenic influence of REEs in fluvial systems remains unclear. Since the solid phases are the primary loads of REEs in aquatic systems, the abundance and characteristics of REEs in the sediments can offer insights into their provenance, weathering processes, and anthropogenic contributions, particularly in regions significantly impacted by urban, industrial, and agricultural activities.
The geochemical characteristics of REEs in local soils and sediments are determined mainly by the characteristics of the parent rocks [15]. For instance, higher concentrations of REEs have been observed in river sediments draining from metamorphic and igneous terranes over those from sedimentary or volcanic rocks [16]. Furthermore, REE fractionation occurs during water–particle interaction, hydrodynamic sorting, and river sediment transport processes, making it challenging to determine sediment provenance [17]. In general, the mobilization and fractionation of REEs undergo various processes in aquatic systems, including water–particle sorption/desorption, co-precipitation, and solution and surface complexation [11]. REE compounds and ions with positive charges can be strongly adsorbed by clay minerals (such as illite and smectite), organic colloids, and inorganic colloids (especially the Fe/Mn oxyhydroxides) due to their negative charges or large specific surface area [18]. At a pH of approximately 7.5, greater than 95% adsorption of REEs can be achieved by clay, implying its significance as an important control on the transport and enrichment of REEs in sedimentary systems [19]. Additionally, the behavior of REEs in aquatic systems is sensitive to environmental factors such as pH, redox potential, and salinity, thereby controlling their behavior in the water–particle interaction [16]. Consequently, bedrock weathering, the geochemical properties of sediment particles, and sediment transport dynamics influence the river sediments’ REE cycles. However, with the anthropogenic inputs and disturbance, the alteration of REE abundance and fractionation patterns has been observed in modern riverine sediments, which raises concerns regarding emerging contaminants and provides insight into the REE geochemical knowledge [20,21].
The present study focuses on the East Tiaoxi (ETX) River, located in eastern China, a paradigm of a small river subject to multiple anthropogenic influences, including urban, industrial, and agricultural activities and hydraulic engineering construction. The pollution of urban and agrarian effluence has resulted in the variation of solutes in the West Tiaoxi River water [22], highlighting the profound impact of anthropogenic activities on regional aquatic ecosystems. The objectives of this study are (1) to determine the distribution of REE concentrations and the fractionation in different types of surface sediments; (2) to identify the control of major elements and texture on REE concentration and fractionation to discuss the influence of sources and transport; and (3) to evaluate the enrichment and ecological risk levels of REEs in surface sediments from the ETX River basin. This study provides a reference for exploring REE origins, transport, and fractionation processes in fluvial sediments under multiple anthropogenic influences, especially urbanization and agriculture.

2. Materials and Methods

2.1. Study Area

The ETX River (30.11–30.96° N, 119.19–120.48° E), a typical small urban river, is located south of the Taihu Lake basin, flowing through Hangzhou, a third megacity in eastern China, and Huzhou City (Figure 1a). The ETX River originates from Tianmushan Mountain, with a main channel length of approximately 158.36 km and a basin area of 2265.1 km2. The average annual rainfall is about 1460 mm, with approximately 75% occurring between mid-May and mid-July (Meiyu period) and between August and September (typhoon season). To manage upstream flood during the rainy season and divert the Taihu Lake water back during the dry season, two significant hydraulic engineering projects were constructed in the mainstream: a right-bank (east-bank) river levee in the middle reaches and a diversion project in the lower reaches; these two separate the ETX catchment area from the Hang-Jia-Hu Plain. The ETX River plays a crucial role in maintaining the balance of aquatic ecosystems due to its strong hydrological connection with the Taihu Lake and the Hang-Jia-Hu Plain’s waterway network, ultimately flowing into the Changjiang River and Qiantang River. For example, 56.8% of the suspended sediment output from Taihu Lake flows out via the Changdougang River and Daqiangang River, which are the terminal branches of the ETX River [23].
Over the past few decades, rapid industrialization, urbanization, and agricultural production within the ETX basin and surrounding areas have posed significant risks to water quality and aquatic ecosystems. Two critical industrial clusters are situated in the upper and lower reaches of the ETX River, and four wastewater treatment plants (WWTP; >50,000 t/d) are distributed along its main channel (Figure 1a). The dominant land-cover types in the ETX watershed are forest land, cropland, and construction land, totaling approximately 98.2% in 2023 [24]. Cropland and construction land (37.4%) are primarily concentrated along the main channel of the ETX River (Figure 1b), and paddy cultivation is the most important agricultural activity in the watershed. Additionally, the lithological map indicates that the ETX basin is dominated by felsic silicates (mainly referring to acidic lava, rhyolite, and biotite granite), clastic sedimentary rocks (primarily referring to sandstone, siltstone, and mudstone), and carbonates (referring to limestone and dolomite), with no evaporite outcrops (Figure 1c). Consequently, the ecological environment of the ETX River, particularly in its mainstream, is significantly influenced by natural conditions and anthropogenic disturbance, including hydrological connectivity, land-use types, and bedrock composition.

2.2. Sampling and Measurement

In August 2023, 14 surface fluvial sediment samples (0–5 cm) were collected along the main channel of the ETX River (Figure 1), including 10 river sediments and four paddy field sediments. Among the river sediments, five riverbed sediments (RBSs) were sampled on the bridges using a grab sampler, and five riparian sediments (RSs) were collected using a shovel at the riverbank in the upper and middle sections where RBSs were absent. Notably, RS sampling sites were located in areas where the water depth was less than 20 cm and were situated on the left bank to avoid the influence of river levee construction. The paddy field sediments, including two paddy soils and two of their adjacent ditch sediments, were collected using a shovel in the middle reaches. The outer layers of the samples in contact with a grab sampler or shovel were removed using a ceramic knife, and individual sediment samples were sealed in clean polyethylene bags. All samples were stored at approximately 4 °C and transported to the laboratory for freezing the same day.
The samples were freeze-dried in the laboratory and sieved to less than 2 mm (10 mesh). Sample pH values (sample/water ratio of 1/2.5) were determined using a pH meter (SX836, Sanxin, Shanghai, China) with a precision of ±0.01. For grain size analysis, 1.0 g of each sample was treated with 30% H2O2 and 2 mol/L HCl to remove organic and calcareous cementation, then dispersed in a 51 g/L (NaPO3)6 solution using an ultrasonic oscillator. Grain size was measured using a laser particle size analyzer (LAP-W2000H, EAST, Xiamen, China). Particles were classified as clay (<5 μm), silt (5–63 μm), and sand (63 μm–2 mm).
For metal element analysis, the samples were ground to 250 mesh powder using an agate mortar. Major metal elements and REEs were analyzed at the Institute of Geographic Sciences and Natural Resources Research, Chinese Academy of Sciences, China. Approximately 50 mg of each sample was digested with a mixture of HNO3-HCl-HF in a Teflon vessel using a microwave digestion system (Multiwave PRO, Anton Paar, Graz, Austria) [14]. The digested samples were dried and redissolved in a 3% v/v HNO3 solution. Major metal elements concentrations (Al, Ca, Fe, K, Mg, Mn, Na, and Ti) were determined using inductively coupled plasma optical emission spectroscopy (ICP-OES, Optima 5300DV, PerkinElmer, Waltham, MA, USA), and REE concentrations were measured using inductively coupled plasma mass spectrometry (ICP-MS, ELAN DRC-e, Perkin Elmer, Waltham, MA, USA). The measurement methods followed those described in a previous study for suspended sediments [25]. A certified soil reference material, GBW07449 (Institute of Geophysical and Geochemical Exploration, Langfang, China), was prepared and analyzed using the same procedure to ensure analytical accuracy. The duplicates, laboratory blanks, and standard reference materials, GBW(E)081531 (National Institute of Metrology, Beijing, China) and GBW07449, were used to ensure the data quality. The measurement accuracy was within ±5% for major metal elements and REEs compared to the standards.

2.3. Indication of REE Parameters and Enrichment Assessment

2.3.1. REE Fractionation and Anomaly Parameters

Several geochemical parameters were used to describe REE fractionation and anomalies. Total REEs (ΣREE), light REEs (ΣLREE), middle REEs (ΣMREE), and heavy REEs (ΣHREE) were defined as the sum of La–Lu, La–Nd, Sm–Dy, and Ho–Lu, respectively [26]. REE concentrations in sediments were normalized using the Post-Archean Australia Shale (PAAS) [27], reflecting the upper crust’s average abundance. Normalized values (e.g., LaN) were calculated as the ratios of sample REE concentrations to PAAS values. Ratios such as (La/Yb)N, (La/Sm)N, and (Sm/Yb)N were used to describe fractionation among LREE, MREE, and HREE, which were defined using Equations (1)–(3) [28], respectively. Ce/Ce* and Eu/Eu* were used to assess Ce and Eu anomalies, which were defined using Equations (4) and (5) [29,30,31].
(La/Yb)N = (Lasample/LaPAAS)/(Ybsample/YbPAAS)
(La/Sm)N = (Lasample/LaPAAS)/(Smsample/SmPAAS)
(Sm/Yb)N = (Smsample/SmPAAS)/(Ybsample/YbPAAS)
Ce/Ce* = CeN/(0.5LaN + 0.5PrN)
Eu/Eu* = EuN/((SmN × GdN)0.5)

2.3.2. Assessment of Enrichment and Ecological Risk

The enrichment factor (EF) was used to evaluate elemental enrichment relative to background levels and identify the influence of natural and anthropogenic processes on elemental concentrations. The EF of a single REE was calculated as follows [32]:
EFi = (Ci/CAl)sample/(Ci/CAl)ref
where EFi represents the enrichment factor for REE i, Ci is the concentration of REE i, CAl is the aluminum mass concentration, and ref refers to the reference material. Al was chosen as a conservative element less affected by anthropogenic sources [33]. The upper continental crust (UCC) [34] and the deep soil geochemical baseline values of China (CDS) [35] were used as reference material since the regional values of the geochemical background were unavailable. Meanwhile, this study’s surface paddy soil (PS1) was used as a contrast. The concentrations of REEs and Al in these references are listed in Table 1. EF was categorized into <1, 1–2, 2–5, 5–20, 20–40, and >40, referring to non-enriched and slightly, moderately, significantly, strongly, and extremely enriched, respectively [28,36].
The potential ecological risk index (PERI) method [37] was used to assess the ecological hazards of REEs in sediments based on abundance and release effect [38,39]. The PERI for a single REE (Eri) and the comprehensive potential ecological risk index (RI) were calculated as follows:
Eri = Tri × (Ci)sample/(Ci)ref
RI = ΣEri
where Tri is the toxicity index of the ith REE, assigned values of 1, 1, 5, 2, 5, 10, 5, 10, 5, 10, 5, 10, 5, 20 for La–Lu, respectively [38]; Ci represents the measured concentration of REE i in the samples or reference level, with the UCC [34] used as the reference.
Single-factor potential ecological risk was classified based on Eri values: mild (<20), moderate (20–40), strength (40–80), strong (80–160), and very strong (>160) [37,38]. In this study, the measured REEs omitted Y. Therefore, the adjusted RI for the “mild ecological risk” was set to 110, calculated as RI = 150 × (94/133), and taken as the integer. The overall potential ecological risk was classified into four levels: mild (<110), moderate (110–220), strength (220–440), and strong (≥440).

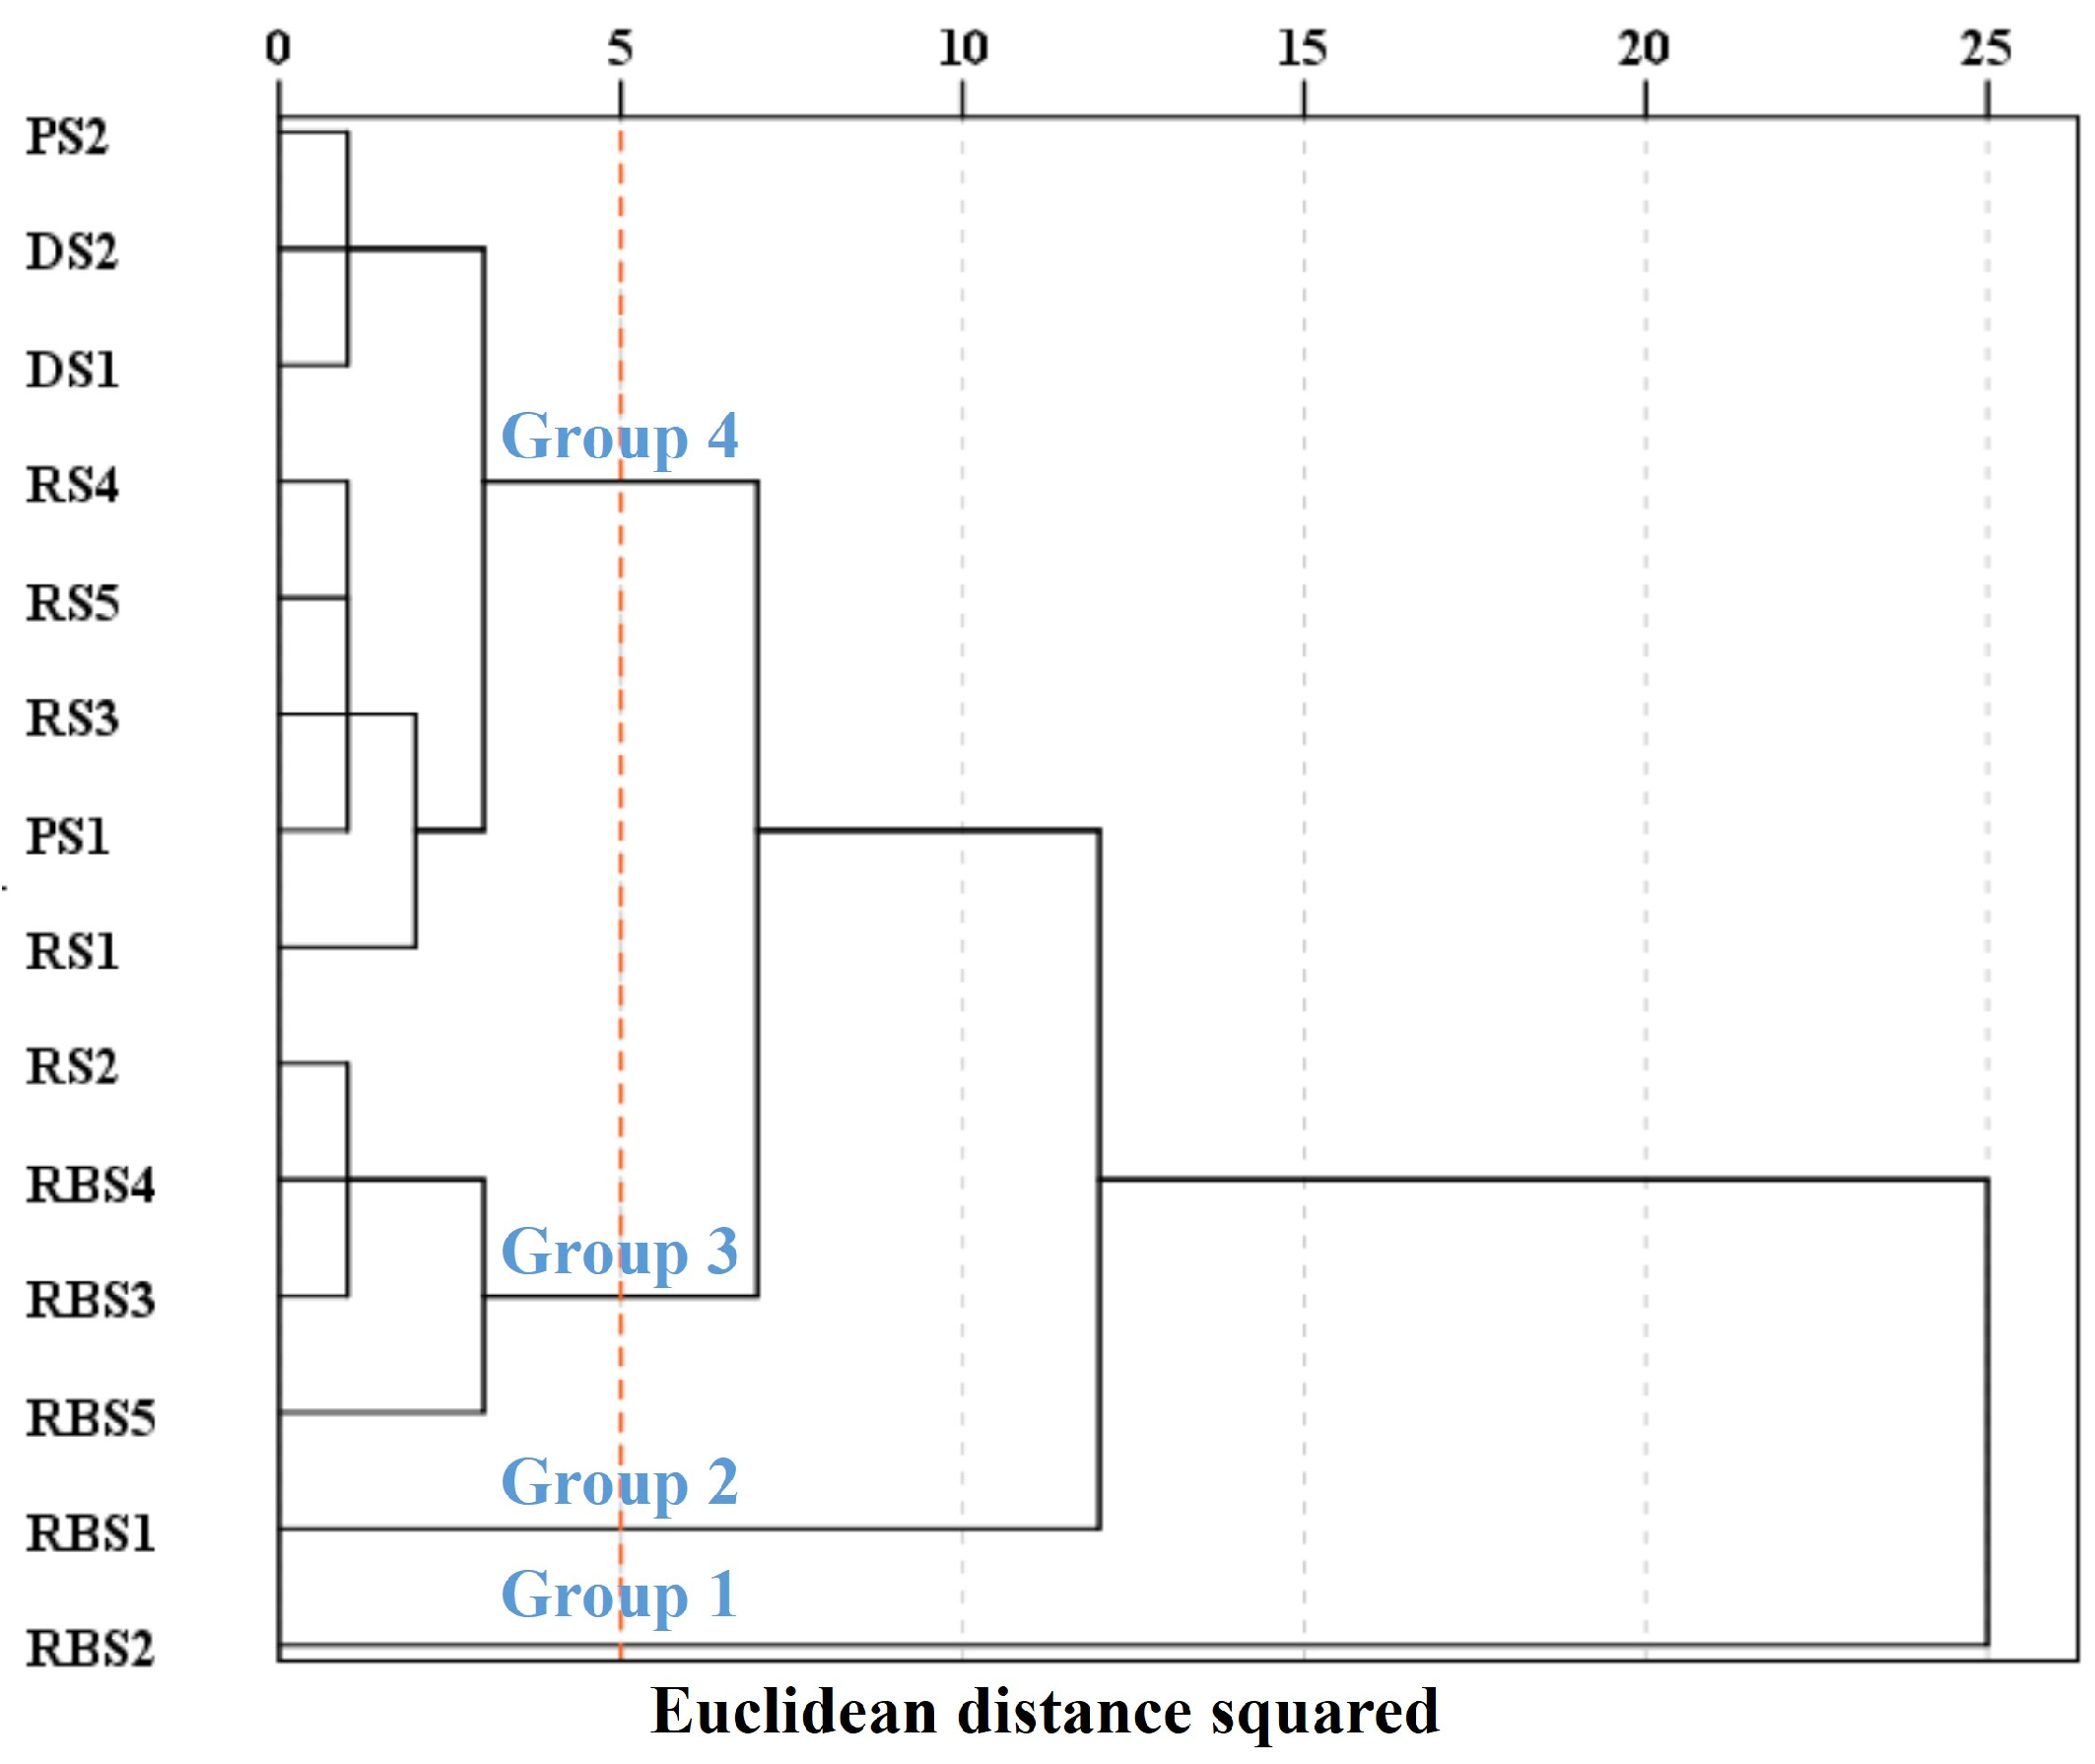
2.4. Statistical Analysis and Visualization

Spearman’s rank correlation coefficients were calculated to analyze the relationship between REEs and other geochemical parameters. Hierarchical clustering analysis was conducted to classify samples based on individual REE concentrations or PAAS-normalized ratios. Variables were standardized through Z-score transformation, and the average linkage method with squared Euclidean distance metric was employed.
Maps of the ETX basin were created using ArcMap 10.6. Data analysis was performed using Microsoft Office Excel 2019 and IBM SPSS Statistics 26. Graphs were generated using Origin 2021 and Python 3.11.4.

3. Results and Discussion

3.1. Characteristics of REEs in Surface Sediments

3.1.1. Distribution Characteristics of REE Concentration

The REE concentrations in various surface sediment types within the ETX basin are summarized in Table 2 and illustrated in Figure 2. The ΣREE concentrations in river sediments ranged from 133.62 to 222.92 mg/kg, averaging 186.30 mg/kg (182.10 mg/kg for RSs and 190.50 mg/kg for RBSs). These values exceed the mean concentration reported for the UCC (146.37 mg/kg) [34], Chinese catchment deep sediments (149.67 mg/kg) [40], CDS (151.00 mg/kg) [35], and the paddy field sediments in this study (151.53–170.01 mg/kg, with a mean value of 160.03 mg/kg), comparable to those of PAAS (184.77 mg/kg) [27] and Changjiang River sediments (186.59 mg/kg) [41]. These findings indicate that no significant REE pollution occurred in the surface sediments from the ETX basin. However, the ΣREE concentrations at sites RS2 (204.71 mg/kg), RBS2 (222.92 mg/kg), RBS3 (211.15 mg/kg), RBS4 (195.13 mg/kg), and RBS5 (189.68 mg/kg), flowing through the industrial clusters and high-density population areas (Figure 1), were close to those from a typical human-impacted river, the Mun River in northeast Thailand (averaged in 197.15 mg/kg) [14], and an anthropogenic-contaminated Tagus estuary in Portugal (18–210 mg/kg) [21], suggesting that these sites may be influenced by anthropogenic inputs such as industrial and urban wastewater.
The average concentration (mg/kg) of individual REEs in river sediments followed the order: Ce (80.72) > La (39.64) > Nd (32.46) > Pr (9.01) > Sm (6.22) > Gd (5.32) > Dy (4.32) > Er (2.55) > Yb (2.51) > Eu (1.20) > Ho (0.85) > Tb (0.77) > Tm (0.37) = Lu (0.37). A similar trend, albeit with reduced concentration, was observed in paddy field sediments: Ce (69.80) > La (33.59) > Nd (27.96) > Pr (7.66) > Sm (5.40) > Gd (4.64) > Dy (3.62) > Er (2.14) > Yb (2.06) > Eu (1.15) > Ho (0.71) > Tb (0.66) > Lu (0.32) > Tm (0.31). Notably, ΣREE concentrations increased progressively from paddy field sediments to RSs and RBSs, while the relative abundance of individual REEs remained consistent.
In river sediments, ΣLREE, ΣMREE, and ΣHREE accounted for 85.55–87.78% (mean 86.90%), 8.75–10.46% (mean 9.53%), and 3.28–3.99% (mean 3.57%), respectively. Similarly, paddy field sediments exhibited proportions of 85.90–87.52% (mean 86.85%), 9.15–10.35% (mean 9.68%), and 3.32–3.75% (mean 3.46%) for ΣLREE, ΣMREE, and ΣHREE, respectively. This indicates pronounced LREE enrichment and HREE depletion in the ETX basin sediments, a pattern consistent with global estuarine and riverine systems [42].

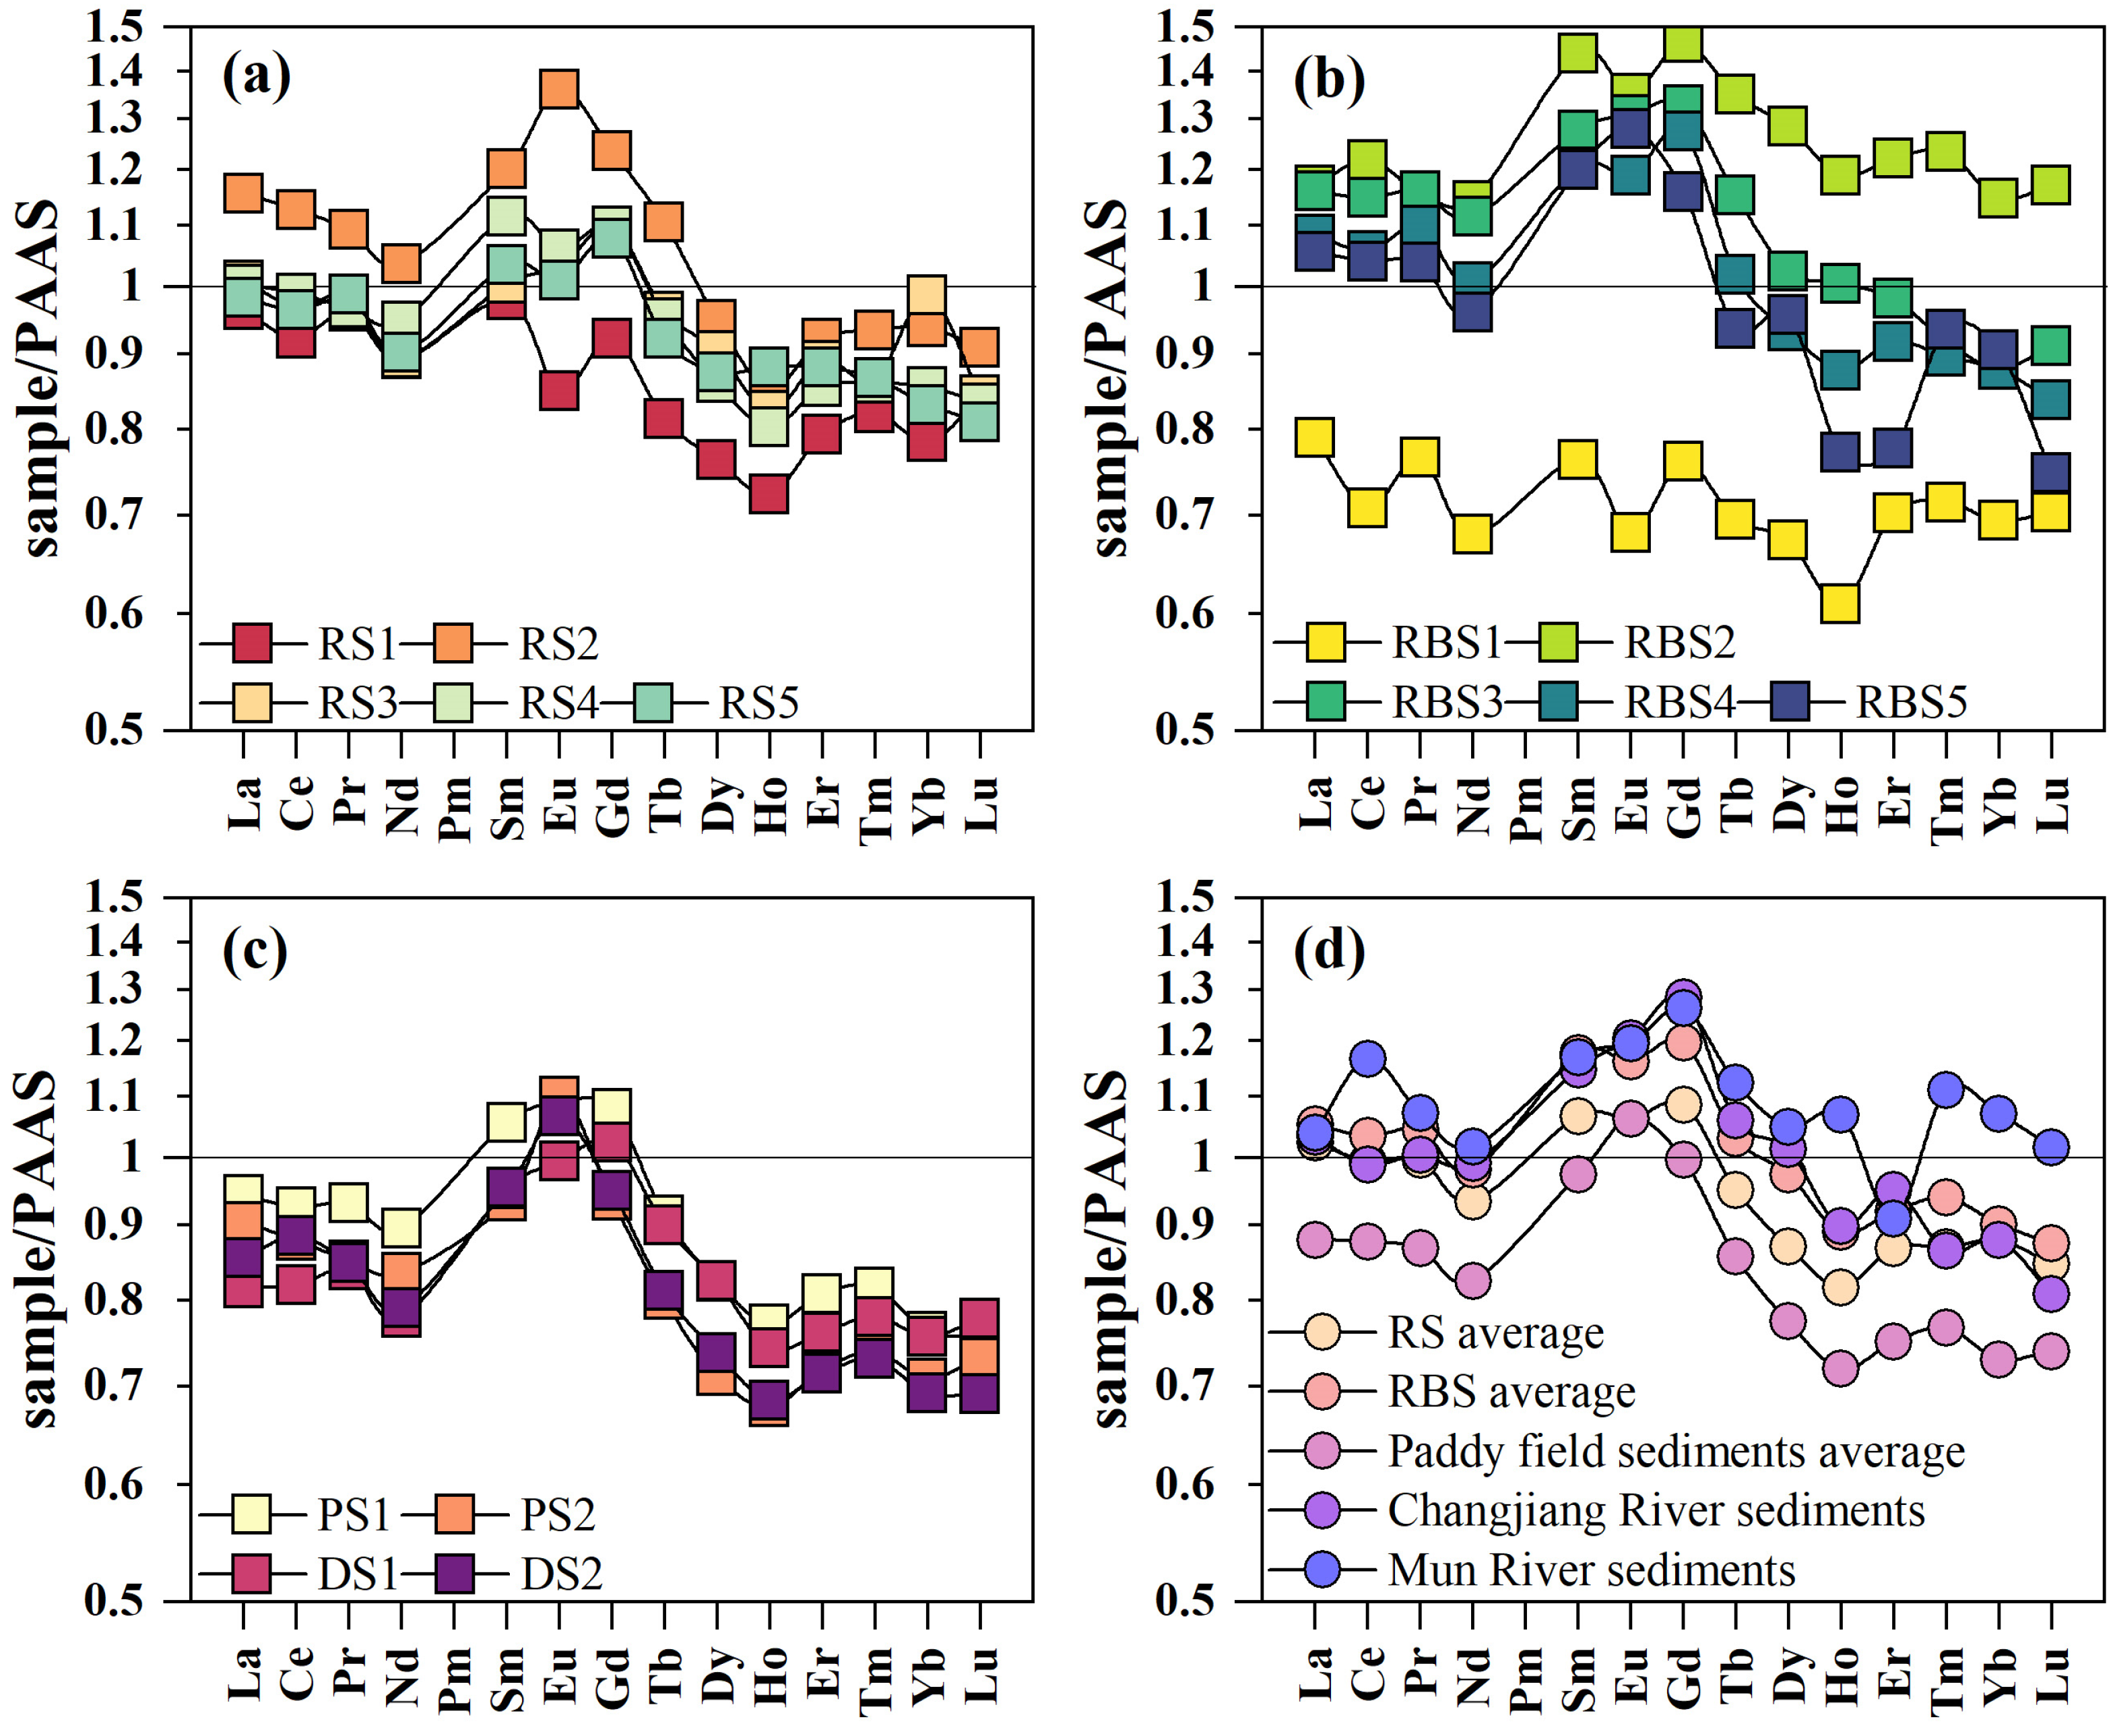
3.1.2. REE Fractionation Patterns and Anomalies

PAAS-normalized REE distribution patterns revealed distinct fractionation trends among RSs, RBSs, and paddy field sediments (Figure 3). For RSs, LaN, SmN, and YbN had ranges of 0.96–1.16 (mean 1.02), 0.98–1.20 (mean 1.07), and 0.78–0.99 (mean 0.88), respectively. In RBSs, these values were 0.79–1.17 (mean 1.05), 0.76–1.44 (mean 1.18), and 0.69–1.15 (mean 0.90), respectively. Paddy field sediments exhibited lower normalized ratios: LaN 0.82–0.94 (mean 0.88), SmN 0.93–1.06 (mean 0.97), and YbN 0.69–0.76 (mean 0.73). Relative to PAAS, RSs and RBSs displayed MREE enrichment and HREE depletion, very close to the Changjiang River sediments [41], whereas paddy field sediments showed slight LREE depletion and pronounced HREE depletion. Notably, site RSB2 was significantly enriched in MREE and HREE (Figure 2 and Figure 3b), indicating the additional anthropogenic inputs.
The fractionation ratios (La/Yb)N and (Sm/Yb)N further quantified REE partitioning. For RSs, these ratios had ranges of 1.02–1.23 (mean 1.17) and 1.02–1.31 (mean 1.22); for RBSs, 1.02–1.32 (mean 1.18) and 1.10–1.45 (mean 1.30); and for paddy field sediments, 1.08–1.28 (mean 1.21) and 1.26–1.39 (mean 1.33). The hierarchy (Sm/Yb)N > (La/Yb)N > 1 underscores preferential HREE separated from sediments into the dissolved phase during the weathering processes due to higher dissolution of HREE over LREE under neutral and alkaline conditions [43].
Ce/Ce* and Eu/Eu* reflect the specific decoupling of Ce and Eu from the other REEs in the geological and environmental processes due to the special electron configuration in the outer shell and different valence states [44]. Ce/Ce* ranged from 0.91 to 1.05 (mean 0.99), while Eu/Eu* ranged from 0.89 to 1.18 (mean 1.01). Average Ce/Ce* values for RSs, RBSs, and paddy field sediments were 0.98, 0.98, and 1.00, respectively; corresponding Eu/Eu* values were 0.98, 0.97, and 1.08. The Ce/Ce* and Eu/Eu* values are almost equal to 1, representing no apparent Ce and Eu anomalies. However, a weak positive Eu anomaly in PS2 (1.18) and DS2 (1.12) likely reflects lithological inheritance from felsic volcanic rocks (Figure 1c), where Eu2+ substitution in plagioclase is common during magmatic processes [45]. In contrast, the absence of Eu anomalies in PS1 and DS1 (clastic sedimentary rock settings) may be related to Eu loss during sericite alteration.

3.2. Impacts of Geochemical Composition on REE Concentrations and Fractionation

All surface sediments in the ETX basin exhibited strong inter-element REE correlations (r = 0.46–0.99; p < 0.05, except Eu vs. Lu), consistent with natural sediment behavior [20]. The data of major elements and texture for all samples are shown in Table S1. To identify key controls on REE concentrations and fractionation in river sediments, Spearman’s rank correlation analyses were performed between REE parameters (ΣREE, ΣLREE, ΣMREE, ΣHREE, Ce/Ce*, Eu/Eu*, (La/Yb)N, and (Sm/Yb)N) and geochemical composition (Figure 4a). Generally, the REE concentration and fractionation of river sediments were primarily related to Ca, Fe, Mg, Mn, and silt content but were weakly influenced by pH. The neutral to slightly alkaline condition of river sediments, with a pH between 6.8 and 7.9, is mainly related to the relatively high carbonate content. For example, carbonate (calcite/magnesium calcite and dolomite) in the floodplain sediments is about 1–4% adjacent to the middle reaches of the ETX River [46] and 6.8 wt% in the Changjiang River sediments [41]. However, REEs are depleted in carbonate minerals, thus causing the effect of dilution in sediments. In other words, the significant positive correlation between REE and Ca or Mg was induced by other Ca-rich minerals rather than carbonate. The positive correlation between REE and silt content for river sediments reflects the higher grain size and REE concentrations for RBSs, rather than the silty fractions enriching REEs, due to their weak correlation with RSs or RBSs. In the lower Changjiang River, major components of sediments are quartz, feldspar, and clay minerals, with about 3% being heavy minerals [41]. Among them, clay fractions can be a major host of REEs (>80%), followed by major and heavy minerals (<20%); in particular, REE-rich minerals such as zircon, sphene, apatite, monazite, and allanite form less than 10% of the heavy mineral fraction, highlighting their importance in hosting REEs [41]. The clay fractions consist of illite, kaolinite, chlorite, and smectite, in addition to Fe–Mn oxides/hydroxides, whose chemical components correspond to the positive correlation of REEs with Ca, Fe, Mg, and Mn [41,47]. Moreover, the PAAS-normalized REE distribution patterns in the ETX River sediments, i.e., MREE enrichment over LREE and HREE depletion, also suggest the control of clay fractions instead of silt fractions [16]. The positive (Sm/Yb)N-silt% correlations suggest that silt content is essential in the fractionation between MREE and HREE [48]. Previous studies show that the enrichment of MREE may be governed by the substitution mechanism of Ca2+ by MREE [49] and reactive iron minerals such as goethite and hematite [50]. Therefore, the primary REE-hosting mineral phase in the ETX River sediments may refer to clay fractions, especially clay minerals (illite, kaolinite, chlorite, and smectite) and Fe–Mn oxides/hydroxides. The role of REE-rich heavy minerals such as zircon, sphene, apatite, monazite, and allanite is non-negligible.
The grouped correlation analyses revealed divergent controlling factors for RSs and RBSs (Figure 4b,c). Although RSs had slightly higher clay content (35.04–60.72%), with an average grain size of 6.1Φ (median: 7.8Φ), than that of RBSs (30.68–53.86%), with an average grain size of 6.0Φ (median: 7.2Φ), REEs in RBSs had a positive correlation (r = 0.80) with clay content, while it was weak for RSs. These indicate the disparity of the grain-size component controlling REE concentration in RSs and RBSs. For RSs, the REE concentrations (particularly ΣHREE) and Eu anomaly were mainly regulated by Ca, Mg, and Mn, in addition to a moderate positive REE-silt% correlation, suggesting a more important role of silty fractions, such as heavy minerals, in the REEs of RSs. Moreover, negative (La/Yb)N correlation with clay content likely reflects HREE preferential adsorption onto clay minerals, driven by increasing surface complexation constants with atomic numbers [51,52]. In contrast, Ca, Fe, Mg, Mn, and clay content were the main controlling factors of REE concentration in RBSs, which indicates the significant role of clay minerals, particularly Fe-containing fine minerals. For example, secondary minerals such as Fe-Mn (oxyhydr)oxides, illite, chlorite, and smectite can strongly adsorb REEs due to their negative charges or large specific surface area [18]. The shared Ca-Mg-Mn signatures and different textures that control REEs in RSs and RBSs suggest hydrodynamic sorting and chemical weathering during sediment transport from floodplains to riverbeds. These findings align with studies of Changjiang River floodplain sediments [53,54], emphasizing the dual controls of source lithology and weathering processes on REE distribution.

3.3. Distribution and Degree of REE Enrichment

3.3.1. Spatial Distribution Characteristics

Despite similar REE fractionation patterns across the ETX basin (Figure 3), marked spatial heterogeneity in ΣREE concentrations emerged (Figure 2), signaling potential ecological risks for local terrestrial and aquatic systems. Hierarchical cluster analysis of 15 REE concentrations and PAAS-normalized ratios yielded congruent groupings (Figure 5): Group 1 (RBS2, i.e., highest ΣREE), Group 2 (RBS1, i.e., lowest ΣREE), Group 3 (RS2, RBS3–RBS5, i.e., moderately high ΣREE), and Group 4 (remaining sites, i.e., soil-influenced). Cluster coherence implies shared provenance within groups [15]. Elevated ΣREE in Groups 1 and 3 likely reflect the addition of anthropogenic inputs, whereas Group 2 represents pristine bedrock signatures. Group 4’s intermediate values suggest mixed soil and fluvial sources. Given the ETX River’s role as a regional water resource and the basin’s intensive land use, these spatial disparities necessitate comprehensive enrichment and ecological risk assessments.

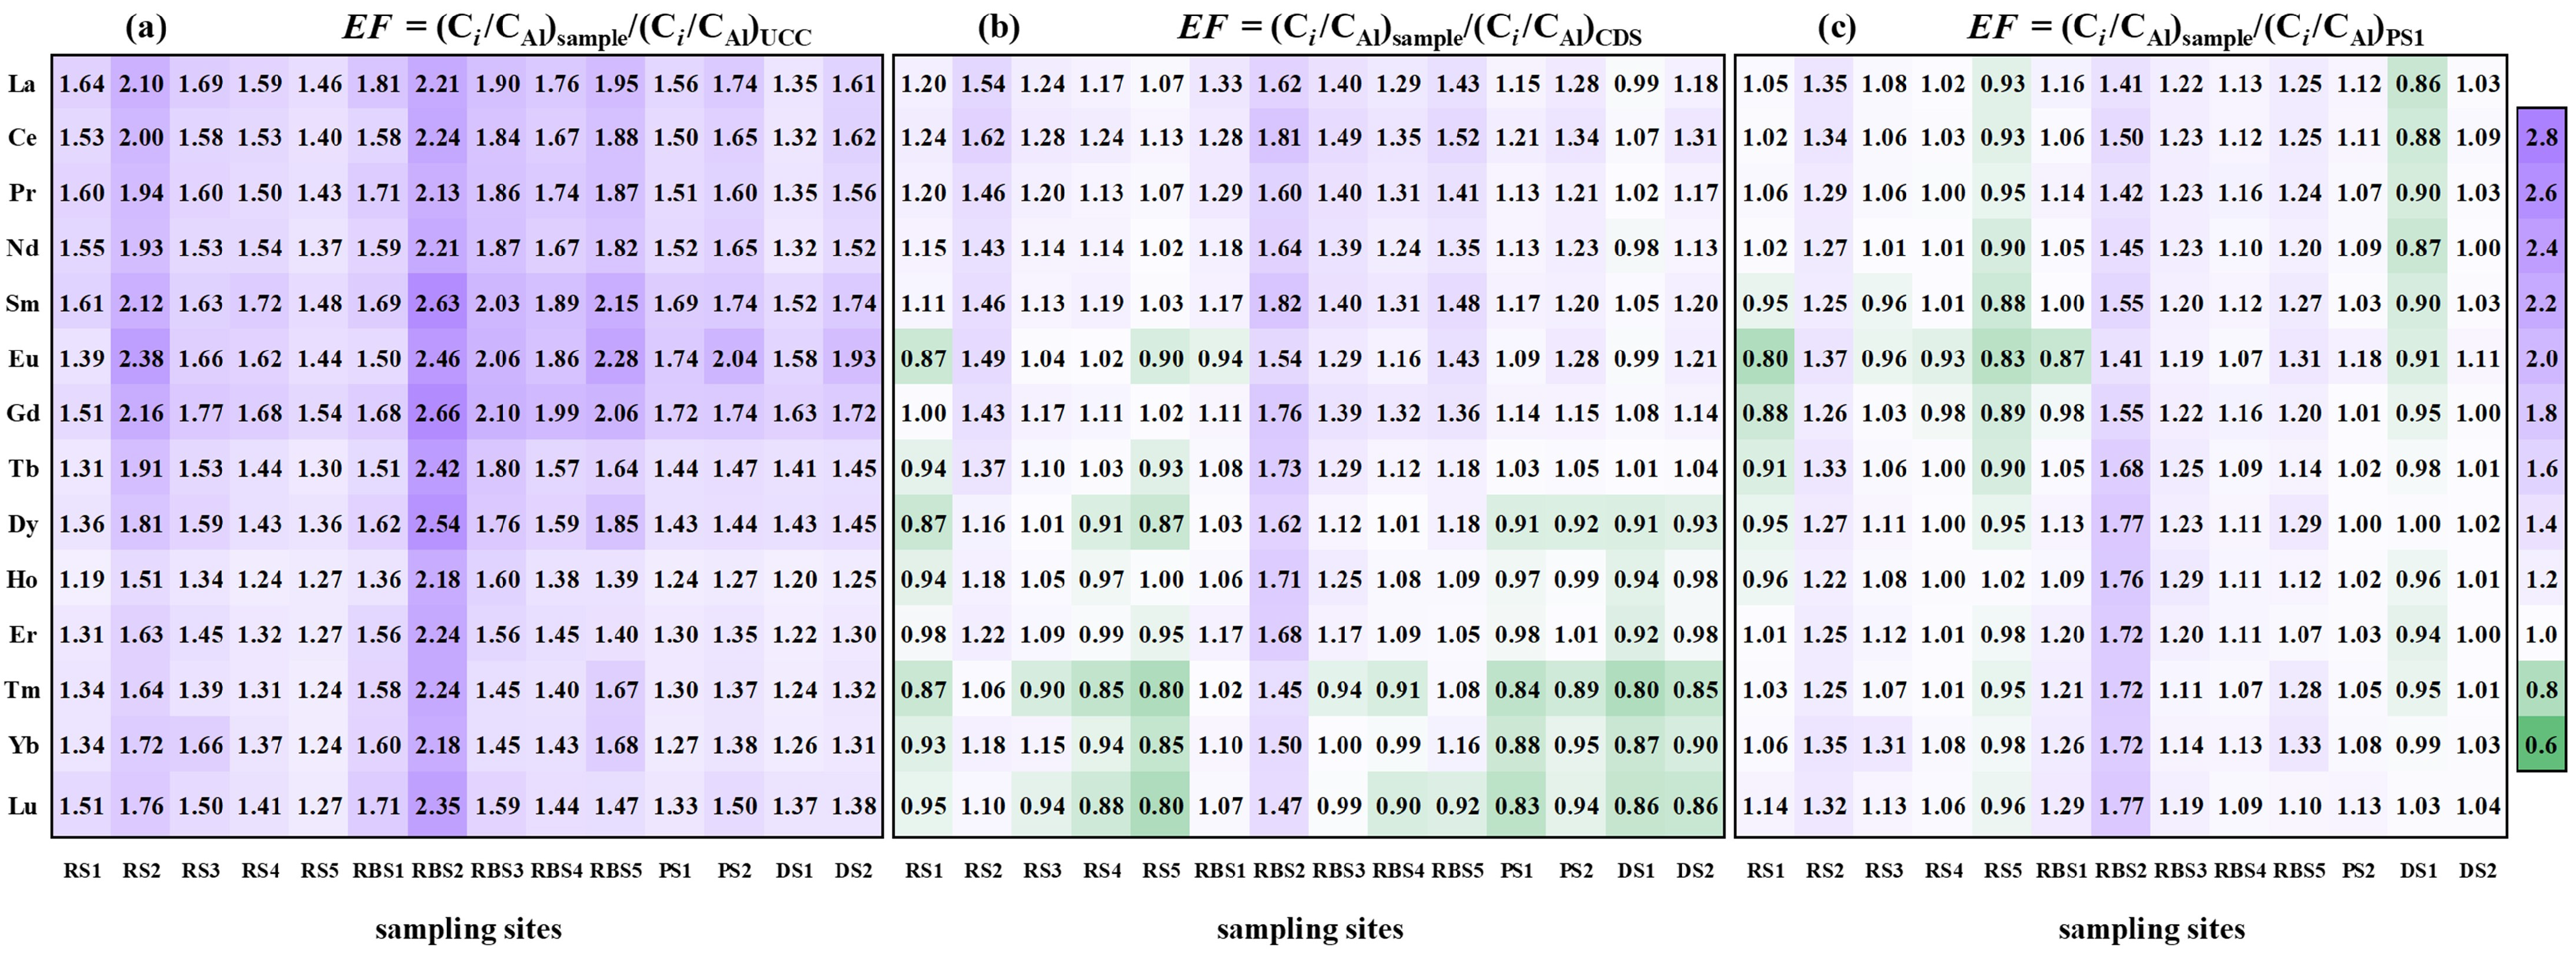
3.3.2. Degree of REE Enrichment and Potential Source

Although the previous study indicates that REE concentrations in sediments are often higher than maximum soil background concentrations by more than 10% [55], some river sediments in this study, including RS2 and RBS2–RBS5, seem to exceed this range, which suggests anthropogenic influences. To evaluate the degree of REE enrichment relative to the lithological background, EF values for all sediments were calculated using the UCC as a reference and ranged from 1.19 to 2.66 (mean 1.63), indicating slight to moderate enrichment. Notably, EF values showed a stronger enrichment of MREE and LREE over HREE (Figure 6a), in accord with the soils from a karst catchment in southwest China [56] and the soils from southern Konya in Turkey [57]. These areas distribute many carbonate rocks, and the enrichment of MREE may be governed by the substitution mechanism of Ca2+ [49]. Notably, RBS2 exhibited EF values comparable to multiple-anthropogenically influenced sediments from the Jiulong River estuary [42] but lower than agrarian-impacted Mun River sediments [14], which indicates potential anthropogenic inputs (perhaps urban and/or agricultural influences).
Given the inherent variability in natural metal concentrations, the UCC and world average soils have not been used as the background values to assess anthropogenic enrichment [58]. Here, the regional baselines, i.e., CDS values, were prioritized for contamination assessment, and EF > 1.5 indicates pollution sources from anthropogenic activities [59]. EF values relative to CDS ranged from 0.80 to 1.82 (mean 1.15), reflecting slight depletion to slight enrichment (Figure 6b). RBS2 showed pronounced anthropogenic influence, while RS2 and RBS5 exhibited minor LREE contamination. Further, to exclude agricultural impacts, EF was recalculated against local paddy topsoil PS1 (Figure 6c). Only RBS2 displayed clear anthropogenic pollution in this case, with minor REE enrichment in RS2 and other RBS sites. Notably, it was observed that RSB2, adjacent to Deqing County, shows an obvious enrichment of MREE and HREE relative to local paddy topsoil, indicating the urban and industrial influence. Near-unity EF at RS3–RS5, PS2, DS1, and DS2, proximal to extensive paddy fields, suggests shared provenance between agricultural soils and adjacent river sediments. In summary, anthropogenic activities, particularly urbanization, drove marked REE enrichment at RBS2 and minor enrichment at RS2 and RBS5, while REEs at other sites were likely governed by soil and sediment transport and hydrodynamic sorting.
Single-element ecological risk indices (Eri) for river sediments followed the order Lu (23.29) > Eu (13.64) > Tb (11.98) > Tm (11.09) > Ho (10.57) > Gd (7.00) > Sm (6.92) > Pr (6.35) > Dy (6.17) > Yb (5.70) > Er (5.54) > Nd (2.50) > La (1.32) > Ce (1.26) (Figure 7). Paddy field sediments exhibited identical trends with reduced values: Lu (20.00) > Eu (13.04) > Tb (10.36) > Tm (9.40) > Ho (8.90) > Gd (6.11) > Sm (6.00) > Pr (5.39) > Dy (5.18) > Yb (4.68) > Er (4.65) > Nd (2.15) > La (1.12) > Ce (1.09). It was observed that Lu, Eu, and Tb largely contributed to the REE ecological risk in this study, consistent with the beach sediments from the Santa Rosalia mining region, Mexico [39], and slightly different from the order of Lu, Ho, Tb, and Eu in the Yellow River-estuary-bay sediments, China [20], and Lu, Tb, and Ho in the Mun River sediments, Thailand [14]. These regions have experienced the impacts of mining, urbanization, and industrial and agricultural activities. Thus, the ecological risks to Lu and Tb in river sediments from anthropogenic impacts are the most significant concern.
Lu posed a moderate ecological risk at all sites except RBS1, PS2, and DS2. LREE (La–Nd), MREE (Sm–Dy), and HREE (Ho–Lu) contributed 8.85–10.75% (mean 10.08%), 36.83–43.01% (mean 40.55%), and 46.57–53.05% (mean 49.37%) to the total potential ecological risk index (RI), respectively, highlighting greater ecological risks from MREE and HREE, though their absolute concentrations (12.22–14.45%) are lower than LREE. MREE and HREE, such as Sm, Eu, Gd, Tb, Dy, and Lu, are widely used for magnets, battery alloys, electronic devices, phosphors, medical imaging, and so on [12], and are indispensable to modern society. Comprehensive RI values had ranges of 83.18–149.02 (mean 113.32) for river sediments and 94.06–103.45 (mean 103.45) for paddy field sediments, indicating elevated REE-associated risks in fluvial systems, particularly at the urban-influenced sites (RS2, RBS2–RBS5), which exhibited moderate risk. Lu, Eu, Tb, Tm, and Ho collectively contributed 52–94% of RI in river sediments and 59–64% in paddy field sediments. The accumulation of MREE and HREE in river sediments, particularly in urbanized and industrialized areas, may cause negative impacts on local aquatic ecological security through the food chain and pose a potential human health risk [60]. Considering the complex anthropogenic influence across the ETX watershed, particularly the industrial clusters and urban areas along the main channel, and reducing the impact of industrial and domestic wastewater discharges on surface water and sediments is essential for water resource management. These findings underscore urbanization, instead of agriculture, as the primary driver of REE-related ecological risks in the ETX basin.

4. Conclusions

This study analyzes and discusses the characteristics and controlling factors of the REE concentrations and fractionation of surface fluvial sediments and assesses the degree of REE enrichment in a typical urban small basin, the ETX River in eastern China. The main conclusions of the study are as follows.
The total REE concentrations (La–Lu) in surface sediments ranged from 133.62 to 222.92 mg/kg. The average ΣREE concentrations were 186.30 mg/kg for all measured sediments, 182.10 mg/kg for RSs, 190.50 mg/kg for RBSs, and 160.03 mg/kg for paddy field sediments, showing an increasing trend with a similar order among single REE concentrations. The comparison with the PAAS reveals that RSs and RBSs were enriched in MREE but depleted in HREE, while paddy field sediments were slightly depleted in LREE and markedly depleted in HREE. The relationship (Sm/Yb)N > (La/Yb)N > 1 demonstrated that the measured surface sediments of the ETX basin exhibited the evident depletion of HREE, since the preferential removal of HREE resulted from higher dissolution of HREE over LREE under neutral and alkaline conditions. The correlation analysis showed that the key factors controlling the concentrations and fractionation of REEs in river sediments include Ca, Fe, Mg, Mn, and grain size. The primary REE-hosting mineral phase in the ETX River sediments may refer to clay fractions, especially the clay minerals (illite, kaolinite, chlorite, and smectite) and Fe–Mn oxides/hydroxides, and the role of REE-rich heavy minerals, such as zircon, sphene, apatite, monazite, and allanite, is non-negligible. Differences in REE behavior between RSs and RBSs were attributed to variations in the mineral composition of the clay fraction, particularly the Fe-containing minerals. These results emphasize the impact of hydrodynamic sorting and chemical weathering on REE distribution in the ETX basin. Nevertheless, to better understand the controls and effects of mineral phases on REEs in riverine sediments, mineralogical evidence should be included in future studies.
The clustering and EF analyses indicated that the evident REE enrichment observed in site RBS2 and the slight REE enrichment in sites RS2 and RBS5 are attributable to anthropogenic activities, specifically urbanization. In contrast, the REEs in sites RS1 and RS3–RS5 are primarily attributed to the transport of soils. By comparison, the slight REE enrichment in RSB1, RSB3, and RBS4 may be attributed to the accumulation during the chemical weathering processes and hydrodynamic sorting. Moreover, three EF analyses underscore that using regional and local soils as a reference is recommended. The single-factor potential ecological risk degree was mild, except for Lu, which exhibited a moderate risk at the sites that exclude RBS1, PS2, and DS2. The river sediments of the ETX basin exhibited a higher comprehensive ecological risk of REEs compared to paddy soils, and a moderate degree of ecological risk at the sites RS2 and RBS2–RBS5 was attributed to the urban distribution. In conclusion, the potential ecological risks of REEs in surface sediments of the ETX basin were primarily attributed to urban distribution as opposed to agriculture.

Supplementary Materials

The following supporting information can be downloaded at: https://www.mdpi.com/article/10.3390/w17091279/s1, Table S1: REE concentrations, major metal element concentrations, and other geochemical parameters of the surface sediments in the ETX basin.

Author Contributions

Conceptualization, K.Y. and Q.Z.; methodology, K.Y. and Q.Z.; software, K.Y. and W.W.; validation, K.Y., Q.Z. and Q.L.; formal analysis, K.Y.; investigation, K.Y.; data curation, K.Y.; writing—original draft preparation, K.Y.; writing—review and editing, K.Y., Q.Z., B.W., B.L. and Q.L.; visualization, K.Y. and W.W.; supervision, Q.Z. and Q.L.; funding acquisition, Q.Z., B.W. and Q.L. All authors have read and agreed to the published version of the manuscript.

Funding

This research was funded by the National Natural Science Foundation of China, grant number 42203011, the Joint Funds of the National Natural Science Foundation of China, grant numbers U2341246 and U24A20319, and startup fund from the Zhejiang University of Technology grant to Bei Wang, grant number 2023044163001.

Data Availability Statement

The original contributions presented in this study are included in the article/Supplementary Materials. Further inquiries can be directed to the corresponding authors.

Acknowledgments

The authors thank the academic editor and anonymous reviewers for their constructive and thoughtful comments, which significantly improved the manuscript. They also thank Jun Li and his group members at the Zhejiang University of Technology in China for their invaluable assistance with the sample collection and pretreatment.

Conflicts of Interest

The authors declare no conflicts of interest. The funders had no role in the design of the study; in the collection, analyses, or interpretation of data; in the writing of the manuscript; or in the decision to publish the results.

References

  1. Barrat, J.-A.; Bayon, G. Practical guidelines for representing and interpreting rare earth abundances in environmental and biological studies. Chemosphere 2024, 352, 141487. [Google Scholar] [CrossRef] [PubMed]
  2. Saputro, S.P.; Godang, S.; Priadi, B.; Basuki, N.I.; Himawan, B. Geochemical study of Al–Fe–Ti enrichment in rock weathering: Implications for the recognizing of igneous protolith and the enrichment of REE in soil profile. Appl. Geochem. 2022, 140, 105259. [Google Scholar] [CrossRef]
  3. Liu, H.; Guo, H.; Pourret, O.; Wang, Z.; Sun, Z.; Zhang, W.; Liu, M. Distribution of rare earth elements in sediments of the North China Plain: A probe of sedimentation process. Appl. Geochem. 2021, 134, 105089. [Google Scholar] [CrossRef]
  4. Han, R.; Zhang, Q.; Wang, D.; Zhong, Q.; Han, G. Discrimination of brewing technologies and assessment of health risks based on rare earth elements: Evidence of fingerprint in Chinese famous vinegars. Food Chem. 2025, 464, 141539. [Google Scholar] [CrossRef]
  5. Han, G.; Liu, M.; Li, X.; Zhang, Q. Sources and geochemical behaviors of rare earth elements in suspended particulate matter in a wet-dry tropical river. Environ. Res. 2023, 218, 115044. [Google Scholar] [CrossRef] [PubMed]
  6. Chakhmouradian, A.R.; Wall, F. Rare Earth Elements: Minerals, Mines, Magnets (and More). Elements 2012, 8, 333–340. [Google Scholar] [CrossRef]
  7. Andrade, R.L.B.; Hatje, V.; Pedreira, R.M.A.; Boening, P.; Pahnke, K. REE fractionation and human Gd footprint along the continuum between Paraguacu River to coastal South Atlantic waters. Chem. Geol. 2020, 532, 119303. [Google Scholar] [CrossRef]
  8. Tommasi, F.; Thomas, P.J.; Pagano, G.; Perono, G.A.; Oral, R.; Lyons, D.M.; Toscanesi, M.; Trifuoggi, M. Review of Rare Earth Elements as Fertilizers and Feed Additives: A Knowledge Gap Analysis. Arch. Environ. Contam. Toxicol. 2021, 81, 531–540. [Google Scholar] [CrossRef]
  9. Bispo, F.H.A.; de Menezes, M.D.; Fontana, A.; Sarkis, J.E.d.S.; Gonçalves, C.M.; de Carvalho, T.S.; Curi, N.; Guilherme, L.R.G. Rare earth elements (REEs): Geochemical patterns and contamination aspects in Brazilian benchmark soils. Environ. Pollut. 2021, 289, 117972. [Google Scholar] [CrossRef]
  10. Costa, L.; Mirlean, N.; Johannesson, K.H. Rare earth elements as tracers of sediment contamination by fertilizer industries in Southern Brazil, Patos Lagoon Estuary. Appl. Geochem. 2021, 129, 104965. [Google Scholar] [CrossRef]
  11. Gwenzi, W.; Mangori, L.; Danha, C.; Chaukura, N.; Dunjana, N.; Sanganyado, E. Sources, behaviour, and environmental and human health risks of high-technology rare earth elements as emerging contaminants. Sci. Total Environ. 2018, 636, 299–313. [Google Scholar] [CrossRef] [PubMed]
  12. Dushyantha, N.; Batapola, N.; Ilankoon, I.M.S.K.; Rohitha, S.; Premasiri, R.; Abeysinghe, B.; Ratnayake, N.; Dissanayake, K. The story of rare earth elements (REEs): Occurrences, global distribution, genesis, geology, mineralogy and global production. Ore Geol. Rev. 2020, 122, 103521. [Google Scholar] [CrossRef]
  13. Gao, X.; Han, G.; Liu, J.; Zhang, S. Spatial Distribution and Sources of Rare Earth Elements in Urban River Water: The Indicators of Anthropogenic Inputs. Water 2023, 15, 654. [Google Scholar] [CrossRef]
  14. Ma, S.; Han, G. Rare earth elements reveal the human health and environmental concerns in the largest tributary of the Mekong river, Northeastern Thailand. Environ. Res. 2024, 252, 118968. [Google Scholar] [CrossRef]
  15. Han, G.; Xu, Z.; Tang, Y.; Zhang, G. Rare Earth Element Patterns in the Karst Terrains of Guizhou Province, China: Implication for Water/Particle Interaction. Aquat. Geochem. 2009, 15, 457–484. [Google Scholar] [CrossRef]
  16. Bayon, G.; Toucanne, S.; Skonieczny, C.; André, L.; Bermell, S.; Cheron, S.; Dennielou, B.; Etoubleau, J.; Freslon, N.; Gauchery, T.; et al. Rare earth elements and neodymium isotopes in world river sediments revisited. Geochim. Cosmochim. Acta 2015, 170, 17–38. [Google Scholar] [CrossRef]
  17. Guo, Y.; Yang, S.; Su, N.; Yin, P.; Wang, Z. Rare earth element geochemistry of the sediments from small rivers draining southeast China. Mar. Geol. Quat. Geol. 2018, 38, 139–149. [Google Scholar]
  18. Zhu, C.; Wang, Q.; Huang, X.; Yun, J.; Hu, Q.; Yang, G. Adsorption of amino acids at clay surfaces and implication for biochemical reactions: Role and impact of surface charges. Colloids Surf. B Biointerfaces 2019, 183, 110458. [Google Scholar] [CrossRef]
  19. Bishop, B.A.; Alam, M.S.; Flynn, S.L.; Chen, N.; Hao, W.; Ramachandran Shivakumar, K.; Swaren, L.; Gutierrez Rueda, D.; Konhauser, K.O.; Alessi, D.S.; et al. Rare Earth Element Adsorption to Clay Minerals: Mechanistic Insights and Implications for Recovery from Secondary Sources. Environ. Sci. Technol. 2024, 58, 7217–7227. [Google Scholar] [CrossRef]
  20. Liu, Z.; Gu, X.; Lian, M.; Wang, J.; Xin, M.; Wang, B.; Ouyang, W.; He, M.; Liu, X.; Lin, C. Occurrence, geochemical characteristics, enrichment, and ecological risks of rare earth elements in sediments of “the Yellow river−Estuary−bay” system. Environ. Pollut. 2023, 319, 121025. [Google Scholar] [CrossRef]
  21. Brito, P.; Prego, R.; Mil-Homens, M.; Caçador, I.; Caetano, M. Sources and distribution of yttrium and rare earth elements in surface sediments from Tagus estuary, Portugal. Sci. Total Environ. 2018, 621, 317–325. [Google Scholar] [CrossRef] [PubMed]
  22. Cui, Z.; Chen, C.; Chen, Q.; Huang, J. Difference in the Contribution of Driving Factors to Nitrogen Loss With Surface Runoff Between the Hill and Plain Agricultural Watersheds. J. Geophys. Res. Biogeosci. 2024, 129, e2023JG007931. [Google Scholar] [CrossRef]
  23. Zhu, J.; Liu, X.; Deng, J.; Zhang, H.; Peng, J. Suspended solids transport rate of the rivers around western Lake Taihu. Acta Sci. Circumstantiae 2018, 38, 3682–3687. [Google Scholar]
  24. Yang, J.; Huang, X. The 30 m annual land cover datasets and its dynamics in China from 1985 to 2023. In Earth System Science Data; Zenodo: Geneve, Switzerland, 2024; Volume 13. [Google Scholar]
  25. Yang, K.; Han, G.; Zeng, J.; Zhou, W. Distribution, fractionation and sources of rare earth elements in suspended particulate matter in a tropical agricultural catchment, northeast Thailand. PeerJ 2021, 9, e10853. [Google Scholar] [CrossRef] [PubMed]
  26. Grawunder, A.; Lonschinski, M.; Händel, M.; Wagner, S.; Merten, D.; Mirgorodsky, D.; Büchel, G. Rare earth element patterns as process indicators at the water–solid interface of a post–mining area. Appl. Geochem. 2018, 96, 138–154. [Google Scholar] [CrossRef]
  27. Taylor, S.R.; McLennan, S.M. Continental Crust: Its Composition and Evolution: An Examination of the Geochemical Record Preserved in Sedimentary Rocks; Blackwell Scientific Publications: Oxford, UK, 1985; 312p. [Google Scholar]
  28. Huang, H.; Lin, C.; Yu, R.; Yan, Y.; Hu, G.; Wang, Q. Spatial distribution and source appointment of rare earth elements in paddy soils of Jiulong River Basin, Southeast China. J. Geochem. Explor. 2019, 200, 213–220. [Google Scholar] [CrossRef]
  29. Rétif, J.; Zalouk-Vergnoux, A.; Briant, N.; Poirier, L. From geochemistry to ecotoxicology of rare earth elements in aquatic environments: Diversity and uses of normalization reference materials and anomaly calculation methods. Sci. Total Environ. 2023, 856, 158890. [Google Scholar] [CrossRef]
  30. Zhou, Y.; Yang, X.; Zhang, D.; Mackenzie, L.L.; Chen, B. Sedimentological and geochemical characteristics of sediments and their potential correlations to the processes of desertification along the Keriya River in the Taklamakan Desert, western China. Geomorphology 2021, 375, 107560. [Google Scholar] [CrossRef]
  31. Rahlf, P.; Laukert, G.; Hathorne, E.C.; Vieira, L.H.; Frank, M. Dissolved neodymium and hafnium isotopes and rare earth elements in the Congo River Plume: Tracing and quantifying continental inputs into the southeast Atlantic. Geochim. Cosmochim. Acta 2021, 294, 192–214. [Google Scholar] [CrossRef]
  32. Zeng, J.; Han, G.; Yang, K. Assessment and sources of heavy metals in suspended particulate matter in a tropical catchment, northeast Thailand. J. Clean Prod. 2020, 265, 121898. [Google Scholar] [CrossRef]
  33. Galhardi, J.A.; Leles, B.P.; de Mello, J.W.V.; Wilkinson, K.J. Bioavailability of trace metals and rare earth elements (REE) from the tropical soils of a coal mining area. Sci. Total Environ. 2020, 717, 134484. [Google Scholar] [CrossRef] [PubMed]
  34. Taylor, S.R.; McLennan, S.M. The geochemical evolution of the continental crust. Rev. Geophys. 1995, 33, 241–265. [Google Scholar] [CrossRef]
  35. Wang, X.; Zhou, J.; Xu, S.; Chi, Q.; Nie, L.; Zhang, B.; Yao, W.; Wang, W.; Liu, H.; Liu, D.; et al. China soil geochemical baselines networks: Data characteristics. Geol. China 2016, 43, 1469–1480. [Google Scholar]
  36. Sutherland, R.A. Bed sediment-associated trace metals in an urban stream, Oahu, Hawaii. Environ. Geol. 2000, 39, 611–627. [Google Scholar] [CrossRef]
  37. Hakanson, L. An ecological risk index for aquatic pollution control.a sedimentological approach. Water Res. 1980, 14, 975–1001. [Google Scholar] [CrossRef]
  38. Chen, H.; Chen, Z.; Chen, Z.; Ou, X.; Chen, J. Calculation of Toxicity Coefficient of Potential Ecological Risk Assessment of Rare Earth Elements. Bull. Environ. Contam. Toxicol. 2020, 104, 582–587. [Google Scholar] [CrossRef] [PubMed]
  39. Godwyn-Paulson, P.; Jonathan, M.P.; Rodríguez-Espinosa, P.F.; Rodríguez-Figueroa, G.M. Rare earth element enrichments in beach sediments from Santa Rosalia mining region, Mexico: An index-based environmental approach. Mar. Pollut. Bull. 2022, 174, 113271. [Google Scholar] [CrossRef]
  40. Wang, X.; Zhou, J.; Chi, Q.; Wang, W.; Zhang, B.; Nie, L.; Liu, D.; Xu, S.; Wu, H.; Gao, Y. Geochemical Background and Distribution of Rare Earth Elements in China: Implications for Potential Prospects. Acta Geosci. Sin. 2020, 41, 747–758. [Google Scholar]
  41. Yang, S.Y.; Jung, H.S.; Choi, M.S.; Li, C.X. The rare earth element compositions of the Changjiang (Yangtze) and Huanghe (Yellow) river sediments. Earth Planet. Sci. Lett. 2002, 201, 407–419. [Google Scholar] [CrossRef]
  42. Ma, S.; Han, G. Distribution, provenance, contamination, and probabilistic ecological risk of rare earth elements in surface sediments of Jiulong River estuary and adjacent watershed. Ocean Coast. Manag. 2024, 254, 107205. [Google Scholar] [CrossRef]
  43. Han, G.; Yang, K.; Zeng, J. Spatio-Temporal Distribution and Environmental Behavior of Dissolved Rare Earth Elements (REE) in the Zhujiang River, Southwest China. Bull. Environ. Contam. Toxicol. 2022, 108, 555–562. [Google Scholar] [CrossRef] [PubMed]
  44. Petrosino, P.; Sadeghi, M.; Albanese, S.; Andersson, M.; Lima, A.; De Vivo, B. REE contents in solid sample media and stream water from different geological contexts: Comparison between Italy and Sweden. J. Geochem. Explor. 2013, 133, 176–201. [Google Scholar] [CrossRef]
  45. Alderton, D.H.M.; Pearce, J.A.; Potts, P.J. Rare earth element mobility during granite alteration: Evidence from southwest England. Earth Planet. Sci. Lett. 1980, 49, 149–165. [Google Scholar] [CrossRef]
  46. Yan, D.; Wünnemann, B.; Gao, S.; Zhang, Y. Early Holocene tidal flat evolution in a western embayment of East China Sea, in response to sea level rise episodes. Quat. Sci. Rev. 2020, 250, 106642. [Google Scholar] [CrossRef]
  47. Fu, H.; Jian, X.; Pan, H. Bias in sediment chemical weathering intensity evaluation: A numerical simulation study. Earth-Sci. Rev. 2023, 246, 104574. [Google Scholar] [CrossRef]
  48. Feng, J.L.; Hu, Z.G.; Ju, J.T.; Zhu, L.P. Variations in trace element (including rare earth element) concentrations with grain sizes in loess and their implications for tracing the provenance of eolian deposits. Quat. Int. 2011, 236, 116–126. [Google Scholar] [CrossRef]
  49. Yin, F.Y.; Li, W.; Xie, G.Q.; Cai, L.; Zhou, Y.Q.; Wu, J.; Meng, Y.Q. Genesis of the Wangu Au deposit in the Jiangnan orogenic belt: Constraints from texture, trace element, and in-situ Sr isotope of scheelite. Ore Geol. Rev. 2025, 176, 106375. [Google Scholar] [CrossRef]
  50. Song, Y.H.; Choi, M.S. REE geochemistry of fine-grained sediments from major rivers around the Yellow Sea. Chem. Geol. 2009, 266, 328–342. [Google Scholar] [CrossRef]
  51. Wood, S.A. The aqueous geochemistry of the rare-earth elements and yttrium: 1. Review of available low-temperature data for inorganic complexes and the inorganic REE speciation of natural waters. Chem. Geol. 1990, 82, 159–186. [Google Scholar] [CrossRef]
  52. Liang, X.; Wu, P.; Wei, G.; Yang, Y.; Ji, S.; Ma, L.; Zhou, J.; Tan, W.; Zhu, J.; Takahashi, Y. Enrichment and fractionation of rare earth elements (REEs) in ion-adsorption-type REE deposits: Constraints of an iron (hydr)oxide-clay mineral composite. Am. Mineral. 2025, 110, 114–135. [Google Scholar] [CrossRef]
  53. Yang, S.; Wang, Z. Rare Earth Element Compositions of the Sediments from the Major Tributaries and the Main Stream of the Changjiang River. Bull. Mineral. Petrol. Geochem. 2011, 30, 31–39. [Google Scholar]
  54. Yang, S.; Wang, Z.; Guo, Y.; Li, C.; Cai, J. Heavy mineral compositions of the Changjiang (Yangtze River) sediments and their provenance-tracing implication. J. Asian Earth Sci. 2009, 35, 56–65. [Google Scholar] [CrossRef]
  55. Tóth, A.; Sipos, P.; Jakab, G.; Szalai, Z.; Kalicz, P.; Madarász, B. Improving the reliability of using rare earth elements as soil erosion tracers. CATENA 2024, 243, 108175. [Google Scholar] [CrossRef]
  56. Han, R.Y.; Xu, Z.F. Geochemical Behaviors of Rare Earth Elements (REEs) in Karst Soils under Different Land-Use Types: A Case in Yinjiang Karst Catchment, Southwest China. Int. J. Environ. Res. Public Health 2021, 18, 502. [Google Scholar] [CrossRef] [PubMed]
  57. Özen, Y. Distribution and origin of rare earth elements (REEs) in topsoils and soil profiles of southern Konya (Turkey): Implication for controls on the dynamics of REEs in soils and bedrocks. CATENA 2024, 246, 108352. [Google Scholar] [CrossRef]
  58. Chakraborty, B.; Bera, B.; Roy, S.h.; Adhikary, P.P.; Sengupta, D.; Shit, P.K. Assessment of non-carcinogenic health risk of heavy metal pollution: Evidences from coal mining region of eastern India. Environ. Sci. Pollut. Res. 2021, 28, 47275–47293. [Google Scholar] [CrossRef]
  59. Chen, H.; Chen, R.; Teng, Y.; Wu, J. Contamination characteristics, ecological risk and source identification of trace metals in sediments of the Le’an River (China). Ecotoxicol. Environ. Saf. 2016, 125, 85–92. [Google Scholar] [CrossRef]
  60. Simbanegavi, T.T.; Gwenzi, W. Chapter 11—Ecological health risks of high-technology rare earth elements. In Emerging Contaminants in the Terrestrial-Aquatic-Atmosphere Continuum; Gwenzi, W., Ed.; Elsevier: Amsterdam, The Netherlands, 2022; pp. 171–194. [Google Scholar] [CrossRef]
Figure 1. (a) The location and elevation map of the Hang-Jia-Hu area. (b) The 30 m land cover map in 2023 [24]. (c) The simplified lithology map of the ETX basin.
Water 17 01279 g001
Figure 2. The REE concentrations of surface sediment samples in the ETX basin.
Water 17 01279 g002
Figure 3. PAAS-normalized REE curves of surface sediment samples: (a) riparian sediments (RSs); (b) riverbed sediments (RBSs); (c) paddy field sediments in the ETX basin; (d) comparison of average PAAS-normalized REE patterns in the RSs, RBSs, paddy field sediments, Changjiang River sediments [41], and Mun River sediments [14].
Water 17 01279 g003
Figure 4. Spearman’s rank correlation coefficients between the geochemical parameters of REEs and the geochemical composition in (a) river sediments, (b) RSs, and (c) RBSs. The bold shows the statistically significant correlation at p < 0.05 (*) or p < 0.01 (**).
Water 17 01279 g004
Figure 5. Cluster analysis diagram of REE concentrations (La–Lu) and the PAAS-normalized REE ratios of individual sediment samples in the ETX basin.
Water 17 01279 g005
Figure 6. Heatmap of enrichment factor (EF) of single REE element for surface sediments in the ETX basin using three background values: (a) UCC [34]; (b) CDS [35], and (c) PS1 in this study.
Water 17 01279 g006
Figure 7. A stacked bar chart of Eri for a single REE gives the comprehensive potential ecological risk index (RI) for each sediment sample in the ETX basin.
Water 17 01279 g007
Table 1. REEs and Al concentrations of the UCC, CDS, and PS1 in this study.
LaCePrNdSmEuGdTbDyHoErTmYbLu∑REEAl
mg/kgmg/kgmg/kgmg/kgmg/kgmg/kgmg/kgmg/kgmg/kgmg/kgmg/kgmg/kgmg/kgmg/kgmg/kg%
UCC 130.0064.007.1026.004.500.883.800.643.500.802.300.332.200.32146.378.04
CDS 232.0062.007.4027.405.101.104.500.704.300.802.400.402.500.40151.006.30
PS1 336.0173.638.2230.355.861.185.030.713.860.762.300.332.150.33170.716.19
Notes: 1 UCC denotes the upper continental crust [34]. 2 CDS denotes the deep soil geochemical baseline values of China [35]. 3 PS1 denotes the paddy topsoil sample (PS1) in this study.
Table 2. Statistics of REEs, major metal element concentrations, and other geochemical parameters of the surface sediments in the ETX basin.
ComponentUnitsRiparian Sediments (RSs)Riverbed Sediments (RBSs)Paddy Field SedimentsRSs + RBSs
Avg 1Max 2Min 3AvgMaxMinAvgMaxMinAvg
Lamg/kg39.0844.1736.8140.2044.7230.1633.5936.0131.1539.64
Cemg/kg79.1389.6973.4082.3197.0256.3169.8073.6365.2280.72
Prmg/kg8.809.658.499.2210.256.767.668.227.419.01
Ndmg/kg31.6735.1230.2533.2538.7323.0327.9630.3526.3832.46
Smmg/kg5.926.675.436.537.994.235.405.865.186.22
Eumg/kg1.151.470.921.251.460.741.151.191.071.20
Gdmg/kg5.065.764.305.586.823.544.645.034.365.32
Tbmg/kg0.740.860.630.801.040.540.660.710.620.77
Dymg/kg4.074.443.574.566.013.153.623.863.334.32
Homg/kg0.810.870.720.881.180.600.710.760.670.85
Ermg/kg2.472.632.262.623.482.002.142.302.032.55
Tmmg/kg0.350.380.330.380.500.290.310.330.300.37
Ybmg/kg2.482.782.212.543.241.962.062.151.952.51
Lumg/kg0.370.390.350.380.510.300.320.340.300.37
∑REEmg/kg182.10204.71169.67190.50222.92133.62160.03170.71151.53186.30
∑LREEmg/kg158.68178.63148.94164.98190.70116.27139.01148.21130.16161.83
∑MREEmg/kg16.9419.1914.8418.7223.3212.2015.4816.6314.6717.83
∑HREEmg/kg6.486.895.896.808.905.155.545.875.266.64
(La/Yb)N41.171.231.021.181.321.021.211.281.081.17
(La/Sm)N40.961.010.900.911.030.810.900.970.860.93
(Sm/Yb)N41.221.311.021.301.451.101.331.391.261.26
Ce/Ce*40.981.000.960.981.050.911.001.040.990.98
Eu/Eu*40.981.120.890.971.080.891.081.181.010.98
Alwt%6.236.915.635.606.314.475.796.195.315.91
Cawt%0.600.950.311.032.170.311.182.930.360.82
Fewt%3.123.412.743.063.561.903.043.902.413.09
Kwt%1.352.410.861.011.870.631.251.341.161.18
Mgwt%0.690.810.451.042.510.240.610.830.360.87
Mnwt%0.100.120.040.090.130.050.160.450.040.09
Nawt%0.771.130.670.880.980.770.640.730.480.83
Tiwt%0.330.370.250.340.420.160.400.430.330.33
Clay%52.7860.7235.0439.2653.8630.6843.7467.7932.2346.02
Silt%38.2241.8129.3653.7967.3831.4755.9066.7532.2146.01
pH47.317.616.857.647.937.317.047.516.267.47
Notes: 1 Avg refers to the average of each component. 2 Max refers to the maximum of each component. 3 Min refers to the minimum of each component. 4 Dimensionless parameters.
Disclaimer/Publisher’s Note: The statements, opinions and data contained in all publications are solely those of the individual author(s) and contributor(s) and not of MDPI and/or the editor(s). MDPI and/or the editor(s) disclaim responsibility for any injury to people or property resulting from any ideas, methods, instructions or products referred to in the content.

