Article

The Water–Energy Nexus in Thermoelectric Power Plants: A Focus on Italian Installations Regulated Under the Integrated Emission Directive

by
Alessandro Stracqualursi
*,
Francesca Mauro
and
Roberto Borghesi
Department for Environmental Evaluations, Control and Sustainability, Italian Institute for Environmental Protection and Research (ISPRA), Via Vitaliano Brancati 48, 00144 Rome, Italy
*
Author to whom correspondence should be addressed.
Water 2025, 17(9), 1285; https://doi.org/10.3390/w17091285
Submission received: 27 March 2025 / Revised: 22 April 2025 / Accepted: 24 April 2025 / Published: 25 April 2025
(This article belongs to the Section Water-Energy Nexus)

Abstract

:
The study investigates the impact of water use in energy production in industrial plants, considering the interdependence between water and energy, or the water–energy nexus, to promote sustainable water and energy management. More specifically, it focuses on the industrial sector, particularly on electricity production in thermoelectric power plants, which require large amounts of water for cooling in its production cycle. The field of analysis is set in Italy, referring to the applications of the European Industrial Emissions Directive and Italian regulations that govern water and energy usage. The focus is on large combustion plants, which need to be monitored by national authorities. The Italian situation is outlined, exposing consumption data from major thermoelectric power plants in 2021 through 2023, highlighting the water usage trend and electricity production. In 2023, total water use for these installations was 9,892,719,965 m3—mainly from seawater—with an overall production of electric energy of 117,239,954 MWh, with a relevant fuel consumption from natural gas (18,544,742,774 Sm3). It also analyzed the application of best available techniques to reduce water consumption, recycle water flows, and minimize the environmental impact of power plants. Finally, the main fuels used in these plants, such as natural gas, coal, and biomass, are presented, along with the environmental performance of the power plants based on water use per unit of energy produced.

1. Introduction

1.1. Water–Energy Nexus in Industrial Sector

Water and energy resources show a strong interdependence, described by the concept of the water–energy nexus (WEN), highlighting how the use of one influences the availability and consumption of the other. This complex relationship is crucial for the sustainable management of natural resources and has significant implications for water and energy security, with a considerable relevance in the industrial sector.
This interdependence is reflected in the environmental resilience of a site, in terms of its ability to react to pressures of anthropogenic origin, particularly due to industrial production. The bidirectional connection can be summarized in the following concepts:
  • Energy for water: the use of energy required in phases such as withdrawal and transport, treatment, heating and cooling, especially in industrial applications, and desalination of water.
  • Water for energy: the use of water for energy production in hydroelectric, thermoelectric, biomass, biofuel plants, fuel extraction, and treatment and refining.

1.2. Literature Background

In recent literature reviews, the main issues related to the topic of WEN in the industrial sector concern interdisciplinary gaps, data challenges and opportunities, methodological approaches, water use in energy systems, and industry development. Despite the growing interest, interdisciplinary research figures as a limited field, highlighting the need for integrated approaches [1]. The knowledge gap between scholars and policymakers hinders effective decision-making. Many methods are employed, without a general shared framework with international relevance [2,3,4]. Data availability at regional/local levels is a major challenge, with issues in disaggregation, transparency, and reproducibility. A centralized data repository could improve research collaboration and energy efficiency benchmarking [5,6,7,8]. Understanding regional water–energy patterns is essential for effective policy interventions, but a global perspective is needed for scalability and comparability. However, many studies have addressed this problem by proposing examples of the application of tools at the global [9], macroregional [10,11], national [12], urban [13], and building scales [14].
Existing research methods are often narrow, static, or outdated, requiring a more comprehensive approach that includes historical analysis, input–output models, scenario analysis, and policy impact assessments [15], also due to the complexity in the quantification of values and defining their relationship using mathematical approaches [16,17]. Scenario-based analysis and improved measurement tools are essential for addressing systemic inefficiencies.
Water use for energy production assumes a relevant role in power generation, with specific concerns about water resource security for the green economy and improving efficiency [1,7,18]. Low-carbon technologies (e.g., hydro, nuclear, biofuels) present both opportunities and challenges related to water use and CO2 emissions [19]. This emphasizes the need for transitioning from fossil fuels to sustainable energy systems and requires a focus on water resource security and efficient management practices.
In industry development as a whole, a theme is the integration of WEN with broader concepts that consider the interlinkages and synergies of the resources, such as food production from agriculture [20,21], also correlating with other concepts such as the circular economy, industrial ecology [22], and technological advancements in Industry 4.0 [23].
The implications and challenges connected to the WEN include resource efficiency through consumption reduction and innovative technologies [24], along with the application of best practices in industrial settlements and for other uses (civil, irrigation, water reserves, etc.). Integrated management is thus a goal to pursue in addressing nexus-related challenges and promoting sustainable development through the implementation of policies and regulations and the planning of infrastructural interventions and investments.

1.3. European and Italian Framework

The European roadmap to reduce water consumption fits within the broader context of the environmental and sustainable policies of the European Union (EU). This plan aims to ensure the sustainable management of water resources by improving water use efficiency and protecting aquatic ecosystems. The Water Framework Directive [25] establishes a framework to protect the EU’s inland, coastal, and transitional waters. The main goal is to achieve “good status” for all waters by 2027, with basin management plans and programs to reduce pollution, improve water efficiency, and protect aquatic ecosystems. Based on the conclusions of the fitness check of the Water Framework Directive, from its implementation until 2019, the total volume of water supplied from inland surface and groundwater sources decreased by 17.6%, with groundwater’s relative contribution to the total volume extracted increasing from 19% to 23%. An important aspect to take into account is that a significant contribution to this decrease derives from the reduction of the water used for cooling, due to the efficiency measures improved in energy production.
Among strategies for sustainable water management, water conservation in industry is a central point. The EU’s Circular Economy Action Plan [26] includes specific objectives for the sustainable use of water resources, such as the reuse of wastewater and resource recovery. The EU also supports the adoption of innovative technologies to improve water efficiency through research and development programs, such as Horizon Europe, which funds initiatives to improve water resource management. Additional support comes from economic incentive policies, through discounted rates and subsidies for efficient technologies. A specific focus is the use of water in the industrial sector. In energy production, particularly electricity, substantial water withdrawals occur for cooling generation plants at thermoelectric power plants (TEPPs). In the water balance of installations, water demand is strongly linked to production activities, from synthesis processes to energy generation. It is crucial in TEPPs for steam production, cooling, and recycling within the system, ensuring operational efficiency and the continuity of electricity production.
According to the water withdrawal indicator of the European Environment Agency (EEA) for the EU [27], in 2019 (the latest year recorded), cooling water in TEPPs represented about 32% of total water withdrawals, making this production sector the largest consumer of water resources, followed by agriculture and public supply (Figure 1). In Europe, about 60% of the electricity fed into the grid is produced using water in cooling processes (around 90 billion m3/year).
The latest available data for Italy, collected by the National Institute of Statistics (ISTAT), date back to 2012 [28] and provide an estimate of the volumes of water withdrawn for electricity production in power plants. With a total production of 207,327 GWh, the annual levy is about 18.51 million m3, of which only 0.6% is destined for the production process. The main source of supply is seawater (88.1%), followed by inland waters such as streams, canals, and wells, or industrial waterworks and other production processes from neighboring plants and wastewater treatment plants (Figure 2).
The total volume of inland water taken from surface and groundwater bodies is 1.6 billion m3, of which the actual use is 1.4 billion.

1.4. The Link with the Industrial Emissions Directive in Europe

In Europe and EU member states, a specific permit is required for the operation of large combustion plants with a rated thermal input not less than 50 MW, including power plants (i.e., TEPPs), heating plants, refineries, and other industrial facilities using fossil fuels or biomass. This is mandated by Directive 96/61/EC (IPPC—Integrated Pollution Prevention and Control) [29] and later by Directive 2010/75/EU on Industrial Emissions (IED—Industrial Emission Directive) [30] and IED 2.0 [31]. These plants must comply with the best available techniques (BAT) as defined in the BAT reference documents (BREFs) published by the European Commission.
The Integrated Environmental Authorization (IEA or AIA for Italy) is the permit for the operation of an installation (According to Article 3(3) of the IED Directive: “Installation means a stationary technical unit within which one or more activities listed in Annex I or in Part 1 of Annex VII are carried out, and any other directly associated activities on the same site which have a technical connection with the activities listed in those Annexes and which could have an effect on emissions and pollution”) in compliance with IPPC requirements and environmental performance in response to BAT. A key feature of the EIA is the integrated approach, which considers multiple environmental factors (air, water, soil, waste) in the analysis of impacts, rather than focusing on individual pollution aspects. The goal is to minimize the overall environmental impact of industrial activities. An integrated evaluation, therefore, requires attention to the direct and indirect relationships triggered between these factors. In this context, the WEN is significant as it establishes the connection between energy and water resource flows. Although closely related, water and energy are usually evaluated and regulated independently, even though their consumption is not unidirectional: all the energy is produced through water consumption, whether direct, using water in the production cycle, or indirect, as seen with the water footprint (specific indicator to measure the total volume of freshwater used—directly and indirectly—to produce the goods and services) associated with raw materials or fuels used.
Further provisions are outlined within the relevant BATs. Examining the conclusions on the best available techniques for large combustion plants [32], BAT 13 focuses on reducing water usage and the volume of contaminated wastewater discharged, through water recycling techniques and/or dry bottom ash handling. Residual aqueous streams from the plant, including run-off water, must be reused for other purposes. The degree of recycling is limited by the quality requirements of the recipient water stream and the plant’s water balance.
In Italy, through Legislative Decree 152/06, Part II, Title III-bis [33] and DM 274/2015 [34], and subsequent amendments, the role of control authority is assigned to ISPRA (Italian Institute for Environmental Protection and Research). Among its tasks is the drafting of the Monitoring and Control Plan (MCP) [35], consistent with the Conclusive Technical Report and attached to the EIA Decree is issued by the competent authority Ministry of Environment and Energy Security (MASE) after the conclusion of a shared procedural process—through a formal agreement amongst two or more public administrations, with internal rules and purposes—that considers the observations of the public, the operator, and public and private stakeholders [36]. Each year, the operator submits an annual monitoring report containing the previous year’s operative data. The reporting is preparatory to draw up inspection plans. Installations as TEPPs and other combustion plants with rated thermal input ≥ 300 MW and thermal plants belonging to the national gas network with rated thermal input ≥ 50 MW fall under national jurisdiction, not regional, for their relevance.
The Regulatory Authority for Energy, Networks, and Environment (ARERA) recorded 14,905 electricity producers in Italy in 2022, with an electricity production of 181,000 GWh, from various sources of supply and conditions [37].

1.5. Objectives of the Study

Based on these premises, the study was conducted with two main objectives:
(a)
Estimate the use of water resources in electricity production and the impact on different sources of supply.
(b)
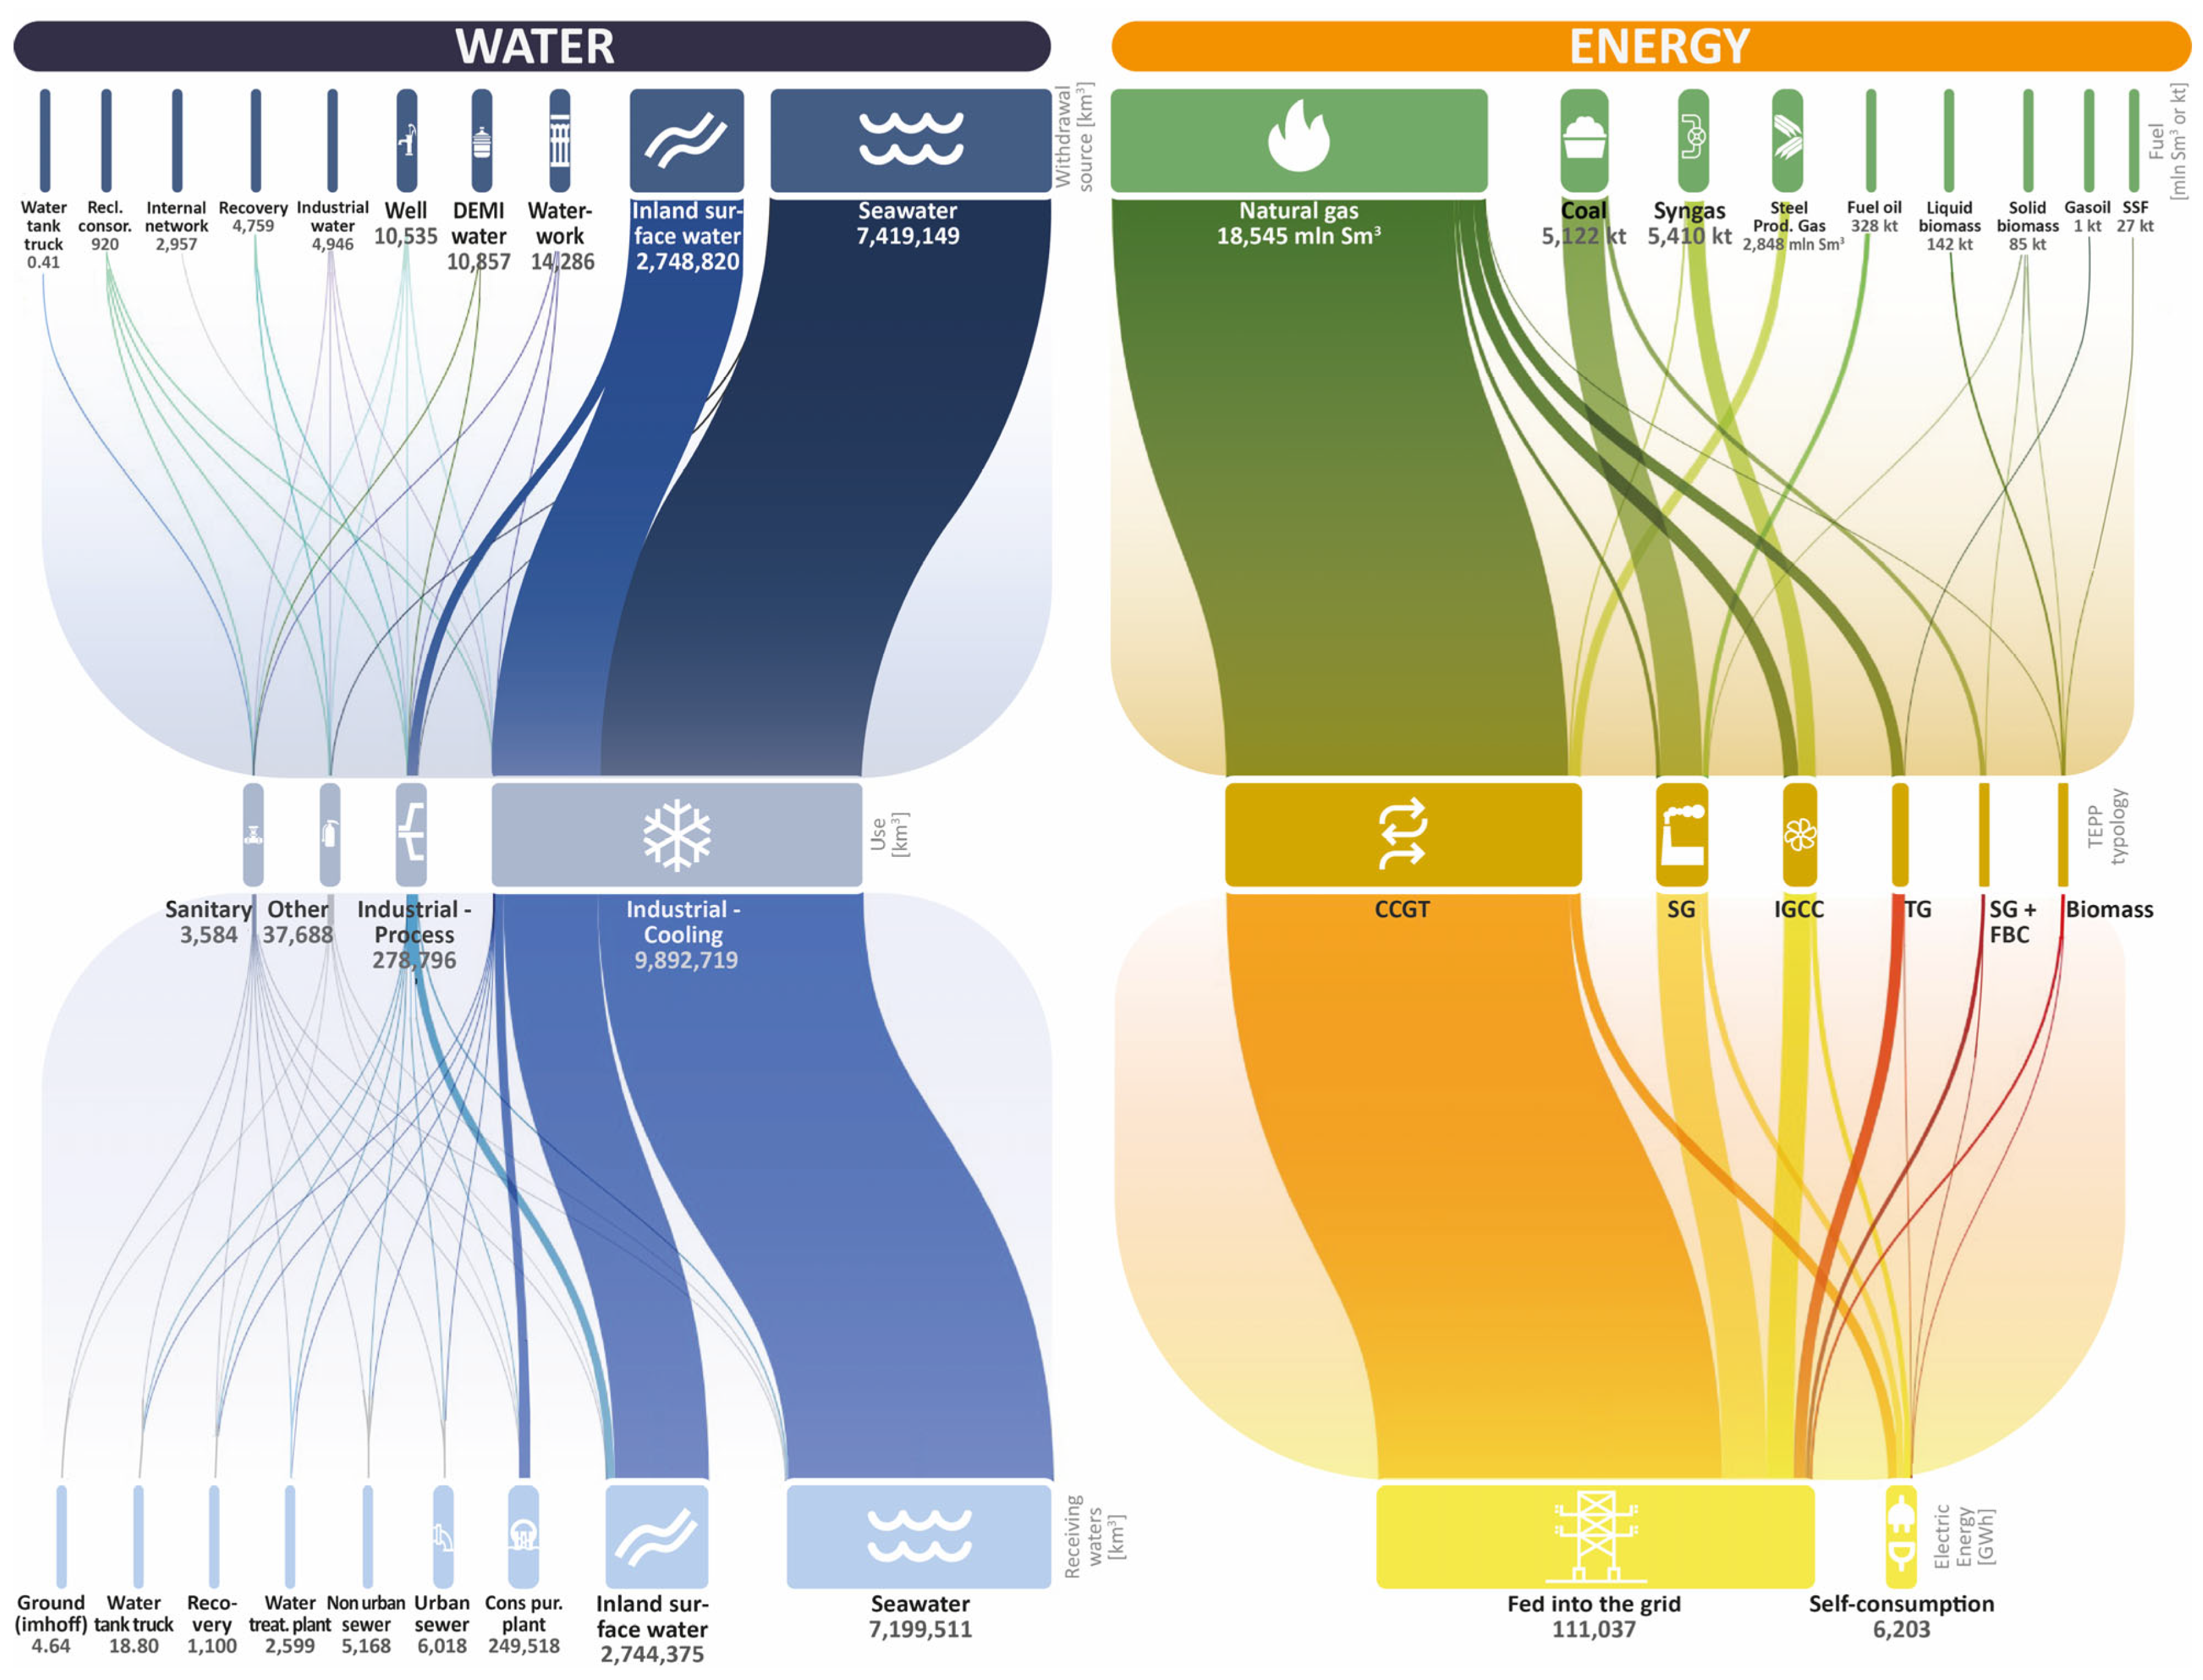
Analyze the flow of water and energy resources in the production of electricity in large combustion plants.

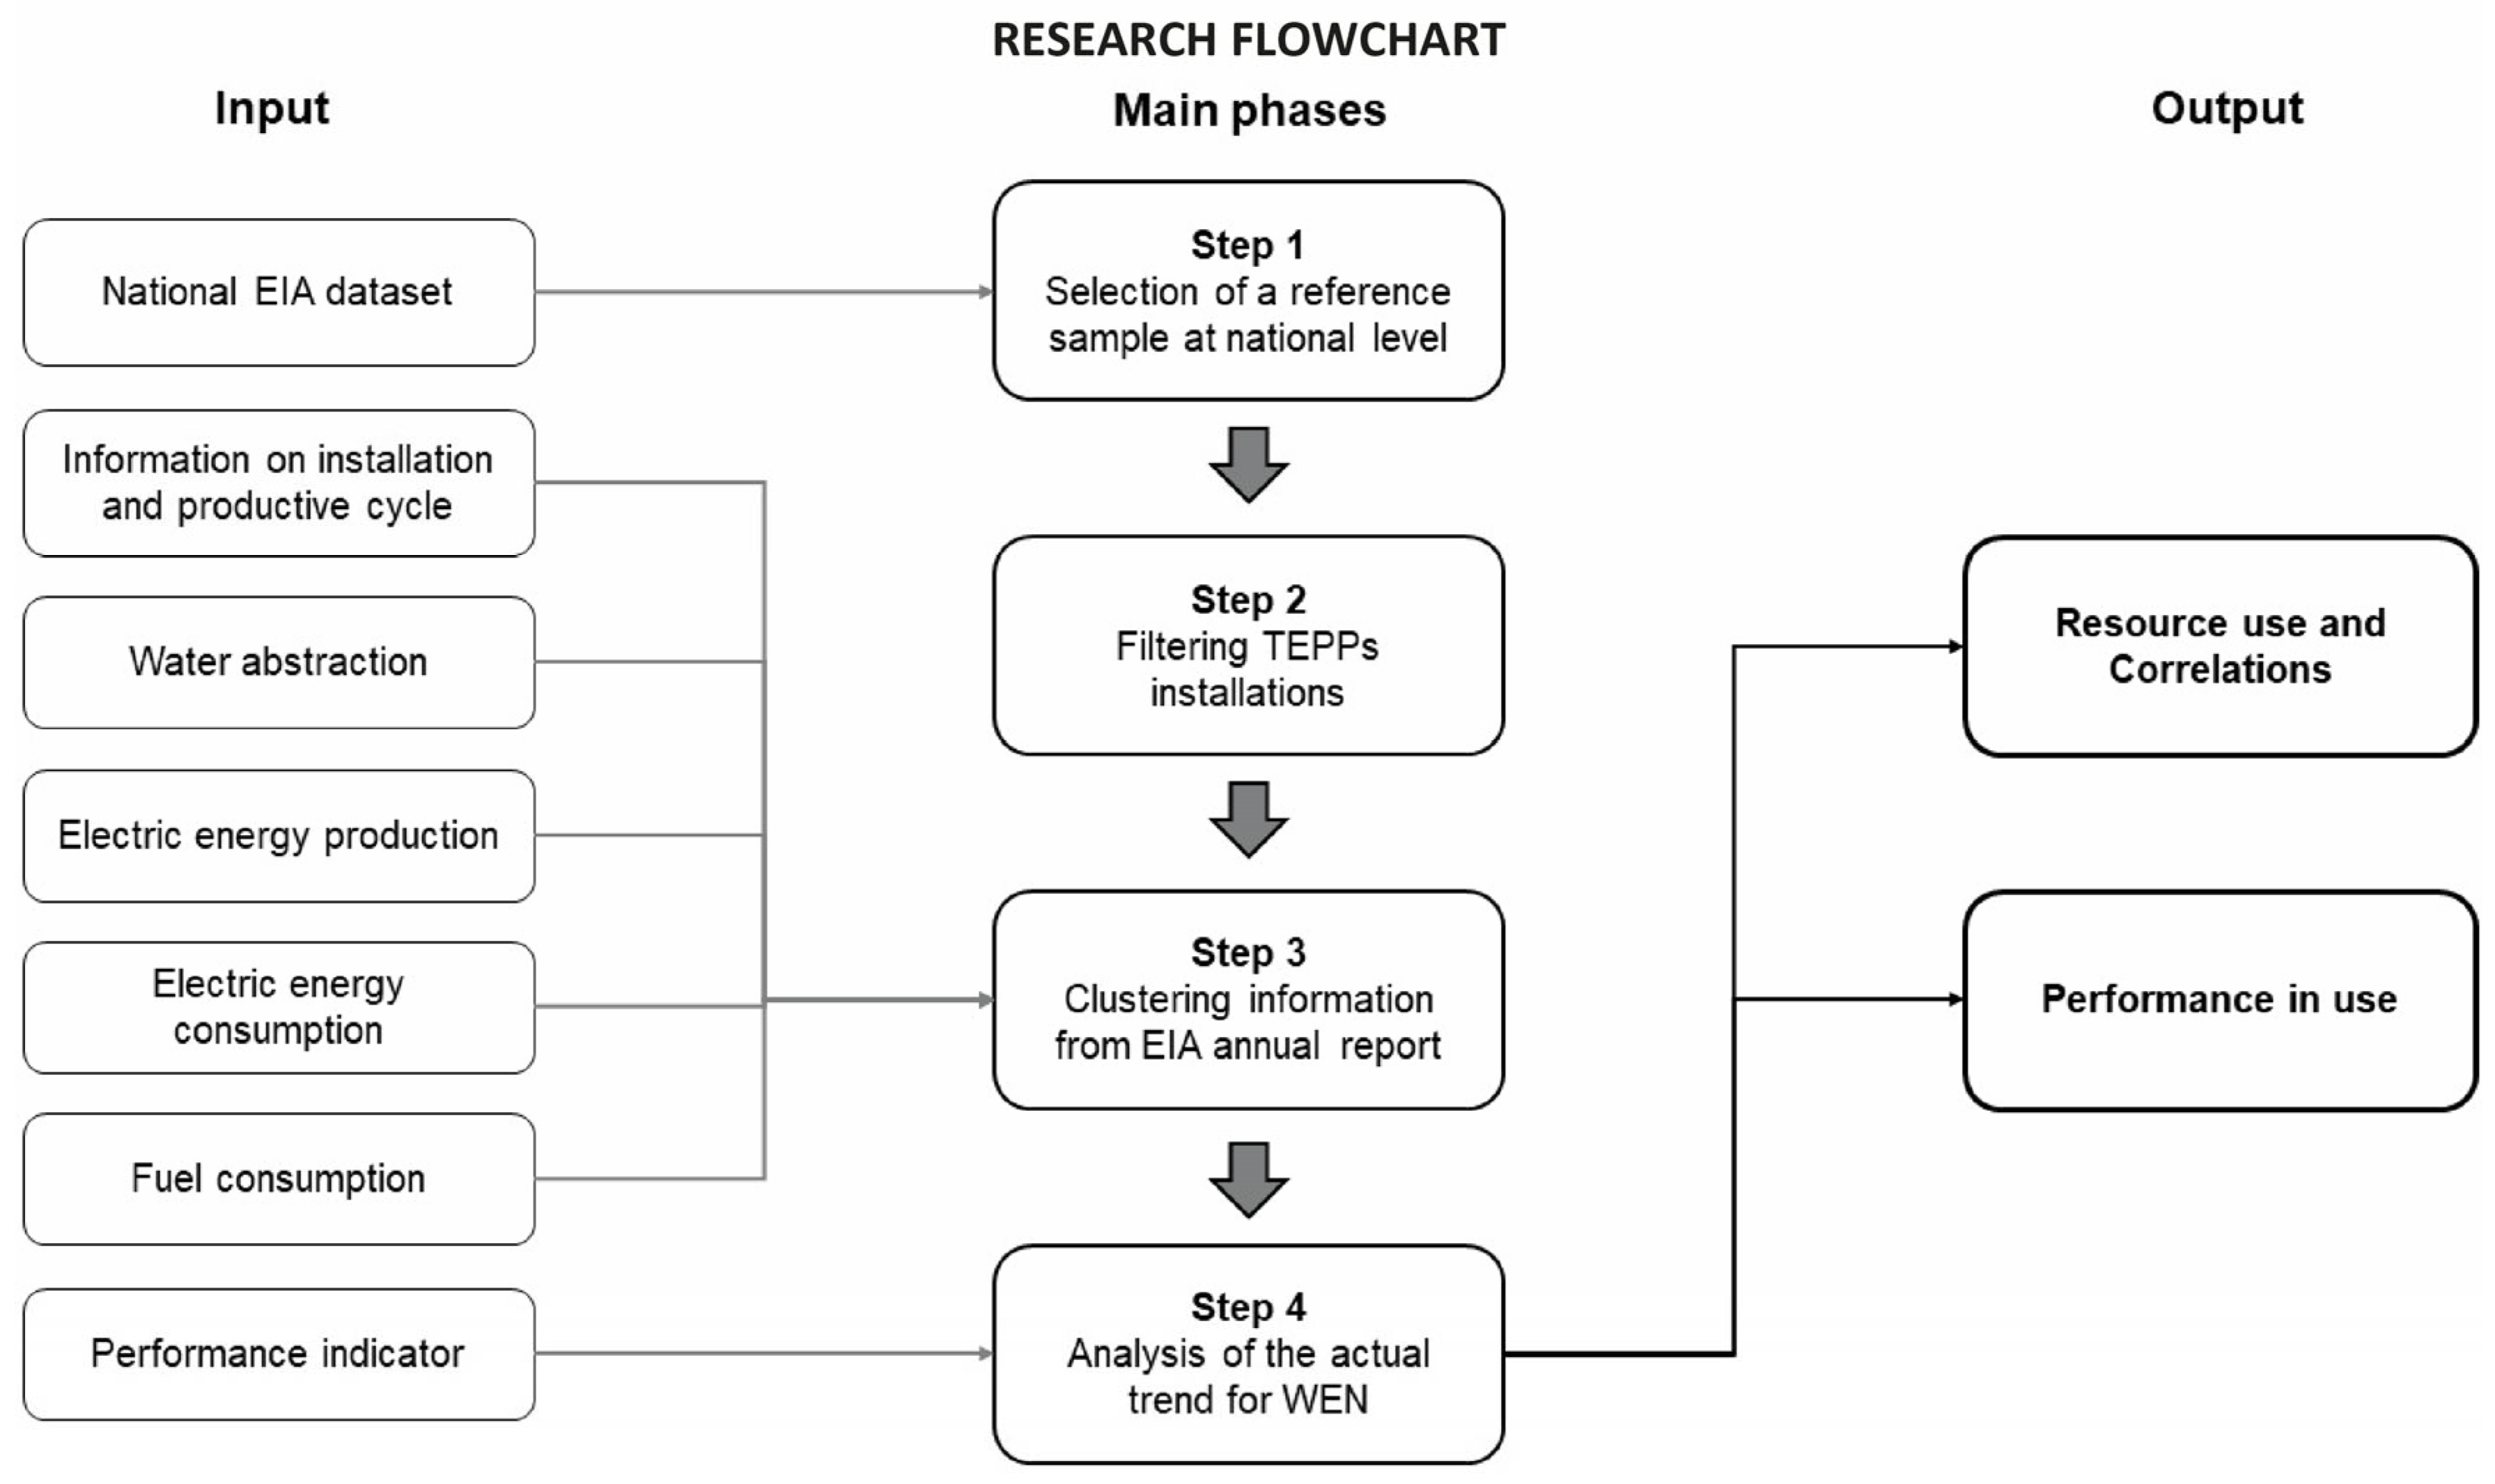
2. Materials and Methods

The research model was conceived to balance clarity and effectiveness, leveraging a carefully structured and validated dataset that guarantees analytical robustness and reliability. This approach facilitates the examination of the alignment between the theoretical concepts outlined in the introduction and the observable dynamics in the actual operative context. Special attention has been given to the existing regulatory framework, which functions both as a constraint and as an interpretive lens for the investigation. Furthermore, the active involvement of the institutions responsible for data collection, management, and oversight is crucial to the empirical validation of the model.
The research process was organized into four main phases, based on the information on TEPPs collected by ISPRA under the framework of Directive 2010/75/EU for national EIA. More in detail, the following activities were performed:
  • Selecting a reference dataset to conduct the study (i.e., the national EIA data);
  • Filtering the above-mentioned dataset with the TEPPs installations;
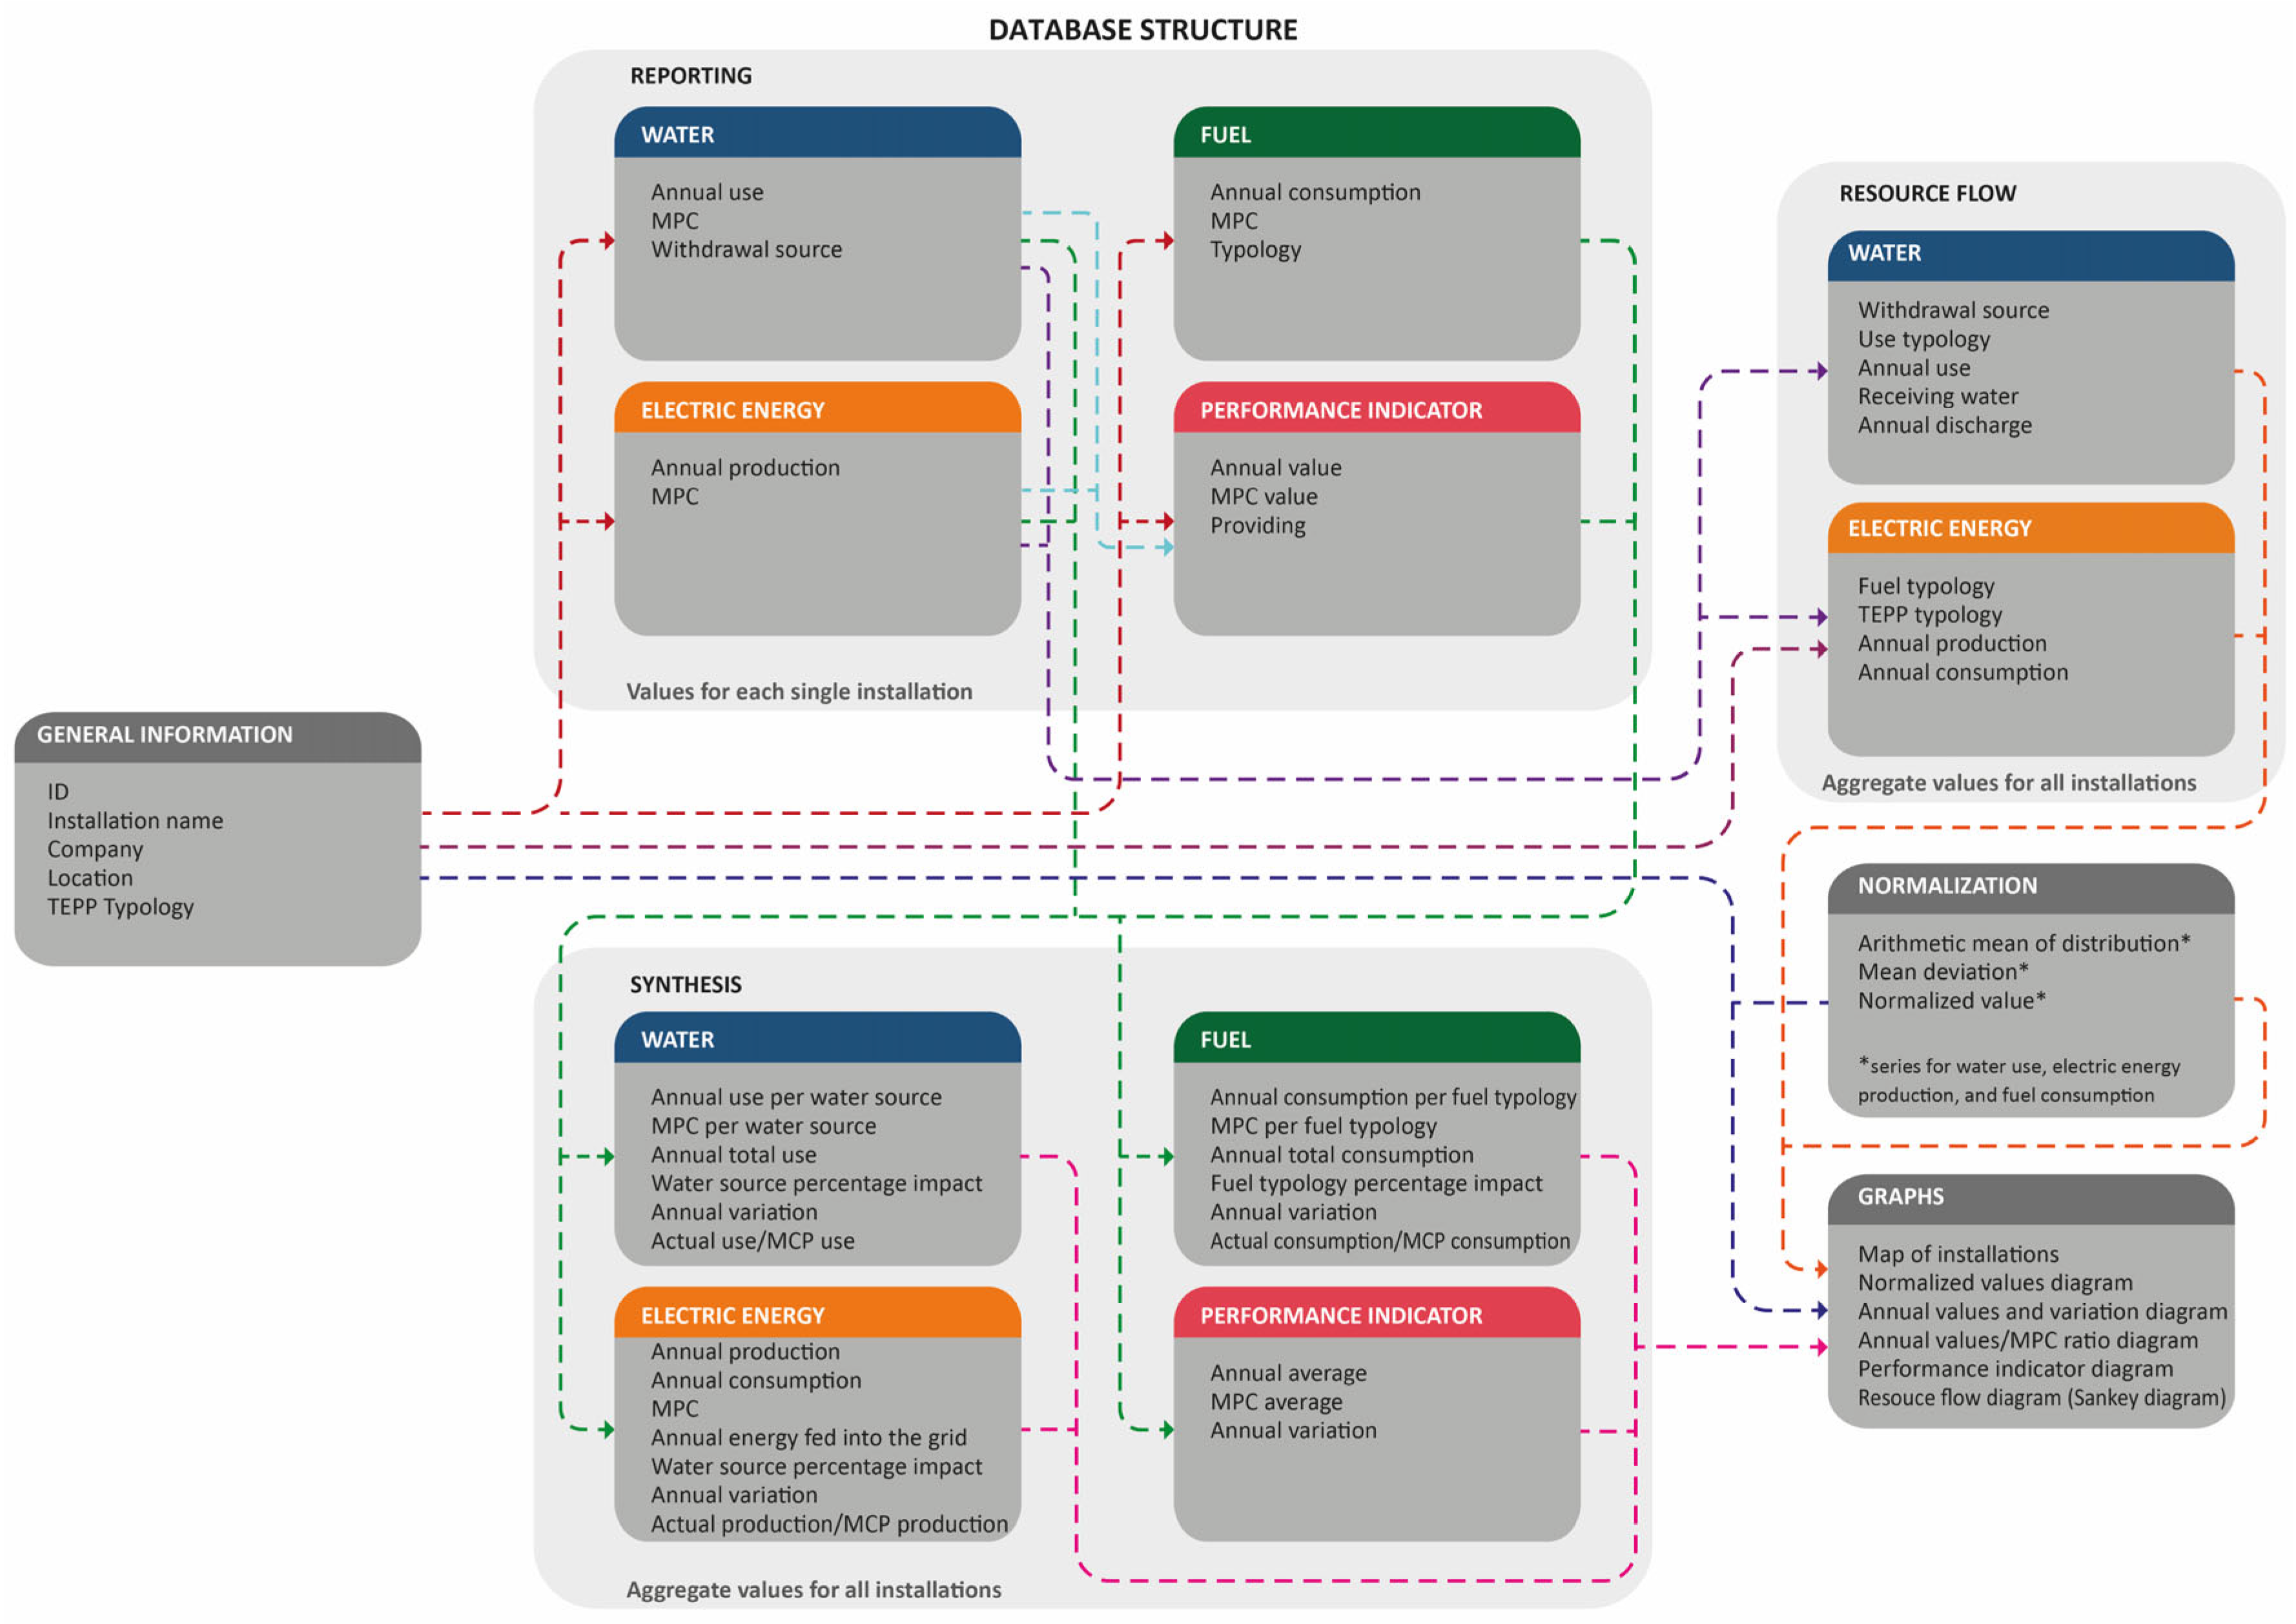
  • Clustering data with reference to water, energy, and fuel;
  • Assessing the actual trend for WEN.
The methodology is synthesized in Figure 3.
Phase 1 of data acquisition was carried out by collecting the annual monitoring reports, transmitted to ISPRA by the operators that exercise with an EIA of national relevance, but also publicly uploaded on the MASE online repository [38], as an object of public evidence.
Within phase 2, the analysis field was contextualized to TEPPs as a type of installation representative of water use for energy production. The study considers 72 functional TEPPs with national relevance, with combustion of fuels in installations with a total rated thermal output equal to or greater than 300 MW (IPPC code 1.1). This set does not include natural gas compressor stations, noting that the major Italian operator in this sector has communicated on more than once occasion that the process of burning gas does not require the use of water for industrial use, and the thermal plants are only for heat production, although both fall within the same IPPC code 1.1.
In phase 3, specific use/consumption parameters were extracted relating to three years (2021–2023) for all the TEPPs and compared with the maximum production capacity (MPC) values authorized with EIA for the specific installation. The monitored values are the following:
  • Information on the type of installation, in terms of technology used in the productive cycle;
  • Water abstraction, restricted to the field of use of industrial cooling (where not specified, including process water) and the relative supply source;
  • Electric energy gross production and self-consumption for production;
  • Fuel used in terms of quantity (mass for solid and liquid fuels, volume for gaseous fuels);
  • Performance indicator, defined as the ratio between water use and energy produced.
In terms of performance capacity, the additional parameter of a performance indicator is required in the MCP to compare the resource use/consumption (cooling water or overall industrial) and the quantity of the main product of the IPPC activity of the installation (in this case, electricity). This is the site of a survey of operators reporting this indicator (regardless of the regulatory framework). When it is not directly reported, the value is estimated based on the available data.
Moreover, the target given by the European roadmap related to decarbonization reminds us that coal-fired TEPPs are in a phase of decommissioning (expected by 2025 according to the National Integrated Plan for Energy and Climate (PNIEC)) [39]. The fuels monitored are related to the main production systems, excluding specific consumption for auxiliary and emergency installations.
The last stage involves the data analysis. Phase 4 contains the processing of the use/consumption trend of single resources, their causal connection by type and quantity, the main types of installed plant, and their impact (resource use and correlations). In this step, the use of specific tools was foreseen, including spreadsheet-based calculation software founded on systematically arranged data. The values were reprocessed through calculation (i.e., total amount, normalization, average, etc.) and subsequently visualized using the same software. Further refinements were carried out using built-in applications and graphics editing software. Moreover, the metadata from spreadsheets were structured to be implemented in Geographic Information System applications, allowing their use as an attribute table for the geolocation of the installations. For a detailed overview of the structure and organization of the database, please refer to Appendix A.
Resource efficiency was assessed by considering the average performance indicator among the installations and comparing the production capacity authorized at the sites, or MPC, with the actual use of resources.
A further point of depth is the market allocation, evaluated through the number of players managing the TEPPs, the quantity of power plants they operate, and the impact on the market in terms of production capacity.
However, it is necessary to provide clarification on the data and highlight data gaps. For the ID 45 plant, the data acquired were consistent only for 2021, since it has been in the phase of decommissioning since 2022. ID 107 and ID 108 are also in decommissioning, not yet concluded, so data have been acquired, but with limited values in terms of production quantity and resource use or consumption. Data are not available for ID 16 and 49 (disused) and for ID 194 (‘cold storage’), and are partially available for ID 198 (new plant structure functional since 2023). Additionally, in the data communication process with the operators, since the transmission format is continuously updated in accordance with the changes to the MCP to which they must comply, some annual data may be missing or not required. In such cases, use/consumption values were considered at the MPC level (these values are provided by the operators based on estimation models accredited in compliance with technical regulations). The data gaps primarily affect three installations (ID 16, ID 49, and ID 194) out of a total of 72. Given the size of the overall sample analyzed, the impact of this gap can be considered negligible. Specifically, these installations are included in the sample solely for census and mapping purposes and do not generate data that would compromise the statistical values.

3. Results

The initial analysis reveals that it is possible to distinguish six different types of operative plants, distributed according to the data reported in Table 1. The distribution of these plants in Italian national territory is represented in Figure 4.
Relating to the resources used in these installations, it was found that in the last reference year (2023), total annual water abstraction was 9,892,719,965 m3 (26,234,224,365 m3 authorized). The main source of supply was seawater, with a withdrawal of 7,343,940,171 m3 (19,703,685,882 m3 authorized), backed by water from inland surface water bodies with 2,535,643,352 m3 (6,498,794,680 m3 authorized), which provided almost all of the supply. Clearly, seawater is the largest and most used source and accounts for 74% of demand within 37.5% of TEPPs, while inland surface water bodies account for 25% through 21% of the installations. The remaining 1% of use is related to water sampling from waterworks with 6,490,596 m3 (14,741,197 m3 authorized), wells with 1,662,914 m3 (6,498,310 m3 authorized), reclamation consortium with 671,290 m3 (5,797,360 m3 authorized), and industrial water with 1,354,612 m3 (4,139,760 m3 authorized). The balance is further compounded by the internal recovery network with 2,957,029 m3.
In the same year, the gross electricity production was 117,239,954 MWh (398,089,409 MWh authorized), with a related self-consumption value of 6,202,699 MWh (23,612,884 MWh authorized).
The fuels detected are solid (solid biomass, coal, solid fuels from non-hazardous waste), liquid (liquid biomass, diesel, fuel oil), and gaseous (natural gas, steel gas, syngas). The combustion of these solid, gaseous, and liquid fuels results in pollutant emissions, including nitrogen oxides (NOx), sulphur dioxide (SO), hydrogen chloride (HCl), hydrogen fluoride (HF), volatile organic compounds (VOCs), fine dust, and heavy metals, including mercury. The quantity of such pollutants can vary according to the initial composition of the fuel. The majority of fuels came from gaseous fossil fuels, with an annual total consumption of 18,544,742,774 Sm3 (98,078,151,468 Sm3 authorized) of natural gas (methane), 2,847,863,181 Sm3 (11,484,318,300 Sm3 authorized) of iron and steel gases, and 5,409,968 t (8,745,044 t authorized) of syngas. Coal-fired TEPPs are still in operation, using 5,121,798 t (21,628,685 t authorized) per year. Liquid fuels included fuel oil with a consumption impact of 328,287 t (1,895,664 t authorized), liquid biomass with 141,506 t (240,498 t authorized), and low diesel with 953 t (1389 t authorized). These types of fuel, unique among the identified renewables, are used only in specific cases. Biomass and waste fuels are used exclusively in ID 629. In the case of solid biomass, co-combustion applications can be found in the coal-fired power plants ID 51 and ID 80.
To permit a direct and more immediate comparison between the variables of water abstraction, electricity production and fuel consumption, in Figure 5 is proposed a graph with the normalization by the mean values of the individual resources associated with the single installations. Given the differences among the fuels, the mean for this resource was estimated on the net calorific value communicated by the operators about fuel characteristics. In addition, the calorific value is a fundamental property for assessing the efficiency and performance of fuels.
The performance indicator for water use per unit of electric energy generated was, on average, 79 m3/MWh in 2023. This mean value was calculated considering the mean deviation standard and excluding outliers below the 5th or above the 95th percentile. In fact, the value varies considerably depending on the type of TEPP and fuel used. In coal-fired power plants, the average indicator is 329 m3/MWh, while in natural gas power plants it is 77 m3/MWh. Despite the importance of the indicator in monitoring the environmental performance in the plants’ annual reports, in the 2023 report, this parameter was specifically delivered only in 67% of cases (48 installations). For the other installations, the indicator was computed using individual data reported, as the ratio between water use and gross energy production.
Further information is given in the following graphs on the annual change between 2021 and 2023 (Figure 6) and the ratio of actual consumption to declared consumption at MPC (yield) (Figure 7). Comparing the water withdrawal between 2021 and 2023, there was a total reduction of 395,384,529 m3 of water, compared to a reduced production of 19,414,302 MWh, which is also associated with a decrease in the consumption of fuels, mainly solid (508,202 t), then liquid (78,773 t), and gaseous (5,658,961,746 Sm3). In particular, it should be noted that coal consumption was steadily declining in the last year (−42%). In the examination of these variations, it is appropriate to consider that the trend in resource use and energy production can be discontinuous. In some cases, the installations operated to a lesser extent for one year, or have not used specific sections powered with particular fuels (i.e., syngas in ID 30 and ID 171, and liquid biomass in ID 629, in 2021). This is visible in the significant increase in syngas use between 2021 and 2022.
The performance indicator varies in accordance with the previous values (Figure 8).
Further connections can be identified by considering the water use for cooling associated with different TEPP typologies, as outlined in Table 2. It is evident that the volume of water used is predominantly linked to the operation of CCGT and SG power plants, as these are the most widespread and productive types. CCGT plants account for 75% of the total analyzed installations and contribute 59% of the overall annual water use, while SG plants represent 11% of the total and account for nearly 34% of the water use. However, the values are presented for all TEPP types to highlight their impact on overall water consumption. Nevertheless, the performance indicator values for SG+FBC, IGCC, TG, and biomass are singular values associated with a unique installation (or a few installations). While they are included as existing cases, they should not be considered statistically representative.
In order to understand the flow of resources in these plants and give an immediate overview of the stream, in Figure 9 is represented a Sankey diagram for water and energy. This type of diagram is widely used for describing resource flows [40], as a useful support allowing for clearly and intuitively visualizing the distribution of resources (water, energy, fuel) and transformations within a system. In Figure 9, it is possible to observe the relationship between the use of different resources, including fuels in different types of TEPPs, the energy generated, and the sources of supply.
Finally, a further consideration on operators and companies of these plants should be represented. There are 26 different companies active in the sector, with different capacities: only five of them manage 60% of the installations, producing 64% of the total electric energy.

4. Discussion

The study collected data on water abstraction and use in relation to electricity production in Italian thermal power plants authorized by the national EIA.
The novelty of the work lies in the analysis of the WEN within the framework of the IED, with a specific focus on a national context. An additional aspect is the development of clear and accessible infographics aimed at illustrating the interconnections between water resources, energy, and fuels, supported by the targeted processing of relevant data.
As a result, different types of plants are used for different types of fuels, mainly more natural gas (methane) and less coal, which is reflected in the increase of CCGT plants and reduction of SG plants, generally coal-fired.
It is precisely the decarbonization path that leads to reflection on the importance of this transition, as well as on the reduction of emissions into the atmosphere, and also on the reduced demand for water resources. This is evident in the performance indicator provided in the annual reports, which is strongly linked to coal-fired power plants. On the other hand, decarbonization has led to a centralization in the use of natural gas (methane), also determining a vulnerability and dependence of this resource at a national scale.
Natural gas has the advantages of low emissions of dust, SO2, and heavy metals, and the main limitations are related to NOx emissions, external dependency, exposure to supply security risks, and cost volatility. Coal is characterized by high calorific value and (historically) broad availability, but it contributes to high emissions of SO2, NOx, and particulates. Moreover, biomass is a renewable source with potential long-term carbon neutrality, but is limited by problems of logistics and storage, and by lower efficiency.
Fuels are another area of analysis to be explored, mainly in the assessment of the water footprint that they have in terms of extraction/production, and which could significantly affect the water balance of a TEPP. Therefore, it may be useful to propose the method of analysis also for refining plants, offshore extraction platforms, and regasification plants.
The resource flow illustrates that water is primarily used in the cooling process, with intake from the sea and subsequent discharge back into the marine environment. Further investigation should be conducted on the impact of discharged water as a function of its temperature. Usually required within the MCP, in terms of thermal load on the receiving water body (sea).
The amount of water recovered is still difficult to estimate. Volume is rarely quantified and reported. There are some cases where the water recovery is total, as in installations that declare a production system zero liquid discharge, or without any discharge, if not intermittent. This recalls the importance of operators’ accuracy in providing data in annual reports. Recovery water within the installation is often not calculated, and the performance indicator is not always estimated. The commitment to be undertaken is to account precisely for the recovery water and bring the indicator to a complete coverage value, also considering the impact of water reuse in its quantification.
A further consideration can be made regarding how geographical configuration influences decisions in resource management. As shown in the previous map of TEPP location (Figure 4) and supported by the results, the distribution of these installations in Italy is strongly conditioned by its peninsular conformation. A significant concentration of TEPPs is found along coastal areas, where access to large volumes of seawater—used predominantly for cooling purposes—is available. In northern Italy, a substantial number of TEPPs powered by natural gas are located near the Po River and its tributaries, utilizing inland surface water both for cooling water intake and for discharge at the end of the cycle. The limited direct access to seawater in this region is a key factor explaining why large combustion plants in northern Italy tend to cluster around these freshwater sources.
As a last point, the energy market is dominated by a limited number of major companies, complemented by a multitude of smaller entities operating individual installations. Further investigation is required to evaluate the relationship between water abstraction and fuel supply costs and the overall electric energy production.

Limitations of the Study

The limitations of the study can be identified in the following aspects. The majority of functional TEPPs in Italy operate with a regional authorization, being under the threshold set for large combustion plants. The control authority for these installations is the Regional Environmental Protection Agencies (ARPA). These agencies operate on a regional administrative scale, and this leads to a more complex aggregation of data from 21 different institutional sources. Even though the production capacity of these smaller TEPPs is limited, it represents, as a whole, a relevant amount of electricity fed into the national grid.
In addition, the reference sample is limited to a national context. This can bring out possible differences with other European countries: on the one hand, in the state of application of directives, on the other hand, in the impact of directives on the use of resources. The different geographical configurations among nations can have an effect on the source and availability of resources (as in the example of Italy).
Moreover, the national sample is not suitable for representing the WEN in the industrial process dimension (TEPP type). As demonstrated in Table 1 and Table 2, the majority of installations belong to the CCGT plant category. For example, Biomass type was observed in only one instance, making it statistically low in significant for comparison purposes. Therefore, the incorporation of additional European data is necessary to accurately assess the WEN within the context of industrial processes.
The time range of the analysis must also be considered. It is limited to a three-year period, due to an incomplete and non-coherent source of public data in the previous period. Continuing over the years, there is a prospect of widening this range.
For this reason, a further development perspective for research, but also for institutional collaboration between public authorities, is to build a structured database with this information.

5. Conclusions

In addition to the output highlighted in the discussion section, some conclusions can be drawn. The study comes to the elaboration of statistical data, describing the current state and showing trends in consumption over a limited period. As a result, this approach limits the overall field of vision and reduces the robustness of any trend conclusions. This choice is due to the large number of installations covered. The authors are interested in deepening the analysis through the implementation of a subsequent phase, to be presented with forthcoming research. This involves the study of a sample of relevant TEPPs, in which the data collection is extended to a wider time range, over 10 years, defining the trend of resource use through three-time phases: the granting of the first EIA, the introduction of the IED Directive, and the overall re-examination after the emission of the new BAT conclusions. Moreover, a second development perspective is to extend the analysis to TEPPs under regional EIA jurisdiction. Despite their smaller sizes (≥ 50 MW and < 300 MW), they are still quantitatively superior and diffused (127 in Italy), representing a large share of electric energy production. Relying on the official information flows among national and regional authorities, this phase can represent an important step towards a collaborative and coordinated management of monitoring activities.
These perspectives would allow a comprehensive trend to be assessed, and conclusions modelled on the effects of these regulations in terms of their efficacy in reducing environmental impacts and promoting prevention.

Author Contributions

Conceptualization: A.S. and F.M.; methodology: A.S., F.M. and R.B.; software: A.S.; validation: F.M.; formal analysis: A.S.; data curation: A.S.; writing—original draft: A.S.; writing—review & editing: F.M. and R.B.; visualization: A.S.; supervision: R.B.; funding acquisition: R.B. All authors have read and agreed to the published version of the manuscript.

Funding

This research was partially funded by the Italian Ministry for the Environment and Energy Safety, under a joint agreement signed with ISPRA for technical support in the Integrated Environmental Authorization procedures.

Data Availability Statement

All data acquired and processed in this study were collected from the public reports transmitted by the operators and published on the MASE online repository, available at: https://va.mite.gov.it/en-GB (accessed on 23 April 2025).

Acknowledgments

The authors thank all the ISPRA colleagues who supported this project.

Conflicts of Interest

The authors declare no conflicts of interest.

Appendix A

All data acquired for the study were organized in spreadsheets and collected as follows. They have been subdivided into general information, TEPP reporting, resource flow, synthesis, normalization of values, and graphs. General information is used to describe the installation, through ID code, name, company, location, and type of installation (Table A1). TEPP reporting provides values of water use, energy production, and fuel consumption per year and at MPC, for all the installations (Table A2). It also shows the performance indicator. Resource flow is divided between water and energy. Water flow contains withdrawal source, use, receiving water, and use (Table A3), while energy flow includes the fuel typology, TEPP typology, self-consumption, and energy fed into the grid (net production) (Table A4). In the synthesis (Table A5), there are the aggregated values extracted from the previous steps, divided by output categories. Normalization provides a comparison of absolute values (Table A6). Finally, data are represented through specific graphs, reported, after some improvements, as figures in the main text. A summary graph of the database structure is represented in Figure A1.
Table A1. Illustrative scheme of general information.
Plant IDInstallationCompanyProvinceRegionTEPP TypologyNotes
nrTEPP nameSociety Namees. Romees. Lazioes. CCGTDescription
Table A2. Illustrative of TEPP reporting.
IDWater Use [m3/Year]Electric Energy Production [MWh/Year]Fuel Consumption [t/Year] or [Sm3/Year]Performance Indicator [m3/MWh]
202120222023MPCWithdrawal Source202120222023MPC202120222023MPCFuel typology202120222023MPCProvided
nrValueValueValueValuees. WellValueValueValueValueValueValueValueValuees. CoalValueValueValueValueYES/
NO
Table A3. Illustrative scheme of resource flow (water).
IDWithdrawal SourceUse TypologyUseReceiving WaterDischarge
202120222023202120222023
nres. SeawaterCoolingValueValueValuees. SeawaterValueValueValue
ProcessValueValueValueValueValueValue
SanitaryValueValueValueValueValueValue
OtherValueValueValueValueValueValue
Table A4. Illustrative scheme of resource flow (energy).
IDFuelTEPP TypologyUse202120222023
nres. Natural gases. CCGTProductionValueValueValue
ConsumptionValueValueValue
Table A5. Illustrative scheme of synthesis.
ResourceCategoryUseImpactAnnual VariationActual Use/MPC Use
202120222023MPC202120222023
Water [m3]SeawaterValueValueValueValue%Value and %%%%
Inland surface waterValueValueValueValue%Value and %%%%
TOTALValueValueValueValue%Value and %%%%
Electric energy [MWh]Fed into the gridValueValueValueValue%Value and %%%%
Self-consumptionValueValueValueValue%Value and %%%%
PRODUCEDValueValueValueValue%Value and %%%%
Fuel [t] or [Sm3]SolidValueValueValueValue%Value and %%%%
Solid biomassValueValueValueValue%Value and %%%%
TOTAL
Performance indicator [m3/MWh]AverageValueValueValueValuen.a.Value and %n.a.n.a.n.a.
Table A6. Illustrative scheme of normalization.
IDWaterElectric EnergyFuel
UseArithmetic
Mean of Distribution
Mean DeviationNormalized ValuePro-ductionArithmetic Mean of DistributionMean DeviationNormalized ValueCon-sumptionTypologyCalorific ValueArithmetic Mean of DistributionMean DeviationNormalized Value
nrValueValueValueValueValueValueValueValueValueValueValueValueValueValue
Figure A1. Database structure. The diagram represents the configuration of all or part of the relational database for TEPPs. The annual values named in the image refer to 2021, 2022, and 2023.
Water 17 01285 g0a1

References

  1. Helerea, E.; Calin, M.D.; Musuroi, C. Water Energy Nexus and Energy Transition—A Review. Energies 2023, 16, 1879. [Google Scholar] [CrossRef]
  2. Hussey, K.; Pittock, J. The energy–water nexus: Managing the links between energy and water for a sustainable future. Ecol. Soc. 2012, 17. [Google Scholar] [CrossRef]
  3. Vázquez, V.L.; Rodríguez, G.; Daddi, T.; De Giacomo, M.R.; Polders, C.; Dils, E. Policy challenges in transferring the integrated pollution prevention and control approach to Southern Mediterranean countries: A case study. J. Clean. Prod. 2015, 107, 486–497. [Google Scholar] [CrossRef]
  4. Fayiah, M.; Dong, S.; Singh, S.; Kwaku, E.A. A review of water–energy nexus trend, methods, challenges and future prospects. Int. J. Energy Water Resour. 2020, 4, 91–107. [Google Scholar] [CrossRef]
  5. European Parliament; Council of the European Union. Directive 2012/27/EU of the European Parliament and of the Council of 25 October 2012 on Energy Efficiency. This Directive Establishes a Common Framework of Measures for the Promotion of Energy Efficiency Within the European Union. 2012. Available online: https://eur-lex.europa.eu/eli/dir/2012/27/oj/eng (accessed on 23 April 2025).
  6. Kalvani, S.R.; Pinardi, R.; Celico, F. The Water–Energy Nexus in 26 European Countries: A Review from a Hydrogeological Perspective. Water 2024, 16, 2981. [Google Scholar] [CrossRef]
  7. Larsen, M.A.D.; Drews, M. Water use in electricity generation for water-energy nexus analyses: The European case. Sci. Total Environ. 2019, 651, 2044–2058. [Google Scholar] [CrossRef]
  8. Chini, C.M.; Excell, L.E.; Stillwell, A.S. A review of energy-for-water data in energy-water nexus publications. Environ. Res. Lett. 2021, 15, 123011. [Google Scholar] [CrossRef]
  9. Melo Zurita, M.D.L.; Thomsen, D.C.; Holbrook, N.J.; Smith, T.F.; Lyth, A.; Munro, P.G.; De Bruin, A.; Seddaiu, G.; Roggero, P.P.; Baird, J.; et al. Global Water Governance and Climate Change: Identifying Innovative Arrangements for Adaptive Transformation. Water 2018, 10, 29. [Google Scholar] [CrossRef]
  10. Siddiqi, A.; Anadon, L.D. The water–energy nexus in Middle East and North Africa. Energy Policy 2011, 39, 4529–4540. [Google Scholar] [CrossRef]
  11. Dai, J.; Wu, S.; Han, G.; Weinberg, J.; Xie, X.; Wu, X.; Song, X.; Jia, B.; Xue, W.; Yang, Q. Water-energy nexus: A review of methods and tools for macro-assessment. Appl. Energy 2018, 210, 393–408. [Google Scholar] [CrossRef]
  12. Hardy, L.; Garrido, A.; Juana, L. Evaluation of Spain’s water-energy nexus. Int. J. Water Resour. Dev. 2012, 28, 151–170. [Google Scholar] [CrossRef]
  13. Fang, D.; Chen, B. Linkage analysis for the water–energy nexus of city. Appl. Energy 2017, 189, 770–779. [Google Scholar] [CrossRef]
  14. Stracqualursi, A.; Andreucci, M.B. Water Resources Management in a Regenerative Design Approach. In Design for Rethinking Resources; Thomsen, M.R., Ratti, C., Tamke, M., Eds.; Springer International Publishing: Cham, Switzerland, 2024; pp. 615–631. [Google Scholar] [CrossRef]
  15. Hamiche, A.M.; Stambouli, A.B.; Flazi, S. A review of the water-energy nexus. Renew. Sustain. Energy Rev. 2016, 65, 319–331. [Google Scholar] [CrossRef]
  16. Kiteto, M.K.; Mecha, C.A. Navigating the Water–Energy Nexus: A Mathematical Approach. Foundations 2024, 4, 713–737. [Google Scholar] [CrossRef]
  17. Silva-Rubio, S.A.; Salgueiro, Y.; Mora-Meliá, D.; Gutiérrez-Bahamondes, J.H. Improving Water and Energy Resource Management: A Comparative Study of Solution Representations for the Pump Scheduling Optimization Problem. Mathematics 2024, 12, 1994. [Google Scholar] [CrossRef]
  18. Sanders, K.T. Critical Review: Uncharted Waters? The Future of the Electricity-Water Nexus. Environ. Sci. Technol. 2015, 49, 51–66. [Google Scholar] [CrossRef]
  19. Li, H.; Zhao, Y.; Lin, J. A review of the energy–carbon–water nexus: Concepts, research focuses, mechanisms, and methodologies. WIREs Energy Environ. 2020, 9, e358. [Google Scholar] [CrossRef]
  20. Russo, T.; Alfredo, K.; Fisher, J. Sustainable Water Management in Urban, Agricultural, and Natural Systems. Water 2014, 6, 3934–3956. [Google Scholar] [CrossRef]
  21. Bazilian, M.; Rogner, H.; Howells, M.; Hermann, S.; Arent, D.; Gielen, D.; Steduto, P.; Mueller, A.; Komor, P.; Tol, R.S.; et al. Considering the energy, water and food nexus: Towards an integrated modelling approach. Energy Policy 2011, 39, 7896–7906. [Google Scholar] [CrossRef]
  22. Al-Thani, N.A.; Al-Ansari, T. Comparing the convergence and divergence within industrial ecology, circular economy, and the energy-water-food nexus based on resource management objectives. Sustain. Prod. Consum. 2021, 27, 1743–1761. [Google Scholar] [CrossRef]
  23. David, L.O.; Nwulu, N.I.; Aigbavboa, C.O.; Adepoju, O.O. Integrating fourth industrial revolution (4IR) technologies into the water, energy & food nexus for sustainable security: A bibliometric analysis. J. Clean. Prod. 2022, 363, 132522. [Google Scholar] [CrossRef]
  24. Skoczko, I. Energy Efficiency Analysis of Water Treatment Plants: Current Status and Future Trends. Energies 2025, 18, 1086. [Google Scholar] [CrossRef]
  25. European Parliament; Council of the European Union. Directive 2000/60/EC of the European Parliament and of the Council Establishing a Framework for the Community Action in the Field of Water Policy (Water Framework Directive). 2000. Available online: https://eur-lex.europa.eu/legal-content/EN/TXT/PDF/?uri=CELEX:02000L0060-20140101 (accessed on 23 April 2025).
  26. European Commission—Directorate-General for Communication (DG COMM). Circular Economy Action Plan: For a Cleaner and More Competitive Europe; Publications Office of the European Union: Luxembourg, 2020. [Google Scholar] [CrossRef]
  27. European Environment Agency (EEA). Water Abstraction by Economic Sector in the 27 EU Member States, 2000–2019. 2022. Available online: https://www.eea.europa.eu/en/analysis/maps-and-charts/water-abstraction-by-economic-sector (accessed on 23 April 2025).
  28. Istituto Nazionale di Statistica (ISTAT). Utilizzo e Qualità Della Risorsa Idrica in Italia; Rome, Italy, 2019; Available online: https://www.istat.it/it/files/2019/10/Utilizzo-e-qualit%C3%A0-della-risorsa-idrica-in-Italia.pdf (accessed on 23 April 2025).
  29. European Parliament; Council of the European Union. Council Directive 96/61/EC of 24 September 1996 Concerning Integrated Pollution Prevention and Control. 1996. Available online: https://eur-lex.europa.eu/eli/dir/1996/61/oj/eng?eliuri=eli%3Adir%3A1996%3A61%3Aoj&locale=en (accessed on 23 April 2025).
  30. European Parliament; Council of the European Union. Directive 2010/75/EU of the European Parliament and of the Council of 24 November 2010 on Industrial Emissions (Integrated Pollution Prevention and Control) (Recast). 2010. Available online: https://eur-lex.europa.eu/legal-content/EN/TXT/?uri=CELEX%3A02010L0075-20240804 (accessed on 23 April 2025).
  31. European Parliament; Council of the European Union. Directive (EU) 2024/1785 of the European Parliament and of the Council of 24 April 2024 Amending Directive 2010/75/EU of the European Parliament and of the Council on Industrial Emissions (Integrated Pollution Prevention and Control) and Council Directive 1999/31/EC on the Landfill of Waste. 2024. Available online: https://eur-lex.europa.eu/eli/dir/2024/1785/oj/eng (accessed on 23 April 2025).
  32. European Commission. Commission Implementing Decision (EU) 2021/2326 of 30 November 2021 Establishing Best Available Techniques (BAT) Conclusions, Under Directive 2010/75/EU of the European Parliament and of the Council, for Large Combustion Plants. 2024. Available online: https://eur-lex.europa.eu/eli/dec_impl/2021/2326/oj/eng (accessed on 23 April 2025).
  33. Consiglio dei Ministri. Decreto Legislativo 3 Aprile 2006, n. 152, “Norme in Materia Ambientale”. GU Serie Generale n.88 del 14-04-2006—Suppl. Ordinario n. 96, Rome, IT. 2006. Available online: https://www.gazzettaufficiale.it/dettaglio/codici/materiaAmbientale (accessed on 23 April 2025).
  34. Ministero della Transizione ecologica (MITE). Decreto Ministeriale 16 dicembre 2015, n. 274, “Direttiva per Disciplinare la Conduzione dei Procedimenti AIA”. Rome, IT. 2015. Available online: https://va.mite.gov.it/it-IT/DatiEStrumenti/MetadatoRisorsaCondivisione/9a772424-2cd6-406d-9e90-d263b79f1270 (accessed on 23 April 2025).
  35. Borghesi, R.; Carlucci, C.; Mauro, F. Preventing Environmental Impacts in National IED Plants: A Self-Monitoring Model. In Frontiers of Energy and Environmental Engineering; Wen, F., Zhu, J., Eds.; Springer Nature: Singapore, 2024; pp. 79–88. [Google Scholar] [CrossRef]
  36. Mauro, F.; Borghesi, R. Using Citizen Science to Manage Odour Emissions in National IED Plants: A Systematic Review of the Scientific Literature. Atmosphere 2024, 15, 302. [Google Scholar] [CrossRef]
  37. Autorità di Regolazione per Energia Reti e Ambiente (ARERA). Produttori, Impianti e Generazione per Fonte. 2023. Available online: https://www.arera.it/dati-e-statistiche?ambito=22&sottoambito=23&sezione=&keyword=&settore=4&orderby= (accessed on 23 April 2025).
  38. Ministero dell’Ambiente e della Sicurezza Energetica (MASE). Environmental Assessments and Authorizations: SEA-EIA-IPPC Permit. Available online: https://va.mite.gov.it/en-GB (accessed on 23 April 2025).
  39. Ministero dello Sviluppo Economico (MISE); Ministero dell’Ambiente e della Tutela del Territorio e del Mare (MAATM); Ministero delle Infrastrutture e dei Trasporti (MIT). Piano Nazionale Integrato per l’Energia e il Clima. Rome, IT. 2019. Available online: https://www.mase.gov.it/sites/default/files/archivio/pniec_finale_17012020.pdf (accessed on 23 April 2025).
  40. Schmidt, M. The Sankey diagram in energy and material flow management: Part II: Methodology and current applications. J. Ind. Ecol. 2008, 12, 173–185. [Google Scholar] [CrossRef]
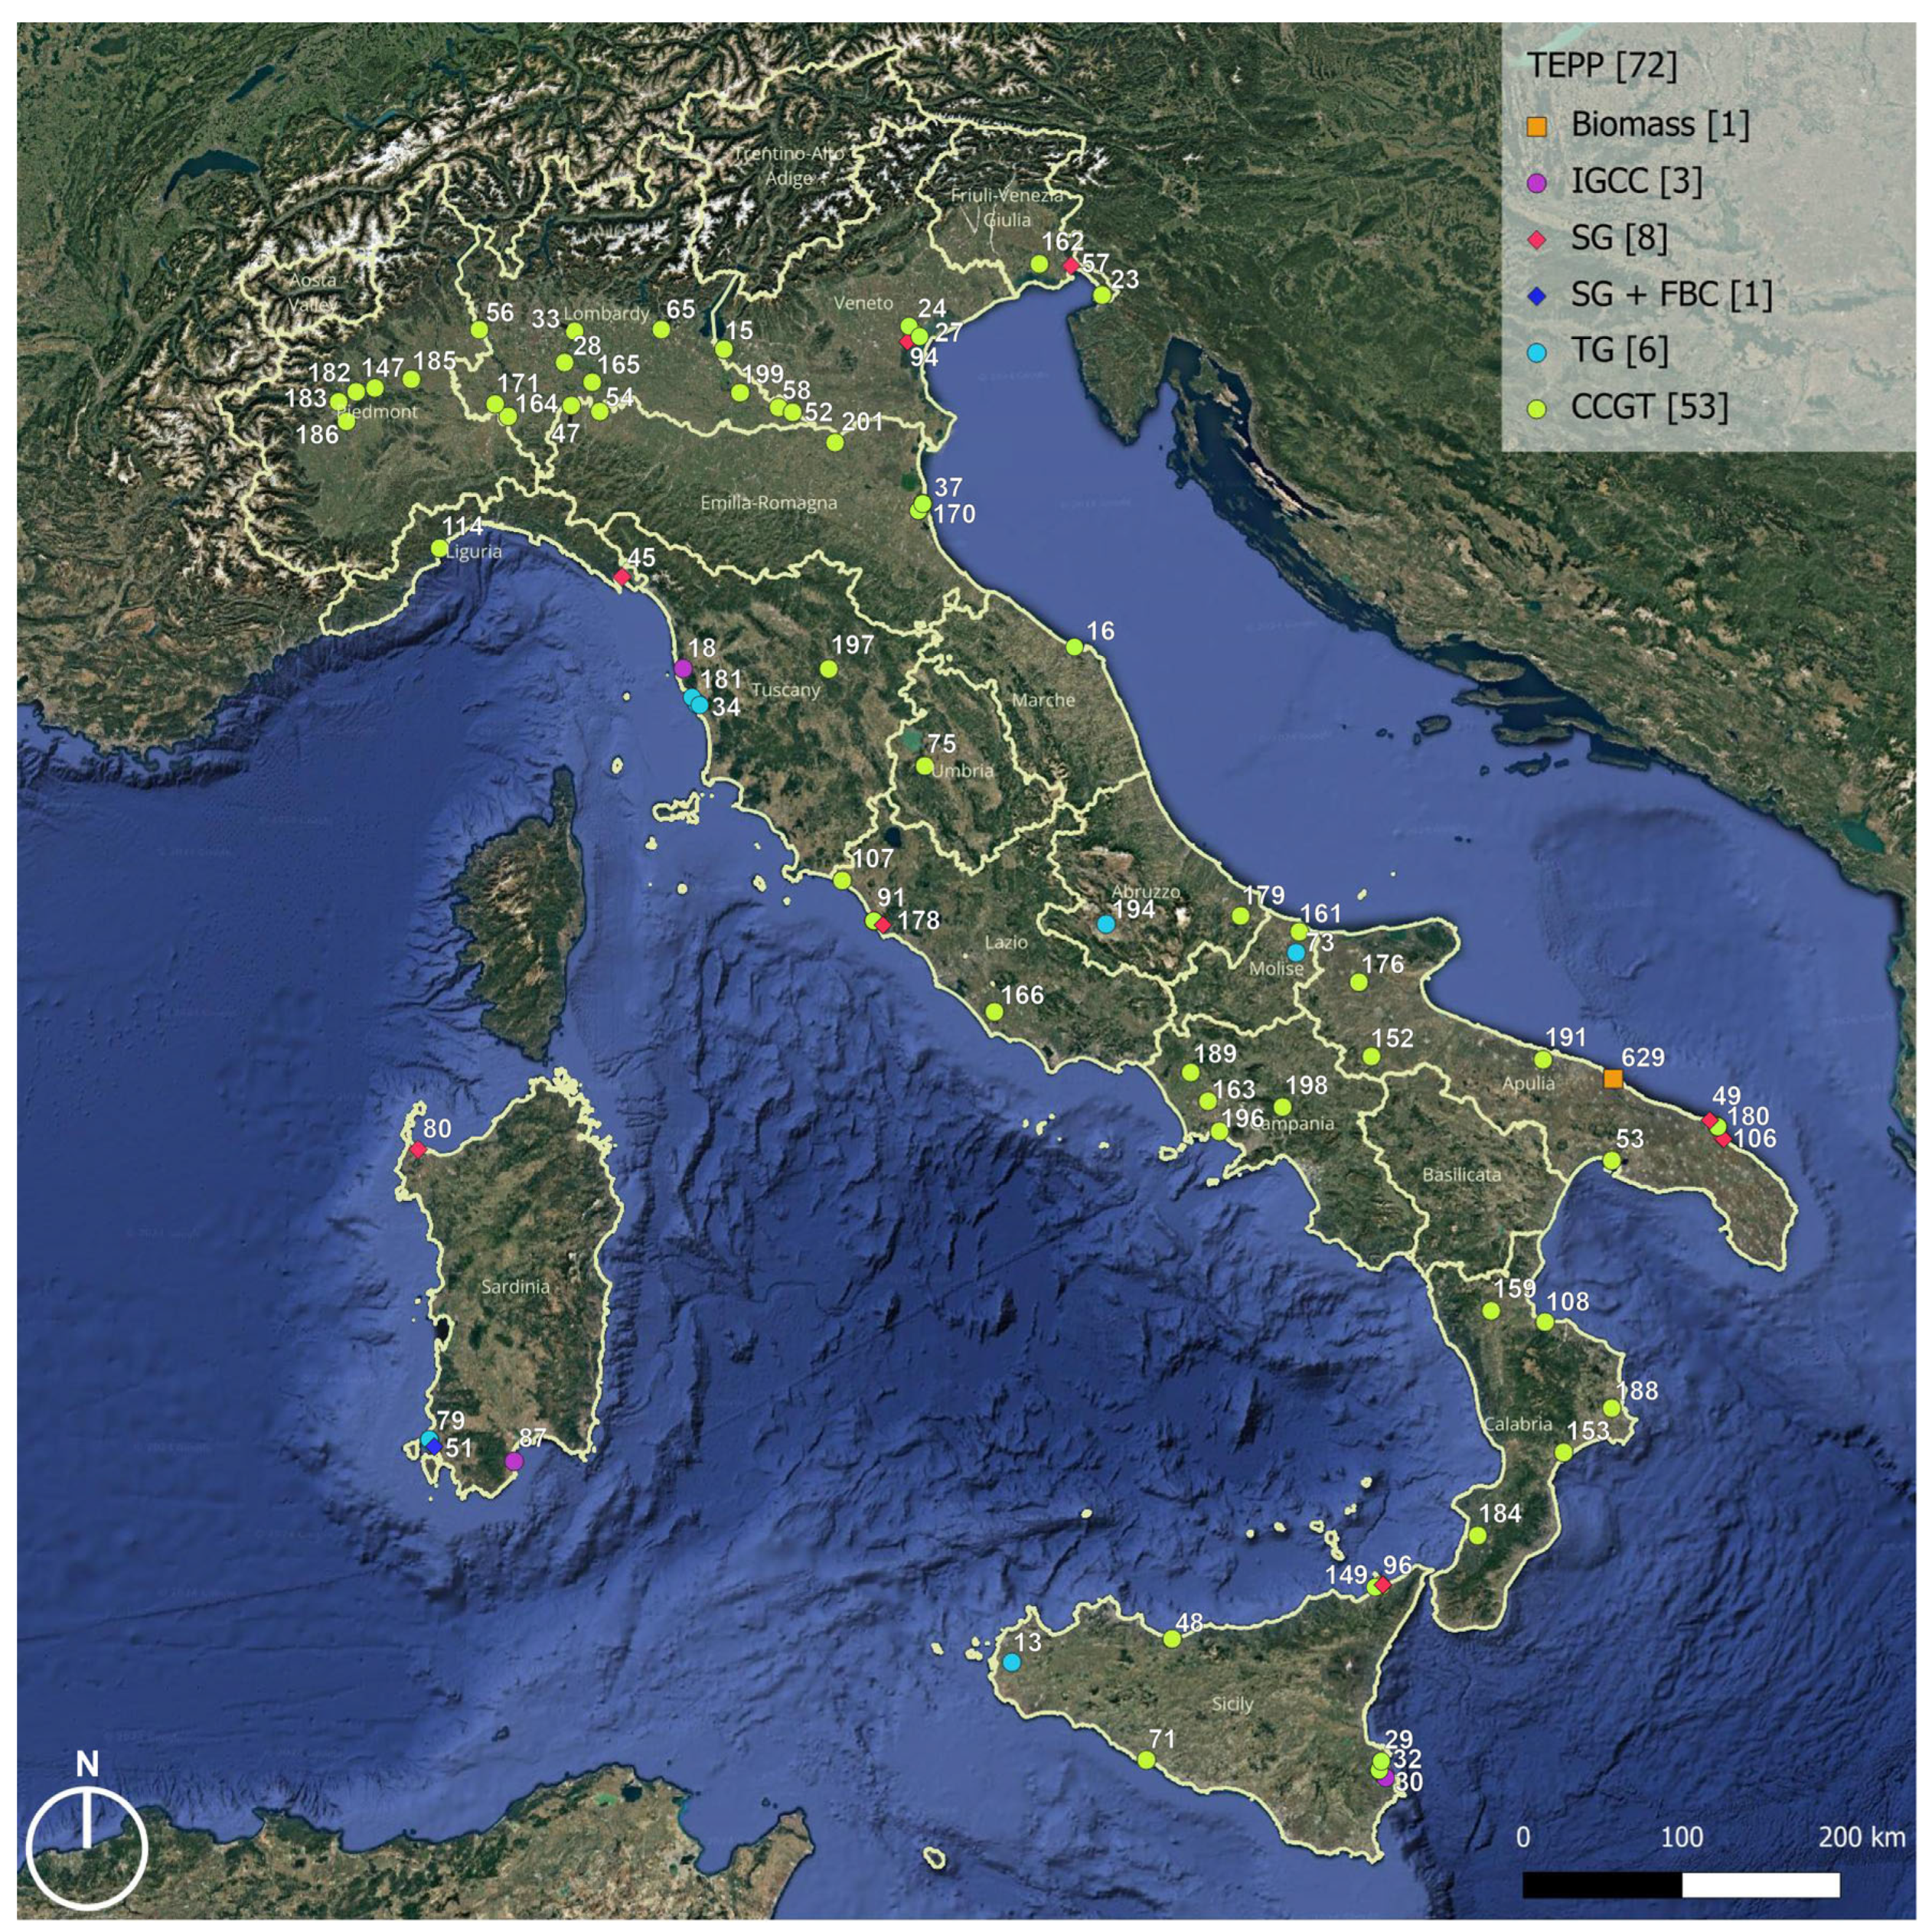
Figure 1. Water abstraction by economic sector between the 27 EU member states (2019). Elaboration of the authors on EEA data.
Water 17 01285 g001
Figure 2. Water use for electricity production and other main sectors in Italy (2012). Elaboration of the authors on ISTAT data.
Water 17 01285 g002
Figure 3. Research flowchart. The diagram represents the four main phases on which the research was based. On the left, the input elements for each phase are shown, while on the right are the resulting outputs.
Water 17 01285 g003
Figure 4. Map of the 72 TEPPs under analysis. General information is available on the MASE online repository by searching for the Installation Code (ID). Entries in the legend refer to TEPP typologies.
Water 17 01285 g004
Figure 5. Heatmap with normalized values for water abstraction, electric energy production, and fuel consumption in 2023. Values are normalized as the arithmetic mean of distribution for single series (water, energy, and fuel). On the vertical axis are listed the installation ID (left) and legend for normalized values (right). On the horizontal axis are reported the resource types (top) and their mean values (bottom). Mean values for fuel consumption are estimated in potential power produced by combustion. Please note: installations without available data (ID 16, ID 49, ID 194) are reported in the graph but excluded from normalization.
Water 17 01285 g005
Figure 6. Annual water use, electric energy production, and fuel consumption between 2021 and 2023. Total values are represented on the left. Single values of each individual component for water, electric energy, and fuel, with annual variation in percentage change, appear on the right. Please note: the total value of fuel is reported in mass (kilo tons per year), considering an average density of natural gas of 0.70 kg/m3. Density for steel production gas is considered the same as natural gas, because this mixture is very variable throughout the year in terms of composition and contains a large amount of natural gas. In detail, inside the circle at the bottom, natural gas and steel production gas are reported as volume (mln of Sm3), as transmitted by the operators in the annual reporting.
Water 17 01285 g006
Figure 7. Actual consumption/MPC consumption ratio for 2021, 2022, and 2023. Please note: the variation in the ratio over the three years is inversely proportional to the changes in performance.
Water 17 01285 g007
Figure 8. Performance indicator, as the ratio between water use and gross electric energy produced, for 2021, 2022, and 2023. In the diagram, the mean value for all installations is reported within the category ‘Overall value’. This value is accompanied by mean values for TEPP fueled by coal or natural gas, which have opposite sizes but constitute the majority of the sample analyzed.
Water 17 01285 g008
Figure 9. Sankey diagram of water and energy flows in TEPPs. The diagram illustrates the flows of water and energy within TEPPs for the year 2023, tracing the progression from input to output stages in the production cycle. On the left side, the diagram presents water inputs, representing withdrawals from various sources. These volumes are subsequently allocated to different uses, with corresponding discharges into receiving water bodies depicted as outputs. Notably, water used for cooling is not significantly consumed—aside from minimal losses due to evaporation or system needs—but is rather used and then returned. In contrast, actual water consumption primarily occurs in other usage categories (e.g., other). Overall, the vast majority of withdrawn water is ultimately returned to its original source. On the right side, the energy flow begins with fuel consumption (input) for combustion processes occurring in various TEPP typologies. This phase generates two principal outputs: electricity fed to the grid and self-consumption.
Water 17 01285 g009
Table 1. TEPP typologies. The table outlines the identified categories of power plants, provides a brief description of their operating characteristics, indicates the number of units detected, and reports their relative share of the total.
TEPP TypologyAcronymDescriptionQuantityShare of Total
Combined cycle gas turbineCCGTGas turbine cycle combined with a steam turbine cycle. The gas turbine generates electricity and produces high-temperature exhaust gases, which are then used to generate steam in a heat recovery steam generator.5375%
Steam generatorSGConventional steam boiler plant that burns solid, liquid, or gaseous fuels to heat water in a boiler, producing steam that drives a steam turbine for electricity generation.811%
TurbogasTGPlant with a single-cycle gas turbine, where fuel combustion directly drives the turbine.68%
Integrated gasification combined cycleIGCCTechnology to convert solid or liquid fuels (such as coal or petroleum coke) into a synthetic gas (syngas) through gasification. The syngas is cleaned and combusted in a gas turbine, with the hot exhaust gases used to produce steam for a steam turbine, similar to a CCGT configuration.34%
SG combined with fluidized bed combustion SG + FBCIn FBC systems, fuels are combusted in a fluidized bed of inert particles (such as sand) that enhances heat transfer and allows for more uniform temperature control.11%
BiomassBiomassPlant that uses organic materials as fuel to produce energy through direct combustion or gasification. The steam or syngas generated is used in a turbine for electricity production.11%
TOTAL 72100%
Table 2. Water use for TEPP types. The table proposes the correlation between plant typologies and use of cooling water for the year 2023. The data are presented in descending order based on water volumes, from the highest to the lowest. The performance indicator column shows the weighted mean value from individual installations belonging to the specific category.
TEPP TypologyInstallation QuantityWater UsePerformance Indicator [m3/MWh/Year]
Volume
[m3/Year]
Share of Total [%]
CCGT535,848,387,63659%73
SG83,398,637,24834%225
SG + FBC1535,090,8375%406
IGCC397,656,7561%15
TG112,880,924<1%4
Biomass166,563<1%0.1
Disclaimer/Publisher’s Note: The statements, opinions and data contained in all publications are solely those of the individual author(s) and contributor(s) and not of MDPI and/or the editor(s). MDPI and/or the editor(s) disclaim responsibility for any injury to people or property resulting from any ideas, methods, instructions or products referred to in the content.

