Abstract
Many municipalities in Denmark and around Europe currently work towards separating stormwater and sewage. In existing urban areas this may imply disconnecting stormwater from the old combined sewer systems suffering from hydraulic overloading and discharging directly to nearby surface waters. Stormwater runoff may, however, be heavily polluted and Best Available Technologies (BAT) are therefore needed to treat the stormwater before discharge. The aim here was to determine the sizes of particles found in stormwater from roads and to evaluate the use of a cationic organic flocculant to increase the size of the particles and thereby increase the removal efficiency of a 10 µm woven polyester disc filter. The samples were collected in connection with a project testing a pilot scale disc filter for treating stormwater runoff. The micro-sized particles were found to be mainly below 10 µm (6.9–19 µm) and nano-sized particles were also observed (ca. 76–228 nm). The flocculent increased the observed particle micrometer sizes by 46% and the removal of particle-associate Polycyclic Aromatic Hydrocarbons (PAHs) was confirmed. The majority of the particles were, however, still below 10 µm after addition of flocculant, which shows that application of flocculants with the woven disc filter technology for stormwater treatment needs further refinement.
1. Introduction
On 2 July 2011, a cloudburst hit the Copenhagen area, Denmark, with 30–90 mm of rain during 24 h and a maximum intensity of 3.1 mm/min over minutes at the worst hit location [1]. The damage caused by combined sewer surcharges and flooding of roads and buildings, including health effects, was estimated to be 0.64 billion Euro [2]. This major cloudburst combined with smaller cloudbursts the years before and after, together with daily problems with hydraulic overloading of combined sewers, has increased the public awareness especially through intensive media coverage. The necessity to separate stormwater from wastewater, using either Water Sensitive Urban Design principles where stormwater management is integrated in the planning of urban space [3], or classical separate storm drains is consequently often discussed. From a water utility point of view, a particularly attractive form of stormwater management is to construct separate storm drainage systems for traffic areas, which are publicly owned and therefore accessible for retrofitting by water utilities and thereby discharge the stormwater runoff directly into surface waters.
Stormwater runoff from urban areas, and in particular from traffic areas, however contains physical, chemical and microbial pollutants, which adversely influence the quality of surface water. Nutrients, i.e., nitrogen (N) and phosphorous (P), particles >0.45 µm [4,5,6], heavy metals like lead (Pb), zinc (Zn), copper (Cu), cadmium (Cd), chromium (Cr) and nickel (Ni), macro ions like sodium (Na) and chlorine (Cl) [7,8], and organic pollutants like Polycyclic Aromatic Hydrocarbons (PAH) [9,10,11] are typically found in elevated concentrations in urban stormwater. Most of these pollutants are also included in the European Directives (2008/105/EC) [12] and (2013/39/EU) [13] for priority substances in waters, which means that binding targets are set to phase them out or reduce their emission in order to achieve water quality targets. More than 600 other compounds have been identified in stormwater runoff [14,15]. Keeping and restoring good ecological and chemical status in receiving waters is one of the main goals in the European Union (EU) Water Framework Directive (WFD) (2000/60/EC) [16]; this may prevent discharging stormwater runoff to surface waters without any kind of treatment.
Approaches to control stormwater runoff, not only during cloudbursts but also to reduce the impact of stormwater discharges to surface waters during small and moderate size rainfall events, has received increasing attention in recent years, and there is currently interest in developing treatment techniques that can be classified as Best Available Technologies (BAT) [17], a term generally used for best practices considering costs in European and American environmental regulations, for treatment of stormwater runoff. A complicating factor is that stormwater treatment requires large storage volumes that can detain flow temporarily and ensure a slow steady flow through several treatment steps. Furthermore, several stormwater priority pollutants (notably heavy metals and PAHs) may be associated with colloidal solid material (<1 µm) [18] suspended in the water phase, which makes conventional treatment challenging. Detention and treatment using wet detention ponds is common in Denmark, and sedimentation of particles is the most important process in these. However, sedimentation is not effective for dissolved pollutants and colloids (<0.45 µm) and the temperate climate with cold winters reduces the rates of biodegradation. Colloids transported with the stormwater runoff, and their sorbed pollutants will therefore not settle in the detention pond and are discharged with the outlet water. A limitation of detention ponds is also that the retention time will be shortened during heavy rainstorms, allowing untreated stormwater, including both colloids and larger particles, to be discharged directly from the system. Therefore, more efficient, faster physical and chemical treatment processes such as disc filters in combination with chemical agents are being considered for treatment of stormwater runoff prior to discharging into surface waters, either as a stand-alone solution or as a final treatment step after a wet detention pond. Disc filter technologies may be used to treat stormwater runoff by passing it through a filter mesh removing particles and particle-associated pollutants. The particle removal efficiency of the disc filter is controlled by the sizes of the filter mesh; a larger mesh will lead small particles through the filter and the particle removal efficiency will be lower than a filter with a smaller mesh size. Use of filter technologies during heavy precipitation leading to high flows will not change the efficiency, since all collected stormwater runoff has to go by the filter.
To increase efficiency of not only the disc filter but also the detention pond, flocculation or coagulation agents can be used. Agglomeration or flocculation of particles will lead to a net increase in the size of particles, causing them to potentially settle in a pond or to be removed by the filter mesh in the disc.
The aim of this work was to investigate the treatment efficiency during realistic field conditions of a pilot scale disc filter with a 10 µm woven polyester mesh installed to treat stormwater runoff from a sub-urban catchment outside Copenhagen, Denmark. The particles considered were nano- and micro-particles, since particles bigger than 10 µm should be retained in the filter. This type of filter, which is already used for wastewater, but has not been tried on stormwater runoff, can potentially be considered a future BAT due to its limited spatial footprint, which means it can be installed in existing built-up areas and started quickly in response to rainy weather. Particular focus of the study was to measure the size distribution of nano- and micro-particles and their associated PAHs contamination at the inlet and outlet from the pilot filter and to evaluate the effects of adding an organic flocculent to increase the treatment efficiency.
2. Materials and Methods
2.1. Catchment, Test-Site and Treatment Technology
The catchment area from where stormwater runoff was collected, is located in the northwestern suburban parts of Copenhagen (Denmark), and consists mainly of small roads, driveways, and bike- and footpaths. The impervious part of the study area is approximately 3 km2 and has been disconnected from a larger 360 km2 combined sewer catchment by equipping it with a separate storm drainage system, which is shown as the bold solid line (red) in Figure 1. This retrofitted system was constructed in 2012 to disconnect stormwater from the old combined sewer system that suffered from frequent surcharge and inundations. The long-term plan is to discharge the treated stormwater into Lake Bagsvaerd, which is a shallow fresh water lake with a surface area of 1.22 km2 [19]. The lake has a high recreational value and is being used as the Danish national rowing center, by hobby anglers and (despite bathing prohibition) by swimmers, and the local environmental authority is therefore concerned about the quality of stormwater potentially being discharged. The retrofitted, separated storm drainage system is connected to a separate stormwater pipe for road runoff at Bagsvaerdvej (dashed green line in Figure 1). From this pipe, stormwater was extracted for the test site, and the remainder of the stormwater was transported via the combined system to a downstream wastewater treatment plant.

Figure 1.
Catchment area circled with the dash (black) line, from where the stormwater runoff is collected. The bold line (red) indicates the separate sewer system. The dash (green) line indicates the stormwater-pipe system removing the stormwater from the area. The arrows indicate the flow direction. [20].

At the test site, a pilot scale treatment train consisting of two 1 m3 in-line intermediate bulk containers (IBC) (for flocculation prior to the disc filtration) and a disc filter was set up (Figure 2). The two IBCs and the disc filter were connected in series, forcing the water to pass through both ICBs prior to treatment in the disc filter. The raw, untreated, stormwater was pumped into the treatment train using a water level controlled pump placed in the manhole between the road and footpath (Figure 2), yielding a continuous flow of approximately 3 m3/h during runoff events. The maximum capacity of the disc filter was not reached using this flow. In case of a higher flow in the sewer, the water level would increase and continue over the plank (Figure 2). The treated water and the reject water (filter wash-off) was discharged back into the sewer system.
The treatment system at the test site was a HYDROTECHTM disc filter, model 1702-1, from Veolia Hydrotech AB, Vellinge, Sweden [21]. Figure 3A shows the backside of the disc filter and Figure 3B shows a conceptual drawing of a disc filter set up. The steel disc drum had a woven polyester filter mesh of 10 µm on both sides. The principle for the technology is gravity driven physical filtration of particulate matter ≥10 µm. The disc was partially (60%) submerged in the tank containing about 2.5 m3 of water. This gave a retention time (τ) of about 4 h for the water in the tank. Figure 3B shows how the inlet stormwater entered the disc filter via a trench that led the water to the inside of the filter drum, where the stormwater was filtered by passing through the filter mesh and into the tank. The outlet water was drained via the bottom of the tank. Regular hosing of the filter mesh from the outside was done creating highly concentrated reject water that was discharged to the downstream sewer.
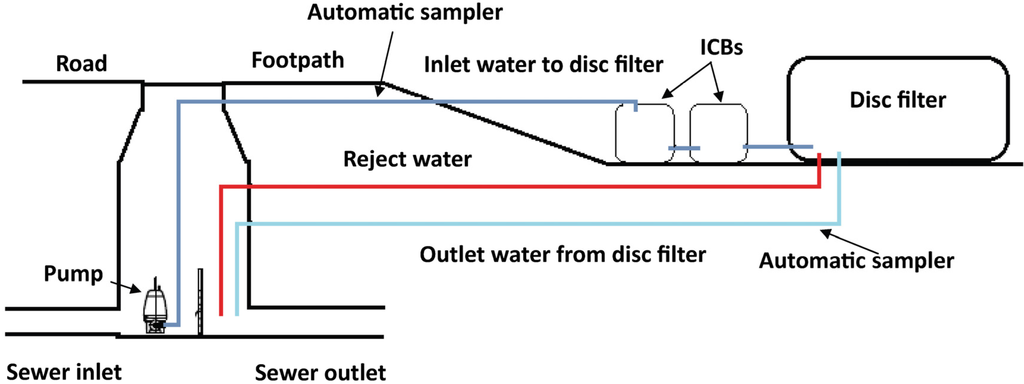
Figure 2.
Schematic drawing of the treatment train. Stormwater runoff was pumped from the departed storm sewer into the ICBs, from where it entered the disc filter, and after cleaning, both the outlet water and the reject water was led back to the downstream sewer.
Figure 2.
Schematic drawing of the treatment train. Stormwater runoff was pumped from the departed storm sewer into the ICBs, from where it entered the disc filter, and after cleaning, both the outlet water and the reject water was led back to the downstream sewer.
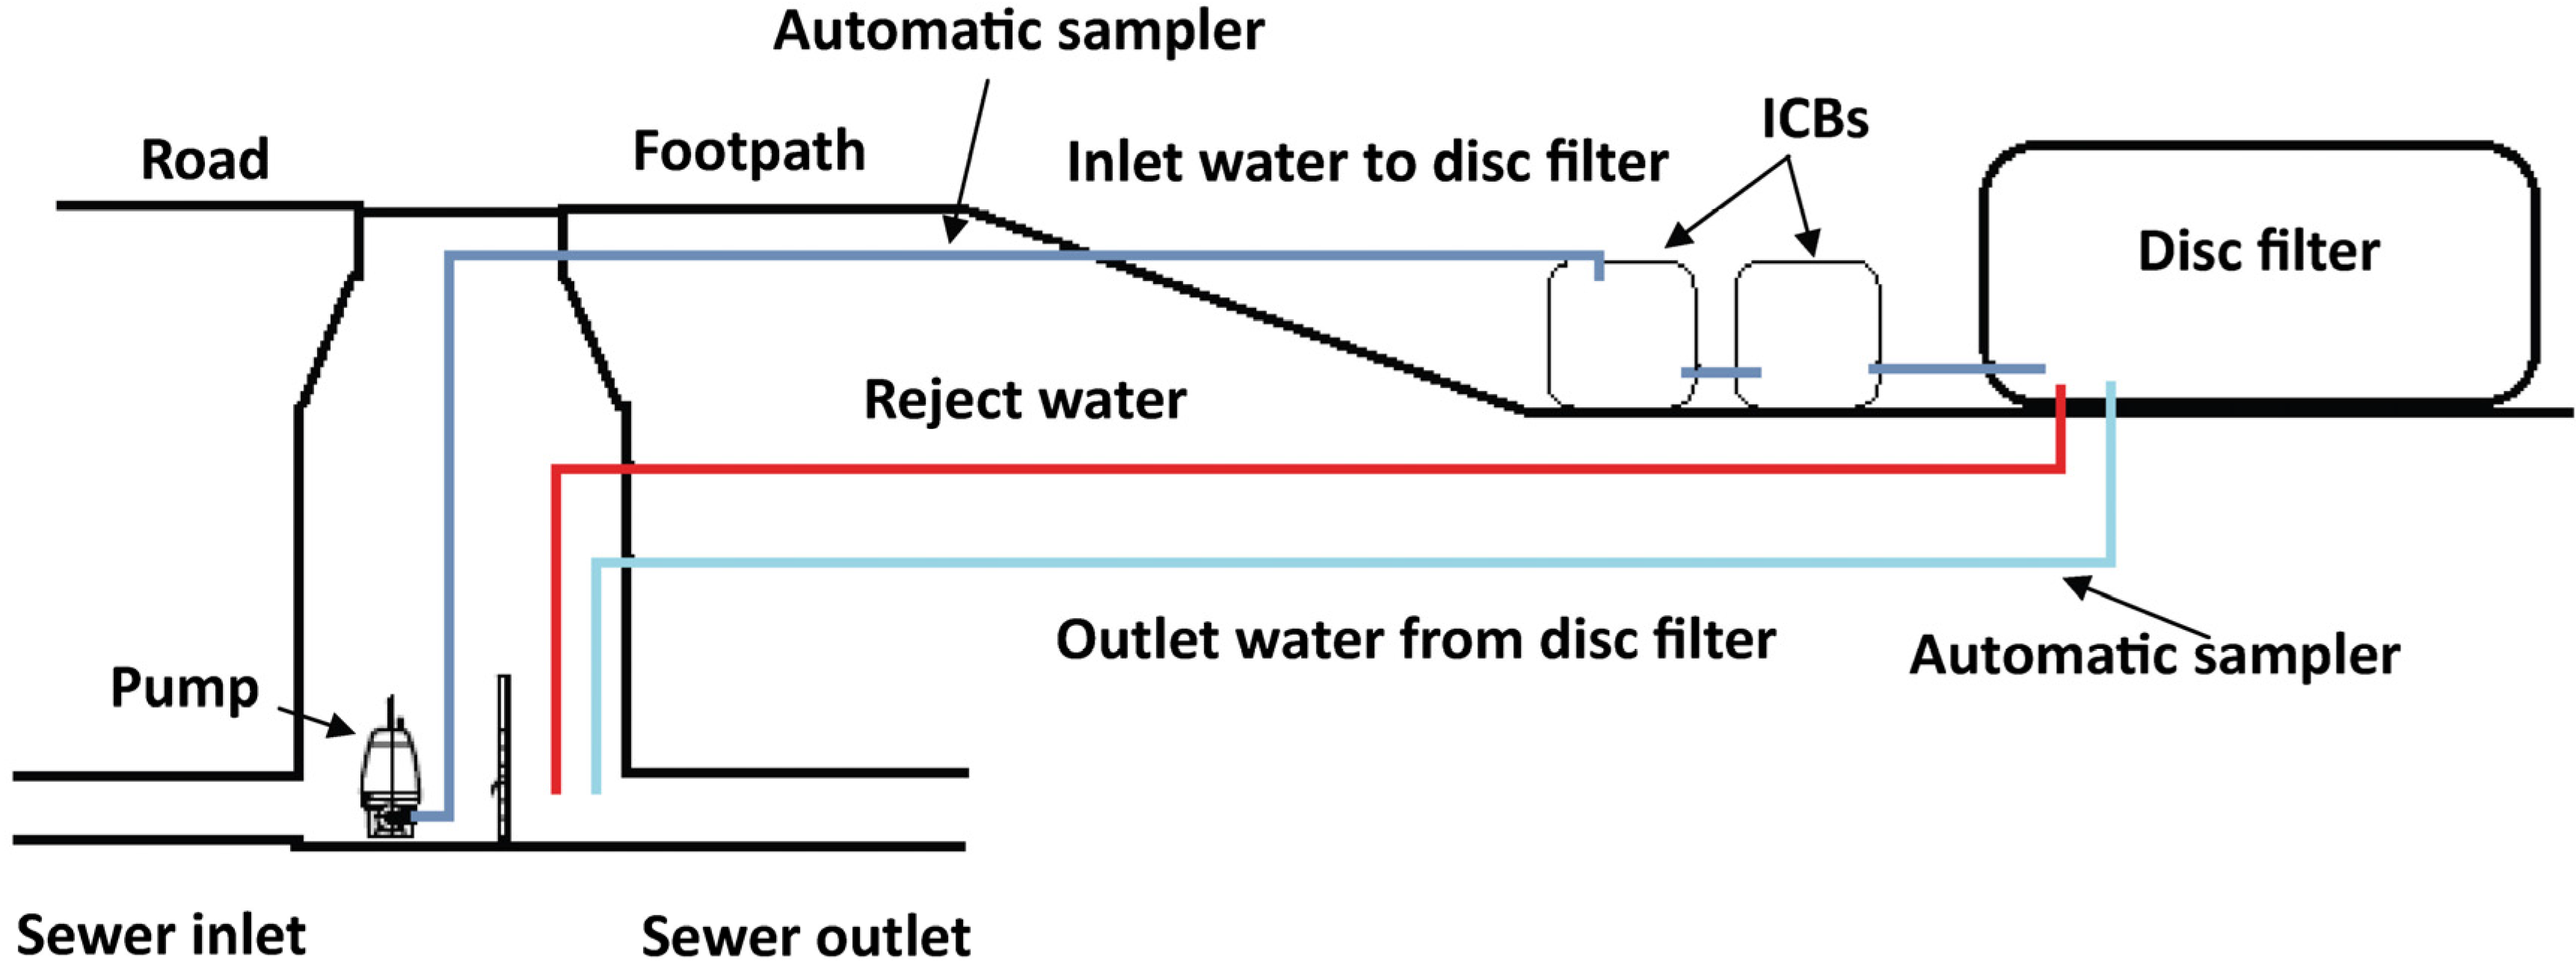
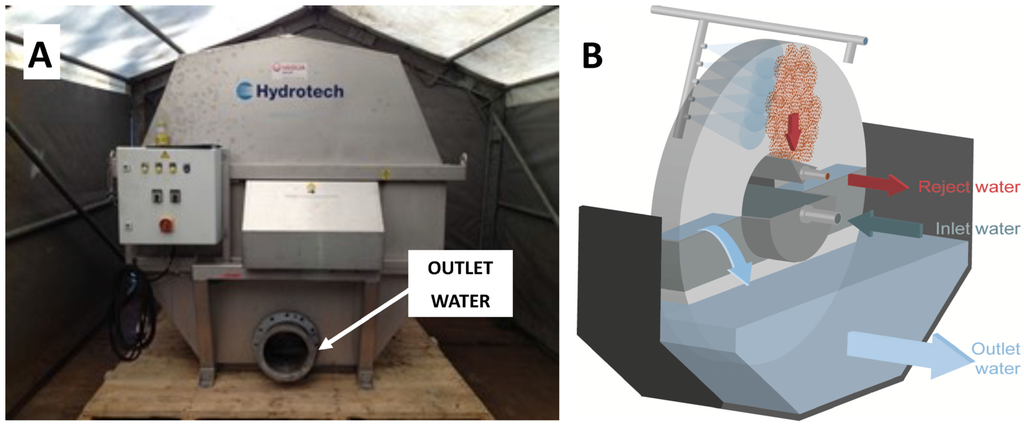
Figure 3.
(A) Shows the backside of the disc filter setup, where samples of the treated water (outlet water) were collected; (B) Schematic drawing of the disc placed inside the container disc filter container.
Figure 3.
(A) Shows the backside of the disc filter setup, where samples of the treated water (outlet water) were collected; (B) Schematic drawing of the disc placed inside the container disc filter container.

The two IBCs placed before the disc filter were equipped with mechanical stirrers for mixing the stormwater with the organic flocculant, when this was added. The flocculant used was a cationic, non-toxic, starch-based biodegradable organic flocculant (Hydrex 6864), not expected to have any effect on the downstream aquatic biodiversity, due to the dilution factor. The water level inside the treatment system was at a constant level of around 1 m and the IBC remained half full, even when the treatment came to a halt due to lack of stormwater.
2.2. Sampling and Sample Handling
Two different stormwater runoff sampling campaigns were conducted during the test period. The first campaign was without addition of flocculant to establish the quality and the particle size distribution of the stormwater runoff and to test the efficiency of the filter treatment. The second campaign was with flocculant added to test the effect of adding the flocculant and thereby increase the particle sizes. These campaigns were conducted in the autumn of two consecutive years, 2012 and 2013. In the first campaign, no treatment besides the disc filter technology was applied (event 1, 2 and 3). In the second campaign, the organic flocculent was added in the IBC prior to the disc filtration (event 4, 5 and 6), but otherwise conducted as the first campaign. Both inlet and outlet samples were collected for all events. For event 1 and 6 reject water was also collected.
Inlet stormwater was sampled from the water being pumped from the separate stormwater pipe at Bagsvaerdvej, before the water entered the first IBC (Figure 2). Treated water was sampled at the effluent valve of the disc filter tank. Time-proportional sampling was conducted by two Hach–Lange online automatic samplers (Bühler 1029, Hach–Lange, Düsseldorf, Germany), with a time resolution of 5 min in-between samples. The inlet sampler started for each event when the flow exceeded 0.5 m3/h, and the outlet sampler started after 2 m3 of water had passed the filter. The automatic samplers were placed on top of coolers fitted with cooling elements and contained 24 acid-washed plastic bottles of 400 mL each. The samples were refrigerated at +4 °C within 24 h of the sampling, and all samples were pooled before analyses. All samples were “partial” event mean concentrations (see e.g., [22]), i.e., first-flush samples collected in the first 120 min. of each runoff event. To determine a change in particle size distribution (PSD) before and after treatment and when adding the flocculant, the use of first-flush samples contained sufficient information.
Wet and dry deposition (total deposition), i.e., rainfall that has not yet become stormwater runoff, was sampled in a 15 L glass container placed 100 m from the test site and 400 m from the catchment. The entrance was fitted with a 15 cm tube. To prevent leaf litter, insects and other debris from entering the container, the top of the tube was covered with glass fiber wool. The glass container was encased in a dark plastic container during sampling. Total deposition was sampled twice during the two stormwater sampling campaigns. Deposition 1 was collected during autumn 2012 and contained deposition for 56 days. Deposition 2 was collected during the spring/summer of 2013 and contained deposition for 87 days. For both campaigns, collection of deposition included the days where stormwater sampling took place. The total deposition samples were used as background samples, to determine which particle sizes and pollutants were collected by the urban surfaces from rainfall and dry deposition, i.e., excluding contributions from materials used and activities taking place on the catchment surfaces.
2.3. Physical Parameters and Particle Characterization
Total suspended solids (TSS) were analyzed according to international U.S. Environmental Protection Agency (EPA) standard Method 160.2 [23] using binder-free, borosilicate glass fiber filters with a pore size of 0.7 µm. Both pH and electric conductivity (EC) were measured using electrodes. Turbidity was measured using a Wissenschaftlich-Technische Werkstätten (WTW) turbidity meter as nephelometric turbidity units (NTU).
A Coulter Counter, MultisizerTM II with a 50 µm orifice, was used to count the number of particles in predefined size ranges (2–43 µm) [24]. Two hundred microliters of thoroughly mixed aliquot-samples in triplicates were suspended into a 20 mL isotonic solution and counted three times each. Calculations of the accumulated particle size distribution % (PSD), for the Coulter Counter, were adapted from [25] using Equation (1):
A Malvern Zetasizer Nano ZS instrument (Malvern Instruments Ltd, Malvern, Worcestershire, UK) with a He-Ne laser at 633 nm was furthermore used to assess the nano- and colloidal-particle size distributions (0.01–1 µm). Samples were filtered by binder-free borosilicate glass fiber filters with a pore size of 1.2 µm following the manufacturer’s instructions. Zeta potential to determine the surface charge of the particles was also measured using the Malvern Zetasizer Nano ZS instrument.
2.4. PAH Analysis
Samples for analysis of 16 US EPA priority PAHs were filtered through binder-free, borosilicate glass fiber filters of 0.7 µm (suspended fraction) and the filtrates were collected and concentrated by solid phase extraction (SPE) by C18. The 16 PAHs were acenaphthene, acenaphthylene, anthracene, benzo[a]anthracene, benzo[a]pyrene, benzo[b]fluoranthene, benzo[ghi]perylene, benzo[k]fluoranthene, chrysene, dibenz[a,h]anthracene, fluoranthene, fluorene, indeno[1,2,3-cd]pyrene, naphthalene, phenanthrene and pyrene. The extracts were analyzed on an Agilent 6890 gas chromatograph combined with an Agilent 5975C triple-axis mass-selective detector (GC-MS) (Agilent Technologies, Santa Clara, CA, USA). The procedure for the SPE was as follows: pH was adjusted to 2 using 10 mL 4 M phosphate buffer with pH of 2.2, and internal standard (pyrene-d10 (200 µg/L) in acetone) were added. A C18 SPE column was conditioned with 2 × 6 mL toluene:methanol (9:1), followed by 6 mL methanol and 6 mL deionized water. The acidified stormwater sample (1 L) was loaded onto the column using vacuum and the vacuum applied for an additional 1 h until completely dry. Subsequently the columns were frozen (−20 °C) prior to extraction. The PAHs were eluted from the thawed columns using 2 × 1 mL toluene: methanol (9:1) and a small amount of anhydrous Na2SO4 was used to remove residual water. When the two phases had separated the upper phase was transferred to a GC-MS vial.
The filters and their collected particles (particulate fraction) were freeze-dried and subjected to microwave assisted extraction (MAE) [26], and then the extracts were cleaned by SPE according to the same procedure as for the suspended fraction before GC-MS analysis. The MAE was performed on a Multiwave 3000 SOLV Microwave Platform System (Anton-Paar, Graz, Austria) in polytetrafluoroethylene (PTFE-TFM) liners and polyether ether ketone (PEEK) pressure jackets. Each filter was cut in pieces and extracted with 30 mL n-hexane:acetone (6:4) at 120 °C and approx. 4 bar for 40 min. The extraction vessels were subsequently kept at 4 °C for 15 min to ensure sufficient cooling. One hundred micrograms per liter pyrene-d10 and perylene-d12 in 2,2,4-trimethyl pentane was added as internal standard and the extract was subsequently evaporated to approx. 1 mL using a gentle stream of nitrogen. Clean-up was achieved on a Liquid (LC)-Florisil SPE column (Supelco, Bellafonte, PA, USA) conditioned with n-hexane:acetone (6:4). The clean-up was used to remove polar compounds in the sample and thereby give a cleaner matrix [27]. The flow-through was collected and the column was eluted with an additional 2 × 4 mL using n-hexane:toluene (4:1). A second evaporation step was performed to approx. 500 μL before GC-MS analysis.
The GC-MS (Agilent 6890) was used to measure the PAHs in the extracts originating from the suspended and particulate sub-samples. The GC was equipped with a 60 meter (m) × 0.25 mm inner diameter × 0.25 µm film thickness Zebron-5ms (Phenomenex, Torrance, CA, USA) column and a 5 m guard column (Phenomenex). The inlet temperature was held a 300 °C and splitless mode was used. Injected sample volume was 1 µL. The oven was programmed to a gradient temperature increase starting with 70 °C and increasing to 300 °C with 20 °C/min and held for 13 min. Last temperature increase was to 325 °C with 50 °C/min, when reached the temperature was held for 10 min. Helium was used as carrier gas and the flow was held constant at 1 mL/min. An Agilent 5975C detector was used and operated in selected-ion monitoring (SIM) mode with the MS source set to 230 °C and the quadropole to 150 °C.
2.5. Statistical Data Treatment
All data was treated statistically. When nothing else is noted, the statistical comparison of measurements was conducted using Students t-test, where p < 0.05 indicates no statistically significant difference between measurements.
3. Results and Discussion
The six stormwater runoff events were all preceded by a dry-period of at least 12 h. The rainfall event duration varied in the range 60–336 min and the precipitation varied in the range of 3.8–14.4 mm.
3.1. Physical Parameters
Table 1 shows an overview of the physical parameters measured for each sample. The pH of rainwater is normally found to be in the range of 4.0–4.9, with the lowest pH found under summer thunderstorms (e.g., [28]). The pH of the total deposition collected in campaign 1 (autumn) was found to be 3.5, while the deposition collected in campaign 2 (spring/summer) had a pH of 6.2. This relative difference could be due to seasonal differences, where the atmosphere contains less NOx in the spring/summer period compared to the autumn [29]. The pH in the collected stormwater runoff was found to be in the range normally found (3.9–9.8, cf.) [14,15]. When comparing the pH in all six events, no significant change was seen between the inlet and the outlet samples. In the samples with flocculant added, no statistically significant change in the pH was seen between samples without and with flocculant. This confirms that the organic flocculant is not affecting the pH.
Before event 3 occurred, the temperature had fallen close to the freezing point and therefore, de-icing agents had been used on the roads. As a result, the stormwater runoff from this event contained de-icing salt, which is reflected in the unusually high EC.

Table 1.
Partial event mean concentrations (pEMCs) of pH, EC, turbidity and TSS from the six different rain events and the two total deposition samples. Inlet = untreated stormwater runoff sampled before entering the disc filter, Outlet = treated water after treatment in the disc filter.
| Rain Event | Depth (mm) | Max Intensity (µm/s) a | Storm Duration (min) | pH | % Change | EC (µS/cm) | % Change | Turbidity (NTU) | % Change | TSS (mg/L) | % Change | |||||
|---|---|---|---|---|---|---|---|---|---|---|---|---|---|---|---|---|
| Inlet | Outlet | Inlet | Outlet | Inlet | Outlet | Inlet | Outlet | |||||||||
| Without flocculant | 1 | 6.0 | 1.4 | 86 | 6.7 | 6.4 | 4.5 | 60 | 50 | 17 | 16 | 12 | 25 | 18 | 5 | 72 |
| 2 | 4.6 | 0.53 | 256 | 7.0 | 7.1 | −1.4 | 50 | 40 | 20 | 12 | 12 | <0.01 | 31 | 13 | 58 | |
| 3 | 3.6 | 0.46 | 209 | 6.5 | 6.6 | −1.5 | 850 | 960 | −13 | 33 | 30 | 9.1 | 659 | 623 | 5.5 | |
| Deposition1 * (autumn) | - | - | - | 3.5 | - | - | 91 | - | - | 0.8 | - | - | n.a. | - | - | |
| With flocculant | 4 | 1 | 1.0 | 450 | n.a. | n.a. | n.a. | 280 | 247 | 12 | 16 | 6 | 63 | 10 | 2 | 80 |
| 5 | 2.6 | 0.44 | 117 | 7.4 | 7.2 | 2.7 | 836 | 17 | 98 | 109 | 27 | 75 | 172 | 13 | 92 | |
| 6 | 14 | 1.98 | 246 | 6.9 | 7.0 | −1.5 | 168 | 171 | −1.8 | 80 | 11 | 86 | 91 | 7 | 92 | |
| Deposition 2 ** (spring/summer) | - | - | - | 6.2 | - | - | 13 | - | - | 2.2 | - | - | n.a. | - | - | |
Notes: Single samples representing the total deposition during * 56 days and ** 87 days; n.a. = not analyzed; a Maximum intensity calculated from 1 h rain.
The turbidity measured in the two total deposition samples were both below 2 NTU. The low turbidity values compared to what was found in the stormwater runoff samples, indicates release of particles from the surfaces that the precipitation has come in contact with during runoff. The EC increase seen for event 3 and 6 from the inlet to the outlet water could not be described by the treatment technology.
In the first stormwater runoff sample campaign, lower particulate matter, reflected in the low TSS concentrations (Table 1), was measured in event 1 and 2 compared to the third event. The higher TSS observed in event 3 could be evidence of de-icing agents applied on the roads before the third event [30,31]. The concentrations of TSS seen in the inlet water of all the six events ranged from 10 to 659 mg/L. This wide range is not unusual, Göbel et al. [7] have reported differences in TSS concentrations from 66 to 937 mg/L in runoff from areas with different traffic intensity, and event-to-event TSS variations at the same site are also commonly observed (e.g., [7]).
The stormwater samples treated with both flocculant and disc filter technology showed an increase in removal efficiency for turbidity and TSS. The addition of flocculant in event 4, 5 and 6 gave removal efficiencies for turbidity from 62% to 86%, compared to 0%–25% for event 1, 2 and 3. The TSS measurements also showed higher removal efficiencies after adding flocculant prior to filter treatment. A higher absolute decrease in EC between inlet and outlet was also observed for samples containing flocculate (for event 4 and especially event 5).
The preferred way to test the efficiency of the flocculation would have been to apply both methods during the same event. However, it is common to test pilot scale experiments over extended periods, and thereby compare different events and different test methods against each other [32,33,34]. To ensure a valuable frame of reference, a one-way ANOVA test using Tukey’s Multiple Comparison was applied to the measured physical parameters for all the inlet samples. The test showed that no significant difference was seen between the six inlet samples (p-value < 0.05). The increased removal efficiencies seen for event 4, 5 and 6 are therefore not coursed by seasonal changes, but by addition of flocculant.
3.2. Particle Size
Particle size measurements showed that the majority of the particles measured by the Coulter Counter were smaller than 10 µm in diameter (d. µm). Figure 4 illustrates the measurements for all six events, showing both the inlet and outlet stormwater samples. The inlet samples from event 1 showed that 95% of the measured particles were found to be 5.2 d. µm or smaller. The inlet sample for event 4 showed that 95% of the particles were 4.9 d. µm or smaller. The inlet sample for event 2 contained the largest particles, while the inlet sample from event 4 contained the smallest particles.
An increase in the particle sizes (d. µm) was observed for the outlet samples. For event 1, where no flocculant was added, 95% of the particles were smaller than 5.2 d. µm in the inlet sample and 5.8 d. µm in the outlet sample. This gave a 5% increase in particle size. For event 4, where flocculant was added, the increase was 21%, with 95% of the particles smaller than 4.8 d. µm for the inlet sample and 6.1 d. µm for the outlet sample.
The PSD results were statistically tested and no significant difference in particle sizes between inlet and outlet samples was found, despite addition of flocculant. The majority (95%) of the particles were smaller than 10 µm in diameter, both in the inlet and outlet samples, which is a major drawback for the tested disc filter technology. It employs a 10 µm woven mesh, which means that the majority of the particles will not be removed by the filter. This was also seen for event 5 and 6 where larger particles at the 95% accumulated volume were measured in the outlet water compared to the inlet water. The use of a smaller filter mesh would retain more particles, but a higher hydraulic head gradient would then be required and this is unfeasible with the employed disc diameter. In this test setup only one flocculant was tested. Another flocculant creating bigger particles could be a solution to the low removal efficiency.

Figure 4.
Micro-particle diameter size distribution (2–43 µm) measured on Coulter Counter. Inlet = untreated runoff stormwater before entering the disc filter, outlet = treated water after passing through the 10 µm disc filter. The thin horizontal line indicates the 95% accumulated volume. Note the logarithmic scale on the horizontal axis.
The ZetaSizer measurements showed that nano-sized particles were present in the samples. The inlet samples had particles with a diameter range from 86 to 197 nm and the outlet samples had particles with a diameter range from 117 to 223 nm (Figure 5). However, no statistically significant difference was seen between the inlet and outlet samples. The samples collected during the second campaign (August/September 2013) in general contained smaller particles in both the inlet and the outlet than the samples collected in the first campaign (October 2012). This could be due to different activities or seasonal effects in the catchment.
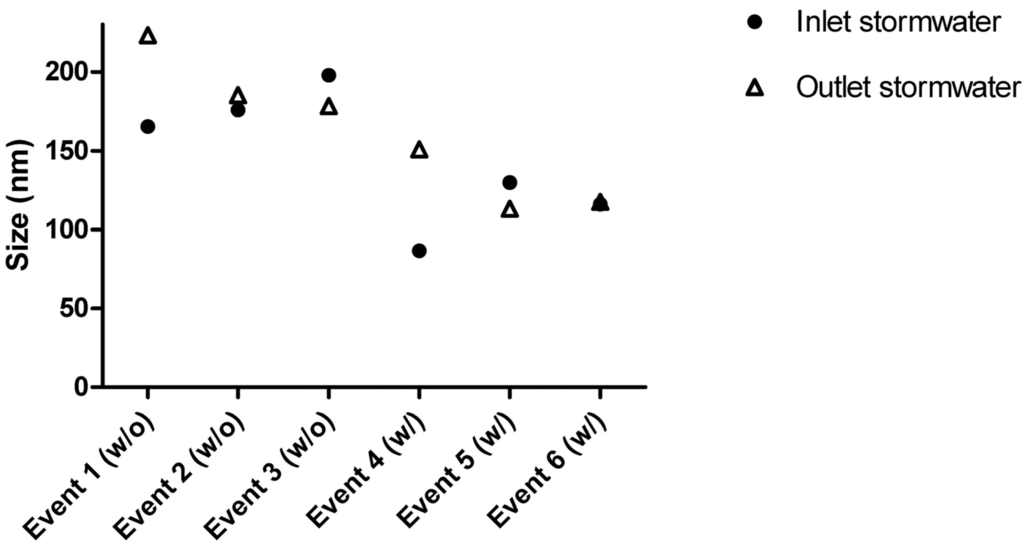
Figure 5.
Nanosize particle sizes measured on ZetaSizer. w/o = without flocculant, w/ = with flocculant. Inlet = untreated runoff stormwater before entering the disc filter, outlet = treated water after passing through the 10 µm disc filter.
Figure 5.
Nanosize particle sizes measured on ZetaSizer. w/o = without flocculant, w/ = with flocculant. Inlet = untreated runoff stormwater before entering the disc filter, outlet = treated water after passing through the 10 µm disc filter.

The surface tension of the particles was measured as the zeta potential, using the ZetaSizer. The zeta potential is describing the electrical potential interfacial layer between a solid and a liquid in an aqueous solution. A zeta potential between −30 and 30 mV indicates an unstable particle, given that the interfacial layers are not strong enough to separate particles and they will thus attract each other. The zeta potential is also a useful indicator of surface charges of the particles [35].
The measurements show that the particles had a negative surface tension ranging from −19 to −26 mV, both in the inlet and outlet samples. Statistical t-test calculations showed that no significant differences were observed between the inlet and outlet samples (p < 0.05). This consists with the particles having a composition of organic acids (fulvic and humic acid), sand and clay. The anionic surface of the particles should create larger particles with the cationic flocculant.
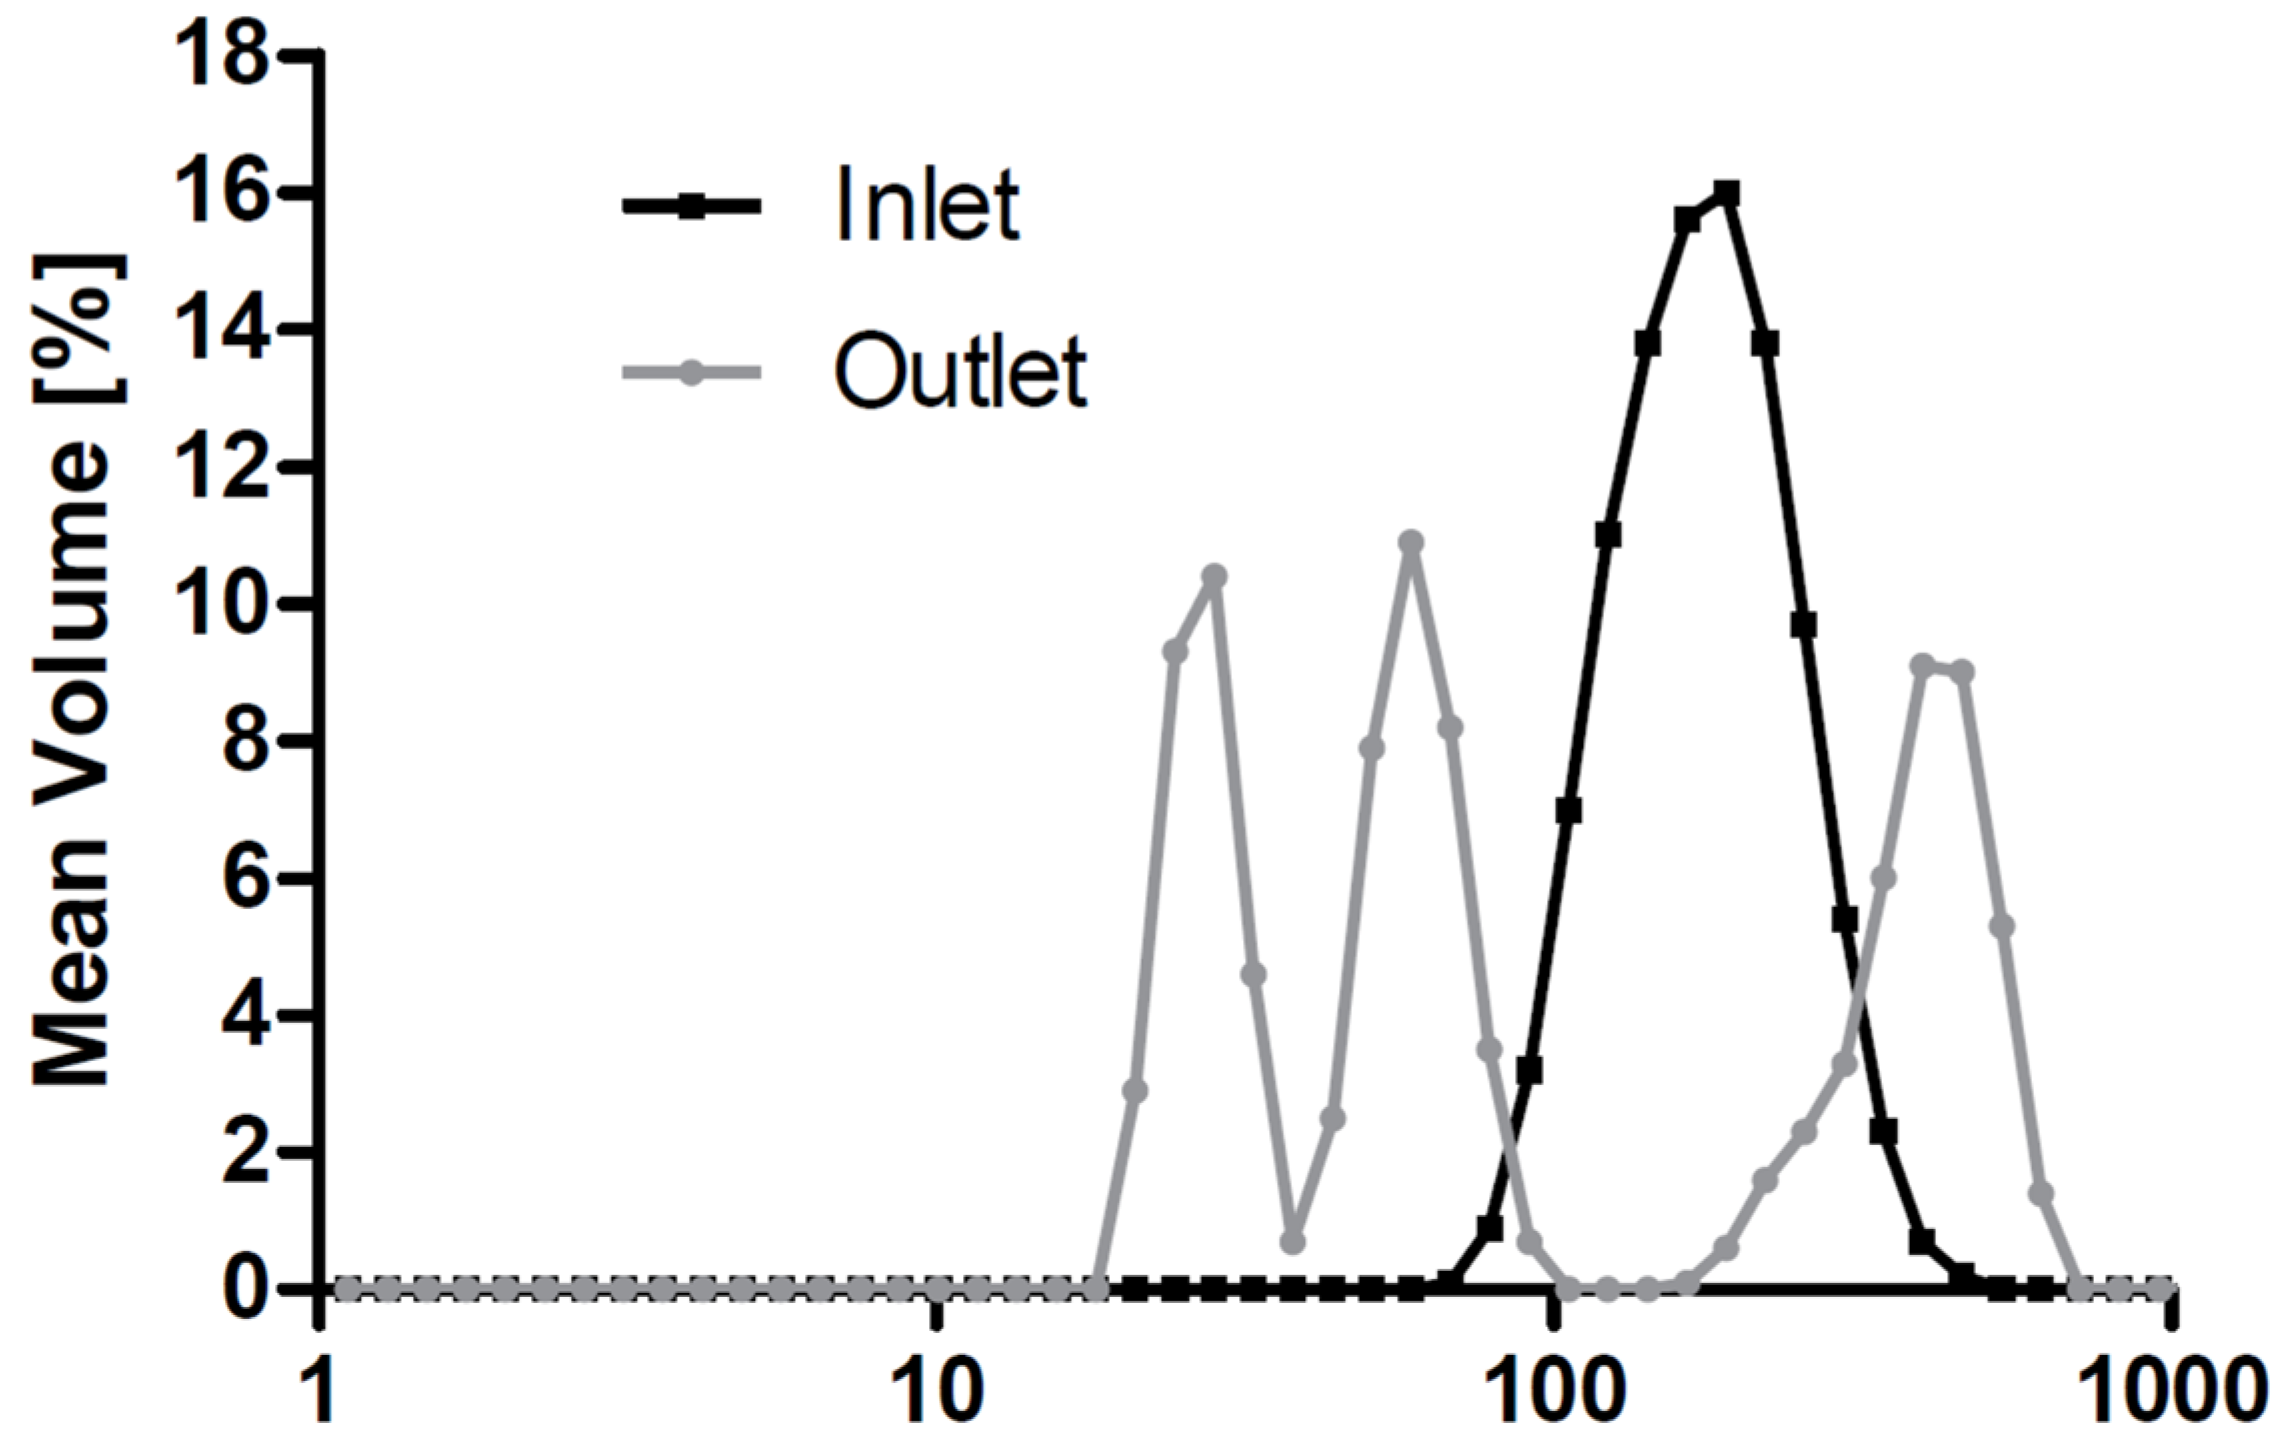
Even through there was no statistically significant difference in size for the measured nano-particles, the nano-sized PSDs differed in some samples between the inlet and outlet. As shown in Figure 6 the inlet particles were mono dispersed while the outlet particles in some of the events polymodally were dispersed. The change in particle dispersity from the inlet to the outlet samples may be explained by physical and biological processes acting throughout the treatment system, especially in the biofilm in the tanks. This could lead to agglomeration or dissociation of the particles, because the electrolytic ionic strength will be changed in the treatment system [36].

Figure 6.
Nanosize particle size distributions measured on ZetaSizer. Inlet samples show monomodal distributions while outlet samples show polymodal distributions. Inlet = untreated runoff stormwater before entering the disc filter, outlet = treated water after passing through the 10 µm disc filter. Note the logarithmic scale on the horizontal axis.
3.3. PAH
Fluoranthene, pyrene and naphthalene were found in the highest concentrations among the PAHs and were most frequently detected above the detection limits (Table 2). Measurements from event 3 were not available, meaning that all calculations and comparisons are only based on event 1, 2, 4, 5 and 6. The sums for all the 16 PAHs containing both the suspended and particulate fractions gave concentrations in the range of 1.1–4.7 µg/L PAHs in the inlet samples. For the outlet samples where no flocculate was added (event 1 and 2) the concentration decreased to be in the range 0.36–1.1 µg/L. The outlet samples where flocculate was added had a similar range (0.99–1.05 µg/L). The PAHs were predominantly found in the particulate fraction (>0.7 µm), as an average 82% (65%–92%) of the PAH in the inlet samples were in particulate form (Figure 7). No seasonal fluctuation effects were observed in the inlet concentrations (p = 0.83).
In the outlet samples, an average of 67% (63%–71%) of the PAHs were in the particulate form (>0.7 d. µm) without flocculation and, correspondingly 61% (22%–87%) with flocculant added. The fraction of PAH in the particulate fraction declined in the outlet samples, which indicates that the disc filtration and flocculation removes some of the particulate matter where the PAHs are adsorbed. This was confirmed by the fact that the reject water (filter wash-off) contained 97% of the PAHs in the particulate fraction. However, 30%–40% of the PAHs were adsorbed to the smallest particles (i.e., <0.7 µm diameter) or dissolved and thus discharged after treatment, which means that nano-sized particle facilitated transport of PAHs in stormwater runoff may be important.
Table 2.
PAHs measurements from collected stormwater samples in µg/L. Both the particulate fractions (particles > 0.7 µm) (P) and the suspended fraction (particles < 0.7 µm) (S) is shown. Event 3 was not possible to measure. Measurements on two collected reject water samples have also been added.
| Total sum PAHs (µg/L) a | Event | |||||||||||||||||||||||
|---|---|---|---|---|---|---|---|---|---|---|---|---|---|---|---|---|---|---|---|---|---|---|---|---|
| 1 | 2 | 4 | 5 | 6 | 2 | 6 | ||||||||||||||||||
| Inlet | Outlet | Inlet | Outlet | Inlet | Outlet | Inlet | Outlet | Inlet | Outlet | Reject | Reject | |||||||||||||
| 4.71 | 1.08 | 1.46 | 0.36 | 4.92 | 1.91 | 1.05 | 0.99 | 1.92 | 1.04 | 4.02 | 7.35 | |||||||||||||
| Sum PAHs (µg/L) | P | S | P | S | P | S | P | S | P | S | P | S | P | S | P | S | P | S | P | S | P | S | P | S |
| 3.83 | 0.88 | 0.72 | 0.36 | 1.46 | bld | 0.364 | bld | 3.23 | 1.69 | 0.44 | 1.47 | 1.05 | bld | 0.86 | 0.13 | 1.73 | 0.19 | 1.04 | bld | 4.02 | bld | 7.24 | 0.11 | |
| Acenaphthene | bld | bld | bld | bld | bld | bld | bld | bld | bld | bld | bld | bld | bld | bld | bld | bld | bld | bld | bld | bld | bld | bld | bld | bld |
| Acenaphthylene | 0.05 | bld | bld | bld | bld | bld | bld | bld | 0.02 | bld | 0.04 | bld | bld | bld | bld | bld | bld | bld | bld | bld | 0.04 | bld | 0.07 | bld |
| Anthracene | 0.11 | 0.08 | 0.05 | 0.04 | 0.10 | bld | 0.02 | bld | 0.24 | 0.14 | bld | 0.12 | 0.07 | bld | 0.05 | bld | 0.11 | 0.03 | 0.07 | bld | 0.30 | bld | 0.58 | 0.03 |
| Benzo[a]anthracene | 0.21 | 0.07 | bld | 0.03 | 0.07 | bld | bld | bld | 0.07 | 0.10 | bld | 0.10 | bld | bld | bld | bld | 0.07 | bld | bld | bld | 0.22 | bld | 0.25 | bld |
| Benzo[a]pyrene | 0.21 | 0.07 | bld | 0.03 | 0.04 | bld | bld | bld | 0.05 | 0.12 | bld | 0.12 | bld | bld | bld | bld | 0.05 | bld | bld | bld | 0.12 | bld | 0.22 | bld |
| Benzo[b]fluoranthene | 0.25 | bld | bld | bld | 0.04 | bld | bld | bld | 0.07 | bld | bld | bld | bld | bld | bld | bld | 0.05 | bld | bld | bld | 0.12 | bld | 0.24 | bld |
| Benzo[ghi]perylene | 0.22 | 0.07 | bld | 0.03 | 0.07 | bld | bld | bld | 0.10 | 0.11 | bld | 0.12 | 0.02 | bld | bld | bld | 0.08 | bld | 0.03 | bld | 0.23 | bld | 0.35 | bld |
| Benzo[k]fluoranthene | 0.40 | n.a. | bld | n.a. | 0.12 | n.a. | bld | n.a. | 0.15 | n.a. | bld | n.a. | 0.03 | n.a. | 0.03 | n.a. | 0.14 | n.a. | 0.05 | n.a. | 0.40 | n.a. | 0.55 | n.a. |
| Chrysene | 0.25 | 0.05 | bld | bld | 0.04 | bld | bld | bld | 0.04 | 0.08 | bld | 0.07 | bld | bld | bld | bld | 0.03 | bld | bld | bld | 0.08 | bld | 0.19 | bld |
| Fluoranthene | 0.63 | 0.12 | 0.2 | bld | 0.30 | bld | 0.09 | bld | 0.76 | 0.22 | 0.12 | 0.20 | 0.20 | bld | 0.23 | 0.04 | 0.38 | 0.04 | 0.28 | bld | 0.89 | bld | 1.6 | bld |
| Fluorene | bld | 0.03 | bld | bld | 0.02 | bld | bld | bld | bld | 0.09 | bld | 0.06 | bld | bld | bld | bld | bld | bld | bld | bld | bld | bld | 0.03 | bld |
| Indeno[1,2,3-cd]pyrene and Dibenz[a,h] anthracene | 0.23 | 0.08 | bld | 0.04 | 0.05 | bld | bld | bld | 0.08 | 0.12 | bld | 0.13 | bld | bld | bld | bld | 0.06 | 0.03 | 0.02 | bld | 0.15 | bld | 0.26 | bld |
| Naphthalene | 0.24 | 0.10 | 0.08 | 0.05 | 0.14 | bld | 0.11 | bld | 0.10 | 0.22 | 0.10 | 0.19 | 0.29 | bld | 0.13 | 0.03 | 0.07 | 0.03 | 0.04 | bld | 0.09 | bld | 0.15 | 0.04 |
| Phenanthrene | 0.09 | bld | 0.02 | bld | 0.02 | bld | bld | bld | 0.07 | 0.03 | bld | bld | 0.02 | bld | bld | bld | 0.04 | bld | bld | bld | 0.08 | bld | 0.15 | bld |
| Pyrene | 0.94 | 0.21 | 0.37 | 0.09 | 0.45 | bld | 0.14 | bld | 1.48 | 0.46 | 0.18 | 0.36 | 0.42 | bld | 0.42 | 0.06 | 0.65 | 0.06 | 0.55 | bld | 1.3 | bld | 2.6 | 0.04 |
Notes: bld = below detection limit. For particulate fraction measurements <0.01 µg/L. For suspended fraction measurements <0.025 µg/L. a The total sum of PAHs contains both the particulate fraction and the suspended fraction.
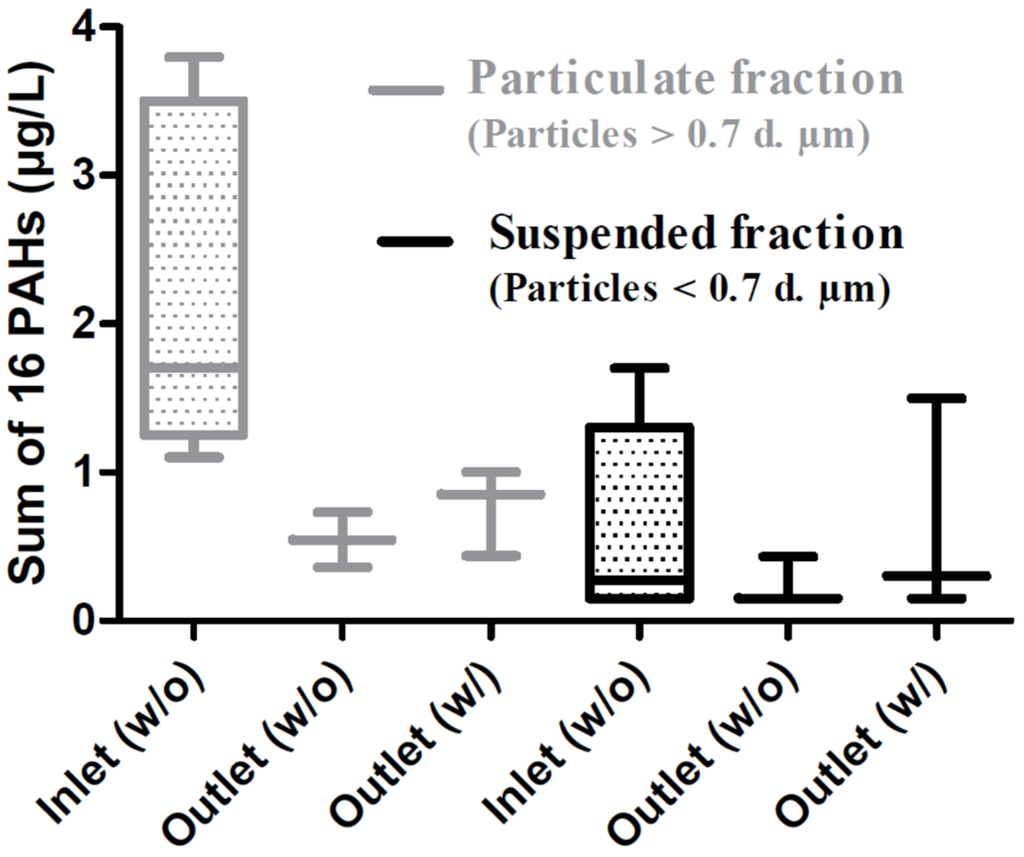
Figure 7.
Box-plots of the sum of PAHs found in the inlet and outlet samples, subdivided into the particulate and suspended fraction. The bars indicate the highest and lowest concentration together with themedian, upper and lower quartile of total PAHs measured in the samples.
Figure 7.
Box-plots of the sum of PAHs found in the inlet and outlet samples, subdivided into the particulate and suspended fraction. The bars indicate the highest and lowest concentration together with themedian, upper and lower quartile of total PAHs measured in the samples.

4. Conclusions
Nano- and microsizeparticles were found in stormwater runoff from the investigated site. Measurements with a Coulter Counter Multisizer (2–43 µm diameter range) showed micro-sized particles in the 2.1–19 µm range with 95% of the particle volume below 10 µm, and measurements with a Zetasizer (0.01–1 µm diameter range) showed nano-sized particles in the 76–228 nm range. Thus disc filtration treatment (10 µm mesh) was not sufficient to remove the majority of the particles. The flocculant increased the observed volume of micro-sized particles, but the majority of the particles were still below 10 µm. This shows that application of flocculants with the woven disc filter technology for stormwater treatment needs further refinement. Particle-associated PAHs were removed as the TSS was removed, but no substantial removal of PAHs in the suspended or nano-sized fraction (<0.7 µm diameter) was observed. A consequence of not removing all of the small particles found in stormwater runoff may be facilitated transport of other pollutants sorbed to the nano-sized particles, resulting in low treatment efficiency for these pollutants.
Acknowledgments
The Foundation for Development of Technology in the Danish Water Sector (VTUF), Nordvand A/S, Krüger A/S, Hydrotech AB, and Gladsaxe municipality are thanked for partial funding and cooperation connected with the project DEMFIL. The Technical University of Denmark is acknowledged for Katrine Nielsens Nordic Five Tech (N5T) PhD scholarship, and the DTU technical staff is acknowledged for their hard work in the lab, in particular Mikael E. Olsson for the PAH analysis guide. Andreas L. Brock is acknowledged for his work in connection with the first sampling campaign. We also acknowledged Lisbet Brusendorff for her graphic skills and thanks her for drawing the disc filter in Figure 3.
Author Contributions
The experimental design was made in collaboration between all authors. The majority of the experiments conducted in the field and the laboratory work were made by Andreas Mørch-Madsen and Katrine Nielsen. Katrine Nielsen prepared the initial draft manuscript and incorporated comments from the co-authors.
Conflicts of Interest
The authors declare no conflict of interest.
References
- Vejen, F. Tropisk styrtregn over København den 2. Juli – Alle danske monsterregns moder. Vejret 2011, 128, 1–11. (In Danish) [Google Scholar]
- Johannsdottir, L.; Davidsdottir, B.; Goodsite, M.; Olafsson, S. What is the potential and demonstrated role of non-life insurers in fulfilling climate commitments? A case study of Nordic insurers. Environ. Sci. Policy 2014, 38, 87–106. [Google Scholar] [CrossRef]
- Fletcher, T.D.; Shuster, W.; Hunt, W.F.; Ashley, R.; Butler, D.; Arthur, S.; Trowsdale, S.; Barraud, S.; Semadeni-Davies, A.; Bertrand-Krajewski, J.-L.; et al. SUDS, LID, BMPs, WSUD and more—The evolution and application of terminology surrounding urban drainage. Urban Water J. 2014. [Google Scholar] [CrossRef]
- Hvitved-Jacobsen, T.; Vollertsen, J.; Nielsen, A.H. Urban and Highway Stormwater Pollution: Concepts and Engineering; CRC Press: Boca Raton, FL, USA, 2010; pp. 1–323. [Google Scholar]
- Buffle, J.; Leppard, G.G. Characterization of aquatic colloids and macromolecules: 1—Structure and behavior of colloidal material. Environ. Sci. Technol. 1994, 29, 2169–2175. [Google Scholar] [CrossRef]
- Gustafsson, O.; Gschwend, P.M. Aquatic colloids: Concepts, definitions, and current challenges. Limnol. Oceanogr. 1997, 42, 519–528. [Google Scholar] [CrossRef]
- Göbel, P.; Dierkes, C.; Coldewey, W.G. Storm water runoff concentration matrix for urban areas. J. Contam. Hydrol. 2007, 91, 26–42. [Google Scholar] [CrossRef] [PubMed]
- Sörme, L.; Lagerkvist, R. Sources of heavy metals in urban wastewater in Stockholm. Sci. Total Environ. 2002, 298, 131–145. [Google Scholar] [CrossRef] [PubMed]
- Brown, J.N.; Peake, B.M. Determination of colloidally-associated polycyclic aromatic hydrocarbons (PAHs) in fresh water using C18 solid phase extraction disks. Anal. Chim. Acta 2003, 486, 159–169. [Google Scholar] [CrossRef]
- Eriksson, E.; Baun, A.; Scholes, L.; Ledin, A.; Ahlman, S.; Revitt, M.; Noutsopoulos, C.; Mikkelsen, P.S. Selected stormwater priority pollutants—A European perspective. Sci. Total Environ. 2007, 383, 41–51. [Google Scholar] [CrossRef] [PubMed]
- Maliszewska-Kordybach, B. Sources, concentrations, fate and effects of polycyclic aromatic hydrocarbons (PAHs) in the environment. Part A: PAHs in air. Pol. J. Environ. Stud. 1999, 8, 131–136. [Google Scholar]
- Directive 2008/105/EC of the European Parliamentand of the Council of 16 December 2008 on Environmental Quality Standards in the Field of Water Policy, Amending and Subsequently Repealing Council Directives 82/176/EEC, 83/513/EEC, 84/156/EEC, 84/491/EEC, 86/280/EEC and amending Directive 2000/60/EC of the European Parliament and of the Council. Available online: http://eur-lex.europa.eu/LexUriServ/LexUriServ.do?uri=OJ:L:2008:348:0084:0097:en:PDF (accessed on 16 March 2015).
- Directive 2013/39/EU of the European Parliamentand of the Council of 12 August 2013 Amending Directives 2000/60/EC and 2008/105/EC as regards Priority Substances in the Field of Water Policy. Available online: http://eur-lex.europa.eu/LexUriServ/LexUriServ.do?uri=OJ:L:2013:226:0001:0017:EN:PDF (accessed on 16 March 2015).
- Eriksson, E. Heavy Metals and Xenobiotic Organic Compounds in Stormwater Run-Off. Potential and Problems Related to Reuse of Water in Households. Ph.D. Thesis, Department of Environmental Engineering, Technical University of Denmark, Copenhagen, Denmark, 2002. [Google Scholar]
- Makepeace, D.K.; Smith, D.W.; Stanley, S.J. Urban stormwater quality: Summary of contaminant data. Crit. Rev. Environ. Sci. Technol. 1995, 25, 93–139. [Google Scholar] [CrossRef]
- Directive 2000/60/EC of the European Parliamentand of the Council of 23 October 2000 Establishing a Framework for Community Action in the Field of Water Policy. Available online: http://www.heritagecouncil.ie/fileadmin/user_upload/Policy/External_Policy_Docs/Water_Framework_Directive.pdf (accessed on 16 March 2015).
- Liu, J.; Sample, D.J.; Bell, C.; Guan, Y. Review and research needs of bioretention used for the treatment of urban stormwater. Water 2014, 6, 1069–1099. [Google Scholar] [CrossRef]
- Kalmykova, Y.; Björklund, K.; Strömvall, A.-M.; Blom, L. Partitioning of polycyclic aromatic hydrocarbons, alkylphenols, bisphenol A and phthalates in landfill leachates and stormwater. Water Res. 2013, 47, 1317–1328. [Google Scholar] [CrossRef] [PubMed]
- Danish Nature Agency. Vandplan 2010–2015 (Water Plan 2010–2015). Oresund. Main Water Catchment 2.3. Water District Zealand. Available online: http://naturstyrelsen.dk/media/129462/23-%C3%B8resund_med_forside.pdf (accessed on 16 March 2015). (In Danish)
- Google Map. Mapdata. Available online: www.google.dk/maps/@55.7629869,12.4653354,16z (accesed on 13 November 2014).
- Veolia Water. Hydrotech 2012 Hydrotech Discfilter-17/21/31-Series. Available online: http://www.water-proved.de/de/Downloads/Hydroetch_Downloads/Brochure-HSF17_21_31-080415-DE-PRINT.pdf (accessed on 16 March 2015).
- Lindblom, E.; Ahlman, S.; Mikkelsen, P.S. Uncertainty-based calibration and prediction with a stormwater surface accumulation-washoff model based on sampled Zn, Cu, Pb and Cd field data. Water Res. 2011, 45, 3823–3835. [Google Scholar] [CrossRef] [PubMed]
- U.S. Environmental Protection Agency. Residue, Non-Filterable Gravimetric, Dried at 103–105 °C; Method 160.2; U.S. EPA National Exposure Research Laboratory (NERL): Research Triangle Park, NC, USA, 1971. [Google Scholar]
- Allen, T. Powder sampling and particle size measuremen. In Particle Size Measurements, 5th ed.; Springer: Dordrecht, The Netherlands, 1997; Volume 1, pp. 329–338. [Google Scholar]
- Li, Y.; Lau, S.-L.; Kayhanian, M.; Stenstrom, M.K. Dynamic characteristics of particle size distribution in highway runoff: Implications for settling tank design. J. Environ. Eng. 2006, 132, 825–861. [Google Scholar] [CrossRef]
- Ganzler, K.; Salgo, A.; Valko, K. Microway extraction—A novel sample preparation method for chromatography. J. Chromatogr. 1986, 371, 299–306. [Google Scholar] [CrossRef] [PubMed]
- Waksmundzka-Hajnos, M.; Wronska, B. Retention Behaviour of Model Solutes on Mixed Silica-Magnesua adsorbents by TLC. Comparison with the adsorption properties of Florisil. Chromatographia 1996, 43, 405–412. [Google Scholar] [CrossRef]
- Willey, J.D.; Bennett, R.I.; Williams, J.M.; Denne, R.K.; Kornegay, C.R.; Perlotto, M.S.; Moore, B.M. Effect of storm type on rainwater composition in southeastern North Carolina. Environ. Sci. Technol. 1988, 22, 41–46. [Google Scholar] [CrossRef] [PubMed]
- Fenn, M.E.; Bytnerowicz, A. Summer throughfall and winter deposition in the San Bernardino mountains in Southern California. Atmos. Environ. 1997, 31, 673–483. [Google Scholar] [CrossRef]
- Engelhard, C.; de Toffol, S.; Lek, I.; Rauch, W.; Dallinger, R. Environmental impacts of urban snow management—The alpine case study of Innsbruck. Sci. Total Environ. 2007, 382, 286–294. [Google Scholar] [CrossRef] [PubMed]
- Legret, M.; Pagotto, C. Evaluation of pollutant loadings in the runoff waters from a major rural highway. Sci. Total Environ. 1999, 235, 143–150. [Google Scholar] [CrossRef] [PubMed]
- Langeveld, J.G.; Liefting, H.J.; Boogaard, F.C. Uncertainties of stormwater characteristics and removal rates of stormwater treatment facilities: Implications for stormwater handling. Water Res. 2012, 46, 6868–6880. [Google Scholar] [CrossRef] [PubMed]
- Lucke, T.; Mohamed, M.A.K.; Tindale, N. Pollutant removal and hydraulic reduction performance of field grassed swales during runoff simulation experiments. Water 2014, 6, 1887–1904. [Google Scholar] [CrossRef]
- Zhang, K.; Randelovic, A.; Page, D.; McCarthy, D.T.; Deletic, A. The validation of stormwater biofilters for micropollutant removal using in situ challenge tests. Ecol. Eng. 2014, 67, 1–10. [Google Scholar] [CrossRef]
- Cho, D.; Lee, S.; Frey, M.W. Characterizing zeta potential of functional nanofibers in a microfluidic device. J. Colloid Interface Sci. 2012, 372, 252–260. [Google Scholar] [CrossRef] [PubMed]
- Jia, J.; Jia, Z.; Iwata, S. Bimodal colloidal mixtures: From fast to slow aggregation regions. J. Colloid Interface Sci. 2011, 362, 633–637. [Google Scholar] [CrossRef] [PubMed]
© 2015 by the authors; licensee MDPI, Basel, Switzerland. This article is an open access article distributed under the terms and conditions of the Creative Commons Attribution license (http://creativecommons.org/licenses/by/4.0/).