1. Introduction
The transfer of organic wastes to soils can be intentional, as part of farm nutrient management plans, or unintentional, because of runoff under very wet conditions often associated with wet weather events. In either case, human health can be negatively impacted through transport of pathogens to surface or ground water [
1].
Transfer of pathogens from a source to sinks in the environment is considered under quantitative microbial risk assessment (QMRA) in a modular approach [
2,
3,
4]. Therefore development of any QMRA requires good understanding of the rates of long-term and repeated transfer events with pathogens crossing the interfaces between various sequences of intermediary sinks.
Soils are the most important component in this sequence. Thus, understanding the parameters of bacterial transport through or across soils is critical. Classically, the transfer of bacteria through soils was dealt with in a mass conservation approach [
5]. In practice, this means that the changes in recoverable bacteria during travel through soil are a function of the number added minus those lost by filtration, adsorption, sedimentation and death [
5].
As pathogenic bacteria may survive [
6] or even grow in the environment [
7], albeit very slowly, a production term for bacteria is occasionally included as a source [
8]. Thus a general filtration coefficient is often applied that intrinsically accounts for all sources of loss.
Filtration theory has been developed for saturated and structurally homogeneous systems. For example, detailed scale modelling employing colloidal models often uses clean bed filtration theory with the Happel sphere-in-cell model to describe filtration while maintaining overall porosity [
8,
9]. Straining and hydrodynamic drag are often implicated when considering physical deposition [
10]. Charge properties are considered of importance in bacterial retention on hydrophobic or hydrophilic soil surfaces. Retention under such conditions is dependent on the dynamic electrostatic properties of bacterial cells, soils, other colloids, and the ion-rich suspending soil and waste solution mix [
11].
For undisturbed field soils, transport of bacteria and similar colloids must however account for pore size, tortuosity, and continuity distributions under conditions of varying soil water contents. The application of filtration theory to such conditions thus required the development of empirical models with various fitted parameters to account for non-steady state conditions.
To allow advection of the mass of bacteria through pores that permit their passage a critical threshold soil water content must be surmounted to initiate flow. However, this threshold may be overcome to varying extents within the soil volume and this will cause heterogeneity in water content and of transport. Limitation of access by bacteria to particular pores, which have both the required equivalent diameter and continuity, allows for bypass flow in locally saturated soil. Such transport pathways may not be stable and this affects the continuity of transport. Variability in water content may therefore induce quantitative and qualitative differences in mass transport.
Both temporary retention and associated re-suspension together with permanent retention must be included when longer-term transport is considered. Nevertheless much of the understanding of transport potential in soils has been developed in repacked soils differing widely in volume and often involving conditions of “worst-case scenario” which commonly means saturated soils under ponded conditions, and mostly after a single extended event [
12].
There is limited information on the long-term transport of bacteria through unsaturated soils after limited and repeated rainfall [
13]. Management options, including type of waste, affect transport pathway stability [
14]. For systems with continuous transport pathways remobilization of microbes is strictly an electrostatic phenomenon. If tortuous and partial pathways open and close in association with successive flow events, movement is equivalent to discontinuous transport, when long-term transport of bacteria is a function of electrostatic interactions between bacterial cells and between cells and soil surfaces. It is also a function of the availability of active flow pathways. Bradford
et al. [
15] recognised that transport is variable across temporal scales mainly due to changes in the relative importance of processes as soil water content varies with season. They considered that attachment depended on whether the energetics were favourable, because no high-energy barriers existed or there were energy minima present, or unfavourable, because such barriers did exist [
15]. Consequently, differences in adaptation to changing environmental conditions and participation in biofilms that vary in stability [
16] will cause alteration in the likelihood of attachment and re-suspension and thus in the long-term transport potential of bacteria.
Given the complexity of any mechanistic approach, a general filtration coefficient is still often implemented to account intrinsically for all sources of loss. Retention, as described by collision efficiency, was shown to vary consistently across distances and experimental conditions [
17]. We need to understand the role of waste type on transport pathway stability and retention and re-entrainment of bacteria to be able to understand and manage long-term risks associated with transport of pathogenic bacteria through soil.
The main goal of this paper is to assess how the form (liquid or dewatered solid) of organic amendments applied and the texture of the receiving soil interact to influence the stability of the bacterial transport pathways under unsaturated conditions during sequential simulated-rainfall events after initial application. Thus four events were investigated on approximately 20 to 40 days intervals. Water was applied by irrigation to mimic time-limited rainfall events. A secondary goal was to compare the cumulative filtration behaviour of four live bacteria, common pathogens or transport indicator organisms, with that of fluorescent hydrophobic microspheres of similar size, which could be used as tracers for appropriate pathogens.
Under real, rain-driven, infiltration transport of bacteria through soils will depend on the stability of transport pathways as governed by soil properties and the properties of the surface applied organic waste. Long-term transport of stable particles such as non-vegetative bacterial spores will likely be governed by the re-entrainment of sedimented and deposited spores as governed by soil water content and related pathway instability.
2. Materials and Methods
2.1. Lysimeter Collection
Undisturbed, monolith lysimeters (45 cm diameter × 50 cm length) were extracted by slowly inserting polyvinyl chloride cylindrical pipes, with wall thickness of 1 cm, into a clay soil (Alfred, ON, Canada; 45°32'53" N, W 74°51'48" W), a clay loam soil (Centralia, ON, Canada; 43°19'04" N, 1°30'11" W), or a sandy loam soil (Cambridge, ON, Canada; 43°28'45" N, 80°21'48" W). None of the locations where lysimeters were collected had a recent history of land application of biosolids. The clays soils (Alfred) have not received any biosolids or manure in the previous 10 years. There was no evidence that biosolids or manure had been applied to the clay loam soil (Centralia) for at least five years previous to monolith collection. The sandy soil monoliths (Cambridge) were collected from a research station where biosolids had been applied in the past but never at or close to the sampling location.
The soil was dug away from around the monolith such that the piping trimmed away only a small annulus of soil as it was forced downwards. This ensured that there was minimal compaction within the monolith during encasement. In addition the trimmed monolith was initially severed from the subsoil below so that it was slightly longer than the casing. A metal plate was then forced under the monolith and linked to a top plate with metal rods. A 2.4 cm thick polystyrene cover, equal in diameter to the inside diameter of the plastic piping, was placed between the soil and cover plate to reduce evaporation. Six monoliths were collected from each site. In the laboratory excess soil was carefully cut away from the bottom of each monolith to remove any smeared or disturbed material. Interface-flow between the soil and plastic casing was minimized by sealing the boundary with plaster of Paris poured around the rim both from the top and bottom. A double layer of fibreglass screen was placed on the bottom to support the monolith and prevent soil material from falling into sample collectors placed below. A grid of approximately 64 funnel-shaped potential collectors was placed immediately below the fibreglass screen to enable the characterization of drainage by area. Each collector was 5.5 cm × 5.5 cm at its base, except those around the edge of the core [
18]. The funnel shape allowed easy insertion into collection bottles.
Time domain reflectometry (TDR) probes were inserted horizontally at five depths from the cores’ surfaces at 5, 15, 25, 35, and 45 cm. This allowed automated measurement of changes in volumetric soil water content (θ) during the irrigation events using a Tektronix 1502-C cable tester (Tektronix Inc., Beaverton, OR, USA.) [
19].
2.2. Soil Characterization
Grab soil samples collected at same time as the monoliths were used for chemical and physical analyses (
Table 1). In addition, 10 standard aluminium core samples (5 cm diameter, 5 cm high) were taken at five depths (2.5–7.5 cm, 12.5–17.5 cm, 22.5–27.5 cm, 32.5–37.5 cm, and 42.5–47.5 cm) in each soil. Saturated hydraulic conductivity was determined using the falling head method [
20]. Half the cores from each depth were used to determine soil bulk density. Cores were oven dried for 24 h at 105 °C. Porosity was calculated from soil bulk density and assuming a particle density of 2.65 g cm
−3. After these measurements were recorded the oven-dry soils were analysed for additional characteristics: organic matter (OM) content [
21], cation exchange capacity (CEC) [
22], pH in CaCl
2 saturated soil paste, plant available calcium (Ca) based on extraction using a 1.0 N ammonium acetate solution and analysed using atomic absorption spectrophotometry [
23], and soil texture by the standard Stokes’ law hydrometer method.
2.3. Treated Municipal Waste (Biosolids)
Biosolids were collected from the wastewater treatment centre for the City of Ottawa, the Robert O. Pickard Environmental Centre, where both aerobic and anaerobic treatments are employed before materials are centrifuged (dewatered). Liquid, pre-dewatering (2.8% dry matter; LMB), and dewatered municipal waste biosolids (29% dry matter; DMW), were obtained and stored at 4 °C for no more than 48 h. The same batch was used for all experiments.
2.4. Tracers
Four bacteria indigenous to biosolids and soil were selected as live tracers.
Escherichia coli is a common faecal indicator of water quality, while
Enterococcus spp.,
Salmonella spp., and
Clostridium perfringens are pathogens common in municipal wastewaters [
24]. Background concentrations of the tracer bacteria were collected during a pre-wetting irrigation event (see
Section 2.5, Table S1). In addition, fluorescent polystyrene hydrophobic microspheres 3.7 μm in diameter were mixed with biosolids before application (
Table 2). We use the term “tracers” to refer collectively to the four bacteria and the microspheres, unless otherwise specified.
2.5. Experimental Protocol
Lysimeters were arranged in a factorial design, with two biosolids, three soils, and three replicates for a total of 18 lysimeters. However one of the lysimeters used for the C-LMB treatment was damaged during handling and eliminated from the analysis. For each soil type, lysimeters were randomly assigned a waste treatment. Following a single surface application of biosolids, each lysimeter was subjected to four test irrigation events. A preliminary irrigation immediately prior to the application of biosolids was employed to pre-wet the soil and determine the background concentration in leachate of bacteria corresponding to those present in the biosolids (Table S1).
Biosolids were applied homogeneously to the upper surface of the monolith lysimeters at a rate of 5 tonnes of dry matter ha−1 followed immediately by irrigation. Distilled water (ddH20) was used for irrigation at a rate of 10 mm h−1 for two hours (3000 mL), except for the last event when a 20 mm h−1 rate was employed (6000 mL). Irrigation events were spaced at about 20 to 40 days apart, longer between the third and fourth event. Water drained from the soil at zero tension.
Irrigation was delivered through a bespoke enclosed cylindrical PVC chamber of the same diameter as the lysimeter and with an internal chamber of 3 cm height. Water was released through hypodermic needles distributed on a 1 cm × 1 cm grid. Droplets were released at 25 cm above the soil surface. Soil moisture was monitored by TDR. Drainage water was collected for up to 30 min after the end of an irrigation event. The volume of water in each sample container was recorded. Samples greater than 10 mL were analysed for the full suite of microbial indicators. Turbid samples could be analysed using smaller samples. Bacteria were analysed and microsphere slides were prepared immediately.
Table 1.
Soil characteristics (mean and standard errors).
Table 1.
Soil characteristics (mean and standard errors).
| Site | Depth (cm) | Soil Texture | Sand (%) | Silt (%) | Clay (%) | Organic Matter (%) | Cation Exchange Capacity (cmol+ kg−1) | pH | Available Ca (mg kg−1 Dry) | Bulk Density–Bd (g cm−3) | Porosity (%) | Saturated Conductivity (Ksat) (mm h−1) |
|---|
| Alfred (C) | 0–10 | clay | 1.0 | 32.7 | 66.3 | 3.2 | 30.0 | 7.2 | 4,019 | 1.37 (0.03) | 0.48 (0.01) | 61 (105) |
| 10–20 | clay | 1.1 | 35.8 | 63.1 | 2.6 | 27.8 | 7.2 | 3,717 | 1.5 (0.07) | 0.44 (0.03) | 13 (21.1) |
| 20–30 | clay | 0.7 | 28.6 | 70.7 | 3.9 | 29.9 | 6.9 | 3,162 | 1.39 (0.03) | 0.48 (0.01) | 34 (19.8) |
| 30–40 | clay | 0.5 | 33.7 | 65.8 | 0.6 | 20.6 | 7.5 | 2,450 | 1.4 (0.06) | 0.47 (0.02) | 250 (572) |
| 40–50 | clay | 0.5 | 19.4 | 80.1 | 0.7 | 24.9 | 7.4 | 3,100 | 1.3 (0.06) | 0.51 (0.02) | 20 (29.7) |
| Centralia (CL) | 0–10 | clay loam | 21.6 | 49 | 29.4 | 2 | 29.2 | 7.5 | 4,369 | 1.29 (0.12) | 0.51 (0.05) | 440 (424) |
| 10–20 | silt loam | 28.6 | 50.2 | 21.2 | 3.3 | 26.7 | 7.5 | 5,497 | 1.58 (0.05) | 0.4 (0.02) | 560 (706) |
| 20-30 | loam | 27.2 | 49.9 | 22.9 | 3.4 | 27.5 | 7.5 | 4,981 | 1.47 (0.06) | 0.44 (0.02) | 470 (1,400) |
| 30–40 | silty clay loam | 16.5 | 51.2 | 32.3 | 0.6 | 24.5 | 7.8 | 5,113 | 1.69 (0.09) | 0.36 (0.03) | 48 (57) |
| 40–50 | silty clay loam | 13.3 | 51.5 | 35.1 | 0.5 | 22.5 | 7.9 | 5,690 | 1.62 (0.15) | 0.39 (0.06) | 310 (551) |
| Cambridge (SL) | 0–10 | sandy loam | 63.3 | 24.3 | 12.4 | 2.5 | 13.9 | 7.2 | 2,531 | 1.4 (0.04) | 0.47 (0.01) | 93 (61.6) |
| 10–20 | sandy loam | 68.8 | 22.2 | 9.0 | 2.1 | 12.0 | 7.4 | 1,955 | 1.58 (0.06) | 0.41 (0.02) | 27 (19.4) |
| 20–30 | sandy loam | 67 | 20.4 | 12.6 | 0.9 | 10.6 | 7.3 | 1,510 | 1.61 (0.06) | 0.39 (0.02) | 200 (423) |
| 30–40 | loamy coarse sand | 83 | 7.3 | 9.7 | 0.7 | 8.8 | 7.6 | 1,425 | 1.56 (0.04) | 0.41 (0.01) | 130 (109) |
| 40–50 | fine sandy loam | 58.8 | 32.2 | 9.1 | 0.3 | 9.0 | 8.0 | 4,177 | 1.93 (0.06) | 0.27 (0.02) | 92 (101) |
Table 2.
Concentration of bacteria and fluorescent hydrophobic microspheres in the test biosolids.
Table 2.
Concentration of bacteria and fluorescent hydrophobic microspheres in the test biosolids.
| Indicator | Liquid (LMB) | Dewatered (DMW) | Total cfu * Applied Per Lysimeter |
|---|
| Liquid (3000 mL) | Dewatered (300 g) |
|---|
| (log10 cfu gdm−1) |
|---|
| E. coli (−ve, rod, 1 × 2 − 6 μm) | 5.36 (0.13) ** | 7.85 (0.42) | 6.86 × 10⁸ | 2.10 × 10¹⁰ |
| Streptococcus spp. (−ve, rod, 1 × 2 − 6 μm) | 6.30 (0.25) | 7.42 (0.19) | 5.98 × 10⁹ | 7.98 × 10⁹ |
| Salmonella spp. (+ve, cocci, 0.5 × 1 μm) | 5.41 (0.28) | 6.98 (0.57) | 7.73 × 10⁸ | 2.83 × 10⁹ |
| C. perfringens (+ve, cocci, 0.5 × 1 μm) | 6.92 (0.08) | 6.96 (0.02) | 2.48 × 10¹⁰ | 2.76 × 10⁹ |
| Microspheres (sphere, 3.7 μm) | 6.34 | 6.31 | 1.78 × 10⁸ | 1.78 × 10⁸ |
2.6. Microbiological Analyses
Membrane filtration (0.45 μm nylon membrane filter) was used to separate microbes from water samples for the subsequent enumeration of bacteria and spores according to
Standard Methods for the Examination of Water and Wastewater [
25]. Filtered sample volumes varied from 1–10 mL aimed at producing 30 to 300 colony-forming units (cfu) per filter. Filters were incubated on agar-based substrates appropriately enriched for each indicator microbe. For
E. coli an mFC basal medium was amended with 0.1 g 5-bromo-4-chloro-3-indolyl-β-d-galactopyranoside (BCIG); blue colonies were counted [
25,
26].
Salmonella spp. was identified on SS agar [
27]; black colonies, indicative of the production of hydrogen sulphide, were enumerated.
Streptococcus spp. (
i.e.,
S. faecalis and
S. faecium) were recovered on KF Streptococcus agar amended with 1% 2,3,5-triphenyltetrazollum chloride (TTC) solution [
25]. Plates were inverted and incubated at 35 °C for 24 h, for
E. coli and
Salmonella spp., and 48 h for
Streptococcus spp. [
25,
26].
Clostridium perfringens were enumerated on a double layer Shahidi-Ferguson Perfringens (SFP) agar [
28]. The basal layer was supplemented with egg yolk emulsion, polymyxin B sulphate and kanamycin, while the top layer did not receive egg yolk extract. Plates were inverted and incubated anaerobically at 37 °C for 24 h. Colonies of
C. perfringens were characteristically black with an opaque rim [
25,
26].
2.7. Enumeration of Fluorescent Microspheres
Fluorescent microspheres 3.7 μm in diameter were used in lysimeter experiments to mimic the movement of larger protozoa such as Cryptosporidium through the soil. To enumerate the microspheres a known volume of drainage water was filtered through 0.45 μm filter paper and mounted on slides with a coverslip for inspection under an epifluorescent microscope (Nikon Eclipse 90i, Nikon Instruments, Melville, NY, USA). Microspheres excited under a blue wavelength of 450–490 nm fluoresce at 520 nm (green). Enumeration was conducted manually counting the total number of microspheres present in six squares of the filter grid (i.e., six replicates). The total active filter area was 254 mm2 (28.8 squares), therefore the detection limit was 4.7 microspheres mL−1.
2.8. Data Analysis
Best-fit probability density functions (PDF), or distributions, were evaluated in XLStat [
29] with the maximum likelihood estimation method. PDFs were obtained separately for each tracer and event. Beta 4 distributions [
30] were employed when no standard PDF fit the data. The Kolmogorov Smirnov (K-S) test was used to verify if the calculated best-fit distributions were statistically similar (probability ≤ 0.05) to the empirical distribution. The advantage of the K-S test is that may be employed for smaller datasets and may be used for any distribution type. Only collectors that produced recoverable tracers were used. No density distribution was calculated for datasets with less than 10 data points. Empirical bacterial filtration coefficient (λ
f) distributions were also compared with microsphere λ
f distributions using the K-S test.
The total volume of water applied to the upper boundary of the lysimeters was the sum of that in the waste plus that provided in irrigation. Collection at the lower boundary of the lysimeters integrated the volume moving to each single collector during the irrigation event and until gravitational flow stopped-about 30 min after irrigation end. Thus no breakthrough curves were determined. To calculate the cumulative filtration coefficient (λ
f, m
−1) the initial concentration of an indicator, c
0, was taken to be the total amount of indicator distributed in the total amount of water applied at the initial waste application as distributed to the equivalent proportion of the individual collection areas (
N = 64).
Any change in the cumulative filtration values, as obtained during the subsequent irrigation events, integrated both filtration and any die-off or possibly regrowth parameters (
Figure 1). The irrigation rate was doubled for the last irrigation event. As λ
f is calculated on an area-proportional basis, this occasionally produced
c values larger than the area proportional
c0, and therefore negative filtration coefficients. For collectors that produced drainage without detectable tracers (
Figure 2) absolute filtration could be assumed (λ
f = ∞).
Figure 1.
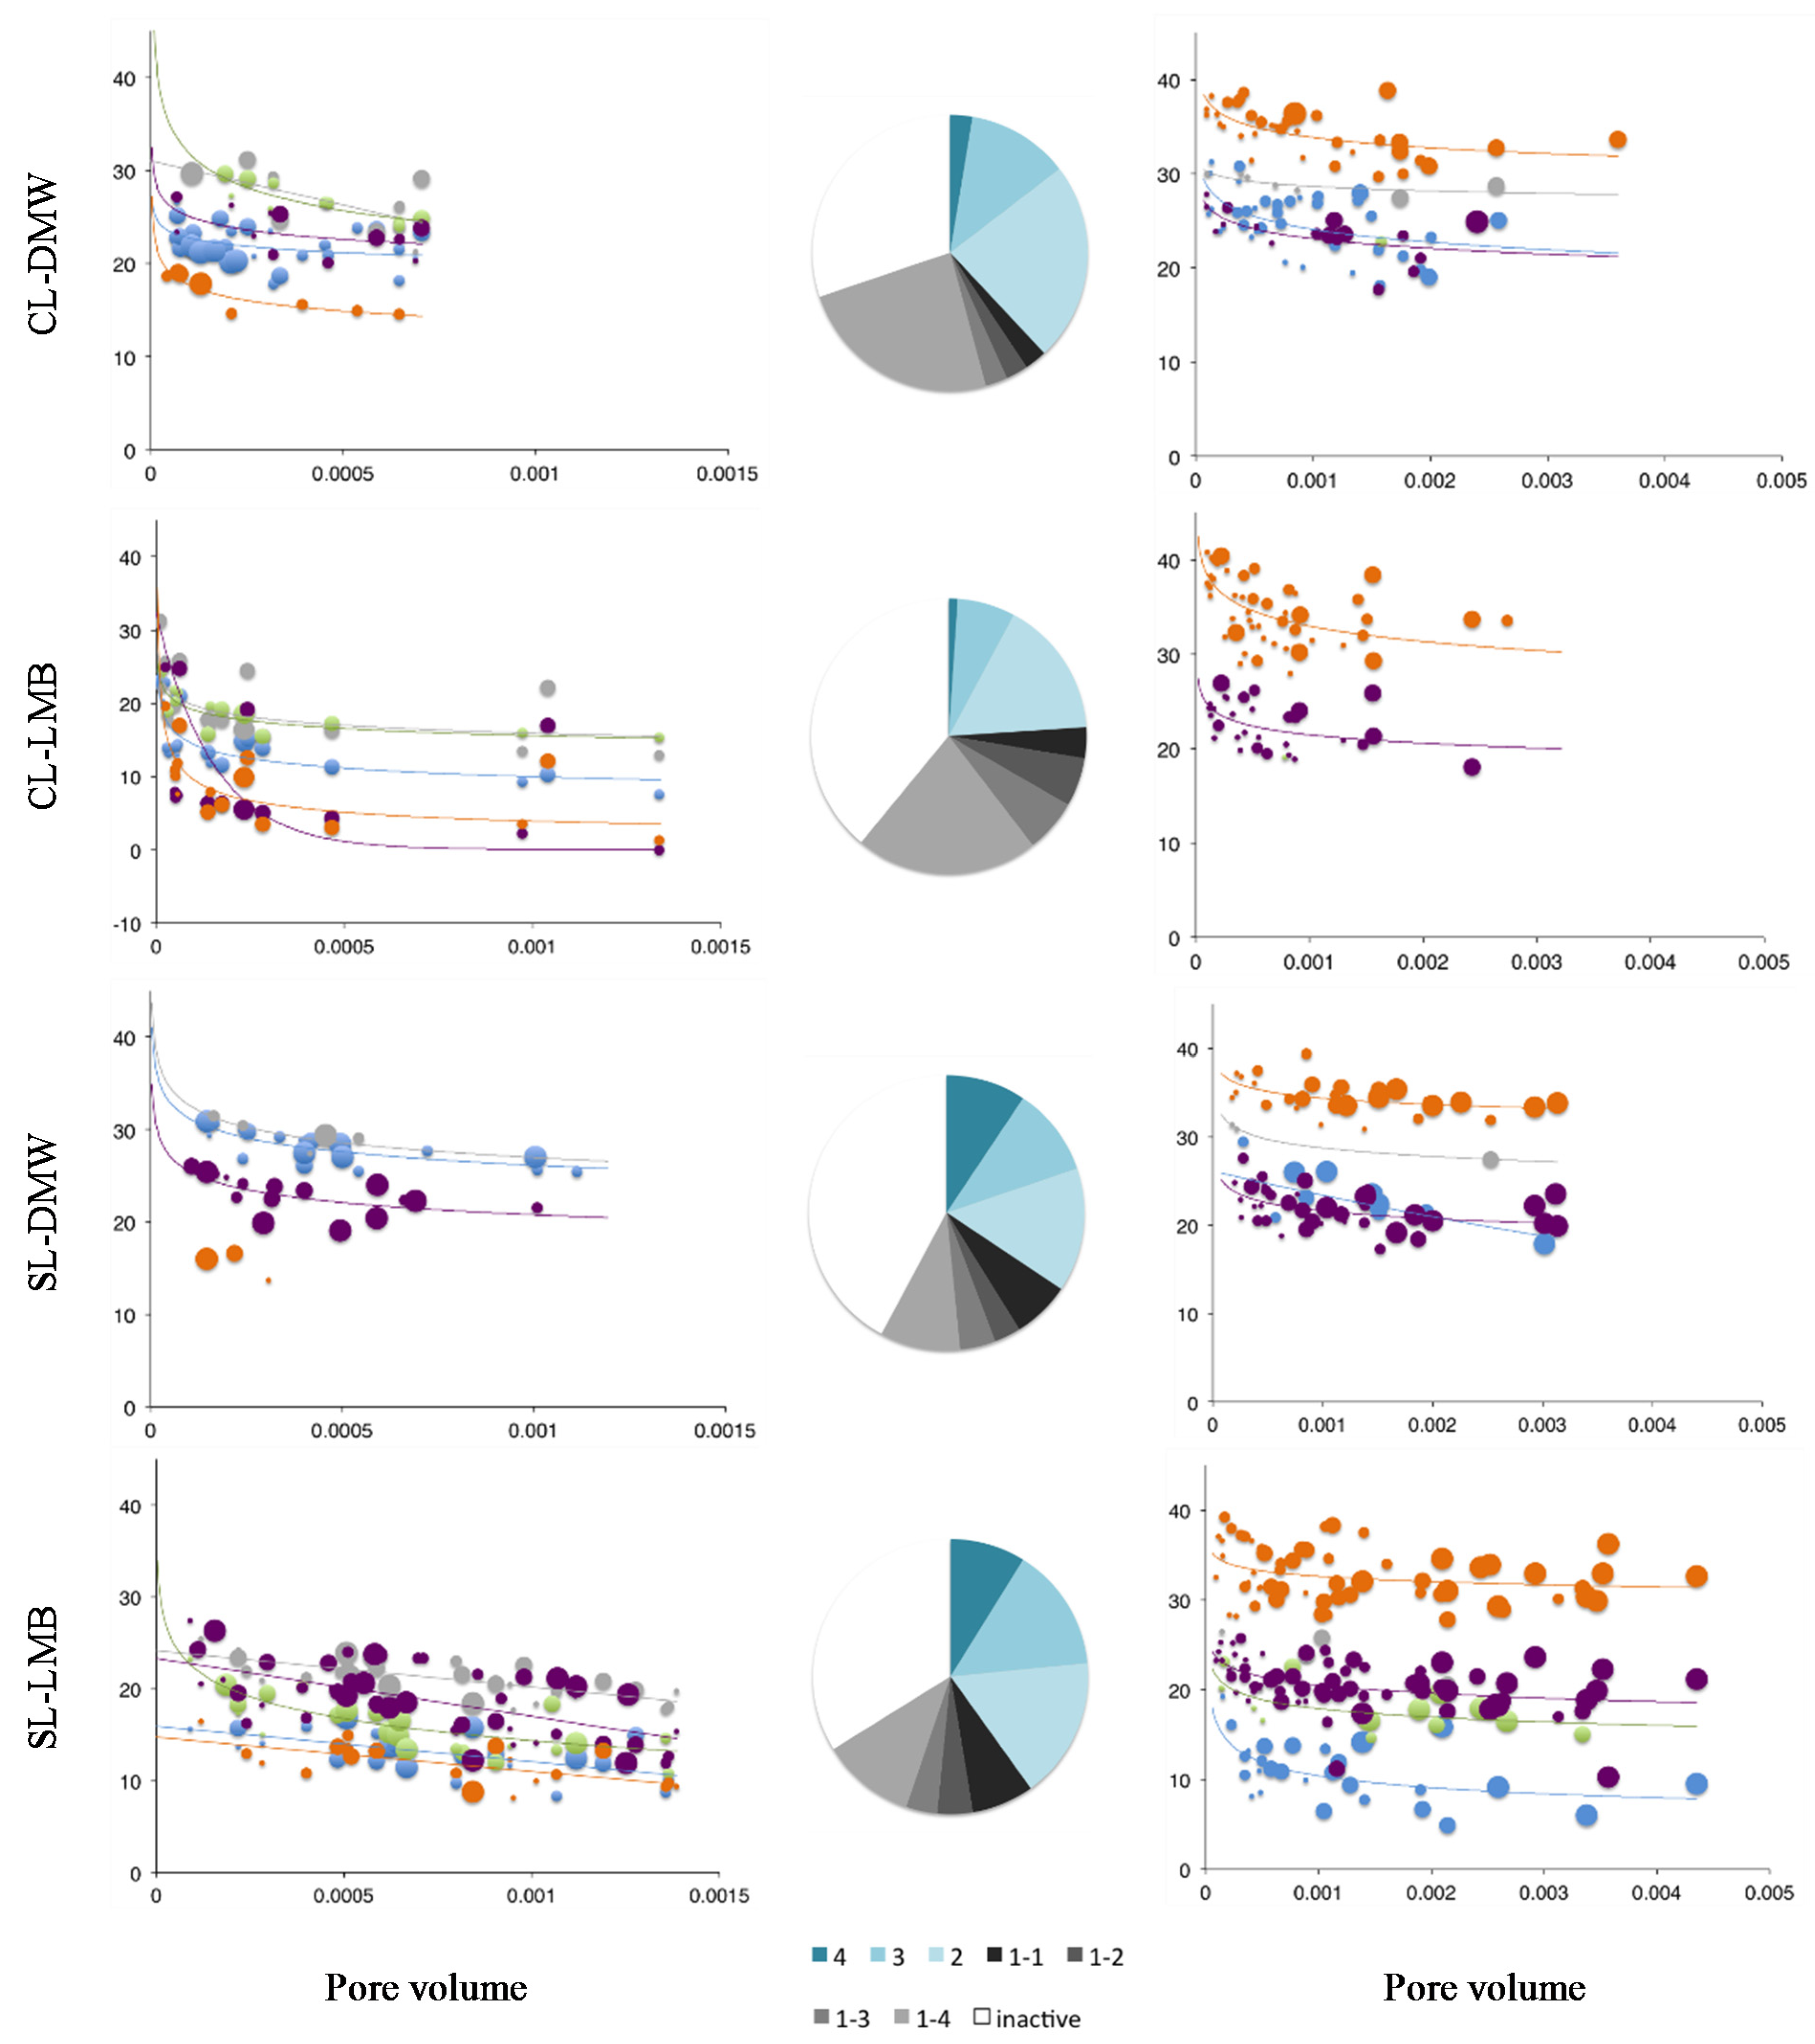
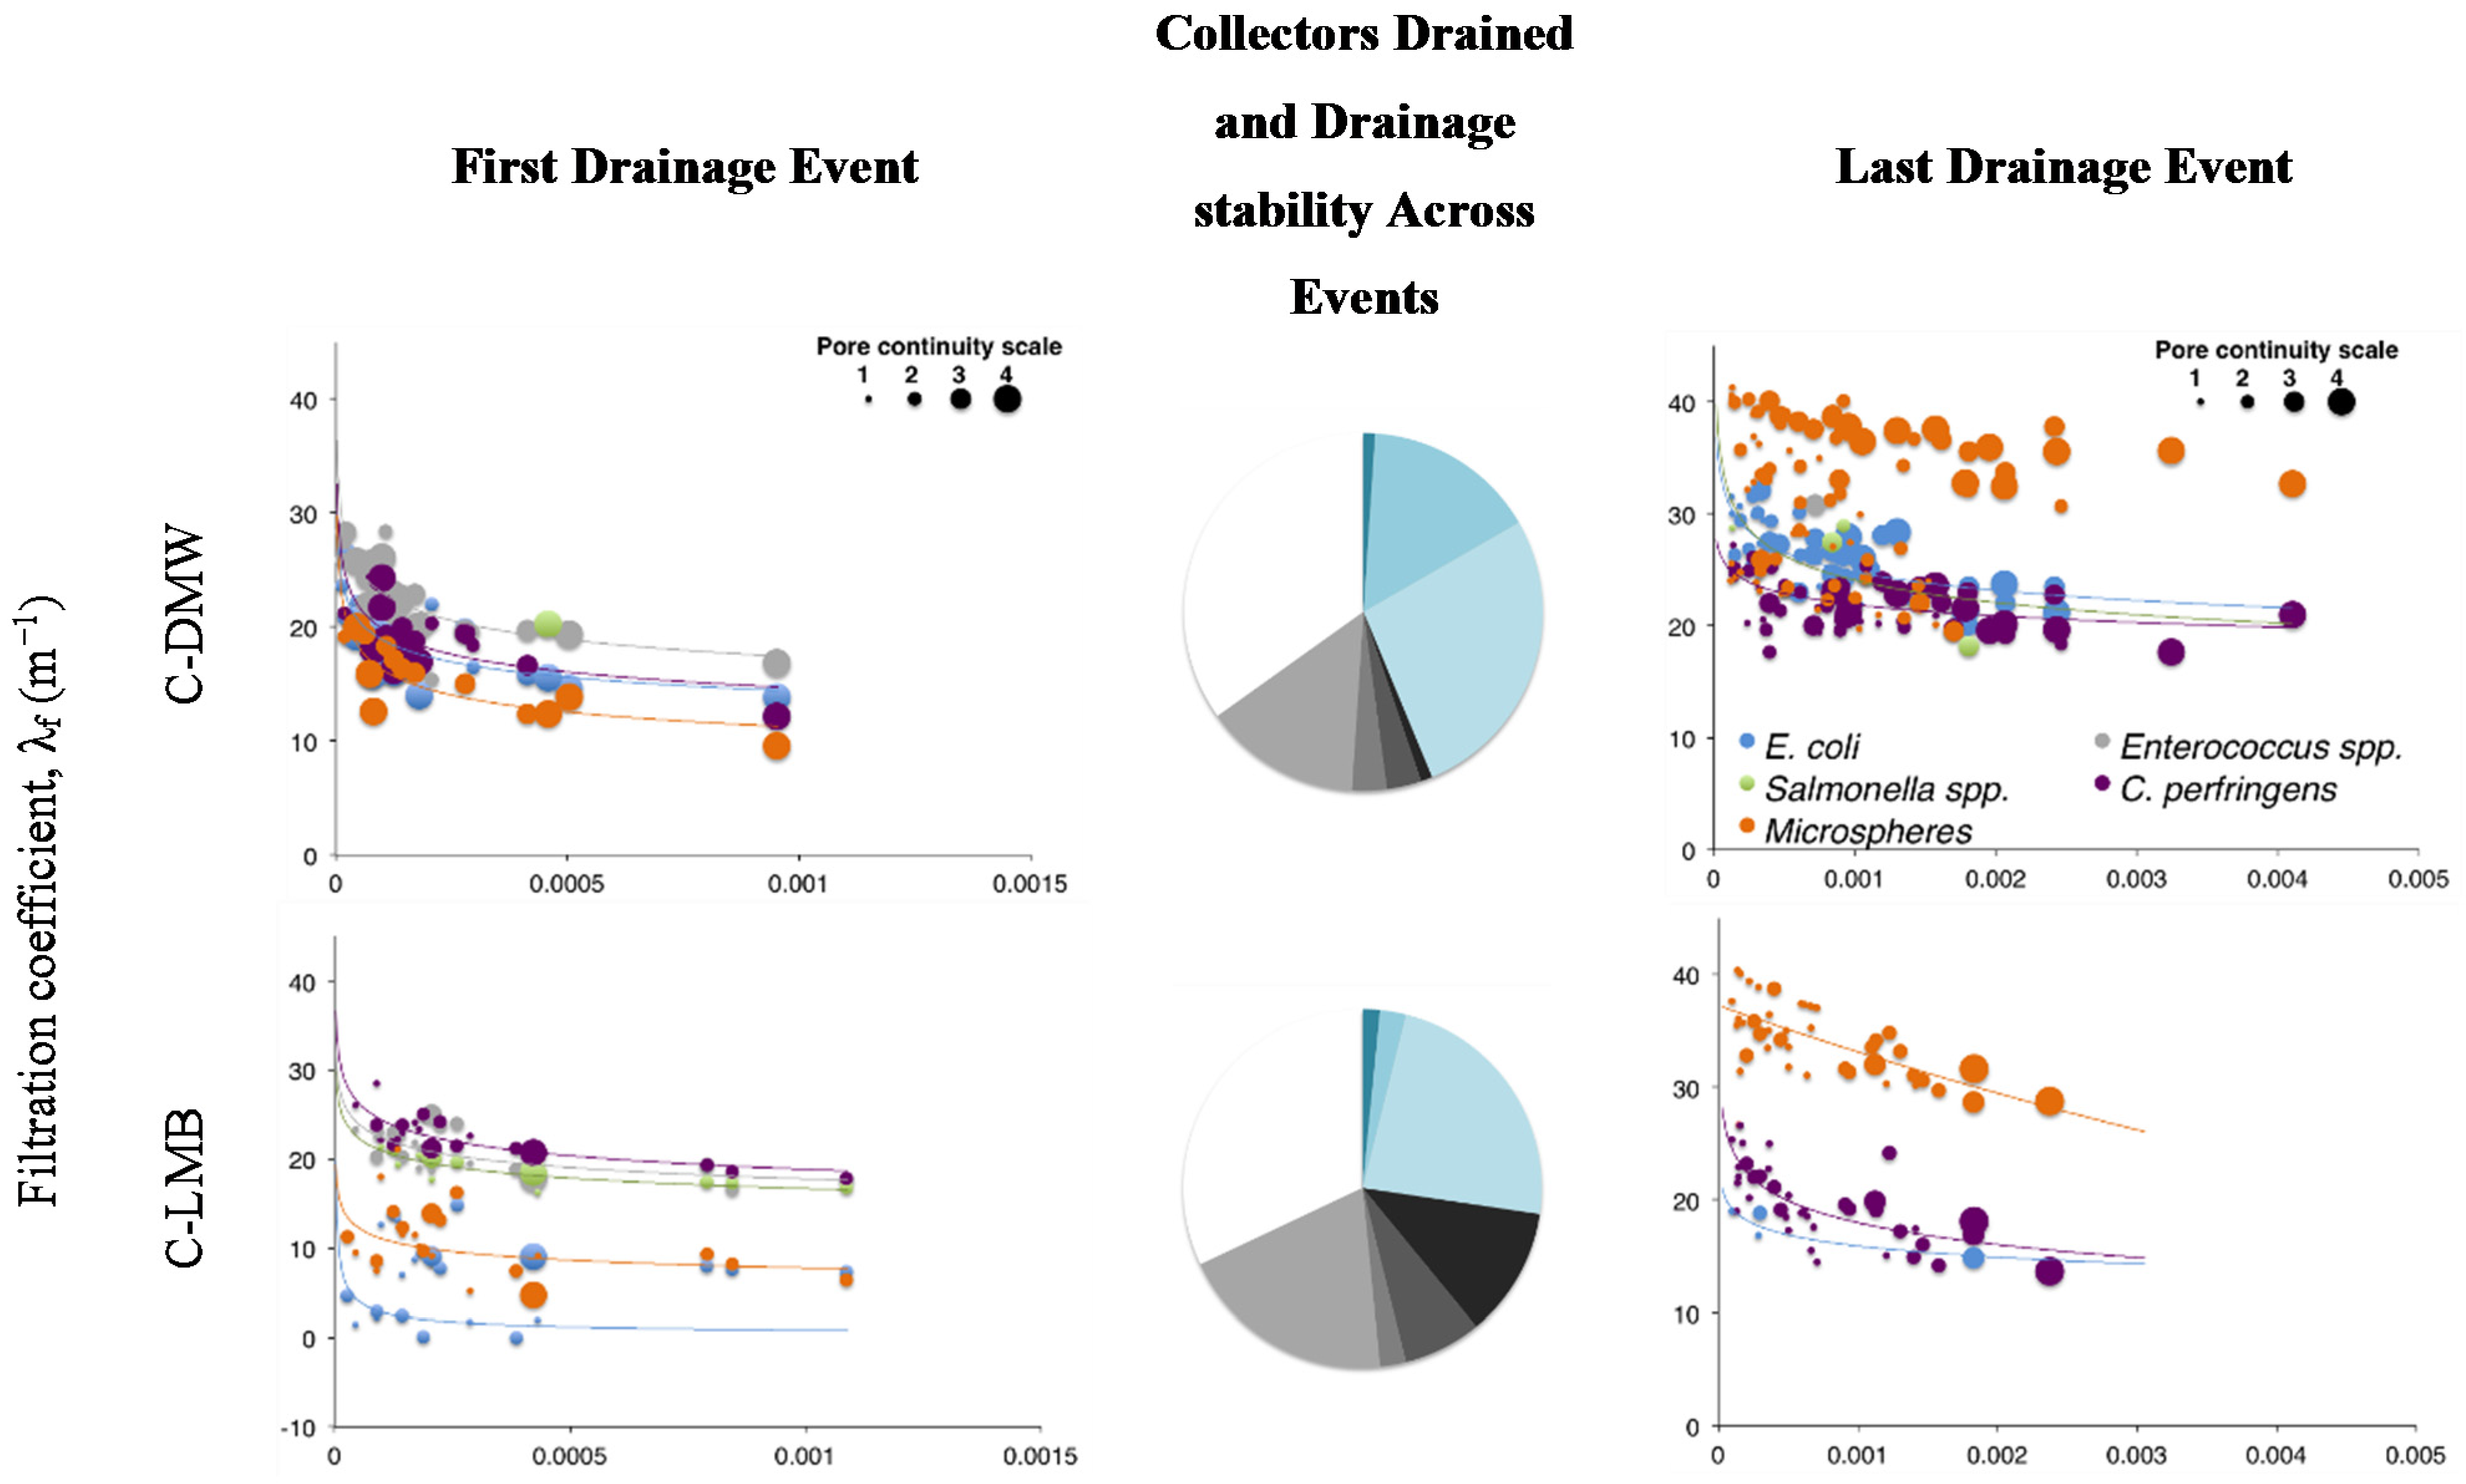
Filtration coefficients for 1st and last drainage event. Last drainage event received double the irrigation volume. Size of bubble describes the flow continuity for the respective collector (i.e., 4 = Area drained at all four events). Pie charts summarize the proportion of collectors’ activity with events. Blue shades describe, clockwise, the proportion of collectors active for four, three or two events. The black and grey shades describe the proportion of collectors active for a single event; e.g., 1–2 describes the proportion of collectors active only once during irrigation Event 2. White slices summarize the proportion of collectors inactive for the entire duration of the experiment. C–clay soil; CL–clay loam soil; SL–sandy loam soil; DMW–dewatered municipal biosolids organic amendment; LMB–liquid municipal biosolids organic amendment.
Figure 1.
Filtration coefficients for 1st and last drainage event. Last drainage event received double the irrigation volume. Size of bubble describes the flow continuity for the respective collector (i.e., 4 = Area drained at all four events). Pie charts summarize the proportion of collectors’ activity with events. Blue shades describe, clockwise, the proportion of collectors active for four, three or two events. The black and grey shades describe the proportion of collectors active for a single event; e.g., 1–2 describes the proportion of collectors active only once during irrigation Event 2. White slices summarize the proportion of collectors inactive for the entire duration of the experiment. C–clay soil; CL–clay loam soil; SL–sandy loam soil; DMW–dewatered municipal biosolids organic amendment; LMB–liquid municipal biosolids organic amendment.
Figure 2.
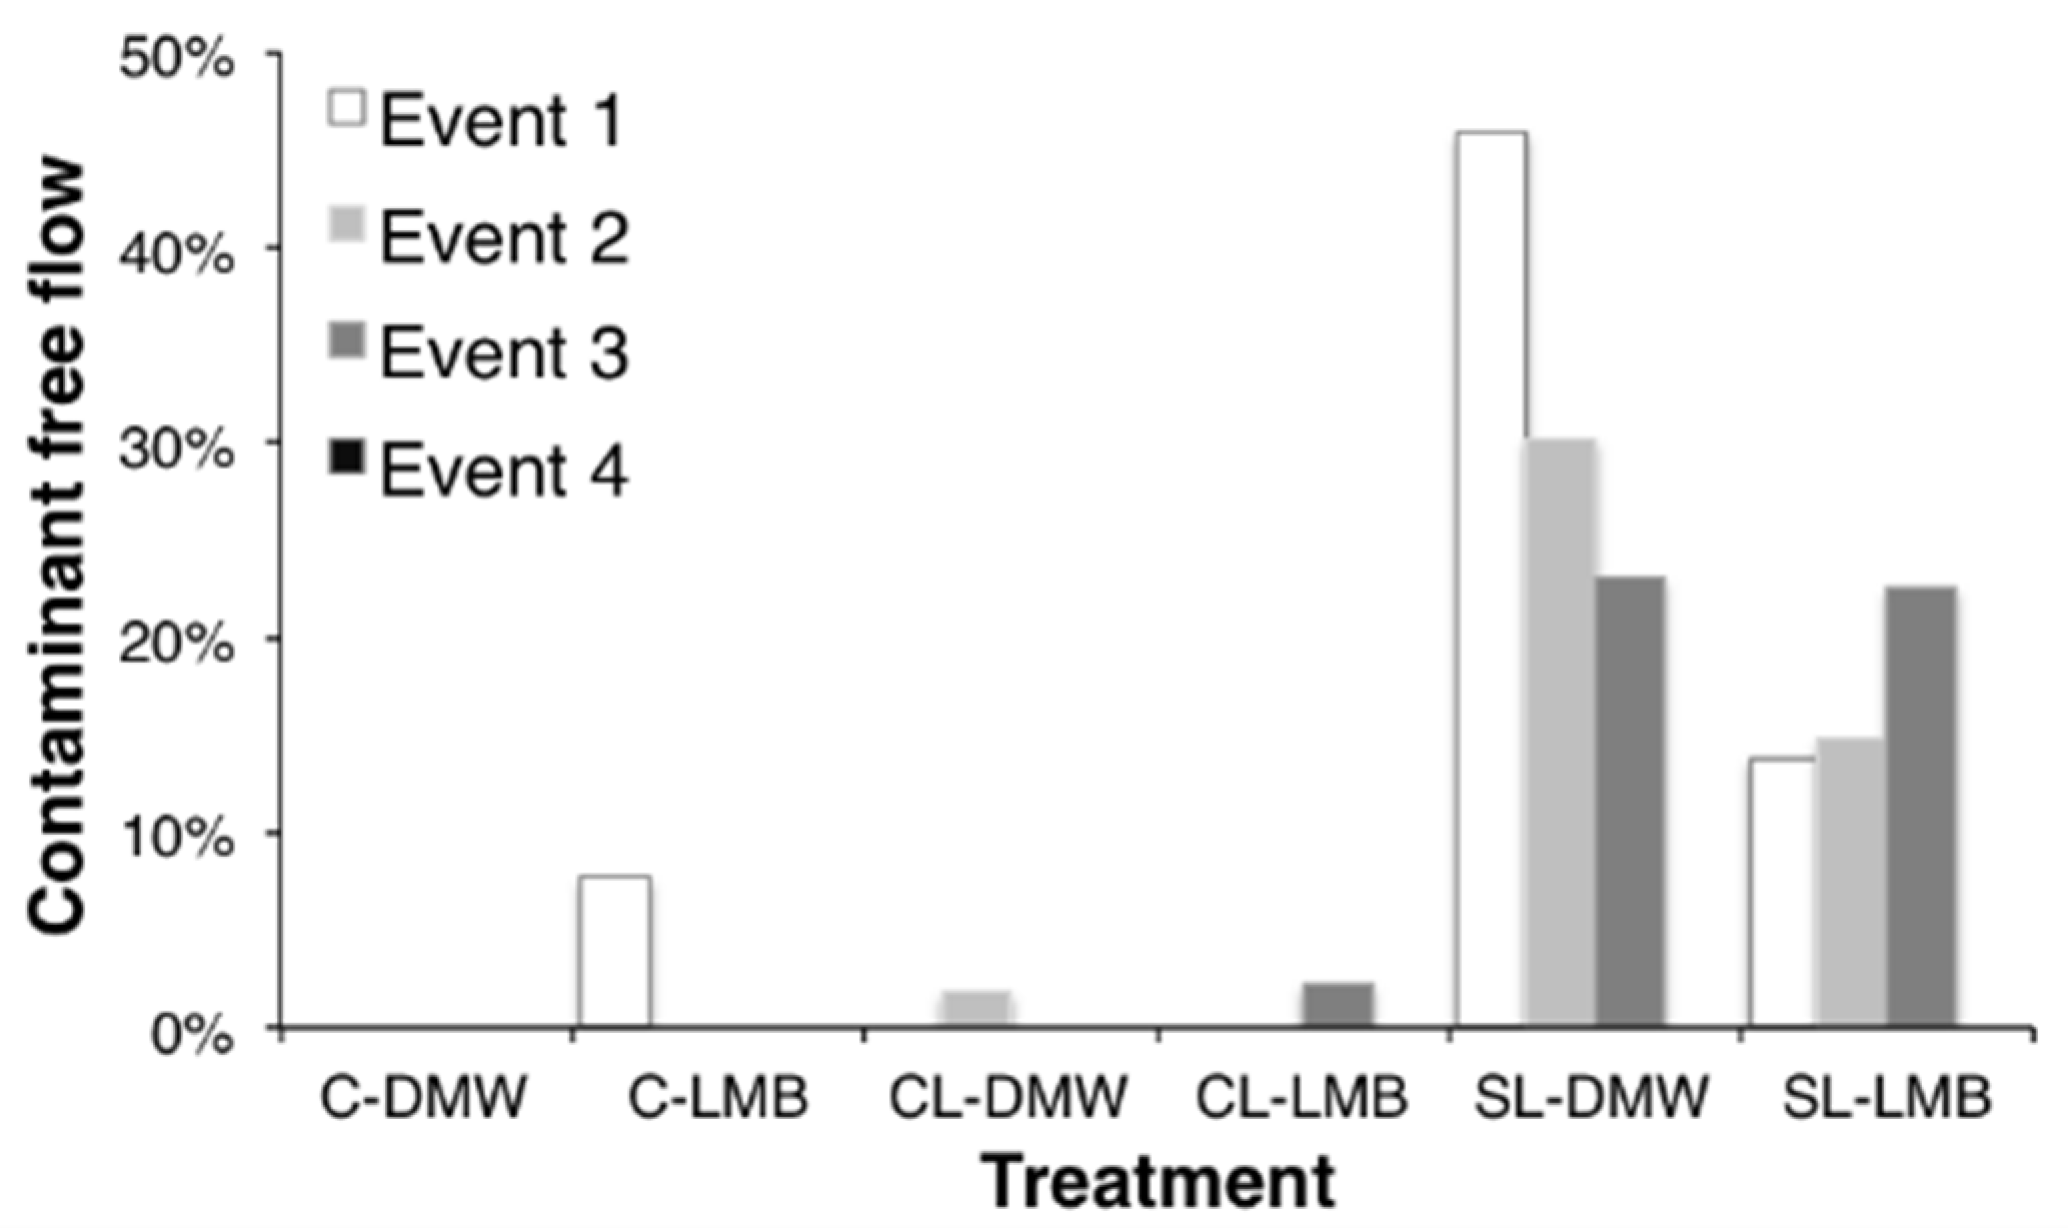
Proportion active collectors not participating in tracer transport (i.e., no detectable bacteria or microspheres; i.e., absolute filtration λf = ∞). C–clay soil; CL–clay loam soil; SL–sandy loam soil; DMW–dewatered municipal biosolids organic amendment; LMB–liquid municipal biosolids organic amendment.
Figure 2.
Proportion active collectors not participating in tracer transport (i.e., no detectable bacteria or microspheres; i.e., absolute filtration λf = ∞). C–clay soil; CL–clay loam soil; SL–sandy loam soil; DMW–dewatered municipal biosolids organic amendment; LMB–liquid municipal biosolids organic amendment.
3. Results
Negative filtration coefficients were only observed for the treatments receiving of liquid municipal biosolids (LMB) on the structured clay or clay loam and likely indicates funnelled preferential flow (
Figure 3). In contrast, drainage to collectors that was free of detectable bacteria or microspheres occurred overwhelmingly in sandy soil. For the first event, close to 50% of active collectors produced no measurable tracer in sandy soil receiving dewatered biosolids (DMW) (
Figure 2).
Figure 3.
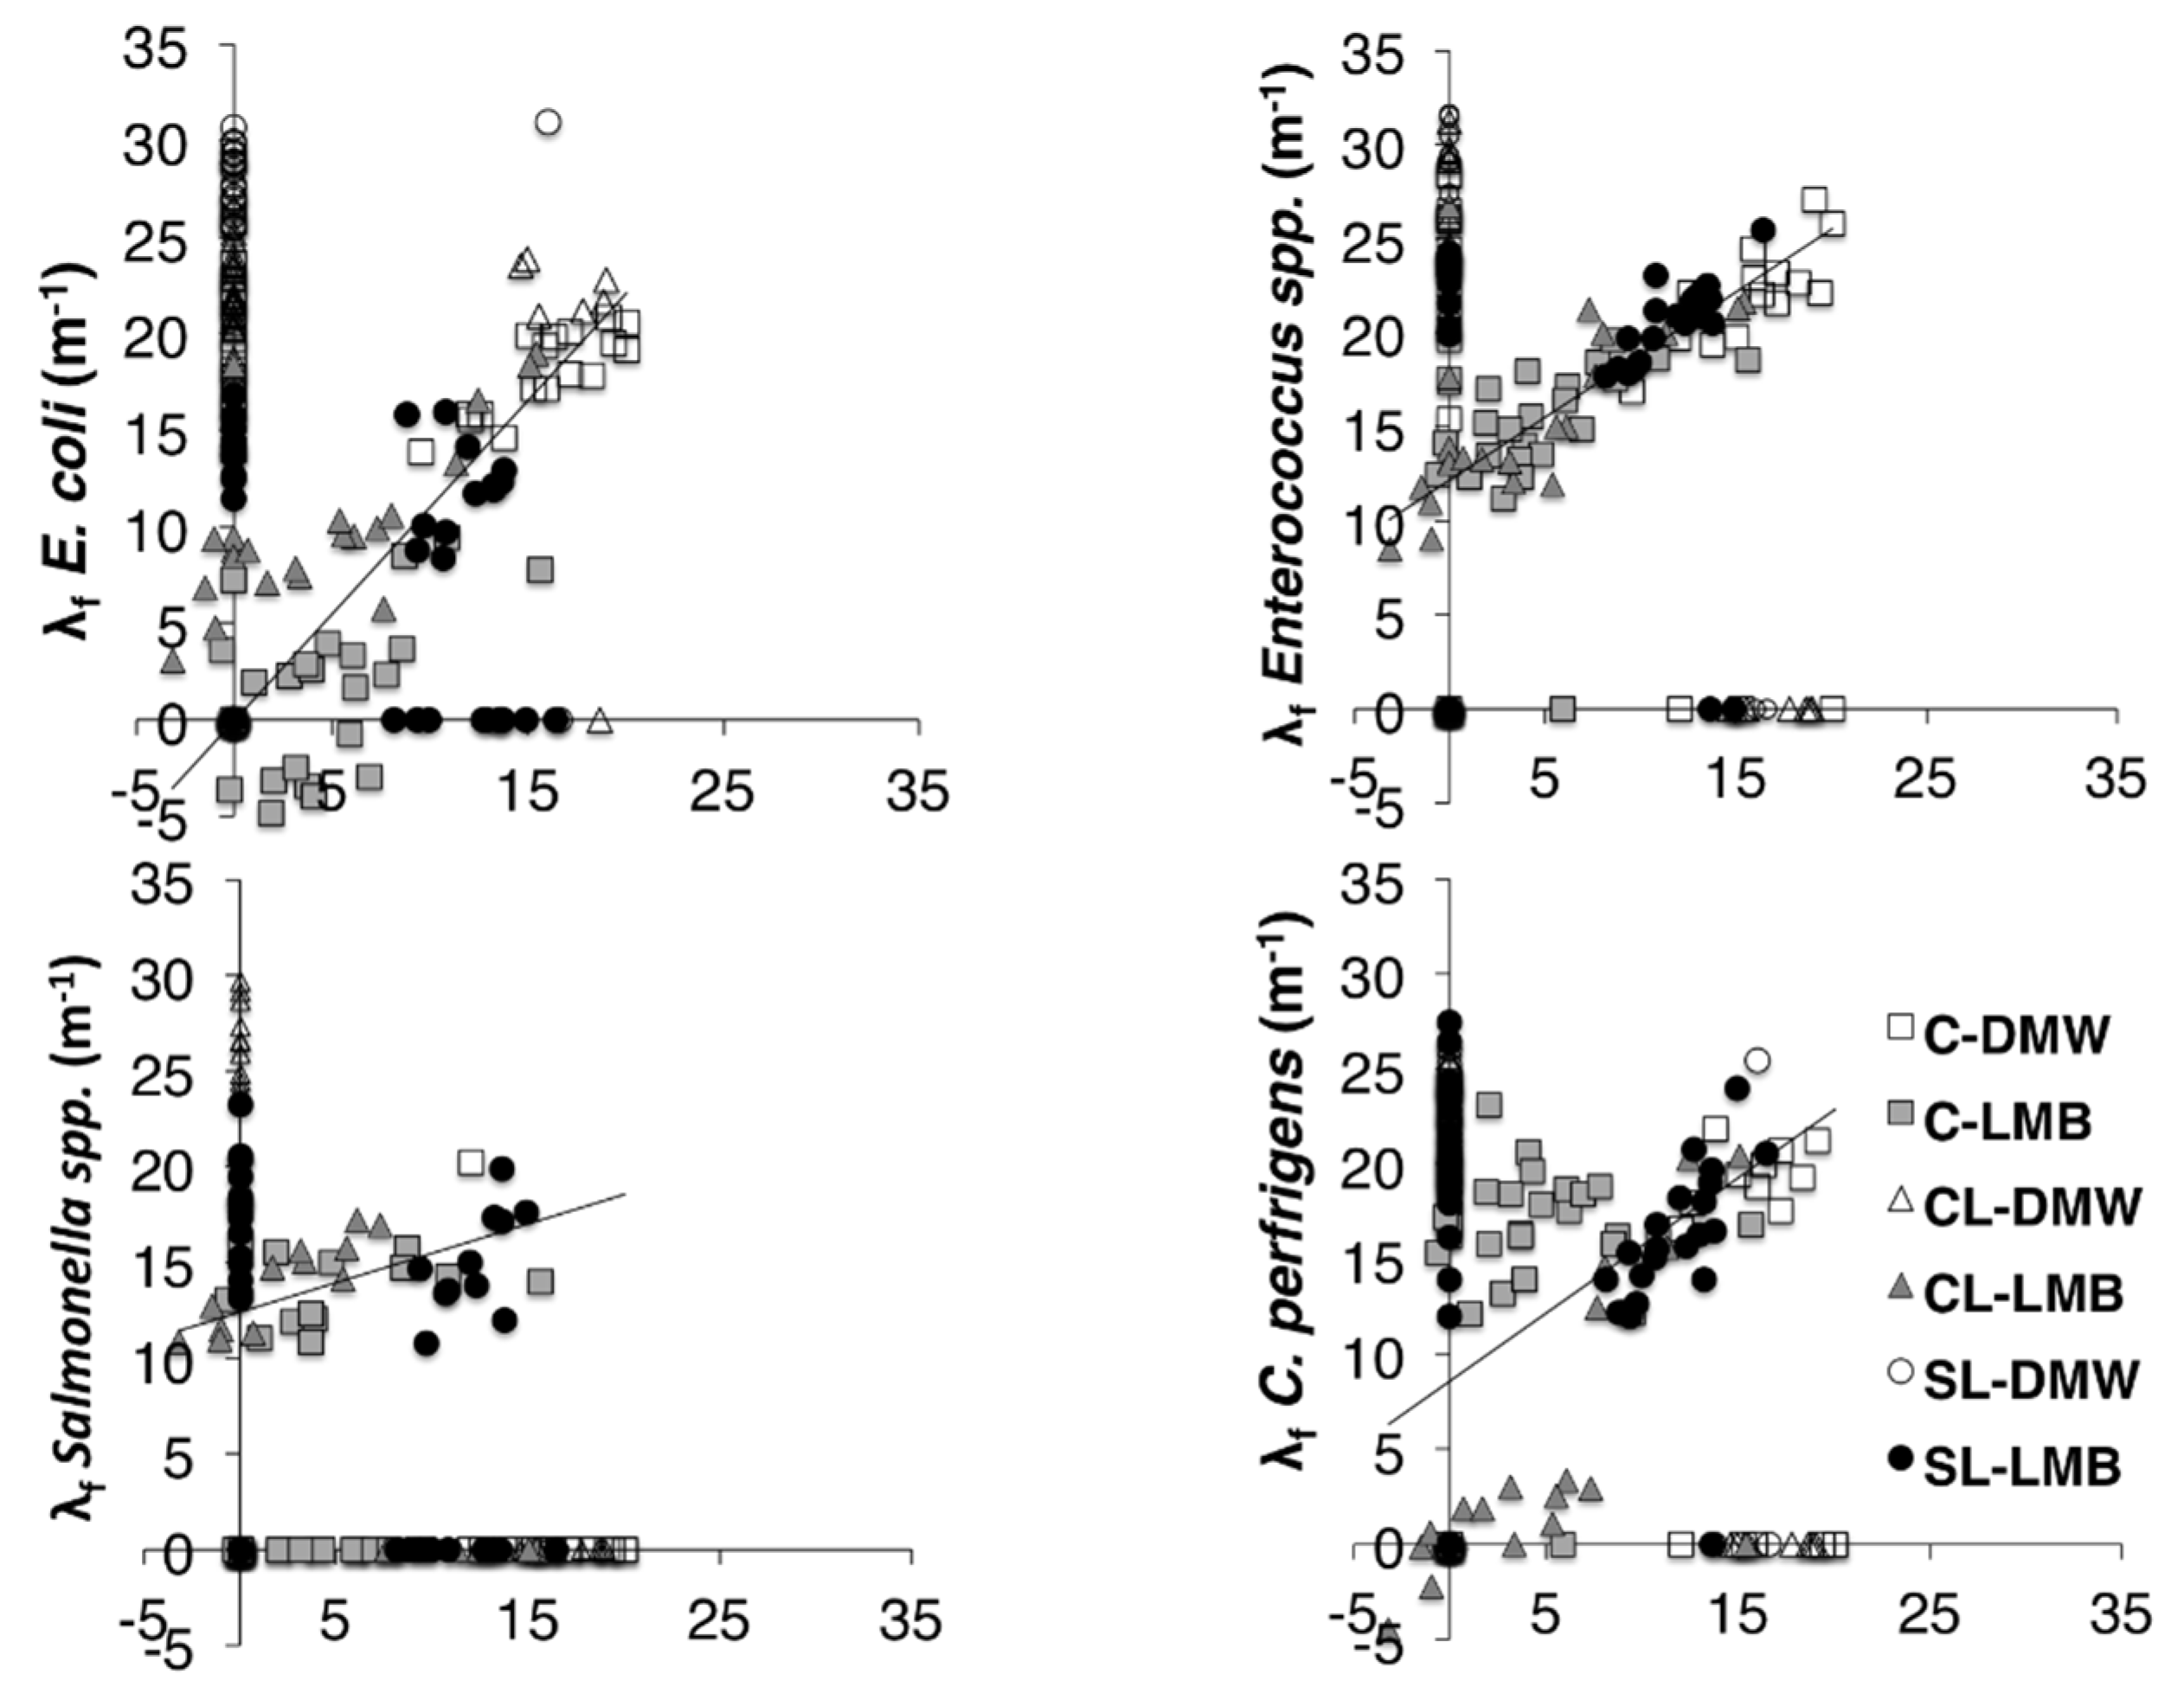
Relationship between the filtration coefficients of microspheres and bacterial indicators (Event 1). For graphical simplicity non-detects (λf = ∞) were assigned a filtration coefficient of 0. Linear regressions were fitted to all data points for which both λf ≠ ∞. C–clay soil; CL–clay loam soil; SL–sandy loam soil; DMW–dewatered municipal biosolids organic amendment; LMB–liquid municipal biosolids organic amendment.
Figure 3.
Relationship between the filtration coefficients of microspheres and bacterial indicators (Event 1). For graphical simplicity non-detects (λf = ∞) were assigned a filtration coefficient of 0. Linear regressions were fitted to all data points for which both λf ≠ ∞. C–clay soil; CL–clay loam soil; SL–sandy loam soil; DMW–dewatered municipal biosolids organic amendment; LMB–liquid municipal biosolids organic amendment.
Microsphere filtration coefficient λf (m−1)
While the average volumetric water content (θ) in the lysimeters varied slightly across events (
Table 3) no statistical relationship could be identified between either the starting or final θ and the drainage volume or number of active collectors (see
Section 2.1).
Table 3.
Average volumetric water content (θ) of lysimeter monoliths.
Table 3.
Average volumetric water content (θ) of lysimeter monoliths.
| Event | 1 | 2 | 3 | 4 |
|---|
| Treatment | | Start | End | Start | End | Start | End | Start | End |
|---|
| Clay-DMW | 0.35 (0.03) * | 0.39 (0.03) | 0.38 (0.06) | 0.41 (0.06) | 0.38 (0.04) | 0.41 (0.03) | 0.37 (0.01) | 0.41 (0.01) |
| Clay-LMB | 0.32 (0.03) | 0.37 (0.05) | 0.37 (0.03) | 0.4 (0.02) | 0.4 (0.04) | 0.43 (0.02) | 0.37 ** | 0.42 ** |
| Clay loam-DMW | 0.28 (0.03) | 0.33 (0.03) | 0.26 (0.06) | 0.29 (0.06) | 0.26 (0.08) | 0.29 (0.08) | 0.29 (0.04) | 0.35 (0.04) |
| Clay loam-LMB | 0.23 (0.02) | 0.30 (0.02) | 0.27 (0.06) | 0.30 (0.05) | 0.31 (0.01) | 0.35 (0.01) | 0.29 (0.01) | 0.34 (0.02) |
| Sandy loam-DMW | 0.27 (0.01) | 0.29 (0.01) | 0.26 (0.01) | 0.29 (0.02) | 0.25 (0.02) | 0.29 (0.03) | 0.27 (0.01) | 0.32 (0.01) |
| Sandy loam-LMB | 0.23 (0.02) | 0.28 (0.01) | 0.24 (0.01) | 0.27 (0.01) | 0.24 (0.01) | 0.28 (0.01) | 0.24 (0.01) | 0.28 (0.01) |
The distribution of λ
f across pore volume drainage equivalent could be reasonably fitted by power law regressions for most treatments (
Figure 1, Tables S2 and S3). This suggests that transport at increased flow (PVs), beyond the point of inflection of the power fit, results in limited further decline in filtration. Given that bacteria and microspheres were not applied continuously, this likely describes the retention of bacteria according to soil retention capacity with the total bacteria transported being independent of the flow volume.
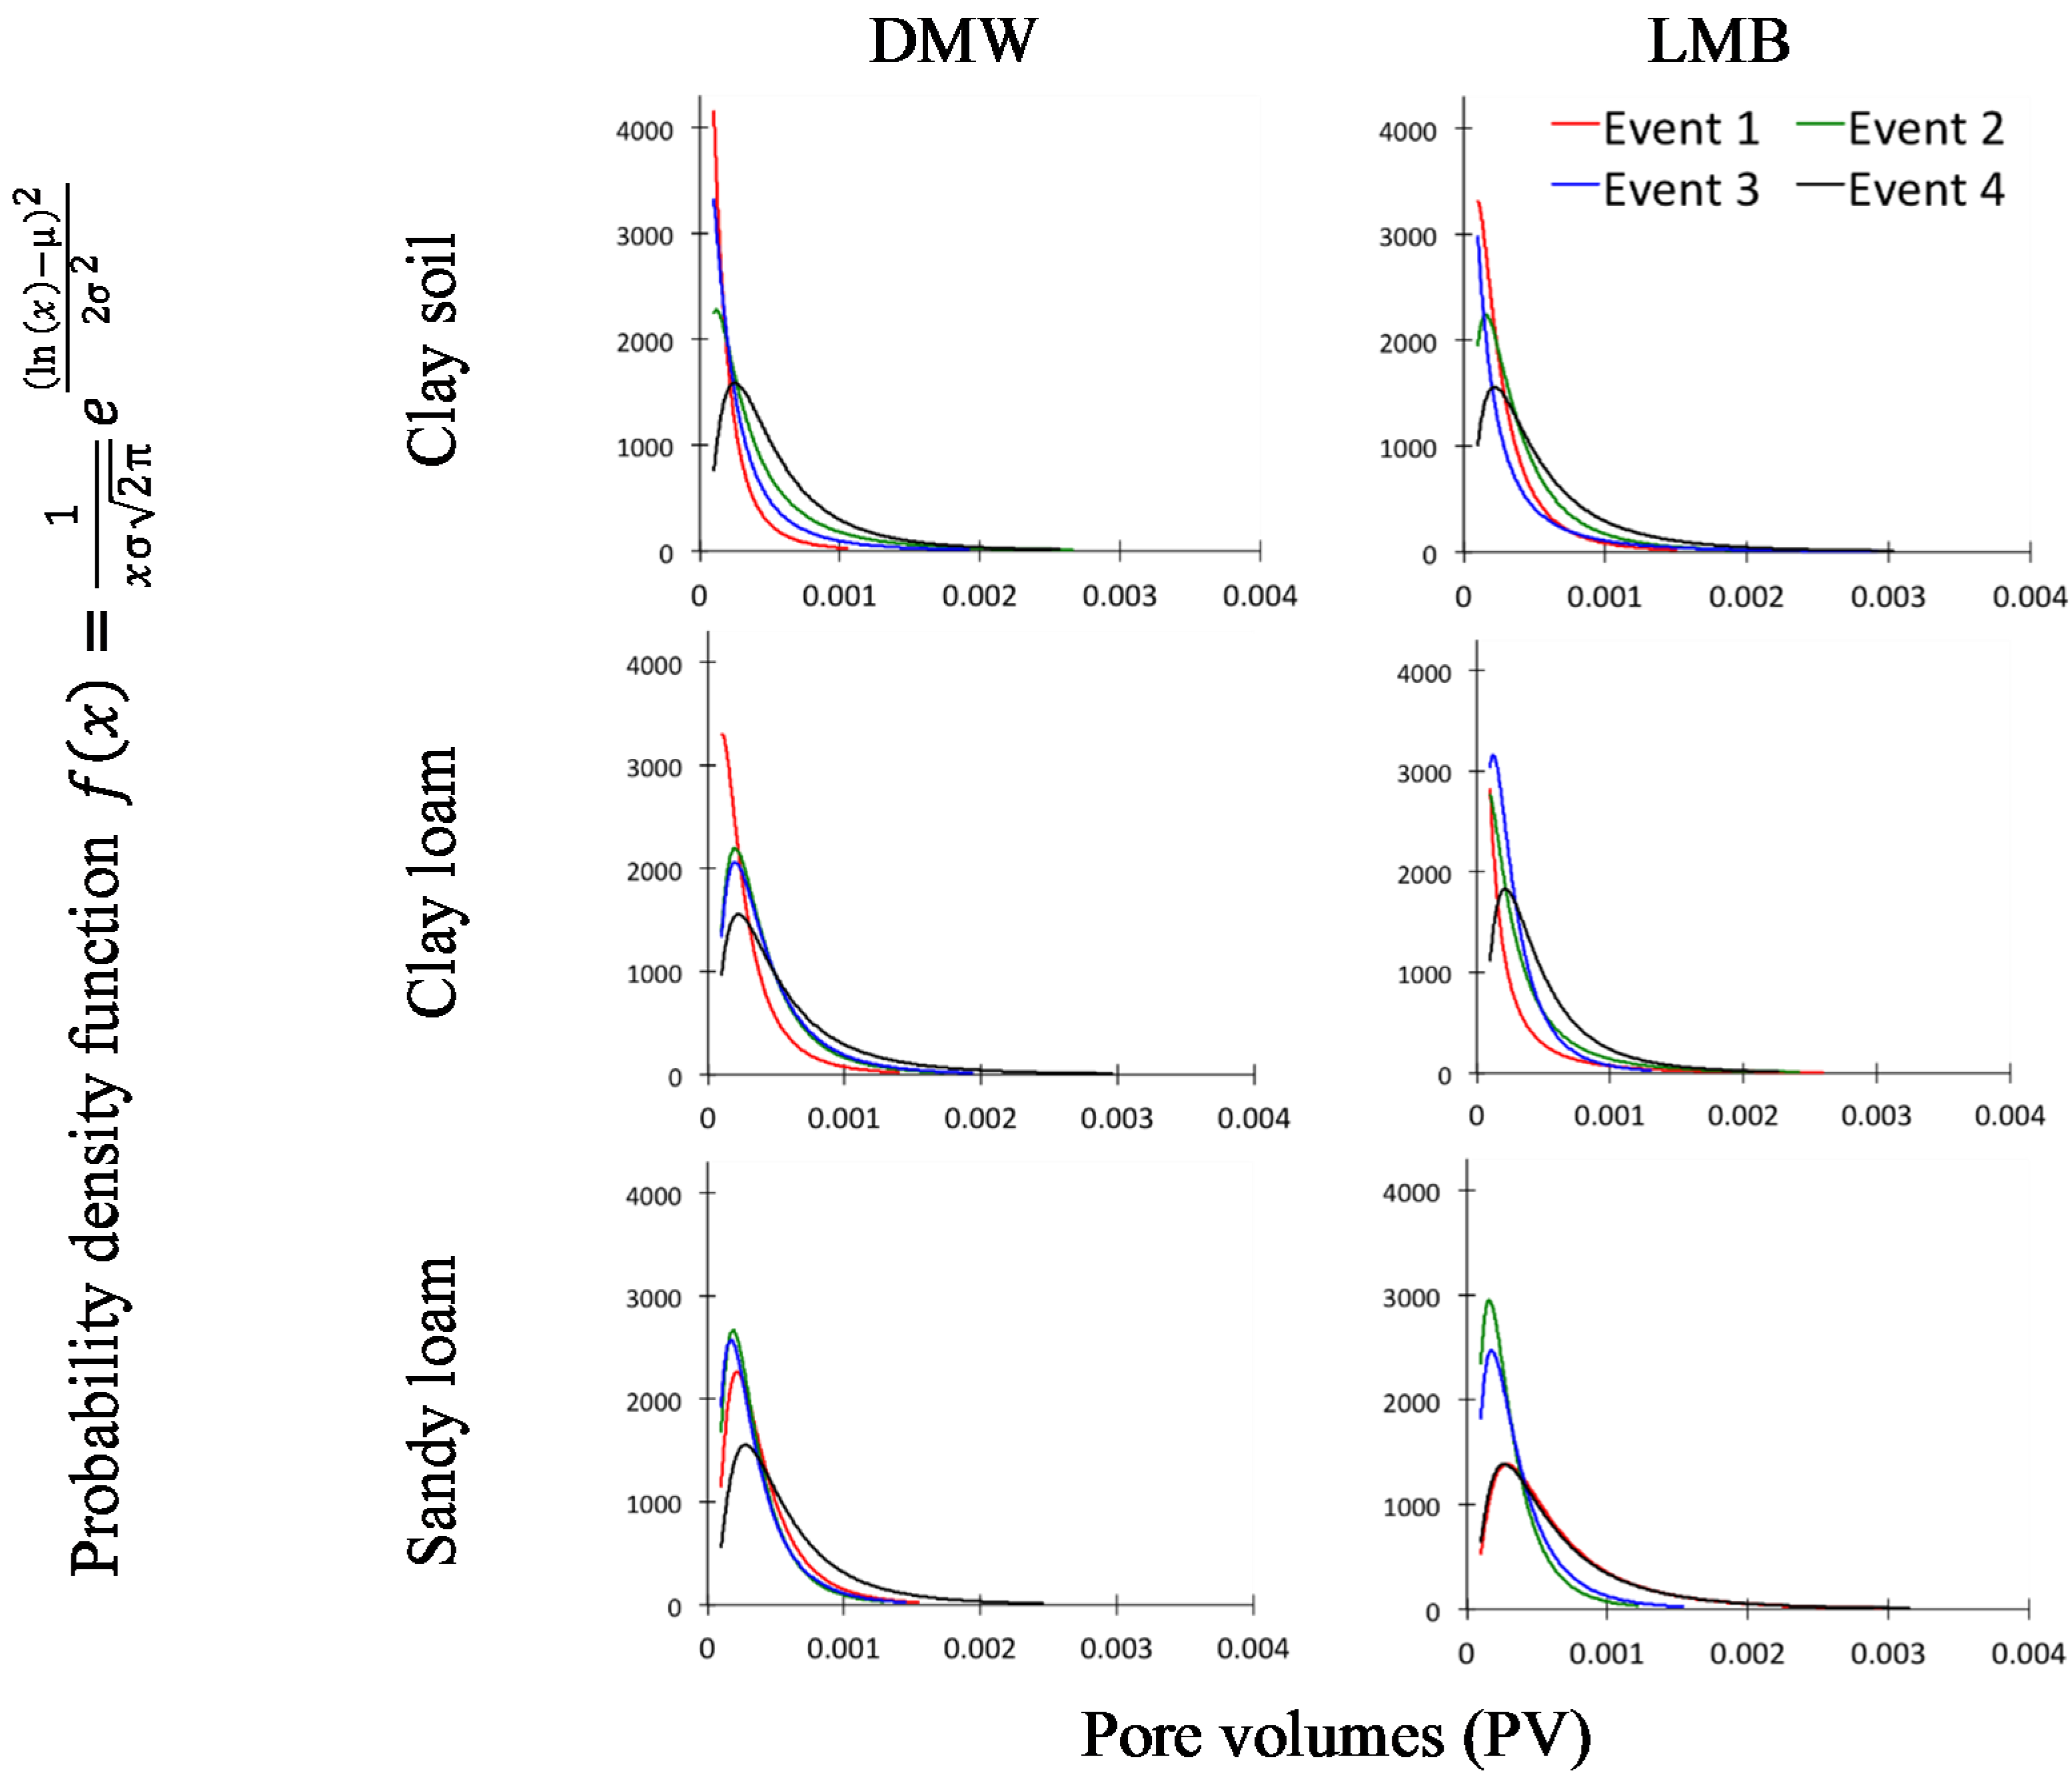
Drainage flow volumes, across the collection areas, were log-normally distributed in all soil and waste treatment combinations (
Figure 4), consistent with a skewed distribution of flow pathways. As was expected, the distributions were slightly more uniform for Event 4, which had an increased irrigation volume. Whereas average drainage volumes increased with each event in clay soil, for both sandy loam soils, average drainage volumes decreased following application of DMW as more areas became active.
Taking a mass conservation approach, if constant attachment and detachment rates are assumed, the cumulative filtration coefficients calculated against the initial
c0 should decline with each irrigation event,
i.e., as more bacteria are transported (Figure S1). The analysis of λ
f distribution is consistent with this mechanism for the transport of
E. coli from DMW, most clearly in the clay loam (
Figure 5). For the clay and sandy loam soils, λ
f was relatively constant from Events 1 through 3, suggesting minor supplementary transport during Events 2 and 3. However the larger event, 4, induced fresh re-mobilization of
E. coli reducing thus the cumulative λ
f, as expected. On the other hand, for LMB the cumulative λ
f density distributions showed a shift to greater cumulative filtration. If the same collectors had intercepted drainage water, and thus likely entrained bacteria or microspheres, then such a value would not be reasonable. However these density distributions include only the collectors active for the specific event. Thus if a somewhat different set of collectors were active in subsequent events, their cumulative λ
f would tend to be independent of the previous events. Such a discontinuity in collectors active for less than the total of four events, as described in
Figure 1, was more common for the treatments receiving LMB. Consequently λ
f means of density distributions decreased during events following the 1st event.
Figure 4.
Distribution of drainage water flow volumes. Log-normal distributions (μ, σ), maximum-likelihood best fit [
29].
Figure 4.
Distribution of drainage water flow volumes. Log-normal distributions (μ, σ), maximum-likelihood best fit [
29].
Only a small proportion of the total number of collectors was active across all four events (1% to 3% for clay or clay loam, 17% to 18% for sand). In the finer textured soils LMB enhanced the count of single event active areas (
Figure 1). For clay and clay loam flow path stability, as described by the proportion of areas active for >2 events, was enhanced under DMW, whereas LMB had a negative effect. Significantly, a proportion of collectors was active only during the forth event but still produced previously retained contaminant tracers.
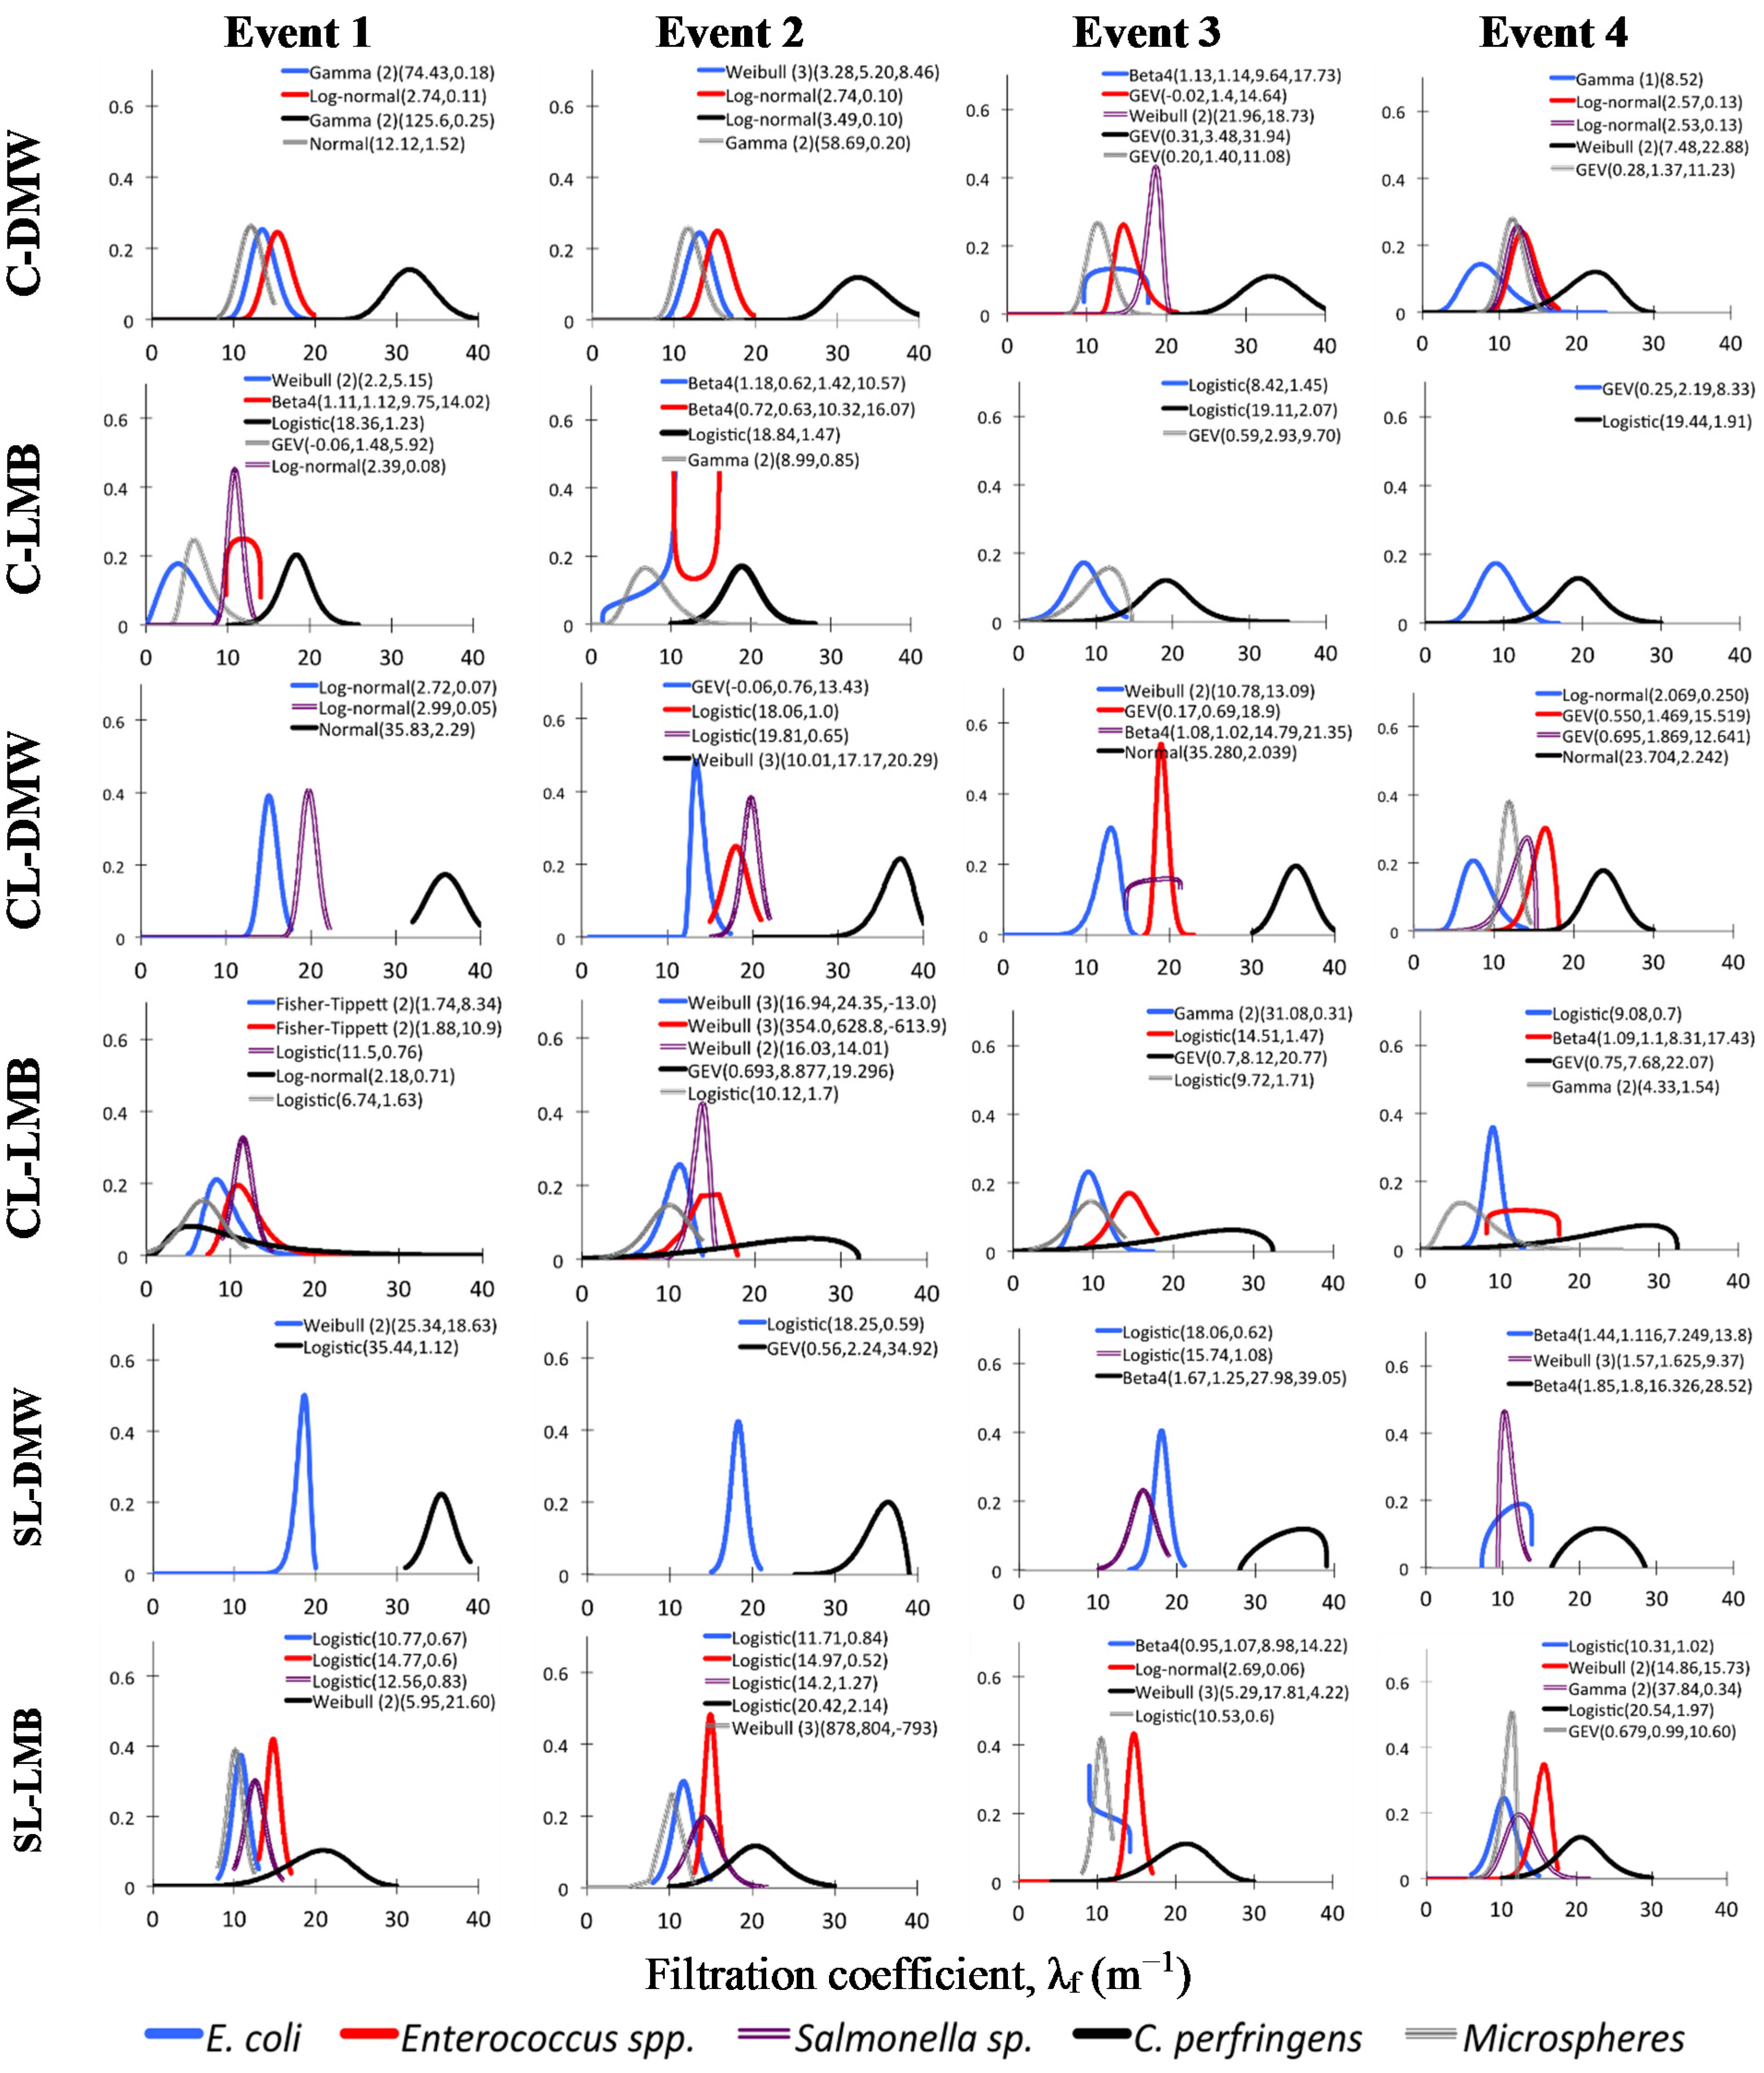
Best-fit PDFs obtained for the cumulative λ
f distribution were employed to describe skewed datasets (
Figure 5). PDF parameters are listed in the Supplementary materials.
Kolmogorov-Smirnov similarity analyses compared the PDFs for microsphere to the PDFs of the bacterial indicators cumulative λ
f (see Table S4). Results have shown that, in general, microsphere PDFs could not statistically predict the distributions of bacterial indicators. A forced fit has however shown that λ
f distributions could be described with reasonable accuracy by a lognormal PDF. The average likelihood for this to be true is summarised in
Table 4.
Figure 5.
Best-fit density distributions for cumulative filtration coefficients. Only collection areas active at an event are included; i.e., previously active clogged areas not included. C–clay soil; CL–clay loam soil; SL–sandy loam soil; DW–dewatered municipal biosolids organic amendment; LB–liquid municipal biosolids organic amendment. PDF model fitting parameters in parentheses; PDF equations and parameters for each PDF are described in Table S5, Supplementary materials.
Table 4.
The risk to reject the hypothesis that the distribution of tracer concentration across collectors follows a lognormal PDF while it is true. All tracers are summarized for each event of each treatment (mean and standard deviation).
Table 4.
The risk to reject the hypothesis that the distribution of tracer concentration across collectors follows a lognormal PDF while it is true. All tracers are summarized for each event of each treatment (mean and standard deviation).
| Treatment | Event |
|---|
| 1 | 2 | 3 | 4 | All |
|---|
| C-DMW | 98% (2.6%) | 92% (8.2%) | 68% (27.9%) | 77% (21.6%) | 82% (21.3%) |
| C-LMB | 76% (30.0%) | 65% (40.5%) | 32% (31.0%) | 90% (2.6%) | 65% (34.7%) |
| CL-DMW | 98% * | 33% (10.5%) | 71% * | 50% (42.0%) | 58% (33.6%) |
| CL-LMB | 64% (23.6%) | 32% (25.0%) | 42% (37.8%) | 47% (46.0%) | 46% (31.6%) |
| SL-DMW | 82% (22.5%) | 74% (17.4%) | 70% (25.6%) | 75% (10.7%) | 78% (12.9%) |
| SL-LMB | 70% (17.2%) | 72% (22.6%) | 78% (31.9%) | 54% (35.9%) | 73% (26.8%) |
4. Discussion and Conclusions
Liquid biosolids applied to clay or clay loam soils led to a smaller proportion of continuously active collectors than did the application of dewatered biosolids. Moreover the latter treatment had the largest proportion of collectors that became inactive after the first event. The same soils receiving dewatered biosolids had fewer single event active areas and fewer inactivated areas (Figure S2). This data is in agreement with previous indications [
14] that addition of solid, dewatered biosolids, to finer textured soils, will lead to a larger effective hydraulic conductivity than when the same soils receive liquid waste. Both this and the current results likely suggest a dispersive clogging of pores in clay and clay loams receiving liquid organic wastes.
Previous observations have shown that filtration efficiency decreases with distance [
15,
17]. Nevertheless, for the sandy soils, which were less heterogeneous, this phenomenon was less obvious and for the application of LMB the fit was mostly linear, indicating continual decrease in cumulative filtration for collectors that allowed increased flow and suggesting a more constant filtration and thus advection of bacteria at consistent rates independent of the total flow. This is consistent with a continuous and uniform transport independent of local water flow volumes. In combination, the results suggest that in the well-structured, finer textured clay and clay loam soils, non-interactive flow took place above certain flow rates and responded to preferential flow parameters.
Presence of organic material in the suspension might nullify the role of the electrostatic interactions between charged particulates and charged surfaces within the soil pore system. If this were the case then transport would be mainly a function of particle size relative to the pores [
17]. Effective size of bacteria tends to vary with their physiological status [
31]. The microspheres used in this experiment had a diameter of 3.7 μm. Differences in concentrations between microspheres and bacteria likely suggest that both true filtration and die-off play a role. The power law fits for all events and tracers are rather similar in shape, indicating similar remobilization and filtration behaviour. Event 4 produced smaller concentration of microspheres. There were differences between the behaviour of microsphere indicators and
E. coli,
Enterococcus spp. or
Salmonella spp. For the clay and clay loam receiving LMB, only microspheres and
C. perfringens were noticeably remobilized at Event 4, albeit at smaller concentrations (
i.e., large λ
f). It is known that
C. perfringens survives in the environment as resilient spores [
32] that generally require a host for germination. This adds support to the hypothesis that the other three bacterial tracers added in a vegetative form died-off. No such indications of die-off were noted for the soils receiving DMW or either waste type in the sandy loam. Thus any differential transport among the tested tracers would be expected to be a function of their differential attachment, detachment and survival parameters. Following LMB application, the λ
f means for the density distribution decreased during events following the 1st event. This clearly indicates that LMB did not favour continuity in transport pathways [
14] and that newly opened pathways allowed re-mobilization of fewer bacteria. Both enhanced retention and die-off might be invoked to explain this. Microsphere transport from DMW generally followed a similar pattern suggesting a dominant role for physical retention. Where LMB was applied increased discontinuity in flow paths (
Figure 1) was reflected in increased average λ
f at subsequent events (
Figure 5).
In a few occasions no distribution would fit the empirical λ
f distribution and a Beta 4 distribution, a highly flexible distribution [
30], had to be employed. Given that lognormal and most other PDF fitted here are commonly used to describe skewed datasets it would be reasonable to assume that lognormal PDFs might fit these distributions to a certain extent even if they would not best describe them. Moreover if tracer transport were mostly governed by flow (log-normal PDFs best-fits,
Figure 4) then both would follow a similar lognormal distribution. Thus lognormal PDFs were fitted to the cumulative λ
f data for each tracer and treatment to verify the statistical likelihood of fit. This has shown that most datasets could statistically be described by a lognormal distribution to a certain extent (
Table 4). However for LMB the fit deviated most from a lognormal PDF in all three soils. Poorest fits to a lognormal PDF were observed in the finer textured clay and clay loam soils. These were usually due to distributions that best followed a logistic or a GEV (generalized extreme values) PDF (
Figure 5), that are incompatible with a lognormal profile.
Our results show that finer textured, well-structured soils tend to better retain their pathway structure after solid waste application. It might be expected that re-mobilization of bacteria within these stable pathways ought to be modelled by considering hydrodynamics and variable electrostatic conditions. Application of liquid waste led to pathway instability and thus a variable role for straining effectively enhancing a soil’s effective capacity to retain tracers. It is evident that waste type affects both transport parameters [
14] and survival [
33], differentially across soil types. As such, straining and empirically fitted filtration equations based transport modelling might be more amenable for liquid waste soil amendments.
While under continuous flow, e.g., in the stable pores, retention occurs under energetically favourable conditions but slow flow may allow attachment even under electrostatically unfavourable conditions [
15,
34]. Such enhanced attachment under energetically unfavourable conditions is expected, therefore, to include the enhanced retention for slow transport in discontinuous pore systems. Tracer retention capacity varied across the tested indicators.
It is important to note that these results were obtained in a mixed tracer system and that single tracer tests, especially in the absence of organic matter flocs, might have produced different tracer retention capacity profiles. On the other hand these observations might question the validity of single transport indicator models for transport through unsaturated soils.
Given the relatively low density of microbial cells they are considered sufficiently buoyant such that sedimentation might be ignored [
35]. However data has shown that sedimentation does occur [
36,
37] and, albeit minor, can be introduced in mathematical models for bacterial transport [
8]. Nevertheless, most these reports tend to discuss sedimentation for hydrodynamically active flow systems and they focus on single particle modelling.
Diversion of particles into static regions of flow, likely in tortuous flow paths, will probably lead to deposition of these particles on soil surfaces [
38]; This is also referred to as sedimentation.
We believe that sedimentation in the context of particulate transport through soil ought to be defined as two distinct but concurrent mechanisms. The one of more consequence is likely to reflect deposition of particles in regions of low hydrodynamic forces common around particles and in tortuous pathways. Sedimentation modelled by Stokes’ law may be then of interest in static systems such as clogged pores. Moreover we ought to discriminate between the modelling of single particle sedimentation and deposition and bacterial-mineral flocs of variable sizes and greater average bulk density, likely after application of wastes rich in organic colloids, of variable surface charges, and charged, dissolved, carbon compounds. As flow path alternate between saturated and unsaturated conditions the thickness of the water film at particle surface varies. During drying, particles are forced into low velocity regions enhancing deposition and possibly attachment under energetically unfavourable conditions. Subsequent precipitation events will increase the thickness of water films re-entraining deposited particles leading to secondary transport peaks. Particles likely to be retained via deposition and sedimentation are the ones more likely to be resuspended during subsequent wet events. This may explain the delayed peaks for microspheres. The assumption was strengthened by the similar behaviour of the resilient, mainly hydrophobic [
39],
C. perfringens spores.
In contrast, vegetative cells, e.g.,
E. coli,
Salmonella spp., and
Enterococcus spp., will be more likely to excrete extracellular polymeric substances (EPS) that surround cells as capsules under stress. As they come and remain in contact with surfaces in soil, either via electrostatic adsorption or physical deposition and sedimentation, they can associate and form biofilms or participate in biofilms of other environmental bacteria [
16,
40]. Biofilm retained bacteria will be less likely to be re-entrained by subsequent flow events. Therefore the decline in the transfer of these bacteria at the late events, most obvious for the clay and clay loam receiving LMB, might thus be due to both die off and biofilm retention.
Thus under real, rain-driven, infiltration, the transport of bacteria through soils will depend on the stability of transport pathways that are governed by soil properties and the properties of the surface-applied organic waste. Long-term transport of stable particles such as non-vegetative bacterial spores will be likely governed by the re-entrainment of sedimented and deposited spores as governed by soil water content and related pathway instability. It is clear that factors that restrict transport must ultimately be included in QMRA’s for estimating source to sink transport of bacteria in long-term scenarios. Both die-off and retention in soils, with biofilms likely playing a role, will be of importance for the decline in long-term transport rates of vegetative, active, bacterial cells.


