Abstract
The relationships between observed rainfall, El Niño/Southern Oscillation (ENSO) and sea surface temperature (SST) variations in the Pacific and Indian Oceans were analyzed using a 1° latitude–longitude grid over Indonesia. The Global Summary of the Day rainfall records provide 26 years of rainfall data (January 1985 to August 2010) for 23 stations throughout the Indonesian islands. The ENSO and SST variations were calculated using the Multivariate ENSO Index (MEI), the Pacific Decadal Oscillation (PDO), NINO1 + 2, NINO3, NINO3.4, NINO4, the Dipole Mode Index (DMI) for the Indian Ocean Dipole (IOD), and Indian Ocean Basin-wide (IOBW) index. The results show that the rainfall in the southern Sumatra and southern Java Islands, which face the Indian Ocean, was positively correlated with the negative IOD, whereas the rainfall in northwestern Sumatra was positively correlated with the positive IOD. In eastern Indonesia, the rainfall was positively correlated with La Niña. The PDO index was also strongly correlated with the rainfall in this region. In central Indonesia, seasonal variations due to monsoons are predominant, and the rainfall exhibited strong negative and positive correlations with the MEI and NINO.WEST, respectively, indicating that high rainfall occurred during strong La Niña episodes. The highly negative and positive correlations with the MEI and NINO.WEST, respectively, in central Indonesia led us to analyze the impacts of Indonesian seas on the rainfall in the region. Using four synoptic-scale scenarios, we investigated the relative residence time of Indonesian seawater along the pathways associated with the Pacific-Indian hydraulic head difference. The results show that when both the western Pacific and eastern Indian Oceans are warm (positive NINO.WEST and negative DMI), the rainfall intensity over central Indonesia is strongest. This increase is explained by the relationship between the residence time of Indonesian seawater and the exposure to surface evaporation: a longer exposure of Indonesian seas results in greater seawater warming and evaporation and more convection-generated cumulus clouds.
1. Introduction
Water scarcity is a problem that many societies worldwide will face in the 21st century. In addition to the water shortage itself, water scarcity also refers to the imbalances between availability and demand, the degradation of groundwater and surface water quality, inter-sectoral competition and interregional and international conflicts. Therefore, water resource management becomes critical for coping with water scarcity issues. However, reliable long-term meteorological and hydrological observations are commonly unavailable for managing water resources in developing and developed countries.
In recent years, numerous studies have investigated the impacts of oceans on regional climates in terms of correlations between sea surface temperature (SST) and surface weather, e.g., El Niño/Southern Oscillation (ENSO), precipitation and temperature, to understand and possibly predict the regional climate system.
The climate of the maritime/continental Indonesian Archipelago is generally shaped by ENSO. Rainfall is normally favored over the western Pacific warm pool, whereas the eastern and central equatorial Pacific and western Indian Ocean experience an overall drier climate, depending on the geophysical configuration of the Indo-Pacific coupled ocean-atmosphere system [1,2,3]. This region experiences higher (lower) rainfall during La Niña (El Niño) events [4], and many researchers have used the Southern Oscillation Index (SOI) to discuss the relationship between rainfall and ENSO in the past [5,6,7,8]. The rainfall characteristics over Indonesia are known to have seasonal and interannual variability primarily related to the monsoon [9,10,11] and ENSO [12,13,14,15,16,17,18,19]. The wet season (December–February) coincides with the Southern Hemisphere summer monsoon [20,21] and the presence of the Inter-Tropical Convergence Zone (ITCZ) [22]. The dry season (May–September) occurs when dry southeasterly wind blows in from Australia. April and October are transition months between the wet and dry phases, as identified by Ramage [9] and Cheang [23]. The Madden–Julian Oscillation (MJO) [24] has also been shown to be a dominant component in the intraseasonal (20- to 90-day) variability over the Tropics and Indonesia [25].
Because maritime Indonesia is a large and complex area consisting of approximately 17,000 islands with high mountains (Figure 1a), several important atmospheric and oceanic processes imposed by SST variability may influence various parts of the region [26,27]. Based on the rainfall patterns and characteristics, Aldrian and Susanto [26] and Chang et al. [27] suggested a climate zone classification for Indonesia.
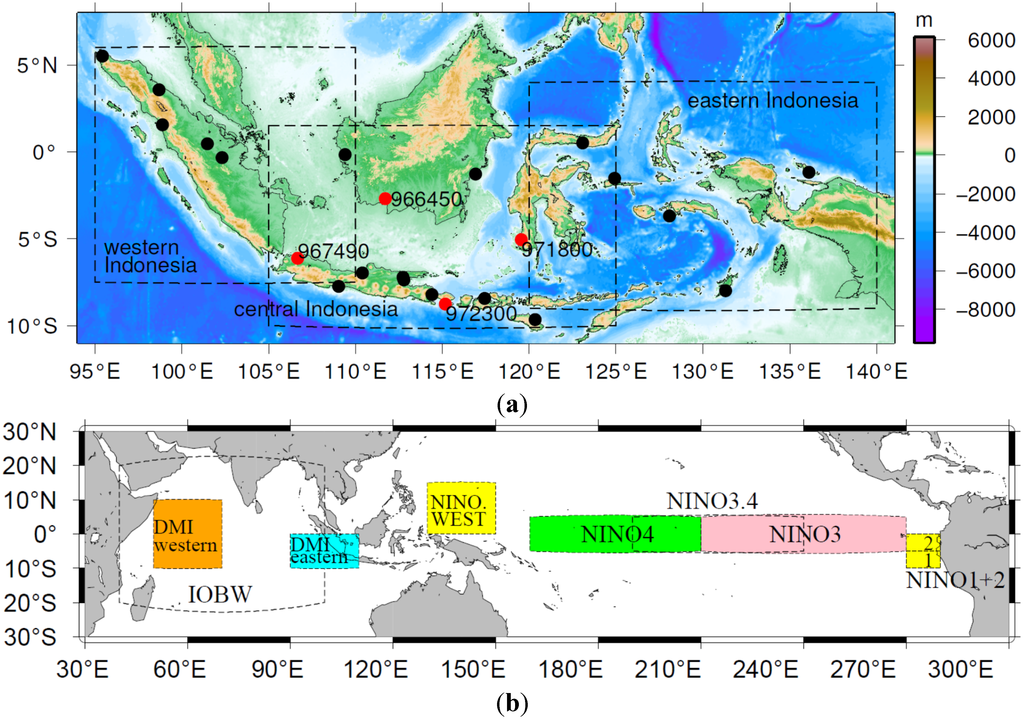
Figure 1.
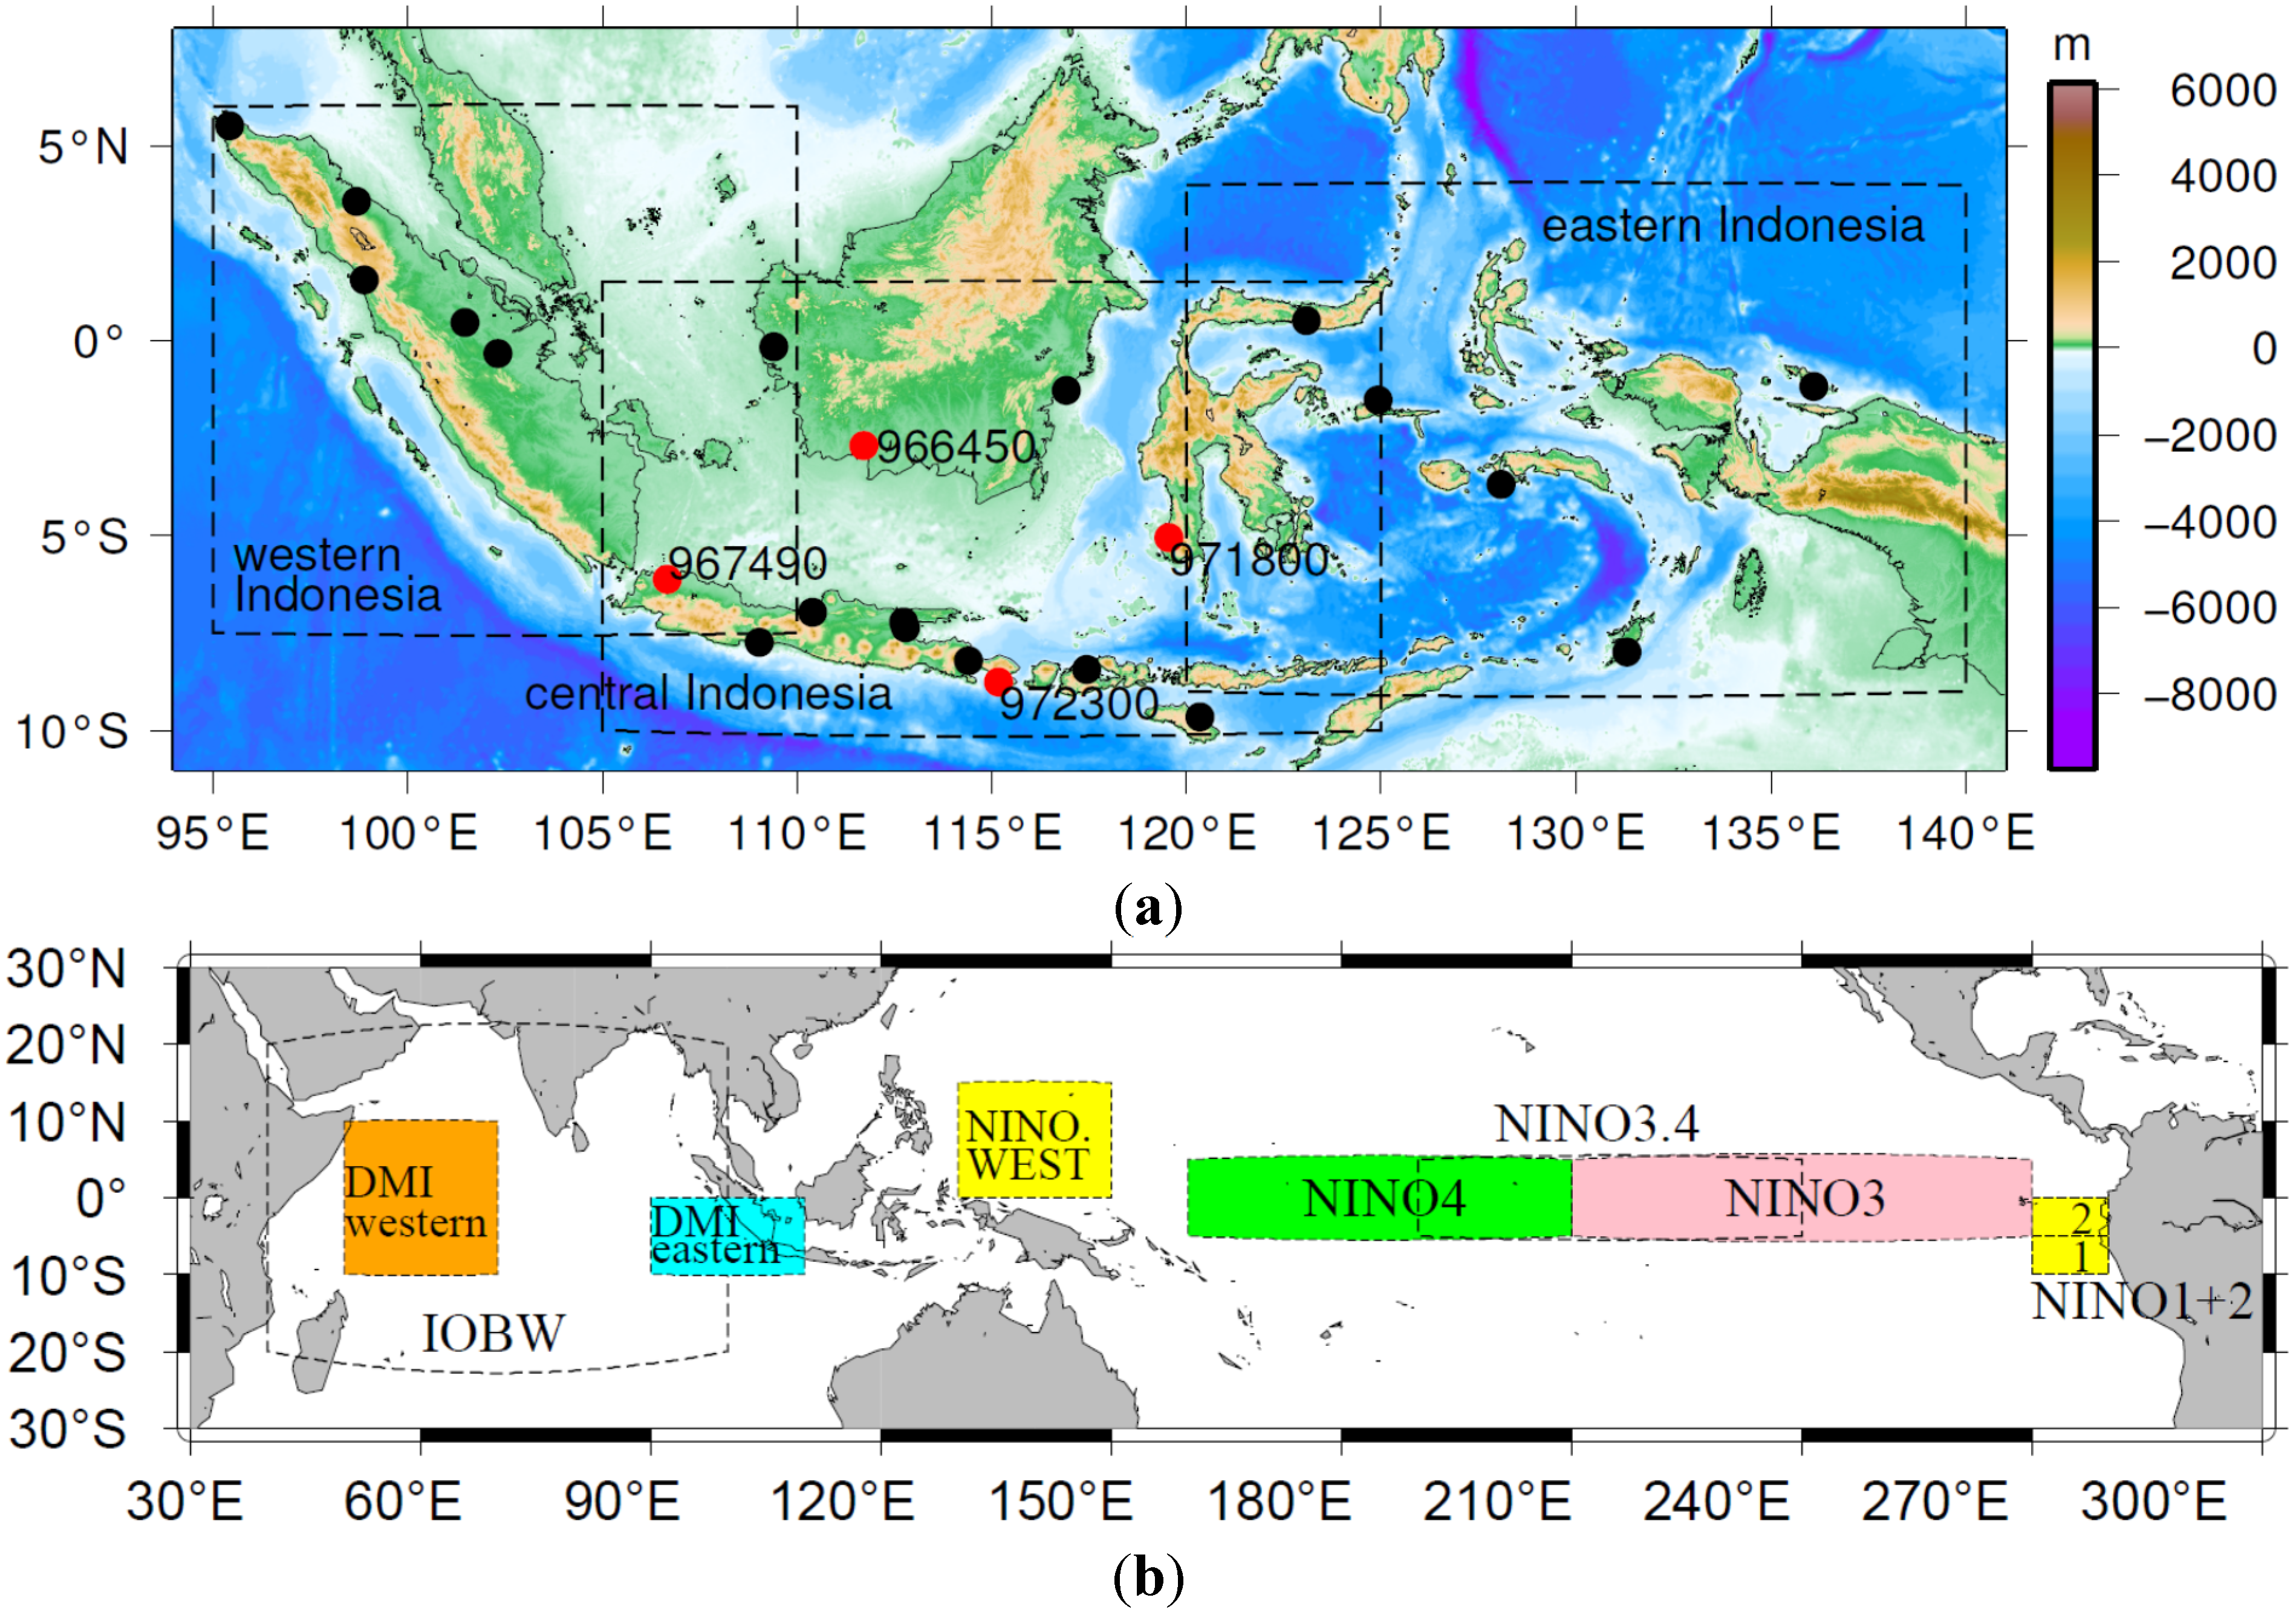
(a) Twenty-three weather stations (red and black circles) in Indonesia from the Global Summary of the Day (GSOD), National Climatic Data Center (NCDC), and National Oceanic and Atmospheric Administration (NOAA); three geographic regions were defined in the analysis. The stations in red are used in further analysis (see Table 2). (b) Specific SST monitoring regions for the indices of interest: the Multivariate ENSO Index (MEI), the Pacific Decadal Oscillation (PDO), NINO1 + 2, NINO3, NINO3.4, NINO4, NINO.WEST, the Dipole Mode Index (DMI) for the Indian Ocean Dipole and the Indian Ocean Basin-wide (IOBW) index. 1 and 2 in yellow indicates the monitoring regions for NINO1 and NINO2.
Figure 1.
(a) Twenty-three weather stations (red and black circles) in Indonesia from the Global Summary of the Day (GSOD), National Climatic Data Center (NCDC), and National Oceanic and Atmospheric Administration (NOAA); three geographic regions were defined in the analysis. The stations in red are used in further analysis (see Table 2). (b) Specific SST monitoring regions for the indices of interest: the Multivariate ENSO Index (MEI), the Pacific Decadal Oscillation (PDO), NINO1 + 2, NINO3, NINO3.4, NINO4, NINO.WEST, the Dipole Mode Index (DMI) for the Indian Ocean Dipole and the Indian Ocean Basin-wide (IOBW) index. 1 and 2 in yellow indicates the monitoring regions for NINO1 and NINO2.
In this study, we evaluated the relationships between ENSO and SST-related climate indices of the Pacific and Indian Oceans and rainfall records from the Global Summary of the Day (GSOD) over Indonesia using time series analysis and spatial correlation. Furthermore, we investigate the relationship between Indonesian seas, including the Indonesian throughflow (ITF) and the merging Pacific and Indian flow, and the rainfall intensity along the pathways to improve our understanding of the regional climate and improve climate predictions based on simple synoptic scenarios and statistics. We discuss the data and methodology in Section 2, followed by the results and discussions in Section 3, Section 4 and Section 5. In the final section, we provide a summary of the research.
2. Data and Methodology
2.1. Global Summary of the Day
The station data used for this study were the publicly available GSOD archive produced by the National Climatic Data Center (NCDC) of the National Oceanic and Atmospheric Administration (NOAA), United States. The dataset contains derived daily values (mean and extremes) of 18 surface meteorological variables, including precipitation, temperature, winds, and pressure, based on the data provided by stations that report 4 synoptic observations per day. This study used 23 stations over Indonesia for the period from January 1985 to August 2010, based on the amount of missing data from 173 stations. The precipitation data were converted from inches to millimeters. The data are available at [28].
The spatial distributions and synoptic features of 5 years of accumulated rainfall were investigated for each of the 173 stations across Indonesia. Because many of the data are missing for the study period (January 1985 to August 2010), 23 stations were selected for further investigation based on the available number of data samples for each station. The stations were selected as follows: 5 stations on Sumatra, 6 stations on Java Island, 3 stations on Sulawesi, and 3 stations on eastern Java Island; each station features fewer than 2000 missing data samples. The other 6 stations comprised 3 stations on Kalimantan Island and 3 stations in the Maluku and Papua regions, with fewer data samples. Table 1 and Figure 1a describe the locations of the 23 stations.

Table 1.
List of the 23 surface weather stations in Indonesia obtained from the GSOD, NCDC, and NOAA. See Figure 1a for the locations.
| ID | Station Name | No. of Missing Data | Location (Lat/Lon) | Location (Region) |
|---|---|---|---|---|
| 960110 | BANDA ACEH BLANG BI | 1803 | 5.517° N, 95.417° E | Sumatra Island |
| 960350 | MEDAN POLONIA | 1401 | 3.567° N, 98.683° E | Sumatra Island |
| 960730 | SIBOLGA PINANGSORI | 1888 | 1.55° N, 98.883° E | Sumatra Island |
| 961090 | PEKAN BARU SIMPANGT | 1783 | 0.467° N, 101.45° E | Sumatra Island |
| 961710 | RENGAT_JAPURA | 1778 | 0.333° S, 102.317° E | Sumatra Island |
| 967490 | JAKARTA SOEKARNO-HA | 1885 | 6.117° S, 106.65° E | Java Island |
| 968050 | CILACAP | 1946 | 7.733° S, 109.017° E | Java Island |
| 968390 | SEMARANG AHMAD YANI | 1900 | 6.983° S, 110.383° E | Java Island |
| 969330 | SURABAYA_PERAK_I | 1957 | 7.217° S, 112.717° E | Java Island |
| 969350 | SURABAYA JUANDA | 1338 | 7.367° S, 112.767° E | Java Island |
| 969870 | BANYUWANGI | 1625 | 8.217° S, 114.383° E | Java Island |
| 970140 | MENADO SAM RATULAN | 1944 | 1.533° S, 124.917° E | Sulawesi |
| 970480 | GORONTALO_JALALUDDI | 1791 | Sulawesi | |
| 971800 | UJUNG PANDANG HASAN | 1556 | 5.067° S, 119.55° E | Sulawesi |
| 972300 | DENPASAR NGURAH RAI | 1287 | 115.167° E | Lesser Sunda Islands |
| 972600 | SUMBAWA BESAR BRANG | 1912 | 8.433° S, 117.417° E | Lesser Sunda Islands |
| 973400 | WAINGAPU_MAU_HAU | 1958 | 9.667° S, 120.333° E | Lesser Sunda Islands |
| 965810 | PONTIANAK SUPADIO | 2092 | 0.15° S, 109.4° E | Kalimantan |
| 966330 | BALIKPAPAN SEPINGGA | 2172 | 1.267° S, 116.9° E | Kalimantan |
| 966450 | PANGKALAN BUN ISKAN | 2685 | 2.7° S, 111.7° E | Kalimantan |
| 975600 | BIAK_FRANS_KAISIEPO | 3035 | 1.183° S, 136.117° E | Papua Region |
| 977240 | AMBON PATTIMURA | 3016 | 3.7° S, 128.083° E | Maluku Islands |
| 979000 | SAUMLAKI OLILIT | 2549 | 7.983° S, 131.3° E | Maluku Islands |
2.2. NINO Indices
In this study, the monthly SST values for specific regions of the equatorial Pacific Ocean from the NOAA National Weather Service (NWS) Climate Prediction Center (CPC) were used as the regional climate indices. These values are the SST-based ENSO indicators. The specific monitoring regions for each index are 0°–10° S and 90°–80° W for NINO1 + 2, 5° N–5° S and 150°–90° W for NINO3, 5° N–5° S and 170°–120° W for NINO3.4, and 5° N–5° S and 160° E–150° W for NINO4 (Figure 1b). These values are available at [29].
2.3. Multivariate ENSO Index
ENSO is the periodic change in the atmosphere and ocean in the tropical Pacific region and is associated with extreme SST departures in the central and east-central Equatorial Pacific; furthermore, extremes in the convective rainfall, surface air pressure, and atmospheric circulation in the tropics are opposite between Indonesia and South America. El Niño and La Niña are the warm and cold phases, respectively, of the oscillation. The climate index used for ENSO is the Multivariate ENSO Index (MEI).
The MEI used in this study consisted of bimonthly values (December/January, January/February, November/December), starting with December 1949/January 1950 and continuing through August 2010 [30,31], with a total of 728 data samples. The MEI was based on the six main observed variables over the tropical Pacific: sea-level pressure, zonal and meridional components of the surface wind, sea surface temperature, surface air temperature, and total cloud fraction. The MEI is available at [32].
2.4. Pacific Decadal Oscillation
The PDO is a long-lived El Niño-like pattern of climate variability in the Pacific Ocean. The PDO is detected as warm or cool surface water in the Pacific Ocean north of 20° N. During a “warm” or “positive” phase, the western Pacific cools, and part of the eastern ocean warms. During a “cool” or “negative” phase, the opposite pattern occurs. The climate index used for the PDO is called the PDO index.
The PDO index used in this study was composed of monthly values from the Joint Institute for the Study of the Atmosphere and Ocean (JISAO) PDO index by Mantua et al. [33]. Their data sources were the UK MetOffice (UKMO) Historical SST dataset for 1900–1981, Reynold’s Optimally Interpolated (OI) SST (V1) for January 1982 to December 2001, and the OI version 2 for January 2002–August 2010, with a total of 1328 data samples. The PDO index is available at [34].
2.5. NINO.WEST and Indian Ocean Basin-Wide
In addition to NINO1 + 2, NINO3, and NINO4, NINO.WEST (0°–15° N and 130°–150° E) and the IOBW (20° N–20° S and 40°–100° E) are defined by the Japan Meteorological Agency (JMA) to monitor the effect of the tropical ocean on the East Asian climate (Figure 1b).
NINO.WEST and IOBW show that the SSTs are warmer than approximately 27 °C throughout the year and influence tropical atmospheric convection, which affect the regional climate of Asia. NINO.WEST and IOBW are evaluated based on anomalies in the monthly SSTs from the last 30 years [35]. NINO.WEST and IOBW are available at [36].
2.6. Dipole Mode Index
The Indian Ocean Dipole (IOD) is a coupled ocean-atmosphere phenomenon in the Indian Ocean. The dipole is normally characterized by anomalous cooling of SSTs in the southeastern equatorial Indian Ocean and the anomalous warming of SSTs in the western equatorial Indian Ocean. Because of these changes, the convection normally situated over the warm pool of the eastern Indian Ocean shifts to the west, delivers heavy rainfall to eastern Africa, and causes severe droughts and forest fires in the Indonesian region [37].
The DMI is an index for evaluating the IOD based on the differences in the SSTs between the western (50°–70° E and 10°S–10° N) and eastern (90°–110° E and 10°–0° S) equatorial Indian Ocean (Figure 1b). Positive DMI values (IOD period) indicate that the eastern and western equatorial Indian Ocean becomes cooler and warmer, respectively, than the normal SST conditions; these conditions are associated with heavy rainfall in eastern Africa and severe drought in Indonesia and southern Australia. In negative IOD periods, the opposite trends occur, and the amount of rainfall in southern Australia increases [38].
The DMI used in this study was derived from the MetOffice Hadley Centre’s sea ice and SST dataset and is available at [39].
2.7. Method
The spatial distribution of the rainfall over Indonesia was calculated for a 1° × 1° grid spacing via the adjustable-tension continuous curvature surface gridding algorithm [40], which is expressed as follows:
where T is the tension factor, which varies between 0 and 1, and is used to suppress spurious oscillations in the interior solution and flatten the solution near boundaries. T = 0 results in a minimum curvature surface, such as the natural bicubic spline. In this study, T = 0.25 was used to avoid undesired oscillations and false local extrema. The parameter z represents the input data, which were the precipitation data and the correlation coefficient [41] in this study. L is the Laplacian operator and is expressed as:
where x and y are the coordinates of the input z.
For the study period from January 1985 to August 2010, the observed daily rainfall (units: mm/day) and mean daily rainfall for each month (units: mm/day) were used to estimate the monthly mean trend when data were missing. The 5-month running mean of the mean daily rainfall for each month was used to investigate the interannual variations in the rainfall for the 23 stations. The 5-month running means of the regional climate indices in Subsection 2.1 were also calculated. Additional data, such as the maximum daily rainfall, date of occurrence, and amount of missing data for every 5 years of the study period, were also determined for the 23 stations. The Pearson’s correlation coefficients between the 5-month running means of the mean daily rainfall for each month and the 5-month running means of the regional climate indices were calculated. Additionally, the spatial correlations between the 5-month running means of the mean daily rainfall for each month and the 5-month running means of the regional climate indices were calculated using the same gridding algorithm to investigate the spatial correlation between the rainfall distribution pattern and the regional climate indices.
2.8. Synoptic Scenarios
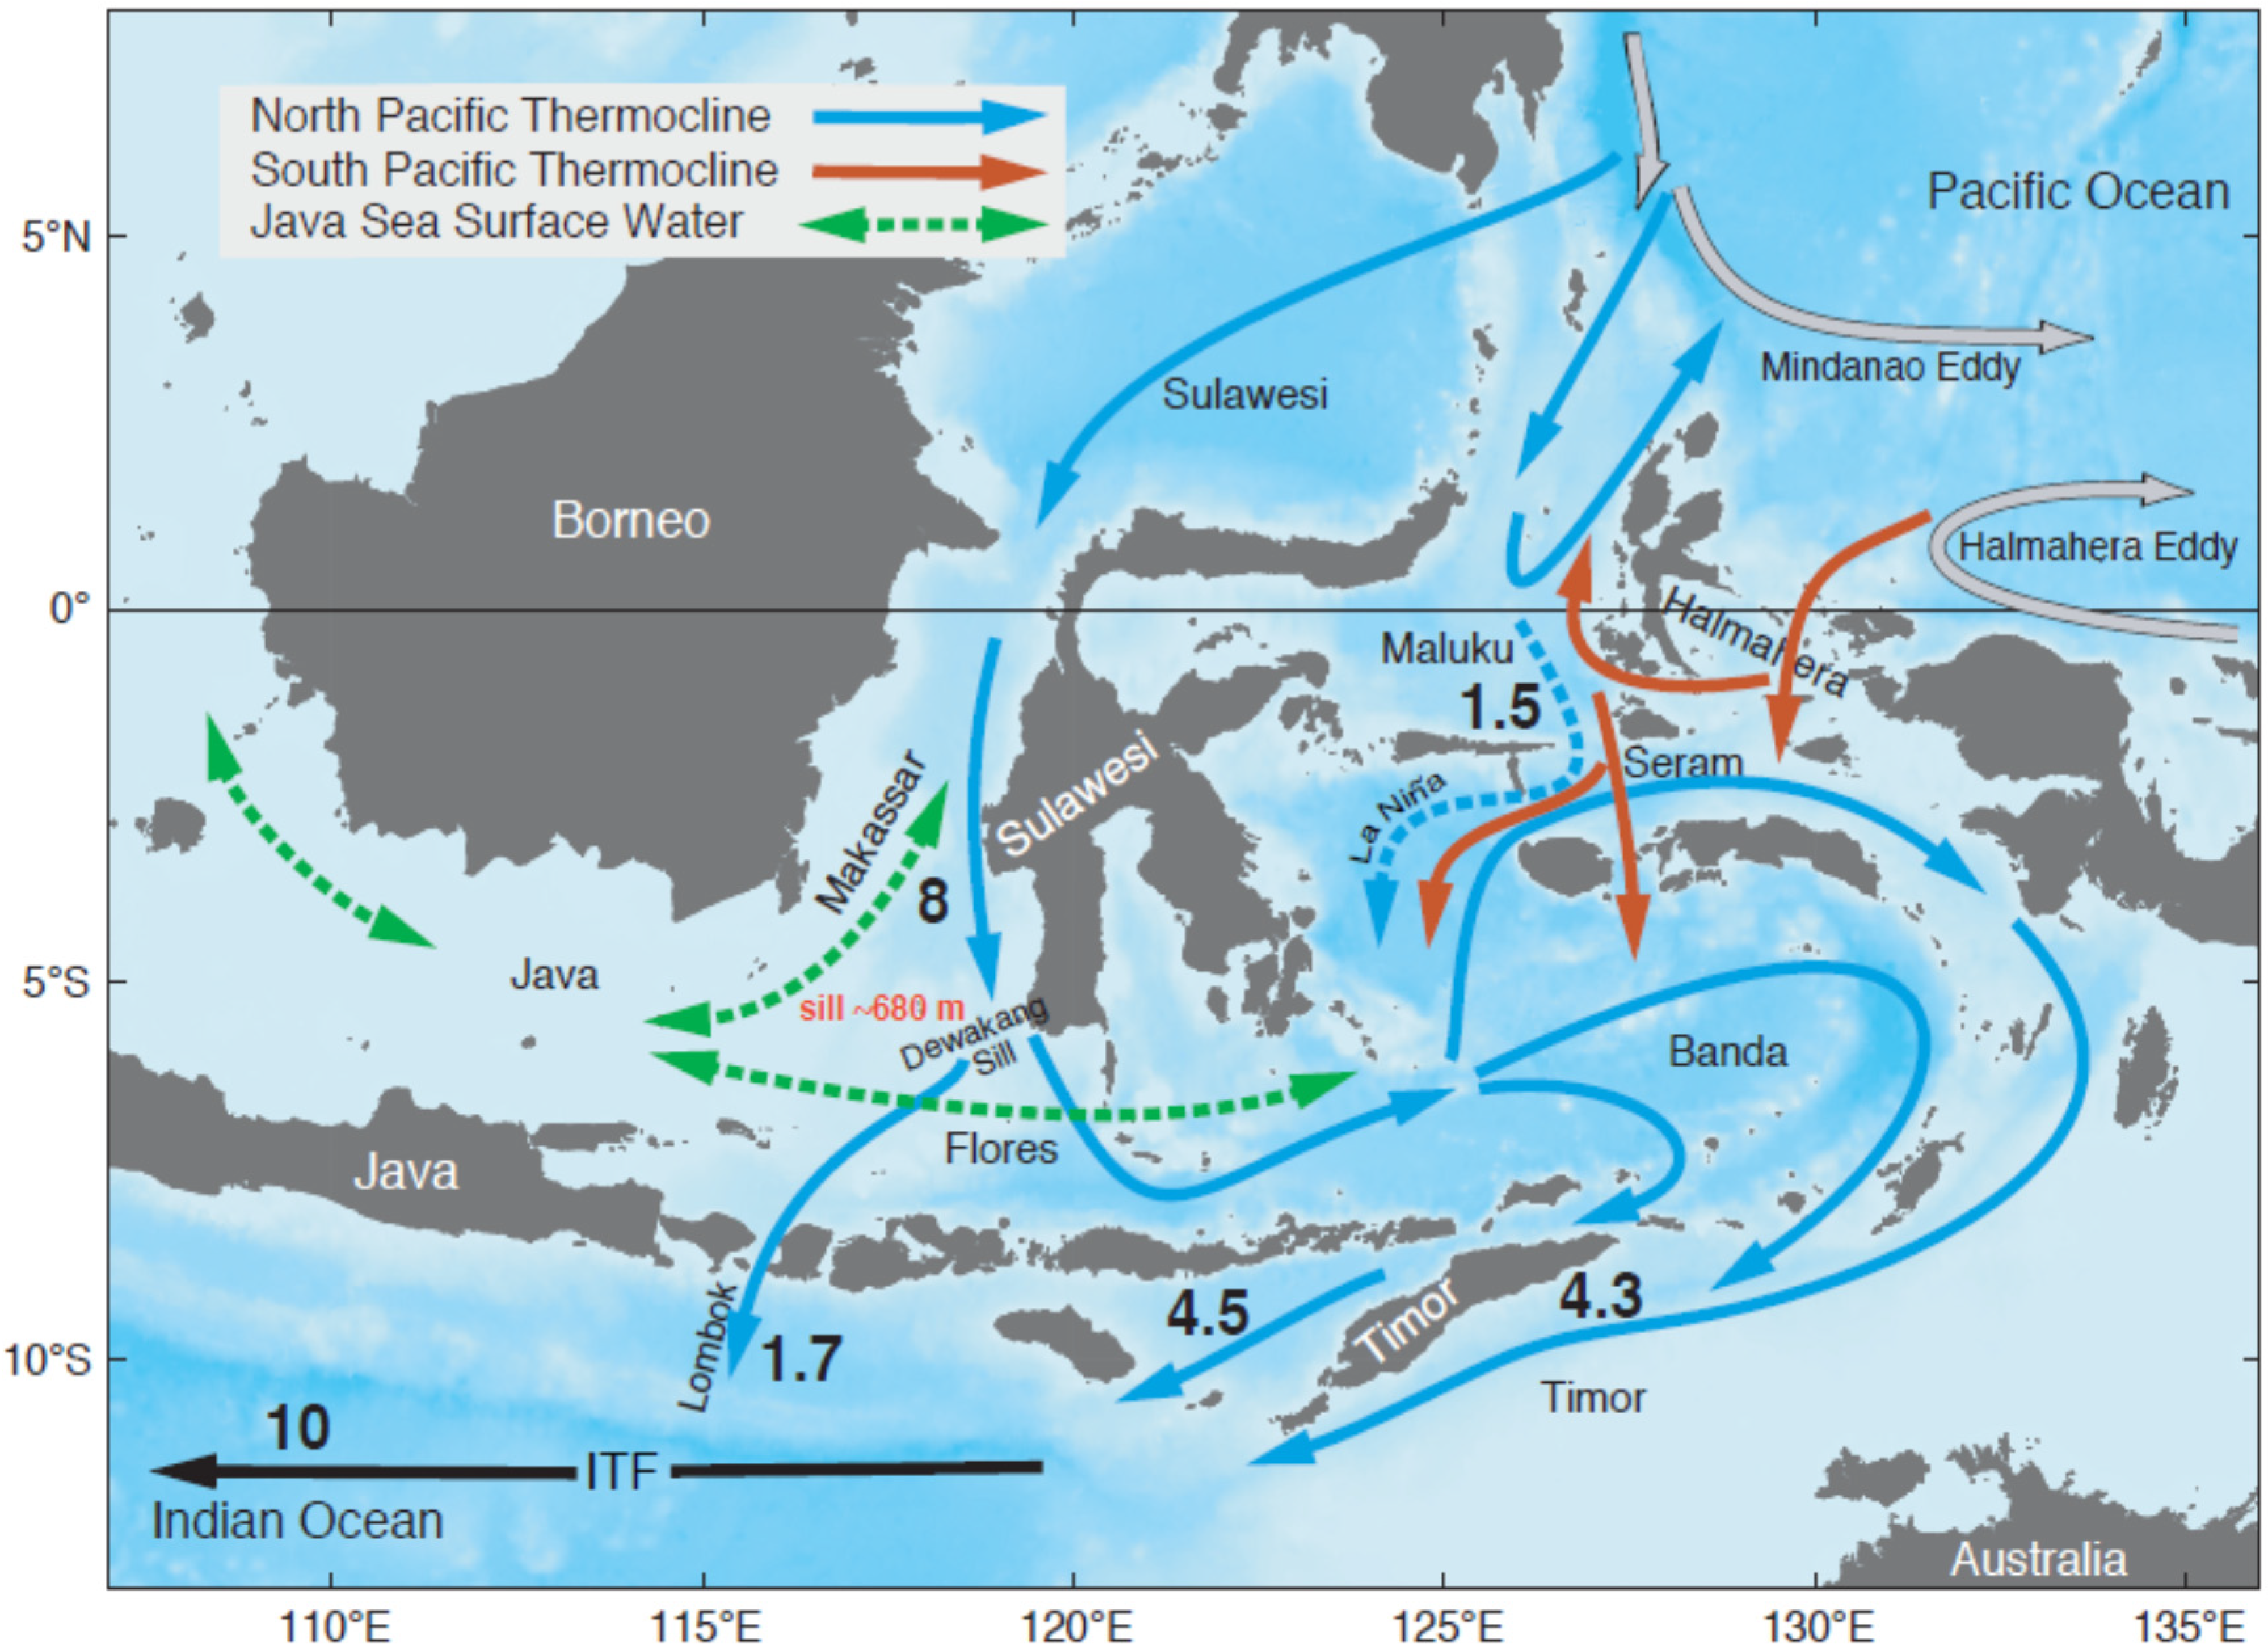
The ITF shown in Figure 2 plays an integral part in the global thermohaline circulation and climate phenomenon [42,43,44,45,46,47], and the heat and freshwater carried by the ITF affects the basin budgets of both the Pacific and Indian Oceans [48,49,50]. However, the impacts of the ITF on the regional-scale surface weather, such as rainfall, have not been thoroughly studied because most studies have focused on the global and basin-scale atmospheric and oceanic climates. Therefore, potential effects of the ITF on regional-scale rainfall events were studied using four synoptic cases with the assumption that the residence time of the ITF in Indonesian waters associated with sea level anomaly and hydraulic head difference between the Pacific and Indian Oceans is related to the surface evaporation exposure time. Longer residence times are associated with longer exposure times. Longer exposure times allow for more seawater evaporation, thereby increasing the likelihood of cumulus formation due to greater convection over warmer seas. Therefore, the ITF could possibly influence the rainfall intensity. First, we assumed four synoptic situations, as described below, according to the hydraulic head difference associated with SST between the Pacific Ocean and the Indian Ocean (Figure 3).

Figure 2.
Indonesian throughflow pathways and estimates of the total volume transported (Sv = 106 m3/sec). Modified from Figure 5 of Gordon [51].
Figure 2.
Indonesian throughflow pathways and estimates of the total volume transported (Sv = 106 m3/sec). Modified from Figure 5 of Gordon [51].
- (a)
- acific_warm-Indian_cool (PW-IC): The SST of the western Pacific Ocean is high (warm), and the SST of the eastern Indian Ocean is low (cool), resulting in a short residence time of the ITF along the pathways.
- (b)
- Pacific_warm-Indian_warm (PW-IW): The SST of the western Pacific Ocean is high (warm), and the SST of the eastern Indian Ocean is also high (warm), resulting in a long residence time of the ITF along the pathways.
- (c)
- Pacific_cool-Indian_cool (PC-IC): The SST of the western Pacific Ocean is low (cool), and the SST of the eastern Indian Ocean is also low (cool), resulting in a short residence time of the ITF.
- (d)
- Pacific_cool-Indian_warm (PC-IW): The SST of the western Pacific Ocean is low (cool), and the SST of the eastern Indian Ocean is high (warm), resulting in the longest residence time of the ITF.
The terms “warm” and “cool” are defined relative to the normal SST of each ocean such that the ITF always flows from the Pacific Ocean to the Indian Ocean, even when both are warm or both are cool.
For further analysis, we defined the index intensity as follows to illustrate the relation of the synoptic cases to rainfall intensity:
where the index intensity is the sum of the absolute values of the DMI and NINO.WEST index.
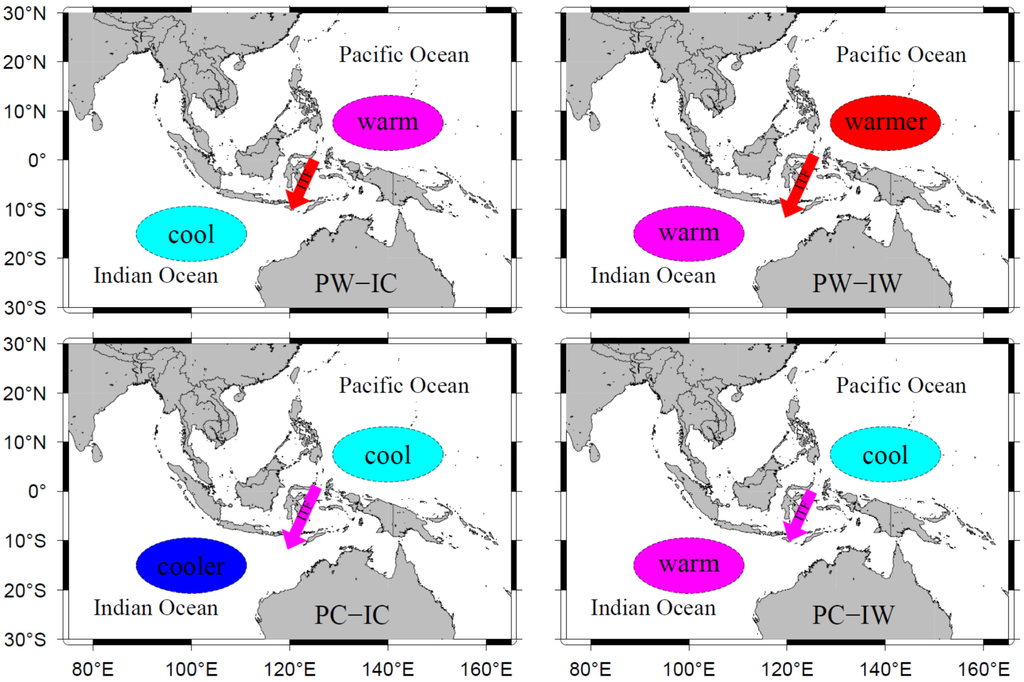
Figure 3.
Four synoptic scenarios for the ITF conditions based on sea level anomaly and the associated hydraulic head difference between the Pacific Ocean and the Indian Ocean with respect to the relative SSTs. The length of the arrows represents the ITF residence time. Note that the ITF always flows from the Pacific Ocean to the Indian Ocean.

3. Rainfall Patterns and Characteristics over Indonesia
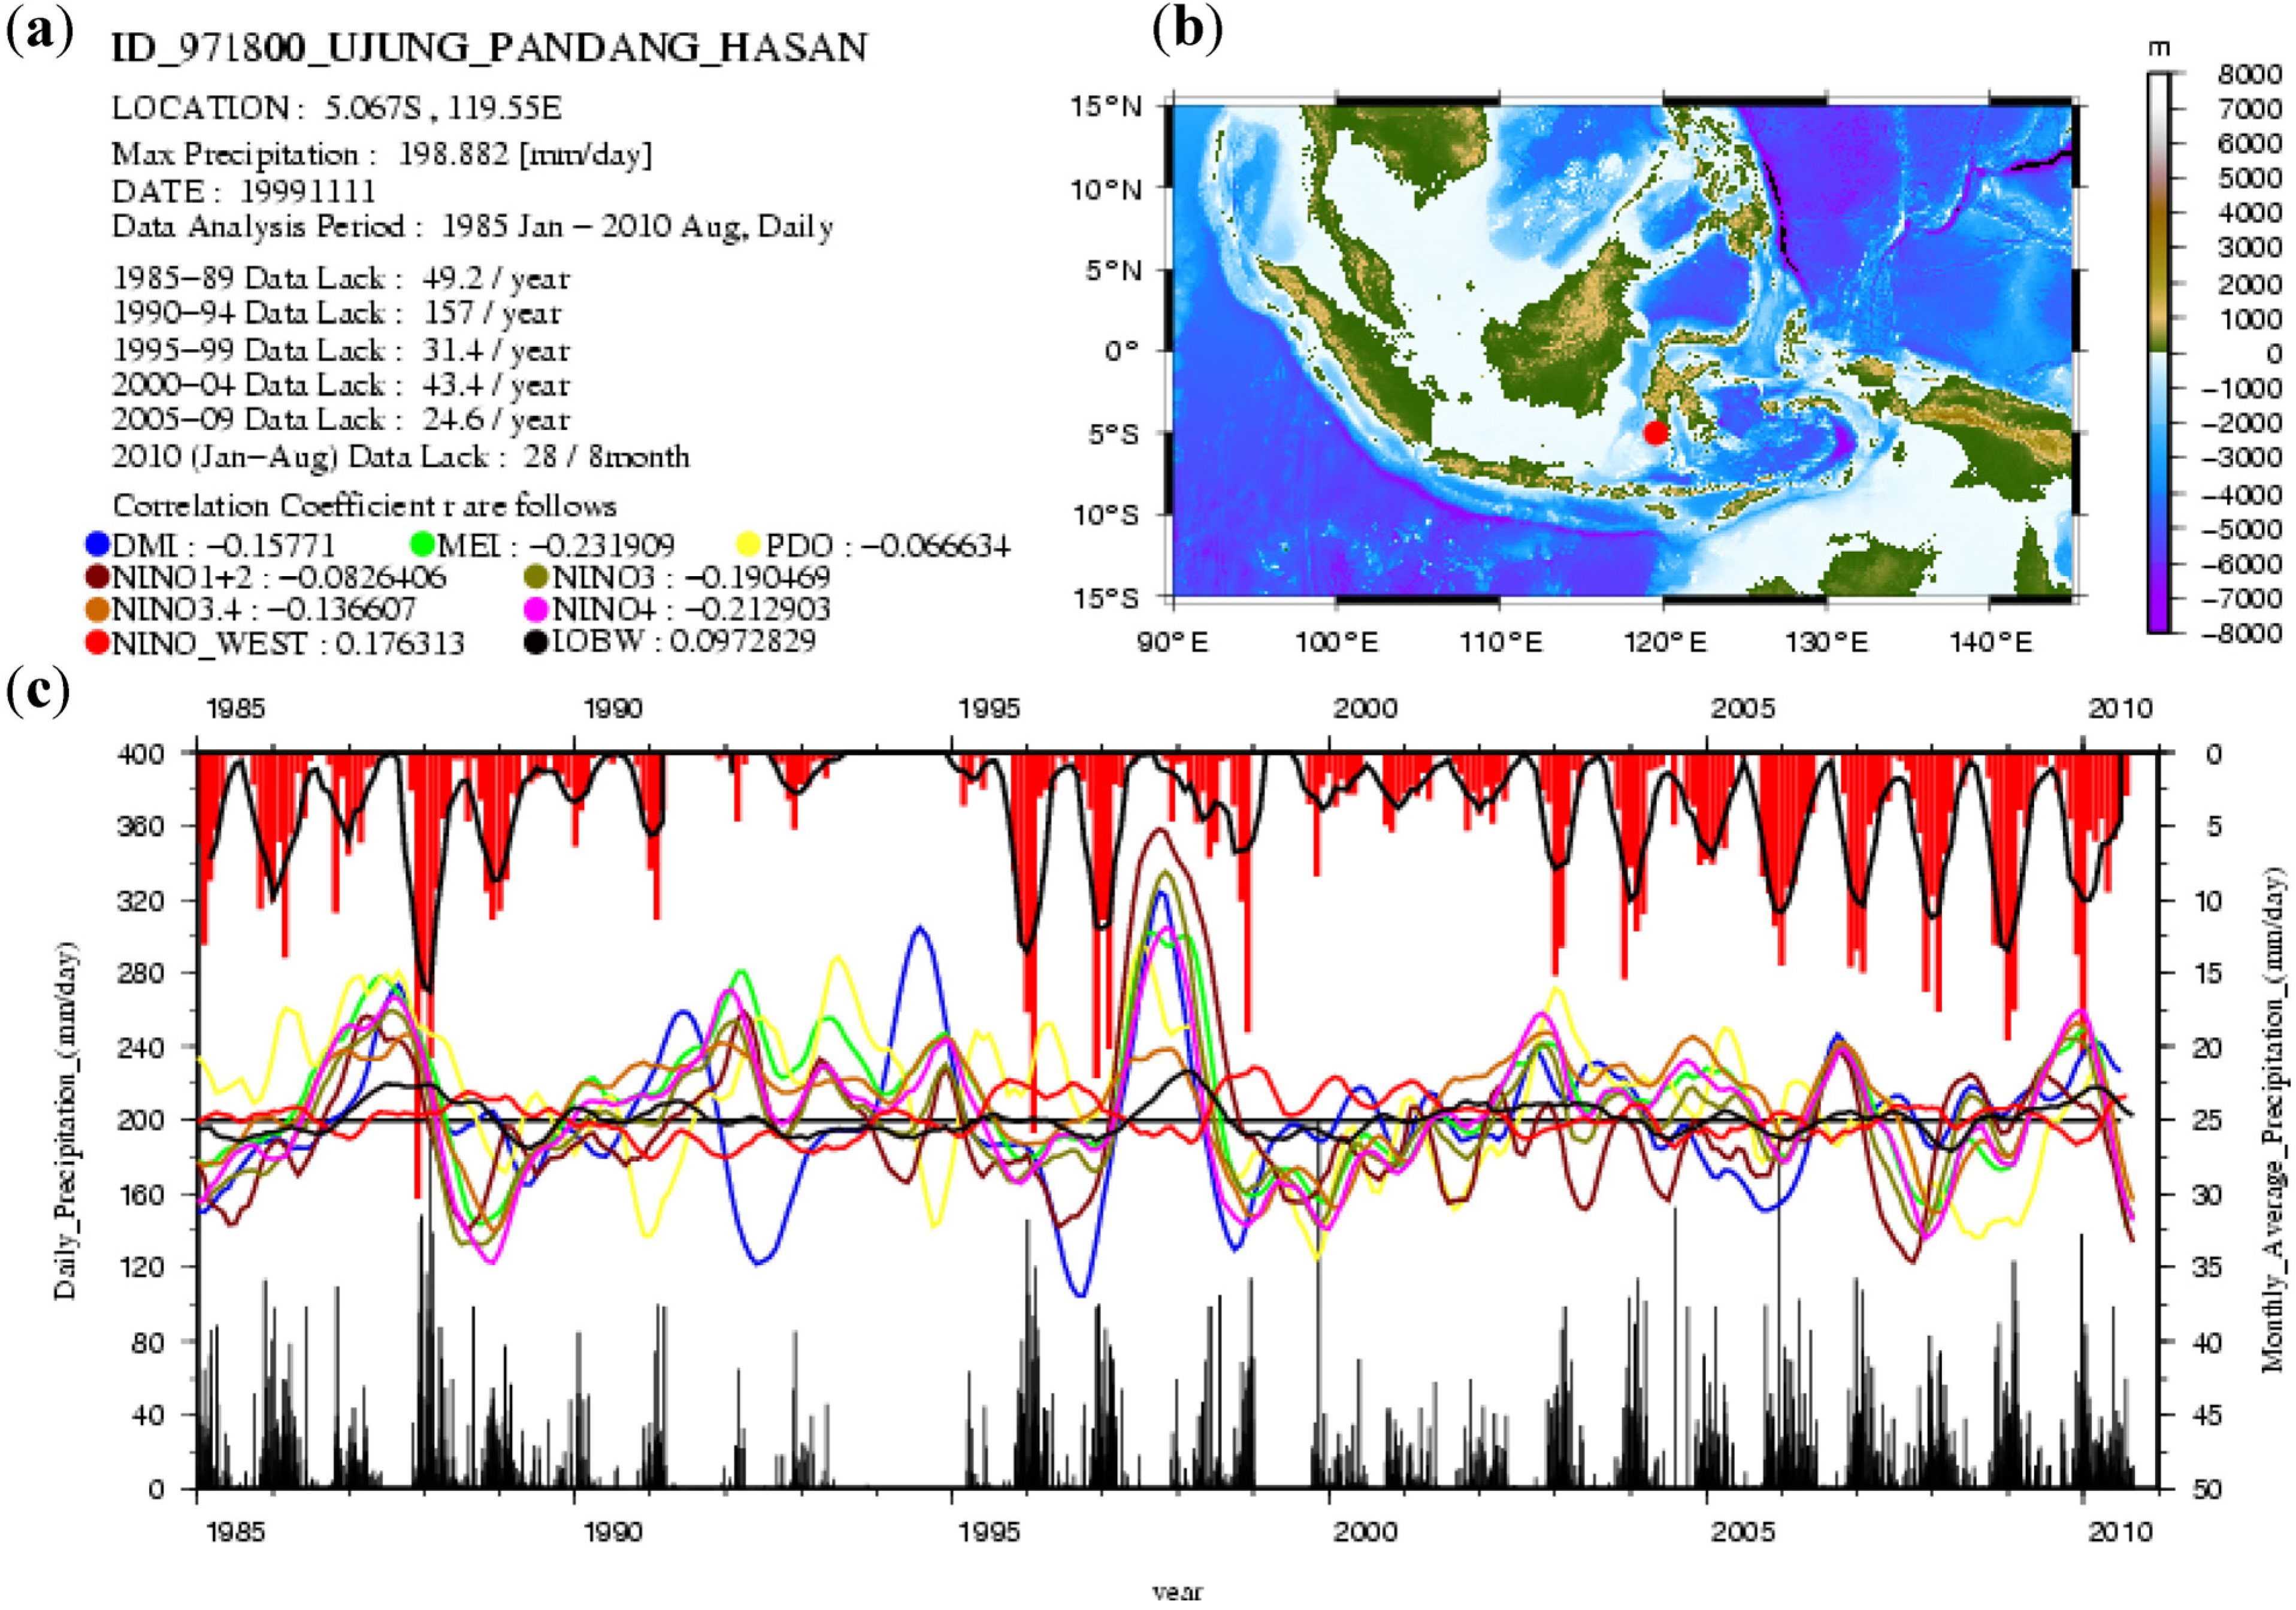
Figure 4 shows a summary of the Ujung Pandang Hasan station in southern Sulawesi. The chart shows the name of the station, the latitude and longitude of the station, the maximum precipitation quantity and date, the number of missing data samples for each five-year period, and the correlation coefficients between the five-month running means of the precipitation and the regional climate indices. In addition to the summary of the results, two subfigures are presented in each chart. The image in the upper-right panel shows the location of the station, and the plot in the bottom panel shows the observed daily rainfall (black bars). The mean daily rainfall for each month (red bars), the five-month running mean of the mean daily rainfall for each month (black solid line), and the time series of the regional climate indices are shown in the middle panel. On Sumatra Island, the rainfall pattern is positively correlated with the DMI and IOBW. The stations facing the Indian Ocean exhibit higher amounts of rainfall and seasonal variations due to the high mountain range compared with the ranges facing the Malacca Strait and Java Sea.

Figure 4.
(a) Summary of the Ujung Pandang Hasan station located in southern Sulawesi. The chart shows the station name, latitude and longitude, maximum precipitation quantity and date observed, number of missing data samples for each 5-year period, and correlation coefficients between the 5-month running means of the precipitation and the indices. (b) the station location and (c) the observed daily rainfall (black bars), the mean daily rainfall for each month (red bars), the 5-month running mean of the mean daily rainfall for each month (black solid line), and the time series of the indices.
On Java Island, most of the stations show very distinctive wet and dry seasonal variations due to the Malaysian-Australian monsoon, which affects Southeast Asia and Australia via the winds from the southeast and northwest during the cooler and warmer months, respectively [52]. The amounts of rainfall from the stations on Java Island are negatively correlated with the DMI and highly negatively correlated with the MEI and NINO4.
In northern Sulawesi, the high amounts of rainfall are highly negatively correlated with an MEI of approximately 0.4, NINO3.4, and NINO4. However, the rainfall is highly positively correlated with NINO.WEST, indicating that the rainfall is primarily influenced by the nearest region during La Niña episodes. In contrast, the rainfall patterns for southern Sulawesi exhibit distinctive wet and dry seasonal variations similar to those of Java Island. The stations in the eastern and western parts of Kalimantan Island exhibit different patterns, with generally larger amounts of rainfall in the east that are positively correlated with the DMI and IBOW and smaller amounts of rainfall in the west that are negatively correlated with the MEI, NINO4, and NINO3.4. The rainfall in the southern Maluku region shows clear seasonal variations. In the Papua Region, the station that faces the Pacific Ocean has high positive correlations with the MEI and NINO indices, with values of 0.25 and 0.25–0.57, respectively, and the station on the other side (i.e., facing the Banda Sea) has high negative correlations with the MEI and NINO indices, with values of –0.37 and –0.3 to –0.37, respectively.
4. Correlations with the Regional Climate Indices
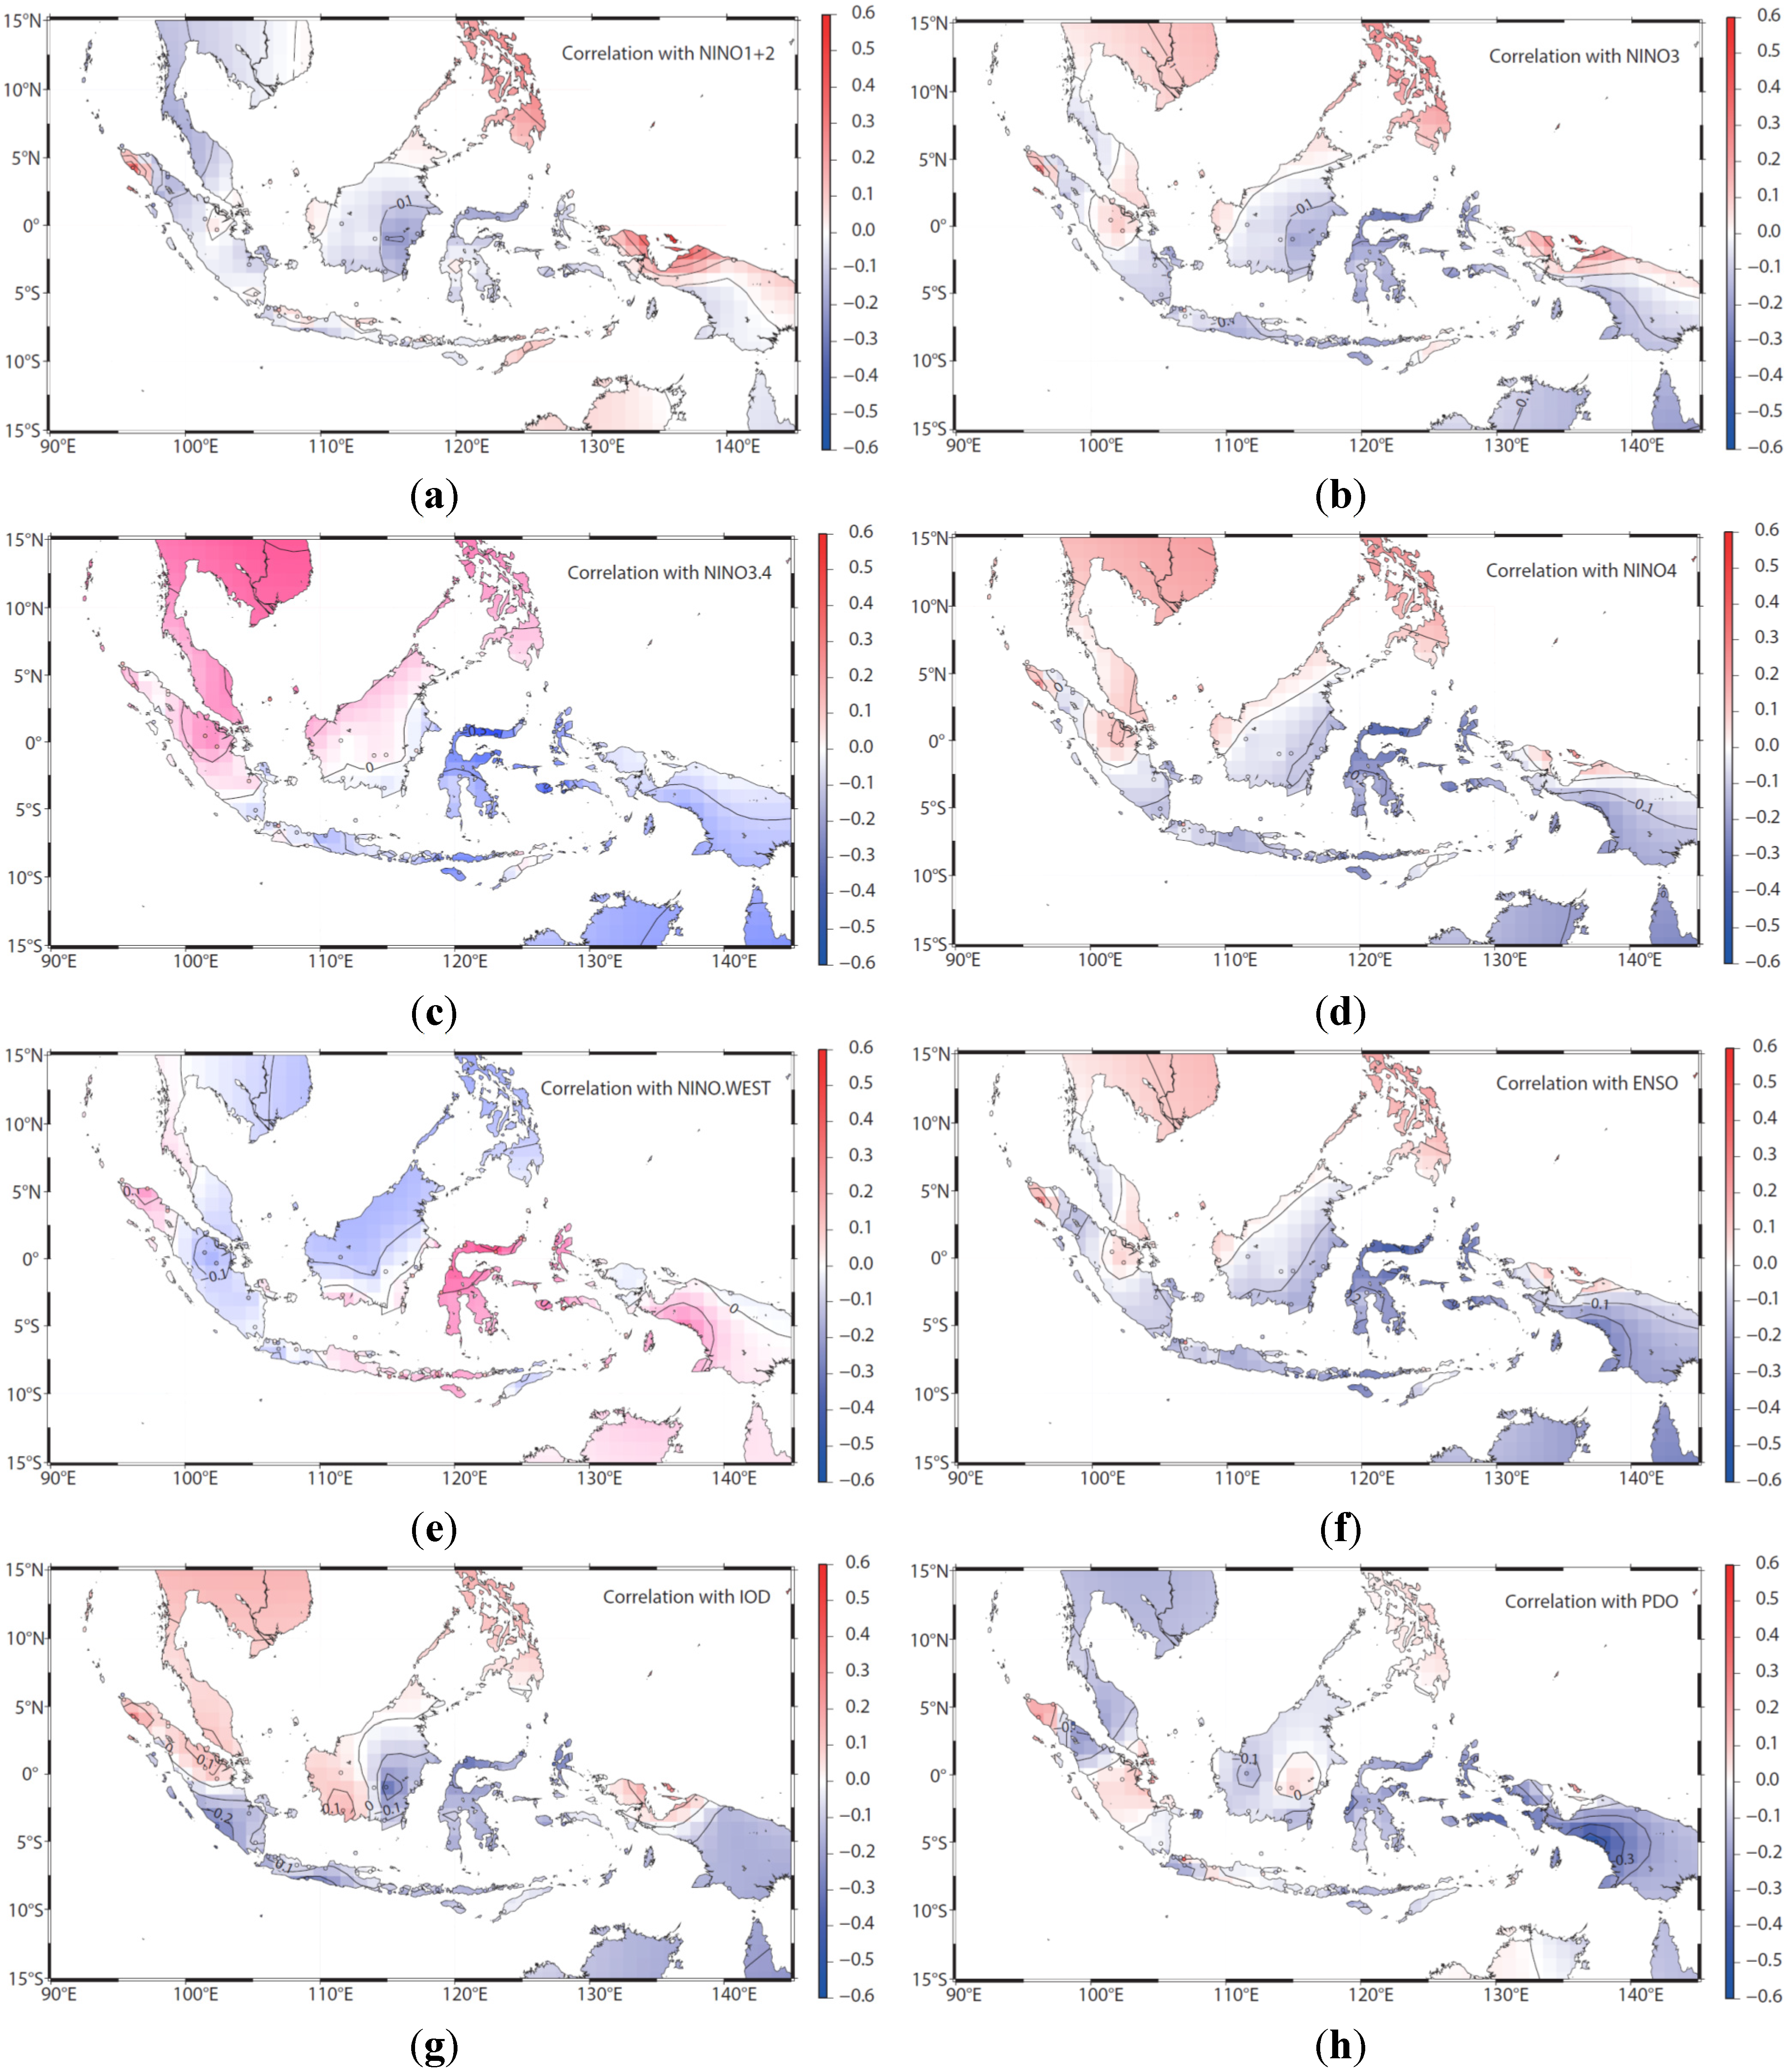
The spatial correlations between the five-month running means of the precipitation and the regional climate indices are presented in Figure 5; using more than 5000 observed GSOD data samples from the stations. The regional climate indices considered are NINO1 + 2 (Figure 5a), NINO3 (Figure 5b), NINO3.4 (Figure 5c), NINO4 (Figure 5d), NINO.WEST (Figure 5e), the MEI (Figure 5f), the DMI (Figure 5g), and the PDO (Figure 5h). The NINO indices, except NINO.WEST, are positively correlated with rainfall over Sulawesi, eastern Kalimantan, eastern Java Island near the Flores Sea, the islands between Sulawesi and the Papua region, and the southwestern Papua region. The NINO indices are negatively correlated with the rainfall over Sumatra Island, western Java Island, western and central Kalimantan, and the northeastern Papua region (Figure 5a–d). NINO.WEST exhibits a trend that is generally opposite those of the other NINO indices and is positively correlated with rainfall over Sulawesi, eastern Java Island, and the Papua region and negatively correlated with rainfall over central Sumatra Island and northern Kalimantan Island (Figure 5e). The MEI has the same spatial correlations as NINO4 with respect to rainfall over the Indonesian islands (Figure 5f). The PDO index has highly negative correlations over the southwestern Papua region, northern and eastern Sulawesi, and the islands between Sulawesi and the Papua region (Figure 5h). Interestingly, the DMI is negatively correlated with the rainfall in southeastern Sumatra, southern Java Island (facing the Indian Ocean), Sulawesi Island, eastern Kalimantan, and the southern Papua region. However, in the other regions, this index has low positive correlations with rainfall (Figure 5g).

Figure 5.
Spatial correlations over Indonesia between the five-month running means of the precipitation data and the indices: (a) NINO1 + 2; (b) NINO3; (c) NINO3.4; (d) NINO4; (e) NINO.WEST; (f) ENSO; (g) IOD and (h) PDO.
Figure 5.
Spatial correlations over Indonesia between the five-month running means of the precipitation data and the indices: (a) NINO1 + 2; (b) NINO3; (c) NINO3.4; (d) NINO4; (e) NINO.WEST; (f) ENSO; (g) IOD and (h) PDO.
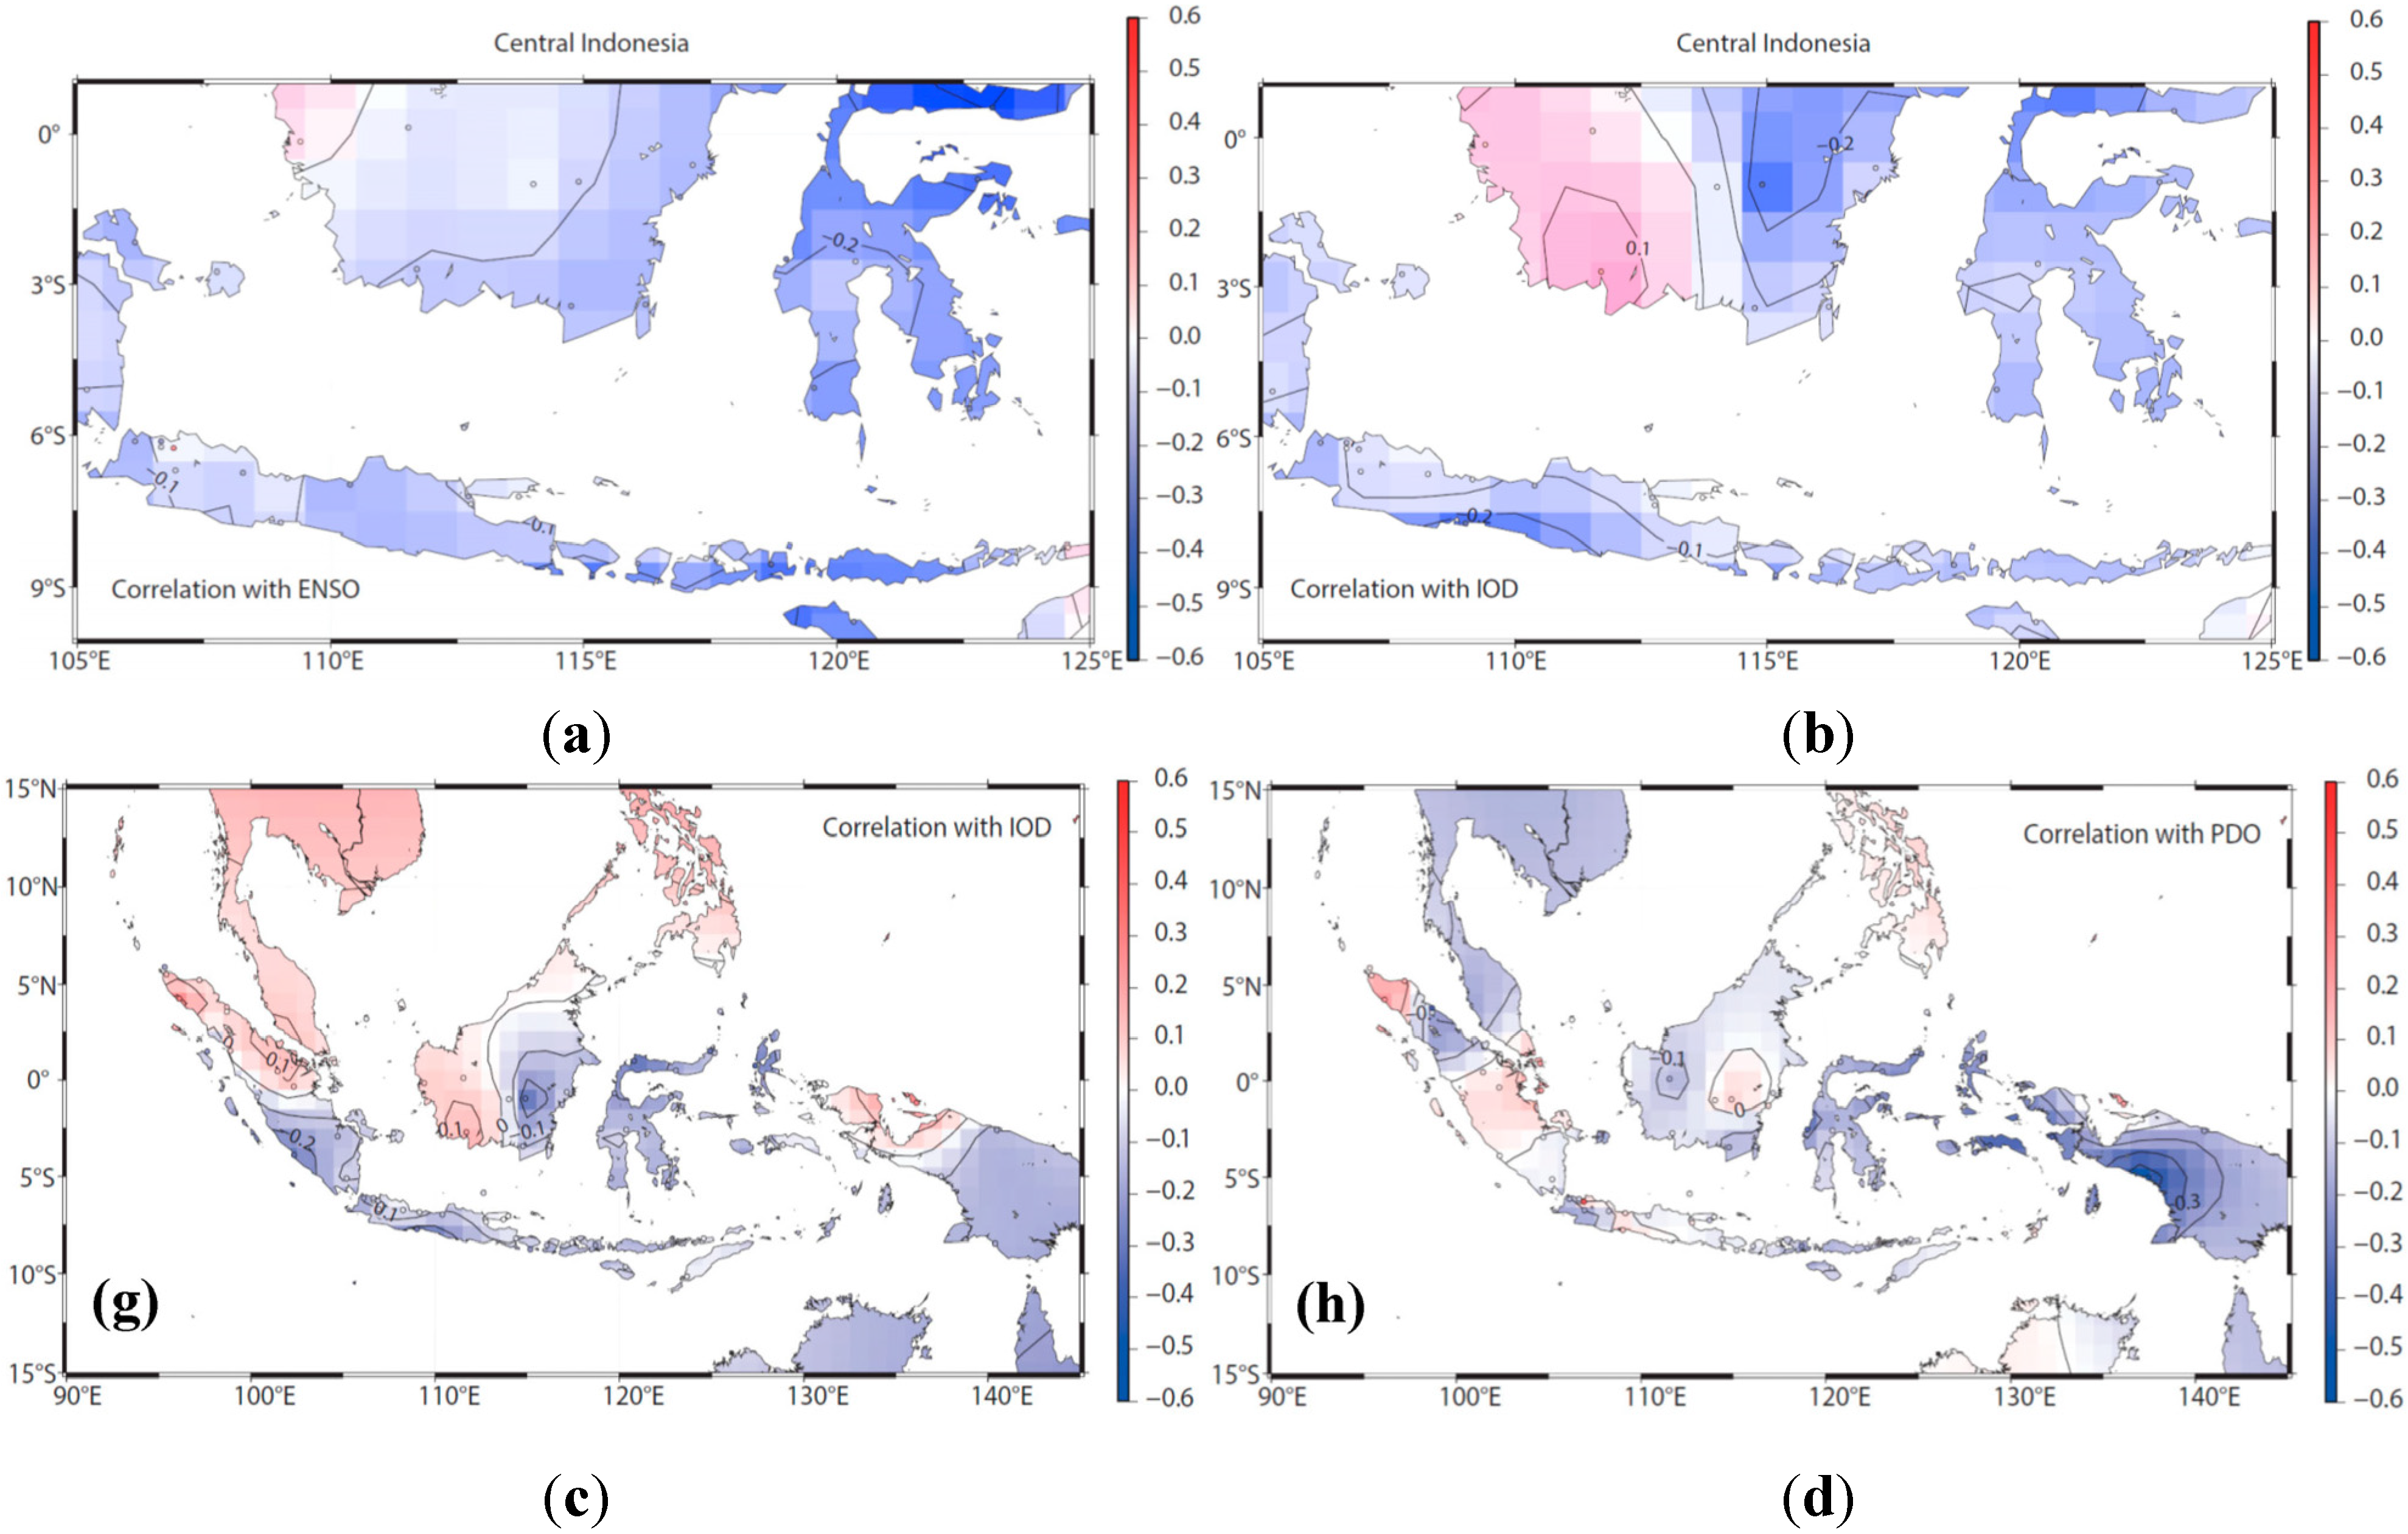
The rainfall characteristics of three regions in Indonesia (Figure 1a) were analyzed by investigating the spatial correlations between rainfall and four indices: the MEI, DMI, NINO.WEST and PDO. In western Indonesia, the rainfall is positively correlated with the MEI in the northwest corner and central part of Sumatra Island and in northwestern Kalimantan Island. The DMI is positively correlated with rainfall over northern Sumatra and western Kalimantan Island. In central Indonesia (Figure 6), the MEI exhibits overall negative correlations with rainfall. The DMI is negatively correlated with rainfall, except over western Kalimantan Island. NINO.WEST is highly positively correlated with rainfall over Sulawesi and the Lesser Sunda Islands. The PDO index is negatively correlated with rainfall over Sulawesi Island but positively correlated over eastern Kalimantan. In eastern Indonesia, the MEI is highly negatively correlated with rainfall, except over the northern Papua region. However, NINO.WEST is positively correlated with the rainfall over almost every island except Timor. The correlations of the DMI are analogous with those of the MEI. Noticeably, the northwestern part of Sulawesi Island is highly correlated with the regional climate indices.
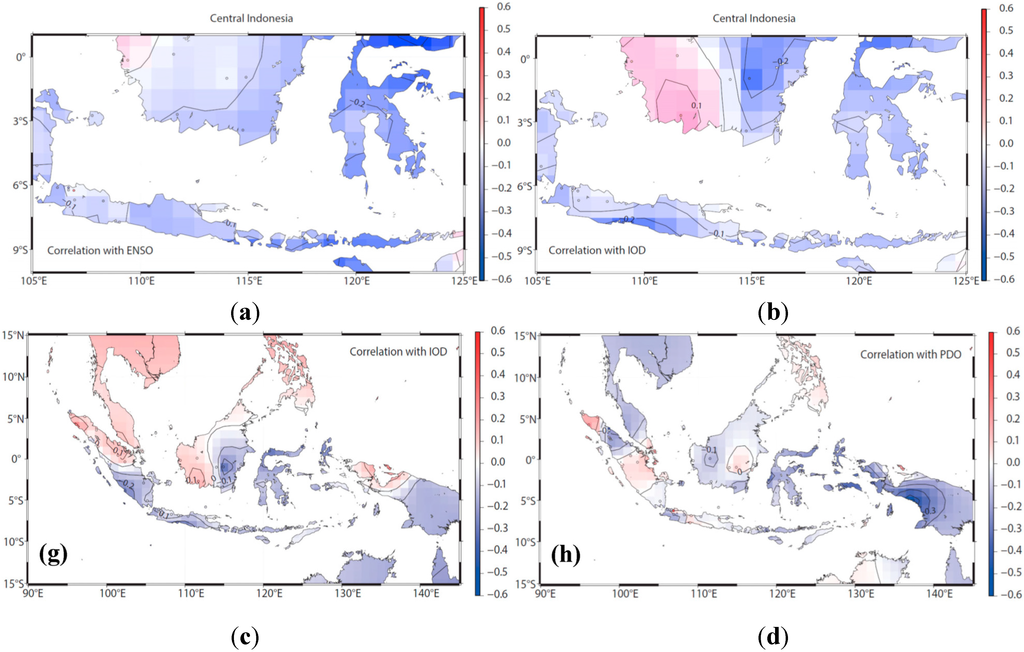
Figure 6.
Spatial correlations between rainfall and the (a) MEI; (b) the DMI; (c) NINO.WEST and (d) the PDO in central Indonesia.
Figure 6.
Spatial correlations between rainfall and the (a) MEI; (b) the DMI; (c) NINO.WEST and (d) the PDO in central Indonesia.
Based on the geographical definition of this study (Figure 1a), the rainfall characteristics of eastern Indonesia and the eastern part of central Indonesia are highly correlated with El Niño and La Niña episodes, whereas western Indonesia and the western part of the central Indonesia are correlated with the Indian Ocean via the DMI. However, the correlation coefficients between the rainfall and the DMI are not particularly strong. The large rainfall quantities in eastern Indonesia have high correlations with La Niña episodes in the Pacific Ocean, and those in central Indonesia are also positively correlated with the MEI and NINO.WEST. However, central Indonesia is dominantly influenced by the Malaysian-Australian monsoon, with distinctive wet and dry seasonal variations. Western Indonesia features generally positive correlations with the IOD through the DMI over northern Sumatra Island (in the Northern Hemisphere, i.e., north of the equator), but the correlation coefficients are not as significant as those in eastern Indonesia. For southern Sumatra and the southern Java Islands, the rainfall is negatively correlated with the DMI, indicating that the warmer water from the eastern Indian Ocean influences the rainfall characteristics during a negative IOD period.
5. Potential Influence of Indonesian Seas on Rainfall Intensity
The hydraulic head difference between the Pacific Ocean and the Indian Ocean is largest in the PW-IC case; thus, the ITF forms a rapid flow rate and large volume transport through the pathways. The residence time of the ITF becomes shorter such that the exposure time of the ITF to seawater evaporation decreases. Therefore, the influence of the ITF on the rainfall intensity decreases. In this case, the Pacific Ocean is in a La Niña phase, with a positive NINO.WEST value, whereas the SST of the eastern Indian Ocean is cool, with a positive DMI value, indicating a positive IOD period.
In the PW-IW scenario, the hydraulic head difference between the Pacific Ocean and the Indian Ocean becomes smaller than that in the PW-IC scenario; thus, the flow rate and volume transport of the ITF are smaller than those in the previous scenarios. However, the residence time of the ITF increases through the pathway regions such that the exposure time of the ITF to evaporation would be relatively long. Therefore, the effects of the ITF on the regional rainfall characteristics might be significant because the increased seawater evaporation could generate cumulus clouds within the significant convection over the warm seas. The PW-IW scenario indicates that cumulus cloud formation most likely occurs over the western Pacific, the eastern Indian and the regions along the ITF pathways. The trade winds over the equatorial zone might also play a role in transporting cumulus clouds to central Indonesia. Therefore, the ITF could possibly influence the rainfall intensity. In this scenario, the Pacific Ocean is in a La Niña phase (negative MEI value and positive NINO.WEST value), whereas the Indian Ocean is in a negative IOD period (negative DMI value).
In the PC-IC scenario, the hydraulic head difference between the Pacific Ocean and the Indian Ocean is less than that in the other scenarios because both of the oceans are cool; thus, the flow rate and volume transport are low. The residence time increases in the pathway regions. However, the impacts of the ITF on the regional rainfall are less significant due to the relatively cooler water in the Pacific Ocean. In this scenario, the Pacific Ocean is in an El Niño phase, with a positive MEI value and negative NINO.WEST value, whereas the eastern Indian Ocean is in a positive IOD period, with a positive DMI value.
In the PC-IW scenario, the hydraulic head difference between the Pacific Ocean and the Indian Ocean is smallest; thus, the flow rate and volume transport are also the lowest. Although the ITF residence time is the longest in this case, the influence of the ITF on rainfall might be less significant due to the cool water in the Pacific Ocean. The Pacific Ocean is in an El Niño phase, whereas the Indian Ocean is in a negative IOD period.
Figure 7 shows the time series of the DMI, MEI, NINO.WEST, and rainfall from four stations located in central Indonesia. Two of the stations, Sts. 971800 and 972300, are located in southern Sulawesi and Bali, adjacent to the Lombok Strait along the pathway of the ITF. In Figure 7, the distinctive PW-IW, PW-IC, and PW-IW scenarios occur during March 1995–March 1997, April 1997–April 1998, and May 1998–February 2000, respectively. The defined index intensities, and the rainfall intensities at the four stations during the three synoptic cases are summarized in Table 2. The index intensities in the table are calculated as the mean values for each synoptic period. Table 2 shows that the rainfall intensities during the PW-IW scenario are higher than those of the PW-IC scenario, as implied by the definitions of the four synoptic cases. Interestingly, the rainfall intensity during the first PW-IW scenario during March 1995–March 1997 is also higher than that for the second PW-IW scenario during May 1998–February 2000. The two instances differ because the eastern Indian Ocean was warmer and the western North Pacific was cooler during the first PW-IW instance than during the second PW-IW instance. In other words, the residence time during the first PW-IW instance was longer than that of the second PW-IW instance. The longer residence time means greater evaporation of the ITF. Therefore, the higher rainfall intensity in the first PW-IW over March 1995–March 1997 compared with the second PW-IW period can be attributed to the effect of the ITF on the rainfall intensity according to the synoptic scenarios.
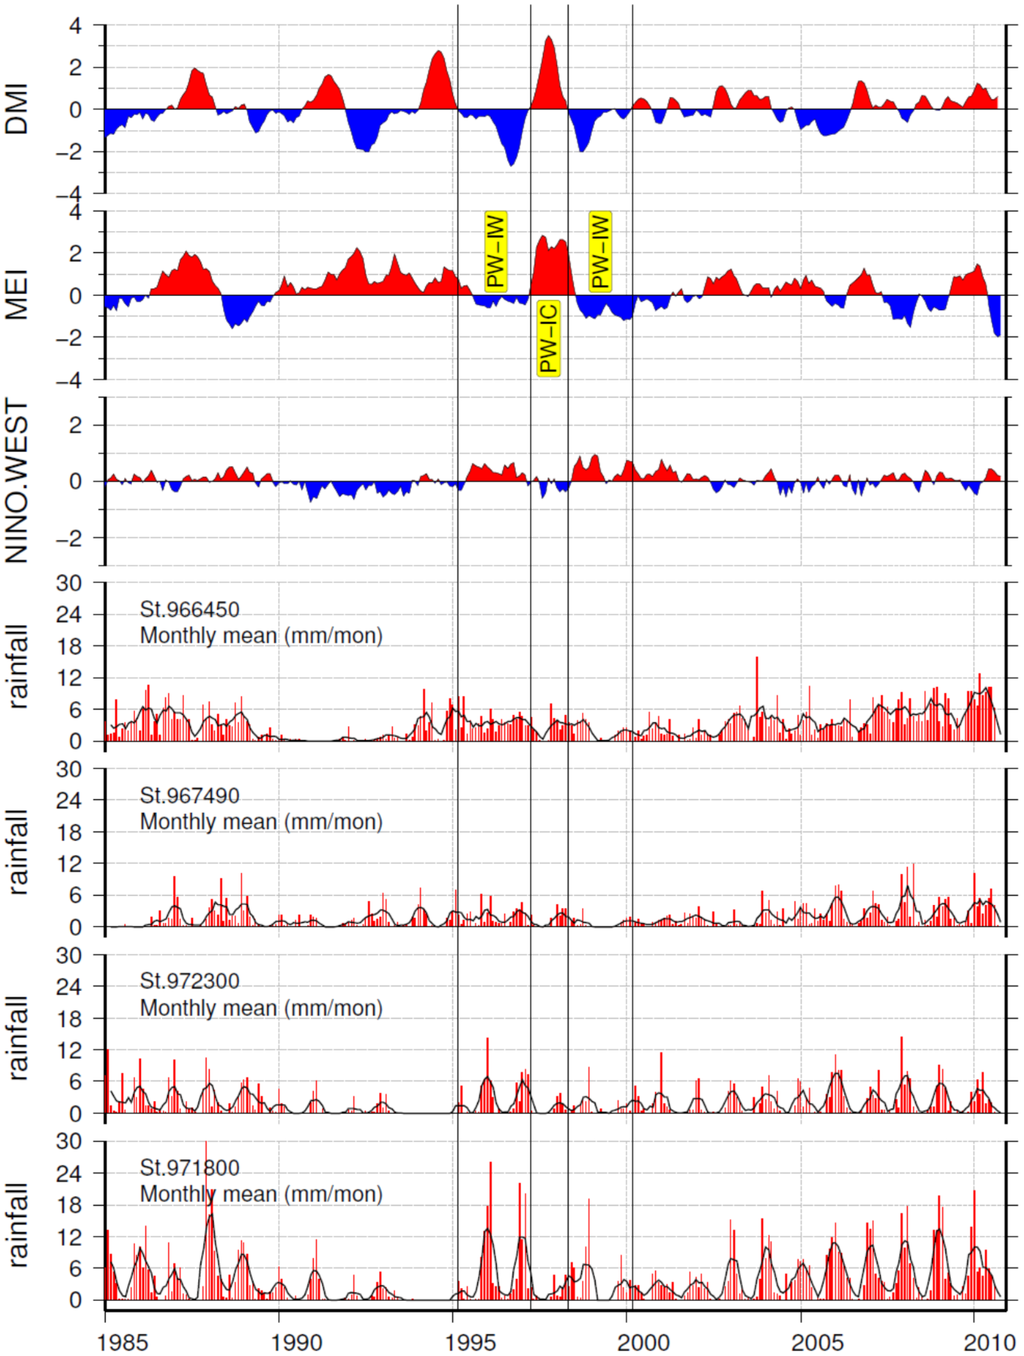
Figure 7.
Comparisons of the time series of the mean daily rainfall for each month (red bars), the five-month running mean of the mean daily rainfall for each month in central Indonesia (black solid line) and the DMI, MEI, and NINO.WEST indices. See Figure 1a for the locations of the stations.
Figure 7.
Comparisons of the time series of the mean daily rainfall for each month (red bars), the five-month running mean of the mean daily rainfall for each month in central Indonesia (black solid line) and the DMI, MEI, and NINO.WEST indices. See Figure 1a for the locations of the stations.
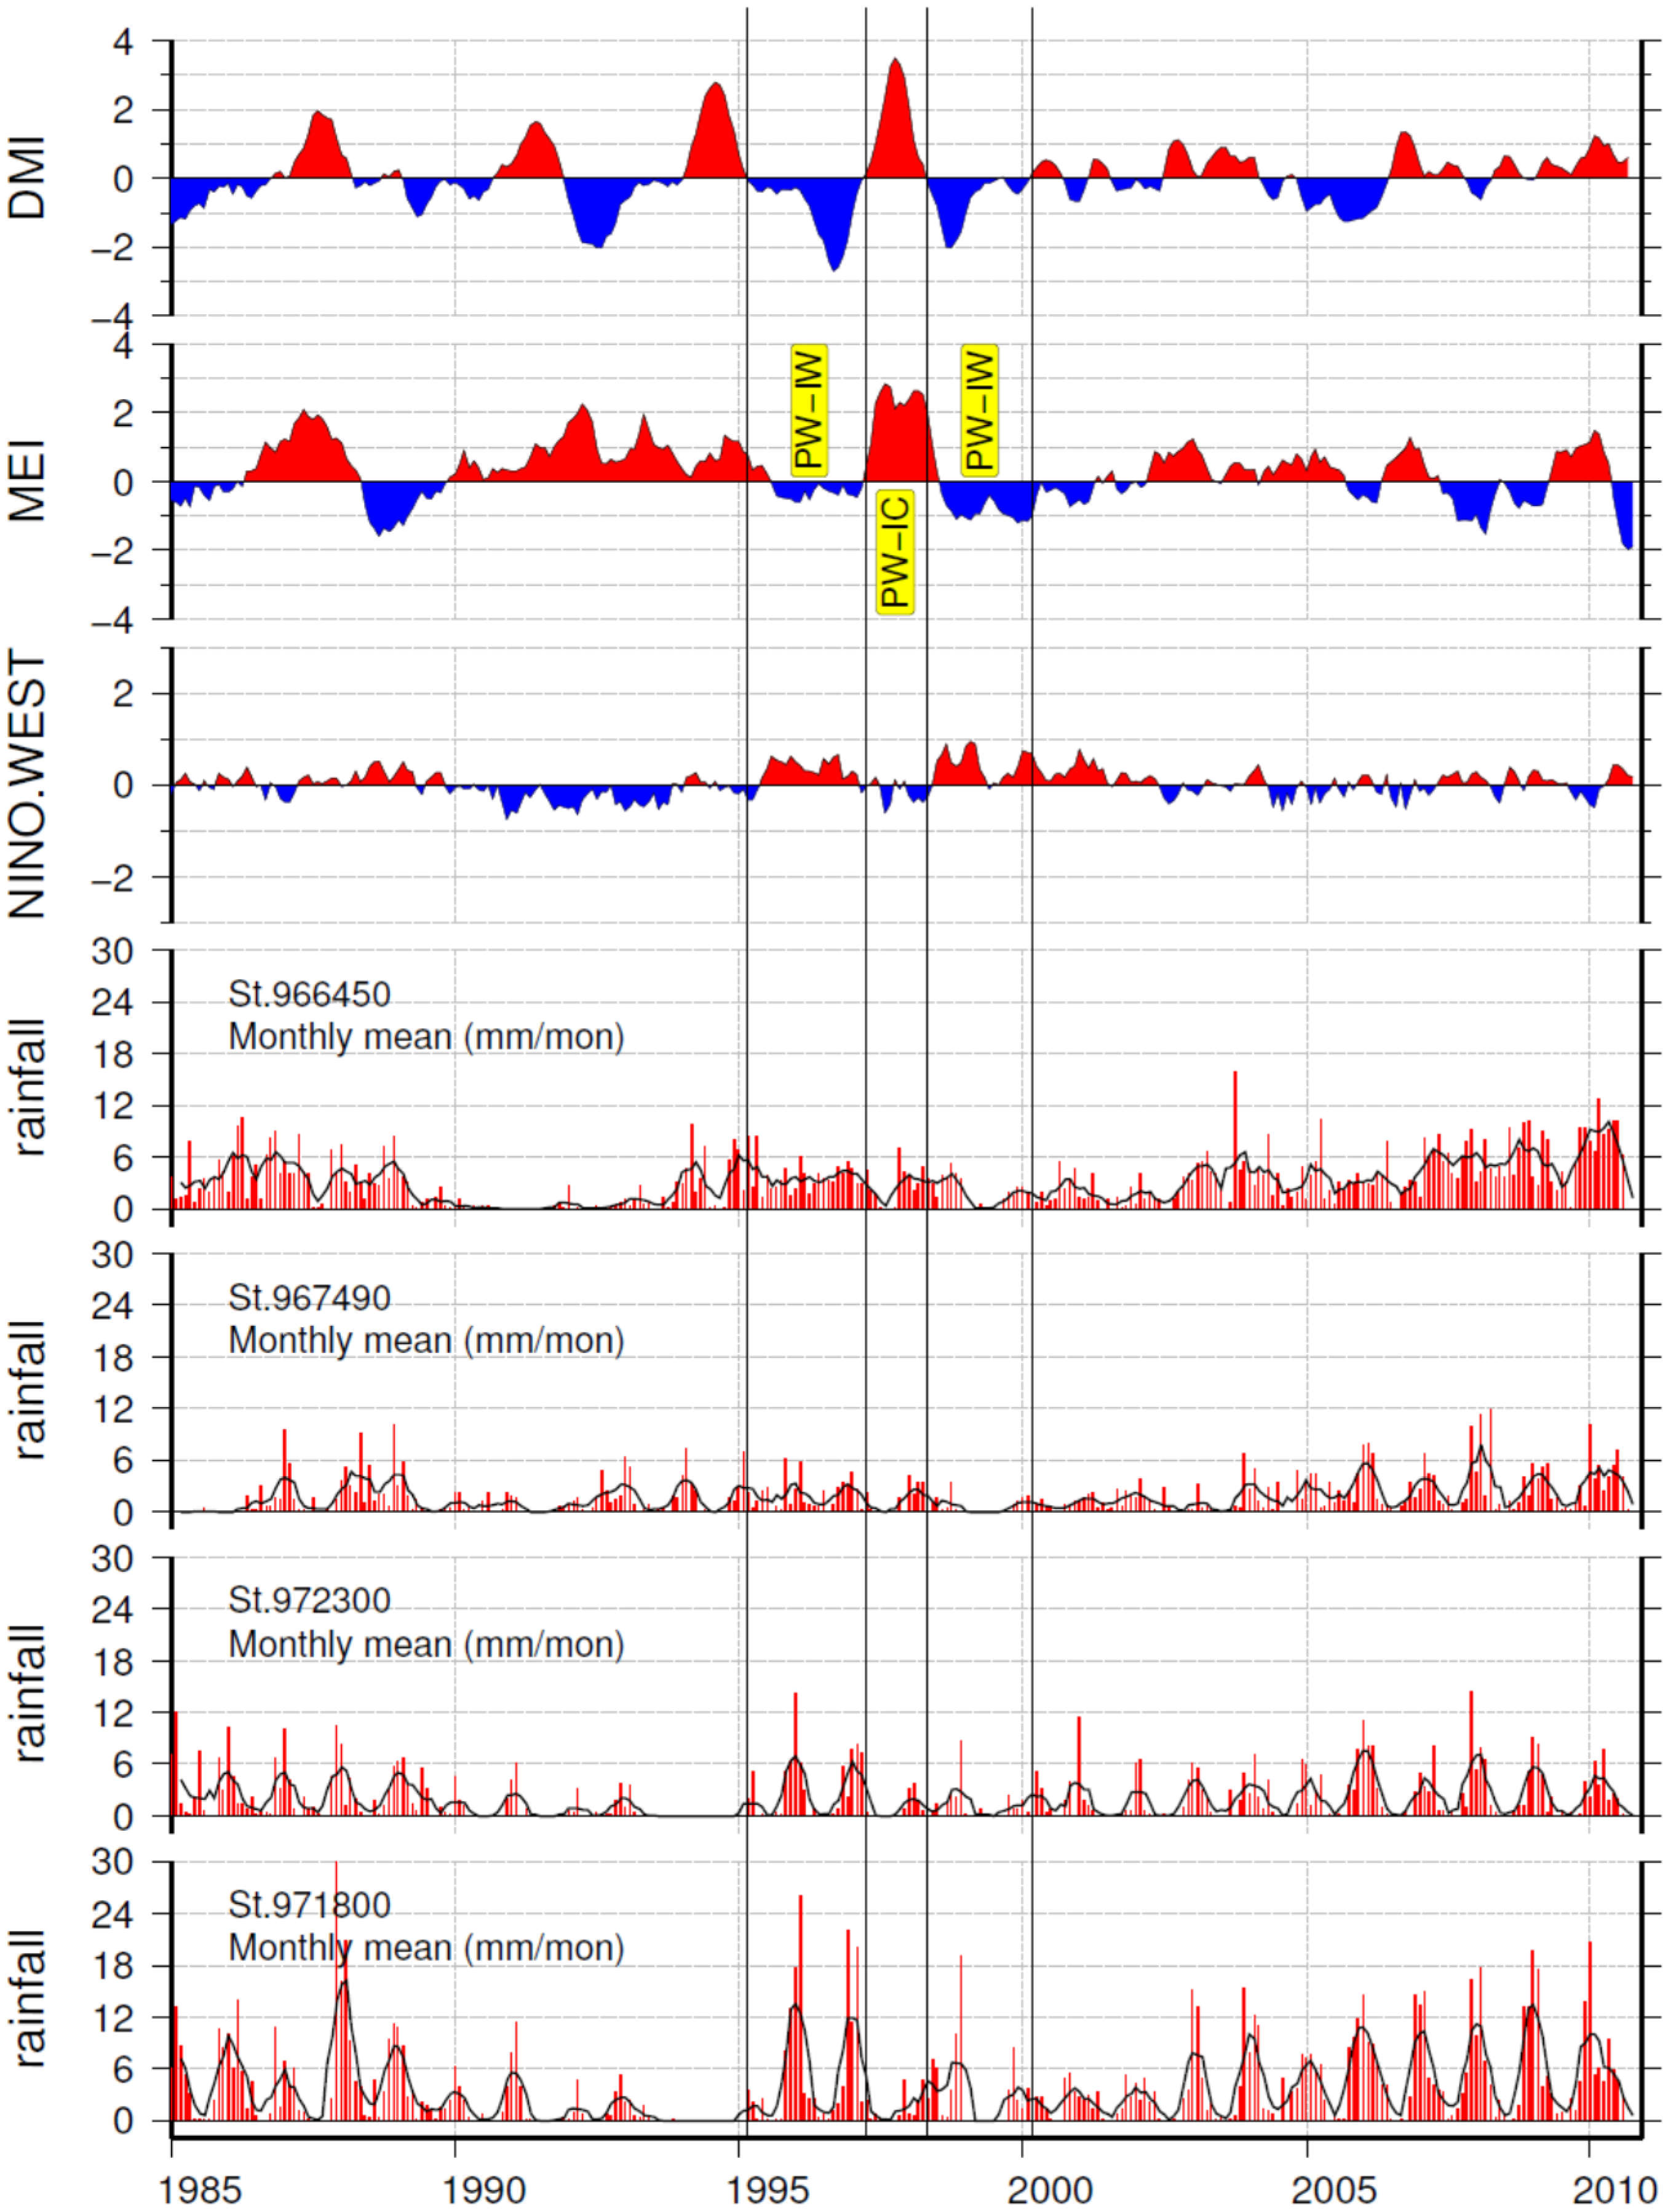
Table 2.
Monthly-mean rainfall intensities at the weather stations in central Indonesia and the index intensities during the three synoptic cases defined in this study. The index intensities are period-averaged, and the stations 971800 and 972300 are located along the pathway of the ITF.
| Intensity | PW-IW (March 1995–March 1997) | PW-IC (April 1997–April 1998) | PW-IW (May 1998–February 2000) | |
|---|---|---|---|---|
| Index intensity (Equation (3)) | 1.22118 | 1.93913 | 1.04960 | |
| Rainfall intensity (mm/mon) | St. 966450 | 6.858 | 3.250 | 4.830 |
| St. 967490 | 1.938 | 1.899 | 1.047 | |
| St. 972300 | 3.619 | 1.462 | 1.780 | |
| St. 971800 | 6.066 | 1.653 | 5.299 | |
6. Conclusions
The rainfall characteristics over Indonesia were investigated using the GSOD precipitation data for a 26-year period from January 1985 to August 2010. Based on the spatial correlations between the five-month running mean of the precipitation and regional climate indices, the rainfall characteristics in eastern Indonesia, including the Papua region, the Maluku Islands, Sulawesi Island, eastern Kalimantan Island, and eastern Java Island, were highly correlated with the ENSO and PDO indices, with high rainfall during strong La Niña episodes and cool PDO phases when the western Pacific Ocean is relatively warmer. In central Indonesia, the Malaysian-Australian monsoon plays a dominant role in the rainfall characteristics and results in distinctive seasonal variations, similar to the findings of Aldrian and Djamil [53]. In western Indonesia, the rainfall in the southern and southeastern portions of Sumatra Island and southern Java Island that face the Indian Ocean was negatively correlated with the DMI, indicating high rainfall during negative IOD periods when the eastern Indian Ocean is relatively warmer. Interestingly, the rainfall in northwestern Sumatra Island was positively correlated with the DMI, in contrast to the finding for southern Sumatra.
The role of Indonesian seas was investigated to determine the effects of the ocean on rainfall characteristics based on four scenarios related to the hydraulic head difference between the Pacific Ocean and the Indian Ocean. The analysis showed that the SST-related hydraulic head difference between the Pacific and Indian Oceans could affect the rainfall characteristics along the ITF pathway regions via temporal differences in the seawater evaporation exposure. For instance, during a strong La Niña episode and a negative IOD period (i.e., warm water in the western Pacific Ocean and warm water in the eastern Indian Ocean; the PW-IW scenario), the prolonged residence time of the warm water in the Pacific Ocean significantly affected the rainfall intensity in the pathway regions due to the increased duration of seawater evaporation, which increased cumulus cloud formation over the warm seas. From March 1995 to February 2000, the PW-IW, PW-IC, and PW-IW scenarios occurred consecutively (Figure 7) and illustrated the effects of Indonesian seas on rainfall intensities along the ITF pathway. In particular, the rainfall intensity during the first PW-IW scenario was greater than that of the second PW-IW because the residence time in the Indonesian seas is significant, according to the assumptions of this study.
However, the 26-year series data with large amount of missing data used in this study is insufficient and more comprehensive studies with long-term high-quality data are needed to determine sufficient statistical significance with respect to the effects of Indonesian seas, including the ITF, on the regional surface weather, such as rainfall.
Acknowledgments
This research was supported by the Grant-in-Aid (24760396) from MEXT, Japan, and by the Tenure-Track program at Saitama University. The basic rainfall analysis was performed by a former graduate student at Hiroshima University, Tsuyoshi Ikeda, and was particularly appreciated.
Conflicts of Interest
The authors declare no conflict of interest.
References
- Cane, M.A.; Molnar, P. Closing of the Indonesian seaway as a precursor to east African aridification around 3–4 million years ago. Nature 2001, 411, 157–162. [Google Scholar] [CrossRef] [PubMed]
- Giannini, A.; Robertson, A.W.; Qian, J.H. A role for tropical tropospheric temperature adjustment to El Niño-Southern Oscillation in the seasonality of monsoonal Indonesia precipitation predictability. J. Geophys. Res. Atmos. 2007, 112. [Google Scholar] [CrossRef]
- Juneng, L.; Tangang, F. Evolution of ENSO-related rainfall anomalies in Southeast Asia region and its relationship with atmosphere–ocean variations in Indo-Pacific sector. Clim. Dyn. 2005, 25, 337–350. [Google Scholar] [CrossRef]
- Gutman, G.; Csiszar, I.; Romanov, P. Using NOAA/AVHRR products to monitor El Niño impacts: Focus on Indonesia in 1997–98. Bull. Am. Meteorol. Soc. 2000, 81, 1189–1205. [Google Scholar] [CrossRef]
- Braak, C. Atmospheric Variations of Short and Long Duration in the Malay Archipelago and Neighbouring Regions and the Possibility to Forecast Them; Javasche Boekhandel en Drukkerij: Batavia, NY, USA, 1919. [Google Scholar]
- Schell, I.I. Dynamic Persistence and Its Applications to Long-range Foreshadowing; Harvard University, Blue Hill Meteorological Observatory: Milton, MA, USA, 1947; Volume 8, p. 80. [Google Scholar]
- Nicholls, N. Air–sea interaction and the possibility of long-range weather prediction in the Indonesian archipelago. Month. Weather Rev. 1981, 109, 2435–2443. [Google Scholar] [CrossRef]
- Aldrian, E.; menil Gates, L.; Widodo, F.H. Seasonal variability of Indonesian rainfall in ECHAM4 simulations and in the reanalyses: The role of ENSO. Theor. Appl. Climatol. 2007, 87, 41–59. [Google Scholar] [CrossRef]
- Ramage, C.S. Monsoon meteorology. In International Geophysics; Academic Press: London, UK, 1971; Volume 15, pp. 285–296. [Google Scholar]
- Moron, V.; Robertson, A.W.; Boer, R. Spatial coherence and seasonal predictability of monsoon onset over Indonesia. J. Clim. 2009, 22, 840–850. [Google Scholar] [CrossRef]
- Moron, V.; Robertson, A.; Qian, J.-H. Local versus regional-scale characteristics of monsoon onset and post-onset rainfall over Indonesia. Clim. Dyn. 2010, 34, 281–299. [Google Scholar] [CrossRef]
- Philander, S. El Niño, La Niña, and the Southern Oscillation. In International Geophysics; Academic Press: London, UK, 1990; Volume 46, p. 286. [Google Scholar]
- Ropelewski, C.F.; Halpert, M.S. Global and regional scale precipitation patterns associated with the El Niño/Southern Oscillation. Month. Weather Rev. 1987, 115, 1606–1626. [Google Scholar] [CrossRef]
- Ropelewski, C.F.; Halpert, M.S. Precipitation patterns associated with the high index phase of the Southern Oscillation. J. Clim. 1989, 2, 268–284. [Google Scholar] [CrossRef]
- Haylock, M.; McBride, J. Spatial coherence and predictability of Indonesian wet season rainfall. J. Clim. 2001, 14, 3882–3887. [Google Scholar] [CrossRef]
- Halpert, M.S.; Ropelewski, C.F. Surface temperature patterns associated with the outhern Oscillation. J. Clim. 1992, 5, 577–593. [Google Scholar] [CrossRef]
- Hendon, H.H. Indonesian rainfall variability: Impacts of ENSO and local air–sea interaction. J. Clim. 2003, 16, 1775–1790. [Google Scholar] [CrossRef]
- Hamada, J.-I.; Yamanaka, M.D.; Matsumoto, J.; Fukao, S.; Winarso, P.A.; Sribimawati, T. Spatial and temporal variations of the rainy season over Indonesia and their link to ENSO. J. Meteorol. Soc. Jpn. Ser. II 2002, 80, 285–310. [Google Scholar] [CrossRef]
- McBride, J.L.; Haylock, M.R.; Nicholls, N. Relationships between the Maritime Continent heat source and the El Niño–Southern Oscillation phenomenon. J. Clim. 2003, 16, 2905–2914. [Google Scholar] [CrossRef]
- McBride, J.L. Satellite observations of the southern hemisphere monsoon during Winter MONEX. Tellus A 1983, 35, 189–197. [Google Scholar] [CrossRef]
- Murakami, T.; Sumi, A. Southern Hemisphere Summer Monsoon Circulation during the 1978–79 WMONEX Part I: Monthly mean wind fieldsi1. J. Meteorol. Soc. Jpn. Ser. II 1982, 60, 638–648. [Google Scholar]
- Asnani, G.C. Tropical Meteorology; Indian Institute of Tropical Meteorology: Maharashtra, India, 1993; p. 1202. [Google Scholar]
- Cheang, B.K. Short- and long-range monsoon prediction in southeast Asia. In Monsoons; Fein, J.S., Stephens, P.L., Eds.; Malaysia Meteorological Service: Selangor, Malaysia, 1987; pp. 579–606. [Google Scholar]
- Madden, R.A.; Julian, P.R. Description of global-dcale crculation cells in the tropics with a 40–50 day period. J. Atmos. Sci. 1972, 29, 1109–1123. [Google Scholar] [CrossRef]
- Hidayat, R.; Kizu, S. Influence of the Madden–Julian Oscillation on Indonesian rainfall variability in austral summer. Int. J. Climatol. 2010, 30, 1816–1825. [Google Scholar]
- Aldrian, E.; Dwi Susanto, R. Identification of three dominant rainfall regions within Indonesia and their relationship to sea surface temperature. Int. J. Climatol. 2003, 23, 1435–1452. [Google Scholar] [CrossRef]
- Chang, C.P.; Wang, Z.; Ju, J.; Li, T. On the relationship between Western Maritime Continent Monsoon Rainfall and ENSO during Northern Winter. J. Clim. 2004, 17, 665–672. [Google Scholar] [CrossRef]
- GHCN-Daily. Available online: ftp://ftp.ncdc.noaa.gov/pub/data/ghcn/daily/grid (accessed on 20 April 2015).
- Monthly Atmospheric & SST Indices. Available online: http://www.cpc.ncep.noaa.gov/data/indices (accessed on 20 April 2015).
- Wolter, K.; Timlin, M.S. Monitoring ENSO in COADS with a seasonally adjusted principal component index. In Proceedings of the 17th Climate Diagnostics Workshop, Norman, OK, USA, 19–23 October 1993; pp. 52–57.
- Wolter, K.; Timlin, M.S. Measuring the strength of ENSO events: How does 1997/98 rank? Weather 1998, 53, 315–324. [Google Scholar] [CrossRef]
- Multivariate ENSO Index (MEI). Available online: http://www.esrl.noaa.gov/psd/people/klaus.wolter/MEI (accessed on 20 April 2015).
- Mantua, N.J.; Hare, S.R.; Zhang, Y.; Wallace, J.M.; Francis, R.C. A Pacific interdecadal climate oscillation with impacts on salmon production. Bull. Am. Meteorol. Soc. 1997, 78, 1069–1079. [Google Scholar] [CrossRef]
- PDO INDEX. Available online: http://jisao.washington.edu/pdo/PDO.latest (accessed on 20 April 2015).
- Japan Meteorological Agency (JMA). El Niño phenomenon. In The Diagnostic Table of the Ocean’s Health; JMA: Tokyo, Japan, 2005. (In Japanese) [Google Scholar]
- Download El Niño Monitoring Indices. Available online: http://ds.data.jma.go.jp/tcc/tcc/products/elnino/index/ (accessed on 20 April 2015).
- Saji, N.H.; Goswami, B.N.; Vinayachandran, P.N.; Yamagata, T. A dipole mode in the tropical Indian Ocean. Nature 1999, 401, 360–363. [Google Scholar] [PubMed]
- Meyers, G.; McIntosh, P.; Pigot, L.; Pook, M. The Years of El Niño, La Niña, and interactions with the tropical Indian Ocean. J. Clim. 2007, 20, 2872–2880. [Google Scholar] [CrossRef]
- Haddly SST. Available online: http://www.jamstec.go.jp/frcgc/research/d1/iod/DATA/dmi_HadISST.txt (accessed on 20 April 2015).
- Smith, W.H.F.; Wessel, P. Gridding with continuous curvature splines in tension. Geophysics 1990, 55, 293–305. [Google Scholar] [CrossRef]
- Pearson, K. Mathematical contributions to the theory of evolution. VII. On the correlation of characters not quantitatively measurable. Philos. Trans. R. Soc. Lond. A 1900, 195, 1–405. [Google Scholar] [CrossRef]
- Gordon, A.L. Interocean exchange. In Ocean Circulation and Climate; Siedler, G., Church, J., Gould, J., Eds.; Academic Press: London, UK, 2001; pp. 303–314. [Google Scholar]
- Santoso, A.; Cai, W.; England, M.H.; Phipps, S.J. The role of the Indonesian throughflow on ENSO dynamics in a coupled climate model. J. Clim. 2011, 24, 585–601. [Google Scholar] [CrossRef]
- Song, Q.; Vecchi, G.A.; Rosati, A.J. The role of the Indonesian throughflow in the Indo–Pacific climate variability in the GFDL coupled climate model. J. Clim. 2007, 20, 2434–2451. [Google Scholar] [CrossRef]
- Susanto, R.D.; Ffield, A.; Gordon, A.L.; Adi, T.R. Variability of Indonesian throughflow within Makassar Strait, 2004–2009. J. Geophys. Res. Oceans 2012, 117. [Google Scholar] [CrossRef]
- Du, Y.; Qu, T. Three inflow pathways of the Indonesian throughflow as seen from the simple ocean data assimilation. Dyn. Atmos. Oceans 2010, 50, 233–256. [Google Scholar] [CrossRef]
- Shinoda, T.; Han, W.; Metzger, E.J.; Hurlburt, H.E. Seasonal variation of the Indonesian throughflow in Makassar Strait. J. Phys. Oceanogr. 2012, 42, 1099–1123. [Google Scholar] [CrossRef]
- Bryden, H.L.; Imawaki, S. Ocean heat transpor. In Ocean Circulation and Climate; Siedler, G., Church, J., Gould, J., Eds.; Academic Press: London, UK, 2001; pp. 455–474. [Google Scholar]
- Wajsowicz, R.C.; Schneider, E.K. The Indonesian throughflow’s effect on global climate determined from the COLA coupled climate system. J. Clim. 2001, 14, 3029–3042. [Google Scholar] [CrossRef]
- Wijffels, S.E. Ocean transport of fresh water. In Ocean Circulation and Climate; Siedler, G., Church, J., Gould, J., Eds.; Academic Press: London, UK, 2001; pp. 475–488. [Google Scholar]
- Gordon, A.L. Oceanography of the Indonesian seas and their throughflow. Oceanography 2005, 18, 14–27. [Google Scholar] [CrossRef]
- Rafferty, J.P. Winds and windstorms. In Storms, Violent Winds, and Earth’s Atmosphere; Rafferty, J.P., Ed.; Britannica Educational Publishing: New York, NY, USA, 2011; Chapter 2. [Google Scholar]
- Aldrian, E.; Djamil, Y.S. Spatio-temporal climatic change of rainfall in East Java Indonesia. Int. J. Climatol. 2008, 28, 435–448. [Google Scholar] [CrossRef]
© 2015 by the authors; licensee MDPI, Basel, Switzerland. This article is an open access article distributed under the terms and conditions of the Creative Commons Attribution license (http://creativecommons.org/licenses/by/4.0/).