1. Introduction
As a generally accepted renewable energy, small hydropower (SHP) has been greatly developed in the past few decades because of its small scale, lower investment, quick returns, lack of pollution and the promotion of local economic development [
1,
2,
3,
4,
5,
6]. With large-scale SHP plants accessing the power grid, problems of wasting water resources and abandoning electricity have been increasing, and the safe operation of the power grid is also threatened [
7,
8]. Therefore, it is necessary to forecast the power production of SHP plants to solve the above problems by means of coordination and dispatching of SHP and large-medium hydropower (LHP) plants.
Currently, the LHP forecasting method, which focuses on the forecasting of inflow in reservoirs and stream flow [
9,
10,
11,
12,
13,
14,
15,
16,
17,
18,
19,
20,
21], is very mature, but the study of SHP has not formed a complete theoretical model. Greatly different from the forecasting problems of LHP, the long-term forecasting of SHP faces a series of challenges: (1) Problems arise from the weakness in management, difficulty of information collection, and lack of available data accumulation; (2) SHP is typically derived from run-off river plants with little regulating capacity, so their power production is determined to a great extent by the reservoir inflow. Because the installed capacity of a single plant is very small, it is difficult to forecast its power production because of strong uncertainty and fluctuation; (3) The power production of SHP plants shows great spatiotemporal diversity, and thus, it is difficult to establish a commonly used model; (4) Because SHP is widely distributed and large in quantity, building forecasting models for all SHP plants is unnecessary and cannot satisfy the demand of precision. Due to the challenges, forecasting power production of SHP plants is a complex task; therefore, a few researchers have explored this issue and have obtained some useful results [
22,
23].
The power production of SHP indicates the maximum generation capacity of an SHP plant under certain meteorological and hydrological conditions, which are easily influenced by factors, such as hydrology, climate, and installation capacity. Therefore forecasting the power production of an SHP plant is a nonlinear, multi-factor complicated problem. However, it is difficult to establish a prediction model based on classical and mature models for forecasting long-term power production because of the lack of observed data of SHP plants. As we know, SHP and LHP plants in the same region or neighborhood have similarities in some aspects of hydrology, meteorology and geography. As a result, some correlation exists between SHP and LHP in some aspects. LHP plants can provide long-term historical data and accurate forecast values. Thus, historical data are used as a reference for the study of forecasting long-term SHP power production.
To solve the problems mentioned above, this paper presents a correlation analysis method of LHP and SHP for forecasting long-term power production of SHP plants. First, the SHP plants are considered to belong to the same area as a whole. Then, the interval flow of the LHP plant is screened as the correlation factor. Then, the correlation analysis of LHP and SHP is performed, and the significance of the correlation is tested. Finally, a regression model is developed to forecast the power production of SHP through the predictive value of LHP. This forecast model has been successfully applied to the Yunnan Power Grid. The LHP plants have a higher level of automation than SHP plants, which can collect long series of observed data. Thus, we could obtain relatively accurate interval flow values of the LHP plant because considerable research activity of forecasting models for LHP plants has been conducted. In addition, there is much stronger correlation between power production of SHP plants and the interval flow of the LHP plant through the numerical simulation analysis. Therefore, the proposed forecast model is capable of achieving accurate forecasting results.
2. Spatiotemporal Characteristics of SHP
2.1. Randomness of a Single Plant
Because of the small installation capacity and the lack of regulation ability, SHP plants are predominantly influenced by rainfall and it is difficult to achieve stable regularity of power production. Therefore, the power production of a single plant shows strong randomness and fluctuation.
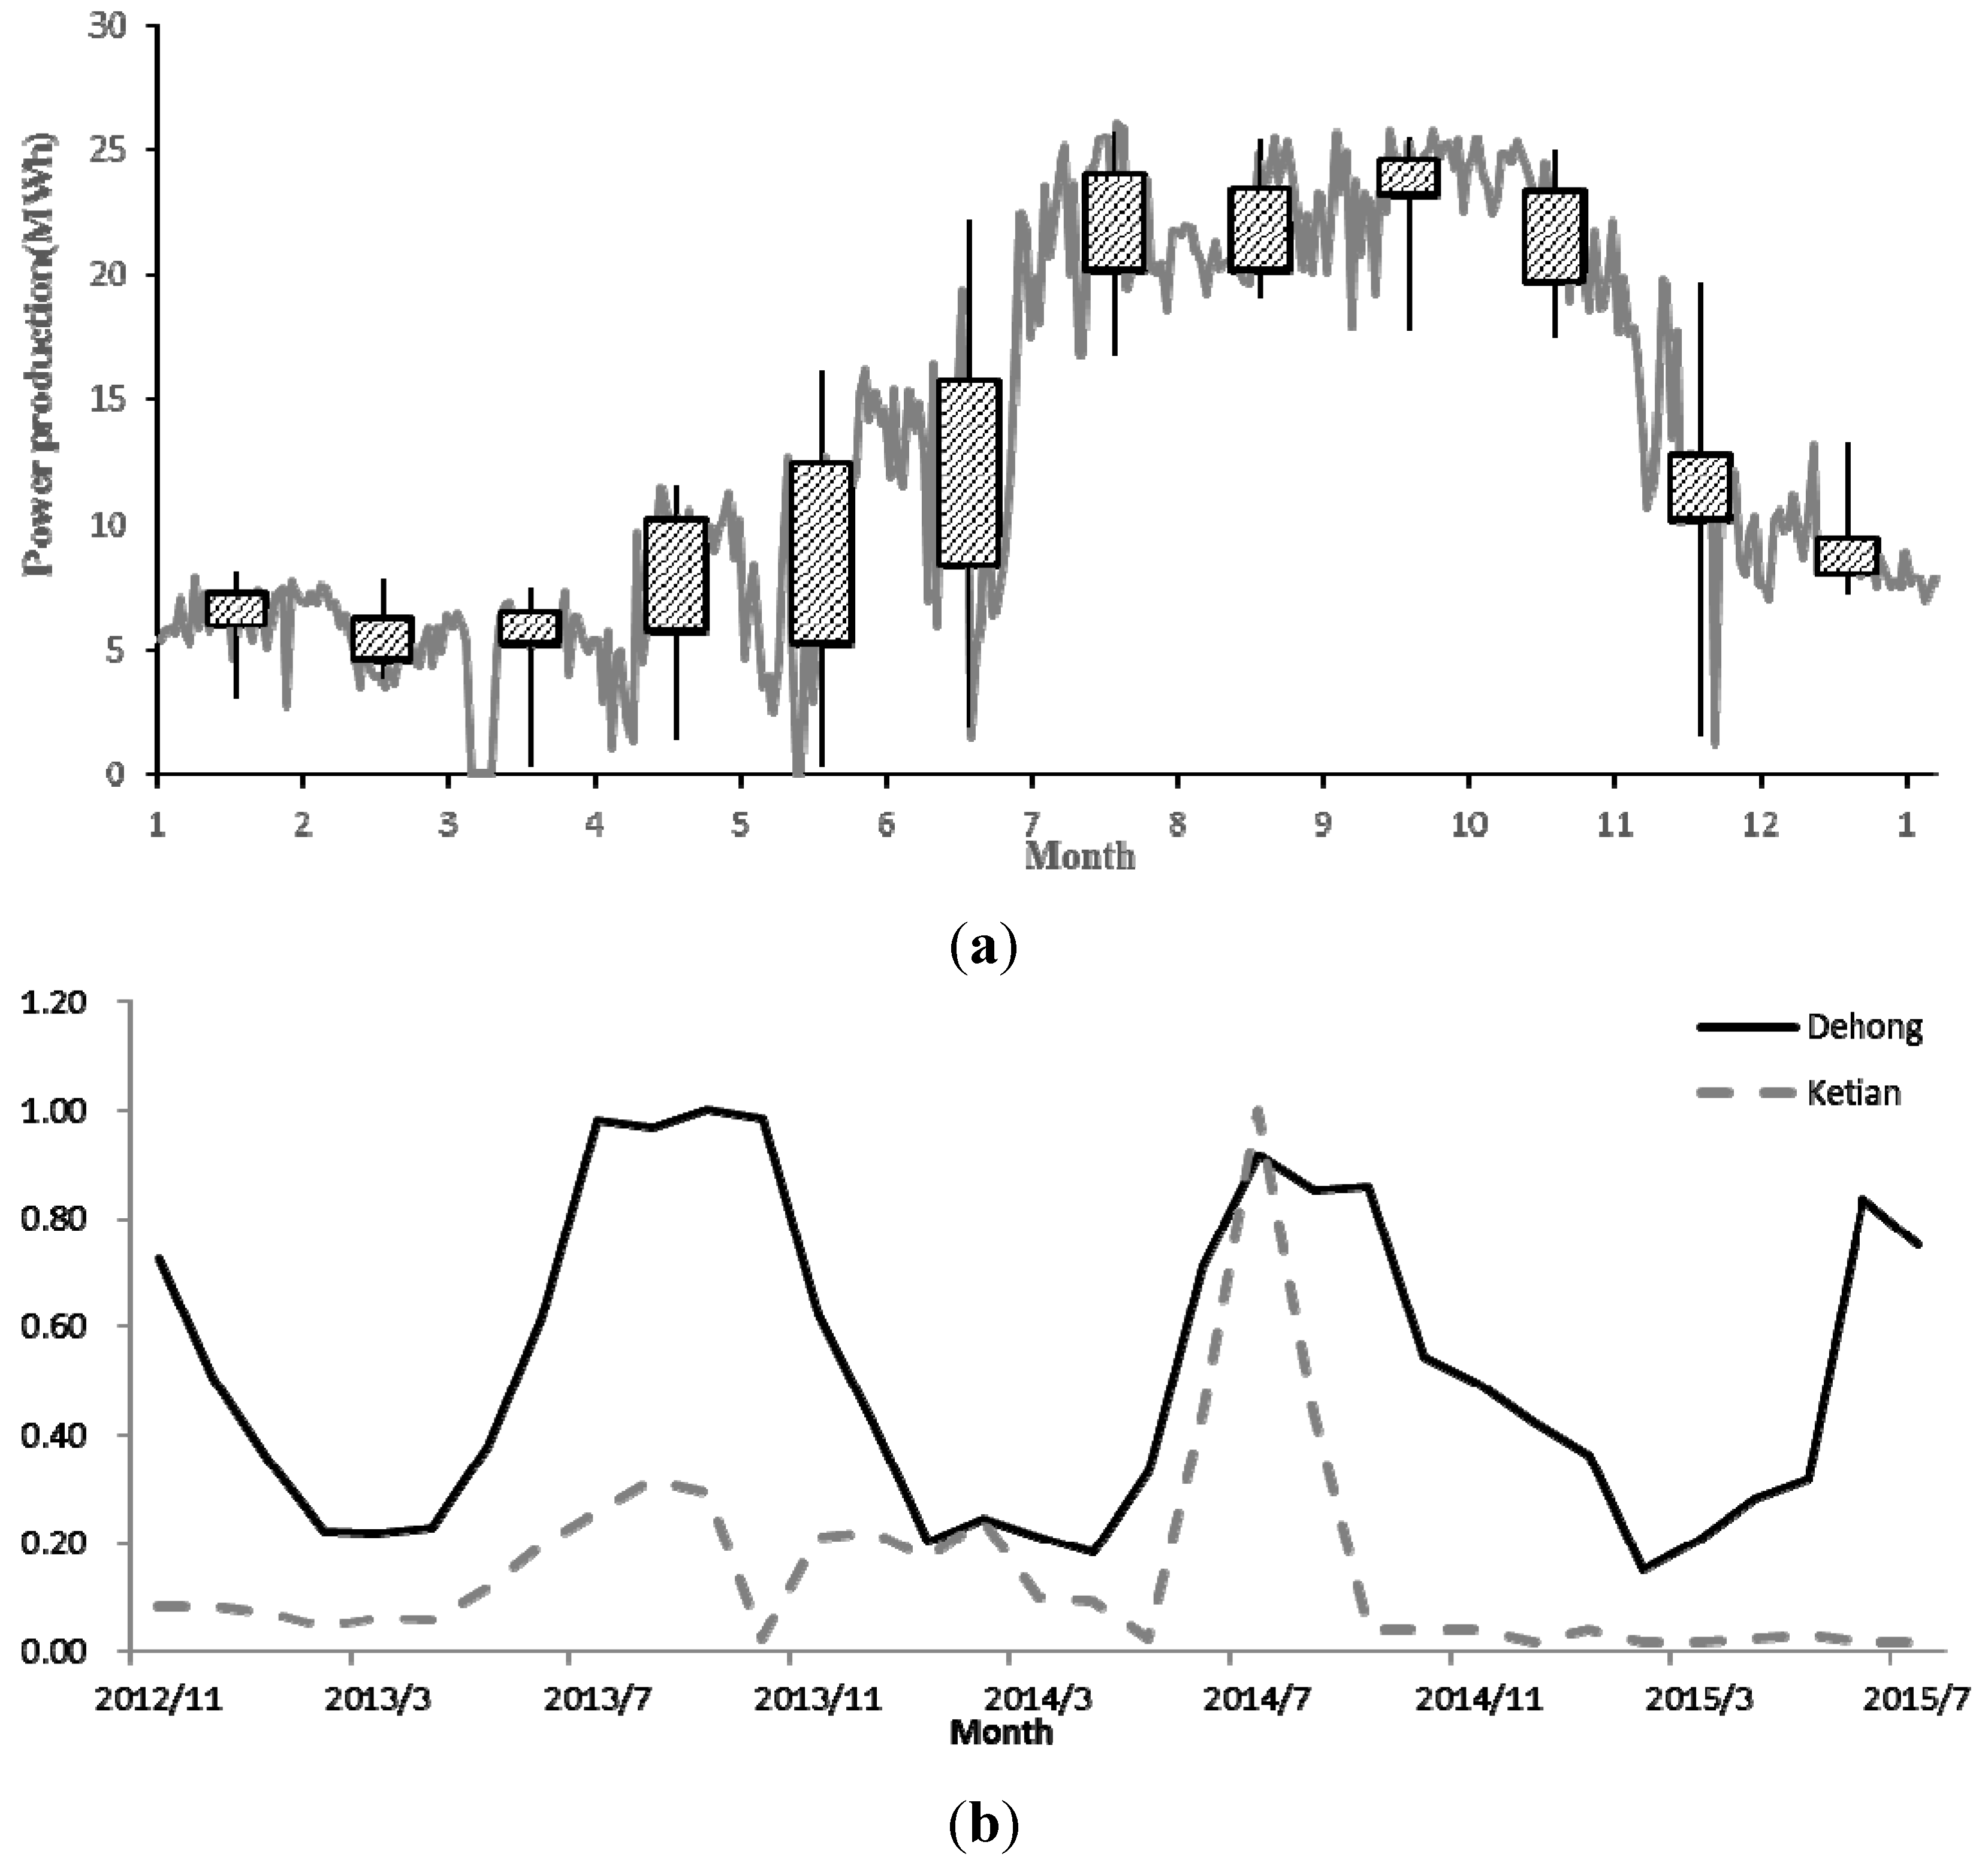
Figure 1 shows the power production of a single SHP plant and the total generation from 75 SHP plants in the region each month in 2013. In this figure, the box shaped diagrams are used to represent the data dispersion degree. It is obvious that the box-shaped diagrams of a single plant have apparently longer “tentacles” than that of the overall region integrity. This suggests that power production in the sequence of a single plant has more outliers, stronger randomness and greater fluctuation.
Figure 1.
Power production curve and its box plot of a single small hydropower (SHP) plant and SHP plants in a county. (a) Power production and box plot of a single SHP plant; (b) Power production and box plot of SHP plants in county.
Figure 1.
Power production curve and its box plot of a single small hydropower (SHP) plant and SHP plants in a county. (a) Power production and box plot of a single SHP plant; (b) Power production and box plot of SHP plants in county.
2.2. Spatial Differences
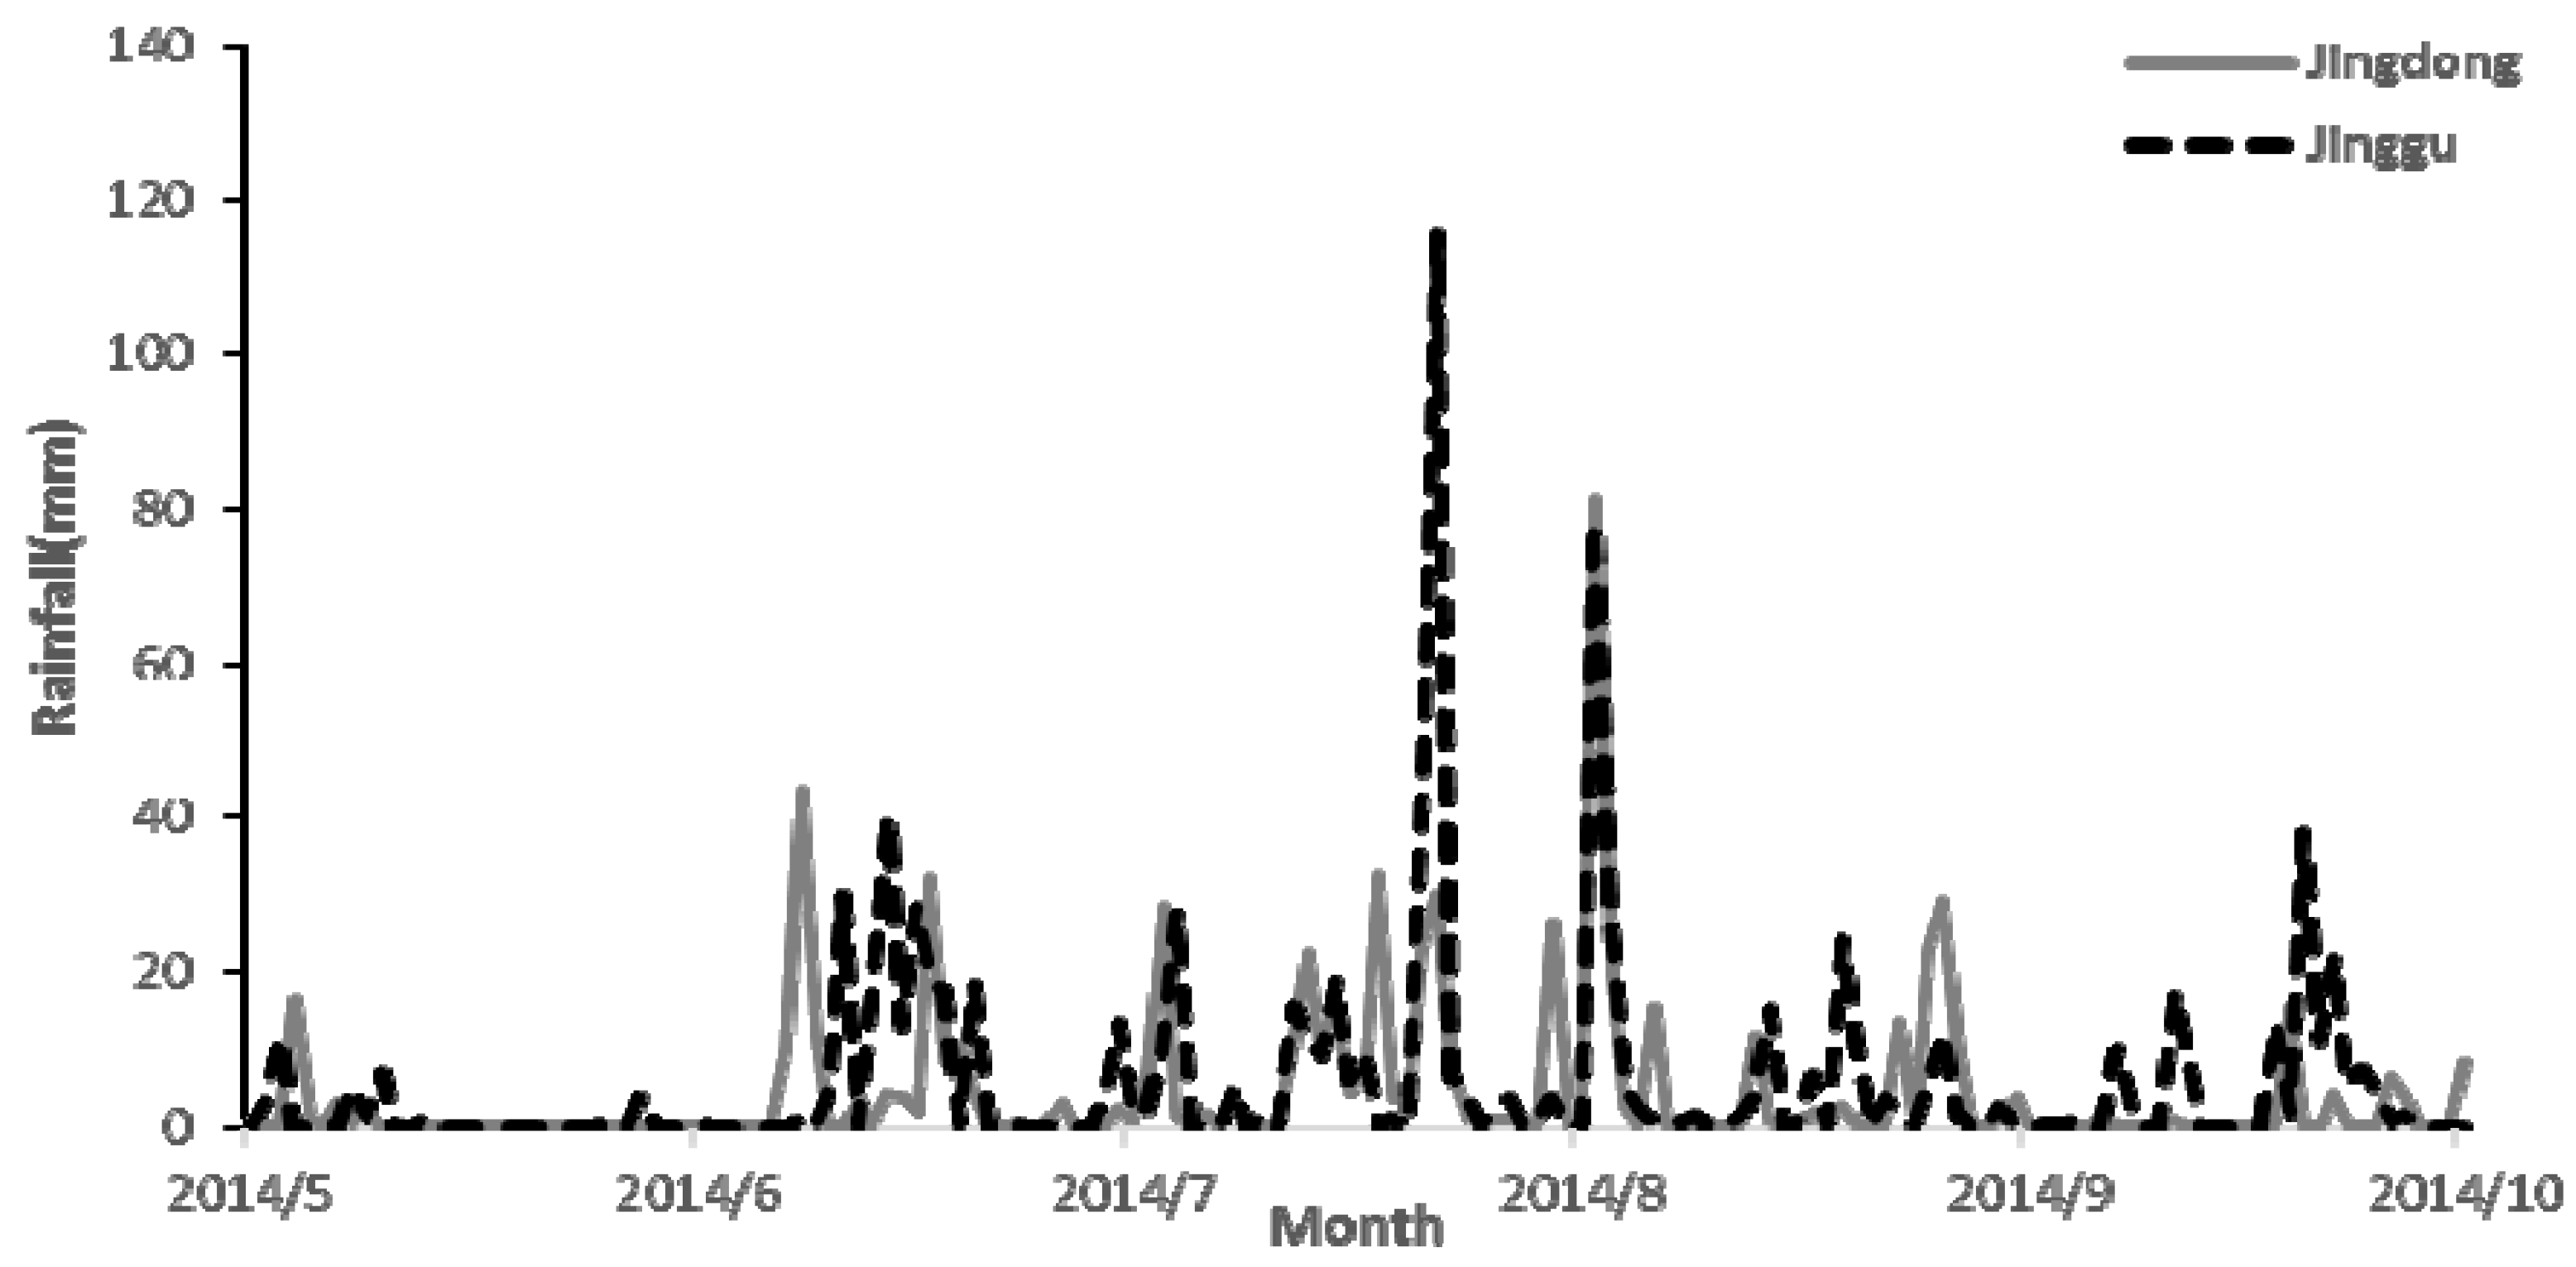
SHP plants are mostly concentrated in remote mountain areas and small watersheds. Because each plant has different topography and landforms, the power production presents spatial differences. Taking Yunnan Province as an example, the climate condition has significant spatial differences that make meteorological phenomena unique, as in the old saying, “A mountain is divided into four seasons; 10 miles have different types of weather.” For example, Jingdong and Jinggu are two adjacent counties located north of Puer district, the daily rainfall of which is shown in
Figure 2. However, significant differences in rainfall and runoff formation occur because of Wuliang Mountain, Ailao Mountain and other mountains in this area, which results in spatial differences of power production of SHP plants.
Figure 2.
Rainfall curves of Jingdong and Jinggu during the flood season.
Figure 2.
Rainfall curves of Jingdong and Jinggu during the flood season.
2.3. Similarity of Regions
SHP plants in the same region have some similarities in terms of hydrological and meteorological conditions. As shown in
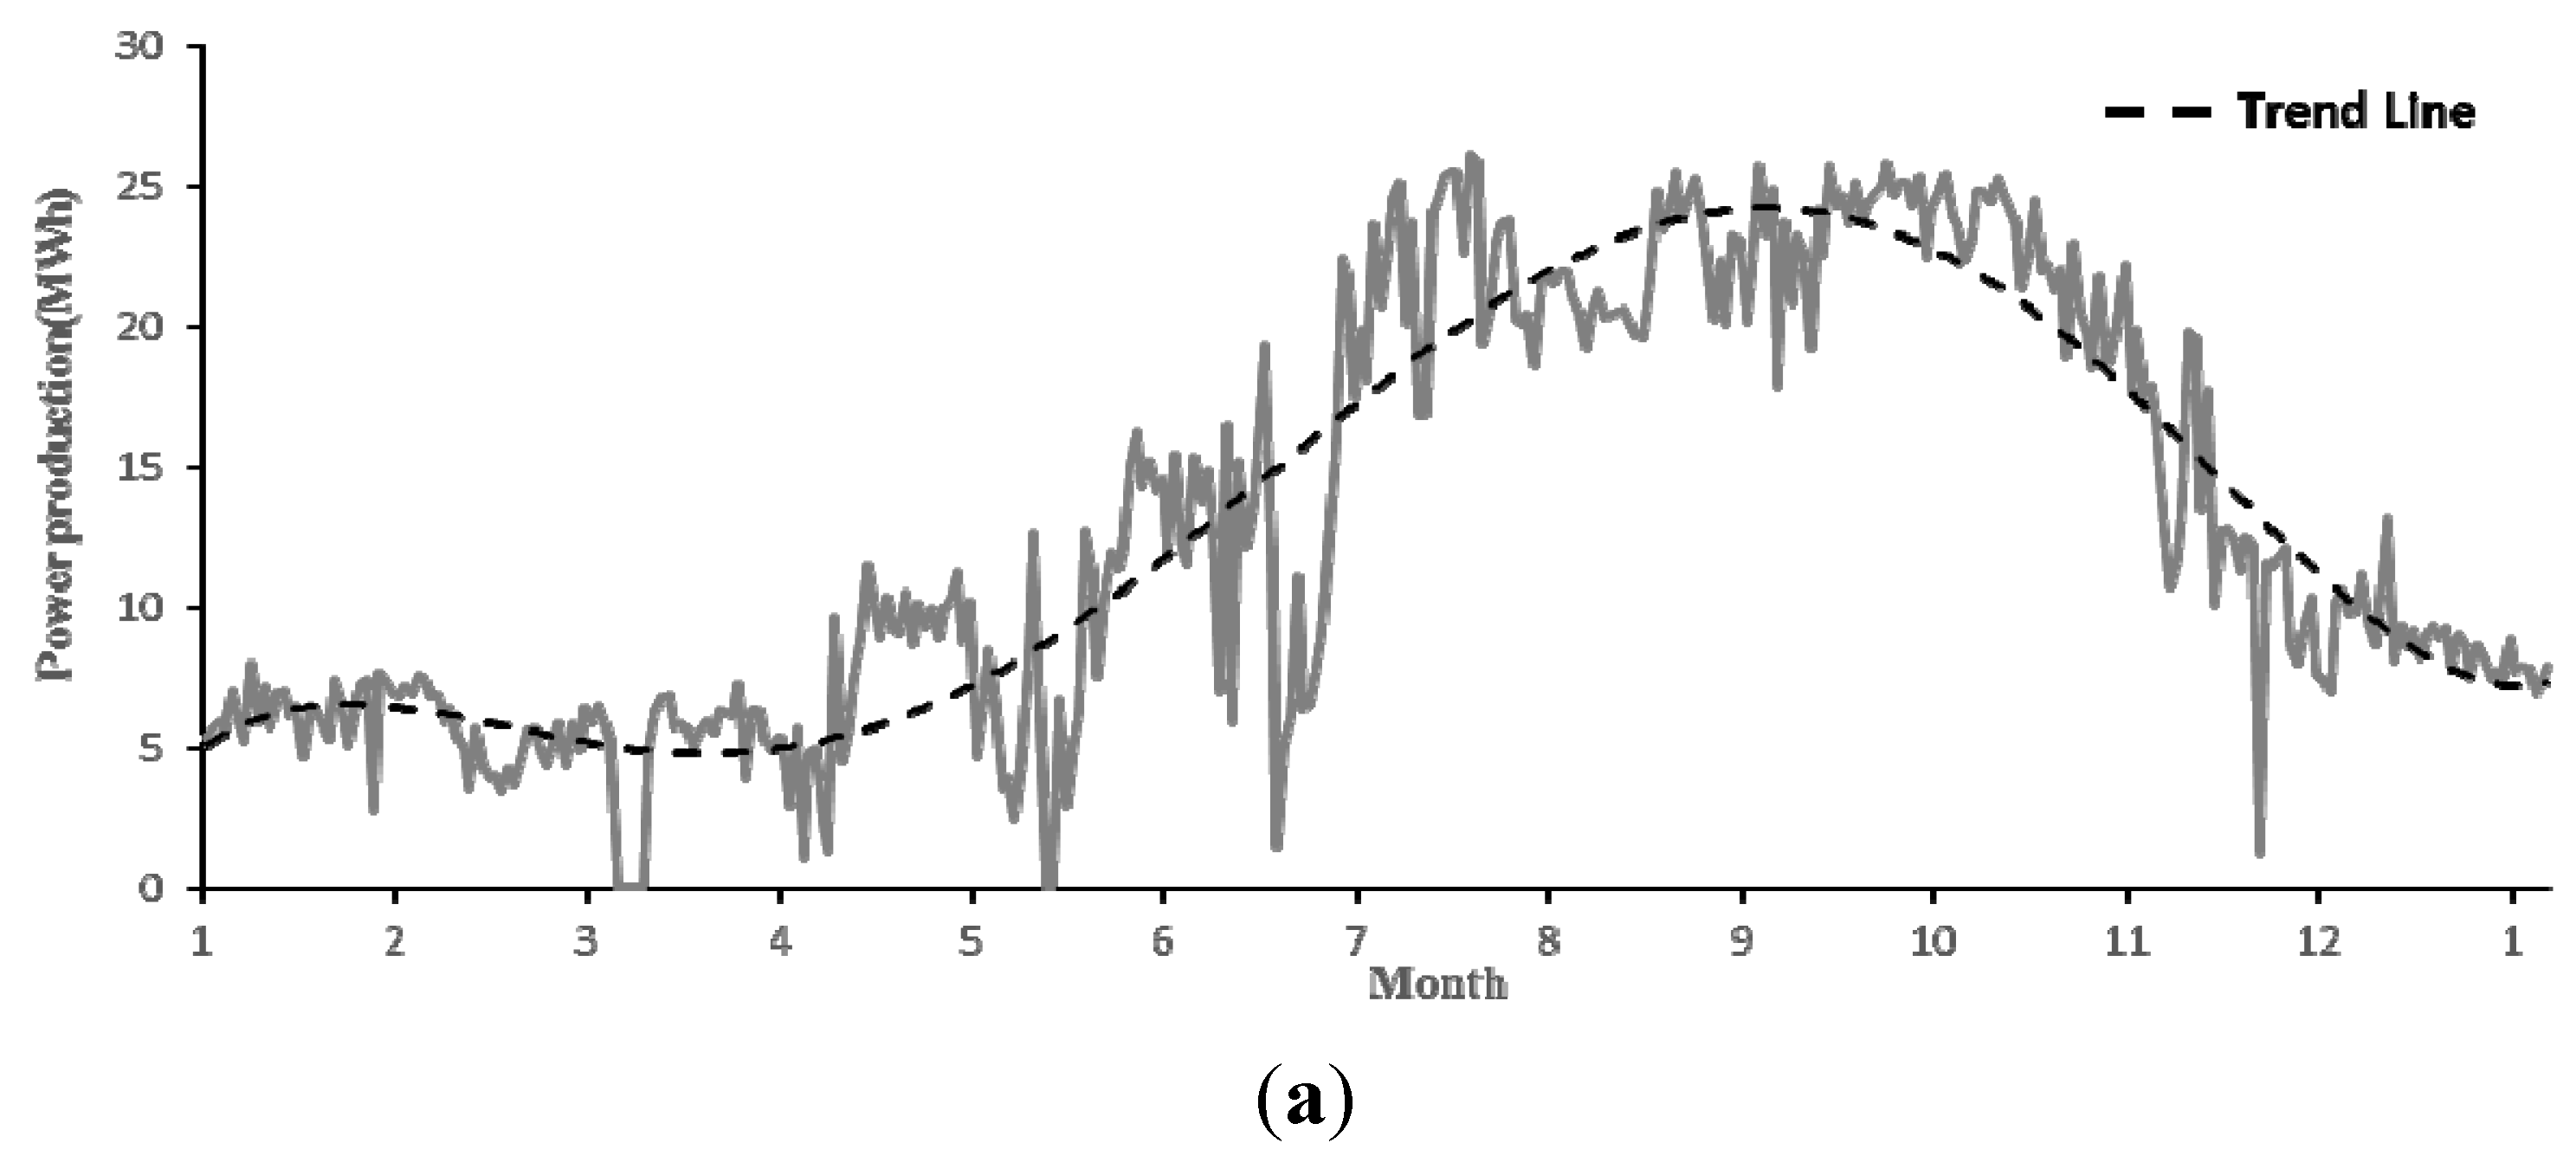
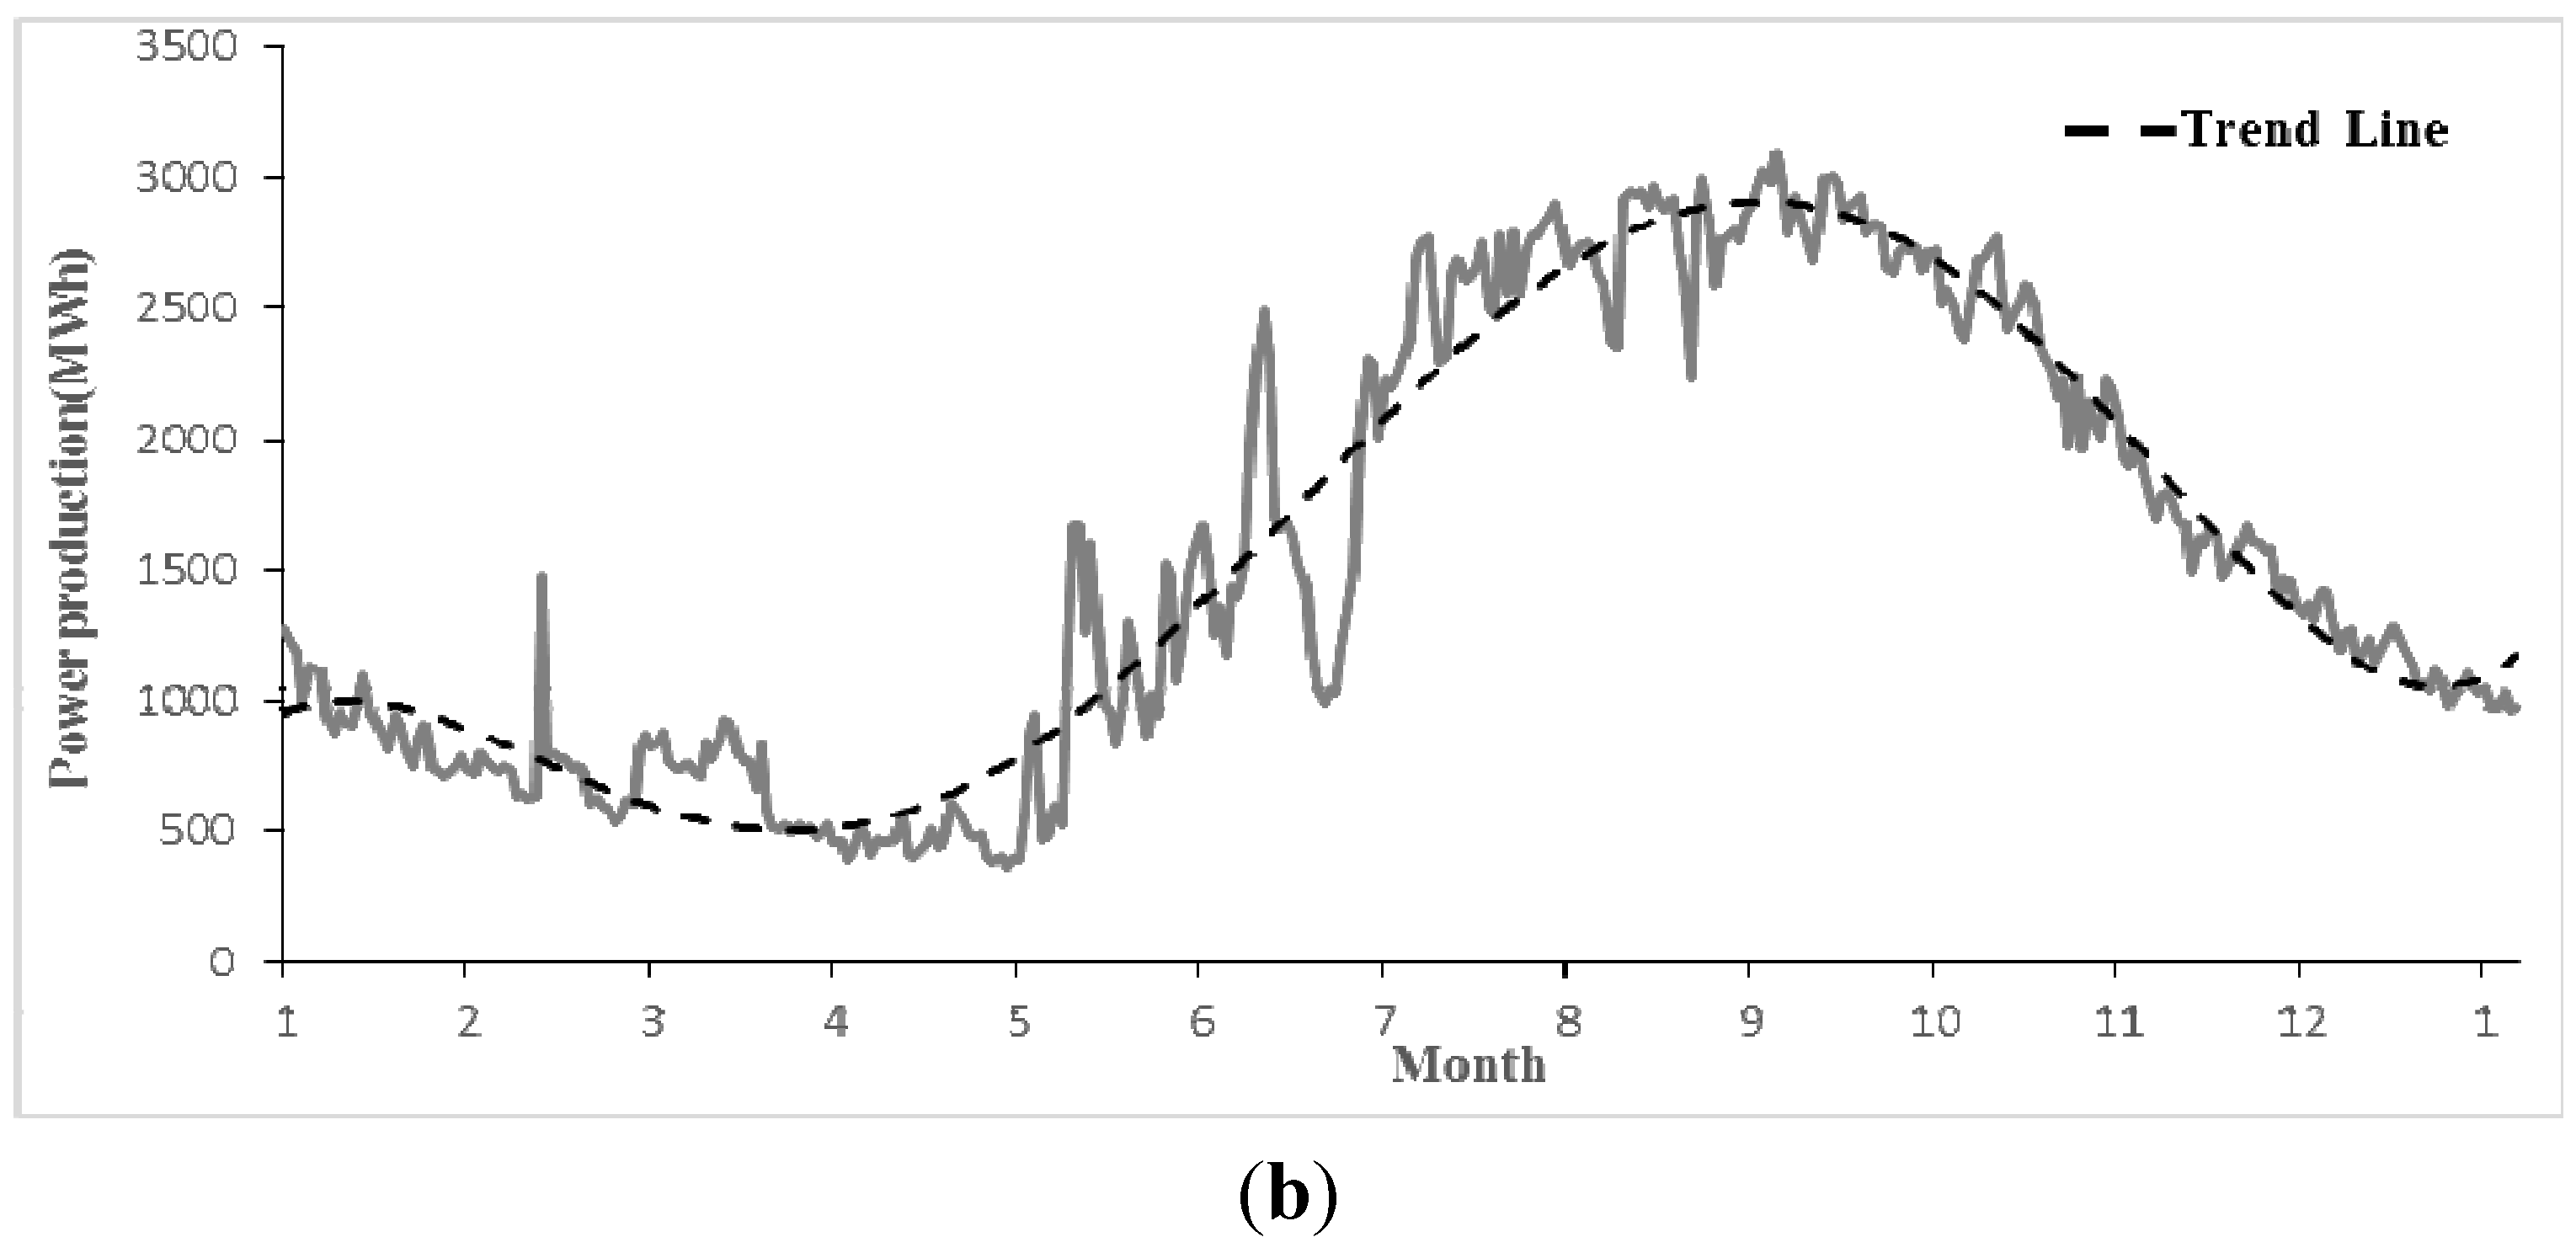
Figure 3, the generation data are different in terms of the degree of smoothing between a single SHP plant and all of the SHP plants in the same region. However, the change trend of generation data during the year is essentially the same as the two-trend line shown in
Figure 3. In other words, there is a similarity between the single SHP plant and the regional integrity.
Figure 3.
Power production curve and its tread line of SHP plant (a) Monthly power production and trend line of single SHP plant; (b) Monthly power production and trend line of SHP plants in county.
Figure 3.
Power production curve and its tread line of SHP plant (a) Monthly power production and trend line of single SHP plant; (b) Monthly power production and trend line of SHP plants in county.
Overall, the power production of SHP plants has spatiotemporal characteristics such as randomness, spatial differences and regional similarity, which can provide strategy support for this paper in developing the forecasting method based on the correlation between the LHP plant and SHP plants.
3. Forecasting Method for Long-Term Power Production of SHP Plants
3.1. Selection of the Correlation Factor
LHP plants predictions are usually dependent on water level and flow (inflow or interval flow). These hydrological factors can form a set of candidate factors for the correlation analysis method. The significantly related factors of power production of SHP should be screened out before establishing the correlation analysis model.
The power production of an SHP plant is directly contributed by the reservoir inflow because most SHP plants are run-off river plants. The geographical and hydrological conditions of SHP plants are similar to that of LHP plant in the same region or neighborhood. SHP plants are usually located at different levels along tributaries. According to the Strahler classification of River Law, the power discharge generated by the SHP plants will flow into the mainstream where LHP plants are usually located. Thus, the interval flow of a set of candidate factors of LHP plants can reflect the runoff in the region where SHP plants are located, and there must be some correlationship between the interval flow of LHP plants and the power production of SHP plants in the same region. Then the correlativity of LHP and SHP in the region can be established. In addition, we had tried to analyze the correlation between the power production of SHP plants and other factors of LHP plants, such as water level, inflow and power generation. The inflow or release from LHP in the cascade hydropower plants is significantly influenced by human impact, which cannot reflect the natural runoff of SHP. Therefore, there is no correlation with the factors except for the interval flow.
From the above-mentioned facts, the interval flow of LHP plant is selected as the related factor to perform the correlation analysis in this paper.
3.2. Correlation Analysis of LHP and SHP
The statistician Karl Pearson designed a statistical index, the correlation coefficient, to reflect the intimate level between variables [
24]. This paper utilizes the correlation coefficient to indicate the correlation between interval inflow of LHP plants and power production of SHP plants.
As mentioned in
Section 2, the power production of the SHP plants in a region is expressed as:
where
is the power production of all SHP plants in month
m (MWh).
is the power production of the
ith SHP plant in month
m (MWh), and
s is the number of SHP plants in month
m.
Considering dynamic operations and the constant changes of the installed capacity, the monthly utilization hour of the SHP plant is used to replace the power production in analyzing the correlation. The monthly utilization hour is as follows:
where
is the installed capacity of SHP plants in month
m (MW).
The correlation coefficient (
R) can be calculated using Equation (3).
R is between –1 and 1. The larger the absolute value is, the more significant the correlation is:
In the above equation, is the monthly utilization hour of the SHP plants in month j (h). is the average value of monthly utilization hour (h). is the interval flow of LHP plants in month j (m3/s). is the average value of monthly interval flow (m3/s). n is the size of sample data.
3.3. Correlation Validation
The probability density function of R between two uncorrelated variables X and Y is:
The equation is transformed as:
Based on Equation (5), the critical value of
R can be obtained as follows:
Thus,
where
is the correlation coefficient of LHP and SHP plants at the level of
a. By using this method, the LHP plant, which is significantly correlated, can be screened out.
3.4. Regression Model of the Power Production Forecast
To forecast the power production of SHP plants in a region, the LHP plant, which is significantly correlated to it, can be selected. Then a regression model is built to analyze the correlation between LHP and SHP. If the correlation is significant, it will be presented by a linear relationship between the LHP and SHP plants, in which the interval flow of LHP is the independent variable and the monthly utilization hours of SHP is the dependent variable. The linear regression model is built as follows:
where
is the forecast value of monthly utilization hours of SHP plants (h).
is the forecast value of monthly interval flow of LHP (m
3/s).
a and
b are the regression coefficients.
The forecast value of power production
can be calculated.
4. Case Study
The SHP plants in Yunnan Province, China, were taken as a case study. The river system of Yunnan province has been well developed, including six river systems: Yangtze River, Pearl River, Red River, Lancangjiang River, Nujiang River, and Irrawaddy River. A considerable number of LHP plants with long historical operation data exist; therefore, Yunnan province has suitable conditions for the correlation analysis of LHP and SHP plants. The hydropower dispatching automation system has been established for many years in the Yunnan Power Grid, which involves many of the classical and intelligent prediction models. By continually modifying the model parameters using real-time observed data, accurate forecasting results of the interval inflow of the LHP plant can be obtained. Therefore, the forecasted interval inflow values of the LHP plant, which are used in the forecasting process, will be obtained from the system.
In this section, the correlation between LHP and SHP plants at different scales (i.e., the district scale and the county scale) was analyzed, and then the power production of SHP plants was forecasted.
4.1. Correlation Analysis of SHP Plants in a District
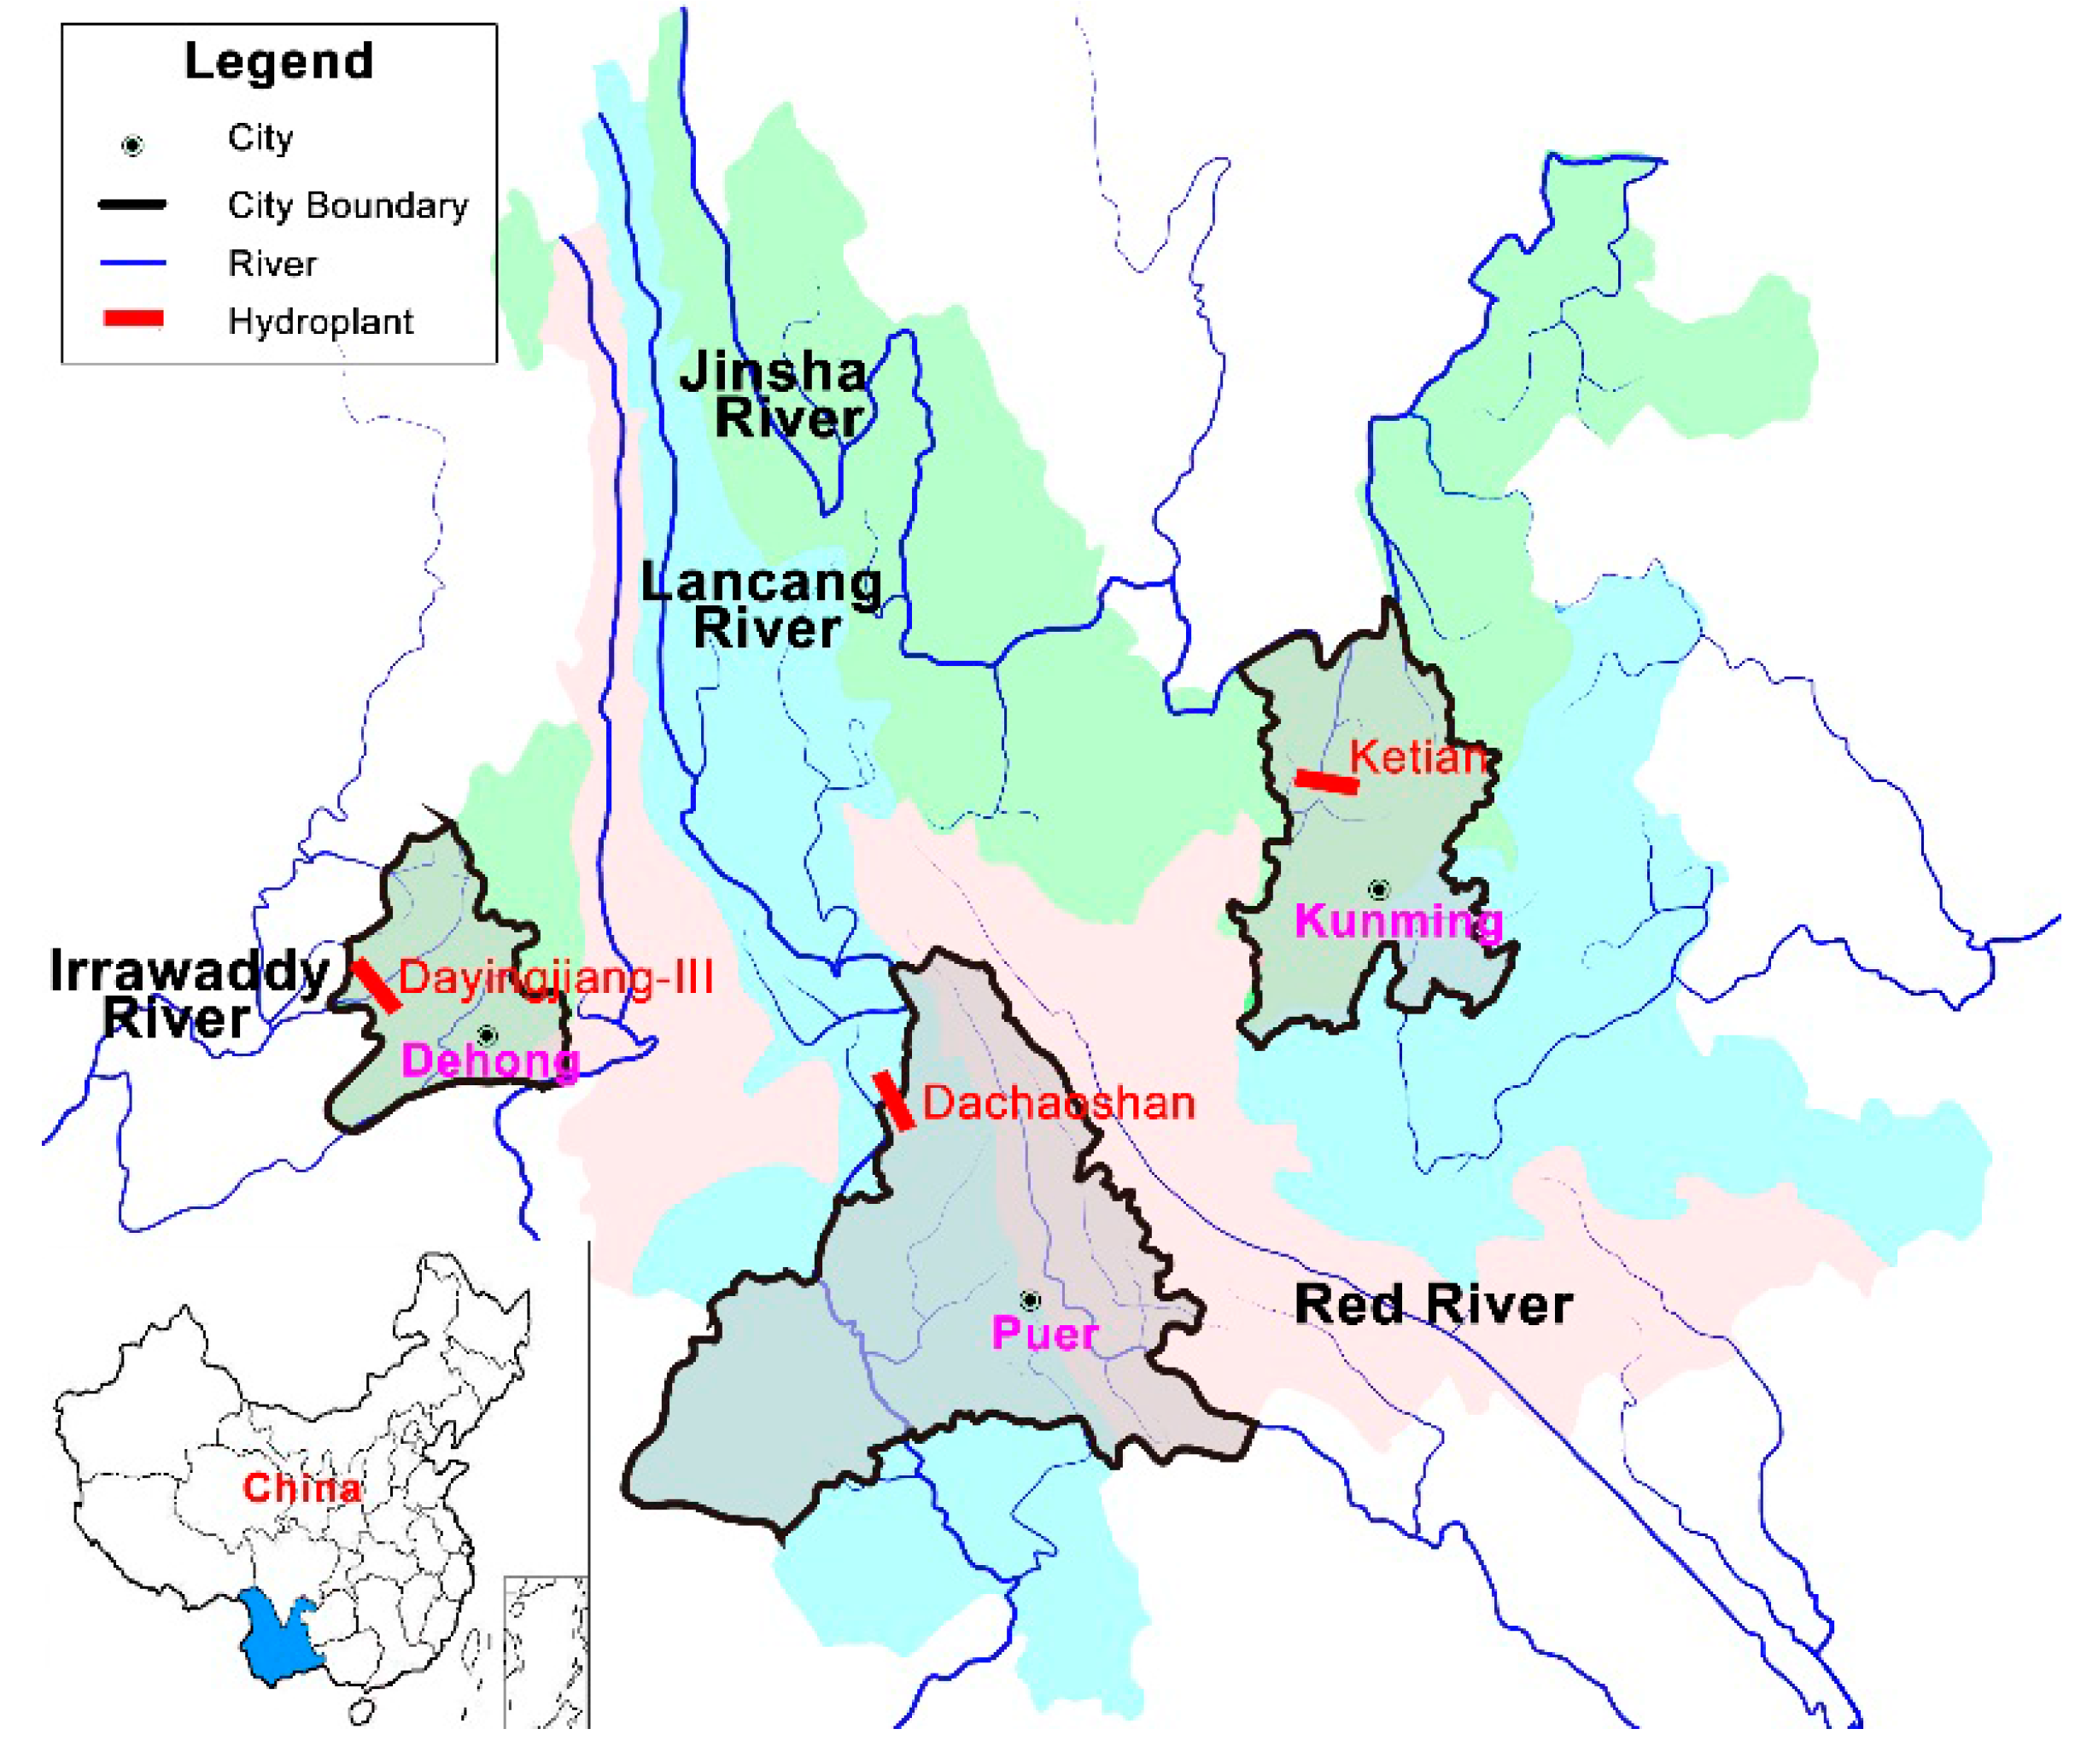
To demonstrate the correlation between SHP plants of district dispatch and the LHP plant, three districts that belonged to different basins were selected as typical examples: Dehong, Puer and Kunming (
Figure 4). Yunnan is a low latitude region with a monsoonal climate and a plateau mountain, which leads to a significant difference between different districts and significant vertical variation. The Dehong district is located in western Yunnan and belongs to the Irrawaddy Basin; it contains several LHP plants, such as the cascade hydropower station of Dayingjiang River, Nongling Station, and Longjiang Station. The Puer district is located in southwestern Yunnan and contains Dachaoshan Station and Nuozhadu Station in Lancangjiang River Basin, and Jufudu Station and Gelantan Station in the Red River Basin. The Kunming district is located in central Yunnan and belongs to the Yangtze River Basin, which contains Ketian Station. Dayingjiang III station, Dachaoshan station and Ketian station are selected as reference stations in this section.
Figure 4.
Map of typical basins, prefectures and large-medium hydropower (LHP) plants in Yunnan Province.
Figure 4.
Map of typical basins, prefectures and large-medium hydropower (LHP) plants in Yunnan Province.
The data sequence of the interval flow of the LHP plant and the power production of the SHP plants was selected from November 2012 to July 2015. The correlation between the SHP plants of the three districts and the LHP plant in the same district was analyzed based on Equations (1) to (3), and the significance was tested based on Equations (4) to (6).
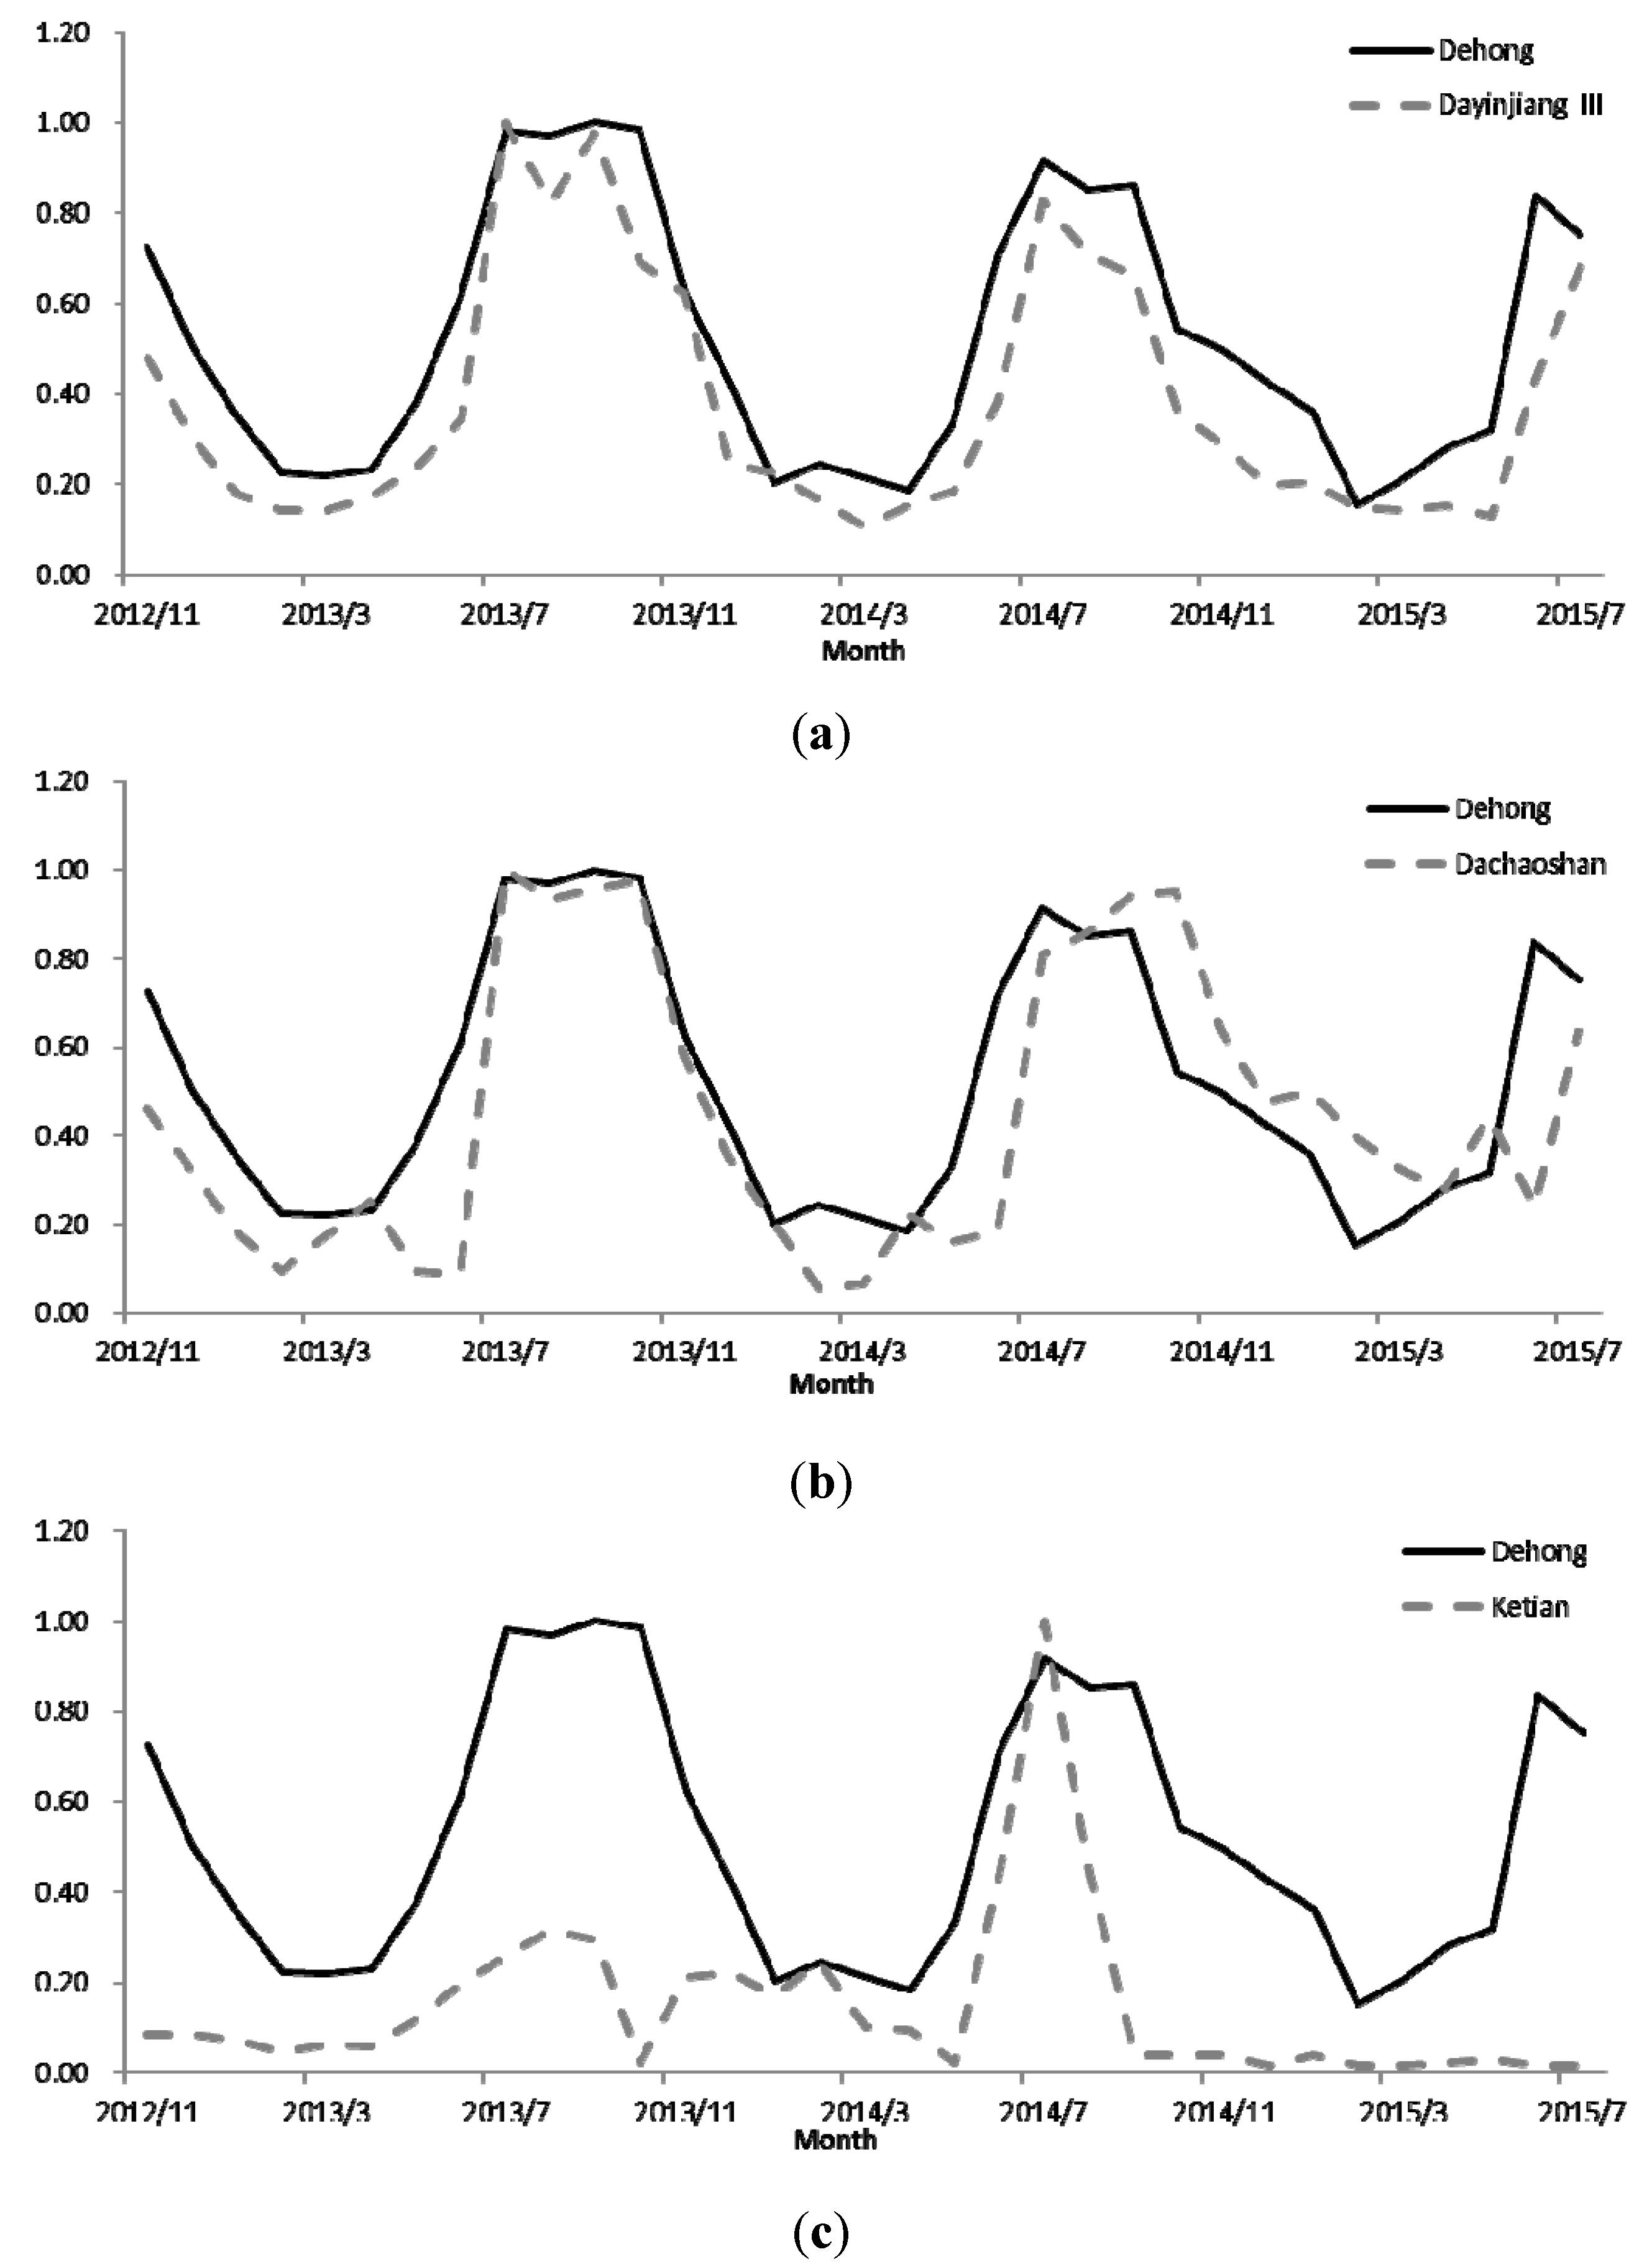
Table 1 shows the correlation coefficient between the LHP plant and the SHP plants. The SHP plants in Dehong have the most significant correlation with the Dayingjiang III plant, with a correlation coefficient of 0.94. These plants also have correlation coefficients of 0.77 with the Dachaoshan plant located in the Lancangjiang Basin and 0.46 with the Ketian plant located in the Yangtze Basin. Both of these plants are located far away from Dehong.
Figure 5 shows the normalized trend graphs of the power production of SHP plants in Dehong district and the interval flow of the three LHP plants. It can easily be seen that the more significant the correlation is, the more similar the trend of SHP and LHP is. The correlation of SHP plants in Puer and Kunming districts also have similar regularity. From the result of
Table 1, the LHP plants that are correlated to the SHP plants in Puer and Kunming districts respectively are Dachaoshan plant, with a correlation coefficient of 0.92 and Ketian plant with 0.89.
Table 1.
The correlation coefficient between SHP and LHP plants in a district.
Table 1.
The correlation coefficient between SHP and LHP plants in a district.
| LHP Plant\District | Dehong | Puer | Kunming |
|---|
| Dayingjiang III | 0.94 ** | 0.81 ** | 0.82 ** |
| Dachaoshan | 0.77 ** | 0.92 ** | 0.75 ** |
| Ketian | 0.46 * | 0.39 | 0.89 ** |
Figure 5.
Normalized trend of power production of SHP plants in Dehong and interval flow of the LHP plant. (a) Trend Chart of SHP plants in Dehong and Dayingjiang III hydropower plant; (b) Trend Chart of SHP plants in Dehong and Dachaoshan hydropower plant; (c) Trend Chart of SHP plants in Dehong and Ketian hydropower plant.
Several regularities of the correlation between SHP plants in a district and the LHP plant can be concluded as follows:
(1) A correlation exists between the power production of SHP plants in a district and the interval flow of the LHP plant.
(2) The power production of SHP plants shows significant correlation with the LHP plant of the same basin, whereas the correlation with the LHP plant in other basins is not significant.
(3) As the power production of SHP plants shows spatial differences, the further the distance in space is, the less significant the correlation relationship is.
4.2. Correlation Analysis of SHP Plants in a County
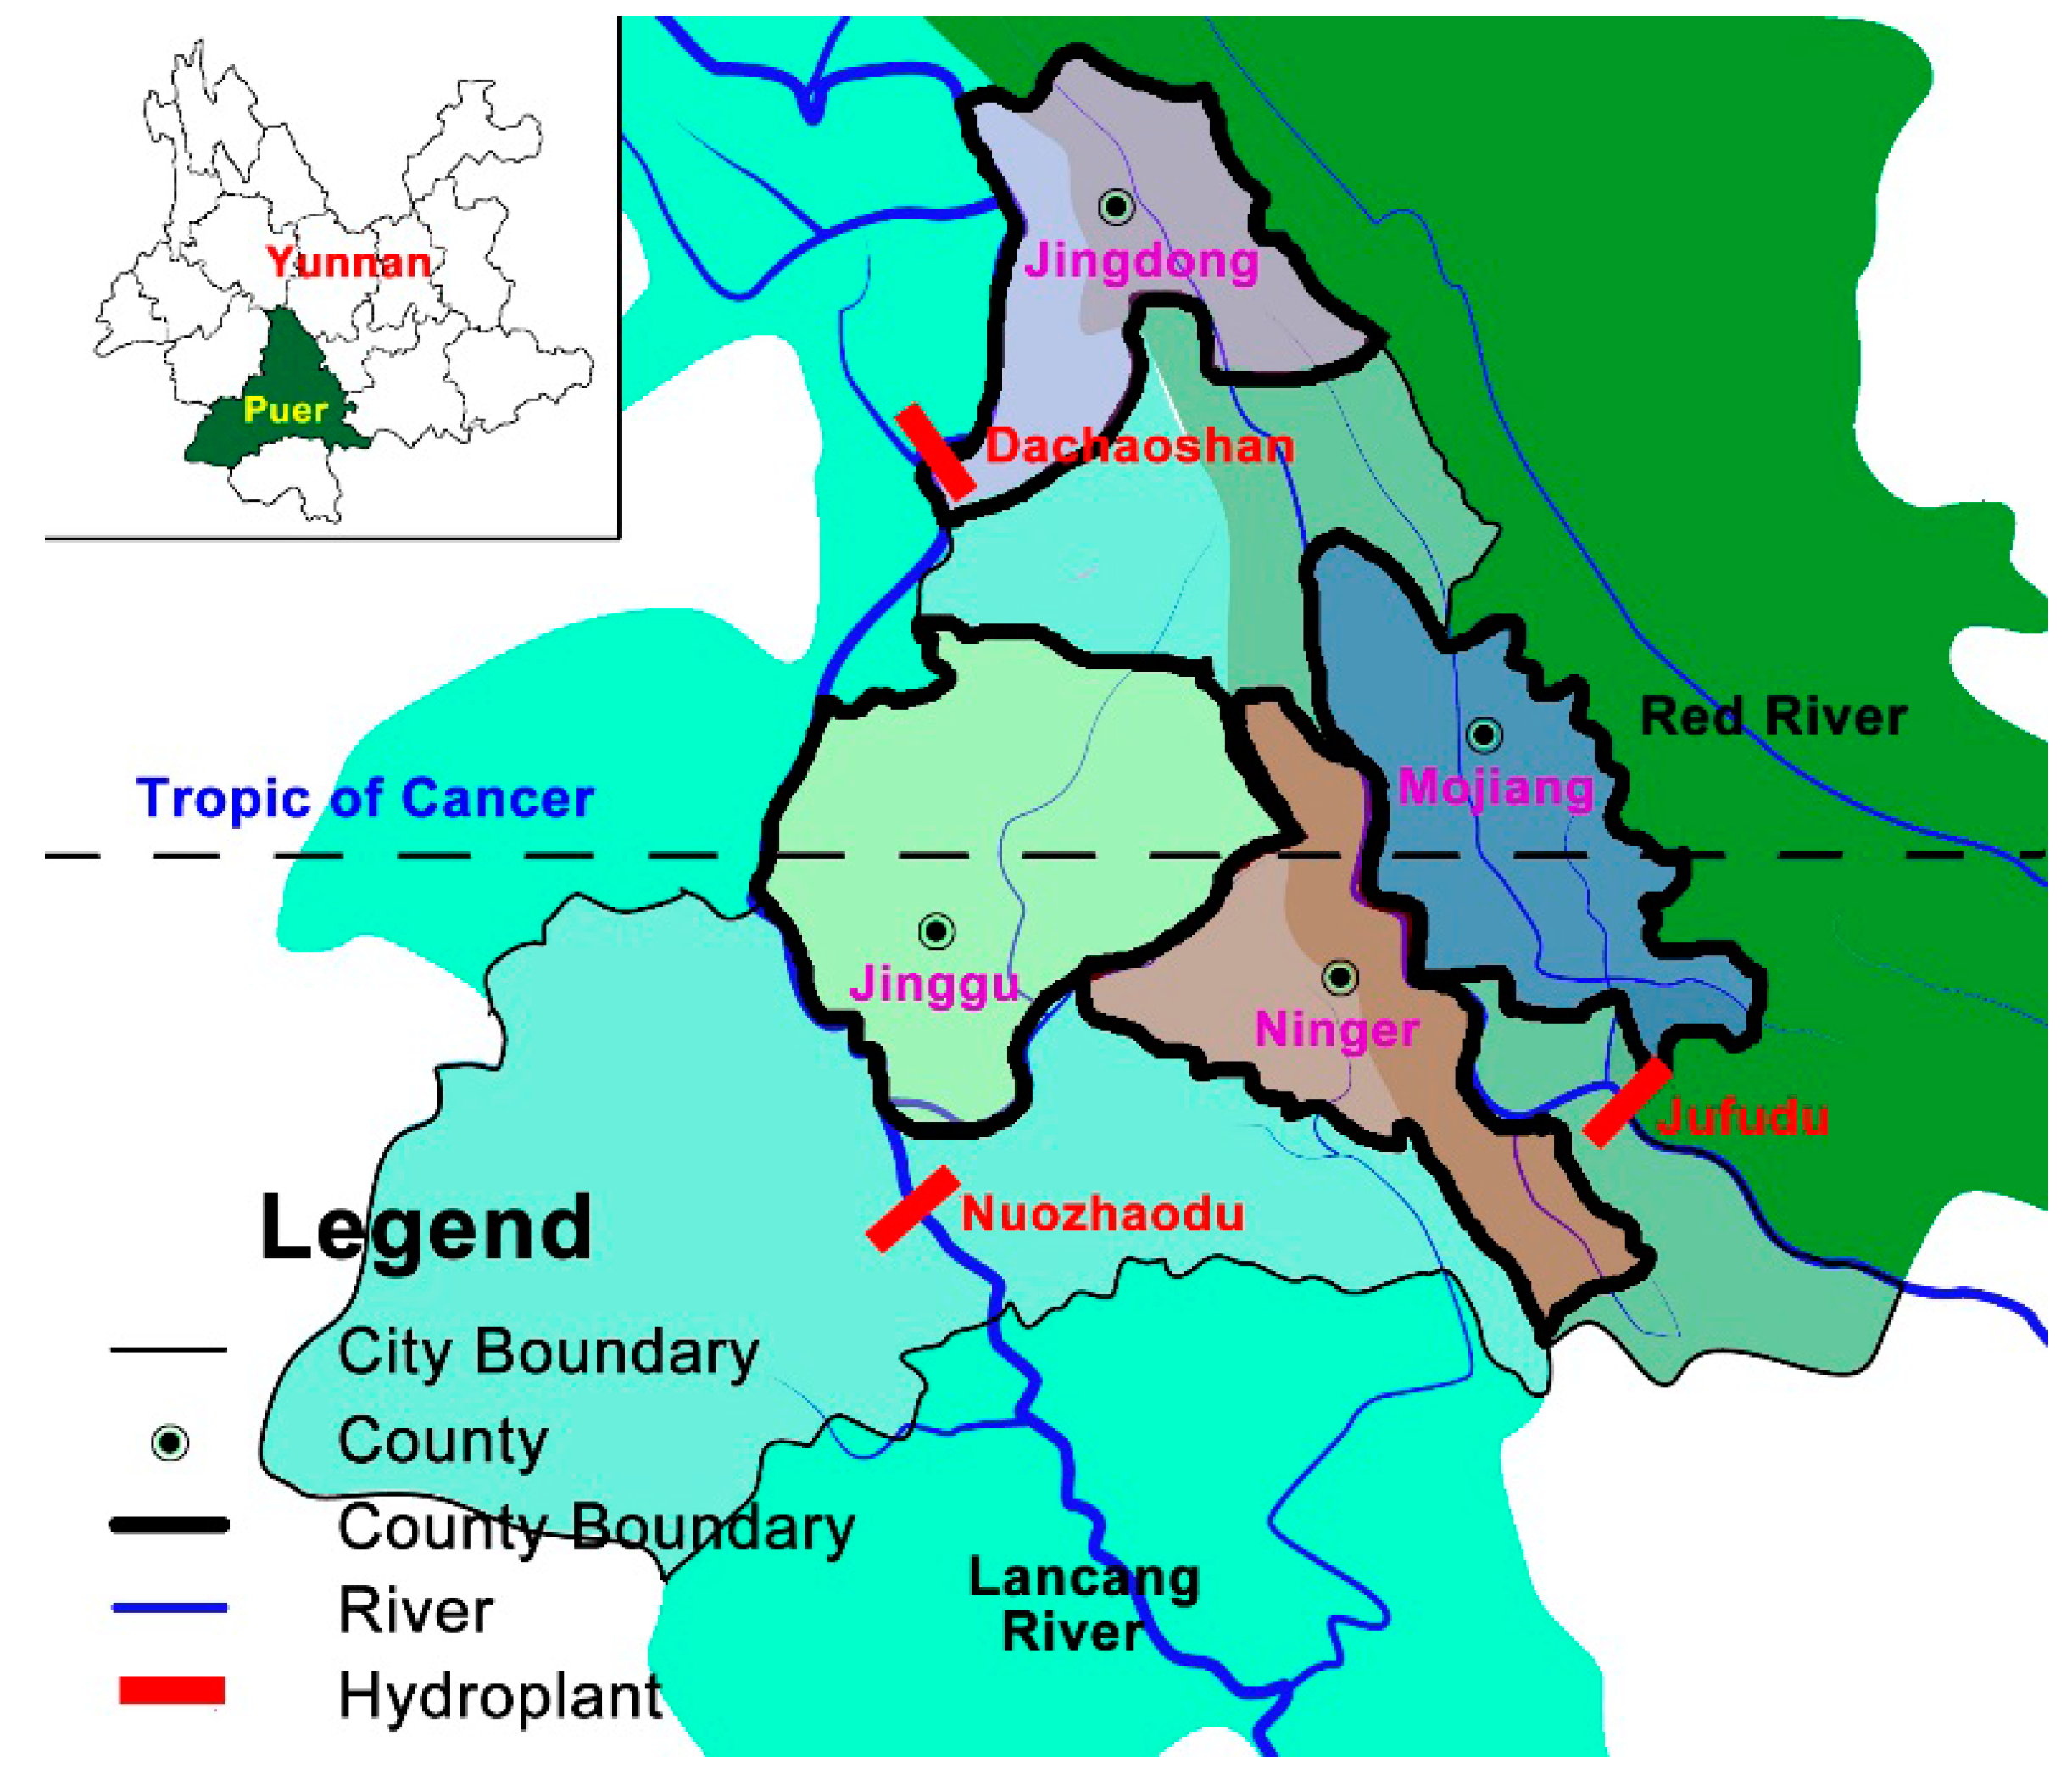
To demonstrate the correlation between SHP and LHP plants in a county, Puer was selected as an example, as two river basins flow into this region (
Figure 6). Puer is located in southwestern Yunnan and is affected by subtropical monsoon climate, with mountainous area accounting for 98.3% of the total areas, and the Tropic of Cancer pass through its center. Affected by terrain and altitude, the vertical differences in Puer are obvious. Separated by Mount Wuliang, the eastern region of Puer is the Red-River Basin and the western region is the Lancangjiang Basin. In this section four counties were chosen as examples: Jingdong, Jinggu, Ninger and Mojiang.
Figure 6.
Map of typical basins, counties and LHP plants in Puer county.
Figure 6.
Map of typical basins, counties and LHP plants in Puer county.
Figure 6 shows that Jingdong and Ninger are located at the borderline of the two basins, Jinggu is located in Lancangjiang Basin, and Mojiang is located along a branch of the Red River. The data sequence of the interval flow of the LHP plant and the power production of SHP plants was selected from November 2012 to July 2015. The correlation between SHP plants in the three counties and the LHP plant are analyzed, and the significance of the correlation is tested.
Table 2 shows the correlation coefficient between the LHP and SHP plants. All of the SHP plants in a given county are significantly correlated with the LHP plant at the 0.01 confidence level, but the degree of significance varies obviously. From the results, it can be seen that the LHP plant that are correalted to the SHP plants in Jingdong and Jinggu county is Dachaoshan plant with a correlation coefficient of 0.92 and 0.84. The Ninger county is Nuozhadu plant with 0.93 and the Mojiang county is Jufudu plant with 0.85.
The regularity of the correlation between the SHP plants in a county and the LHP plant can be concluded as follows:
(1) As well as in district, there exists correlation between SHP plants and LHP plant in county. The degree of the correlation is associated with spatial distance.
(2) The correlation between SHP plants in a county and the LHP plant has similar regularity with the district correlation. Influenced by the river basin, SHP plants in different counties have differences in terms of correlation to the LHP plant.
(3) As the power production of SHP plants shows similarity of regions, the difference of the correlation in different counties (maybe in the same district) is less than that in different districts.
Table 2.
The correlation coefficients between SHP plants in a county and the LHP plant.
Table 2.
The correlation coefficients between SHP plants in a county and the LHP plant.
| LHP Plant\County | Jingdong | Jinggu | Ninger | Mojiang |
|---|
| Dachaoshan | 0.92 ** | 0.84 ** | 0.90 ** | 0.75 ** |
| Nuozhadu | 0.91 ** | 0.81 ** | 0.93 ** | 0.81 ** |
| Jufudu | 0.70 ** | 0.76 ** | 0.90 ** | 0.85 ** |
4.3. Forecast Results of the Correlation Analysis Method
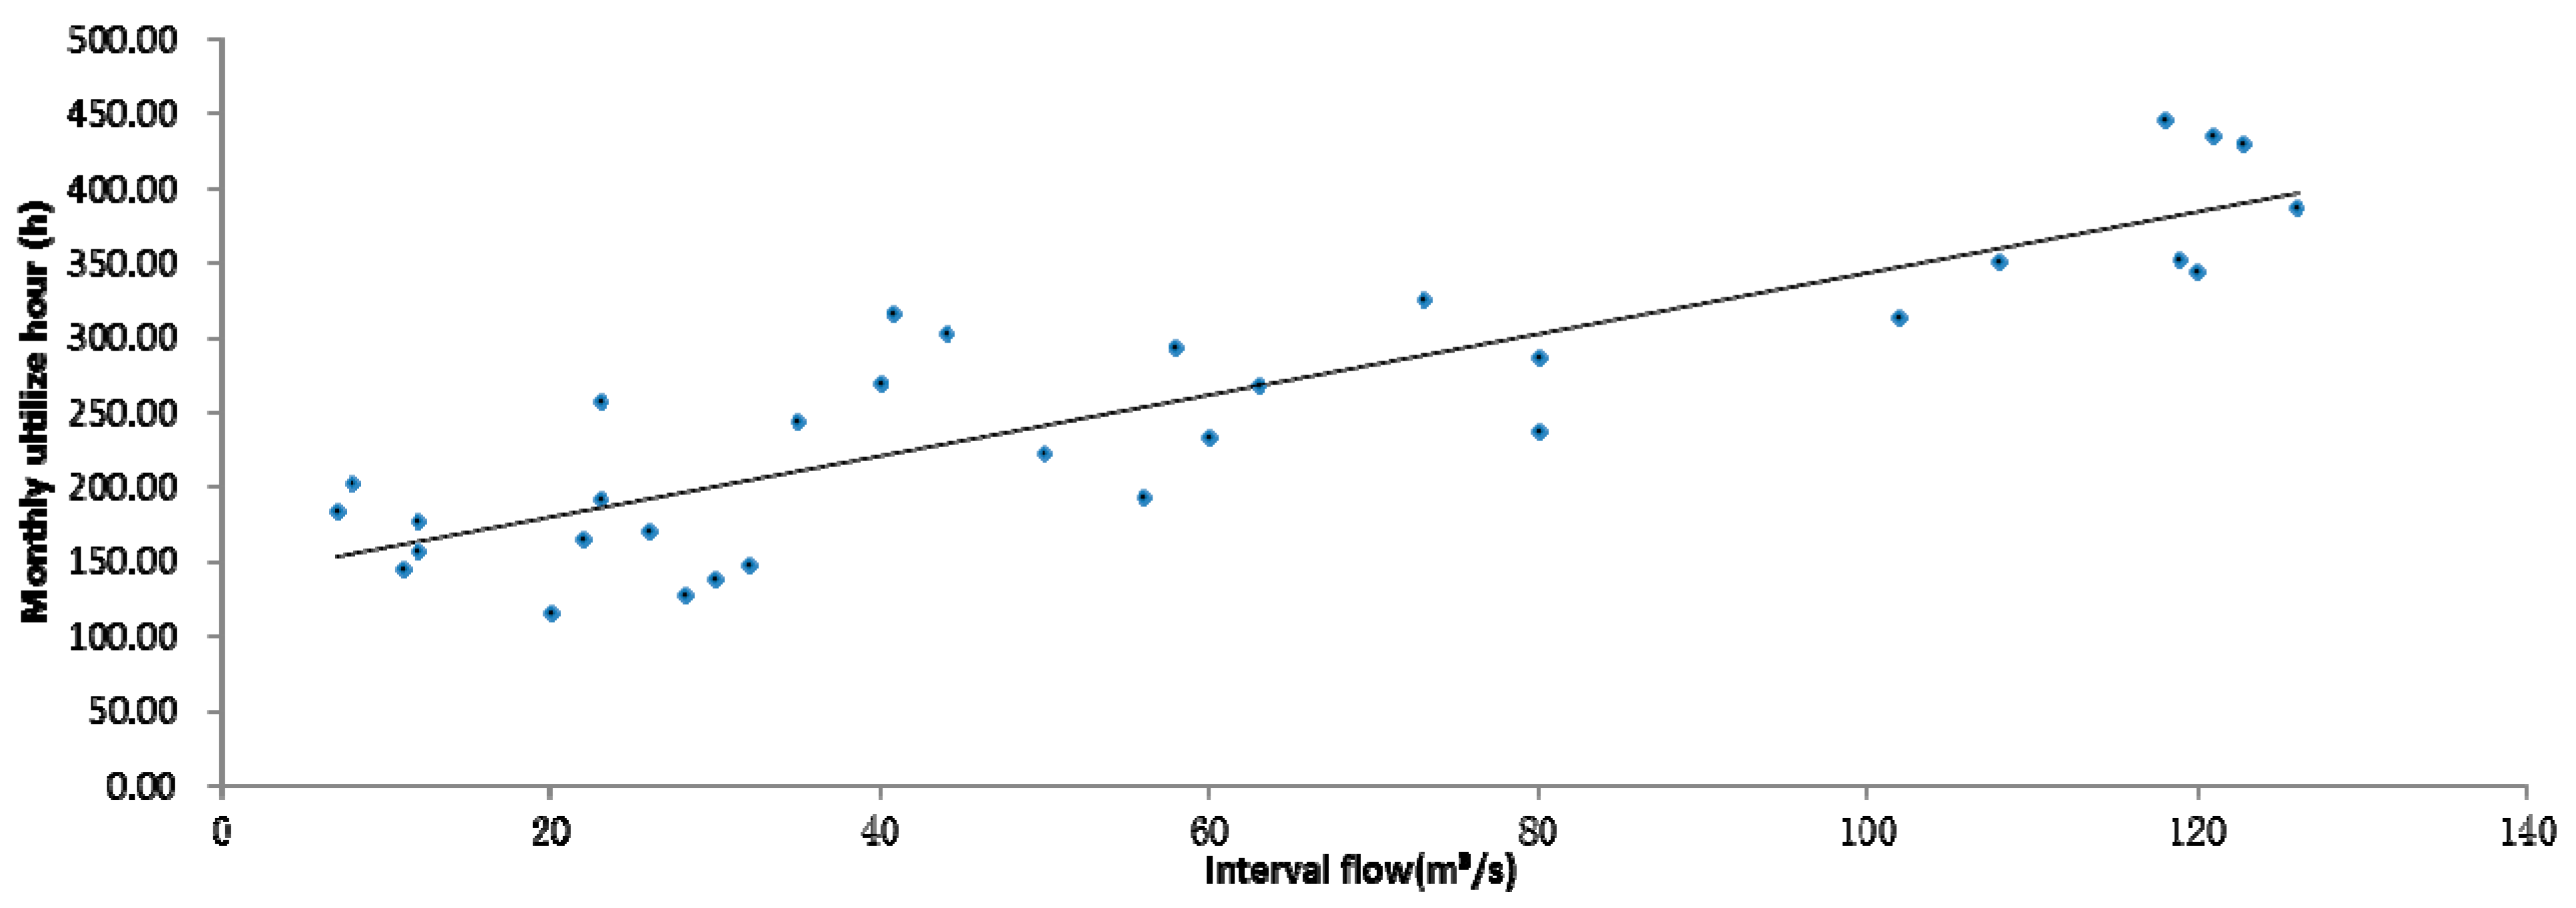
The SHP plants in Puer are selected as an example in this section. Several LHP plants that are correlated to the SHP plants are the Dachaoshan plant (correlation coefficient: 0.92), the Dayingjiang III plant (correlation coefficient: 0.81), and the Ketian plant (correlation coefficient: 0.39). So the Dachaoshan plant was chosen as the correlated plant to establish the regression model of LHP and SHP (
Figure 7) based on Equation (8).
Figure 7.
Linear curve fitting of LHP and SHP in Puer County.
Figure 7.
Linear curve fitting of LHP and SHP in Puer County.
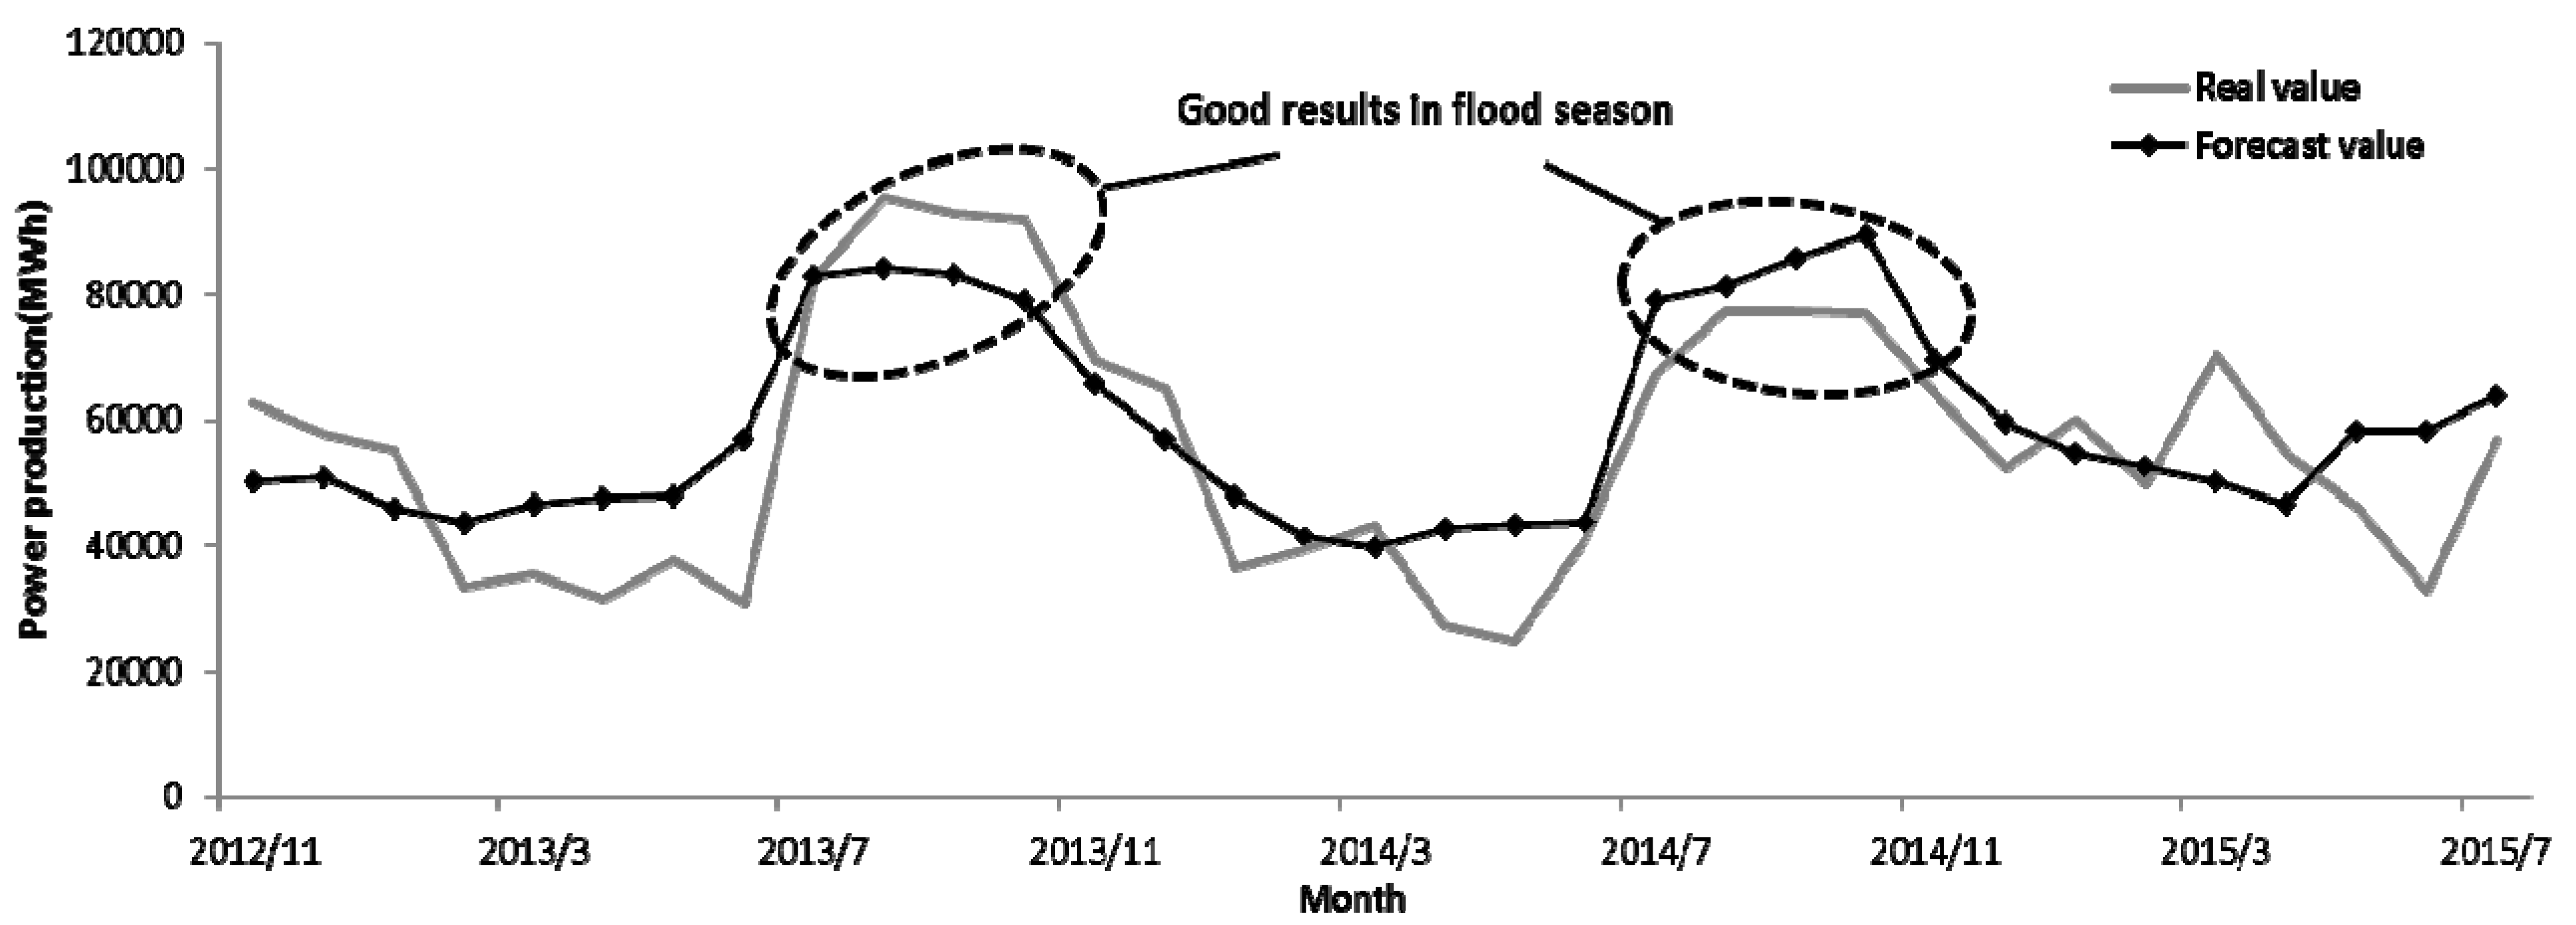
After establishing the regression model, the power production of SHP plants in Puer was forecasted using the interval flow of Dachashan plant based on Equations (8) and (9). The prediction accuracy is 87.9%. The average relative error is 18.5%, and the maximum and minimum relative error is 43.8% and 5.6%, respectively.
Figure 8 shows that the prediction value of this method shows the same trend with the real value regardless of the season. This indicates that this method could achieve an accurate result, even during the flood season, which can provide the reliable forecasted data for arranging the coordinate power generation schedule between SHP plants and LHP plants in order to reduce wasting water resources and abandoning electricity.
Figure 8.
Prediction results of power production of SHP plants in Puer district.
Figure 8.
Prediction results of power production of SHP plants in Puer district.
4.4. Generality Analysis of Forecasting Method
The power production of SHP plants shows significant spatial differences. The regular mathematical method does not show good generality, as it was built based on the mathematical statistics rule of power production sample sequence. The generality of the correlation analysis method is determined by the correlation of LHP and SHP and the forecast accuracy of LHP. Therefore the correlation analysis method can solve the problem effectively.
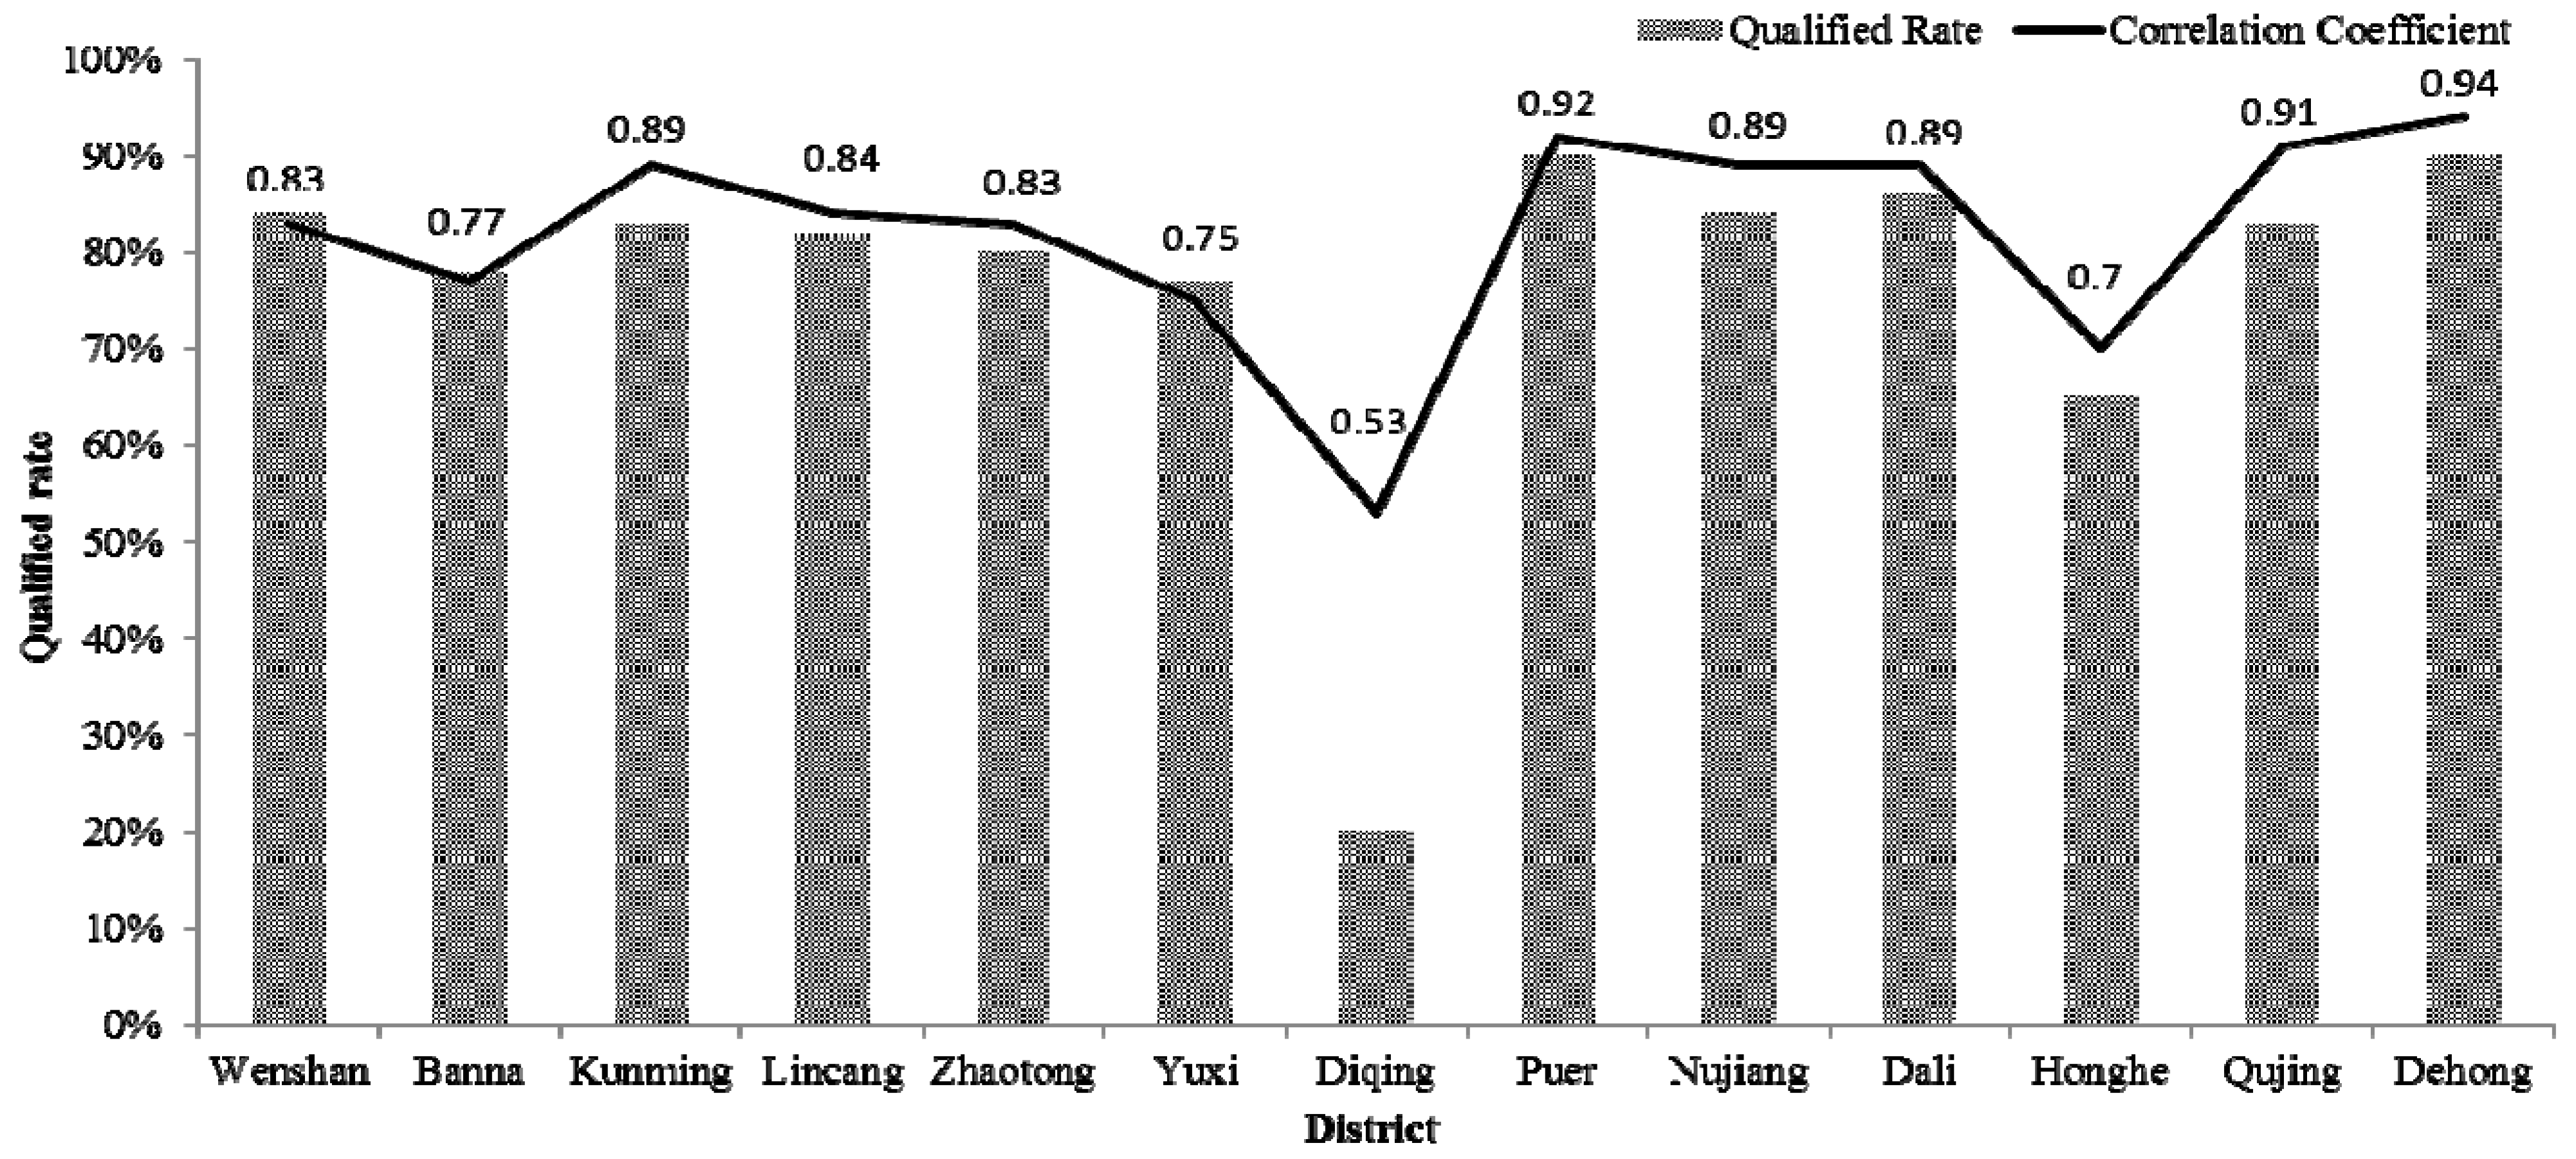
This model is applied to forecast the long-term power production of SHP plants in 13 districts of Yunnan province, and the results are shown in
Figure 9. The results indicate that the forecast accuracy is positively correlated to the correlation coefficient. Twelve districts have correlation coefficients greater than or equal to 0.7, and forecasting qualified rates of greater than 70%. These results have verified the generality of the correlation analysis method for the forecasting of long-term power production of SHP plants.
Figure 9.
Prediction results of the thirteen districts in Yunnan province.
Figure 9.
Prediction results of the thirteen districts in Yunnan province.
5. Conclusions
Forecasting the long-term power production of SHP plants is of great significance for realizing the coordination with LHP plants, solving the problem of the waste water and abandoned electricity and ensuring the safe operation of the power grid. In this paper, the similarity between LHP and SHP plants and the spatiotemporal characteristics of SHP plants have been analyzed, based on which, the correlation analysis method of LHP and SHP has been proposed. Taking the SHP plants in Yunnan province as examples, the correlation between the power production of SHP plants and the interval inflow of LHP plants has been verified, and the correlation characteristics in space and at the basin-scale have been obtained. Based on the interval flow of the Dachaoshan plant, the power production of the SHP plants in the Puer district was forecasted. The prediction accuracy of this method has been verified. Lastly, by analyzing the forecast results of the 13 districts in Yunnan province, the generality of the correlation analysis method is demonstrated. From the discussion above, we may safely draw the conclusion that the correlation analysis method is a feasible solution for forecasting the long-term power production of SHP plants.
From the discussion above, it can be seen that the proposed forecasting method has some limitation. Because SHP plants are lack of sufficient information for establishing a forecasting model, there must be a LHP plant with long-term observed data in district or county, which has significant correlation with the SHP plants. The prediction accuracy of SHP plants depends on the LHP plant. Therefore, how to use the classical and mature prediction models based on existing data for forecasting long-term power production of SHP plants may be future study directions.


