Abstract
The concentrations of dissolved inorganic nitrogen (DIN; NO2−–N, NH3–N, and NO3−–N), PO43−–P, dissolved oxygen (DO), chemical oxygen demand (COD), five-day biological oxygen demand (BOD5), oil, Si, and seven heavy metals (Hg, Cr, Cu, As, Zn, Pb, and Cd) in seawater from the Dongzhaigang National Mangrove Nature Reserve of China in 2013 were determined. Except for the concentrations of the COD, BOD5, Cr, Hg, Cu, As, and Cd, each index in seawater were found to be over the limits of I-Class seawater standards. The index of organic pollution showed that the pollution level in this study area reached level 6; eutrophication levels indicated that the nutritional level reached level 4. According to the water quality index model, the sea area was slightly polluted by heavy metals. In a genetic algorithm-based fuzzy comprehensive evaluation, the results for organic pollutants, nutrients, and heavy metal pollution can be combined to evaluate the water quality as a whole. Results showed that the sea area in Dongzhaigang did not have a healthy water environment, but was seriously polluted by organic pollutants and nutrients.
1. Introduction
Estuaries are ecotones between terrestrial and marine systems that receive large quantities of nutrients from tributary rivers [1]. Given their unique characteristics, estuaries, like mangrove wetlands, certainly attract aquatic animals; these aquatic animals congregate in estuaries, which eventually become the habitat of such animals [2]. Mangrove ecosystems are important inter-tidal estuarine wetlands along the coastlines of tropical and subtropical regions; these ecosystems are closely associated with human activities and are subject to contamination [3]. However, with the rapid development of economic and human activities, more and more pollutants (e.g., domestic sewage, industrial wastewater, agricultural wastewater, and domestic wastewater) are discharged into seawater, thereby resulting in a series of environmental problems, such as organic over-enrichment, eutrophication, and health-related problems [4]. Some adverse effects of pollution can be reversed by abatement actions [4]. However, factors such as the high variability of environmental conditions and the existence of time lags in recovery responses make the evaluation of progress in achieving goals in pollution reduction difficult [5]. Thus, timely investigations and assessments of coastal water quality are important for the protection of the littoral environment.
Hainan Island is the second largest island of China and has a mangrove area of 4772 hm2, which accounts for one third of the total mangrove forest areas in China [3,6]. A total of 26 mangrove plant species are distributed in Hainan among the 27 species in China [3,6,7]. As the first National Mangrove Reserve of China established in 1986, Dongzhaigang was included in the list of wetlands of international importance in 1992 to protect the mangrove wetland ecosystem [3,7]. This estuary and coastal mudflat ecosystem is on the edge of boreal tropics and offers protection of the mangrove wetland; this ecosystem is also an important habitat for wintering birds [7]. Hence, the mangrove ecosystem has been always protected. However, in recent years, because of the increase in coastal settlement and rapid economic development in Dongzhaigang, tourism and aquaculture have led to a certain degree of pollution. According to research in 2013, hundreds of acres of mangrove of Dongzhaigang died because of water pollution [8,9]. This event was mainly caused by production and business activities near the protected areas, especially the intensive breeding of saltwater ducks; thus, the original biological chain was affected, which resulted in eutrophication and the proliferation of gribble [8,9]. Moreover, sewage from shrimp ponds and the swine industry in Qienan village in the Meilan district of Haikou City was directly discharged into the protected area such that excessive nitrogen and phosphorus were present in the seawater [8,9]. Due to the seriously polluted water in such an important protected area, there is a need to carry out a comprehensive health assessment on the water quality in Dongzhaigang.
In terms of seawater quality assessment, indicators of seawater quality assessment are few [4,5]. As for water quality evaluation method, the single factor method is simple and intuitive, so is frequently applied in water quality assessment, while the results of the fuzzy comprehensive evaluation method are more objective and comprehensive [10,11]. Researchers such as Aydinol conducted a statistical study and used the comprehensive evaluation method to evaluate seawater quality based on the investigation data around Princes’ Islands’ beaches in Istanbul [10]. However, there are few indicators except total and fecal coliform concentrations in Aydinol’s study [10]. In order to evaluate the seawater quality of the region thoroughly, water quality evaluation indicators should be comprehensive. Therefore, fuzzy comprehensive evaluation is clearly a more appropriate method. However, information on the comprehensive assessment of the water quality in the Dongzhaigang mangrove wetland is lacking. Researchers in China, such as Li Pengshan [11], selected the II-Class of Water Quality Standards of China (GB3097-1997) [12], which clearly did not meet the real requirements. On the other hand, Li only used the index of organic pollution and the eutrophication level method to evaluate seawater quality through the organic pollutants and nutrients, which did not give a comprehensive evaluation of the water quality in Dongzhaigang [11].Given the increasingly serious and complicated pollution situation, a simple study of nutrients or heavy metals in seawater cannot solve practical problems.
Since various factors are important to assess the water quality, determining the weight of each factor has become a vital problem. To solve a variety of optimization problems, including problems in which the objective function is discontinuous, non-differentiable, stochastic, or highly nonlinear, a genetic algorithm can be applied [13]. The weight of each factor can be determined in a more objective way using a genetic algorithm and programs that simulate the logic of Darwinian selection [13,14]. The major advantage of the genetic algorithm is that it can tackle generally-shaped fuzzy membership functions on both sides of the model constraints [15]. At present, the genetic algorithm is seldom used to assess seawater quality, which is used to calibrate a water quality model [13]. The genetic algorithm has become the preferred water system design optimization technique for many researchers and practitioners [14]. Researchers such as Xu used a combined genetic algorithm and fuzzy simulation approach to solve water quality management problems; Van Dijk optimized water distribution systems by using a weighted penalty in the genetic algorithm [14,15]. In this paper, the genetic algorithm was used to perform fuzzy comprehensive evaluation of seawater quality in Dongzhaigang.
Various factors need to be considered comprehensively in the latest survey and assessment of water quality in the entire range of Dongzhaigang. Given the results of the survey of the Dongzhaigang water environment in 2013, we evaluated the water quality of the samples based on the nutrients, organic pollutants, and heavy metals that were present. In addition, the genetic algorithm was used to perform fuzzy comprehensive evaluation. In this comprehensive evaluation, the results for organic pollutants, nutrients, and heavy metal pollution can be combined with the fuzzy comprehensive evaluation of water quality. Eventually, this study will provide crucial information on the health of seawater in the Dongzhaigang National Mangrove Nature Reserve, serving as a scientific reference for the protection of the Mangrove Nature Reserve and other similar regions.
The objectives of this study are as follows: (1) to obtain quantitative information on the concentration of nutrients, organic pollutants, and heavy metals in seawater at different sampling sites in the Dongzhaigang mangrove wetland of China; (2) to determine the distribution of these factors and their levels as compared with the criteria; (3) to evaluate the respective levels of organic pollution, eutrophication, and heavy metal pollution; and (4) to assess the water quality of this area by genetic algorithm-based fuzzy comprehensive evaluation.
2. Materials and Methods
2.1. Study Area
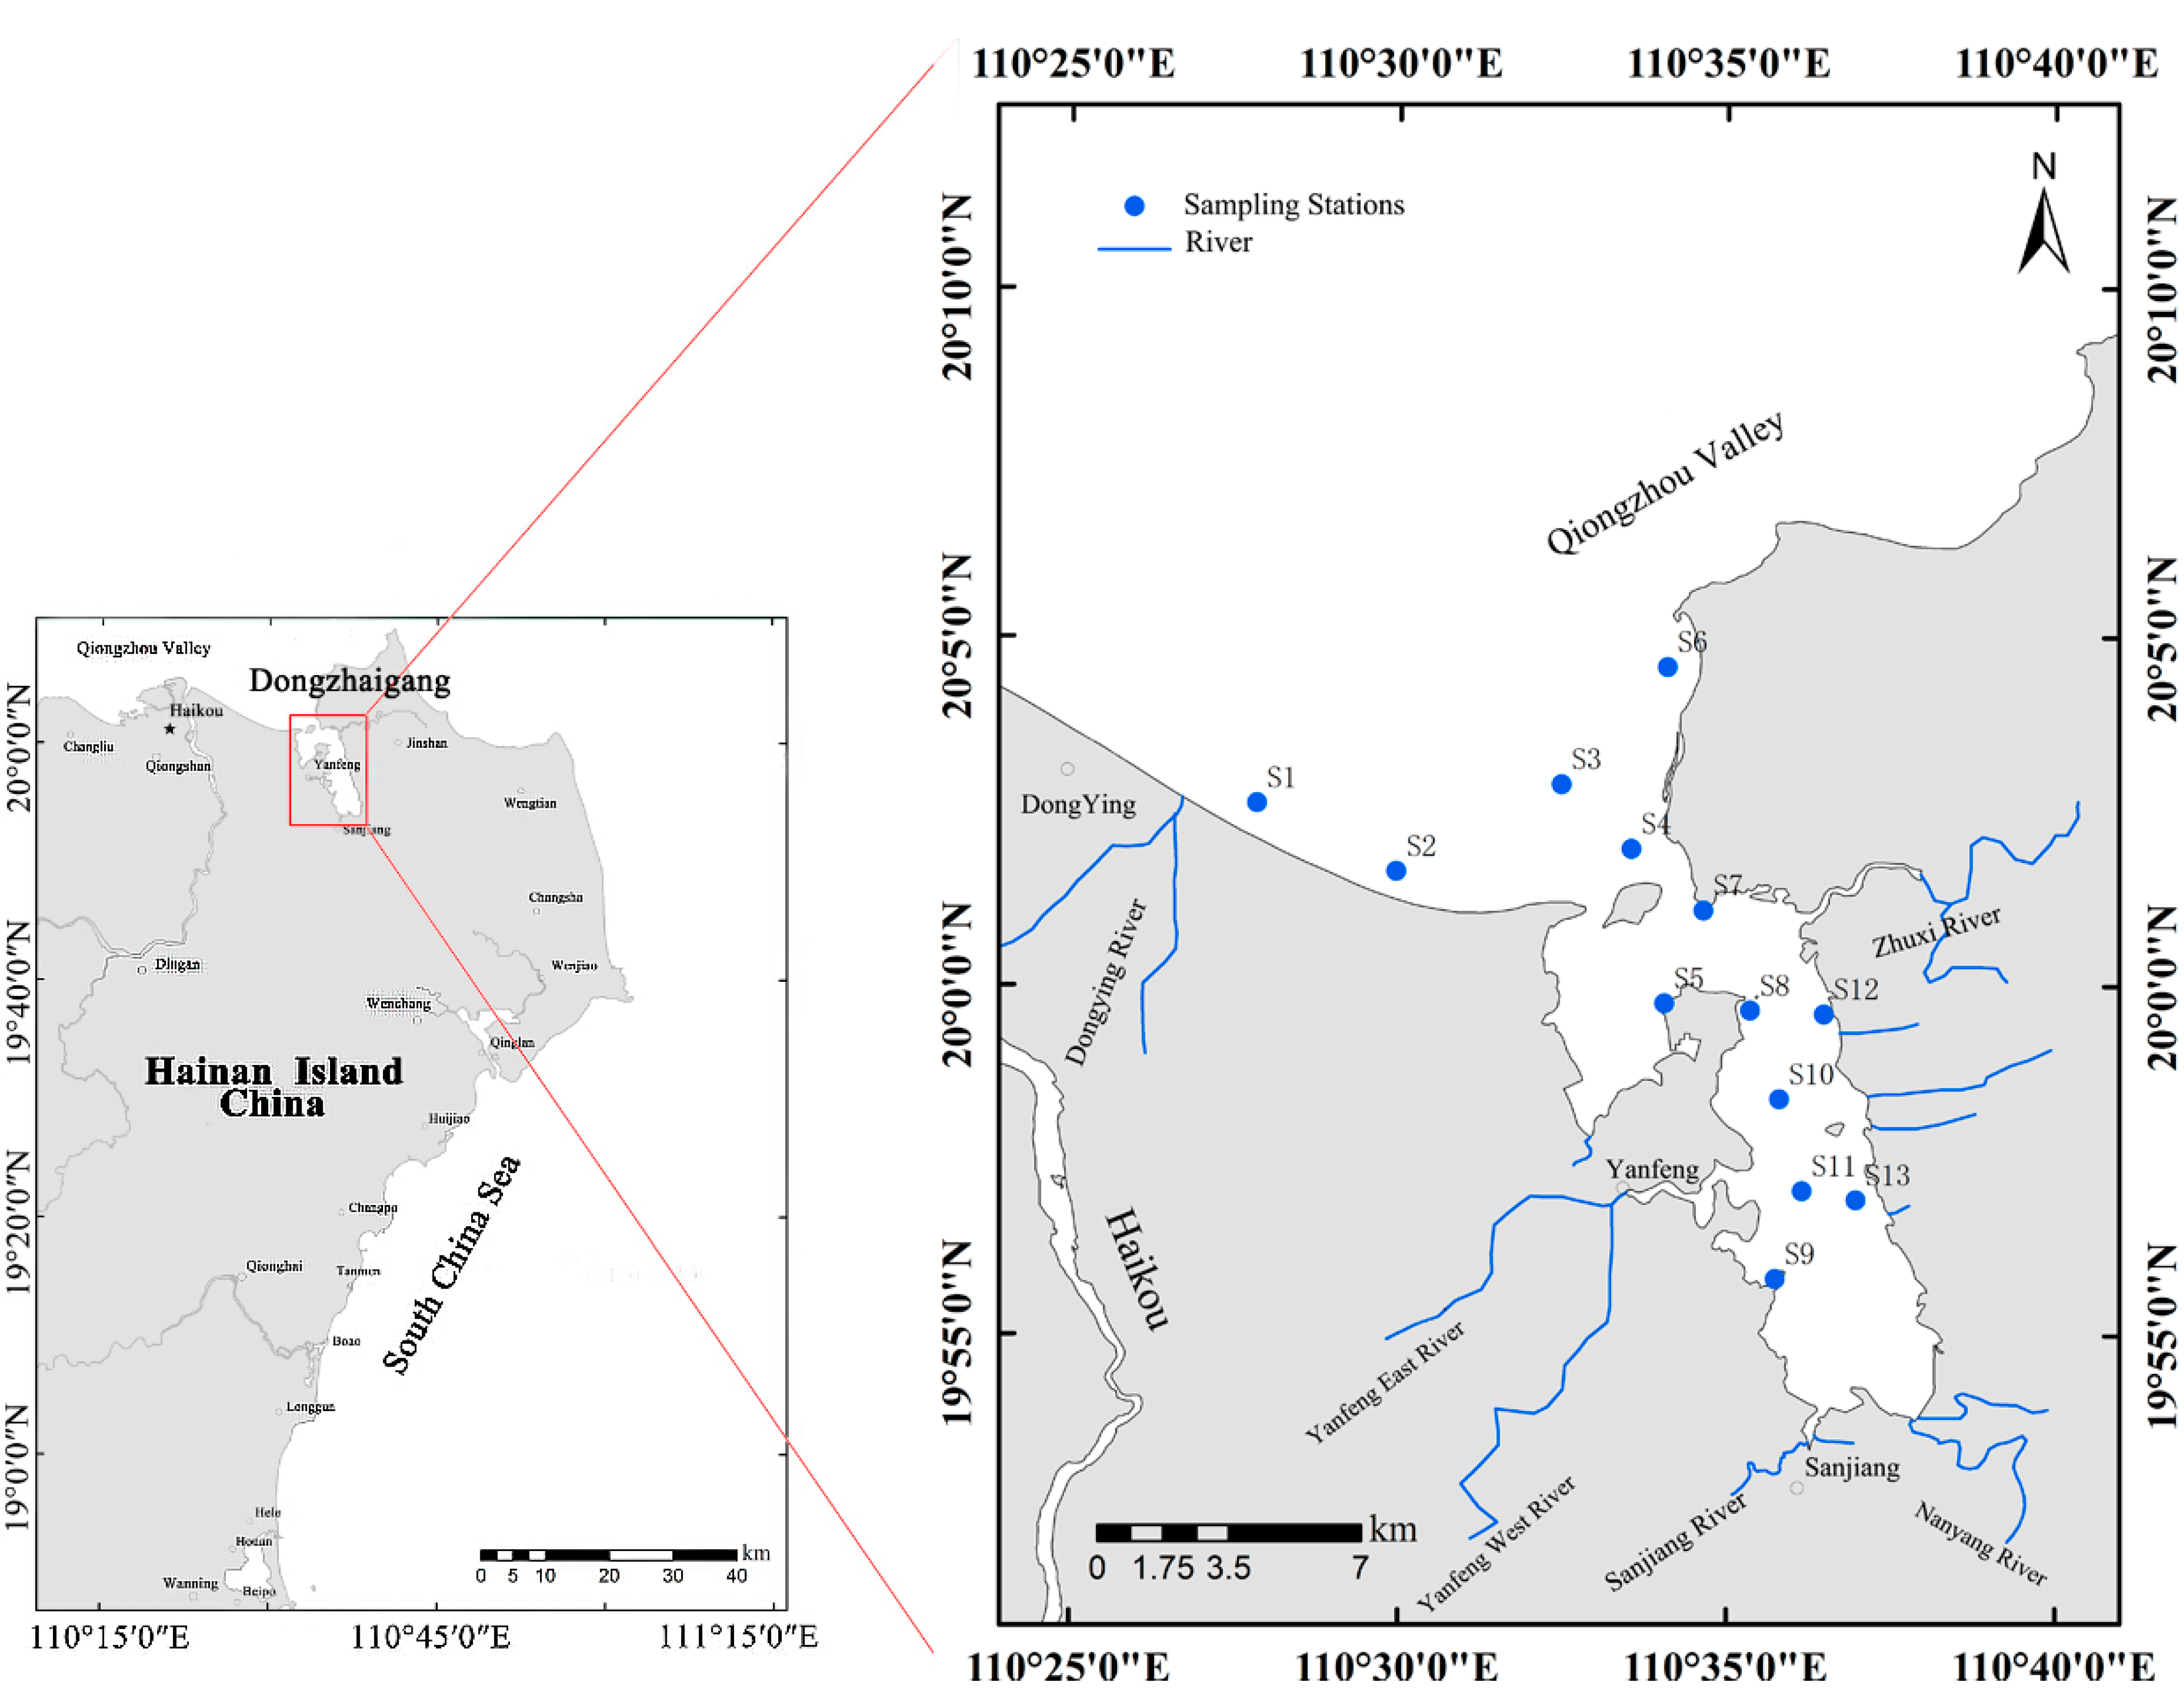
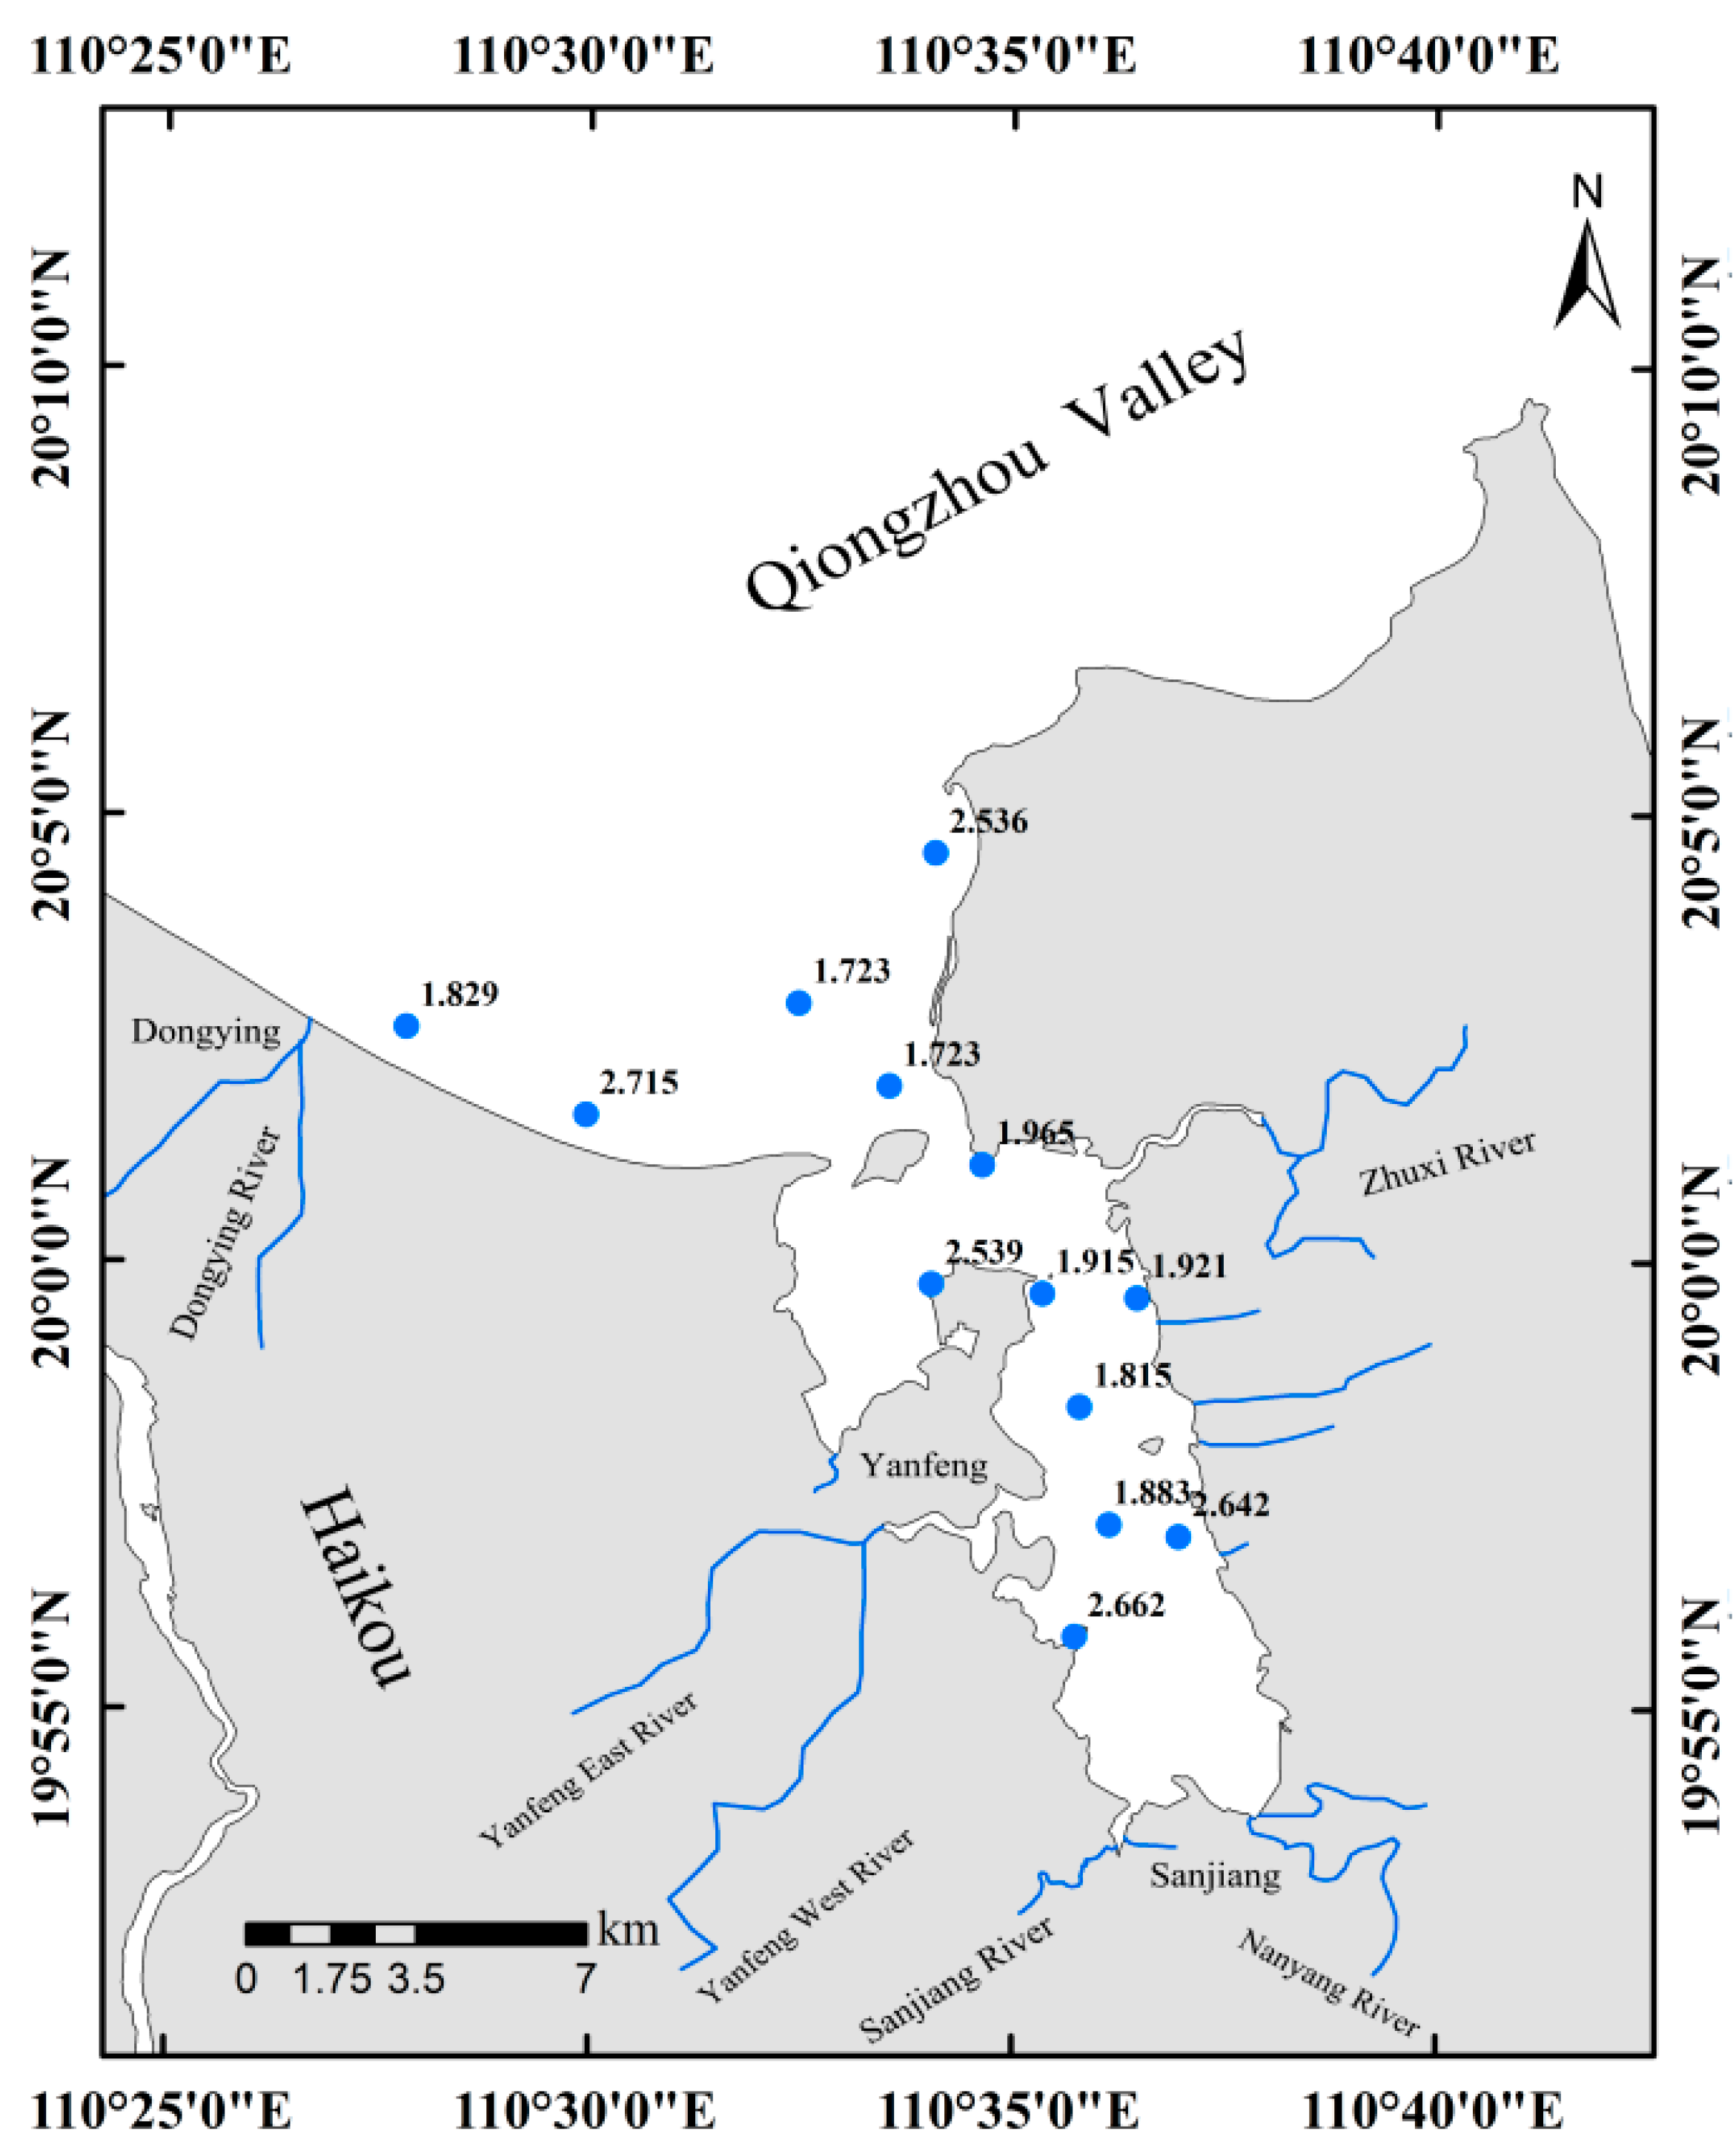
The Hainan Dongzhaigang National Mangrove Nature Reserve is located in the northeast of the Meilan district, Haikou City (110°30'–110°37' E, 19°51'–20°01' N). This reserve has most of the typical original natural mangroves in China. Dongzhaigang is a harbor-styled lagoon with a semi-closed shape (Figure 1), with a length of 50 km; the total area is 3337.6 hm2. The Dongzhaigang mangrove wetland has a tropical oceanic climate with monsoons, and the annual temperature reaches 23.8 °C; the annual duration of sunshine is up to 2200 h [7].

Figure 1.
Sampling stations in the study area.
Figure 1.
Sampling stations in the study area.
2.2. Sample Collection and Processing
Surface seawater sampling was conducted by a research ship in Dongzhaigang National Mangrove Nature Reserve. Seawater samples were collected in July 2013, with a total of 13 stations distributed along the coastal area of the study area (Figure 1). The sampling stations were chosen according to the criterion of even distribution in the entire study area. Samples were selected and collected with a 5-L organic glass surface sampler and transferred into glass bottles or plastic jugs. All sample processing followed The Specification for Marine Monitoring. Part 3: Sample Collection, Storage and Transportation (GB17378.3-2007) [16]; some samples that were used to measure DO, chemical oxygen demand (COD), and heavy metals were chemically processed on site by adding specific reagents (manganese chloride, potassium iodide, and nitric acid, respectively). After on-site chemical processing, all samples were stored in a dark place. The samples that were used to measure biochemical oxygen demand were placed into poly foam boxes with ice for cryopreservation. After the research ship docked daily, seawater samples were directly transferred to the laboratory for further experiments.
2.3. Analysis Factors and Methods
These analysis factors were included: NO2−–N, NH3–N, NO3−–N, PO43−–P, dissolved oxygen (DO), chemical oxygen demand (COD), five-day biological oxygen demand (BOD5), oil, Si, PO43−, NO3−, NO2−, NH4+, PO43−, Hg, total Cr, Cu, As, Zn, Pb, and Cd, for a total of 21 factors. Testing instruments included: an inductively-coupled plasma spectrometer (IRIS Intrepid II XSP), an inductively coupled plasma source mass spectrometer (X-SERIES 2), and a dual-channel atomic fluorescence spectrophotometer (AFS-3000). All experiments followed The Specification for Marine Monitoring. Part 4: Seawater Analysis (GB17378.4-2007) [17]: nitrate was tested by reduction through the cadmium column colorimetric method; nitrite was tested by N-(l-naphthyl)- ethylenediamine spectrophotometry; ammoniacal nitrogen was tested by hypobromite oxidimetry method; reactive phosphate was tested by phosphorus-molybdenum spectrophotometry; chemical oxygen demand was tested by basic potassium permanganate; BOD5 was tested by five-day biochemical cultivation method; oil was tested by fluorescence spectrophotometry; silicate was tested by silicon molybdenum blue method; Hg was tested by atomic absorption spectrophotometry; As was tested by hydride generation atomic absorption spectrophotometry; Zn was tested by flame atomic absorption spectrophotometry; and Cr, Pb, Cd, and Cu were tested by non-flame atomic absorption spectrophotometry. The environment temperature was set to 21.7 °C, and the humidity was maintained at 40% throughout the experiment.
2.4. Evaluation Criteria
The Specification for Marine Monitoring. Part 4: Seawater Analysis (GB17378.4-2007) was used as the quality standard for seawater sample testing. The People’s Republic of China Marine Water Quality Standard (GB 3097-1997) was used for the evaluation criteria in this study (Table 1) [12,17].
2.5. Data Analysis
Data were processed with SPSS 12.0 and Excel 2003 to obtain the range of variation, average value, and the coefficient of variation of each index. ArcGIS 9.3 was applied to analyze the concentration of each index and the significant distribution. Simultaneously, the analysis index was classified into three categories, as follows: organic pollutants, e.g., DO, COD, BOD5, and oil; nutrients, e.g., reactive phosphate, dissolved inorganic nitrogen (DIN),and reactive silicate; and heavy metals, e.g., Hg, Cr, Cu, As, Zn, Pb, and Cd. The seawater quality was evaluated based on these three aspects.
In this study area, the index of organic pollution was used to assess the level of organic pollution, whereas the eutrophication level was applied to analyze the nutritional pollution. The water quality index model was used to analyze the monitoring index and pollution level of heavy metals. Finally, genetic algorithm-based fuzzy comprehensive evaluation was used to comprehensively evaluate the water quality of the whole sea area of Dongzhaigang.

Table 1.
The standard of seawater quality (mg/L).
| Items | I | II | III | IV |
|---|---|---|---|---|
| DIN | 0.2 | 0.3 | 0.4 | 0.5 |
| PO43−–P | 0.015 | 0.03 | 0.03 | 0.045 |
| DO | 6 | 5 | 4 | 3 |
| COD | 2 | 3 | 4 | 5 |
| BOD5 | 1 | 3 | 4 | 5 |
| Oil | 0.05 | 0.05 | 0.3 | 0.5 |
| Hg | 0.00005 | 0.0002 | 0.0002 | 0.0005 |
| Cr | 0.05 | 0.1 | 0.2 | 0.5 |
| Cu | 0.005 | 0.01 | 0.05 | 0.05 |
| As | 0.02 | 0.03 | 0.05 | 0.05 |
| Zn | 0.02 | 0.05 | 0.1 | 0.5 |
| Pb | 0.001 | 0.005 | 0.01 | 0.05 |
| Cd | 0.001 | 0.005 | 0.01 | 0.01 |
Note: The values for each parameter in each column are the maximum allowable values for each class.
2.6. Modeling Process of Genetic Algorithm-based Fuzzy Comprehensive Evaluation
To comprehensively evaluate the water quality of the whole sea area of Dongzhaigang, the fuzzy comprehensive evaluation model was constructed based on a genetic algorithm, with the following steps [13,14]: (1) establish the factor assembly and remark assembly; (2) confirm the weight with the genetic algorithm; (3) construct the membership matrix; and (4) calculate the comprehensive evaluation vector.
Step 1: Confirm the factor assembly matrix, remark assembly matrix, and orders of magnitude.
In this study, the DIN, PO43−P, DO, COD, BOD5, oil, Hg, total Cr, Cu, As, Zn, Pb, and Cd were selected as seawater quality evaluation indexes. These indexes were processed by a dimensionless method to construct the evaluation matrix C while keeping the changing information of each index value. The index Do was processed by the following standardized formula:
Other indexes were processed by the following standardized formula:
where xmax(i) and xmin(i) were the maximum and minimum values of index i in each station and c(i,j) was the standardized evaluation index value.
Second, the judging matrix B = (bik)n × m can confirm the weight of every evaluation index based on c(i,j). The standard deviation was as follows:
where was used to reflect the influence degree of each index on the comprehensive evaluation and to construct the judging matrix B = (bik)n × m as follows:
where Smax, and Smin were the maximum and minimum of {S(i)/i = i → n}, respectively. The relative importance parameter value could be expressed as:
where int was a rounding function.
Step 2: Confirm the weight using the genetic algorithm.
Based on the judging matrix B = (bik)n × m and S(i), we wrote the program with Matlab7.0. The weight range was (0,1), the parameter d was 0.2, the population number was 100, and the hereditary algebra was 100. The weight matrix was W = (w1,w2, …, wp), where
Step 3: Construct the membership matrix.
The evaluation index was evaluated according to the evaluation scale, and the value of membership was confirmed. The final membership matrix R (ris)n × h could be constructed with the actual situation as the standard by considering the real characteristics of fuzzy pheromones and summarizing the experience of experts.
Step 4: Calculate the comprehensive evaluation vector and quantization value of comprehensive evaluation.
After the weight vector W and the membership matrix R were confirmed, the comprehensive evaluation vector was calculated according to the following expression:
S = W × R.
The quantization value of remark assembly was defined by V = {vs}, s = 1,2 ,..., n. The remark conclusions are divided into four levels, namely, “good”, “normal”, “poor”, and “very poor”.
The quantization value of comprehensive evaluation was calculated by the following expression:
N = S × V.
3. Results
3.1. Spatial Distribution of Organic Pollutants
The spatial distributions of the concentrations of organic pollutants are shown in Figure 2. The average concentration of BOD5 was 0.654 mg/L. BOD5 concentration ranged from 0.100 mg/L in station S8 to 2.400 mg/L in station S9. The coefficient of variation was 0.878, which indicated a high level of fluctuation. Compared with The People’s Republic of China Marine Water Quality Standard (GB 3097-1997) [12], the concentration of BOD5 in only one station (S9) exceeded the I-Class seawater standard, whereas those in other stations satisfied this standard. The spatial variation of BOD5 showed a decreasing trend from the inner region to the outer region of Dongzhaigang, whereas the area with the highest BOD5 concentration was the seawater around Sanjiang Town.
In the present study area, the average concentration of DO was 5.762 mg/L, ranging from 3.700 mg/L in station S9 and 6.300 mg/L in station S6. The coefficient of variation was 0.126, which showed that the spatial variation was small. Compared with the seawater quality standard, most stations were below the limits of I-Class and II-Class, whereas the concentrations in two stations (S9 and S13) were below the limits of IV-Class or III-Class. Furthermore, the variation of DO concentration progressively increased from the southwest to the northeast of Dongzhaigang, which was the opposite of the trend for BOD5.
The COD concentrations from each station ranged from 0.300 mg/L in S3 to 4.460 mg/L in S7, and the average value was 1.719 mg/L. The coefficient of variation was 0.695, which showed a high level of spatial variation. Moreover, two apparent points that had high COD were situated in the sea area of Puqian town (S7) in Wenchang city with IV-Class water quality and the sea area of Beipai village in Yanfeng town with III-Class water quality. These sea areas were affected by human activities.
The concentration of oil ranged from 0.0035 to 0.400 mg/L, with an average of 0.235 mg/L. Only four stations (S5, S6, S9, and S13) were below the limits of I-Class, whereas station S2 was below the limits of III-Class. The other stations were below the limits of IV-Class. The extremum of oil appeared in numerous sea areas that were mainly located along the shore of the estuary of the Dongying and Zhuxi Rivers. In addition, the water was severely polluted in the northeast costal area of Yanfeng town. This status matched the previous report, except that the degree of oil pollution was slightly lower [11].
3.2. Spatial Distribution of Nutrients
The production capability of the seawater ecosystem is influenced by the nutrient concentration. In coastal, harbor, and estuarine areas, nutrients are mainly transported horizontally. Sewage is discharged in the seaside area, and transportation by outflowing rivers is the main source of nutrients [18]. Consequently, a study on the spatial distribution and concentration of nutrients may help effectively evaluate the eutrophication level of the sea area.
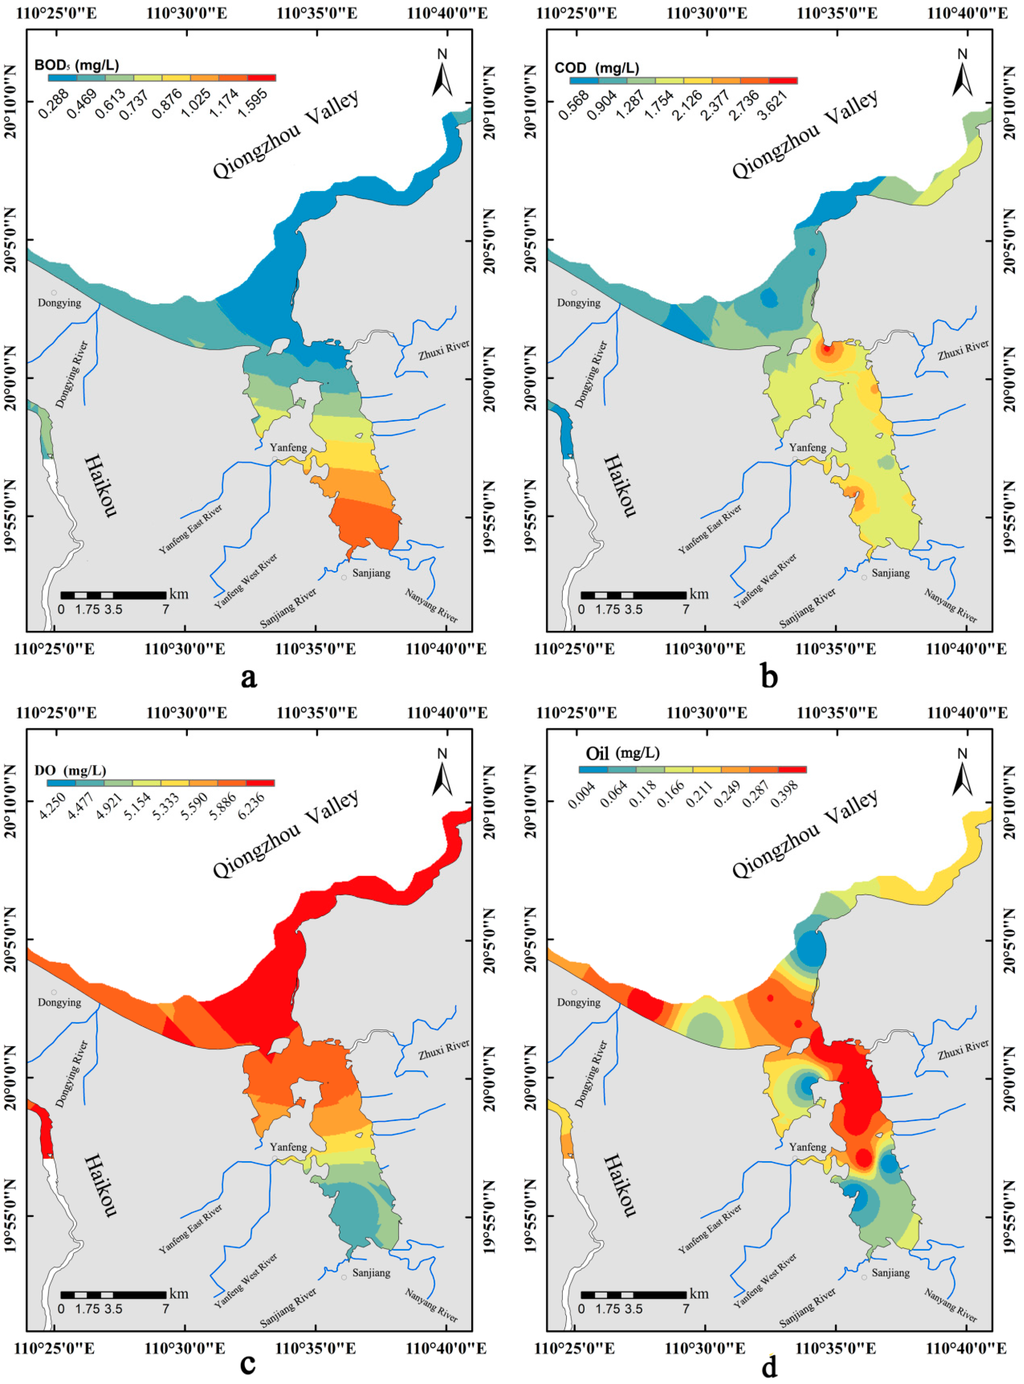
Figure 2.
Spatial distribution of organic pollutants. (a) Spatial distributions of BOD5; (b) spatial distributions of COD; (c) spatial distributions of DO; (d) spatial distributions of oil.
Figure 2.
Spatial distribution of organic pollutants. (a) Spatial distributions of BOD5; (b) spatial distributions of COD; (c) spatial distributions of DO; (d) spatial distributions of oil.

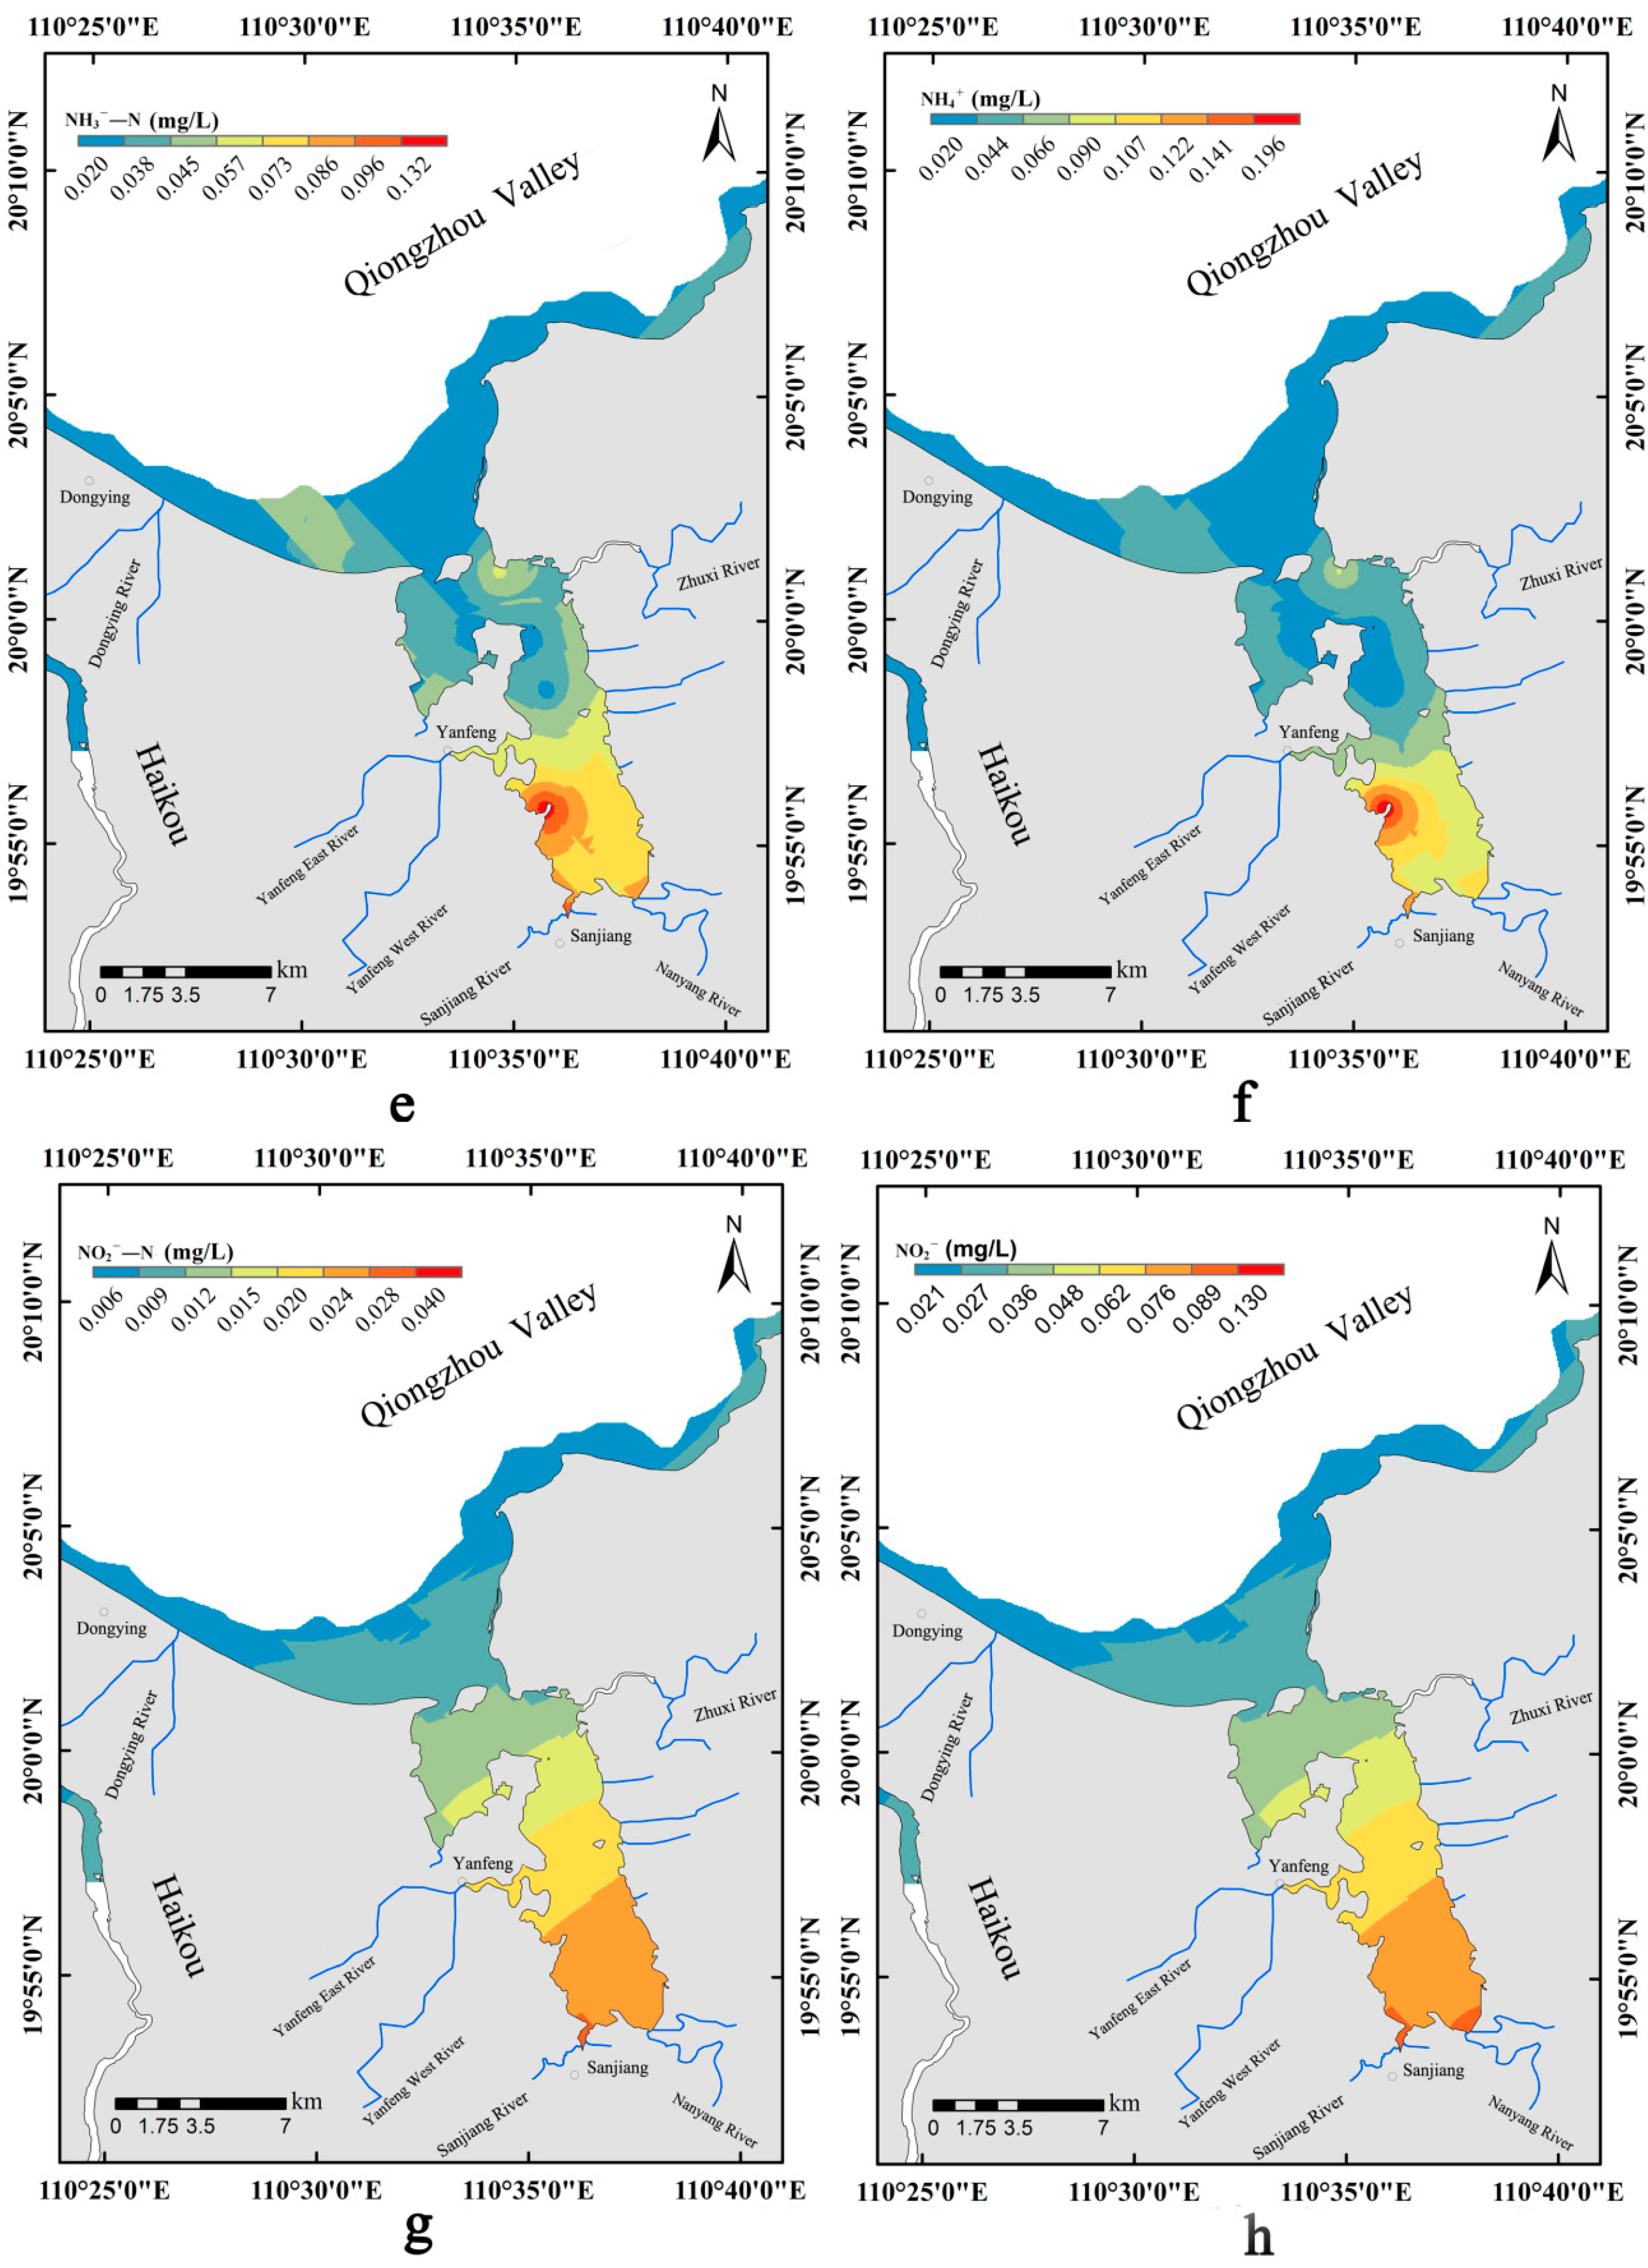
As shown in Figure 3a, the PO43−–P concentration ranged from 0.0002 to 0.070 mg/L, with a coefficient of variation of 0.945, thereby reflecting high spatial variation. The average content of PO43−–P was 0.026 mg/L, which was below the limit of II-Class. Five stations (S1, S2, S3, S4, and S5) were below the limits of I-Class (≤ 0.015 mg/L) and were located near offshore areas or areas of seawater exchange. Only two stations (S13 and S6) exceeded the IV-Class limit. Furthermore, two areas had high levels of PO43−–P. One area was situated in the inner region of Dongzhaigang (S13):the offshore region of Shangyuan village. The other area was located in station S6: the offshore region of Xinfu Sea and Qixing Mountain. PO43−–P is present in PO43− and accounts for 31.51%. Their homology can be derived from the distribution figures (Figure 3a,b).
NO2−–N, NH3–N, and NO3−–N are the main forms of DIN in seawater. The relationship of the concentrations among these forms is influenced by environmental variation [19]. In the present study area, the concentration of DIN ranged from 0.563 mg/L in station S6 to 1.668 mg/L in station S7. The coefficient of variation was 0.340, which indicated a low level of variation. In addition, the concentrations of DIN in all stations were higher than 0.50 mg/L, which exceeds the limits of IV-Class, with an average of 1.035 mg/L. The average concentrations of NO2−–N, NH3–N, and NO3—N were 0.974, 0.014, and 0.0470 mg/L, respectively. The similarities of the three forms could be observed in the distribution Figure (Figure 3c,e,g). Overall, their distributions followed a progressively decreasing trend from the inner part to the outer part of Dongzhaigang. According to the distribution of NO3−–N and NO2−–N (Figure 3c,g), high similarity was found between these compounds, whereas the area with high values of the former was larger than that of the latter. Moreover, the extremum values of NO3−–N and NO2−–N both appeared at the estuary of Sanjiang River. In station S9, which includes the shore of Beipai village in Yanfeng town and the estuary of Sanjiang River, the concentration of NH3–N was higher. The area of high NH3–N was small, whereas the area with low levels was relatively large.
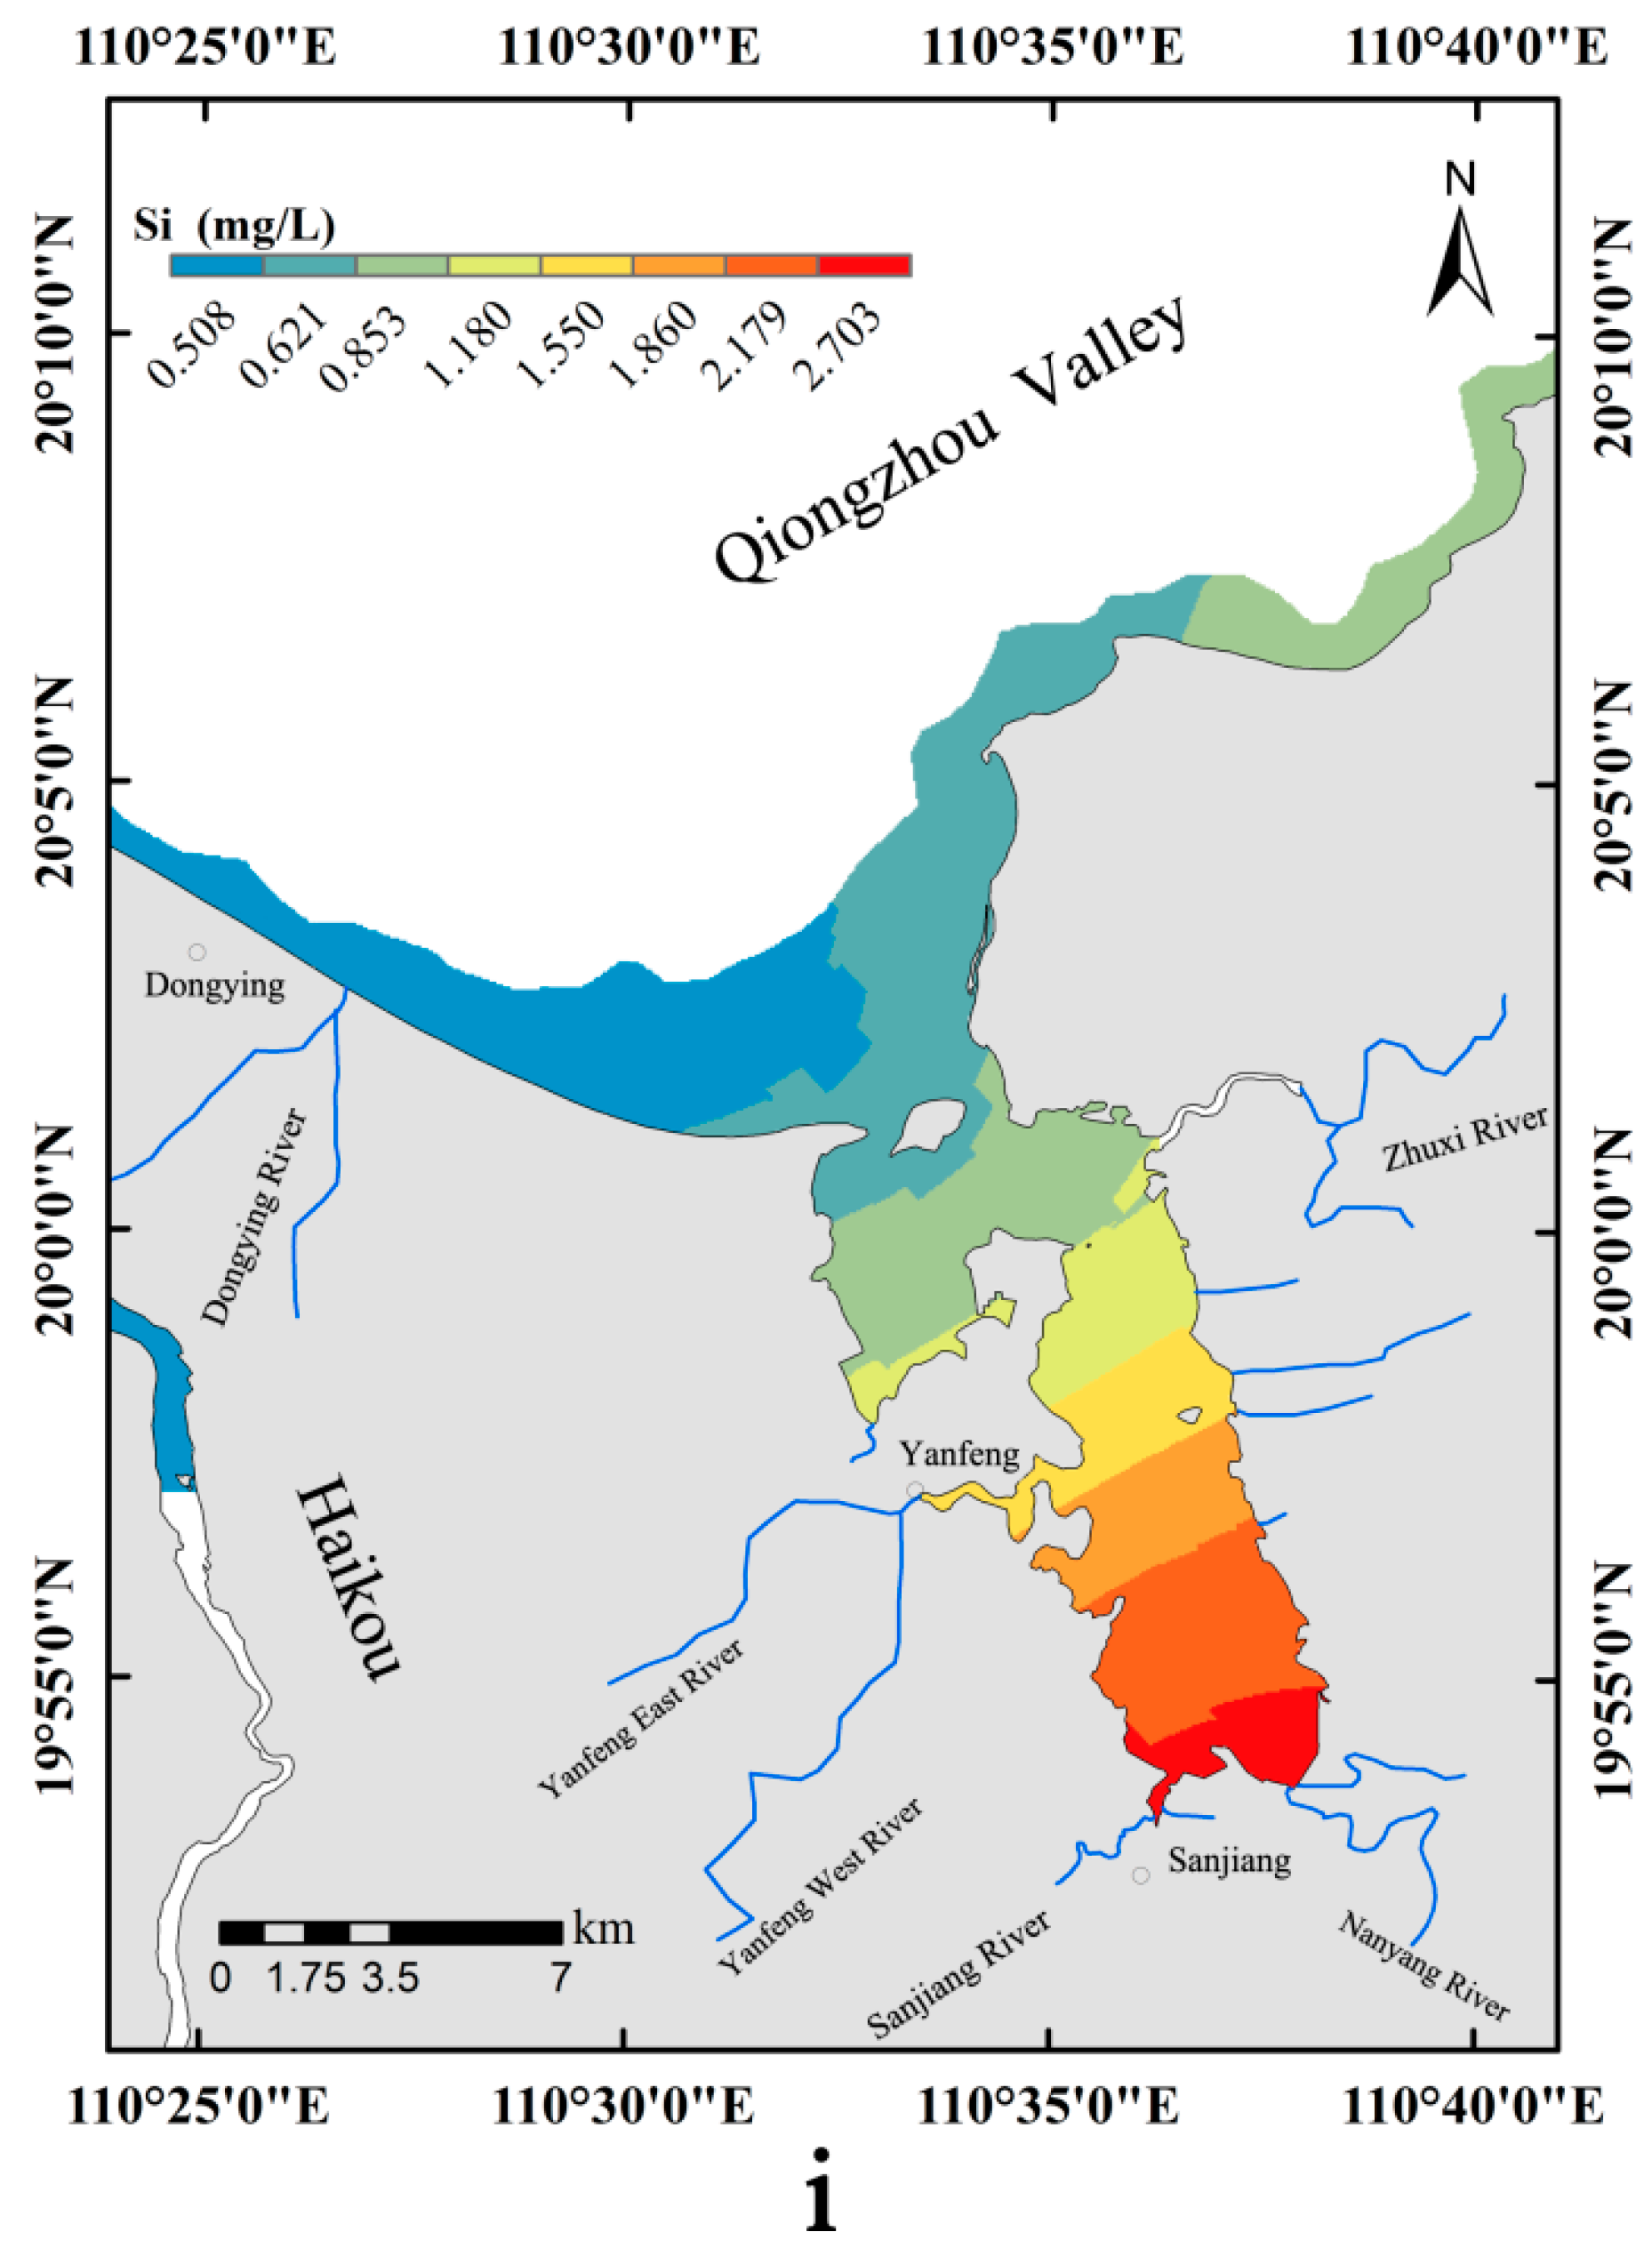
The silicate concentration ranged from 0.510 mg/L in station S1 to 2.780 mg/L in station S9, with an average of 1.191 mg/L. The coefficient of variation was 0.615, which indicated high variation. The silicate concentration progressively decreased from the inner part of Dongzhaigang to the outer part. Specifically, the area with a high silicate concentration was located at the estuary of the Sanjiang River and the Nangyang River, whereas the area with low concentration was located at the Dongying River.
3.3. Spatial Distribution of Heavy Metals
Obvious differences were found in the heavy metal concentrations in the study area. The calculation results of the average concentrations of seven metals in the seawater were ranked as follows (in µg/L): Zn (62.914) > Cr (8.533) > Pb (3.873) > As (1.315) > Cu (0.363) > Cd (0.303) > Hg (0.005), with concentration ranges of 27.830–97.560, 6.740–9.710, 0.030–28.400, 0.980–2.010, 0.150–2.320, 0.010–1.990, and 0.001–0.021 µg/L, respectively. The variations in the Pb, Cu, Cd, and Hg content were large and highly dependent on the environment. Compared with the People’s Republic of China Marine Water Quality Standard (GB 3097-1997) [12], the concentrations of Hg, Cr, Cu, As, and Cd were below the limits of I-Class, whereas those of Zn and Pb were below the limits of the III-Class and IV-Class, respectively. Therefore, Zn and Pb were the main sources of heavy metal pollution of this study area in 2013.
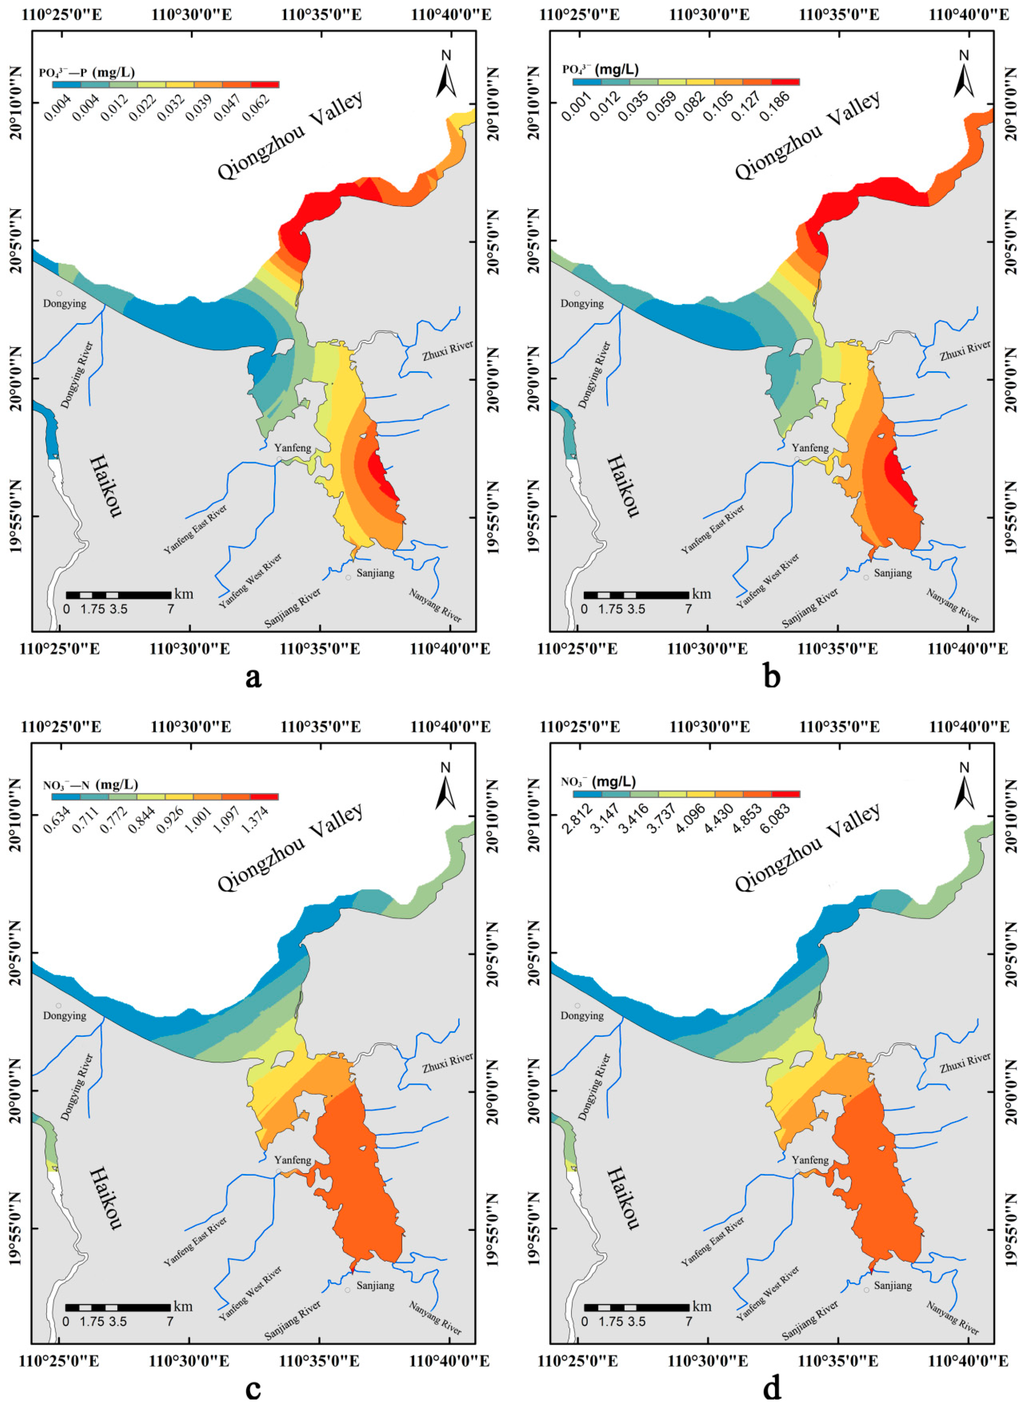
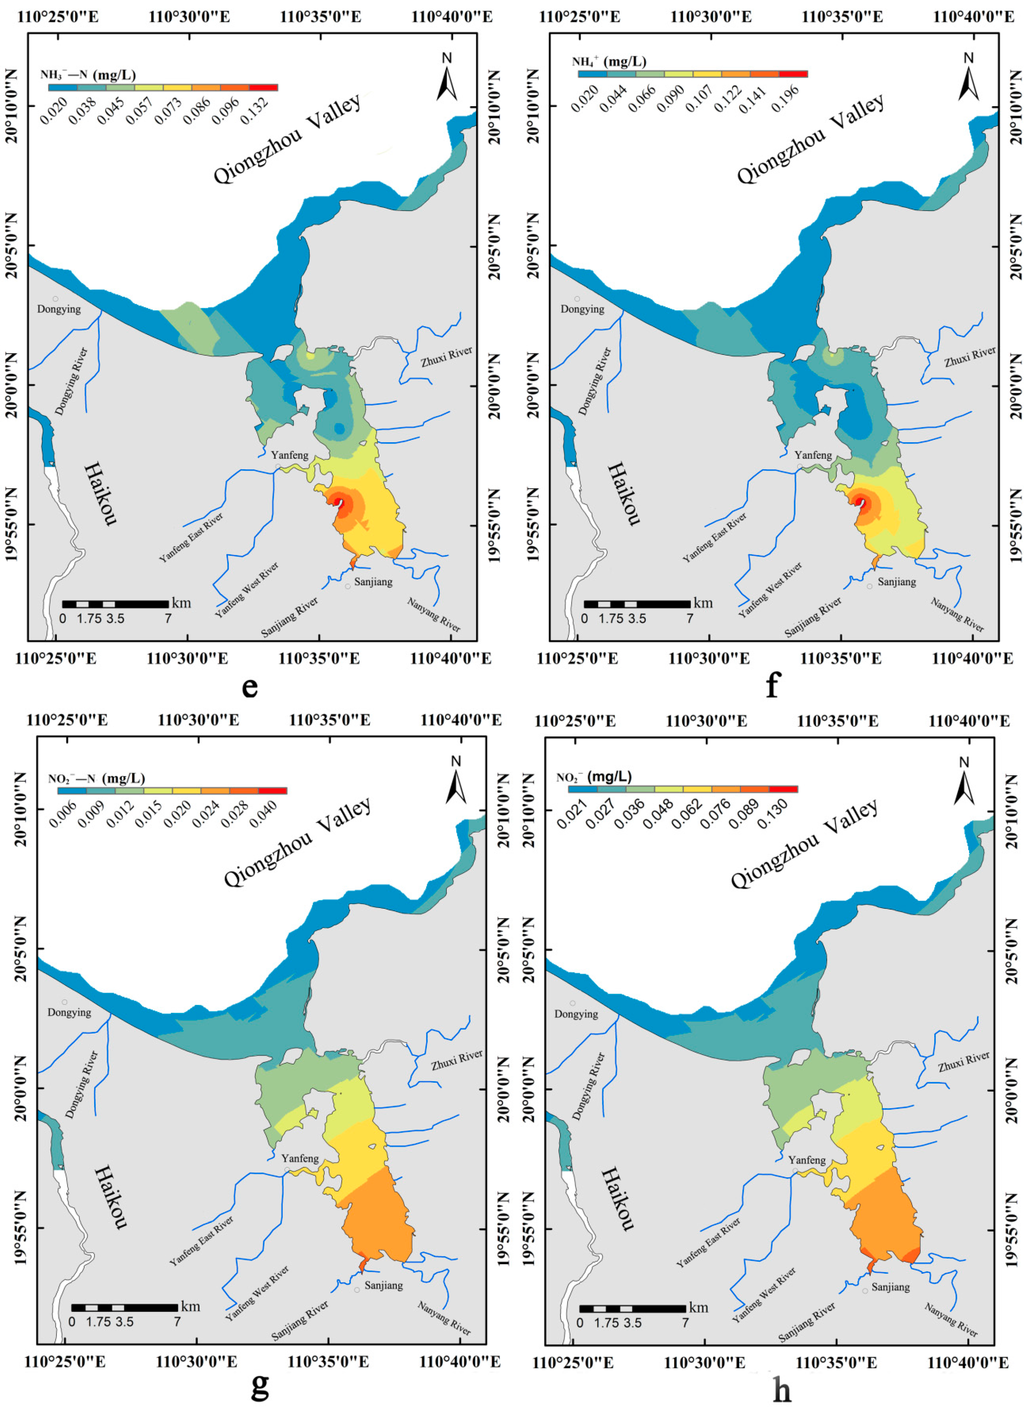

Figure 3.
Spatial distribution of nutrients. (a) Spatial distribution of PO43−–P; (b) spatial distribution of PO43−; (c) spatial distribution of NO3−–N; (d) spatial distribution of NO3−; (e) spatial distribution of NH3–N; (f) spatial distribution of NH4+; (g) spatial distribution of NO2−–N; (h) spatial distribution of NO2−; (i) spatial distribution of Si.

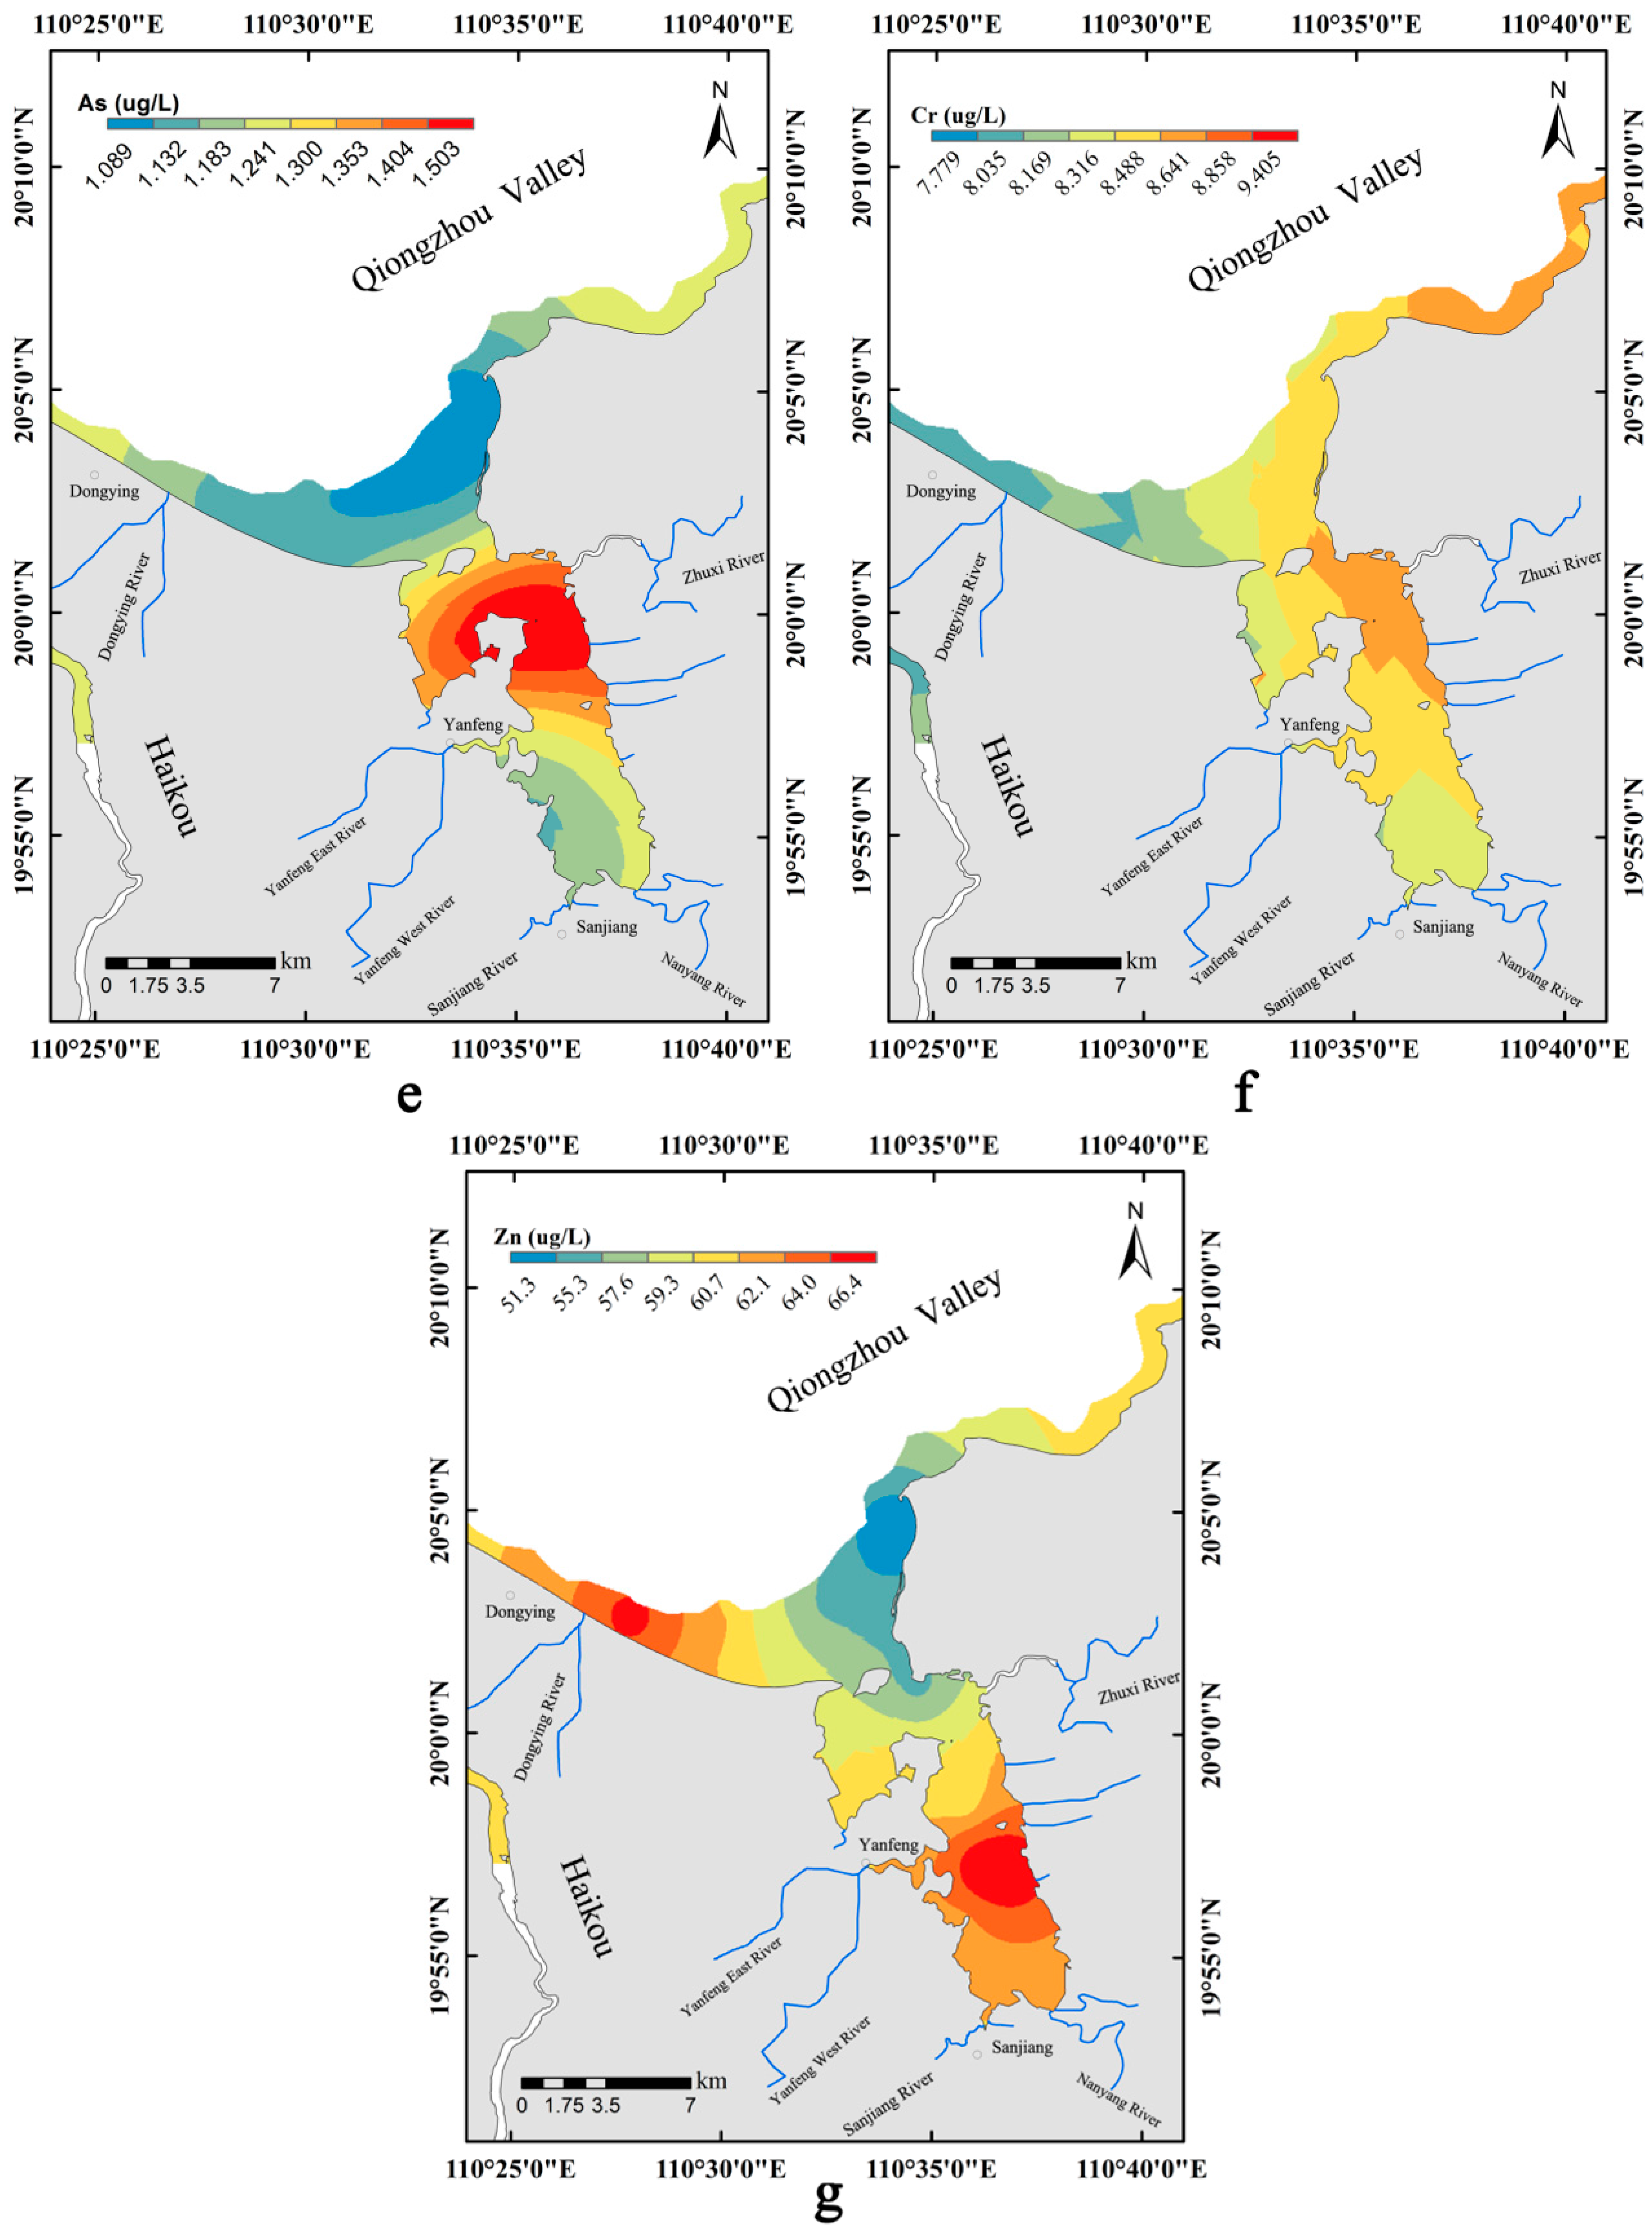
The spatial interpolation of the distribution of heavy metals is shown in Figure 4. The distributions of Pb and Cd were similar, with the same decreasing trend from the inner regions of Dongzhaigang to the outer regions. The areas of high Pb and Cd were located at the estuaries of the Sanjiang River and the Nanyang River, and the area of distribution was relatively small. The areas with low Pb and Cd concentrations were more extensive than the areas of high Pb and Cd, mainly located offshore. Moreover, the concentrations of Pb and Cd in S9 and S13 exceeded the limits of I-Class, whereas the concentrations in other stations were below the limits of I-Class. From the distribution of Hg, Cu, and As, we could tell that these elements shared a similar distribution pattern, i.e., decreasing concentrations from the estuary of the Zhuxi River (near S10 and S12) to its outward sides. The area of high Hg concentration was at the eastern coastal sea area of Yanfeng town (S10), the area of high Cu concentration was at the seashore area in Shangyuan village (S13), and the areas of high As concentration were mainly distributed in the western side of Xiachang village and the eastern side of Nanyang village (S8 and S12). The total content of Cr measured from each station was below the limits of I-Class without any obvious high value areas in Figure 3. In conclusion, the quantitative contribution of Cr was minimal even if the pollution due to the sum of heavy metals still existed. The concentration of Zn exceeded the limits of I-Class. Overall, the Zn level was below the limits of III-Class. Its distribution showed that Zn had two significant areas of high concentration (in the range 64.0–66.4 µg/L), i.e., at the estuary of Dongying River (S1) and in the eastern seashore area in Shangyuan village (S11 and S13).
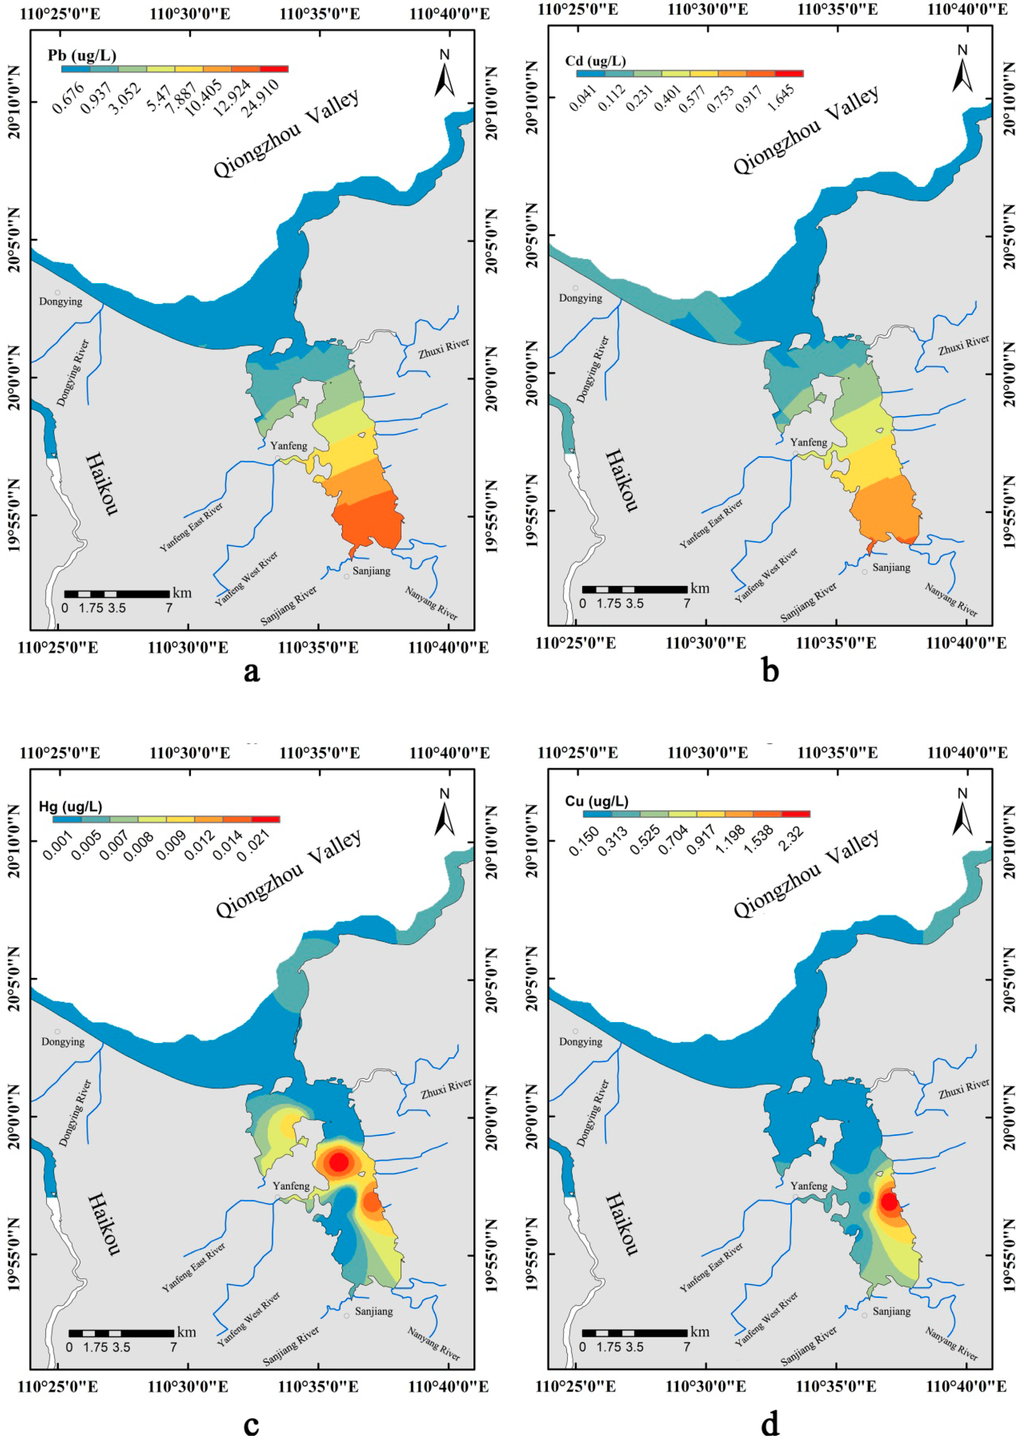

Figure 4.
Spatial distribution of heavy metals (a) Spatial distribution of Pb; (b) spatial distribution of Cd; (c) spatial distribution of Hg; (d) spatial distribution of Cu; (e) spatial distribution of As; (f) spatial distribution of Cr; (g) spatial distribution of Zn.
Figure 4.
Spatial distribution of heavy metals (a) Spatial distribution of Pb; (b) spatial distribution of Cd; (c) spatial distribution of Hg; (d) spatial distribution of Cu; (e) spatial distribution of As; (f) spatial distribution of Cr; (g) spatial distribution of Zn.

4. Discussion
4.1. Assessment of Organic Pollution
The index of organic pollution was mainly aimed at the comprehensive evaluation of organic pollution in seawater. Based on the single parameter pollution index of DO, COD, DIN, and dissolved inorganic phosphorus (DIP), this method could measure the level of organic pollution. In 2013, the organic pollution of water quality of this study area was measured by A, the index of organic pollution. The following equation was used:
where COD, DIN, DIP, and DO were the measured values of each sample station, whereas COD0, DIN0, DIP0, and DO0 were the seawater quality standard values. In accordance with The Division of Marine Function in Hainan Island (2011–2020) and “11th Five-Year Plan” for the Division of Marine Function in Haikou, the required quality of seawater in Dongzhaigang was not inferior to I-Class [20,21]. Thus, the I-Class seawater standard of the People’s Republic of China Marine Water Quality Standard (GB 3097-1997) was used as the evaluation standard in this paper (Table 1) [12]. The grade of comprehensive quality evaluations is given in Table 2.
Table 2.
Grade of comprehensive quality evaluations.
| A-Value | Polluted Condition Grade | Water Quality |
|---|---|---|
| <0 | 1 | Great |
| 0–1 | 2 | Good |
| 1–2 | 3 | polluted |
| 2–3 | 4 | slightly polluted |
| 3–4 | 5 | moderately polluted |
| >4 | 6 | seriously polluted |
Consequently, the value of organic pollution index was 6.82, and the pollution level reached level 6 in 2013. The sea area in this research was seriously polluted. Compared with the A value (2.02) of 2008, which was calculated by Li Pengshan for the same study area, the A value in this study is higher [11]. Li Pengshan only used II-Class water quality standards to evaluate the study area, which was obviously not appropriate for the water quality requirements of Dongzhaigang. In addition, the measured DIN content of Dongzhaigangin 2013 was larger, thereby leading directly to a larger A value.
The A value of each site ranged from 2.49 in station S3 to 11.67 in station S13. The maximum value was observed at station S13in the sea area near Shangyuan village. This result indicated that the condition of the shore area was more serious, especially the area to the north of Sanjiang town. According to the distribution status, we could infer that this sea area was disturbed by human activities, and the serious pollution was mainly caused by resident villagers because of the local organic pollution caused by marine aquaculture (intensive breeding of saltwater ducks and shrimp ponds especially) and the swine industry [8,9]. Tourism in Dongzhaigang was also an important factor in organic pollution [9]. However, the offshore area and estuary in Dongzhaigang had relatively minimal levels of organic pollution because of the developed hydrodynamics and strong fluidity [11,18,19]. The water exchange processes were rapid, thereby leading to the low level of organic pollution.
4.2. Evaluation of Eutrophication
4.2.1. Si:N:P Ratio of Nutrients
Silicate, reactive phosphate, and DIN are the necessary nutrients for phytoplankton growth and reproduction; these nutrients reflect the utilization of organic matter and the metabolic activity of marine life [22,23]. In addition to the impact of seasonal variations in diatoms, the distribution of silicate was mainly influenced by river runoff. DIN and phosphate were mainly derived from the death of marine organisms by oxidation and decomposition, as well as terrestrial runoff [24].
Si:N:P could be used as an important indicator of nutrient limitation of phytoplankton in water. Normally, when the ratio was 16:16:1, the normal absorption of these nutrients by phytoplankton would be able to maintain growth. Deviations in the concentration from this ratio might cause malnutrition of phytoplankton species, thereby limiting their growth [25,26]. Therefore, after several simulation experiments, Doetch (1989) and Justic (1995) proposed a criteria system for evaluating the stoichiometric constraints of each nutrient [27,28]. If Si:P > 22 and DIN:P > 22, then P was a limiting factor; if DIN:P < 10 and Si:DIN > 1, then the DIN was a limiting factor; and if Si:P < 10, and Si:DIN < 1, then silicon was a limiting factor. However, virtually all excess of N or P could not be used by phytoplankton. Therefore, potential eutrophication remained [27,28]. In the present study area, the Si:P, Si:DIN, and DIN:P ratios were 45.42, 1.15, and 39.49, respectively, thereby indicating that phosphate was the limiting factor for phytoplankton growth in Dongzhaigang. This conclusion was consistent with the fact that phosphate was the limiting factor for coastal waters of the estuary areas in China [23].
4.2.2. Analysis of the Composition of DIN
Each station in this sea area showed that NO3−–N was a main form of DIN that accounted for 94.07%; NH3–N was the secondary form of DIN, which accounted for 4.53%; and NO2−–N was the DIN with the lowest proportion, with only 1.39%. Previous studies showed that these characteristics were more obvious in the summer, because NH3–N and NO3−–N could be simultaneously utilized by phytoplankton in cases where the concentration of inorganic nitrogen is high [29,30]. The former would be converted into the latter, and the latter would in turn accumulate in the water. In addition, NO2−–N was only an unstable intermediate, which would continue to undergo oxidization and eventually be converted into NO3−–N. This result also demonstrated that DIN in seawater followed a trend of excessive accumulation, thereby indicating that the balance of DIN in this area was disturbed [29,30].
4.2.3. Eutrophication Level Method
Eutrophication could cause overgrowth of plankton, thereby inducing red tide [19]. The eutrophication index, E, was used to evaluate the eutrophication of seawater in this study area. The equation was as follows:
where COD, DIN, and DIP were the measured values of each sample station (mg/L). The grade of nutritional level evaluation is shown in Table 3.
Table 3.
Grade of nutritional level evaluation.
| E-Value | Nutritional Level Grade | Nutritional Level |
|---|---|---|
| 0–0.5 | 1 | oligotrophication |
| 0.5–1.0 | 2 | less eutrophication |
| 1.0–3.0 | 3 | eutrophication |
| ≥3.0 | 4 | high eutrophication |
As a result, the mean value of E was 10.363, and the nutritional level reached level 4 in 2013, which shows that the seawater was at the level of high eutrophication. The E value of each site ranged from 0.009 in station S3 to 33.063 in station S7. Only four stations of Dongzhaigang (S1, S2, S3, and S4), distributed along the coast and estuaries, had an E value between 0 and 0.5, which indicates that these stations were at the level of oligotrophication. The E values of other stations were more than 3.0, which implied that these stations had high eutrophication. Among these stations, the E values of S7 and S9 were more than 33.0 because the concentration of COD was higher. The distribution of E also showed that the shore area was more seriously polluted, especially in the north of Sanjiang town. With respect to the E value of 5.980 for Dongzhaigang calculated by Li, this index was increasing over the years [11]. This value implied that the eutrophication in this study area would be more serious.
4.3. Assessment of Heavy Metals in Seawater
4.3.1. Comparison with Other Study Areas
In this study, we selected the typical areas, investigated them in the same season, and compared the measured values with the concentration of heavy metals in Dongzhaigang surface water (Table 4). Except for Cu and Hg, the concentration of heavy metals in Dongzhaigang was obviously higher than those of the Beilun River Estuary Wetland in China and the Sungei Buloh Wetland Reserve in Singapore [31,32]. The concentration of heavy metals in the Yangtze River Estuary was similar to that of Dongzhaigang [33]. Cu and Hg concentrations in the former were significantly higher, which might be associated with the flow of water into the Yangtze River. The Zn and Cr concentrations in this study were higher than those in the Seletar River of Singapore [32]. Compared with gulfs and ports such as the Gulf of Suez in Egypt and Port Jackson in Australia, a similar situation was found in the present study [34,35]. This result could be attributed to the fact that Dongzhaigang was a semi-enclosed sea port and similar to a gulf. Dongzhaigang was surrounded by land, the self-purification of which was poor because of the slow switching speed in water. In addition, given the impact of human activity, higher concentrations of heavy metals accumulated. The concentrations of heavy metals in Dongzhaigang surface water were significantly higher than in the South China Sea, because the sampling stations in the South China Sea were distributed along the offshore area, which was less disturbed by human activities and had a stronger self-purification capacity [36].
Table 4.
Comparison of heavy metal accumulation in the surface seawater with the reported values in the literatures (μg/L).
| Sample Area | As | Cd | Cu | Hg | Pb | Zn | Cr | Ref. |
|---|---|---|---|---|---|---|---|---|
| Dongzhaigang Mangrove Wetland | 1.315 | 0.3028 | 0.3631 | 0.005 | 3.873 | 62.913 | 8.533 | This study |
| Beilun River Estuary Wetland, Guangxi | 0.75 | 0.030 | 0.77 | 0.092 | 0.79 | 14.50 | 0.50 | [31] |
| Sungei Buloh Wetland Reserve, Singapore | 0.470 | 0.159 | 0.284 | ND | 0.193 | 1.577 | 0.094 | [32] |
| Seletar River, Singapore | 1.080 | 0.254 | 0.640 | ND | 0.980 | 3.731 | 0.640 | [32] |
| The Yangtze River Estuary, China | ND | 0.076 | 3.10 | 0.026 | 2.150 | ND | ND | [33] |
| The Gulf of Suez, Egypt | ND | 0.150–0.180 | 1.16–5.33 | ND | 1.840–2.570 | 8.130–23.240 | ND | [34] |
| Port Jackson, Australia | ND | 0.006–0.104 | 0.932–2.55 | ND | ND | 3.27–9.66 | ND | [35] |
| South China Sea | ND | 0.007 | 0.100 | ND | 0.058 | 0.086 | ND | [36] |
| The South Yellow Sea, China | 1.66 | 0.053 | 1.12 | 0.009 | 0.30 | 3.44 | ND | [37] |
| Bohai, China | 0.79–2.06 | 0.08–0.19 | 1.60–4.10 | 0.004–0.009 | 3.63–12.65 | 3.0–55.0 | 0.11–1.15 | [38] |
| Tanshui Coast, Taiwan | ND | 0.03–0.14 | 0.37–1.74 | ND | 0.09–0.43 | 10.3–74.9 | 4.35–6.86 | [39] |
Note: “ND” means no data.
Compared with the Zn and Pb concentrations in the Yellow Sea, high levels of Zn and Pb were found in Bohai and Dongzhaigang, China [37,38]. The Zn concentration off the Tanshui coast of Taiwan was also high [39]. The excessive concentration of Zn reflected the seriousness of pollution along the shore area. With the rapid economic development of the protected area in recent years, the agricultural, solid waste, and aquacultural wastewater discharge, and all kinds of shipping activities resulted in the extensive Zn pollution [40]. Pb monitoring is often used to evaluate the presence of anthropogenic pollution in the environment. Thus, Pb is not metabolically regulated for organisms and comes from human activities. Pb usually originates from atmospheric sedimentation and wastewater discharge, but mostly from aquaculture wastewater [38,39].
4.3.2. Water Quality Index (WQI) Model
The WQI is a mathematical instrument used for transforming large quantities of water characterization data into a single number, which represents the water quality level [41]. In the present study, we used the water quality index model to evaluate the pollution of heavy metals. The following equations were used:
where C was the measured value of each sample station; S was the I-Class standard values of seawater quality; and n was the number of factors [42]. The obtained P and WQI values are shown in Table 5.
Table 5.
Grade of heavy metal pollution.
| P | WQI | Pollution Level |
|---|---|---|
| P ≤ 1 | WQI ≤ 1 | less polluted |
| - | 1 < WQI ≤2 | slightly polluted |
| - | 2 < WQI ≤ 3 | moderately polluted |
| P > 1 | WQI > 3 | seriously polluted |
Note: “-” means no data.
Results showed that the mean value of WQI was 1.10, which implied that the sea area in this research was slightly polluted by heavy metals. Only two stations had a WQI greater than 3, namely 3.70 in station S9 and 5.16 in station S13. The WQI of other stations was less than 1. The stations S9 and S13 had been seriously polluted by heavy metals. In addition, this conclusion was consistent with the results of single pollution index of heavy metals in this area. The p value of heavy metals in seawater followed the following order: Pb > Zn > Cd > Cr > Hg > Cu > As. The concentrations of Hg, Cr, Cu, As, and Cd reached National Grade I, whereas Zn and Pb were the vital pollution factors in Dongzhaigang.
4.4. Results of Genetic Algorithm-Based Fuzzy Comprehensive Evaluation in the Health Assessment of Water Quality
The water environment itself is controlled by multiple factors and can be considered a complex and nonlinear fuzzy system, whereas the determination of the purpose-level classification, evaluation criteria, and methods are all fuzzy. Therefore, fuzzy mathematics has been widely used in water quality evaluation [43,44,45]. Given the natural uncertainty of the index value in water quality evaluation, the evaluation of water quality may be treated as a type of fuzzy problem [13]. To improve the correctness of water quality evaluation in Dongzhaigang, the fuzzy comprehensive evaluation method can be applied. The reliability and correctness of this method are mainly decided by the reasonable distribution of the weight of the factors and the choice of evaluation model. One of the difficult points is to synthesize the problems scientifically with various indexes into a form with a single index. Reasonable confirmation of the weight of these indexes is essential. The current processing method is strongly subjective and cannot be used to obtain the optimal judging matrix; this method can only amend individual elements in the judging matrix [13,14]. The current processing method lacks underlying scientific theory and method. To compensate for the disadvantages of the current method, the genetic algorithm is introduced into the fuzzy comprehensive evaluation method to amend the consistency of the judging matrix and to calculate the weight of each evaluation index [13,14,15,45,46,47]. Comprehensive evaluation quantified indexes reflect the assessed objects by establishing subsets, and the evaluation results are obtained by integrating all indexes with a transform principal.
Based on the abovementioned steps, the evaluation matrix C = c(i,j) could be constructed as (with the values for DIN as an example):
where S (i) = (0.152,0.337,0.070,0.241,0.221,0.417,0.288,0.052,0.229,0.108,0.160,0.320,0.296).
Given the relative importance parameter value of bm = 8, the judging matrix B = (bik)n × m could be constructed as follows:
Based on the judging matrix B = (bik)n × m and S(i), the weight matrix W = (w1, w2, …, wp), could be calculated by Matlab7.0 as
W = (0.0198, 0.0747, 0.0306, 0.0308, 0.0098, 0.5939, 0.0533, 0.0084, 0.0602, 0.0001, 0.0287, 0.0448, 0.0439).
The consistency coefficient of the weight matrix W was 0.0518 (<0.1), which indicated that the matrix was satisfied.
By taking the station S1 as an example, the membership matrix R was as follows:
The comprehensive evaluation vector was S = W · R = (0.0747, 0.0306, 0.5939, 0.2500). Similarly, the comprehensive evaluation vector S of each station could be calculated.
To compare the results more directly, we constructed V = {vs} = (4,3,2,1), which represented each grade of water quality (Table 6). The quantization value of comprehensive evaluation was N = S · V, which gave the score of each station. The consequences are presented by ArcGis in Figure 5.
Table 6.
Comprehensive evaluation of quantitative grading standard.
| N Value | Assessment | Grade |
|---|---|---|
| N ≥ 3.6 | Healthy | Good |
| 2.8 ≤ N < 3.6 | Sub-healthy | Normal |
| 2 ≤ N < 2.8 | Less healthy | Poor |
| N < 2 | Unhealthy | Very poor |
Figure 5 indicates that the quantization value of the comprehensive evaluation of each station was less than 2.8, which implied that all the stations had poor or very poor levels. Only five stations (S2, S6, S5, S9, and S13) were rated “poor,” which meant the water quality of these stations was less healthy. The other stations were rated “very poor,” which meant that the water quality of these stations was unhealthy. Generally, this conclusion was consistent with the results of the various assessment methods in this study area. Consequently, the genetic algorithm-based fuzzy comprehensive evaluation indicated that the water quality of Dongzhaigang was not healthy.

Figure 5.
Consequences of comprehensive evaluation.
Figure 5.
Consequences of comprehensive evaluation.
5. Conclusions
The data in this study suggest that the water monitoring indexes in seawater samples from the Dongzhaigang National Mangrove Nature Reserve more or less exceeded the I-Class seawater standard in July 2013. Among these, DIN standard was the most serious and was below the limits of only the IV-class seawater standard. The PO43−–P, DO, and Pb concentrations were below the limits of the II-Class seawater standard, whereas the oil and Zn concentrations were below the limits of the III-Class seawater standard. Meanwhile, the COD, BOD5, Cr, Hg, Cu, As, and Cd concentrations were below the limits of the I-Class seawater standard.
The index of organic pollution showed that the pollution level in this study area reached level 6 in 2013. Therefore, the sea area under study was seriously polluted. This result was mainly due to the increase in DIN concentration in recent years. The measured eutrophication level showed that the nutritional level was 4; that is, the seawater had a high level of eutrophication. Among all the sampling stations, stations S7 and S9 had relatively higher eutrophication. In addition, NO3−–N was the main form of DIN, thereby reflecting the fact that DIN in seawater followed a trend of excess accumulation. Phosphate was the limiting factor for phytoplankton growth in Dongzhaigang. The water quality index model showed that the sea area in this research was slightly polluted by heavy metals. The average concentrations of the seven metals in seawater were ranked Zn > Cr > Pb > As > Cu > Cd > Hg; Zn and Pb were the vital pollution factors in Dongzhaigang. The spatial variation of heavy metals showed a decreasing trend from the inner to outer parts of Dongzhaigang; the high concentration was probably caused by human activities in the inner part of the region, such as the waste water discharge of the swine industry and aquaculture. Moreover, the genetic algorithm-based fuzzy comprehensive evaluation indicated that the water quality of Dongzhaigang was not healthy.
Overall, the water quality in the inner parts of Dongzhaigang (southwest) is poorer than that of the external parts (northeast). The distribution of the increasing trend spreads from the near-shore to the offshore regions, with low distribution, terrestrial input, coastal river diluted water, and salinity as the main factors. The monitoring indicators of high concentration areas were detected in Beipai village of Yanfeng town, Shangyuan village, and the estuary of Sanjiang River (near stations S9 and S13), which indicated that more frequent and intensive human activities in these regions affected the coastal waters. Therefore, the Dongzhaigang National Mangrove Nature Reserve needs to be further protected by the government. Reasonable limits of human disturbance are necessary to reduce water pollution.
Acknowledgments
This study was funded by grants from the China Geological Survey (Grant No. 1212010914020), the National Natural Science Foundation of China (Grant No. 41001341), the Fundamental Research Funds for the Central Universities (Grant No. 2014ZZ0012), the Ministry of Water Resources Special Funds for Scientific Research Projects of Public Welfare Industry (201401048), and a research project jointly funded by Guangdong Province and China’s Ministry of Education (Grant No. 2012B091100143). We are grateful to Chang-zhu Liu, Ming Ruan, and other colleagues from the Geological Survey Institute of Hainan Province for their help in field sample collection and analysis.
Author Contributions
Jiasheng Wen performed the experiments, processed the data, and wrote the manuscript. Feng Li, the supervisor of Jiasheng Wen, Kaixuan Shen, Xiangyun Zeng, Yanyan Liang, Xiaolin Long, and Yansha Wei, designed the study, and reviewed and revised the manuscript. Kaixuan Shen, Xiangyun Zeng, Yanyan Liang, Xiaolin Long, and Yansha Wei participated in the experiment, processed the data, and contributed to the genetic algorithm calculation. Haijun He, Huayang Gan, and Jinwei Zhang gave their support through the field experiments.
Conflicts of Interest
The authors declare no conflict of interest.
References
- Garcia-Barcina, J.M.; Gonzalez-Oreja, J.A.; de la Sota, A. Assessing the improvement of the bilbao estuary water quality in response to pollution abatement measures. Water Res. 2006, 40, 951–960. [Google Scholar] [CrossRef] [PubMed]
- Zagars, M.; Ikejima, K.; Kasai, A.; Arai, N.; Tongnunui, P. Trophic characteristics of a mangrove fish community in southwest thailand: Important mangrove contribution and intraspecies feeding variability. Estuar. Coast. Shelf Sci. 2013, 119, 145–152. [Google Scholar] [CrossRef]
- Qiu, Y.W.; Yu, K.F.; Zhang, G.; Wang, W.X. Accumulation and partitioning of seven trace metals in mangroves and sediment cores from three estuarine wetlands of Hainan Island, China. J. Hazard. Mater. 2011, 190, 631–638. [Google Scholar] [CrossRef] [PubMed]
- Cloern, J.E. Our evolving conceptual model of the coastal eutrophication problem. Mar. Ecol. 2001, 210, 223–253. [Google Scholar] [CrossRef]
- Boesch, D.F. Challenges and opportunities for science in reducing nutrient over-enrichment of coastal ecosystems. Estuaries 2002, 25, 886–900. [Google Scholar] [CrossRef]
- Chen, W.; Chen, C.; Li, L.; Xing, L.; Huang, G.; Wu, C. Spatiotemporal analysis of extreme hourly precipitation patterns in Hainan Island, South China. Water 2015, 7, 2239–2253. [Google Scholar] [CrossRef]
- Liao, Q.Y.; Li, J.; Zhang, J.H.; Li, M.; Lu, Y.; Xu, R.L. An ecological analysis of soil sarcodina at Dongzhaigang mangrove in Hainan Island, China. Eur. J. Soil Biol. 2009, 45, 214–219. [Google Scholar] [CrossRef]
- Lin, H.W.; Lin, W.H. The damages and controlling strategies of Sphaeroma in Dongzhaigang Mangroves. Trop. For. 2013, 4, 35–36. (In Chinese) [Google Scholar]
- Xu, D.; Liao, B.W.; Zhu, N.H.; Guan, W.; Li, S.C.; Zhong, C.R. A primary analysis on mangroves degradation in Dongzhaigang of Hainan Island. Ecol. Sci. 2014, 2, 294–300. (In Chinese) [Google Scholar]
- Aydinol, F.; Ilter, T.; Gurdal, K.; Hurrem, B. Sea water quality assessment of Prince Islands’ Beaches in Istanbul. Environ. Monit. Assess. 2012, 184, 149–160. [Google Scholar] [CrossRef] [PubMed]
- Li, P.; Xie, G.; Li, Q.; Chen, X.; Zhou, Q. Analysis and evaluation of seawater quality status of mangrove national nature reserve in Dongzhai port. Trans. Oceanol. Limnol. 2010, 41, 53–60. (In Chinese) [Google Scholar]
- Ministry of Environmental Protection of China (MEP). Sea Water Quality Standard (GB3097–1997); MEP: Beijing, China, 1997; pp. 654–658. (In Chinese) [Google Scholar]
- Liu, S.; Butler, D.; Brazier, R.; Heathwaite, L.; Khu, S.T. Using genetic algorithms to calibrate a water quality model. Sci. Total Environ. 2007, 374, 260–272. [Google Scholar] [CrossRef] [PubMed]
- Van Dijk, M.; van Vuuren, S.J.; van Zyl, J.E. Optimising water distribution systems using a weighted penalty in a genetic algorithm. Water SA 2008, 35, 537–548. [Google Scholar]
- Xu, T.Y.; Qin, X.S. Solving Water Quality Management Problem through Combined Genetic Algorithm and Fuzzy Simulation. J. Environ. Inf. 2013, 22, 39–48. [Google Scholar] [CrossRef]
- General Administration of Quality Supervision, Inspection and Quarantine of the People’s Republic of China (GAQSIQ). The Specification for Marine Monitoring Part 3: Sample Collection, Storage and Transportation (GB17378.3-2007); GAQSIQ: Beijing, China, 2007. (In Chinese) [Google Scholar]
- General Administration of Quality Supervision, Inspection and Quarantine of the People’s Republic of China (GAQSIQ). The Specification for Marine Monitoring Part 4: Seawater Analysis (GB17378.4-2007); GAQSIQ: Beijing, China, 2007. (In Chinese) [Google Scholar]
- Brockmann, U.H.; Laane, R.W.P.M.; Postma, J. Cycling of nutrient elements in the North Sea. Neth. J. Sea Res. 1990, 26, 239–264. [Google Scholar] [CrossRef]
- Kim, J.B.; Hong, S.; Lee, W.C.; Lee, Y.W.; Kim, H.C.; Cho, Y. Evaluation of phytoplankton community composition in the eutrophic Masan Bay by HPLC pigment analysis. J. Environ. Biol. 2015, 36, 491–498. [Google Scholar] [PubMed]
- Ssfcn. “11th Five-Year Plan” for the Division of Marine Function in Haikou. Available online: http://www.ssfcn.com (accessed on 21 August 2010).
- Anhuinews. The Division of Marine Function in Hainan Island (2011–2020). Available online: http://www.anhuinews.com/zhuyeguanli/system/2012/11/08/005306040.shtml (accessed on 8 November 2012).
- Conley, D.J.; Malone, T.C. Annual cycle of dissolved silicate in Chesapeake Bay: Implications for the production and fate of phytoplankton biomass. Mar. Ecol. Prog. 1992, 81, 121–128. [Google Scholar] [CrossRef]
- Li, M.; Xu, K.; Watanabe, M.; Chen, Z. Long-term variations in dissolved silicate, nitrogen, and phosphorus flux from the Yangtze River into the East China Sea and impacts on estuarine ecosystem. Estuar. Coast. Shelf Sci. 2007, 71, 3–12. [Google Scholar] [CrossRef]
- Howarth, R.W.; Marino, R. Nitrogen as the limiting nutrient for eutrophication in coastal marine ecosystems: Evolving views over three decades. Limnol. Oceanogr. 2006, 51, 364–376. [Google Scholar] [CrossRef]
- Redfield, A.C. The influence of organisms on the composition of sea-water. Sea 1963, 2, 26–77. [Google Scholar]
- Brzezinski, M.A. The Si:C:N ratio of marine diatoms: Interspecific variability and the effect of some environmental variables1. J. Phycol. 1985, 21, 347–357. [Google Scholar] [CrossRef]
- Dortch, Q.; Packard, T.T. Differences in biomass structure between oligotrophic and eutrophic marine ecosystems. Deep Sea Res. A 1989, 36, 223–240. [Google Scholar] [CrossRef]
- Justic, D.; Rabalais, N.N.; Turner, R.E. Stoichiometric nutrient balance and origin of coastal eutrophication. Mar. Pollut. Bull. 1995, 30, 41–46. [Google Scholar] [CrossRef]
- Horrigan, S.G.; Montoya, J.P.; Nevins, J.L.; Mccarthy, J.J. Natural isotopic composition of dissolved inorganic nitrogen in the Chesapeake Bay. Estuar. Coast. Shelf Sci. 1990, 30, 393–410. [Google Scholar] [CrossRef]
- Wong, W.W.; Grace, M.R.; Cartwright, I.; Cook, P.L.M. Sources and fate of nitrate in a groundwater-fed estuary elucidated using stable isotope ratios of nitrogen and oxygen. Limnol. Oceanogr. 2014, 59, 1493–1509. [Google Scholar] [CrossRef]
- Luo, W.C.; Su, B.; Liu, X.; Zhong, Q.P.; Yang, B. Spatial and temporal distributions and influence factors of the dissolved heavy metals in surface water in the mangrove reserve at the Beilun River Estuary in Guangxi. Mar. Sci. Bull. 2014, 6, 668–675. (In Chinese) [Google Scholar]
- Cuong, D.T.; Bayen, S.; Wurl, O.; Subramanian, K.; Wong, K.K.; Sivasothi, N.; Obbard, J.P. Heavy metal contamination in mangrove habitats of singapore. Mar. Sci. Bull. 2006, 50, 1732–1738. [Google Scholar] [CrossRef] [PubMed]
- Wang, B.; Liu, A. Distribution changes of dissolved heavy metal concentration in Changjiang estuary and its adjacent waters, 1984–2000. Mar. Sci. Bull. 2003, 22, 32–38. (In Chinese) [Google Scholar]
- El-Moselhy, K.M.; Gabal, M.N. Trace metals in water, sediments and marine organisms from the northern part of the gulf of suez, Red Sea. J. Mar. Syst. 2004, 46, 39–46. [Google Scholar] [CrossRef]
- Hatje, V.; Apte, S.C.; Hales, L.T.; Birch, G.F. Dissolved trace metal distributions in port jackson estuary (sydney harbour), Australia. Mar. Sci. Bull. 2003, 46, 719–730. [Google Scholar] [CrossRef]
- Yu, T. Study about dissolved heavy metals and their background values in South China Sea. J. Oceanogr. Taiwan Strait 2003, 22, 328–333. [Google Scholar]
- He, Z.P. Variation characteristics and controlling factors of heavy metals in the south yellow sea surface seawaters. Environ. Sci. 2008, 29, 1153–1162. (In Chinese) [Google Scholar]
- Meng, W.; Qin, Y.; Zheng, B.; Zhang, L. Heavy metal pollution in Tianjin Bohai bay, China. J. Environ. Sci. 2008, 20, 814–819. [Google Scholar] [CrossRef]
- Fang, T.H.; Hwang, J.S.; Hsiao, S.H.; Chen, H.Y. Trace metals in seawater and copepods in the ocean outfall area off the northern Taiwan coast. Mar. Environ. Res. 2006, 61, 224–243. [Google Scholar] [CrossRef] [PubMed]
- Bervoets, L. Metal concentrations in water, sediment and gudgeon (Gobio gobio) from a pollution gradient: Relationship with fish condition factor. Environ. Pollut. 2003, 126, 9–19. [Google Scholar] [CrossRef]
- Sánchez, E.; Colmenarejo, M.F.; Vicente, J.; Rubio, A.; García, M.G.; Travieso, L.; Borja, R. Use of the water quality index and dissolved oxygen deficit as simple indicators of watersheds pollution. Ecol. Indic. 2007, 7, 315–328. [Google Scholar] [CrossRef]
- Flores, J.C. Comments to the use of water quality indices to verify the impact of cordoba city (Argentina) on Suquia river. Water Res. 2002, 36, 4664–4666. [Google Scholar] [CrossRef]
- Zhang, X.Q.; Liang, C. Application of fuzzy matter-element model based on coefficients of entropy in comprehensive evaluation of water quality. J. Hydraul. Eng. 2005, 36, 1057–1061. [Google Scholar]
- Wu, J.W.; Wu, X.M.; Bo, W.; Hu, N.L.; Guo, L.; Zhang, K.C. Application to water quality assessment based on the fuzzy pattern recognition model by projection pursuit. J. Water Resour. Water Eng. 2008, 3, 93–97. (In Chinese) [Google Scholar]
- Fulazzaky, M.A. Water quality evaluation system to assess the status and the suitability of the citarum river water to different uses. Environ. Monit. Assess. 2010, 168, 669–684. [Google Scholar] [CrossRef] [PubMed]
- Sadati, S.K.; Speelman, S.; Sabouhi, M.; Gitizadeh, M.; Ghahraman, B. Optimal irrigation water allocation using a genetic algorithm under various weather conditions. Water 2014, 6, 3068–3084. [Google Scholar] [CrossRef]
- Liu, W.-C.; Chung, C.-E. Enhancing the predicting accuracy of the water stage using a physical-based model and an artificial neural network-genetic algorithm in a river system. Water 2014, 6, 1642–1661. [Google Scholar] [CrossRef]
© 2015 by the authors; licensee MDPI, Basel, Switzerland. This article is an open access article distributed under the terms and conditions of the Creative Commons Attribution license (http://creativecommons.org/licenses/by/4.0/).