Article

The Influence of Natural and Anthropogenic Forcing on Water and Energy Balance and on Photosynthesis

1
Innovative Meteorological Research Department, National Institute of Meteorological Sciences, Seogwipo-si 63568, Korea
2
Numerical Modeling Group, Korea Institute of Atmospheric Prediction Systems (KIAPS), Seoul 07071, Korea
*
Author to whom correspondence should be addressed.
Land 2021, 10(11), 1151; https://doi.org/10.3390/land10111151
Submission received: 3 August 2021 / Revised: 22 October 2021 / Accepted: 27 October 2021 / Published: 29 October 2021
(This article belongs to the Special Issue Feature Papers for Land–Climate Interactions Section)

Abstract

:
Land surface processes are rarely studied in Detection and Attribution Model Inter-comparison Project (DAMIP) experiments on climate change. We analyzed a CMIP6 DAMIP historical experiment by using multi-linear regression (MLRM) and analysis of variance methods. We focused on energy and water budgets, including gross primary productivity (GPP). In MLRM, we estimated each forcing’s contribution and identified the role of natural forcing, which is usually ignored. Contributions of the forcing factors varied by region, and high-ranked variables such as net radiation could receive multiple influences. Greenhouse gases (GHG) accelerated energy and water cycles over the global land surface, including evapotranspiration, runoff, GPP, and water-use efficiency. Aerosol (AER) forcing displayed the opposite characteristics, and natural forcing accounted for short-term changes. A long-term analysis of total soil moisture and water budget indicated that as the AER increases, the available water on the global land increases continuously. In the recent past, an increase in net radiation (i.e., a lowered AER) reduced surface moisture and hastened surface water cycle (GHG effect). The results imply that aerosol emission and its counterbalance to GHG are essential to most land surface processes. The exception to this is GPP, which was overdominated by GHG effects.

1. Introduction

Understanding climate change is important for scientific research and future policy planning. The Earth System Model (ESM) has become a key tool for understanding climate systems and evaluating climate extremes in the future [1]. Currently, the Coupled Model Inter-comparison Project (CMIP), by using multiple ESMs, plays a central role in climatological research and projection by climate change communities such as the International Panel on Climate Change (IPCC) [2]. Standardized scales, inputs, and file formats have facilitated the inter-comparison and ensemble analysis of models [2]. Recently, CMIP6 (6 Phase) was developed as a new-generation tool with a more complex model system than previous versions, adopting improved physical/chemical processes and providing finer spatial resolutions [2].
The Detection and Attribution Model Inter-comparison Project (DAMIP) experiment is one of the CMIP6-Endorsed MIPs (experiments). This MIP investigates external force attributions and provides observational constraints on the climate system [2]. This constrained experiment can assist both scientists attempting to understand the climate system and policymakers that are developing future plans. The DAMIP was conceptualized by CMIP3, but few of its studies were publicly available before CMIP5. By separating forcing experiments from synthetic forcing, the DAMIP in CMIP6 enables assessments of anthropogenic impacts (e.g., greenhouse gas emission and aerosols), thus highlighting human influences on climate change and providing climate system behaviors such as the transient climate response (TCR) [3].
CMIP6 has employed new models and reduced the uncertainties in anthropogenic-related forcing by clarifying the separation between greenhouse gases and other anthropogenic emissions. In CMIP5, the aerosols were not separated from anthropogenic emissions. Rather, DAMIP historical simulation initially included only the changes in natural forcing and greenhouse gases (GHG), although separation was later performed in CMIP5 [3,4]. Aerosol separation has been emphasized because aerosols can be anthropologically (e.g., air pollutants) or naturally (e.g., volcano) sourced. The problem with unclear separation has largely propagated uncertainties of climate model by the interaction with other factors such as ozone and land use, especially as simulation periods lengthen and the models become updated to sophisticated chemical reactions. The uncertainties related to aerosols are further exacerbated by the different spatiotemporal patterns between models [4,5]. The DAMIP of CMIP6 has three fully separated major forcings: natural-only (NAT), GHG-only (GHG), and aerosol-only (AER) [4]. It also provides volcano-only (volc), stratospheric-ozone-only (stratO3), and SSP2-4.5 simulations, thus widening the range of experiments embracing present and future information in order to explore climate-change triggers [3].
Many DAMIP-based studies have verified different roles for anthropogenic and natural forcings and their contribution degrees to climate change. In some studies, models have been evaluated via isolated experiments. In a CMIP5 DAMIP study, Ha et al. [6] found that anthropogenic forcing affects global and regional monsoon rainfall. In particular, anthropogenic signals (GHG and aerosol forcing) largely affect African monsoons and also cause asymmetric precipitation amounts between the Northern Hemisphere (NH) in the African monsoon domain and the Southern Hemisphere (SH) in the Asian–Australian monsoon domain. Moseid et al. [7] detected the error in five ESMs by studying regional dimming and brightening effects of aerosols. Irving et al. [8] found that GHG is the main contributor to planetary energy unbalances. In their analysis, the unbalance was reduced by AER and northward oceanic transport. As clarified by DAMIP and other climate researches, natural forcing (NAT) is known to not affect much of climate change compared to anthropogenic forcing, but GHG dominates the increases in global temperature and precipitation amount, and AER tends to counteract these increases [6,8,9,10,11]. However, their effects on other meteorological variables or subsidiary processes (e.g., land surface and dust processes) are not adequately discussed yet.
Land surface is a key component of the Earth’s system, as it exchanges heat, water, and carbon dioxide with the atmosphere [12,13]. Changes in land surface such as vegetation and land use by either seasonal or anthropogenic activities can markedly affect land surface processes [14,15]. Moreover, anthropogenic emissions from the land are known to significantly influence future climate, raising many concerns of climate change by scientists and communities. Variable land fluxes interacting with climate change have manifested as extreme events, although an increase in severe events remains controversial [16,17,18]. Future climate changes and the variations in energy and water exchanges at the surface will affect both land conditions and lives (including plants and human lives). Water and food are essential to life, but their safety is threatened by rapidly changing environments and prediction uncertainty. In preparation for future risks, we need to research the potential consequences of climate change [19,20,21].
In planning future scenarios, the impact of anthropogenic emissions on factors other than climate such as land surface processes should not be ignored. Planning must consider the atmosphere, land, and their interactions. The change of climatological variables driven by anthropogenic forcing can affect land surface processes. For instance, rising global temperature and extreme precipitation can change the water cycle and photosynthesis, but land surface processes can be more directly (and possibly irrevocably) affected by human-driven emissions (e.g., aerosol can reduce the net radiation). Eco-hydrological resilience and ecosystem shifts, which are highly linked to both climate and land surface processes, have raised great concern. Ecosystem shift is also related to crop productivity [21,22]. Other sources such as solar energy are also highly affected by aerosol [23]. The many possible consequences from future scenarios on the land surface warrant an investigation of the DAMIP results.
Compared to the land surface DAMIP study, similar MIPs and land-surface-related projects have existed, such as the Coupled Climate-Carbon Cycle Model Intercomparison Project (C4MIP, Jones et al. [24]), the Land Use Model Intercomparison Project (LUMIP, Lawrence et al. [25]), the Carbon-Land Model Intercomparison Project (CLAMP, Hoffman et al. [26]), the International Land Model Benchmarking Project (ILAMB, Hoffman et al. [27]), and the Inter-Sectoral Impact Model Intercomparison Project (ISIMIP, isimip.org, accessed on 28 October 2021). These projects provided the impact of greenhouse gases and conducted model validations regarding land surface processes. C4MIP-related studies proved that increasing CO2 triggers global warming and amplifies climate change [28]. On land, it showed that elevated CO2 stimulates vegetation growth and increases terrestrial carbon stock [24,29]. Here, this large feedback from each land surface model is sensitive to CO2 change, and this revealed the necessity of the model’s inter-comparison study (e.g., CLAMP, ILAMB, and ISIMIP) with MIPs [24]. However, C4MIP only focuses on CO2 variations. The other forcings (e.g., AER and NAT) follow CMIP historical values. Moreover, LUMIP focuses on land-use change. CLAMP, ILAMB, and ISIMIP are utilized for inter-comparison between land-surface models. We need to note that they have some similarities compared to our study, but they are not identical. CMIP6 DAMIP fully separates three major forcings. Moreover, most of the DAMIP studies have focused on atmospheric impacts such as precipitation and temperatures. In particular, the impact on the land surface process using CMIP6 DAMIP is not yet fully studied.
Here, we analyzed the CMIP6 DAMIP experiment by focusing on the energy and water budgets, including gross primary productivity (GPP). This study will address how natural and anthropogenic forcings influence land surface processes. Natural forcing effects would still be minor on the large and long-term scale, but its role will be detected by our analysis.

2. Data and Methods

2.1. Data and Study Area

The CMIP6 models and DAMIP type that we used here are listed in Table 1 and Table 2, respectively. CMIP6 DAMIP data were provided by the Earth System Grid Federation (ESGF). The study period was selected from 1850 to 2010, and data were aggregated daily or monthly to annual data for the analysis. All additional estimations, including evapotranspiration fraction, water balance, and water-use-efficiency (WUE), were calculated from the model list. The number of models for each ensemble can be small by utilizing the combination. All data, including the observations, were re-gridded onto a finite-volume grid (100 km, 192 × 288 grids) with a 0.9 × 1.25 degree scale.
Reanalysis and up-scaled observation data included ERA5 (Hersbach et al. [30]) and FLUX-MTE (Jung et al. [31]) data, which are frequently used in model validations. Precipitation (PR, P), temperature (TAS), evapotranspiration (ET), sensible heat flux (SH), and surface soil moisture (SSM) were validated on the ERA5 data, whereas GPP was compared with FLUX-MTE. These data were also re-gridded to facilitate comparisons with CMIP6 models and were validated by using Taylor diagram (Figure 1). As shown in the Taylor diagram, the PR, TAS, ET, SH, and GPP were reasonably estimated, but SSM was erroneous and varied among the models as reported in a previous study [32]. However, the CMIP6 model was improved from CMIP5, and the long-term SSM trend in this model was similar to that in a previous study [32]. Hence, CMIP6 SSM was assumed to be appropriate for our study.
Table 1. List of DAMIP experiments analyzed in this study (from Gillett et al. [3]).
NameDescriptionsPeriods
CMIP6 historical simulationCMIP6 historical simulation (∼2014): WMGHGs, BC, OC, SO2, SO4, NOx, NH3, CO, NMVOC, nitrogen deposition, ozone, tratospheric aerosols, solar irradiance, and land use1850–2010
hist-NATNatural-only historical simulations (solar irradiance and stratospheric aerosol)1850–2010
hist-GHGWell-mixed greenhouse-gas-only historical simulations (WMGHGs)1850–2010
hist-AERAnthropogenic-aerosol-only historical simulations (BC, OC, SO2, SO4, NOx, NH3, CO, and NMVOC)1850–2010
Table 2. CMIP6 DAMIP model list used in this study where PR is precipitation, T is 2 m air temperature, ET is evapotranspiration, SH is sensible heat flux, SSM and TSM are surface and total soil moisture, and RUNOFF is runoff.
ModelPRTET, SHGPPSSM(TSM)RUNOFF
ACCESS-ESM1-5 [33]
BCC-CSM2-MR [34]
CanESM5 [35]
CESM2 [36]
CNRM-ESM2-1 [37]
FGOALS-g3 [38]
GFDL-ESM4 [39]
GISS-E2-1-G [40]
HadGEM3-GC31-LL [41]
IPSL-CM6A-LR [42]
MIROC6 [43]
MRI-ESM2-0 [44]
NorESM2-LM [45]
The study area was limited to global land for highlighting land surface activities. East Asia (EAS) and South Asia (SAS), which include many developing countries, were also selected for regional analysis, which shows significantly different results from a global-scale analysis. The sub-regional Asian domains were chosen with reference to Iturbide et al. [46].

2.2. Energy and Water Balance

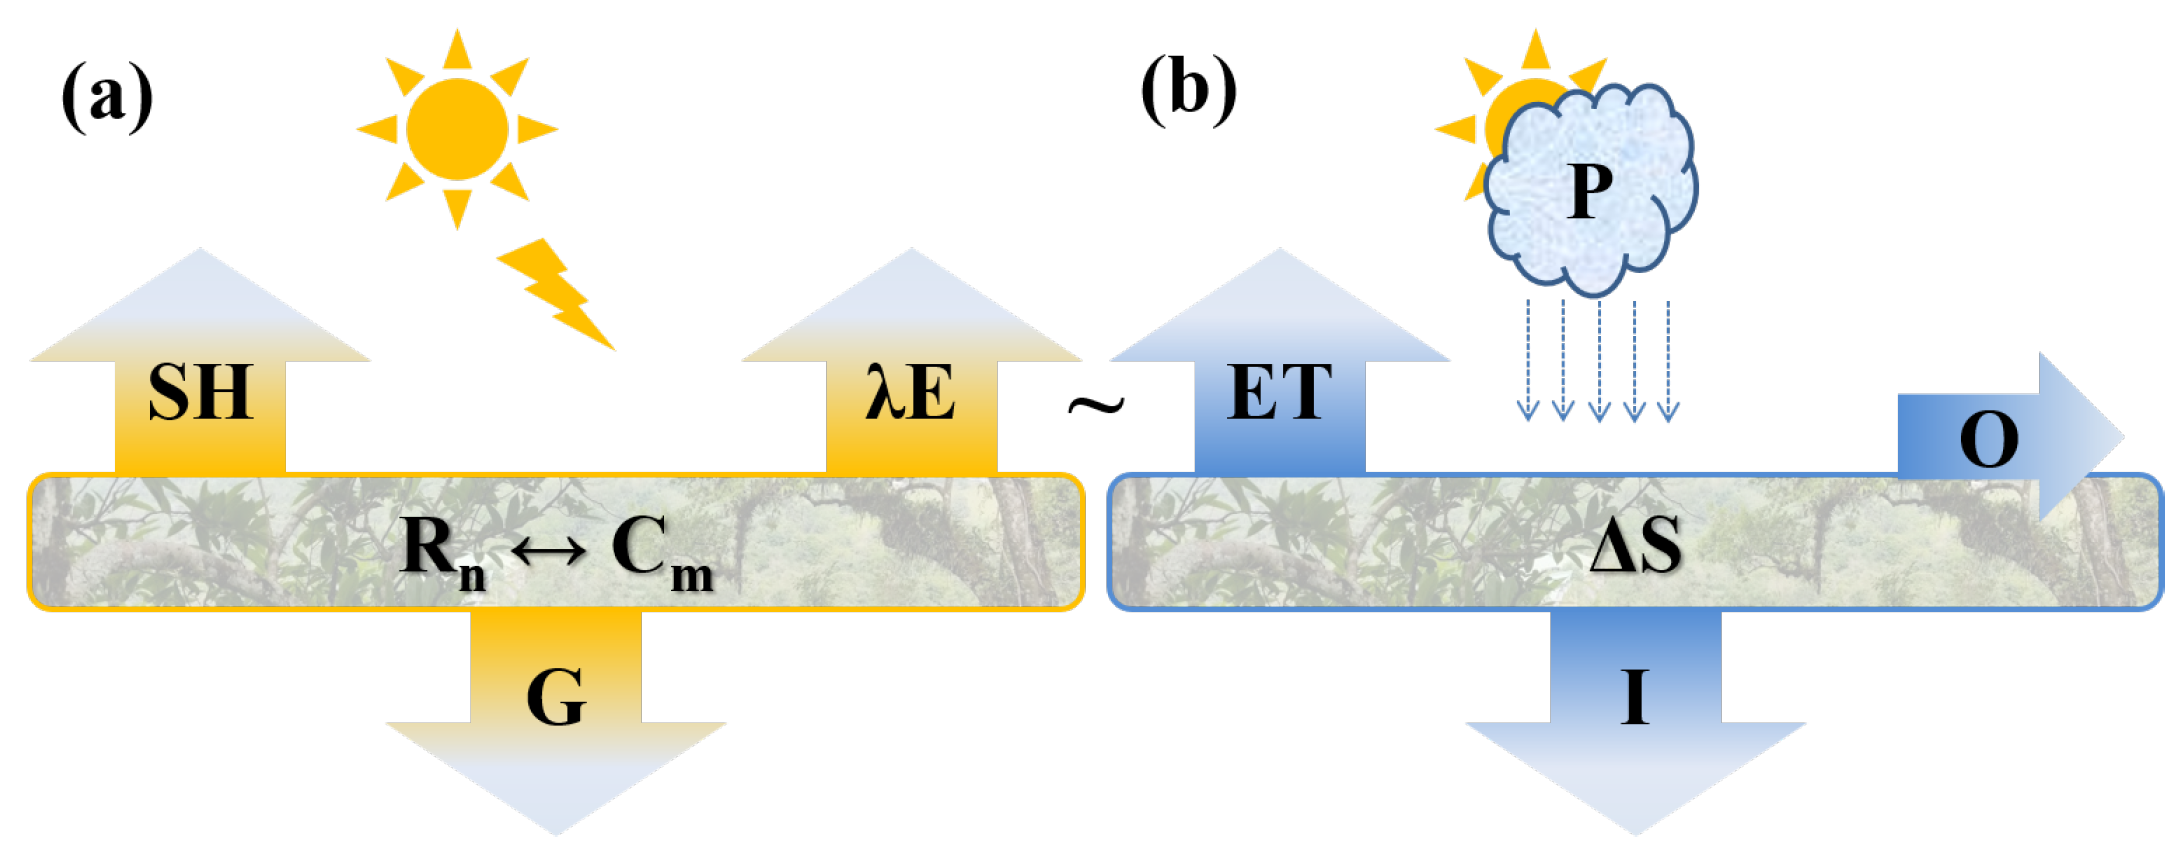
This section briefly introduces the energy and water-balance equations normally used in land surface models (LSMs). An LSM of the surface-atmosphere interaction begins with down-welling solar radiation and incoming precipitation, which are the most critical drivers at the terrestrial surface. The important processes are the total amount of absorbed solar energy (also known as the net radiation R n ) and its partitioning into sensible and latent heat fluxes. In order to estimate each major flux, the model must solve the balance equation [47] (Figure 2a). The energy balance equation with the main elements can be written as follows:
R n = E T + S H + G + C m ,
where E T ( W · m 2 ) and S H are the latent and sensible heat fluxes, respectively, G is the ground heat flux, and C m describes the minor energy exchanges, including the metabolism of energy for photosynthesis and storage flux in the canopy air space [48,49]. ET in the energy balance is normally written as λ E . However, we unify λ E into ET for convenience. The unit conversion between W · m 2 and kg · m 2 · s 1 ( mm · s 1 ) is made through the latent heat of vaporization ( λ 2.454 × 10 6 J · kg 1 ). G and C m were omitted in this study because their contributions are minor and because the roles of E T and H are easily contrasted. based on the nine models in Table 2, the correlation coefficient between R n and E T + H was R 2 = 0.98 According to the energy budget, the water vapor flux (∼ E T ) is a vital component and is directly linked to the water budget (Figure 2b).
The water balance equation is given by the following:
P = E T + O + ( I + Δ S )
where P is precipitation, E T is the evapotranspiration, I is infiltration into soil, O is the runoff, and Δ S is a storage flux term [50]. The units of water balance ( kg · m 2 · s 1 ) are converted to W · m 2 for comparison with the energy balance variables. These simple expressions for water and energy balance are the foundation of LSM, connoting various static and dynamic activities and their interactions.

2.3. Analysis Method

In this study, we mainly use a Multi-Linear Regression Method (MLRM) for the analysis, which is expressed as follows:
Y H i s t = β 0 + β A E R X A E R + β G H G X G H G + β N A T X N A T
where Y H i s t , X A E R , X G H G , and X N A T are the simulation results of historical, aerosol-only, greenhouse-gas-only, and natural-only forcings, respectively. The β with each X represents parameters that imply the influence degree of the individual forcing, and β 0 is white noise. In this analysis, all data were normalized by the first 10 years’ average value. The parameters were estimated by using an ordinary least squares method, and their significances were verified by analysis of variance (ANOVA). The uncertainties between ensemble models were expressed as one standard deviation and are displayed as shaded areas on the result figures.
The trend of the time-series data was determined in a linear regression model if necessary. The significance of the slope parameter was estimated in the same manner as MLRM. In this analysis, data were normalized by the total average value to clarify the long-term trends. The statistical significance of the change between the two periods (depicted as dots in the map) was evaluated in a student’s t-test. Results were considered significant at the p ≤ 0.05 level.

3. Results

3.1. Precipitation and Temperature

In the historical simulation (integrated forcing), global mean precipitation gradually decreased until around 1970 and increased until 2010, but the changes were not significant (p-value of the slope parameter = 0.63) in the regression analysis. Rather, the significance of the change in the precipitation amount depended on the region (Figure 3a,b). Precipitation significantly decreased in rainforest areas such as Southeast Asia, Central America, and the Amazon area. Conversely, temperatures (TAS) increased in most regions except in middle latitudes of the northern hemisphere (Figure 3c,d). The non-significant changes in these areas can be explained by the long-term decreasing trends in the middle of the 20th century followed by an abruptly increasing recent trend. After the 1970s, both temperature and precipitation dramatically increased.
From the trends and fitting parameters of DAMIP analysis, we inferred that AER and GHG influence PR and TAS. Both variables tended to increase under GHG-only forcing, decrease under AER-only, and exhibited no significant long-term changes under NAT-only forcing (Figure 3b,d). Similar results were reported in a previous study [6,8,11]. Interestingly, the historical simulations of both PR and TAS followed AER when decreasing and GHG when increasing, indicating that the contribution of each forcing depends on the time and ambient conditions. In the MLRM analysis, historical TAS data were well fitted by a separated-forcing simulation (R-squared = 0.85) but were poorly fitted to PR (R-squared = 0.29); TAS was more directly affected by DAMIP forcing than PR. PR was more influenced by AER (R-squared = 0.56) and GHG (R-squared = 0.56) than by NAT (R-squared = −0.04). GHG forcing (R-squared = 0.81) exerted the highest impact on the historical TAS, but other forcings ( β A E R = 0.52, β N A T = 0.61) were also significantly effective. Although NAT did not apparently affect the long-term trends, its importance on TAS was determined in the MLRM analysis.

3.2. Energy Balance

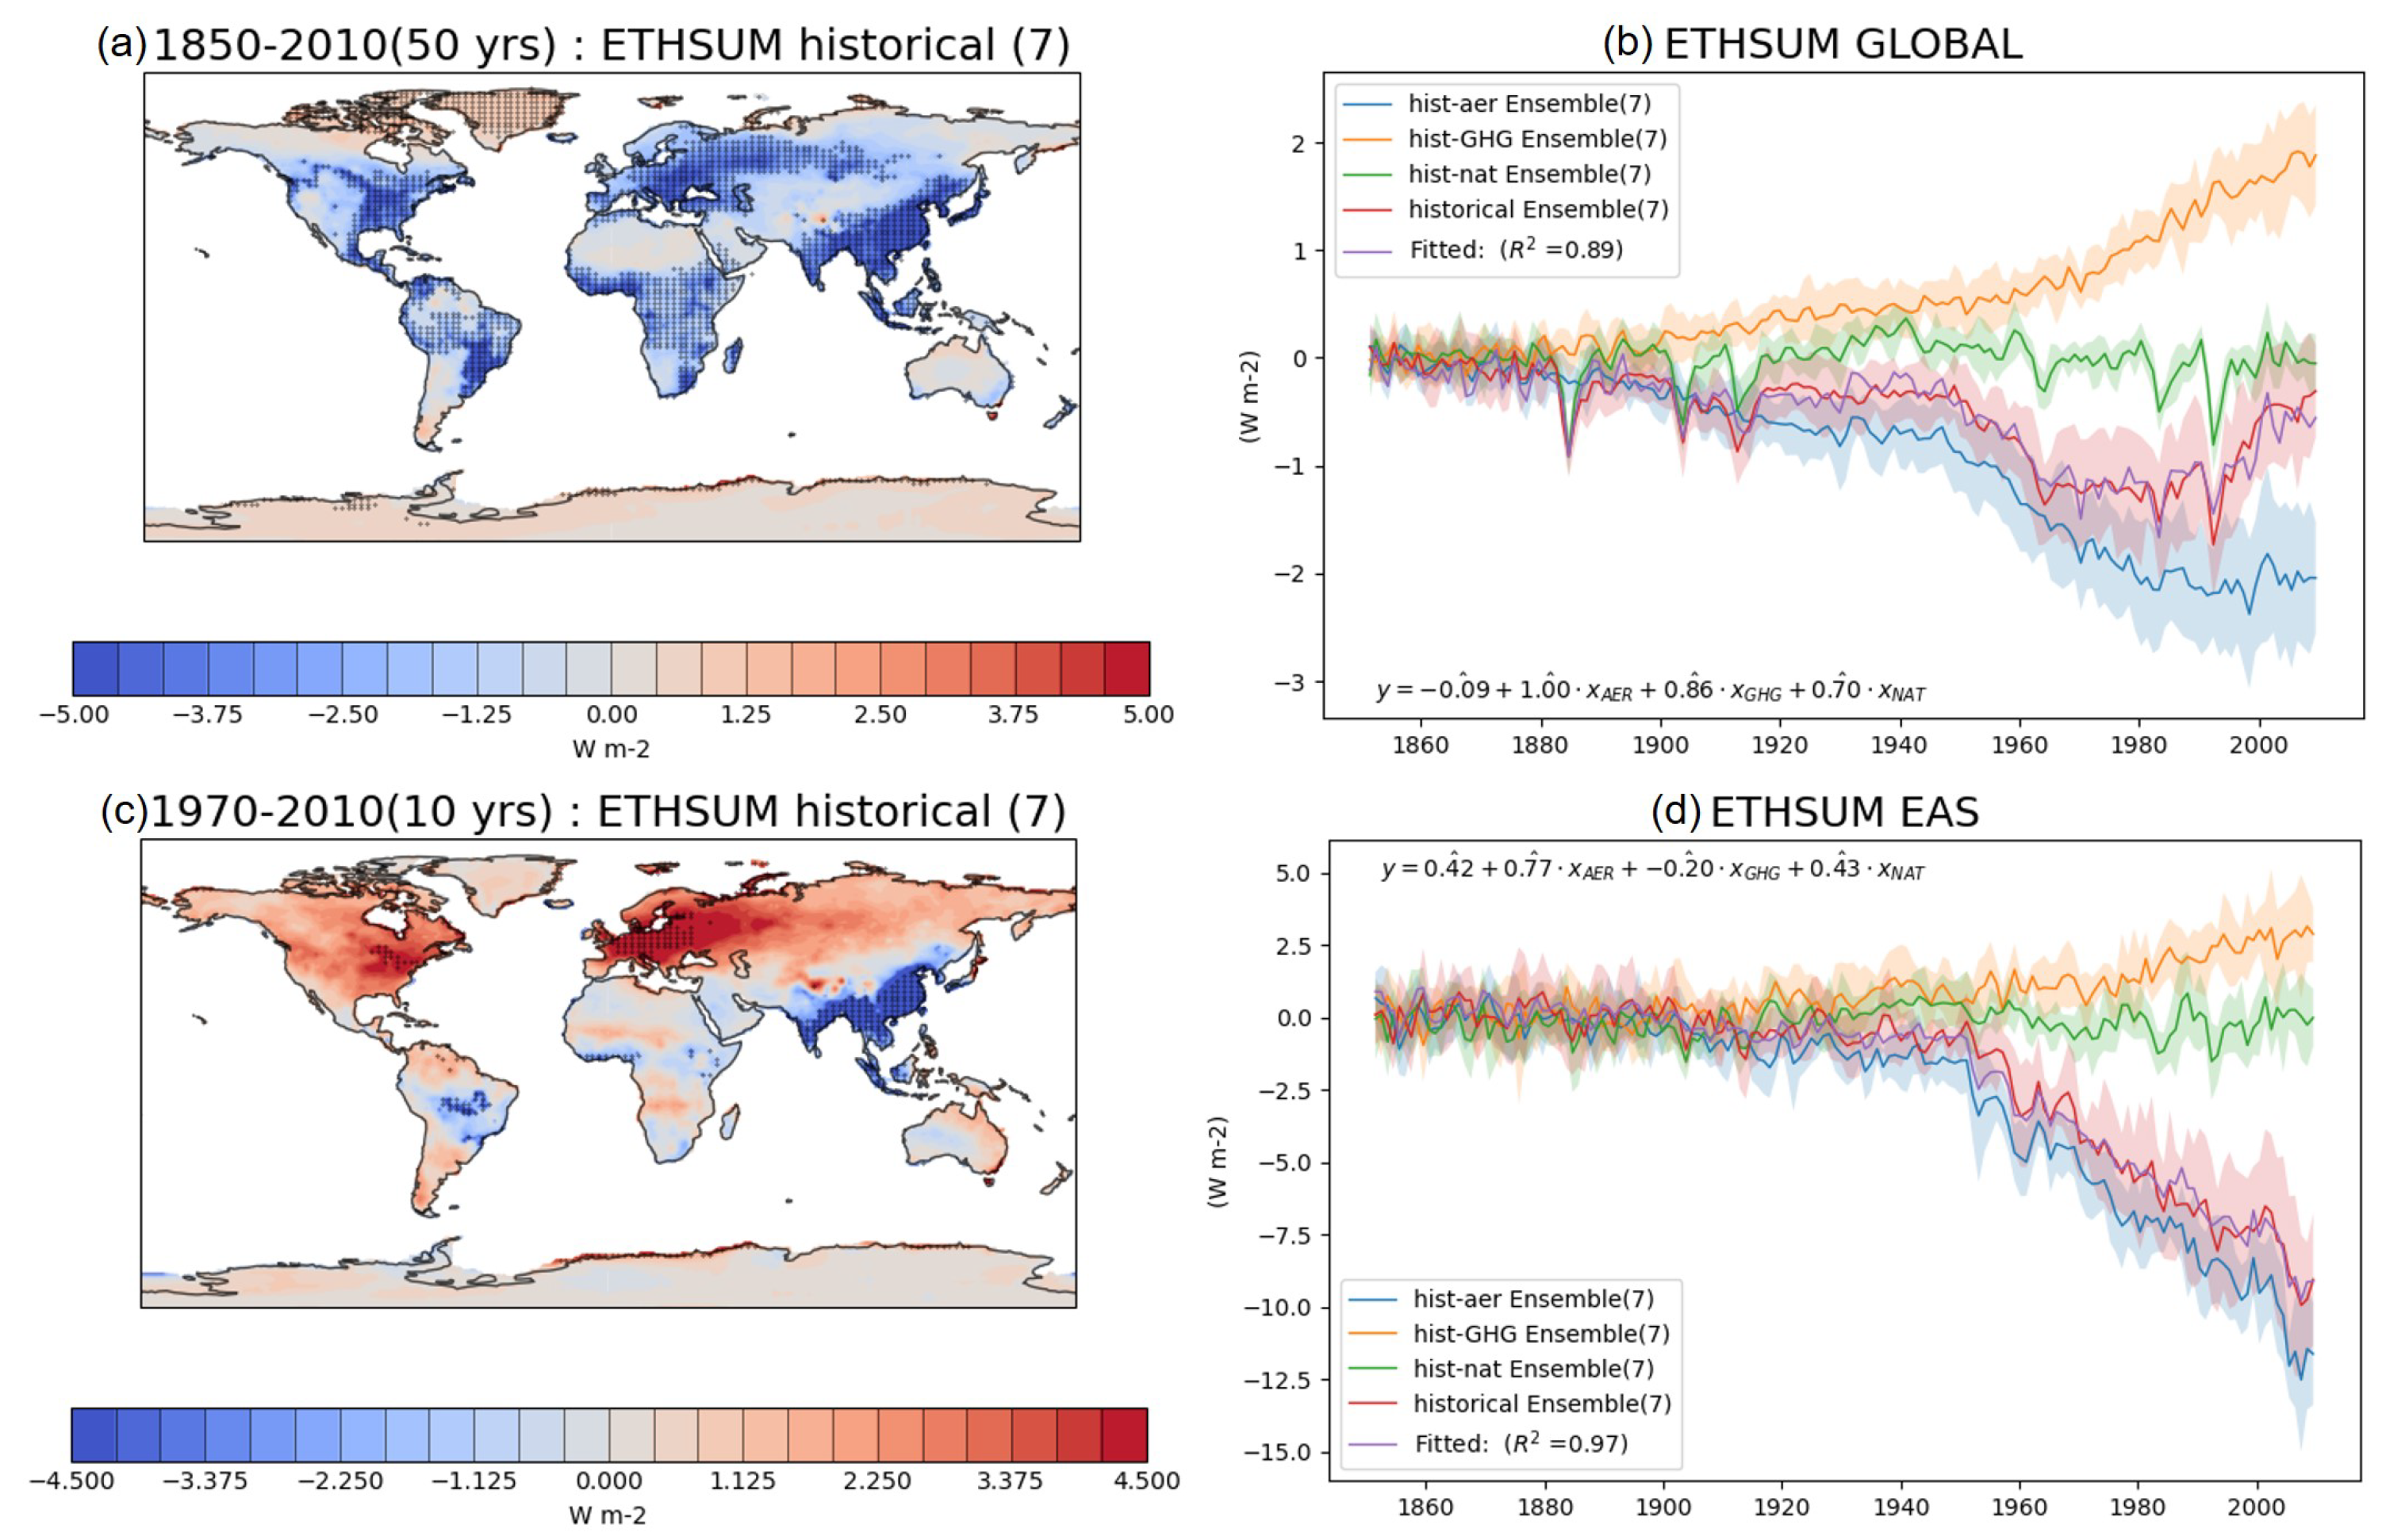
Net radiation is affected by all forcings, although there is a regional difference. The net radiation under historical forcing showed that the energy absorbed on the ground decreased globally over a long-term trend (Figure 4a,b) before rebounding in the near past (1970–2010). By comparing the results of the pre-1970s and post-1970s (Figure 4a,c), such bouncing appears to be contributed by advanced countries on the continents of North America and Europe. In contrast, the net radiation in Asian regions decreased even more dramatically after 1970s (Figure 4c,d) mainly because aerosol emissions have increased in Asia. Asian regions have seen a significant increase in aerosol after industrialization, which can be the main reason for a consistent decrease in short wave radiation as reported in a previous study [51]. Furthermore, the MLRM analysis indicated that the total absorbed energy (net radiation) is affected not only by AER but also by GHG and NAT to a remarkable extent (Figure 4b). The effects of the estimated MLRM parameters are visually recognizable in the figure; for instance, AER and GHG forcing increased and decreased net radiation, respectively, as evidenced in the temperature and PR trends. The decreasing trend in the historical simulation (global deeming) followed the AER simulation, and the rebounding trend since 1970 (global brightening in Eastern USA and Europe) followed GHG results [52]. By utilizing net radiation, we can clearly identify the role of NAT in short historical frequency; specifically, the major variations in the short frequency coincide with major volcanic activities [53].
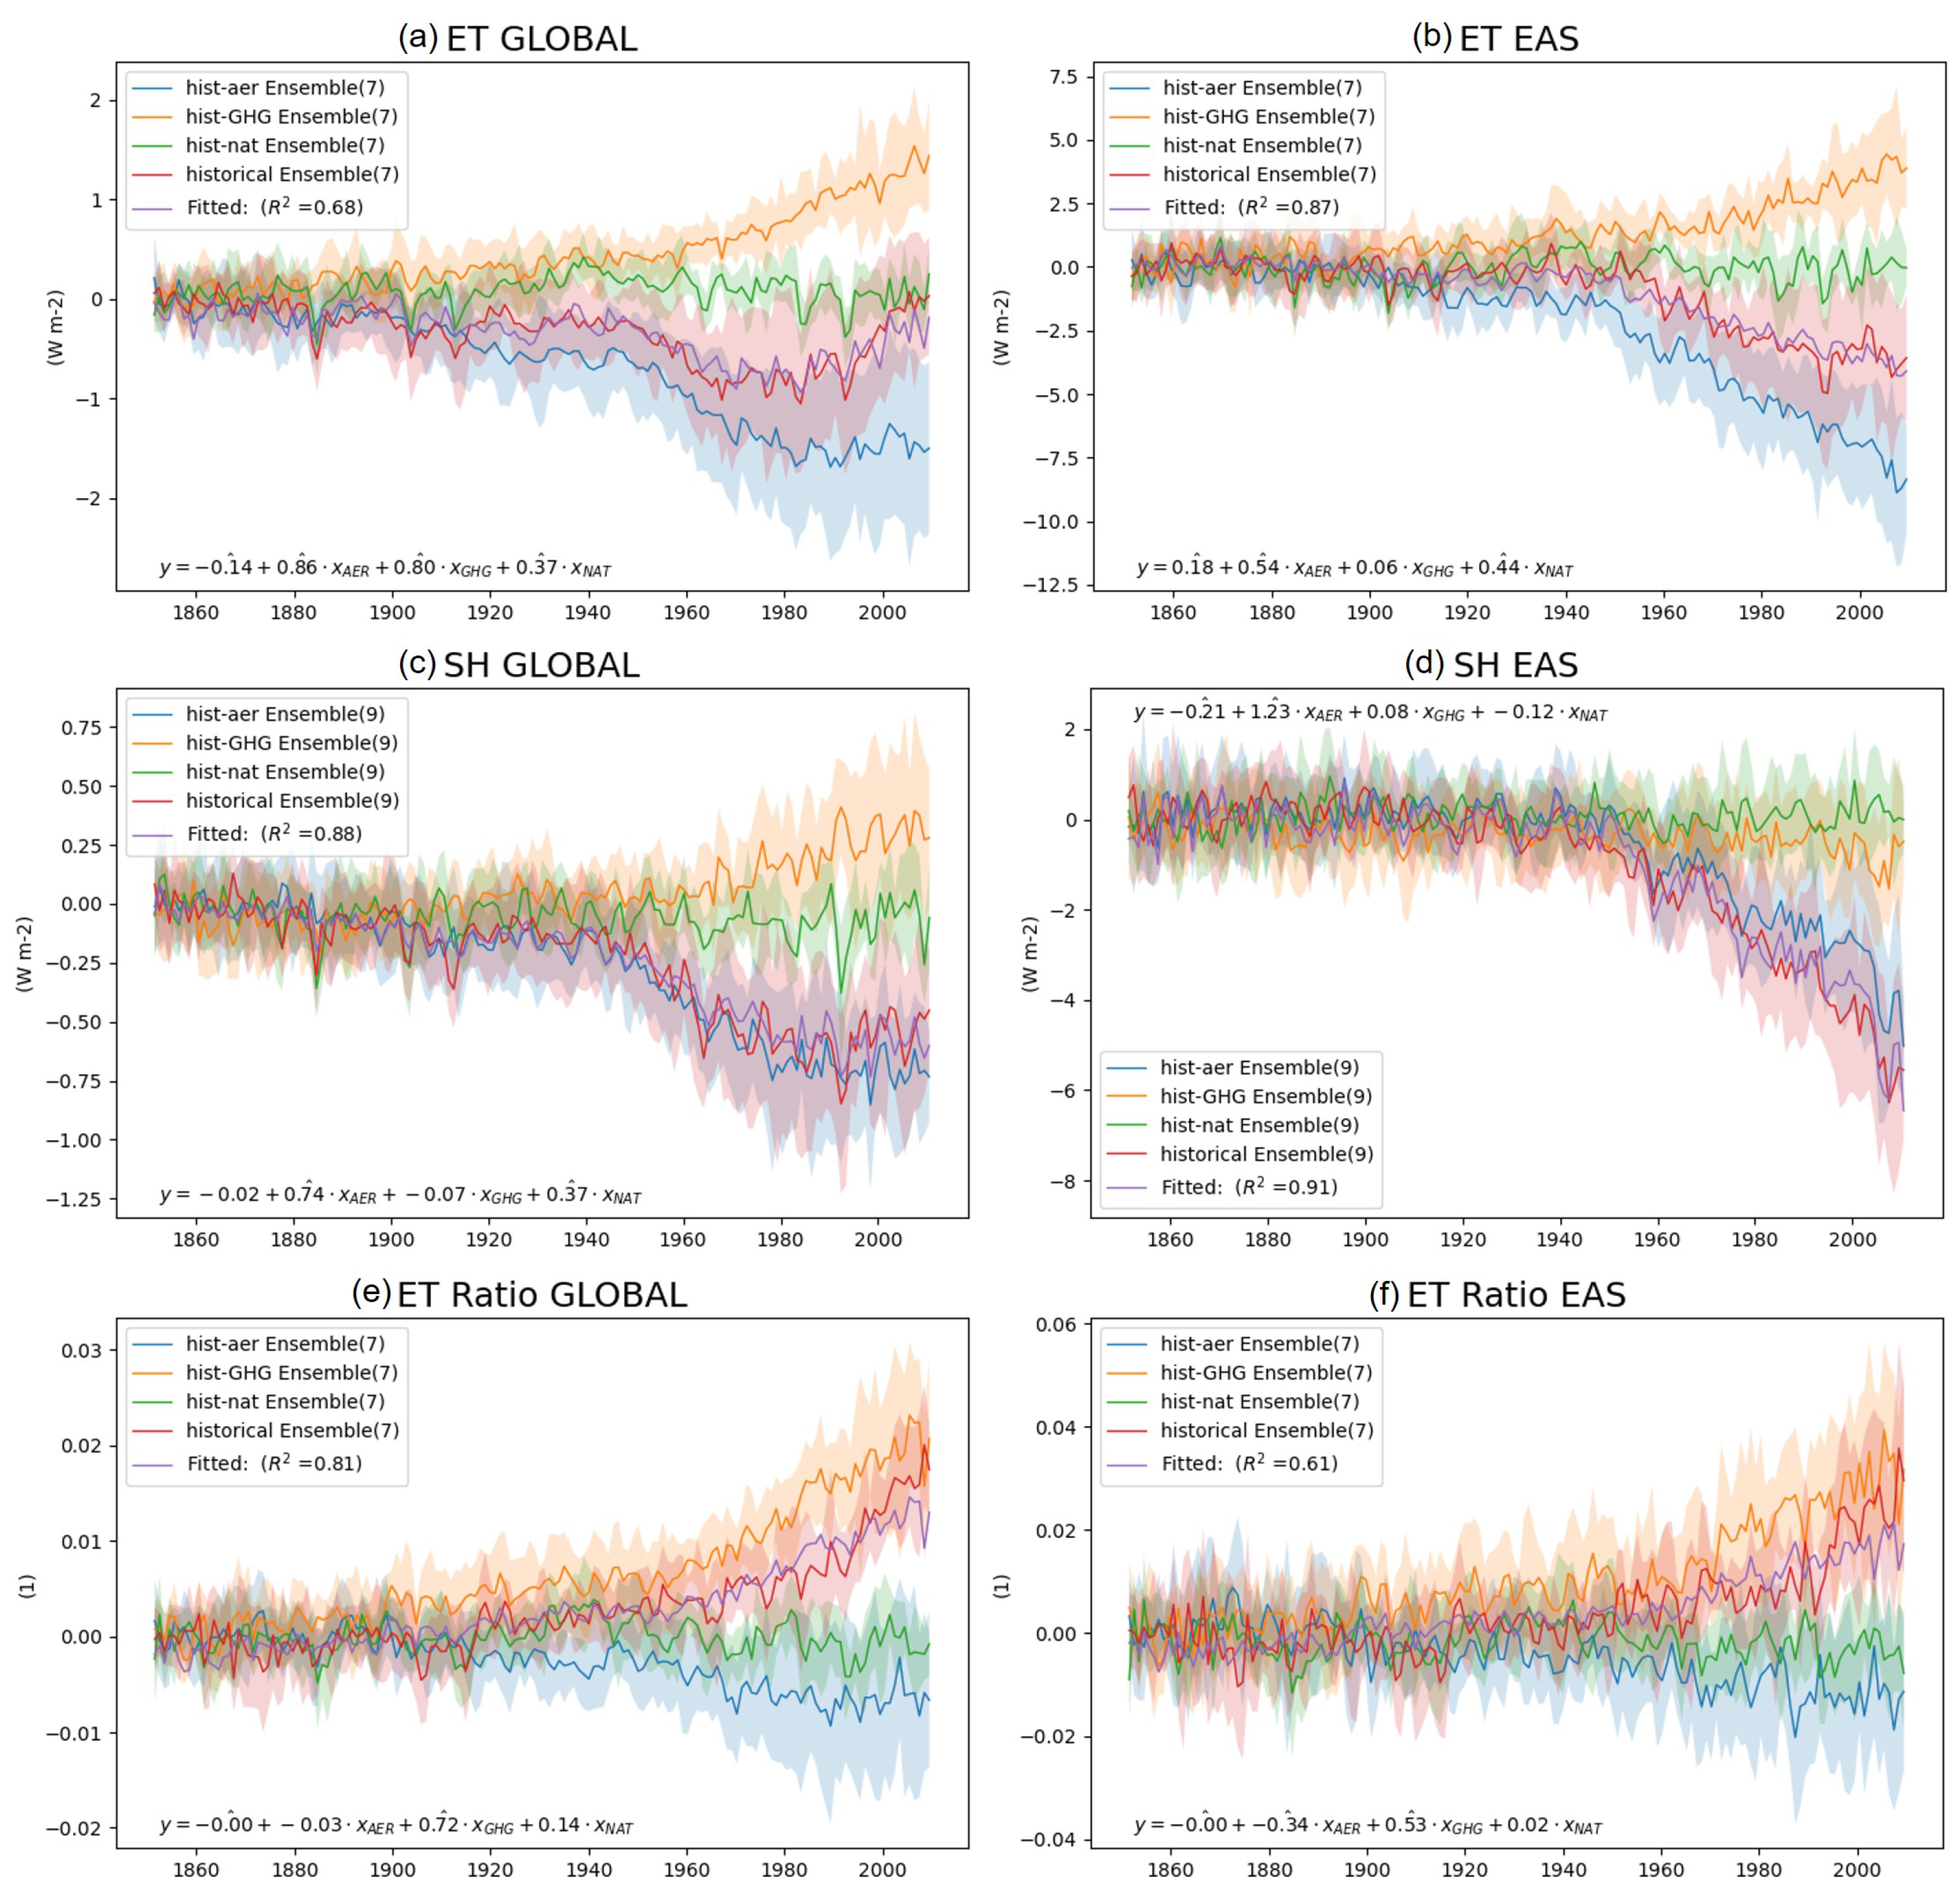
The long-term variations in both latent heat (∼Evapotranspiration, ET) and sensible heat (SH) fluxes tended to follow net radiation. However, the forcings of ET and SH have different weights although the two variables are bound in net radiation: AER dominantly affects SH, and both AER and GHG dominantly influence ET on a global scale (Figure 5). Given the strong effect of AER on SH and the summation relationship, we can expect that GHG can dominantly affect ET. As observed for the other variables, the contribution of ET was regionally variable. In East Asia, ET is mainly controlled by AER and NAT, but in South Asia, ET was not significantly affected by any forcing (no figures provided). We additionally estimated the ET (∼ λ E) portion ET/(ET + SH), which is similar to the Bowen Ratio ET/SH (Figure 5e,f). The ET ratio has been steadily increasing globally and in East Asia, although PR and net radiation have fluctuated throughout historical records. Interestingly, the ratio followed the GHG-only simulation, which also predicted an increasing trend, indicating that GHG might strongly contribute to ET variation. An elevated ET ratio implies a wet surface climate of land [54].

3.3. Water Balance

Both total and surface soil moisture tended to increase in most places (p-value < 0.05), but decreases were found in some places, such as the Amazon (Figure 6a–d). More statistically significant changes (dots in the maps of Figure 6) were detected in the total soil moisture (TSM) than in the SSM. We note that SSM data represents 5 cm depth (Figure 6a,b) and the depth known to be detectable by remote-sensing [55]. However, the depth of TSM can be varied among models depending on groundwater existence, vertical resolution, root depth, or the decisions of a model developer (Figure 6c,d). The analyzed results used normalized values or represented the differences between two periods, so the change in water amount can be adequately detected regardless of the depth. Thus, we assumed that the TSM results adequately represented change in TSM.
As shown in Figure 6b, the historical simulation of SSM is followed the AER-only simulation. SSM gradually increased since 1870 and decreased from around 1970, opposing PR and net radiation trends. The reduction in net radiation may have caused the SSM increase in the early period, although PR decreased simultaneously. The rebounding of the net radiation might have caused soil moisture loss after 1970 despite growing PR. Moreover, soil moisture reduction after 1970, along with the increased PR and net radiation, suggests that the surface water cycle was accelerating at the surface. Unlike surface moisture, TSM values have constantly increased (Figure 6d). We need to note that TSM has a slower response than the SSM, and while the global-mean soil moisture has slightly changed, TSM has undergone statistically significant changes throughout the world, indicating that water balance has certainly been altering (Figure 6c). For instance, the soil moisture has decreased in the Amazon area, which is an important “breathing” source of the Earth, and increased in the west of the USA and Europe. The estimated water budget ( P ( E T + O ) ), which is equivalent to I + S , indicates that the incoming PR exceeds the outgoing water fluxes (Figure 6e,f). Only a few areas have significance, but we can observe that most of the areas have an increasing trend. This can be a reason for the rise soil moisture since the water budget has been increasing over time and is always larger than zero. It may explain the rising soil moisture. In Figure 6f, the values were normalized by their total average in order to detect the slope. This analysis may involve timing-related or over-simplification errors because the land surface process is a complicated system (e.g., snow melting). Moreover, the number of ensemble models was unavoidably small because the analysis used variables’ combinations, and we selected models having all sets (AER, GHG, NAT, and Historical). Moreover, analyzing individual sets (e.g., only GHG regardless of “all sets”) that provide an increased number of ensemble members produces similar results.
The long-term variations of SSM were similar to those of TSM in most regions, but in some regions, the water budget ( P ( E T + O ) ) behaved oppositely relative to soil moisture (Figure 6a,c,e). As all three variables have been increasing globally, positive signs (red in the maps) are prominent, particularly in the northern hemisphere. However, in the forested regions such as the Amazon and Eastern North America, soil moisture has trended oppositely or lost statistical significance compared to the water budget. The reason is unclear, but we can suppose that water loss from soil is related to vegetation and PR. In the Amazon, PR has decreased but the reductions of O and ET were more significant (no figures given). Consequently, the water budget showed an increasing trend. However, the amount of underground flow out does not seem to be adequately filled due to reduced PR. This can be a reason for decreasing SSM and TSM. Interestingly, vegetation has maintained its photosynthesis even under low PR conditions. In later results, we will show that GPP flux, which requires water, has been dramatically increased even under low PR conditions. This would be because water deficiency is offset by elevated photosynthesis efficiency.
While runoff flux has continuously increased (Figure 7a,b), PR has fluctuated (Figure 3). The runoff flux tended to follow the GHG-only simulation (Figure 7b). In addition, the estimated GHG parameter of the MLRM was large, indicating that runoff variation was dominantly influenced by GHG forcing. This high runoff does not necessarily reduce infiltration because other factors such as PR and ET may change. PR intensity would be more related to infiltration rate due to different flow rates between the soil and the surface. Due to high runoff, the risk of water management and flood will increase.
Such a gradual increase in runoff can be explained by PR changes and ice or snow melting in the polar regions, but rising PR intensity is another possible main reason. To check whether intensity has changed, we divided the monthly mean PR (>1 mm) by the monthly PR occurrence rate (>1 mm) by using the daily PR data (Figure 7c,d). The PR occurrence rate is estimated by changing it to a binary value: we gave one if there is a rainfall event (>1 mm) on a daily scale, and zero otherwise. We then estimated the monthly average from those daily binary values. Visually, the change in the PR occurrence rate tended to follow PR variation (data not shown). However, historical intensity (PR/O) has become increasing similarly to the GHG-only simulation. The result indicates that the PR occurrence rate has gradually decreased compared to PR, indicating that extreme rainfall (intensity) has increased in most places. The variations in PR intensity and runoff rate were similar in most regions except in places where PR has significantly decreased or possible ice/snow melting occurs in places such as Asia, Central America, the Amazon, and the north and south poles.

3.4. GPP and Water Use Efficiency

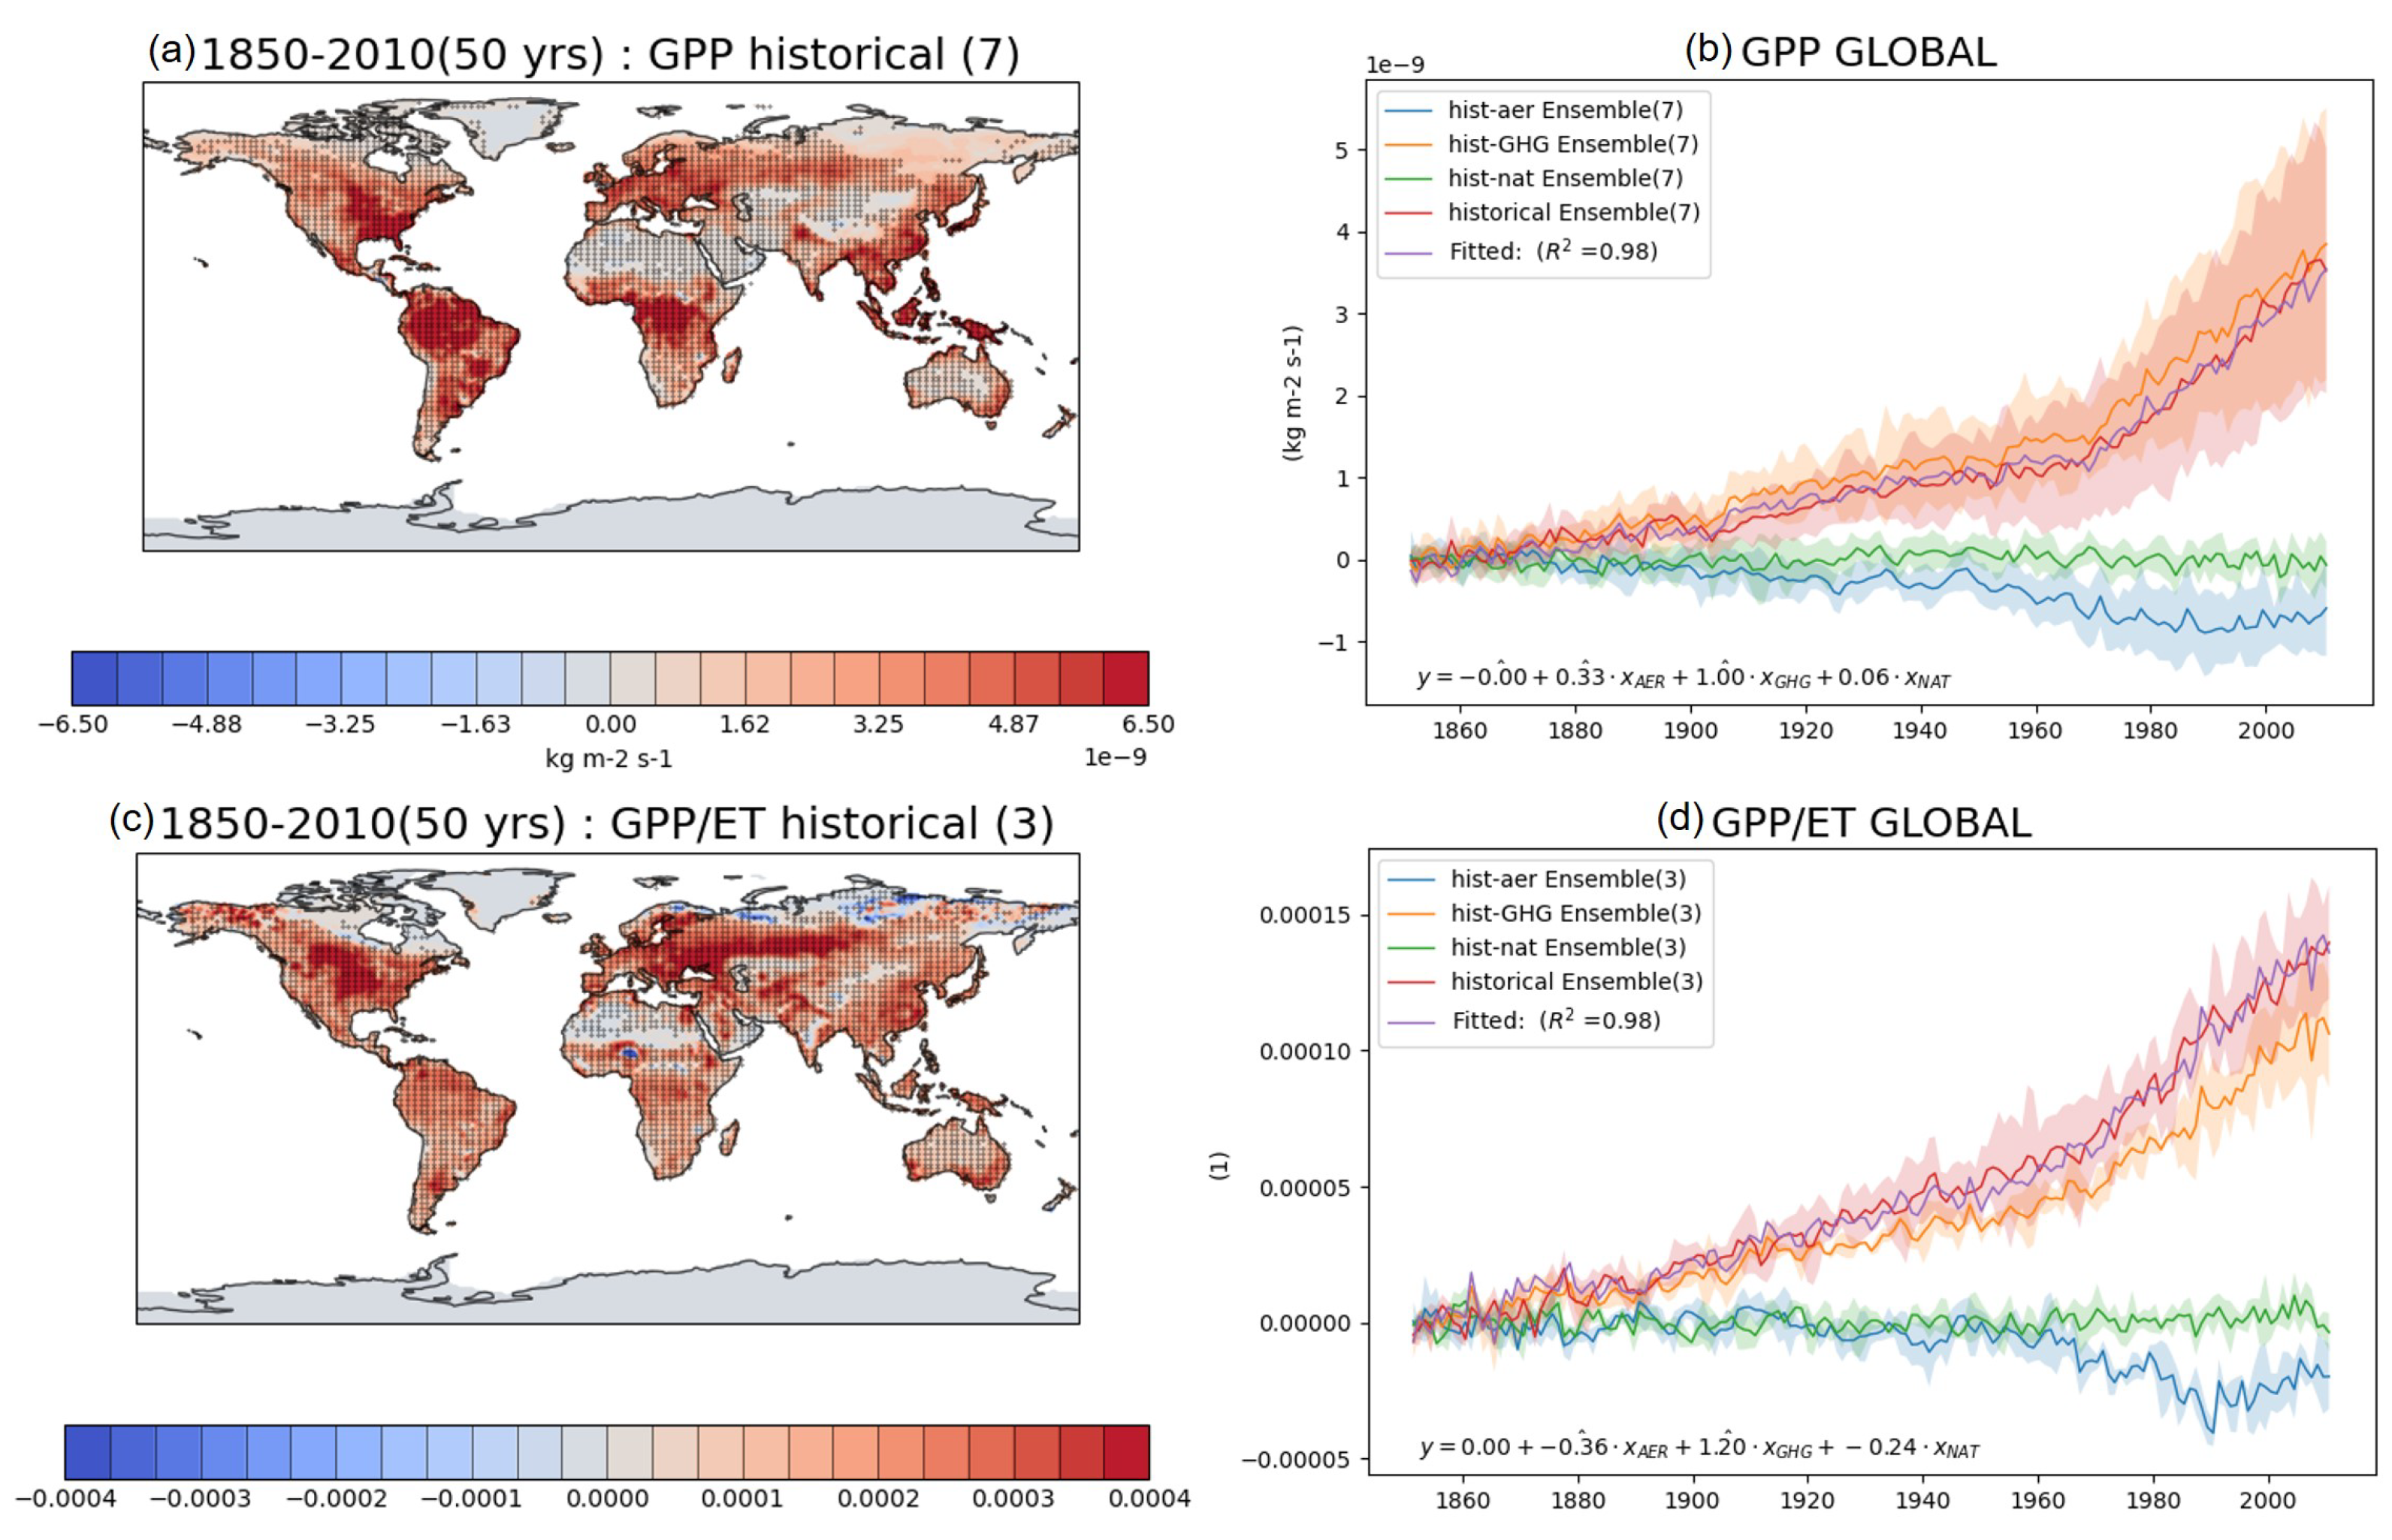
In the historical simulations, GPP continuously increased in most regions and dominantly followed the GHG forcing (Figure 8a,b). PR and net radiation have also increased in the near past, but they have not performed so consistently since 1850, such as GPP. Most photosynthesis models estimate the GPP and transpiration by using Farquhar’s model [56]. This model considers photosynthetically active radiation (PAR), which is normally proportional to the incoming short-wave solar radiation although there is a limit point known as the maximum electron transport (e.g., maximum carboxylation rate) [12,57,58]. The photosynthesis model is also related to temperatures, humidity, CO2 concentration, water, etc. [56,58]. Among these main variables, solar energy and water are surely the key drivers of plant photosynthesis [13,59,60]. However, this strong GHG influence is an interesting result concerning the existence of the maximum carboxylation rate and maximum Rubisco-limited rate in the photosynthesis model. Increasing both temperature and CO2 in the Farquhar model can elevate the GPP in the GHG-only simulation, but such a dominant role of GHG over the other factors remains questionable. The role of other physiological effects may need to be investigated. Current land surface models account for key environmental conditions and physiological functions such as nutrients, plant demography, water use efficiency, and even root distribution [60,61,62,63].
In order to identify the cause of GPP increase, we estimated water use efficiency (WUE) of plants as GPP/ET [64,65]. The result indicated that increasing GHG (CO2) elevates the efficiency of photosynthesis. The absorption of carbon dioxide (productivity) dominated ET variation (Figure 8c,d). Precipitation, water budget, soil moisture, and surface energy grew only slightly, but the photosynthesis rate abruptly increased. To a lesser extent than GHG, the influence of AER is also detected by using MLRM. As solar energy (AER effect) is a physically important driver and was statistically significant in MLRM analysis, it cannot be disregarded in future scenarios. Here, the limit of this high efficiency is not certain yet when both GHG and AER rising. The ecological resilience against GHG and AER changes should be investigated in future scenarios. In the past, high AER counterbalanced the GHG effect to some extent. However, AER has declined recently and is expected to decline in the future, so WUE could rise significantly unless GHG suddenly returns to its original state. Therefore, the study of the limit of WUE and its consequences may be necessary. Such changes in GHG and AER can result in extreme physiological stages when vegetation receive excessive solar energy and reach the WUE limit.

3.5. Parameter Table

The MLRM-estimated parameters on the global scale and in some Asian regions are shown in Figure 9. The analysis showed that AER and GHG are the main drivers of the trend shifts in most variables, accounting for 37% and 42% among statistically significant parameters, respectively. In East Asia regions, AER and GHG accounted for 50% and 31%, respectively, confirming that their weights differ from those of the global mean. Within Asia, the parameters of South Asia were significantly distinct from those of East Asia. For instance, there were 17 statistically significant parameters in East Asia (shaded in orange), mainly in the AER column. Conversely, in South Asia, the number of statistically significant parameters (especially those with high R-squared) was relatively low, implying that major forcings weakly affected the SAS region. Global ET and PR appeared to be mainly influenced by AER and GHG, but GHG exerted no impact on East Asia. In global mean data, all forcings were important for net radiation (ET+SH), but GHG did not largely affect net radiation in East Asia. Additionally, the role of natural forcing has faded in SAS.

4. Summary and Conclusions

Anthropogenic emissions have been frequently studied and are known to influence climate significantly. However, the direct impacts of GHG and AER on land surface have not been sufficiently discussed. This study analyzed the data from the CMIP6 DAMIP experiment in an MLRM with ANOVA and provided variation maps of the land energy and water budgets, including GPP. In comparisons with ERA5 and FLUX-MTE data, PR, TAS, ET, SH, and GPP were confirmed to be reasonably estimated. Although the SSM contained an error and varied among the models, we assumed that CMIP6 SSM was appropriate for this study because the CMIP6 model has been improved from the CMIP5 model and the long-term SSM trend resembled that in a previous study Yuan et al. [32].
The MLRM analysis revealed the degree of each forcing. Unlike previous studies that typically focused on AER and GHG alone, we found that natural forcing also significantly influences meteorological and land surface variables. Normally, a long-term trend analysis tends to focus on anthropogenic effects (AER and GHG) because of their clear effects. From natural-only simulation results, we cannot easily detect NAT contribution through a long-term time-series plot and even with some statistical analyses [9,10]. In this study, by using MLRM parameter values, we showed that natural forcing can impact TAS and Net radiation as much as AER and GHG. Time-series figures showed NAT does not much influence long-term trends, and statistical significance of linear regression’s slope parameter has not been detected in any NAT-only simulation. Rather, NAT tended to be related to high-frequency variations (e.g., volcanic eruption). Such contributions may not easily be detected without MLRM.
The land surface process was mainly influenced by GHG and AER but with varying degrees of contribution. GHG increased key land surface variables (net radiation, ET, and runoff) along with PR and TAS, but AER presented opposite characteristics. Both GHG and AER continuously rose since 1850 (the beginning of the record). Their historical simulation (with all combined forcings) showed the gradual reduction in PR and most land surface variables until 1970 mainly because the AER effectively counteracted the GHG until 1970. Thereafter, balance was disturbed as AER began decreasing, producing a bouncing trend. The time-series plots of the historical simulation (integrated forcing) tended to lie between those of the GHG-only and AER-only simulation results, which indicates that the influences of GHG and AER are balanced. For instance, PR and ET showed balanced results between GHG and AER. However, the historical simulation of some other variables was skewed toward GHG or AER. For example, TAS and GPP in the historical simulations tended to follow the GHG-only results, while net radiation closely followed the AER-only results. The historical simulation of ET ratio and WUE also strongly followed the GHG trend.
Each forcing impact and historical changes varied on a regional basis. Developing countries in the late 20th century such as East Asia showed significant contrasts from other regions, possibly owing to the aerosol effect. For instance, the rebound of PR, TAS, and net radiation after 1970 was not observed in East Asia. Instead, further declines of these variables were noted, likely because Asian regions are still developing and suffering from air quality issues. Conversely, advanced countries such as North America and Europe showed an increasing trend in PR and net radiation. Moreover, distinct from the global analysis, the statistically significant MLRM parameters of AER (50%) outnumbered GHG and NAT in East Asia (Figure 9). Some regions, such as South Asia, were less affected than East Asia and the global mean; MLRM found a small number of statistically significant parameters among forcings in South Asia. Although other causes (e.g., land use) are possible, the regionally variable AER emissions might mainly explain the spatial gap in the model results of net radiation and PR.
Variables that include sub-variables or are intertwined with other variables tend to involve multiple forcings. For instance, AER can be regarded as a dominant forcing to net radiation because aerosols can block incoming solar radiation. However, in the present study, net radiation was significantly affected not only by AER but also by GHG. In the time-series plots, both ET and SH apparently followed the variations in net radiation. Meanwhile, the ET ratio was mainly influenced by GHG. As ET and SH are correlated due to a summation relationship and SH is strongly related to AER, we note that ET can be affected by GHG. Hence, the dual forcing effect (AER and GHG) on net radiation might be attributable to two-variable combinations (ET + SH).
This study also showed that GHG accelerates energy exchange, water cycle, and photosynthesis. The GHG-only simulations showed an increase in precipitation and evapotranspiration. GHG also enhances the PR intensity, causing a high runoff rate. TSM and water balance analyses showed that the available water of the land has increased. However, SSM showed a decreasing trend in the recent past. Here, higher PR than ET and runoff should increase SSM, but the fast water cycle induced by high PR intensity (same amount of PR at low frequency) and the raised ET rate appears to prevent an increase in SSM. GHG changes can also shift surface conditions. The ET ratio, which can be related to the Bowen ratio, strongly followed the GHG trend. The increase in these variables implies that the surface is becoming a wet climate globally (based on the Bowen ratio classification). The WUE, which defines the GPP to ET ratio, dramatically increased and strongly followed the GHG-only simulation, indicating that plant productivity has increased by elevated CO2. The models we used for this study can have errors. However, this analysis comes from the advanced models which have long been verified and possess rationality with respect to simplification.
In conclusion, DAMIP analysis identified a role for GHG and AER on the land surface and behaves similarly to PR and TAS. Their contributions to each variable within the water and energy balance equations were explored in an MLRM. This method helped to identify the role of natural forcing, which has been usually ignored in previous studies. The study revealed that greenhouse gas tends to accelerate land surface processes, possibly causing extreme processes such as runoff. However, some variables were positively affected by GHG; for instance, GPP and its efficiency both increased. Planning scenarios normally focus on the climatologic consequences of GHG. However, we need to be concerned about balances between GHG and other fluxes (aerosol and natural variations) regarding land surface processes. This study was limited to past simulations, but a DAMIP analysis about the future, when GHG and AER are expected decrease, may be needed. Moreover, the MLRM analysis was limited to the global scale and a few regions. Mapping MLRM parameters and analyzing future scenarios are interesting topics to be addressed in our future research.

Author Contributions

J.S. wrote the manuscript and contributed to the graphics. S.S., J.-S.K., J.-H.L., Y.-H.B., and Y.-H.K. contributed to the discussion and revision of the manuscript. All authors have read and agreed to the published version of the manuscript.

Funding

This research was funded by the Korea Meteorological Administration Research and Development Program Development and Assessment of Climate Change Scenario under Grant (KMA2018-00321).

Institutional Review Board Statement

Not applicable.

Informed Consent Statement

Not applicable.

Data Availability Statement

The data presented in this study are available upon request from the corresponding author.

Conflicts of Interest

The authors declare no conflict of interest.

References

  1. Kim, Y.H.; Min, S.K.; Zhang, X.; Sillmann, J.; Sandstad, M. Evaluation of the CMIP6 multi-model ensemble for climate extreme indices. Weather. Clim. Extrem. 2020, 29, 100269. [Google Scholar] [CrossRef]
  2. Eyring, V.; Bony, S.; Meehl, G.A.; Senior, C.A.; Stevens, B.; Stouffer, R.J.; Taylor, K.E. Overview of the Coupled Model Intercomparison Project Phase 6 (CMIP6) experimental design and organization. Geosci. Model Dev. 2016, 9, 1937–1958. [Google Scholar] [CrossRef] [Green Version]
  3. Gillett, N.P.; Shiogama, H.; Funke, B.; Hegerl, G.; Knutti, R.; Matthes, K.; Santer, B.D.; Stone, D.; Tebaldi, C. The Detection and Attribution Model Intercomparison Project (DAMIP v1.0) contribution to CMIP6. Geosci. Model Dev. 2016, 9, 3685–3697. [Google Scholar] [CrossRef] [Green Version]
  4. Ribes, A.; Terray, L. Application of regularised optimal fingerprinting to attribution. Part II: Application to global near-surface temperature. Clim. Dyn. 2013, 41, 2837–2853. [Google Scholar] [CrossRef]
  5. Ribes, A.; Gillett, N.P.; Zwiers, F.W. Designing Detection and Attribution Simulations for CMIP6 to Optimize the Estimation of Greenhouse Gas–Induced Warming. J. Clim. 2015, 28, 3435–3438. [Google Scholar] [CrossRef]
  6. Ha, K.J.; Kim, B.H.; Chung, E.S.; Chan, J.C.L.; Chang, C.P. Major factors of global and regional monsoon rainfall changes: Natural versus anthropogenic forcing. Environ. Res. Lett. 2020, 15, 034055. [Google Scholar] [CrossRef]
  7. Moseid, K.O.; Schulz, M.; Storelvmo, T.; Julsrud, I.R.; Olivié, D.; Nabat, P.; Wild, M.; Cole, J.N.S.; Takemura, T.; Oshima, N.; et al. Bias in CMIP6 models as compared to observed regional dimming and brightening. Atmos. Chem. Phys. 2020, 20, 16023–16040. [Google Scholar] [CrossRef]
  8. Irving, D.B.; Wijffels, S.; Church, J.A. Anthropogenic Aerosols, Greenhouse Gases, and the Uptake, Transport, and Storage of Excess Heat in the Climate System. Geophys. Res. Lett. 2019, 46, 4894–4903. [Google Scholar] [CrossRef] [Green Version]
  9. Stott, P.A.; Gillett, N.P.; Hegerl, G.C.; Karoly, D.J.; Stone, D.A.; Zhang, X.; Zwiers, F. Detection and attribution of climate change: A regional perspective. WIREs Clim. Chang. 2010, 1, 192–211. [Google Scholar] [CrossRef]
  10. Ribes, A.; Zwiers, F.W.; Azaïs, J.M.; Naveau, P. A new statistical approach to climate change detection and attribution. Clim. Dyn. 2017, 48, 367–386. [Google Scholar] [CrossRef]
  11. Gillett, N.P.; Kirchmeier-Young, M.; Ribes, A.; Shiogama, H.; Hegerl, G.C.; Knutti, R.; Gastineau, G.; John, J.G.; Li, L.; Nazarenko, L.; et al. Constraining human contributions to observed warming since the pre-industrial period. Nat. Clim. Chang. 2021, 11, 207–212. [Google Scholar] [CrossRef]
  12. Song, J.; Miller, G.R.; Cahill, A.T.; Aparecido, L.M.T.; Moore, G.W. Modeling land surface processes over a mountainous rainforest in Costa Rica using CLM4.5 and CLM5. Geosci. Model Dev. 2020, 13, 5147–5173. [Google Scholar] [CrossRef]
  13. Song, J.; Miller, G.R.; Cahill, A.T.; Aparecido, L.M.T.; Moore, G.W. Modeling Profiles of Micrometeorological Variables in a Tropical Premontane Rainforest Using Multi-Layered CLM (CLM-ML). J. Adv. Model. Earth Syst. 2021, 13, e2020MS002259. [Google Scholar] [CrossRef]
  14. Sheil, D. Forests, atmospheric water and an uncertain future: The new biology of the global water cycle. For. Ecosyst. 2018, 5, 19. [Google Scholar] [CrossRef] [Green Version]
  15. Song, J.Y. Improving Predictions of Soil and Plant Evapotranspiration in Vadose Zone and Land Surface Models. Ph.D. Thesis, Texas A&M University, College Station, TX, USA, 2019. [Google Scholar]
  16. Harris, R.M.B.; Loeffler, F.; Rumm, A.; Fischer, C.; Horchler, P.; Scholz, M.; Foeckler, F.; Henle, K. Biological responses to extreme weather events are detectable but difficult to formally attribute to anthropogenic climate change. Sci. Rep. 2020, 10, 14067. [Google Scholar] [CrossRef] [PubMed]
  17. Stott, P. How climate change affects extreme weather events. Science 2016, 352, 1517–1518. [Google Scholar] [CrossRef]
  18. Mann, M.E.; Rahmstorf, S.; Kornhuber, K.; Steinman, B.A.; Miller, S.K.; Coumou, D. Influence of Anthropogenic Climate Change on Planetary Wave Resonance and Extreme Weather Events. Sci. Rep. 2017, 7, 45242. [Google Scholar] [CrossRef] [Green Version]
  19. Allan, C.; Xia, J.; Pahl-Wostl, C. Climate change and water security: Challenges for adaptive water management. Curr. Opin. Environ. Sustain. 2013, 5, 625–632. [Google Scholar] [CrossRef]
  20. Turral, H.; Burke, J.; Faurès, J.M. Climate Change, Water and Food Security; Number 36; Food and Agriculture Organization of the United Nations (FAO): Rome, Italy, 2011. [Google Scholar]
  21. Misra, A.K. Climate change and challenges of water and food security. Int. J. Sustain. Built Environ. 2014, 3, 153–165. [Google Scholar] [CrossRef] [Green Version]
  22. Kayiranga, A.; Chen, B.; Trisurat, Y.; Ndayisaba, F.; Sun, S.; Tuankrua, V.; Wang, F.; Karamage, F.; Measho, S.; Nthangeni, W.; et al. Water Use Efficiency-Based Multiscale Assessment of Ecohydrological Resilience to Ecosystem Shifts Over the Continent of Africa During 1992–2015. J. Geophys. Res. Biogeosci. 2020, 125, e2020JG005749. [Google Scholar] [CrossRef]
  23. Neher, I.; Buchmann, T.; Crewell, S.; Evers-Dietze, B.; Pfeilsticker, K.; Pospichal, B.; Schirrmeister, C.; Meilinger, S. Impact of atmospheric aerosols on photovoltaic energy production Scenario for the Sahel zone. Energy Procedia 2017, 125, 170–179. [Google Scholar] [CrossRef]
  24. Jones, C.D.; Arora, V.; Friedlingstein, P.; Bopp, L.; Brovkin, V.; Dunne, J.; Graven, H.; Hoffman, F.; Ilyina, T.; John, J.G.; et al. C4MIP—The Coupled Climate–Carbon Cycle Model Intercomparison Project: Experimental protocol for CMIP6. Geosci. Model Dev. 2016, 9, 2853–2880. [Google Scholar] [CrossRef] [Green Version]
  25. Lawrence, D.M.; Hurtt, G.C.; Arneth, A.; Brovkin, V.; Calvin, K.V.; Jones, A.D.; Jones, C.D.; Lawrence, P.J.; de Noblet-Ducoudré, N.; Pongratz, J.; et al. The Land Use Model Intercomparison Project (LUMIP) contribution to CMIP6: Rationale and experimental design. Geosci. Model Dev. 2016, 9, 2973–2998. [Google Scholar] [CrossRef] [Green Version]
  26. Hoffman, F.M.; Covey, C.C.; Fung, I.Y.; Randerson, J.T.; Thornton, P.E.; Lee, Y.H.; Rosenbloom, N.A.; Stöckli, R.C.; Running, S.W.; Bernholdt, D.E.; et al. Results from the carbon-land model intercomparison project (C-LAMP) and availability of the data on the earth system grid (ESG). J. Phys. Conf. Ser. 2007, 78, 012026. [Google Scholar] [CrossRef]
  27. Hoffman, F.M.; Koven, C.D.; Keppel-Aleks, G.; Lawrence, D.M.; Riley, W.J.; Randerson, J.T.; Ahlström, A.; Abramowitz, G.; Baldocchi, D.D.; Best, M.J.; et al. 2016 International Land Model Benchmarking (ILAMB) Workshop Report; U.S. Department of Energy, Office of Science: Germantown, MD, USA, 2017. [CrossRef] [Green Version]
  28. Friedlingstein, P.; Cox, P.; Betts, R.; Bopp, L.; von Bloh, W.; Brovkin, V.; Cadule, P.; Doney, S.; Eby, M.; Fung, I.; et al. Climate—Carbon Cycle Feedback Analysis: Results from the C4MIP Model Intercomparison. J. Clim. 2006, 19, 3337–3353. [Google Scholar] [CrossRef]
  29. Prentice, I.; Farquhar, G.; Fasham, M.; Goulden, M.; Heimann, M.; Jaramillo, V.; Kheshgi, H.; Quéré, C.L.; Scholes, R.; Wallace, D.; et al. The carbon cycle and atmospheric carbon dioxide. In Climate Change 2001: The Scientific Basis, Intergovernmental Panel on Climate Change; Cambridge University Press: Cambridge, UK, 2001; pp. 183–237. [Google Scholar]
  30. Hersbach, H.; Bell, B.; Berrisford, P.; Hirahara, S.; Horányi, A.; Muñoz-Sabater, J.; Nicolas, J.; Peubey, C.; Radu, R.; Schepers, D.; et al. The ERA5 global reanalysis. Q. J. R. Meteorol. Soc. 2020, 146, 1999–2049. [Google Scholar] [CrossRef]
  31. Jung, M.; Koirala, S.; Weber, U.; Ichii, K.; Gans, F.; Camps-Valls, G.; Papale, D.; Schwalm, C.; Tramontana, G.; Reichstein, M. The FLUXCOM ensemble of global land-atmosphere energy fluxes. Sci. Data 2019, 6, 74. [Google Scholar] [CrossRef] [Green Version]
  32. Yuan, S.; Quiring, S.M.; Leasor, Z.T. Historical Changes in Surface Soil Moisture Over the Contiguous United States: An Assessment of CMIP6. Geophys. Res. Lett. 2021, 48, e2020GL089991. [Google Scholar] [CrossRef]
  33. Ziehn, T.; Chamberlain, M.A.; Law, R.M.; Lenton, A.; Bodman, R.W.; Dix, M.; Stevens, L.; Wang, Y.P.; Srbinovsky, J. The Australian Earth System Model: ACCESS-ESM1.5. J. South. Hemisph. Earth Syst. Sci. 2020, 70, 193–214. [Google Scholar] [CrossRef]
  34. Wu, T.; Lu, Y.; Fang, Y.; Xin, X.; Li, L.; Li, W.; Jie, W.; Zhang, J.; Liu, Y.; Zhang, L.; et al. The Beijing Climate Center Climate System Model (BCC-CSM): The main progress from CMIP5 to CMIP6. Geosci. Model Dev. 2019, 12, 1573–1600. [Google Scholar] [CrossRef] [Green Version]
  35. Swart, N.C.; Cole, J.N.S.; Kharin, V.V.; Lazare, M.; Scinocca, J.F.; Gillett, N.P.; Anstey, J.; Arora, V.; Christian, J.R.; Hanna, S.; et al. The Canadian Earth System Model version 5 (CanESM5.0.3). Geosci. Model Dev. 2019, 12, 4823–4873. [Google Scholar] [CrossRef] [Green Version]
  36. Danabasoglu, G.; Lamarque, J.F.; Bacmeister, J.; Bailey, D.A.; DuVivier, A.K.; Edwards, J.; Emmons, L.K.; Fasullo, J.; Garcia, R.; Gettelman, A.; et al. The Community Earth System Model Version 2 (CESM2). J. Adv. Model. Earth Syst. 2020, 12, e2019MS001916. [Google Scholar] [CrossRef] [Green Version]
  37. Seferian, R.; Nabat, P.; Michou, M.; Saint-Martin, D.; Voldoire, A.; Colin, J.; Decharme, B.; Delire, C.; Berthet, S.; Chevallier, M.; et al. Evaluation of CNRM Earth System Model, CNRM-ESM2-1: Role of Earth System Processes in Present-Day and Future Climate. J. Adv. Model. Earth Syst. 2019, 11, 4182–4227. [Google Scholar] [CrossRef] [Green Version]
  38. Li, L.; Yu, Y.; Tang, Y.; Lin, P.; Xie, J.; Song, M.; Dong, L.; Zhou, T.; Liu, L.; Wang, L.; et al. The Flexible Global Ocean-Atmosphere-Land System Model Grid-Point Version 3 (FGOALS-g3): Description and Evaluation. J. Adv. Model. Earth Syst. 2020, 12, e2019MS002012. [Google Scholar] [CrossRef]
  39. Dunne, J.P.; Horowitz, L.W.; Adcroft, A.J.; Ginoux, P.; Held, I.M.; John, J.G.; Krasting, J.P.; Malyshev, S.; Naik, V.; Paulot, F.; et al. The GFDL Earth System Model Version 4.1 (GFDL-ESM 4.1): Overall Coupled Model Description and Simulation Characteristics. J. Adv. Model. Earth Syst. 2020, 12, e2019MS002015. [Google Scholar] [CrossRef]
  40. Kelley, M.; Schmidt, G.A.; Nazarenko, L.S.; Bauer, S.E.; Ruedy, R.; Russell, G.L.; Ackerman, A.S.; Aleinov, I.; Bauer, M.; Bleck, R.; et al. GISS-E2.1: Configurations and Climatology. J. Adv. Model. Earth Syst. 2020, 12, e2019MS002025. [Google Scholar] [CrossRef] [PubMed]
  41. Williams, K.D.; Copsey, D.; Blockley, E.W.; Bodas-Salcedo, A.; Calvert, D.; Comer, R.; Davis, P.; Graham, T.; Hewitt, H.T.; Hill, R.; et al. The Met Office Global Coupled Model 3.0 and 3.1 (GC3.0 and GC3.1) Configurations. J. Adv. Model. Earth Syst. 2018, 10, 357–380. [Google Scholar] [CrossRef]
  42. Hourdin, F.; Rio, C.; Grandpeix, J.Y.; Madeleine, J.B.; Cheruy, F.; Rochetin, N.; Jam, A.; Musat, I.; Idelkadi, A.; Fairhead, L.; et al. LMDZ6A: The Atmospheric Component of the IPSL Climate Model With Improved and Better Tuned Physics. J. Adv. Model. Earth Syst. 2020, 12, e2019MS001892. [Google Scholar] [CrossRef] [Green Version]
  43. Tatebe, H.; Ogura, T.; Nitta, T.; Komuro, Y.; Ogochi, K.; Takemura, T.; Sudo, K.; Sekiguchi, M.; Abe, M.; Saito, F.; et al. Description and basic evaluation of simulated mean state, internal variability, and climate sensitivity in MIROC6. Geosci. Model Dev. 2019, 12, 2727–2765. [Google Scholar] [CrossRef] [Green Version]
  44. Yukimoto, S.; Kawai, H.; Koshiro, T.; Oshima, N.; Yoshida, K.; Urakawa, S.; Tsujino, H.; Deushi, M.; Tanaka, T.; Hosaka, M.; et al. The Meteorological Research Institute Earth System Model Version 2.0, MRI-ESM2.0: Description and Basic Evaluation of the Physical Component. J. Meteorol. Soc. Jpn. Ser. II 2019, 97, 931–965. [Google Scholar] [CrossRef] [Green Version]
  45. Seland, Ø.; Bentsen, M.; Olivié, D.; Toniazzo, T.; Gjermundsen, A.; Graff, L.S.; Debernard, J.B.; Gupta, A.K.; He, Y.C.; Kirkevåg, A.; et al. Overview of the Norwegian Earth System Model (NorESM2) and key climate response of CMIP6 DECK, historical, and scenario simulations. Geosci. Model Dev. 2020, 13, 6165–6200. [Google Scholar] [CrossRef]
  46. Iturbide, M.; Gutiérrez, J.M.; Alves, L.M.; Bedia, J.; Cerezo-Mota, R.; Cimadevilla, E.; Cofiño, A.S.; Di Luca, A.; Faria, S.H.; Gorodetskaya, I.V.; et al. An update of IPCC climate reference regions for subcontinental analysis of climate model data: Definition and aggregated datasets. Earth Syst. Sci. Data 2020, 12, 2959–2970. [Google Scholar] [CrossRef]
  47. Wang, A.; Zeng, X.; Guo, D. Estimates of global surface hydrology and heat fluxes from the Community Land Model (CLM4.5) with four atmospheric forcing datasets. J. Hydrometeorol. 2016, 17, 2493–2510. [Google Scholar] [CrossRef] [Green Version]
  48. Heidkamp, M.; Chlond, A.; Ament, F. Closing the energy balance using a canopy heat capacity and storage concept—A physically based approach for the land component JSBACHv3.11. Geosci. Model Dev. 2018, 11, 3465–3479. [Google Scholar] [CrossRef] [Green Version]
  49. Monteith, J.; Unsworth, M. Principles of Environmental Physics: Plants, Animals, and the Atmosphere; Academic Press: Cambridge, MA, USA, 2013. [Google Scholar]
  50. Brutsaert, W. Hydrology: An Introduction; Cambridge Univeristy Press: Cambridge, UK, 2005. [Google Scholar]
  51. Shim, S.; Sung, H.; Kwon, S.; Kim, J.; Lee, J.; Sun, M.; Song, J.; Ha, J.; Byun, Y.; Kim, Y.; et al. Regional Features of Long-Term Exposure to PM2.5 Air Quality over Asia under SSP Scenarios Based on CMIP6 Models. Int. J. Environ. Res. Public Health 2021, 18, 6817. [Google Scholar] [CrossRef]
  52. Seo, J.; Shim, S.; Kwon, S.H.; Boo, K.O.; Kim, Y.H.; O’Connor, F.; Johnson, B.; Dalvi, M.; Folberth, G.; Teixeira, J.; et al. The Impacts of Aerosol Emissions on Historical Climate in UKESM1. Atmosphere 2020, 11, 1095. [Google Scholar] [CrossRef]
  53. Angell, J.K.; Korshover, J. Surface temperature changes following the six major volcanic episodes between 1780 and 1980. J. Clim. Appl. Meteorol. 1985, 24, 937–951. [Google Scholar] [CrossRef] [Green Version]
  54. Han, B.; Lü, S.; Li, R.; Wang, X.; Zhao, L.; Zhao, C.; Wang, D.; Meng, X. Global land surface climate analysis based on the calculation of a modified Bowen ratio. Adv. Atmos. Sci. 2017, 34, 663–678. [Google Scholar] [CrossRef]
  55. Chanzy, A.; Bruckler, L. Significance of soil surface moisture with respect to daily bare soil evaporation. Water Resour. Res. 1993, 29, 1113–1125. [Google Scholar] [CrossRef]
  56. Farquhar, G.D.; von Caemmerer, S.; Berry, J.A. A Biochemical Model of Photosynthetic CO2 Assimilation in Leaves of C3 Species; Springer: Berlin, Germany, 1980. [Google Scholar] [CrossRef] [Green Version]
  57. Evans, J. Improving photosynthesis. Plant Physiol. 2013, 162, 1780–1793. [Google Scholar] [CrossRef] [Green Version]
  58. Medlyn, B.E.; Dreyer, E.; Ellsworth, D.; Forstreuter, M.; Harley, P.C.; Kirschbaum, M.U.F.; Le Roux, X.; Montpied, P.; Strassemeyer, J.; Walcroft, A.; et al. Temperature response of parameters of a biochemically based model of photosynthesis. II. A review of experimental data. Plant Cell Environ. 2002, 25, 1167–1179. [Google Scholar] [CrossRef] [Green Version]
  59. Bonan, G.B.; Lawrence, P.J.; Oleson, K.W.; Levis, S.; Jung, M.; Reichstein, M.; Lawrence, D.M.; Swenson, S.C. Improving canopy processes in the Community Land Model version 4 (CLM4) using global flux fields empirically inferred from FLUXNET data. J. Geophys. Res. Biogeosci. 2011, 116, G02014. [Google Scholar] [CrossRef] [Green Version]
  60. Bonan, G.B.; Oleson, K.W.; Fisher, R.A.; Lasslop, G.; Reichstein, M. Reconciling leaf physiological traits and canopy flux data: Use of the TRY and FLUXNET databases in the Community Land Model version 4. J. Geophys. Res. Biogeosci. 2012, 117, G02026. [Google Scholar] [CrossRef]
  61. Neumann, R.B.; Cardon, Z.G. The magnitude of hydraulic redistribution by plant roots: A review and synthesis of empirical and modeling studies. New Phytol. 2012, 194, 337–352. [Google Scholar] [CrossRef] [PubMed]
  62. Bonan, G.B.; Williams, M.; Fisher, R.A.; Oleson, K.W. Modeling stomatal conductance in the earth system: Linking leaf water-use efficiency and water transport along the soil–plant–atmosphere continuum. Geosci. Model Dev. 2014, 7, 2193–2222. [Google Scholar] [CrossRef] [Green Version]
  63. Medvigy, D.; Wofsy, S.C.; Munger, J.W.; Hollinger, D.Y.; Moorcroft, P.R. Mechanistic scaling of ecosystem function and dynamics in space and time: Ecosystem Demography model version 2. J. Geophys. Res. Biogeosci. 2009, 114, G01002. [Google Scholar] [CrossRef] [Green Version]
  64. Yuan, F.; Liu, J.; Zuo, Y.; Guo, Z.; Wang, N.; Song, C.; Wang, Z.; Sun, L.; Guo, Y.; Song, Y.; et al. Rising vegetation activity dominates growing water use efficiency in the Asian permafrost region from 1900 to 2100. Sci. Total. Environ. 2020, 736, 139587. [Google Scholar] [CrossRef]
  65. Lavergne, A.; Graven, H.; De Kauwe, M.G.; Keenan, T.F.; Medlyn, B.E.; Prentice, I.C. Observed and modelled historical trends in the water-use efficiency of plants and ecosystems. Glob. Chang. Biol. 2019, 25, 2242–2257. [Google Scholar] [CrossRef] [Green Version]
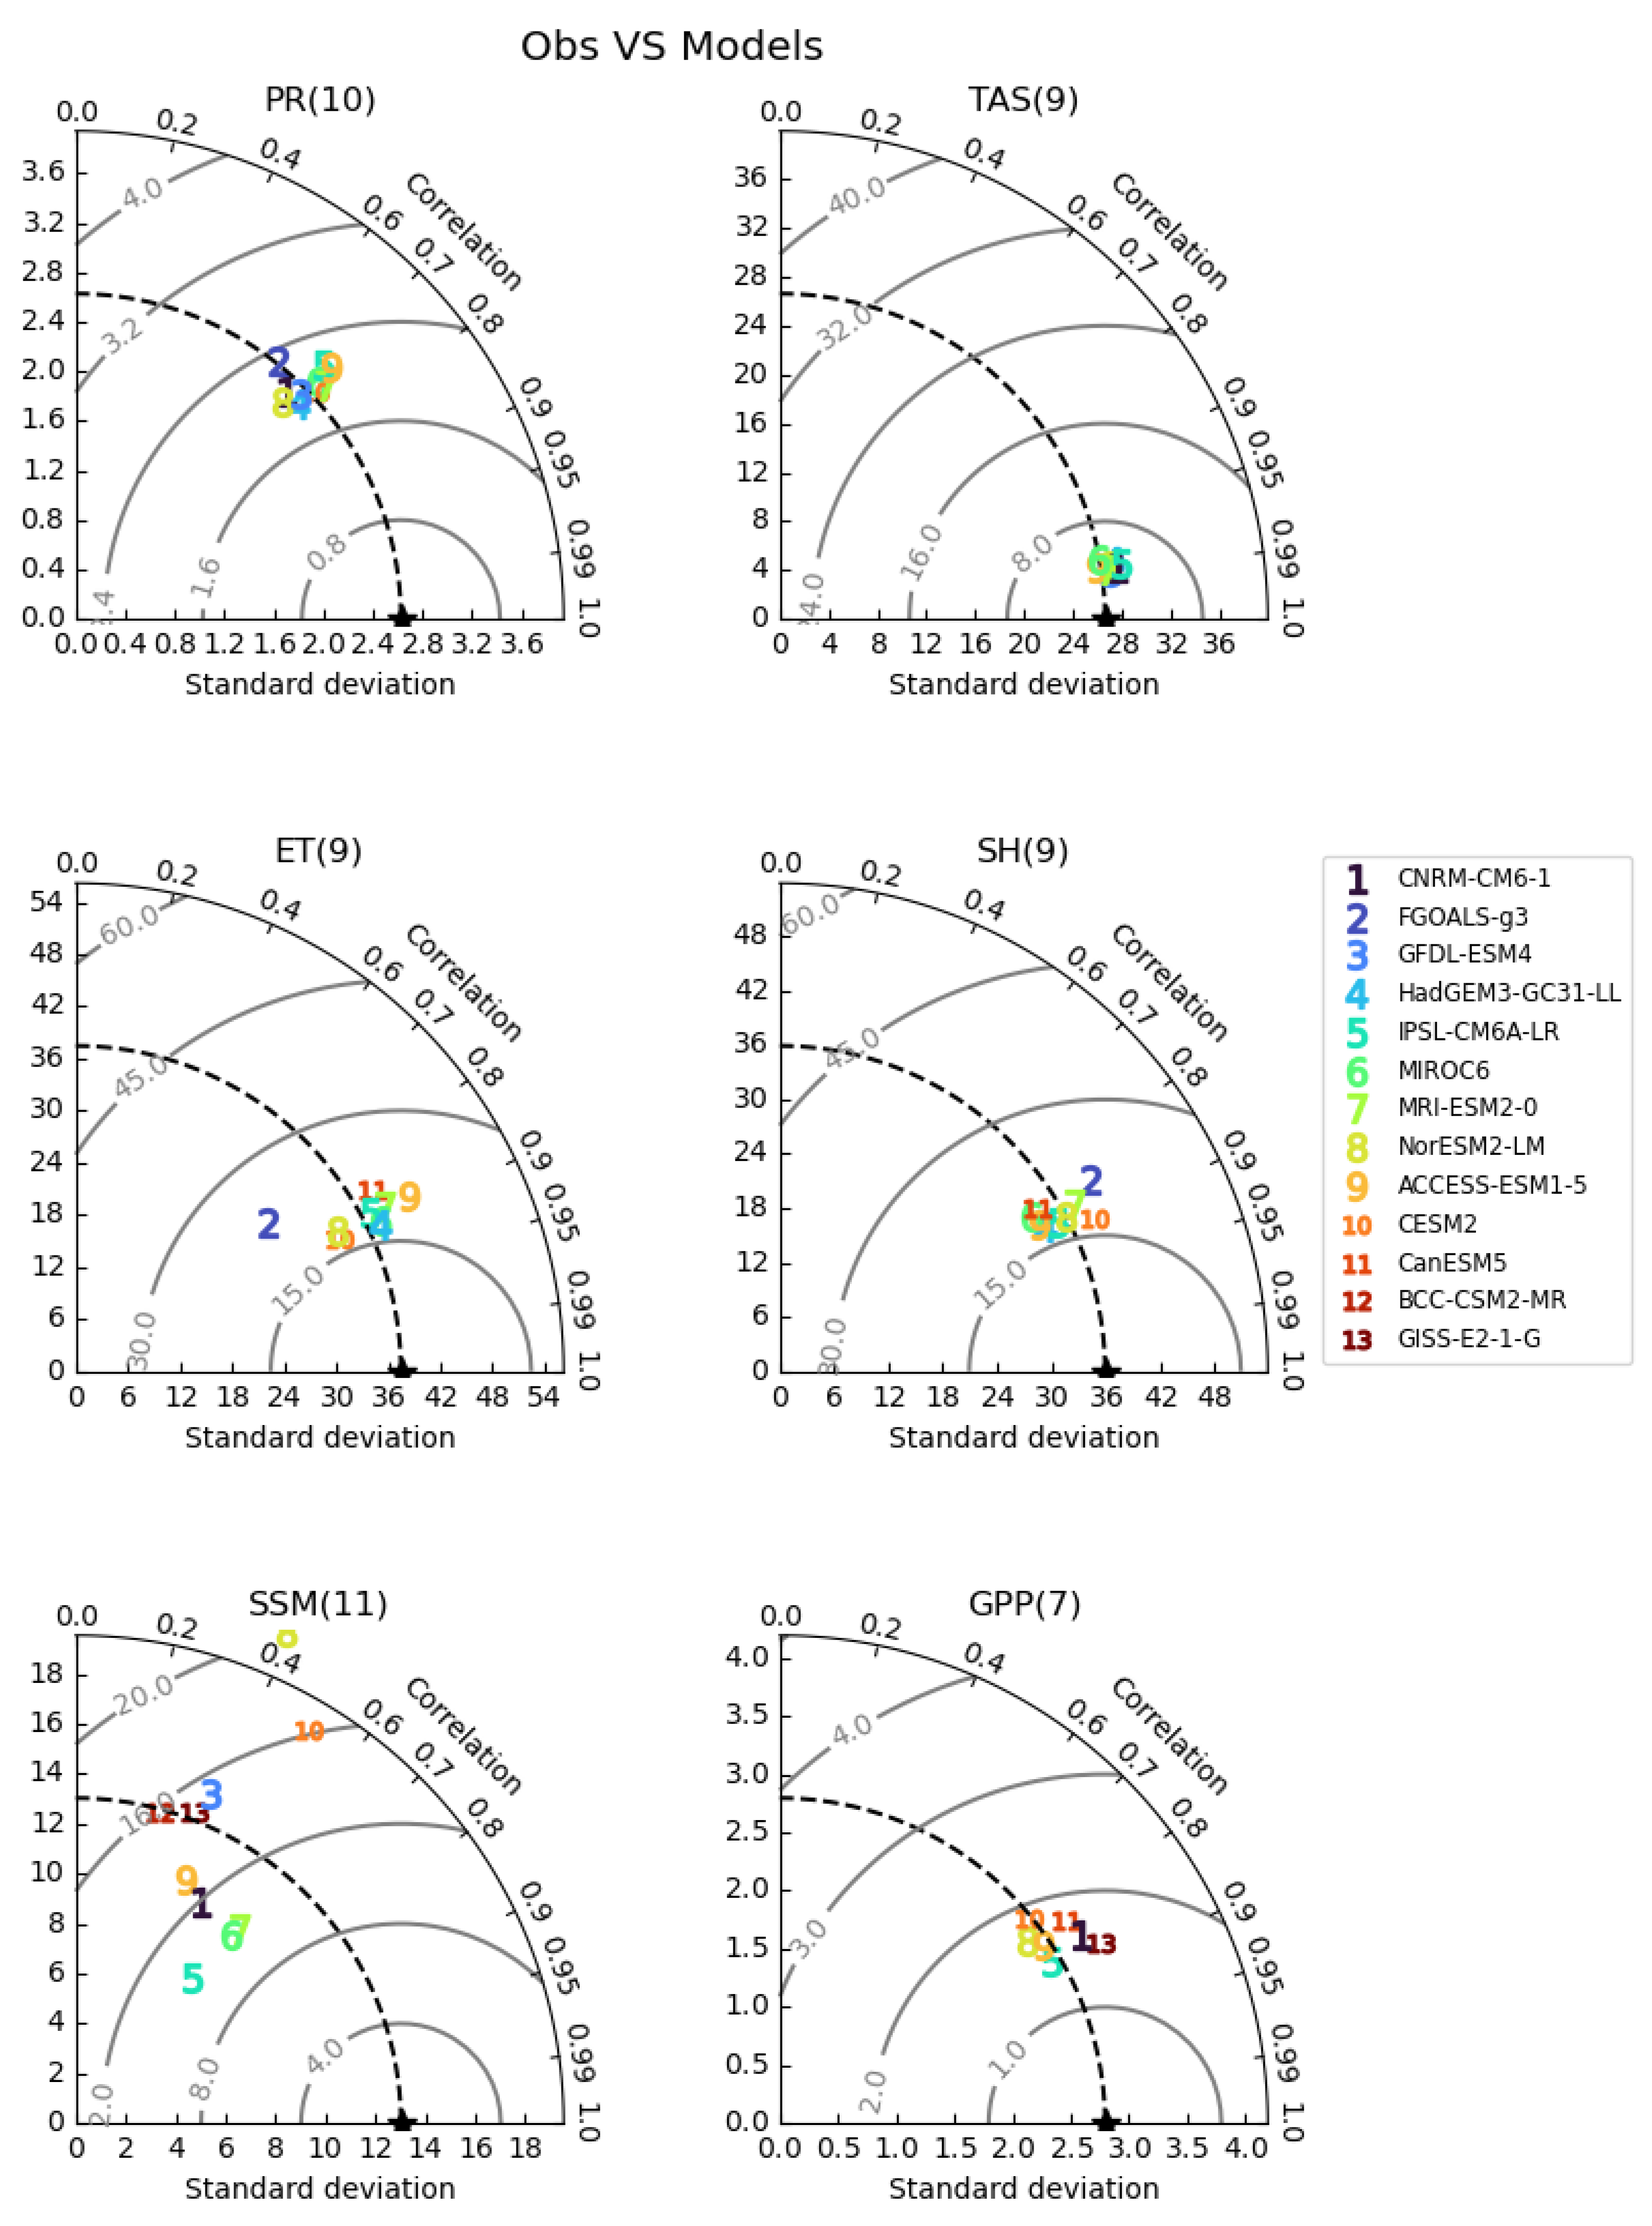
Figure 1. Taylor diagram for model validation. PR, TAS, ET, SH, and SSM data were compared with ERA5 data from 1981 to 2010, and SSM data were compared with FLUX-MTE data from 1982 to 2007.
Land 10 01151 g001
Figure 2. (a) Energy balance and (b) water balance (reprinted from Song [15]).
Land 10 01151 g002
Figure 3. Results of precipitation (PR) and temperature (TAS) analyses: (a) 50-year mean start-to-end difference of precipitation; (b) time series plot of global precipitation; (c) 50-year mean start-to-end difference of temperature; (d) time series plot of global temperature. The titles above the plots and the legends within the plots are followed by the number of ensemble models in parentheses, and the estimated parameters with hats provide the statistical significance. On the maps, the dots indicate where the differences are significant (p-value ≤ 0.05).
Land 10 01151 g003
Figure 4. Result of the Net Radiation (ETHSUM) analysis: (a) 50-year mean start-to-end differences in net radiation (1850–2010); (b) time series plot of global net radiation; (c) 10-year mean start-to-end differences in net radiation (1970–2010); (d) time series plot of global net radiation. The titles above the plots and the legends within the plots are followed by the number of ensemble models in parentheses, and the estimated parameters with hats indicate statistical significance. On the maps, dots indicate where the differences are significant (p-value ≤ 0.05).
Land 10 01151 g004
Figure 5. Results of latent heat (∼evapotranspiration, ET) and sensible heat (SH) flux analyses and their ratio (ET Ratio): (a) time series plot of global ET; (b) plot of ET in East Asia; (c) plot of global SH; (d) plot of SH in East Asia; (e) plot of global ET Ratio; (f) plot of ET ratio in East Asia. The titles above the plots and the legends within the plots are followed by the number of ensemble models in parentheses, and the estimated parameters with hats provide statistical significances (p-value ≤ 0.05).
Land 10 01151 g005
Figure 6. Results of surface soil moisture (SSM), total soil moisture (TSM), and water budget ( P ( E T + O ) ) analyses, where O is the surface runoff: (a) 50-year mean start-to-end difference in SSM; (b) time series plot of global SSM; (c) 50-year mean start-to-end difference in TSM; (d) time series plot of global TSM; (e) 50-year mean start-to-end difference in P ( E T + O ) ; (f) time series plot of global P ( E T + O ) . The water budget was normalized by the whole-period average. The titles above the plots and the legends within the plots are followed by the number of ensemble models in parentheses, and the estimated parameters with hats indicate statistical significance. On the maps, dots indicate where the differences are significant (p-value ≤ 0.05).
Land 10 01151 g006
Figure 7. Results of runoff (RUNOFF) and precipitation intensity (Pint): (a) 50-year mean start-to-end difference in RUNOFF; (b) time series plot of global RUNOFF; (c) 50-year mean start-to-end difference in Pint; (d) time series plot of global Pint. The titles above the plots and the legends within the plots are followed by the number of ensemble models in parentheses, and the estimated parameters with hats provide the statistical significances. On the maps, dots indicate where the differences are significant (p-value ≤ 0.05).
Land 10 01151 g007
Figure 8. Results of the GPP and WUE analysis: (a) 50-year mean start-to-end difference in GPP (1850-2010); (b) time series plot of global GPP; (c) 10-year mean start-to-end difference in WUE (1870–2010); (d) time series plot of global WUE. The titles above the plots and the legends within the plots are followed by the number of ensemble models in parentheses, and the estimated parameters with hats provide statistical significances. On the maps, dots indicate where the differences are significant (p-value ≤ 0.05).
Land 10 01151 g008
Figure 9. All parameters obtained in the MLRM analysis. The variable names are followed by the number of ensemble models in parentheses. Orange shading indicates statistical significance.
Land 10 01151 g009
Publisher’s Note: MDPI stays neutral with regard to jurisdictional claims in published maps and institutional affiliations.