Article

Electrochemical and Structural Modifications of Humic Acids in Aerobically and Anaerobically Incubated Peat

Department of Agricultural, Food, Environmental and Animal Sciences (DI4A), University of Udine, Via delle Scienze 206, 33100 Udine, Italy
*
Author to whom correspondence should be addressed.
Land 2021, 10(11), 1189; https://doi.org/10.3390/land10111189
Submission received: 28 September 2021 / Revised: 3 November 2021 / Accepted: 3 November 2021 / Published: 5 November 2021
(This article belongs to the Special Issue Peatland Ecosystem)

Abstract

:
Exposure to oxygen and aerobic biological activity during drought periods alters the availability of terminal electron acceptors (TEA) in the peat catotelm layer. We investigated the changes in the electrochemical and chemical characteristics of humic acids (HA) induced by subjecting air-dried sphagnum peat to biological oxidation or reduction during a 90-day incubation experiment. Structural modifications of HAs from anaerobically (HAred) and aerobically (HAox) incubated peat were investigated by ATR-FTIR, UV–vis, and EEM fluorescence spectroscopy. Number and strength of acid groups were characterized by titration, while changes in redox properties were characterized by cyclic voltammetry and quantified by coulometry with mediated electrochemical oxidation (MEO). Exposure to oxygen had small effects, but compared to anaerobic incubation, decreased by 20% the capacity of HA to reduce the radical ion of 2,2′-Azinobis (3-ethylbenzothiazoline-6-sulfonic acid) (ABTS●−), passing from 2.77 ± 0.13 mmole- gHA−1 in HAred to 2.21 ± 0.10 mmole- gHA−1 in HAox. Pseudo-first-order electron transfer kinetic constants were 13.3 ± 1.2 s−1 for HAox and 16.7 ± 1.4 s−1 for HAred. Alterations in the hydrological status of the catotelm have minor effects on the actual in situ availability of organic TEA, but if coupled to intensified biological activity they may result in significant variations of greenhouse gases emissions.

1. Introduction

Peat deposits form because carbon (C) inputs to the catotelm, the anoxic part of the profile, exceed overall C losses. In fact, in the waterlogged part of the profile, the organic C (OC) mineralization is hindered by the much lower energy gain allowed by fermentation as compared to aerobic and anaerobic respirations [1,2]. In this way, about 270–370 Pg of C (nearly one-third of the world’s soil carbon) were sequestered in peatlands and most of them are accumulated below the permanent level of the water table [3,4]. In the coming decades, as a consequence of global warming, peatlands will be increasingly exposed to drought periods and water table fluctuations are expected to cause the release of huge amounts of greenhouse gases (GHG) [5].
The temperature dependence of the OC decomposition and the effects of shifts in vegetation cover have been extensively investigated and modeled [6,7], but effects of modified oxygen limitations on microbially mediated C mineralization rates have been underestimated [1]. Moreover, mechanisms underlying CO2:CH4 emission ratios from peatlands are not fully understood and will contribute to the scarcely known feedback mechanisms that hinder our capability to predict climate change [8,9]. About 10% of the global natural emissions of methane (54 Tg y−1) originates in bogs and organic horizons of tundra soils [10] and, considering that CH4 has a global warming potential 25 times that of CO2, it is important to understand which factors may be important in affecting emission ratios from peatlands. Among these, the availability of terminal electron acceptors (TEA) that fuel microbial anaerobic respiration is one of the most crucial.
In natural peatlands, as long as the soil is waterlogged, anaerobic respiration is limited by the completely reduced state of TEA. Conversely, in soils with fluctuating water tables, anaerobic respiration prevails for two to three weeks after re-submergence, because of the renewed availability of oxidized TEA that ensues after drainage and exposure to air [4]. During this stage, more CO2 and less CH4 is released from the upper layers compared to continuously submerged conditions. Keller and Takagi [11] demonstrated that the reduction of organic TEA is coupled to the production of a significant fraction of the CO2 released from a bog soil during anaerobic respiration, whereas CH4 is not produced until the electron-accepting capacity of organic TEA is exhausted. The higher energy yield of anaerobic respiration compared to methanogenesis provides the thermodynamic justification for the higher CO2:CH4 production ratios observed.
Compared to mineral soils, peatlands are naturally poor in inorganic TEA such as nitrate and Fe(III) [8,12], so CO2:CH4 production ratios higher than one can only be sustained by reduction of humic acids (HAs) [13]. In fact, HAs which can act as organic TEA [14] are contained in large amounts in peat [15,16,17]. Keller et al. [16] proved that the addition of HA alters the ratio of CO2:CH4 produced during anaerobic laboratory incubations. Moreover, HAs and HA-analogs have been proven to inhibit methane production in different types of peatlands by various mechanisms [18,19].
Redox-active species require activation by fluctuating redox conditions to maintain their capability to serve as TEA: this implies frequent switching between reducing and oxidizing conditions, as can be attained by hydrological perturbations that cause water table fluctuations [20].
The greater incidence and length of drought periods fostered by climate change will cause a more and more frequent onset of aerobic conditions in thicker sections of peat deposit profiles [21,22]. Impacts of water table lowering on GHG emissions from peatlands are highly variable: most studies report reductions in CH4 emissions, although the overall balance foresees a net increase from 0.73 to 0.86 Gt CO2-eq yr−1 by the end of the century [23]. The factors that affect the mechanisms underlying this variability have not been fully elucidated yet, but HA certainly play a pivotal role [19]. Besides enforcing aerobic mineralization during low water table periods, it is reasonable to hypothesize that both exposure to oxygen and aerobic biological activity contribute to alter the redox properties of HA increasing the overall availability of TEA and faster anoxic decomposition during the ensuing periods of flooding [24].
Previous studies investigated the effects of the addition of model organic TEA, HAs, and of the biological reduction of solid organic materials on greenhouse gas emissions from peat [25,26], and the redox cycling of solid HAs in suspension by pure bacterial strains [17,27]. However, no studies have so far directly addressed the evaluation of changes caused by modifying the conditions of peat on the capability of HA to act as TEA.
We hypothesized that changes in the redox properties of HA in their native solid state, are not only caused by exposure to oxygen but that aerobic biological activity modifies them and contributes to alter the availability of TEA in the catotelm layer.
In this work, we therefore analyzed HA extracted from: (i) a peat sample that had been dried and exposed to air; and (ii) the same peat after it underwent biological oxidation or reduction in mesocosms during a 90-day incubation experiment. Changes in the redox state of HA were quantified with cyclic voltammetry and coulometry by means of mediated electrochemical oxidation (MEO) and structural modifications of biologically reduced (HAred) and oxidized (HAox) humic acids were investigated by ATR-FTIR, UV–vis, and EEM fluorescence spectroscopy.

2. Materials and Methods

2.1. Chemicals

Sodium hydroxide, phosphoric acid, potassium persulfate, hydrochloric acid (all puriss. p.a.), 2,2′-Azinobis (3-ethylbenzothiazoline-6-sulfonic acid) (>98%) (ABTS2−) diammonium salt were obtained from Sigma-Aldrich (St. Louis, MO, USA). All solutions were prepared using high purity water (18 MΩ resistivity, Milli-Q Corp.), deoxygenated and N2 saturated (purged for 2 h under continuous stirring).

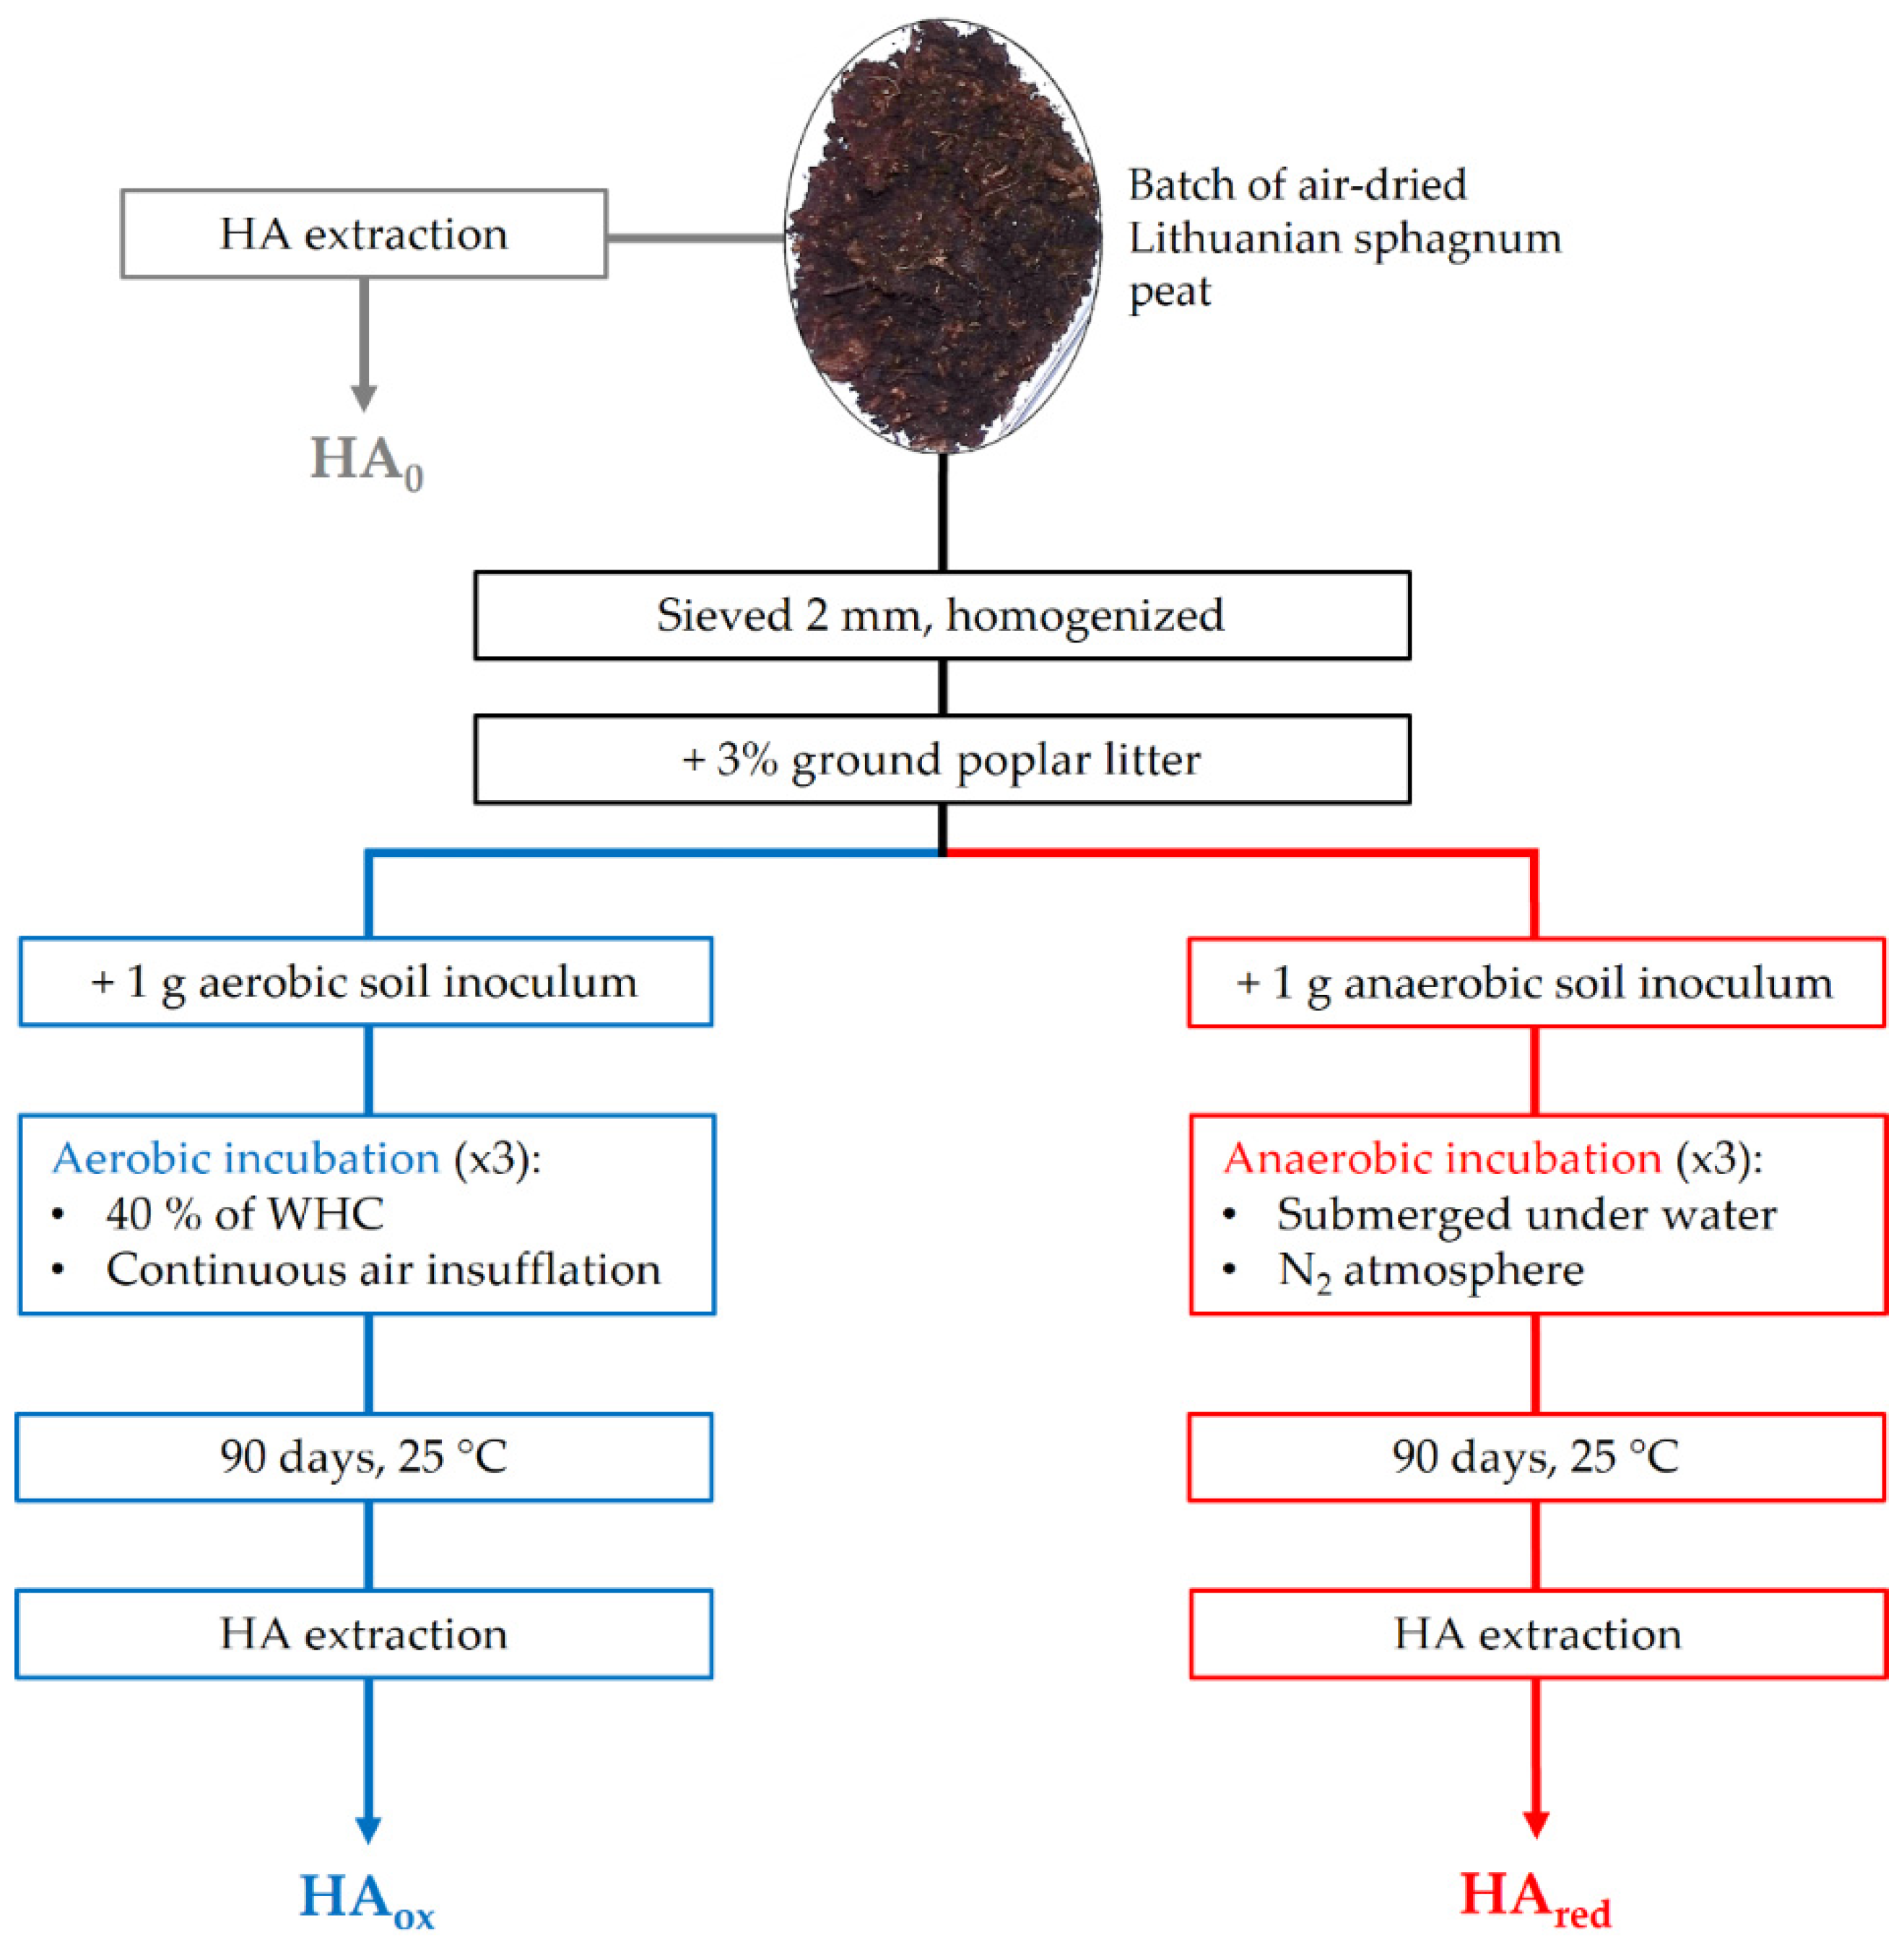
2.2. Experiment Layout

Lithuanian sphagnum peat (pH = 3.7, Von Post index H = 4) that had been stored air-dried in a perforated plastic bag for more than a year, was sieved at 2 mm, homogenized, and incubated in mesocosms under either fully aerobic or anaerobic conditions (Figure 1). Aerobic (40% of water holding capacity (WHC), continuous insufflation of air) and anaerobic (submerged under water previously purged with N2 for 2 h and kept under N2 atmosphere) mesocosms were incubated, in triplicate, in the dark in a thermostatic cell at 25 °C for 90 days. Each mesocosm contained an amount of peat corresponding to 200 g dry weight, which had been thoroughly mixed just before incubation with 3 g of ground poplar litter to boost biological activity [28,29], and 1 g of an aerobic or anaerobic fresh soil as natural inoculum. In the case of the anaerobic treatment, all operations (including HA extraction) were carried out inside an anoxic glove box (N2 saturated; O2 < 0.1 ppm).

2.3. HA Extraction

Humic acids were extracted from the air-dried peat (HA0) and from the aerobically (HAox) and anaerobically (HAred) incubated peat following the procedure recommended by the IHSS. Briefly, extractions were carried out using 0.1 M NaOH for 4 h at 1:20 peat/solution ratio. Suspensions were centrifuged (14,000 rpm for 30 min) and supernatants were filtered through 0.2 µm cellulose filters and acidified to pH 1 using 6 M HCl to allow HA precipitation. After washing twice with Milli-Q water, HA were frozen and then freeze-dried. The ash content, determined gravimetrically after burning 50 mg of each isolated HA in a muffle furnace at 500 °C for 4 h, was less than 2% in all samples. HA stock solutions were prepared by dissolving a certain amount of HA in 0.1 M anoxic phosphate buffer (pH 7.0).

2.4. HA Characterization

Organic carbon (OC) and total nitrogen (Ntot) contents, and carbon stable isotope composition (δ13C) of the original peat and extracted HA were determined with a CHN elemental analyzer (Vario Microcube, Elementar) coupled with a stable isotope ratio mass spectrometer (Isoprime 100, Elementar). Caffeine IAEA was used as international reference material.
Titration of acidic groups was carried out under N2 with a Mettler Memo titrator DL 50, according to [30].
UV–vis spectra of HA were recorded using a Cary Varian Spectrophotometer in 1 cm quartz cuvettes over a wavelength interval from 220 to 800 nm at a scan rate of 60 nm min−1. Each spectrum was normalized by the OC concentration of the sample.
Fluorescence emission-excitation matrices (EEMs) of HA solutions (15 mg L−1) were collected on a Cary Eclipse fluorescence spectrophotometer (Agilent Technologies) at varying excitation wavelengths from 230 to 500 nm (5 nm steps). Emission was recorded from 350 to 550 nm (1 nm steps, scan rate 600 nm min−1). Solutions were thermostated at 20.0 ± 0.5 °C. EEMs were blank subtracted and fluorescence intensities (F.I.) normalized for the OC concentration.
FTIR spectra were recorded with an FT-IR Spectrum 100 (PerkinElmer) spectrometer equipped with a universal ATR (attenuated total reflectance) sampling device containing a diamond/ZnSe crystal. The spectra were recorded at room temperature in transmission mode over a wavenumber interval from 4000 to 500 cm−1 (64 scans). A background spectrum of air was scanned under the same instrumental conditions before each series of measurements. Intensity ratios (R) were calculated for specific pairs of bands [31].

2.5. Electrochemical Measurements

Cyclic voltammograms (CV) were recorded by a 430A CHI electrochemical analyzer in 0.1 M anoxic phosphate buffer (pH 7.0) solutions (10–12 mL), under anoxic atmosphere, using a 3 mm diameter glassy carbon (GC) disk working electrode (WE), an Ag/AgCl reference electrode and a Pt wire auxiliary electrode. The WE was cleaned after each CV using 1.0 and 0.05 µm aluminum oxide on polishing pads, thoroughly rinsed with Milli-Q water, and dried. The cathodic and anodic vertex potentials were fixed at Eh = +0.15 V and +0.95 V (scan rate v = 0.010 V s−1). CVs were collected in the presence of only HA (0.2–2.0 g L−1) and in the presence of both ABTS2− (3 or 60 μM) and HA (0.05 to 3.5 g L−1) [32].
Mediated electrochemical oxidation (MEO) measurements were carried out, under anoxic atmosphere and continuous solution stirring, in a bulk electrolysis cell containing a macro GC WE polarized to Eh = +0.606 V, an Ag/AgCl reference electrode and a Pt wire auxiliary electrode (separated by a porous glass frit). ABTS2− was used as electrochemical mediator to shuttle electrons from electron-donating moieties in HA to the WE [33]. After oxidation of a 0.20 mM ABTS2− solution (0.1 M phosphate buffer, pH 7), small aliquots of HA were spiked into the electrochemical cell. Oxidative currents were automatically integrated by a digital current integrator (Model 731, Amel) to quantify the electron donating capacity (EDC) of HA. In CVs and MEO potentials were measured vs. Ag/AgCl but are reported vs. standard hydrogen electrode (SHE).

2.6. Statistics

Incubations were performed in triplicate, all electrochemical measurements were analytically replicated at least three times, while other analyses were performed in duplicate and reported in tables and figures as mean ± standard error (SE). Differences between treatments were tested by Tukey’s HSD and considered significant at p < 0.05. Regression analysis, test of significance of the correlation coefficient, and analysis of parallelism were carried out by R software [34,35].

3. Results

3.1. HA Composition

OC, Ntot and δ13C values of the original peat sample and of HA0, HAox and HAred are reported in Table 1. The results show that neither addition of poplar litter and soil inoculum nor incubation altered the C and N content and isotopic composition of HA, albeit a slight decrease in C/N ratio was observed in HAox as could be reasonably expected in an aerobic process.

3.2. Electrochemical Behavior of HAs

At potentials above +0.5 V, the CVs of both HAox and HAred (Figure 2a,b) displayed more intense oxidative currents during anodic scanning demonstrating not only that HAs can directly transfer electrons to the GC WE and that the intensity of the anodic current is linearly proportional to the concentration of HA, but also that more electrons were exchanged by HAred. Electrode passivation by surface-active fractions of HA probably occurred at relatively higher concentrations of HAs, as indicated by the lower reproducibility of scans when the concentration of HAs in the electrochemical cell exceeded 1.0 g L−1.
Linear correlations were found between HA concentrations and anodic current intensities (Ia) measured at 0.850 V, a potential at which most redox active groups of HA can be presumed to be oxidized (Figure 2d). HAred presented significantly steeper slope (p < 0.005) compared to HAox. Therefore, the direct transfer of electrons to the WE by a unit mass of HAs (slope of the regression line) decreased by about 50% after by exposure of peat to the activity of aerobic microorganisms. Because of the sluggish response, however, a proper quantitation of electron exchange by HA cannot be performed by direct electrochemical oxidation.
The featureless CVs of HAs (Figure 2) not only suggested the lack of defined oxidation or reduction potentials for both HAred and HAox, but also a sluggish electron transfer to the WE, which was later confirmed by the fact that no defined end point was reached even by ABTS2− mediated coulometric MEO. Therefore, after checking the linearity of the oxidative peak currents of both HAs at 0.719 V, the potential corresponding to that of the anodic peak of ABTS2− (Figure 2c), quantitative measurements were carried out by MEO with in ABTS2− solutions.

3.3. Electron Transfer Kinetic Constants from CV

To further characterize the electrochemical behavior of microbially reduced and oxidized HAs with quantitative measurements and to calculate pseudo first order kinetic constants of electron transfer, we used ABTS2− to mediate the electron transfer from electron donating moieties in HAs to the WE. The CV of ABTS2− solutions showed a reversible charge transfer process and obeyed the Randles–Sevcik law as confirmed by the linear correlations found between the oxidative peak current (Ip,a) and its concentration (R2 = 1.00) and v1/2 (R2 = 1.00) (data not shown).
The catalytic currents registered in the presence of both ABTS2− and HA were much higher than when only one component was present in the solution and increased with the HA concentration (Figure 3). This reflects the fact that at the boundary layer ABTS2− was oxidized to ABTS●− (ABTS2− ⇄ ABTS●− + 1e, heterogeneous oxidation step at the WE surface), but the radical ion was then chemically reduced back by HA (ABTS●− + HA → ABTS2− + HA, homogeneous reduction step) regenerating the non-radical reduced form (ABTS2−), which can once again be oxidized at the WE.
At increasing concentrations of HA, in the presence of 3 µM ABTS2−, the catalytic anodic peak currents increased linearly with the concentration of HAs up to 0.5 g L−1. Then, at 0.8 g L−1 for HAred and 0.9 g L−1 for HAox stationary state conditions were reached, at which the voltammetric response was no longer a peak but assumed a sigmoidal shape and no backward peak was found. At this stage, the homogeneous regeneration reaction (i.e., ABTS reduction by HA) occurred quantitatively during the potential sweep. From the intensity of the plateau currents (Ilim) it is possible to calculate pseudo-first-order kinetic constants (kf) of the electron transfer between ABTS and HAox or HAred, as suggested by [36]
k′f = (0.4463 Ilim/Id)2 Fv/RT
where Id is the peak current when only ABTS2− is present in solution, F is Faraday’s constant (96,487 C mol−1), v is the scan rate (0.010 V s−1), R is the ideal gas constant (8.31 J), T is the absolute temperature (298 K). The calculated kf values were 13.3 ± 1.2 and 16.7 ± 1.4 s−1 for HAox and HAred, respectively. This indicated that, compared to HAox, HAred can donate electrons faster (~30%) to the ABTS radical.

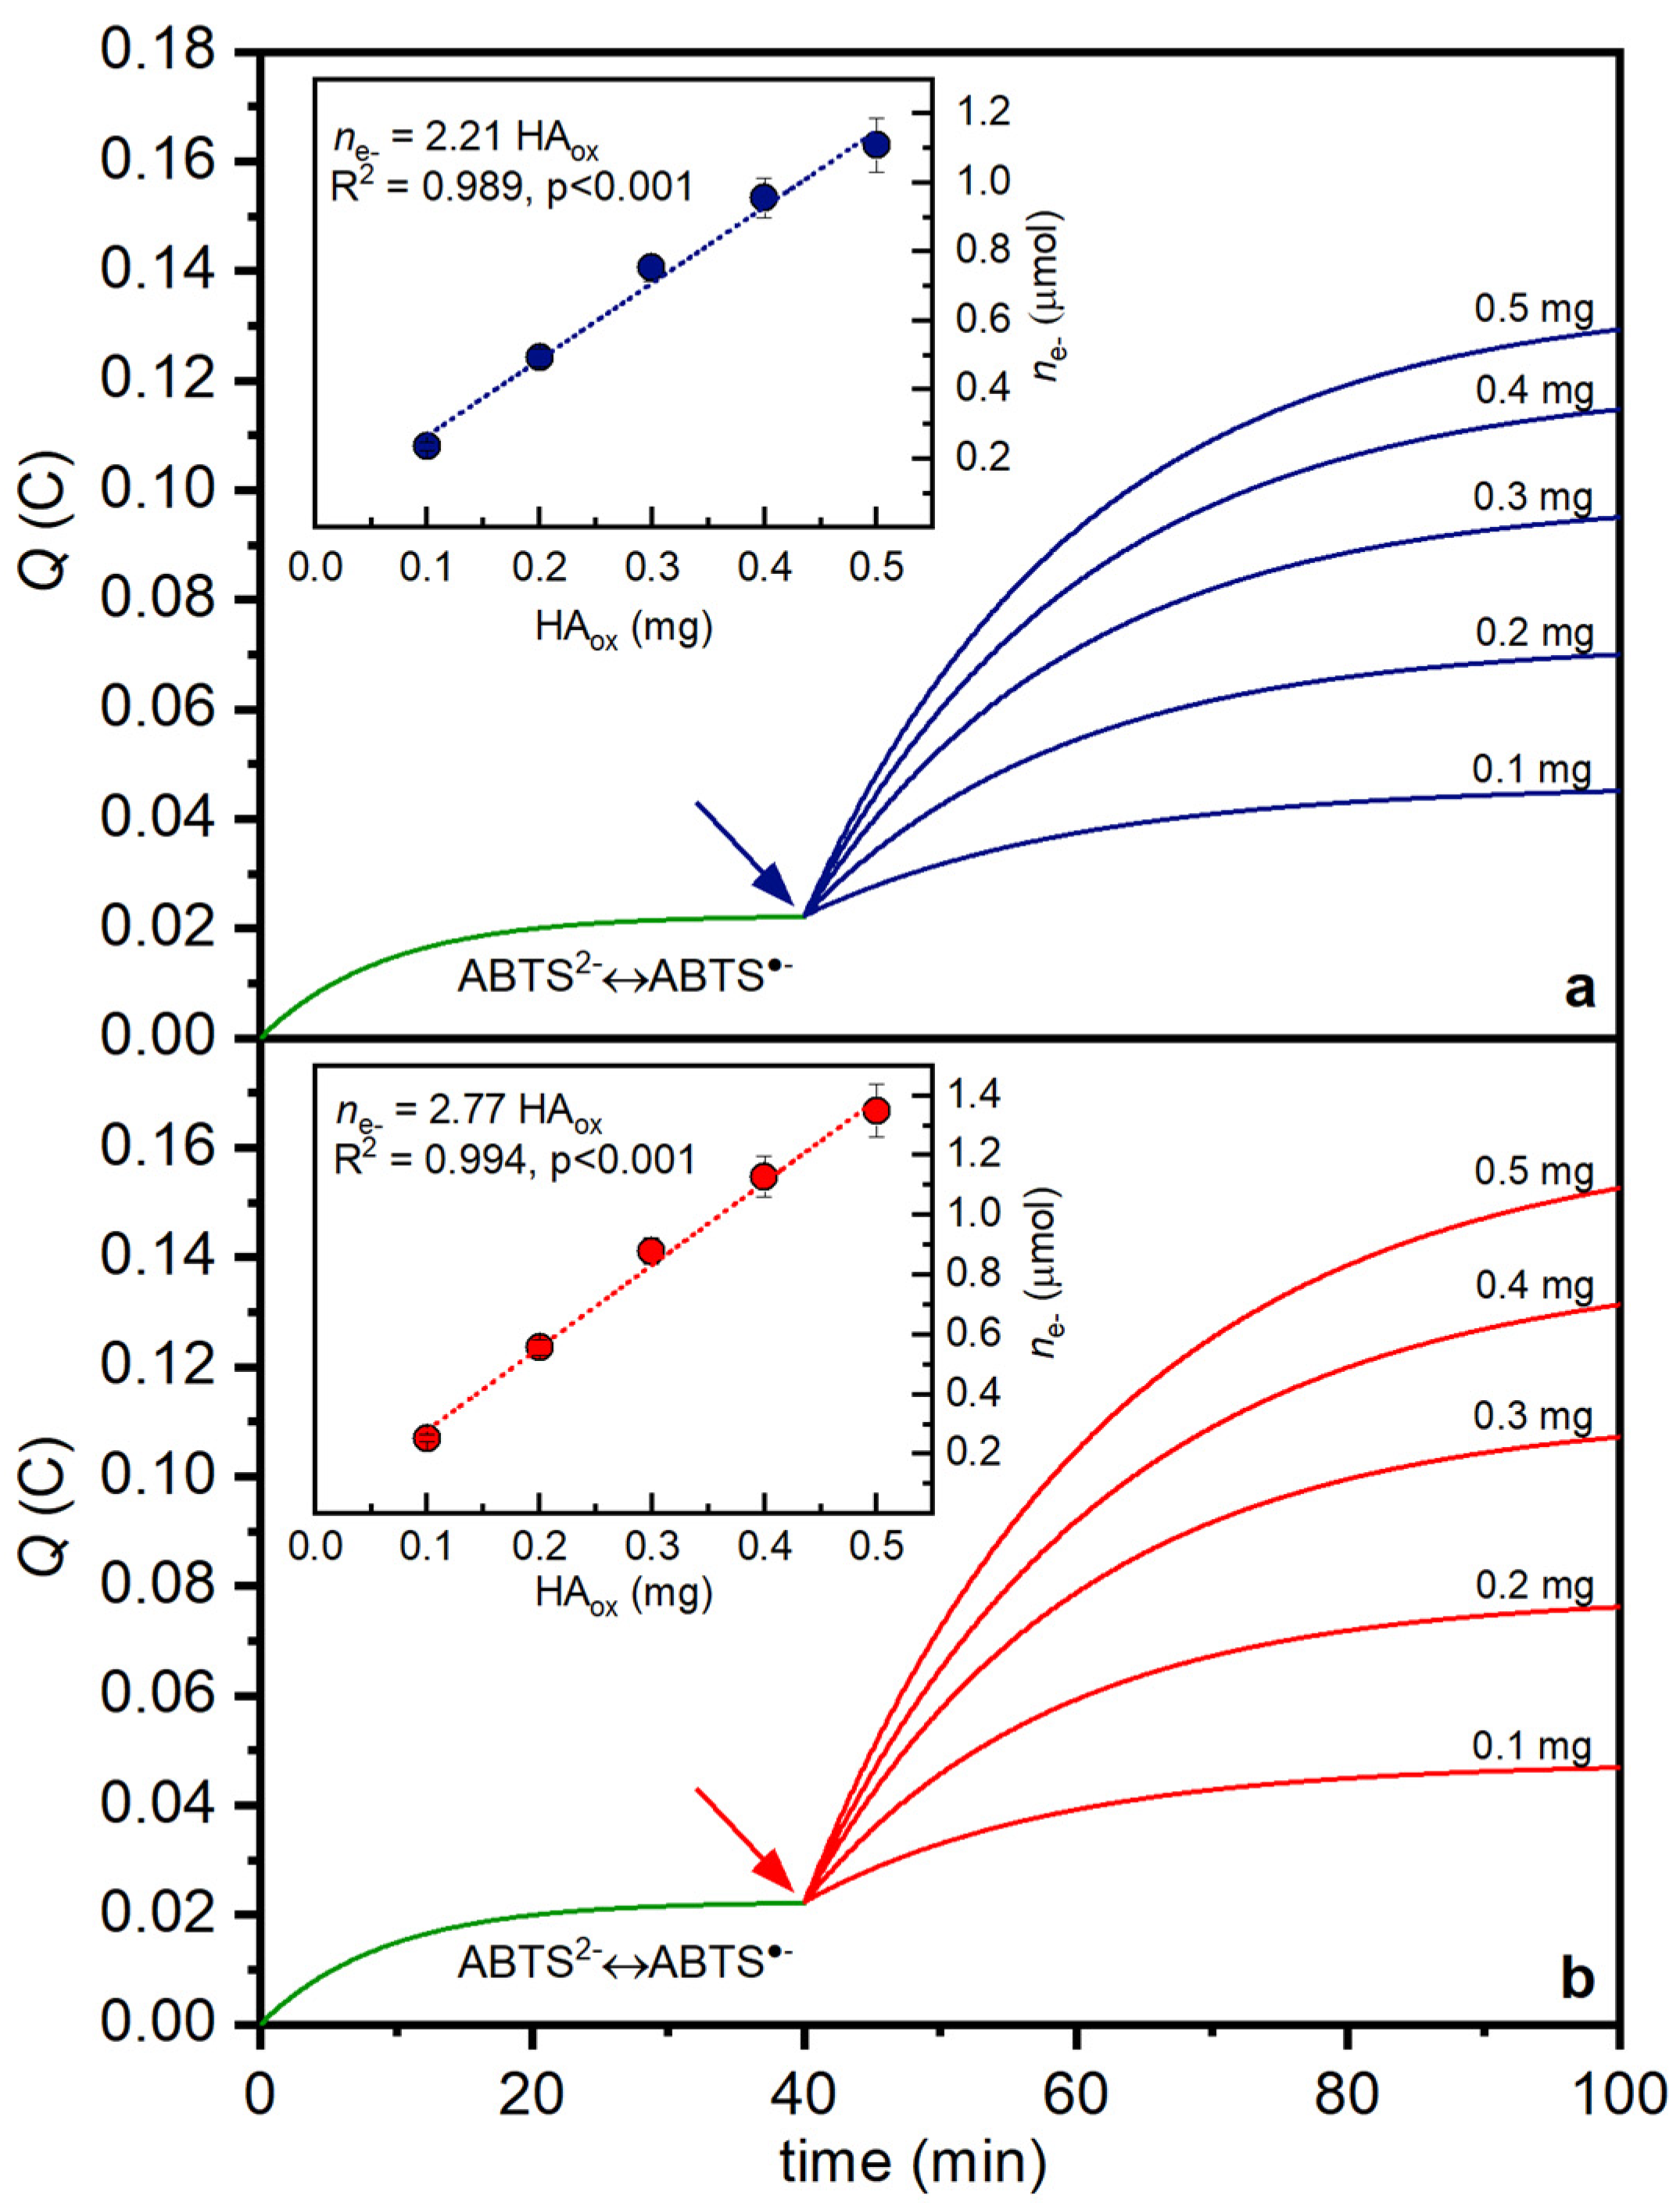
3.4. Quantification of Redox Changes

The effects of the aerobic/anaerobic incubation on the redox state of HA were quantified by MEO (Figure 4). The amount of excess charge transferred to the electrode by ABTS in the presence of HAs is directly proportional to the number of electrons, ne- (mol), transferred from HAs to the radical ABTS
ne- = Q/F
where Q is the integrated charge (C) and F is the Faraday constant. The EDC (mmole- gHA−1) of HAox and HAred were calculated after 60 min from HA addition, by normalizing ne- to the mass of the sample.
The EDC of HAox (2.21 ± 0.10 mmole- gHA−1) was ~20% lower (p < 0.05) than that of HAred (2.77 ± 0.13 mmole- gHA−1). This shows that peat incubation under oxic conditions resulted in a significant decrease in the reduced redox active moieties on HA molecules. The EDC value of the HA extracted from the original peat sample, which had been excavated and exposed to oxygen during and after drying, was 2.48 ± 0.18 mmole- gHA−1: oxidation in the absence of biological activity apparently diminished the EDC of HA by less than 10% (data not shown).

3.5. Structural Changes

Spectral parameters calculated from UV–vis spectra revealed that HA underwent structural changes. All UV–vis spectra showed a monotonical decrease of the specific absorbance (SA) with increasing wavelengths and a shoulder around 260–280 nm (conjugation of quinones and ketones [37]) (Figure S1). However, lower specific absorption was displayed by HAred at high wavelengths (>400 nm). This can be associated to the decrease of charge transfer contacts, brought about by the reduction of electron acceptor groups that triggers a decrease of the electron delocalization in aromatic structures [38]. On the other side, aromaticity itself was not affected, as SUVA254 values of HAox (4.77 ± 0.12 L mg−1 cm−1) and HAred (4.66 ± 0.16 L mg−1 cm−1) did not display significant differences (p > 0.40) (Table 2). A bathochromic shift of UV absorption (at 254 nm) towards higher (5 nm) wavelengths was displayed by HAox. This shift is compatible with the oxidation of hydroquinone groups during aerobic incubation. The E4/E6 ratio of HAox (5.83 ± 0.05) was significantly higher than HAred (5.52 ± 0.04, p < 0.05) confirming that some oxidative depolymerization probably occurred during aerobic incubation as also shown by the decrease in C/N ratio (Table 2) [39].
Fluorescence EEM (Figure S2 and Table 2) of HA were little affected by the aerobic/anaerobic incubations and showed two peaks at excitation/emission wavelengths of 250/475 and 330/475 nm.
ATR-FTIR spectra of HAox and HAred (Figure 5) displayed typical peat HA absorption bands and exhibited broad OH stretching absorption in around 3300 cm−1, broadened by intermolecular hydrogen bonding and/or H-bonded OH attributed to phenolic groups and similar weak absorption bands associated with aliphatic C-H. The band due to C=O stretching in carboxyls (1720 cm−1) overlapped with the band at 1650 cm−1 generally attributed to aromatic C=C, C=O, and/or C=O of conjugated ketones or to C=N amide I stretching. Absorption at 1600 cm−1 is related to aromatic skeleton vibrations. Other relevant bands were: a discrete peak at about 1515 cm−1 (uncondensed aromatic compounds bound to N and O atoms); two small peaks at 1450 and 1420 cm−1 (C-H bending of CH2 and CH3 groups); a band at 1215 cm−1 (stretching C-O and bending O-H vibrations) and stretching of carbohydrate or alcoholic C–O at 1030 cm−1.
Changes were highlighted by calculating the relative intensity ratios of selected bands (Figure 5, inset). The 1720/1025 cm−1 intensity ratio, related to variations in sorption by C=O stretching in COOH with respect to C-O stretching of carbohydrates and the 1650/1600 cm−1 intensity ratio, related to the presence of quinones in aromatic structures were lower in HAred, whereas ratios calculated with respect to C=O stretching in COOH increased.
A direct titration of HAs was performed to quantify changes in the number of strong and weak acid groups: HAox and HAred respectively contained 10.9 and 7.9 mmol COOH gHA-C−1, and 3.6 and 5.4 mmol (phenolic OH) gHA-C−1. Therefore, the overall number of carboxyl groups decreased in HA after anaerobic incubation, as shown by ATR-FTIR spectra: a likely result of direct or shuttle mediated biological reduction or decarboxylation, whereas that of phenolic groups increased.
Henderson–Hasselbalch elaboration of titration data (Figure 6) also allows determining average pKa at α = 0.5: HAred displayed an average pKa of 5.70. Carboxyl groups of HAred were therefore weaker than most aliphatic acids, coherently with the fact that reduction of electron active groups weakens the ionization of carboxyl groups by diminishing their electron withdrawing power.
On the contrary, acid groups of HAox were not only more abundant, but also stronger and typical of substituted aromatic acids, which could form from oxidation of side chains of phenols during aerobic incubations.

4. Discussion

Even if the examined peat was subjected to oxidation during excavation and further during drying and storage, a substantial EDC persisted also in HA extracted from the original peat sample (HA0). This shows that exposure to oxygen alone was not sufficient to completely oxidize HA. The residual reduced moieties remained in HA0 may be sterically protected and, therefore, be less reactive and more easily preserved in oxic environments. This protection may be structural or caused by rearrangements that occur during drying [40].
Further oxidation driven by biological activity (under conditions that strongly accelerate biological oxidative processes) did not cause exhaustion of the EDC capacity of HA, but significantly decreased it. Moreover, the lower capability of HAox to transfer electrons is also reflected by their lower pseudo-first-order kinetic constant (kf) compared to HAred. This indicates not only that HAox have been further oxidized in their native state by biological processes during the incubation, but also that they possess a lower density of electron donating groups which are less prone to exchange electrons.
The absence of any clearly defined peak in the CV scans of HAs confirmed that electron exchange involves an extensive range of active redox moieties [41]. These likely consist of closely related functional groups, whose reactivity is influenced by differences in their structural environment, resulting in a wide distribution of overlapping redox potentials [42].
Spectral differences (i.e., lower specific absorption was displayed by HAred at wavelengths >400 nm; Table 2) showed a decrease of charge transfer contacts, brought about by the reduction of electron acceptor groups that triggers a decrease of the electron delocalization in aromatic structures [38]. Fluorescence intensities were very low and not significantly different between the samples (Table 2). These results are coherent with those reported by Maurer et al. [43], where electrochemical reduction of soil HAs did not change the EEM peaks position and intensities, and support the doubts about the usefulness of fluorescence measurements in determining the redox states of natural organic matter [44,45].
These results show that drought periods lasting 90 days or less will therefore not cause the complete oxidation of HA. However, they may bring about large alterations of the overall availability of TEA during the subsequent flooding, allowing anaerobic respiration to proceed for longer periods. We must consider, in fact, that HAs are present in peat in large amounts, increasing with depth from 10% to 30% in ombrotrophic peat bogs [46] and up to 40% in low mires [47]. A 20% decrease in their reduction state is therefore likely to provide, during subsequent submergence periods, enough oxidized redox active moieties to sustain the faster decomposition fueled by anaerobic respiration for much longer periods. These results have important implications. They suggest in fact, that lowering of the water table will increase CO2 emission rates from peatlands and might further compromise their carbon balance. All this is coherent with the enhancement in GHG emissions, only partly offset by inhibition of methanogenesis, that was recently predicted through a machine learning upscaling approach by Huang et al. [23].

5. Conclusions

This experiment demonstrated that dried peat HAs are further oxidized or reduced when exposed to biological activity in their native solid state. Exposure to oxygen alone causes only a limited change in the redox state of HAs. Under the action of facultative anaerobes and aerobes, these substances undergo further chemical–physical and structural changes that are coherent with an enhanced capability to act as TEA. Although this was a laboratory experiment, it provided some mechanistic insights on the reasons of the variability observed in predicting the effects of the lowering of water table on GHG emissions from peatlands. Alteration of the hydrology of peat deposits caused by climate change might, per se, have only minor effects on the redox state of HA, but if coupled to intensified biological activity (caused, for instance, by vegetation changes which modify the availability of decomposable substrates) can result in an increase of oxidized redox active sites in HA. This may favor anaerobic respiration over fermentative processes, lowering CH4 emissions, but enhancing decomposition rates and the consequent larger release of CO2. Results of our laboratory study provide indications on factors that need to be confirmed in field studies. Kinetic factors of electron exchange could also, in fact, potentially impact microbial control on peat redox environment as electron transfer rates are, as shown by our results, significantly modified by exposure to biological activity in either aerobic or anaerobic conditions. Future research to predict GHG emission trends should therefore include monitoring of the redox status of HAs and of modifications in the availability of easily decomposable organic inputs in peatlands as key parameters affecting the variability of response to climate change.

Supplementary Materials

The following are available online at https://www.mdpi.com/article/10.3390/land10111189/s1, Figure S1: UV–vis spectra of HA; Figure S2: EEM fluorescence spectra of HA.

Author Contributions

Conceptualization, M.D.N. and R.T.; Methodology, C.B. and R.T.; Formal analysis, C.B.; Investigation, C.B. and M.C.; Data curation, C.B. and M.C.; Writing—original draft preparation, C.B.; Writing—review and editing, C.B., M.D.N., and M.C.; Supervision, M.D.N. and R.T. All authors have read and agreed to the published version of the manuscript.

Funding

This research received no external funding.

Data Availability Statement

All data used during the study appear in the submitted article.

Conflicts of Interest

The authors declare no conflict of interest.

List of Abbreviations

ABTS2− = 2,2′-Azinobis (3-ethylbenzothiazoline-6-sulfonic acid); ATR-FTIR = attenuated total reflectance Fourier-transform infrared; CV = cyclic voltammograms; EDC = electron donating capacity; EEM = excitation-emission matrix; FI = fluorescence intensity; GC = glassy carbon; GHC = greenhouse gases; HA = humic acids; HA0 = HA extracted from the air-dried peat; HAox = HA extracted from the aerobically incubated peat; HAred = HA extracted from the anaerobically incubated peat; HSD = honestly significant difference; IHSS = International Humic Substances Society; k’f = pseudo-first-order kinetic constant; MEO = mediated electrochemical oxidation; Ntot = total nitrogen; OC = organic carbon; SA = specific absorbance; SHE = standard hydrogen electrode; SUVA254 = specific UV absorbance at 254 nm; TEA = terminal electron acceptors; WE = working electrode; WHC = water holding capacity.

References

  1. Keiluweit, M.; Nico, P.S.; Kleber, M.; Fendorf, S. Are oxygen limitations under recognized regulators of organic carbon turnover in upland soils? Biogeochemistry 2016, 127, 157–171. [Google Scholar] [CrossRef] [Green Version]
  2. Boye, K.; Noël, V.; Tfaily, M.; Bone, S.E.; Williams, K.H.; Bargar, J.R.; Fendorf, S. Thermodynamically controlled preservation of organic carbon in floodplains. Nat. Geosci. 2017, 10, 415–419. [Google Scholar] [CrossRef] [Green Version]
  3. Drake, H.L.; Horn, M.A.; Wüst, P.K. Intermediary ecosystem metabolism as a main driver of methanogenesis in acidic wetlands soil. Environ. Microbiol. Rep. 2009, 1, 307–318. [Google Scholar] [CrossRef] [PubMed]
  4. Bridgham, S.D.; Cadillo-Quiroz, H.; Keller, J.K.; Zhuang, Q. Methane emissions from wetlands: Biogeochemical, microbial, and modeling perspectives from local to global scales. Glob. Chang. Biol. 2013, 19, 1325–1346. [Google Scholar] [CrossRef] [PubMed]
  5. Davidson, E.A.; Janssens, I.A. Temperature sensitivity of soil carbon decomposition and feedbacks to climate change. Nature 2006, 440, 165–173. [Google Scholar] [CrossRef] [PubMed]
  6. Ise, T.; Moorcroft, P.R. The global-scale temperature and moisture dependencies of soil organic carbon decomposition: An analysis using a mechanistic decomposition model. Biogeochemistry 2006, 80, 217–231. [Google Scholar] [CrossRef]
  7. Guo, X.; Meng, M.; Zhang, J.; Chen, H.Y.H. Vegetation change impacts on soil organic carbon chemical composition in subtropical forests. Sci. Rep. 2016, 6, 29607. [Google Scholar] [CrossRef]
  8. Keller, J.K.; Bridgham, S.D. Pathways of anaerobic carbon cycling across an ombrotrophic-minerotrophic peatland gradient. Limnol. Oceanogr. 2007, 52, 96–107. [Google Scholar] [CrossRef] [Green Version]
  9. Ye, R.; Jin, Q.; Bohannan, B.; Keller, J.K.; Bridgham, S.D. Homoacetogenesis: A potentially underappreciated carbon pathway in peatlands. Soil Biol. Biochem. 2014, 68, 385–391. [Google Scholar] [CrossRef]
  10. Mikaloff Fletcher, S.E.; Tans, P.P.; Bruhwiler, L.M.; Miller, J.B.; Heimann, M. CH4 sources estimated from atmospheric observations of CH4 and its 13C/12C isotopic ratios: 1. Inverse modeling of source processes. Glob. Biogeochem. Cycles. 2004, 18, GB4004. [Google Scholar] [CrossRef] [Green Version]
  11. Keller, J.K.; Takagi, K.K. Solid-phase organic matter reduction regulates anaerobic decomposition in bog soil. Ecosphere 2013, 4, 1–10. [Google Scholar] [CrossRef]
  12. Vile, M.A.; Bridgham, S.D.; Wieder, R.K. Response of anaerobic carbon mineralization rates to sulfate amendments in a boreal peatland. Ecol. Appl. 2003, 13, 720–734. [Google Scholar] [CrossRef]
  13. Galand, P.E.; Yrjälä, K.; Conrad, R. Stable carbon isotope fractionation during methanogenesis in three boreal peatland ecosystems. Biogeosciences 2010, 7, 3893–3900. [Google Scholar] [CrossRef] [Green Version]
  14. Lovley, D.R.; Coates, J.D.; Blunt-Harris, E.L.; Phillips, E.J.P.; Woodward, J.C. Humic substances as electron acceptors for microbial respiration. Nature 1996, 382, 445–448. [Google Scholar] [CrossRef]
  15. Cervantes, F.J.; van der Velde, S.; Lettinga, G.; Field, J.A. Competition between methanogenesis and quinone respiration for ecologically important substrates in anaerobic consortia. FEMS Microbiol. Ecol. 2000, 34, 161–171. [Google Scholar] [CrossRef]
  16. Keller, J.K.; Weisenhorn, P.B.; Megonigal, J.P. Humic acids as electron acceptors in wetland decomposition. Soil Biol. Biochem. 2009, 41, 1518–1522. [Google Scholar] [CrossRef]
  17. Klüpfel, L.; Piepenbrock, A.; Kappler, A.; Sander, M. Humic substances as fully regenerable electron acceptors in recurrently anoxic environments. Nat. Geosci. 2014, 7, 195–200. [Google Scholar] [CrossRef]
  18. Ye, R.; Keller, J.K.; Jin, Q.; Bohannan, B.J.M.; Bridgham, S.D. Peatland types influence the inhibitory effects of a humic substance analog on methane production. Geoderma 2016, 265, 131–140. [Google Scholar] [CrossRef] [Green Version]
  19. Valenzuela, E.I.; Avendaño, K.A.; Balagurusamy, N.; Arriaga, S.; Nieto-Delgado, C.; Thalasso, F.; Cervantes, F.J. Electron shuttling mediated by humic substances fuels anaerobic methane oxidation and carbon burial in wetland sediments. Sci. Total Environ. 2019, 650, 2674–2684. [Google Scholar] [CrossRef] [PubMed]
  20. Peiffer, S.; Kappler, A.; Haderlein, S.B.; Schmidt, C.; Byrne, J.M.; Kleindienst, S.; Vogt, C.; Richnow, H.H.; Obst, M.; Angenent, L.T.; et al. A biogeochemical–hydrological framework for the role of redox-active compounds in aquatic systems. Nat. Geosci. 2021, 14, 264–272. [Google Scholar] [CrossRef]
  21. Leng, L.Y.; Ahmed, O.H.; Jalloh, M.B. Brief review on climate change and tropical peatlands. Geosci. Front. 2019, 10, 373–380. [Google Scholar] [CrossRef]
  22. Morris, P.J. Wetter is better for peat carbon. Nat. Clim. Chang. 2021, 11, 561–562. [Google Scholar] [CrossRef]
  23. Huang, Y.; Ciais, P.; Luo, Y.; Zhu, D.; Wang, Y.; Qiu, C.; Goll, D.S.; Guenet, B.; Makowski, D.; De Graaf, I.; et al. Tradeoff of CO2 and CH4 emissions from global peatlands under water-table drawdown. Nat. Clim. Chang. 2021, 11, 618–622. [Google Scholar] [CrossRef]
  24. Hoyos-Santillan, J.; Lomax, B.H.; Large, D.; Turner, B.L.; Boom, A.; Lopez, O.R.; Sjögersten, S. Quality not quantity: Organic matter composition controls of CO2 and CH4 fluxes in neotropical peat profiles. Soil Biol. Biochem. 2016, 103, 86–96. [Google Scholar] [CrossRef]
  25. Ise, T.; Dunn, A.L.; Wofsy, S.C.; Moorcroft, P.R. High sensitivity of peat decomposition to climate change through water-table feedback. Nat. Geosci. 2008, 1, 763–766. [Google Scholar] [CrossRef]
  26. Gao, C.; Sander, M.; Agethen, S.; Knorr, K.H. Electron accepting capacity of dissolved and particulate organic matter control CO2 and CH4 formation in peat soils. Geochim. Cosmochim. Acta 2018, 245, 266–277. [Google Scholar] [CrossRef]
  27. Roden, E.E.; Kappler, A.; Bauer, I.; Jiang, J.; Paul, A.; Stoesser, R.; Konishi, H.; Xu, H. Extracellular electron transfer through microbial reduction of solid-phase humic substances. Nat. Geosci 2010, 3, 417–421. [Google Scholar] [CrossRef]
  28. Coles, J.R.P.; Yavitt, J.B. Linking belowground carbon allocation to anaerobic CH4 and CO2 production in a forested peatland, New York State. Geomicrobiol. J. 2004, 21, 445–455. [Google Scholar] [CrossRef]
  29. Yavitt, J.B.; Williams, C.J. Linking tree species identity to anaerobic microbial activity in a forested wetland soil via leaf litter decomposition and leaf carbon fractions. Plant. Soil 2015, 390, 293–305. [Google Scholar] [CrossRef]
  30. Barak, P.; Chen, Y. Equivalent radii of humic macromolecules from acid-base titration. Soil Sci. 1992, 152, 184–195. [Google Scholar] [CrossRef]
  31. Inbar, Y.; Chen, Y.; Hadar, Y. Solid-state carbon-13 nuclear magnetic resonance and infrared spectroscopy of composted organic matter. Soil Sci. Soc. Am. J. 1989, 53, 1695–1701. [Google Scholar] [CrossRef]
  32. Bravo, C.; De Nobili, M.; Gambi, A.; Martin-Neto, L.; Nascimento, O.R.; Toniolo, R. Kinetics of electron transfer reactions by humic substances: Implications for their biogeochemical roles and determination of their electron donating capacity. Chemosphere 2022, 286, 131755. [Google Scholar] [CrossRef] [PubMed]
  33. Aeschbacher, M.; Sander, M.; Schwarzenbach, R.P. Novel electrochemical approach to assess the redox properties of humic substances. Environ. Sci. Technol. 2010, 44, 87–93. [Google Scholar] [CrossRef] [PubMed]
  34. Miller, J.C.; Miller, J.N. Statistics and Chemometrics for Analytical Chemistry, 6th ed.; Pearson: Harlow, UK, 2010. [Google Scholar]
  35. R Development Core Team. R: A Language and Environment for Statistical Computing; R Foundation for Statistical Computing: Vienna, Austria, 2018. [Google Scholar]
  36. Nicholson, R.S.; Shain, I. Theory of Stationary Electrode Polarography. Single Scan and Cyclic Methods Applied to Reversible, Irreversible, and Kinetic Systems. Anal. Chem. 1964, 36, 706–723. [Google Scholar] [CrossRef]
  37. Chin, Y.P.; Aiken, G.; O’Loughlin, E. Molecular Weight, Polydispersity, and Spectroscopic Properties of Aquatic Humic Substances. Environ. Sci. Technol. 1994, 28, 1853–1858. [Google Scholar] [CrossRef]
  38. Del Vecchio, R.; Blough, N.V. On the origin of the optical properties of humic substances. Environ. Sci. Technol. 2004, 38, 3885–3891. [Google Scholar] [CrossRef] [PubMed]
  39. Chen, Y.; Senesi, N.; Schnitzer, M. Information provided on humic substances by E4/E6 ratios. Soil Sci. Soc. Am. J. 1977, 41, 352–358. [Google Scholar] [CrossRef]
  40. Szajdak, L.; Szatylowicz, J. Impact of drainage on hydrophobicity of fen peat-moorsh soils. Mires Peat. 2010, 6, 158–174. [Google Scholar]
  41. Aeschbacher, M.; Graf, C.; Schwarzenbach, R.P.; Sander, M. Antioxidant properties of Humic Substances. Environ. Sci. Technol. 2012, 46, 4916–4925. [Google Scholar] [CrossRef]
  42. Nurmi, J.T.; Tratnyek, P.G. Electrochemical properties of natural organic matter (NOM), fractions of NOM, and model biogeochemical electron shuttles. Environ. Sci. Technol. 2002, 36, 617–624. [Google Scholar] [CrossRef]
  43. Maurer, F.; Christl, I.; Kretzschmar, R. Reduction and reoxidation of humic acid: Influence on spectroscopic properties and proton binding. Environ. Sci. Technol. 2010, 44, 5787–5792. [Google Scholar] [CrossRef] [PubMed]
  44. Boyle, E.S.; Guerriero, N.; Thiallet, A.; Del Vecchio, R.; Blough, N.V. Optical properties of humic substances and CDOM: Relation to structure. Environ. Sci. Technol. 2009, 43, 2262–2268. [Google Scholar] [CrossRef] [PubMed]
  45. Macalady, D.; Walton-Day, K. New light on a dark subject: On the use of fluorescence data to deduce redox states of natural organic matter (NOM). Aquat. Sci. 2009, 71, 135–143. [Google Scholar] [CrossRef]
  46. Zaccone, C.; Cocozza, C.; D’Orazio, V.; Plaza, C.; Cheburkin, A.; Miano, T.M. Influence of extractant on quality and trace elements content of peat humic acids. Talanta 2007, 73, 820–830. [Google Scholar] [CrossRef] [PubMed]
  47. Zykova, M.V.; Schepetkin, I.A.; Belousov, M.V.; Krivoshchekov, S.V.; Logvinova, L.A.; Bratishko, K.A.; Yusubov, M.S.; Romanenko, S.V.; Quinn, M.T. Physicochemical Characterization and Antioxidant Activity of Humic Acids Isolated from Peat of Various Origins. Molecules 2018, 23, 753. [Google Scholar] [CrossRef] [Green Version]
Figure 1. Schematic representation of the experimental layout.
Land 10 01189 g001
Figure 2. Cyclic voltammograms (CVs) of solutions (0.25, 0.50, and 1.50 g L−1) of HAox (a) and HAred (b). Black traces represent the CV of the background electrolyte. Diagrams below report linear correlations between anodic currents at 0.719 V (c) and 0.850 V (d) versus HAox (blue symbols) and HAred (red symbols) concentrations.
Land 10 01189 g002
Figure 3. Cyclic voltammograms (CVs) of solutions containing only 3 µM 2,2′-azino-bis(3-ethylbenzothiazoline-sulfonate) (ABTS2−, green trace) and ABTS2− plus varying amounts of HAox (0.1 and 0.9 g L−1, blue traces) and HAred (0.1 and 0.8 g L−1, red traces). Inset: anodic peak currents (Ip,a) versus HA concentrations. The dashed lines indicate the limit currents (Ilim)and the corresponding limiting concentrations.
Land 10 01189 g003
Figure 4. Oxidative charge responses to spikes of increasing HAox (a) and HAred (b) masses, added in the electrochemical cell containing ABTS2/ABTS in equilibrium to the working electrode (Eh = 0.606 V, pH 7). Insets: Linear correlation between the moles of electrons (ne−) transferred to the WE versus the mass of HAox (a) and HAred (b) after 60 min from addition. The slopes of the linear regression models correspond to the EDC values.
Land 10 01189 g004
Figure 5. ATR-FTIR spectra of HAox (blue), HAred (red) HA0 (grey). Inset: relative intensity ratios (R) of selected bands. Different letters refer to significant differences (HSD test, p < 0.05).
Land 10 01189 g005
Figure 6. Henderson–Hasselbalch plots of HA extracted from aerobically (HAox, blue circles) and anaerobically (HAred, red circles) incubated peat.
Land 10 01189 g006
Table 1. Organic carbon (OC), total nitrogen (Ntot), and carbon stable isotope composition (δ13C) of the original peat sample and of HA extracted before (HA0) and after aerobic (HAox) and anaerobic (HAred) incubations. Different letters (a,b,c) refer to significant differences (HSD test, p < 0.05). All data are expressed on a dry weight basis.
OC (%)Ntot (%)C/Nδ13C (‰) 1
Original Peat45.9 ± 1.0 a1.10 ± 0.06 a41.7 a−27.04 ± 0.05 a
HA048.8 ± 0.2 b1.96 ± 0.20 b24.9 b−26.98 ± 0.04 a
HAox48.8 ± 0.5 b2.22 ± 0.12 b22.0 c−27.08 ± 0.02 a
HAred48.9 ± 0.2 b1.93 ± 0.14 b25.3 b−26.97 ± 0.04 a
1 vs. V-PDB.
Table 2. Spectroscopic parameters of humic acids extracted after aerobic (HAox) and anaerobic (HAred) incubations. Different letters (a, b) refer to significant differences (HSD test, p < 0.05). All data are expressed on a dry weight basis.
1 SUVA2541 E4/E61 SA4002 Peak A2 Peak B
(l mg−1 cm−1) (l mg−1 cm−1)Ex/EmF.I.Ex/EmF.I.
HAred4.66 ± 0.16 a5.52 ± 0.04 a0.98 a255/4700.71 a340/4700.58 a
HAox4.77 ± 0.12 a5.83 ± 0.05 b1.14 b260/4700.65 a340/4700.53 a
1 from UV–vis. 2 from EEM fluorescence.
Publisher’s Note: MDPI stays neutral with regard to jurisdictional claims in published maps and institutional affiliations.

