Abstract
Urban vitality is the primary driver of urban development. However, assessing urban vitality has always been a challenge. This paper builds on the research framework of sustainable development evaluation and selects evaluation indicators from the three systems of urban operation: economy, society, and environment. The deviation maximization (DM) method is used to evaluate urban vitality. Shanghai is then used as a case study for evaluation, and the comprehensive index of urban vitality is calculated for the city from 2010 to 2019. The evaluation results indicate that the urban vitality of Shanghai experienced a significant upward trend over ten years (2010–2019), which shows that the urban competitiveness of Shanghai is constantly strengthening. Next, the study focuses on the administrative region of Shanghai, to calculate the regional vitality level of Shanghai from 2010 to 2019 and to explore its spatial distribution characteristics. Then, a spatial autocorrelation analysis is used to explore the mechanism that affects the spatial distribution of urban vitality. The results demonstrate that the urban vitality in Shanghai shows a significant positive correlation in space. Moreover, there is a “High–High” gathering area, which includes Huangpu, Xuhui, Hongkou, and Changning in central area of Shanghai. This research provides a theoretical reference to support effective decision-making with respect to high-quality urban development.
1. Introduction
More than half of the world’s population lives in cities, and city spaces are key carriers of human activities, in which people work, consume, relax, and study. There are no precise statistics listing the total number of cities on the earth; however, Internet data indicate that more than 300 cities have populations of more than one million each [1]. Only a few of these cities, however, have complete infrastructure, social security, and a livable ecological environment. Many of these cities face existential threats, such as urban sprawl, residential vacancies, population loss, and ecosystem degradation [2,3,4,5]. Cities that are full of vitality make people living in them feel safe and comfortable, have a rich street life, and have a reasonable urban order and form, which can satisfy the needs associated with different human activities. Therefore, assessing and improving the vitality of cities are hot topics in urban research.
A city is a large and complex dynamic system with comprehensive characteristics. A city’s emergence and development are influenced by different factors, such as the natural environment, economy, and society. Urban vitality somewhat reflects the capacity and potential of urban progress. It shows the degree of a city’s support for vital functions and the ecological and socioeconomic environment, and it reflects the activity, openness, and the rationality of city elements and resources. Urban vitality is comprehensively expressed in the efficiency of urban operation and development.
The concept of urban vitality was first introduced by Jacobs, who posited that the complexity of human activities and human life creates the diversity of urban life, and the expression of urban life is urban vitality [6,7]. Early studies mainly focused on the theory of urban vitality, such as developing the conceptual framework [8,9], determining whether urban form impacts the formation of urban vitality [10,11], assessing the impact of public policies on urban vitality [12,13], and improving the accessibility of specific facilities to enhance urban vitality [14]. The theory of urban vitality has also been gradually introduced into the fields of sociology, criminology, and public health [15,16,17]. With the continuous spread of cities, urban planning researchers have paid significant attention to urban vitality, including urban institutions and neighborhood vitality [18], parking restriction policies and economic vitality [11], and public green space and urban vitality [14].
However, measuring urban vitality has always been an important challenge. Many scholars propose that urban vitality is inextricably linked to sustainable development [19,20,21] and apply the research framework of sustainability evaluation to decompose urban vitality into three systems: economy, society, and environment [22]. With the widespread application of open-source big data in urban and geographic related research, data that can represent population mobility and interaction, including point of interest (POI), mobile phones, bus cards, and taxis route data, are beginning to be applied and rapidly developed to study urban vitality [23,24,25,26,27,28]. Using this open-source big data, most studies describe urban vitality from the perspective of economic level, activity intensity, and cultural contacts [29,30,31]. Measuring the level of economy vitality by identifying the number of commercial facilities in POI data has become a common research approach [29,32,33]. In addition, night-time light data are also used to evaluate a region’s economy vitality [34]. Measuring societal vitality is mainly realized by focusing on the flow and aggregation of the population within the city and describing human activities. Due to the higher sample counts and better accessibility of social media punch data and mobile signal data, these technology data provide a new approach to measure societal vitality, and they can accurately reflect the changes of vitality caused by people’s various activities [35,36,37,38]. Therefore, big data have recently been frequently used to measure societal vitality. In contrast, cultural vitality emphasizes the spirituality of cities, with scholars proposing that the number, scale, type, and funders of cultural venues are closely related to cultural vitality [39,40,41,42,43].
Other researchers, especially those in the field of urban planning, are not confined to the research framework of sustainable evaluation. Instead, they select evaluation indicators from another perspective, focusing more attention on the vitality of communities, streets, and other public spaces in the city at a micro level. With respect to the impact of urban form on urban vitality, scholars have proposed that architectural heritage, building density, and the accessibility of transportation facilities are closely related to the construction and distribution of urban vitality [44,45,46,47]. For urban functions, the number of commercial and service facilities, public green spaces, and cultural industries are indicators that should be considered in measuring urban vitality [48]. In the dimension of urban life, indicators such as housing prices [44] and the convenience of living facilities [45] are also studied.
In summary, since the concept of urban vitality was put forward, it has received extensive attention from researchers. The development of spatial big data, human activity tracking data, and data mining technology creates more possibilities for assessing urban vitality. However, the existing research frameworks mostly focus on urban vitality at one point in time (i.e., the moment when the data were obtained or the period before that), and ignore how the urban vitality changes in space and time. To address such gaps, this paper uses historical statistical data to evaluate the urban vitality of Shanghai over a decade, based on a comprehensive urban vitality assessment framework. The study then conducts an exploratory spatial analysis for these assessment results, to provide a comprehensive and systematic understanding of the connotations of urban vitality. This paper is innovative in the following two ways:
- It is a new framework of urban vitality analysis deconstructed from the above-mentioned connotations, to explore the changes in the vitality of a city from the past to the present, with explicit expression. This framework constructs the connotations of urban vitality into the economy, society, and environment aspects. It is more complete than the previous studies on urban vitality.
- The proposed framework makes full use of a variety of statistical data, including data on economic growth, finance, population, and air quality, and it provides a multi-dimensional indicator analysis method for urban vitality.
2. Research Methods and Index System
2.1. Research Area
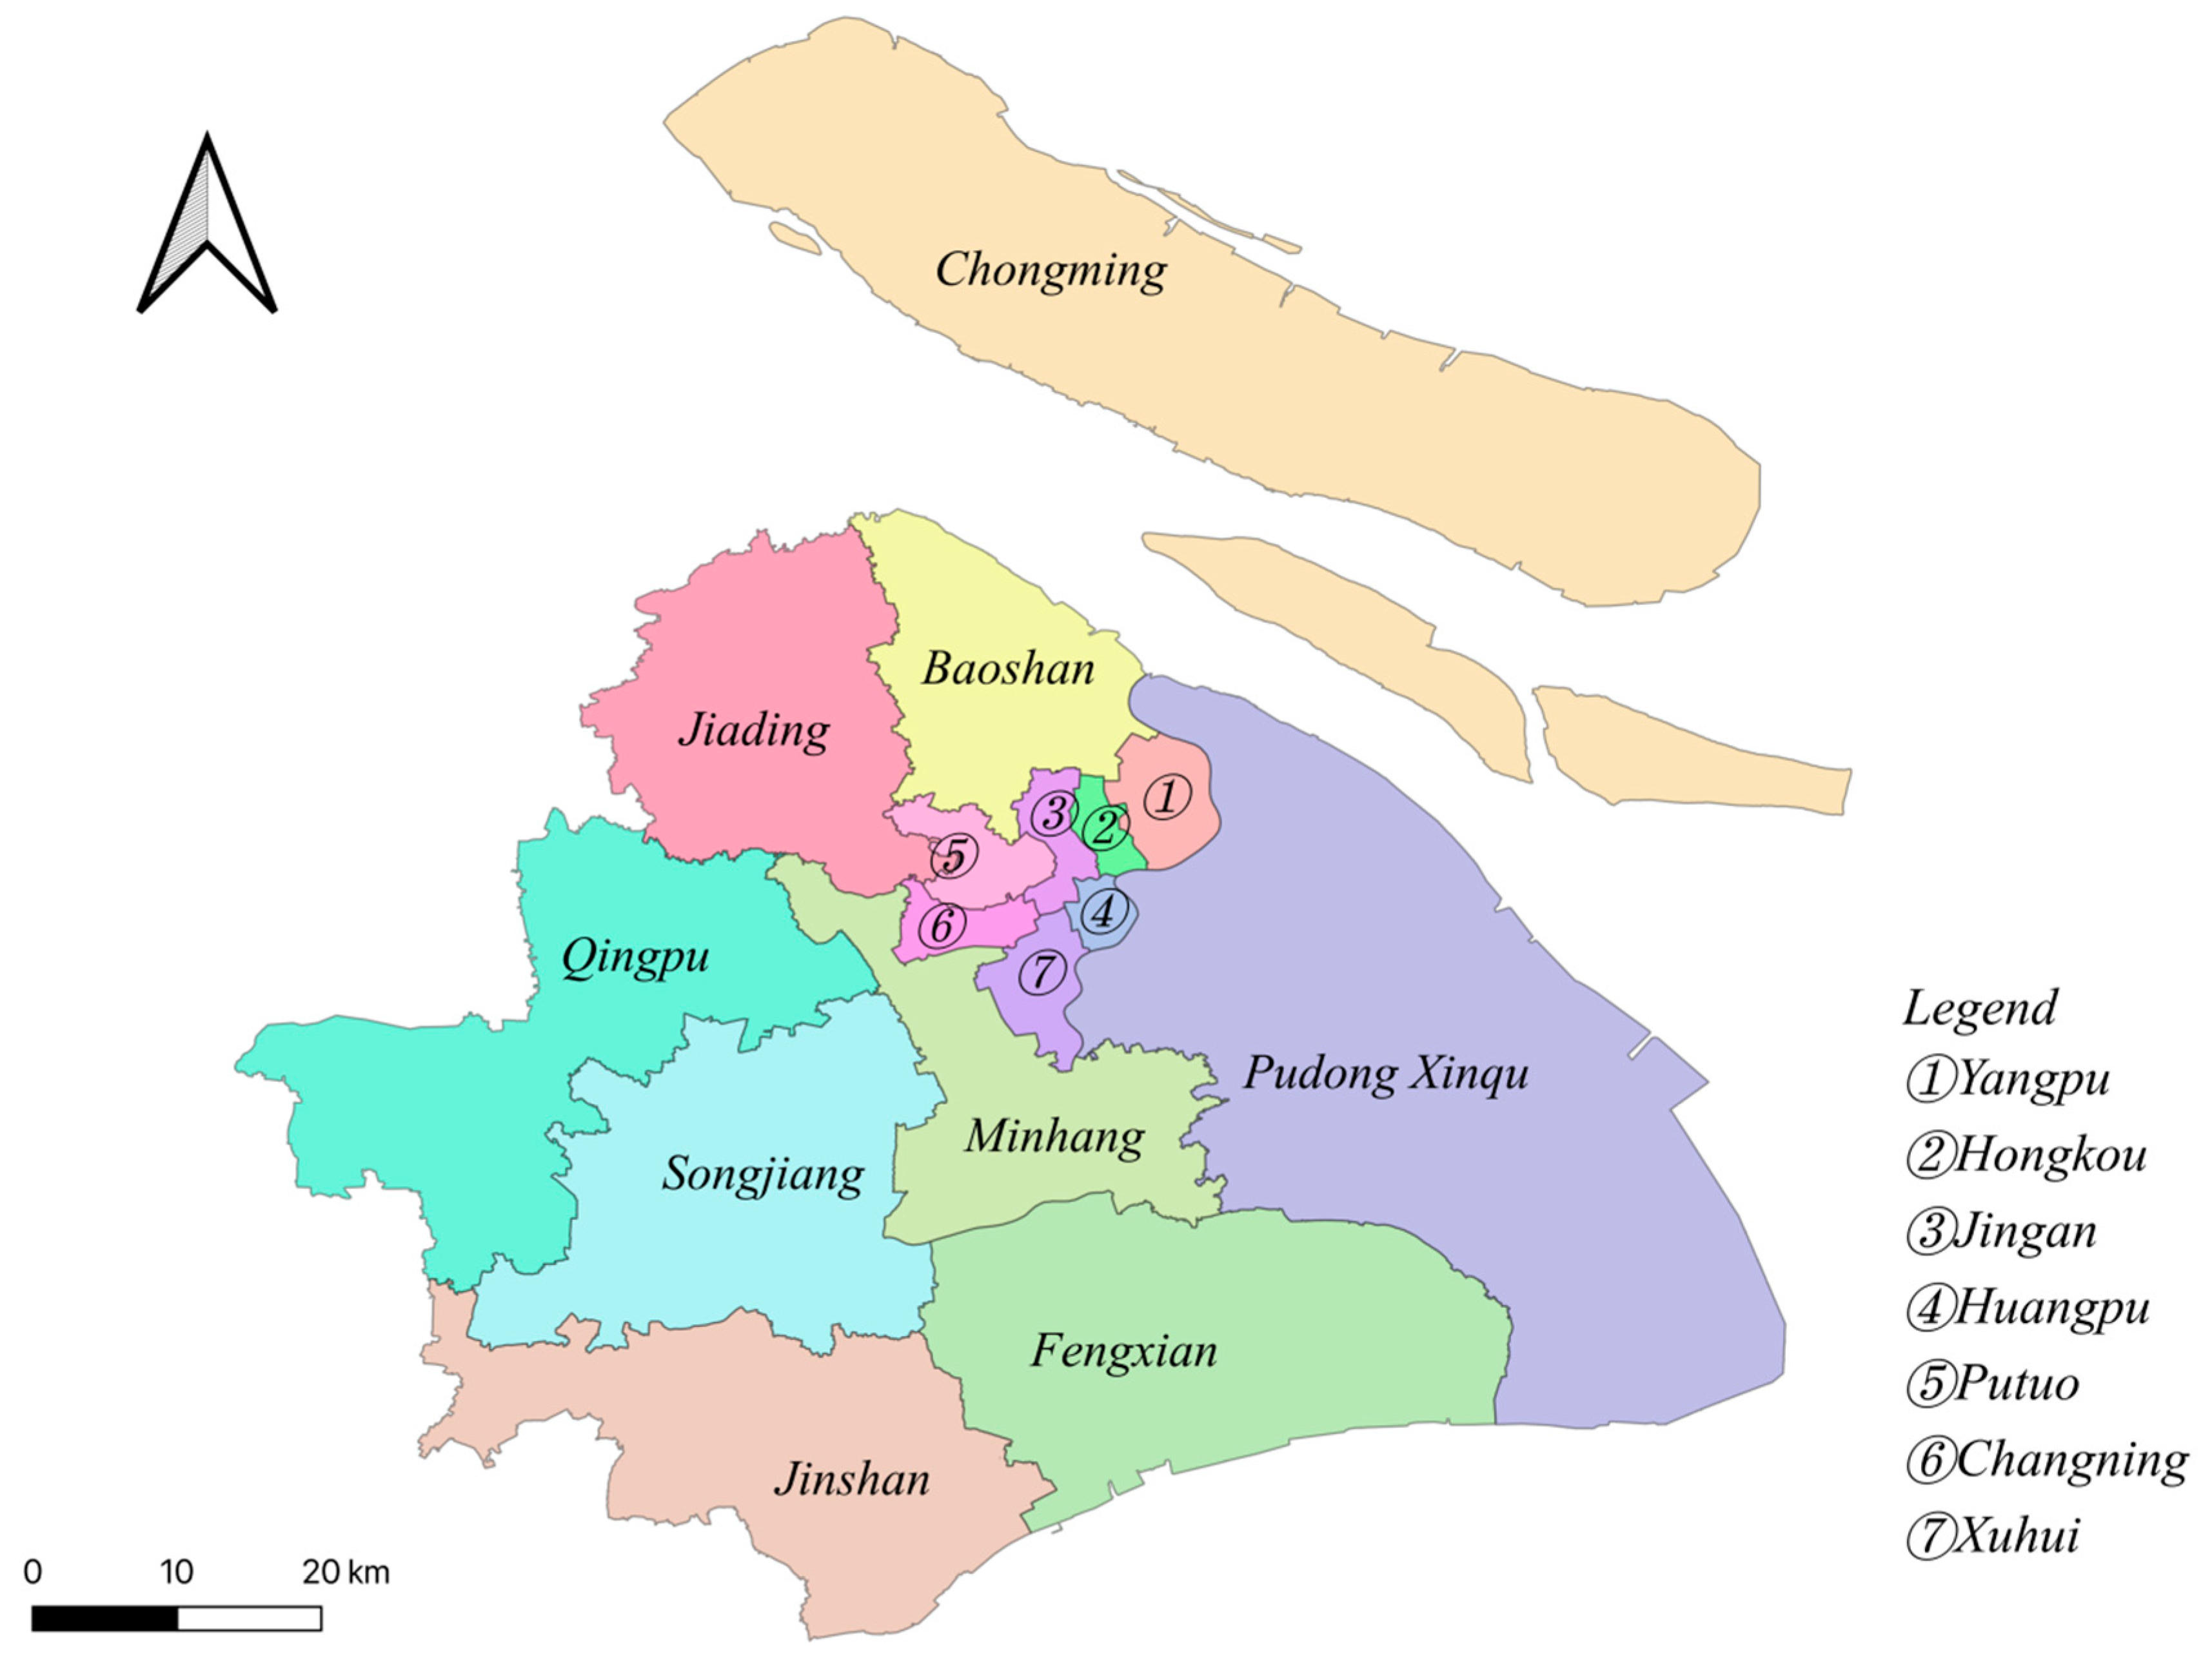
The city of Shanghai covers an area of 6340.5 km2 and includes 16 administrative regions (Figure 1). The area had approximately 24.87 million inhabitants in 2019. Shanghai is the largest and most prosperous city in China, and is considered a global financial, trade, economic, and shipping hub, with excellent potential for urban development. Due to its significant economic progress, Shanghai’s urbanized population ratio grew to 88.1% in 2019, ranking first among Chinese cities. For this reason, Shanghai has likewise become an attractive city in China, with an increasing number of highly educated and skilled people. This has made it one of the most densely populated areas in the world. The research data used in this paper are from the Shanghai Statistical Yearbook (2010–2019) and statistical data from each region. Some missing data were obtained by estimating approximate values.

Figure 1.
Locations of the 16 regions in Shanghai, China.
2.2. Urban Vitality Evaluation Process
The essence of a comprehensive evaluation is a decision-making process. This involves a cognitive process of judging and comparing the value or merits of specific things, behaviors, perceptions, attitudes, and other evaluation objects using established criteria. The ultimate goal is to provide decision makers with comprehensive evaluation values and rank them to support decision makers [49,50]. The basic procedures of comprehensive evaluation are as follows: determining the purpose of evaluation, identifying relevant indicators, obtaining indicator weights, selecting or constructing evaluation models, and calculating and ranking evaluation values. Figure 2 illustrates this process.
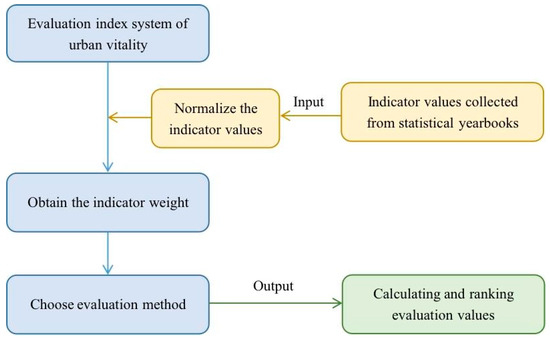
Figure 2.
Urban vitality evaluation process.
2.3. Urban Vitality Evaluation Index System
The goal of creating a highly vibrant city is to make the city more livable, as evidenced by a steady increase in economic progress, sufficient public space for people to engage in social activities, and a diverse ecological environment and green space for people to relax. This goal is similar to the goal of sustainable urban development. The difference is that the goal of sustainable development focuses on the balanced development of economy, society, and environment systems within the city, whereas the goal of a vibrant city focuses on the impact of human activities. Therefore, this paper applies an index framework from sustainable development evaluation and constructs an index system to evaluate different dimensions within three systems of the city: economy, society, and environment (as summarized in Table 1). Economy vitality is the direct embodiment of urban vitality. The level of a city’s vitality is directly reflected in whether the city’s economy has vitality. Therefore, economy vitality is the most important dimension to measure urban vitality. C1, C2, C3, and C4 directly reflect the economic level of the city and are important embodiments of economy vitality; C5 was selected to reflect people’s consumption level and purchasing power of social commodities, indicating that people have the economic ability to go out for various social activities; C6 refers to the ability to expand reproduction and adjust economic structure; C7 and C8, respectively, reveal the development of industrial structure and service industry. Societal vitality is the indirect embodiment of urban vitality. Urban vitality is produced by human complex activities; the main body of these activities is people, and the place of activities is public space. For this reason, societal vitality was selected as an important part of measuring urban vitality. C9 represents the trend and speed of natural population growth and reflects the potential of urban vitality; C10 and C11 represent urban population concentration, which can reflect the aggregation degree of urban vitality; C12 represents the state of unemployment and social stability; and C13 represents the development of education and science and technology, both of which can reflect the attraction of cities to the population. C14 represents the number of cultural venues, such as libraries, museums, cinemas, and cultural squares, which reflect the carrying capacity of the city for human activities. Environment vitality is the basis of urban vitality. As long as people live in the urban environment, environmental factors such as the quality of urban air and whether there is enough public green space will affect people’s willingness to go out for activities, thus affecting urban vitality. C15 and C16 represent the situation of green areas within city, and sufficient green space can make people feel comfortable. C17 represents funds used for environmental protection, which can reflect the changing trend of the urban environment in the future, and C18 represents the air quality status of the city.

Table 1.
Evaluation index system of urban vitality in Shanghai.
2.4. Urban Vitality Evaluation Methods
This paper applies an objective weighting method to evaluate the urban vitality in Shanghai, called the deviation maximization (DM) method. This method was proposed by Guo in 2007 [57] and has been applied to evaluate urbanization level [58] and sustainable development [51]. DM is a comprehensive evaluation method that is applied to “three-dimensional” (i.e., evaluation object, evaluation index, and time) panel data. It is not influenced by subjective data, and is based entirely on observational data mining. The essence of the method is to assign appropriate weights to the relevant indicators, to maximize the differences between the evaluation values of the evaluation objects.
Combined with the weighted sum model (WSM), the deviation maximization (DM) method is described as:
where denotes the comprehensive index of the evaluation object; denotes the normalized value of the jth index of the ith evaluation object at moment ; and denotes the weight of the jth index.
The purpose of determining the indicator weight is to maximize the difference among the comprehensive indices of evaluation objects. The difference is represented by the variance of performance values:
Based on this, a programming model is developed to determine the indicator weight, by maximizing the variance of the comprehensive index. The optimization model is expressed as:
Solving the Models (3)–(4) yields the individual indicator weights, and the comprehensive index is obtained by substituting the weights into Equation (1).
The following steps are followed for the case evaluation in this research.
- (1)
- Normalizing the initial data
According to the nature of evaluation indicators, indicators are generally distinguished into positive and negative indicators. Positive indicators indicate that larger indicator values are better, and negative indicators indicate that smaller indicator values are more favorable. For the positive indicators, the initial indicator values are normalized using Equation (5). For the negative indicator, Equation (6) is used.
where denotes the initial value of the jth index of the ith evaluation object at moment ; and , .
- (2)
- Calculating indicator weights
The Equation (1) is written as follows:
where ,,.
Placing the Equation (7) into Equation (2) yields the following formula:
where H is a real symmetric matrix.
Then, a programming model is defined to obtain the indicator weights:
When solving the Models (9)–(10), if all the elements in matrix H are greater than 0, there is a sole positive maximum eigenvalue and an associated positive eigenvector. If the weight vector w is the eigenvector of the largest eigenvalue of the matrix H, the objective Function (9) is assigned the maximum value, as shown in Table 2.
Table 2.
The weight of evaluation indicators system.
- (3)
- Calculating the evaluation value
The comprehensive index of urban vitality of Shanghai is calculated by substituting the weight vector w into Equation (7). Table 3 shows the results.
Table 3.
Urban vitality comprehensive index for Shanghai from 2010 to 2019.
2.5. Spatial Autocorrelation Analysis
2.5.1. Global Spatial Autocorrelation Analysis
Global spatial autocorrelation is used to describe the overall distribution of a phenomenon and to determine whether the phenomenon has aggregation characteristics in space. However, the method does not indicate in which exact areas the aggregation is located. Moran’s I index is a widely used index for spatial autocorrelation determination and takes the following specific form:
where and denote the value at the ith and jth spatial units; and is an element of the spatial weight matrix W, which represents the topological relationship between spatial units. The term is the sum of all elements of the spatial weight matrix W and reflects the similarity of the attribute values of spatially adjacent or spatially neighboring regional units.
The Moran’s I index is usually interpreted as a correlation coefficient, with values in the range of (0,1). A Moran’s I index greater than 0 indicates there is a significant positive correlation, indicating that the neighboring spatial units have similar data attributes, and there is an aggregation phenomenon in areas with high or low attribute values. A Moran’s I index less than 0 indicates there is a significant negative correlation, indicating that the spatial units adjacent to each other have different attributes, and the spatial distribution of data show a high and low interval distribution. A Moran’s I index of 0 indicates there is no spatial correlation, and the spatial distribution of the data is in an irregular random distribution.
2.5.2. Local Spatial Autocorrelation
Local spatial autocorrelation is used to identify different spatial correlation patterns that may exist for different spatial units. This facilitates observations of local unsteadiness at different spatial locations, and the discovery of spatial heterogeneity between data to provide a basis for classification or zoning. Local Moran’s I (LISA) statistic is generally used to measure the autocorrelation of local space. The formula is:
The significance of can be determined using the Bonferroni standard. A positive value indicates a spatial agglomeration of similar values (High–High or Low–Low) around the regional unit, and a negative value indicates a spatial agglomeration of non-similar values (High–Low or Low–High) around the regional unit.
3. Discussion
3.1. Evaluation Results
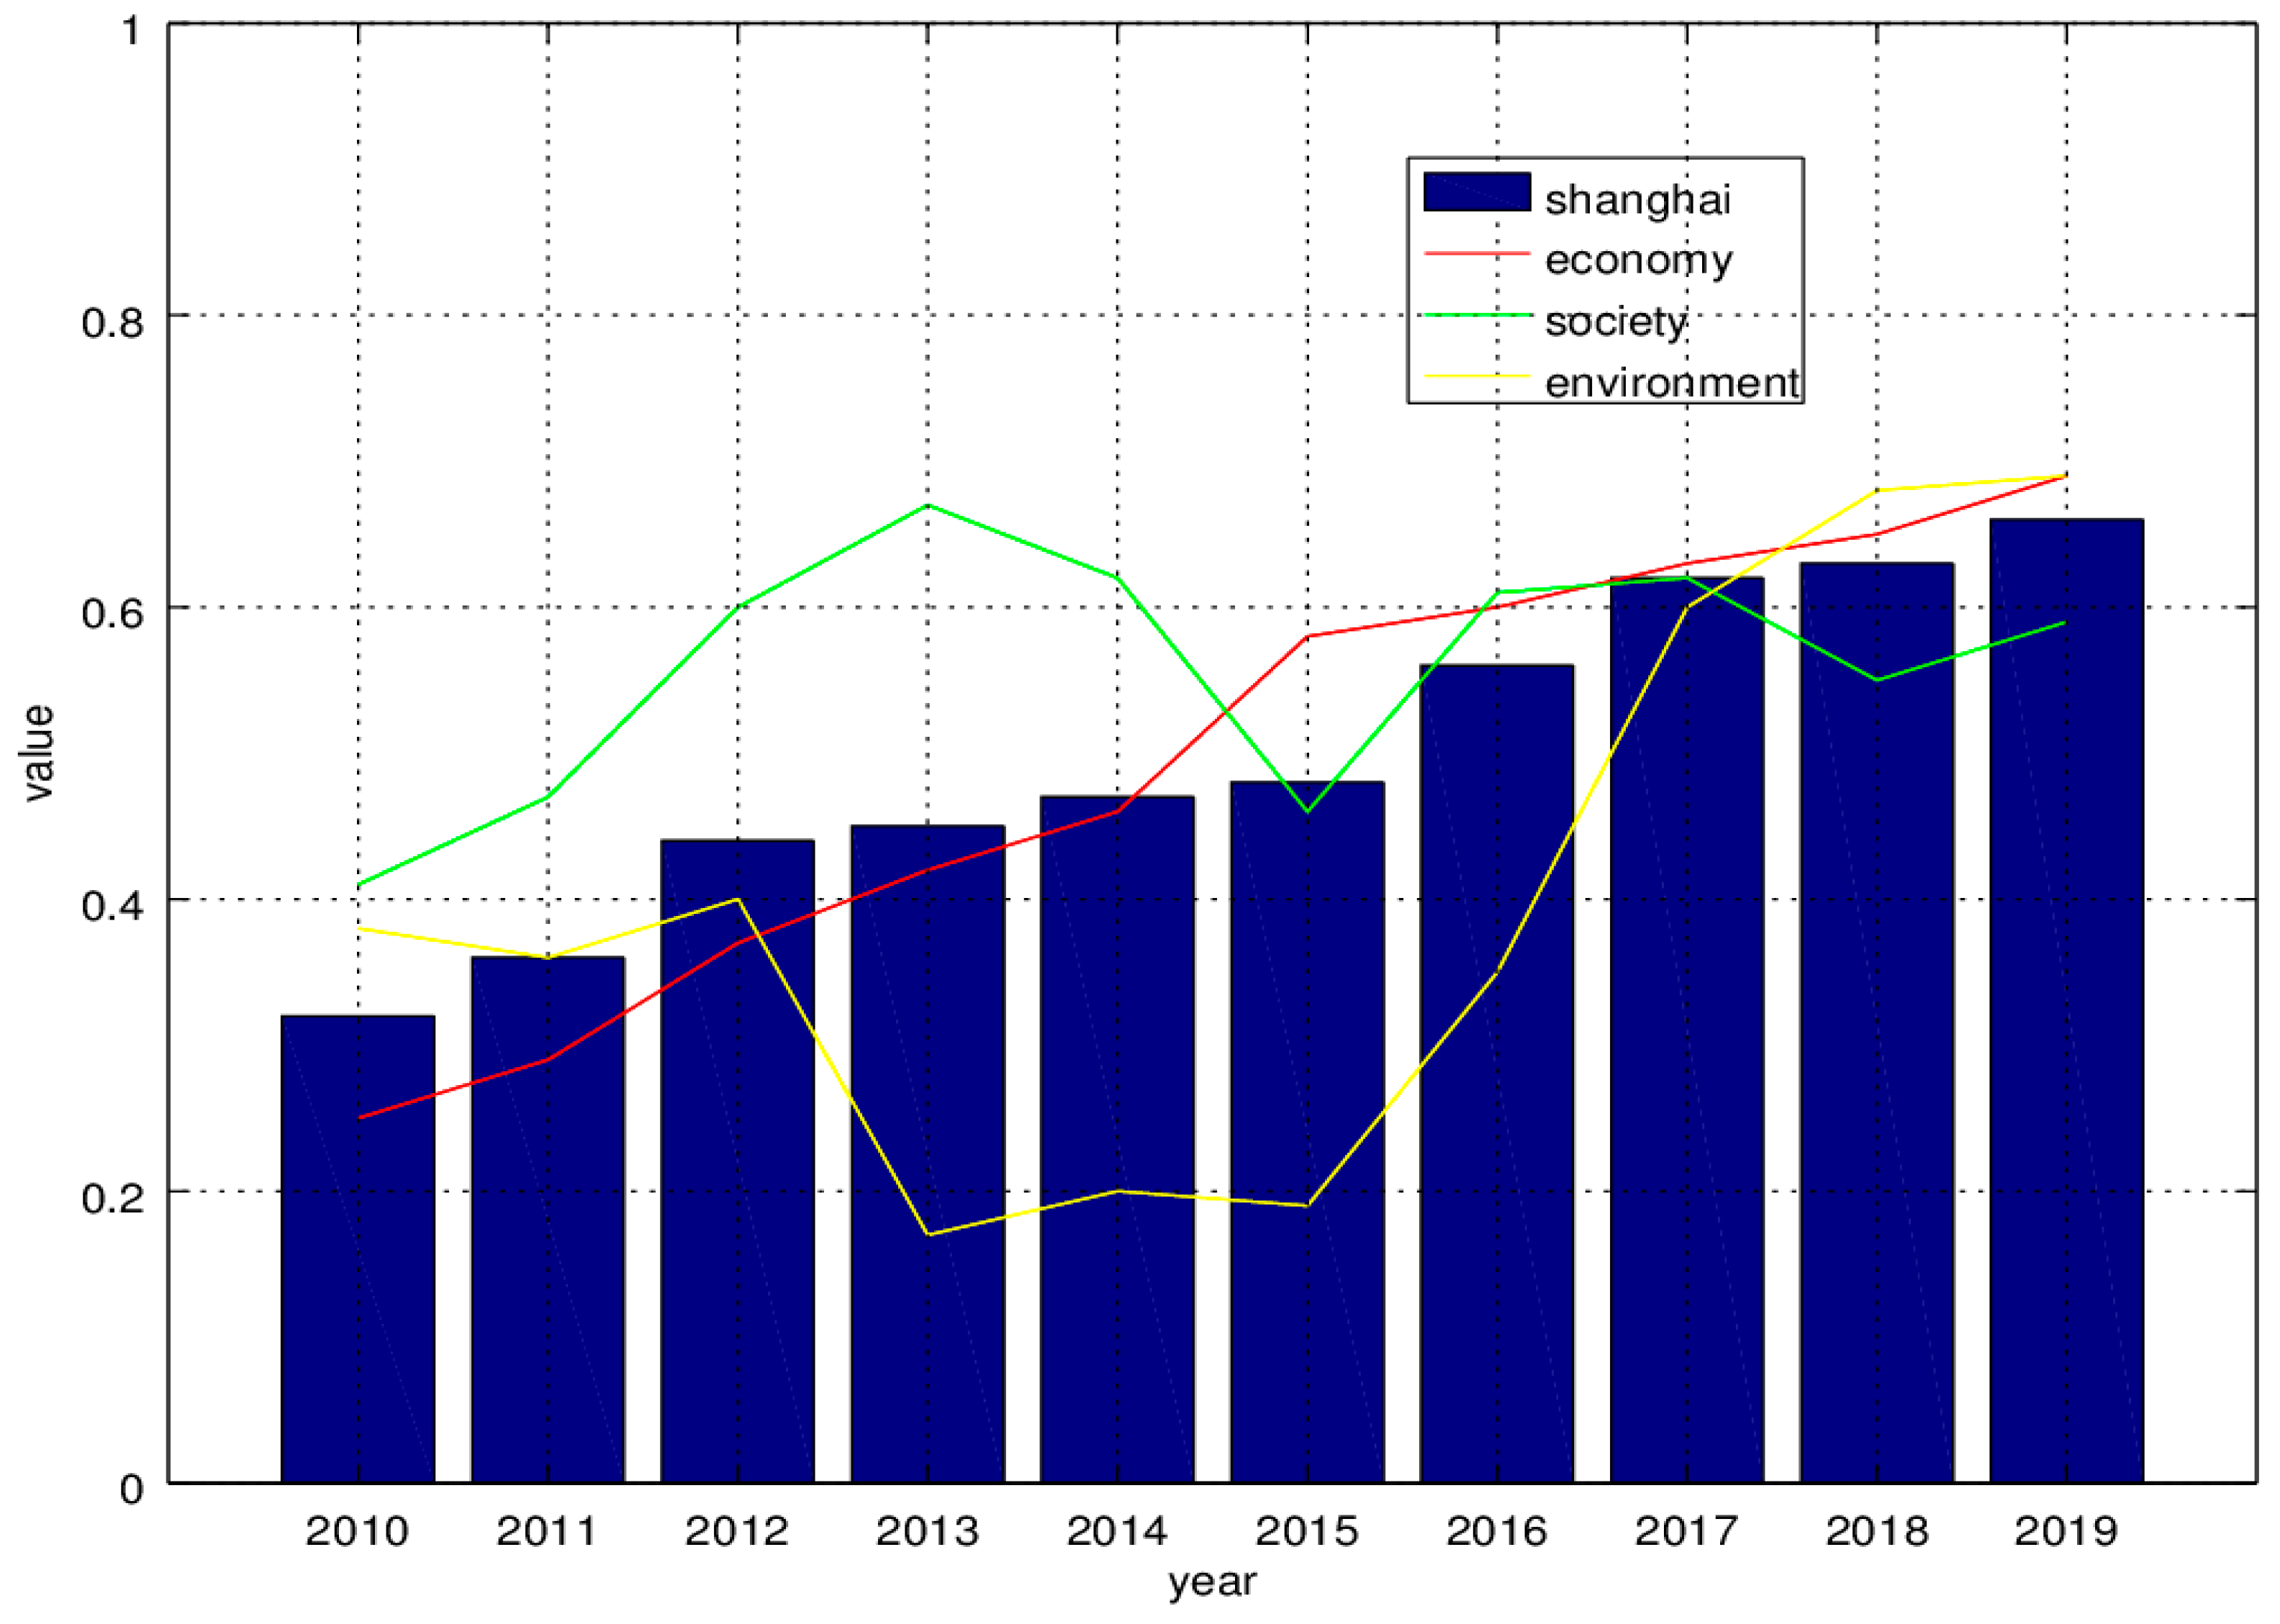
Table 3 and Figure 3 show that the trend of Shanghai’s urban vitality gradually increased over the study decade, from 0.32 in 2010 to 0.66 in 2019; this represents an increase of 106.3%. From 2012 to 2015, the growth rate of Shanghai’s urban vitality comprehensive index was only 2%; however, after 2015, it grew at a rapid rate of 6.5% per year. This change may have occurred from a significant reform in urban development strategies, which happened when city managers realized that urban development should focus on people’s needs and not just economic growth. This initiated the Shanghai City Master Plan, released in 2017; the plan includes urban infrastructure construction, population policy, technological innovation, urban renewal, urban safety, and improvements to the ecological environment [59]. The Shanghai City Master Plan reflects on the “big city malaise” by redefining the development goals and paths under the people-centered ideology. By protecting the ecological environment, controlling resources, securing housing, and providing more jobs, everyone living and working in Shanghai will be able to enjoy the beauty of urban life. This document puts more effort into community vitality and urban vibrancy, proposed ways for Shanghai to become an outstanding global city.
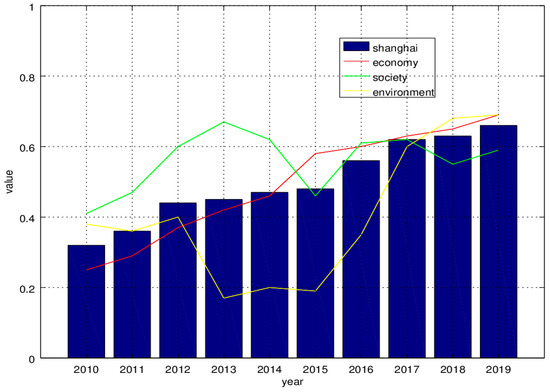
Figure 3.
Urban vitality comprehensive index of Shanghai from 2010 to 2019.
In terms of the three dimensions of the evaluation:
- (1)
- Shanghai’s economy vitality showed a high rate of development during the study period, indicating that Shanghai remains a promising city in China. As the largest city in China and a famous international metropolis, Shanghai’s economic progress also indirectly reflects China’s economic progress over the study decade. Table 3 indicates that although the level of economy vitality in Shanghai generally follows an upward trend, the growth rate slowed after 2015. The comprehensive urban vitality index of Shanghai changed in a corresponding way. This is because the Shanghai government adjusted its urban development strategy, and maintaining high economic growth was no longer the only goal pursued by managers.
- (2)
- The trend associated with societal vitality has fluctuated over the decade. The evaluation indicators associated with society, or societal vitality, mainly include population; financial investments in science, technology, education, and employment; and important places for cultural activities. Shanghai is a highly attractive city in China; however, due to real estate prices and the high cost of living, an increasing number of young people have chosen to leave Shanghai in recent years, resulting in a part of the city’s labor force being lost to neighboring cities. To address this, the government implemented improvement measures to increase the attractiveness of the city to the labor force, such as increasing financial investments in employment and building more cultural activities. This led to fluctuations in the society dimension of vitality. However, relative to the societal vitality value in 2010, the value reached 0.59 in 2019, and the overall trend is increasing.
- (3)
- Concern for the environment is an important part of sustainable development strategies; however, in developing countries, economic development is often more important than protecting the ecological environment. China’s past activities were consistent with this trend, yet, Table 3 and Figure 3 show a significant decrease and then increase, with 2015 being an important turning point. Environment vitality declined until 2015 and then significantly increased, continuing to grow to 0.69 in 2019. As discussed in the previous section, this change was likely due to the change in Shanghai’s development strategy. The results also show that managers paid more attention to ecological changes and less to economic development after 2015; however, this change did not reduce economic vitality but rather just slowed the growth. This indicates that implementing environmentally friendly policies, reducing energy consumption, and improving the ecological environment will not reverse the economic level of a city or country but may increase resident satisfaction, indirectly positively impacting economic development.
3.2. Spatial Distribution Characteristics
To verify the spatial distribution of urban vitality, we calculated the regional vitality of 16 districts in Shanghai from 2010 to 2019, as shown in Table 4. The average value indicates the average vitality value over the decade. The growth value indicates an increase in the vitality value from 2010 to 2019. The overall level of regional vitality significantly changed in all regions; however, Table 4 shows that there were differences in the rate of growth.
Table 4.
Regional vitality of 16 regions in Shanghai.
The three regions with the highest average vitality levels are Huangpu, Jing’an, and Pudong Xinqu. For a long time, Huangpu and Jing’an were the most prosperous and most urbanized areas in Shanghai. However, after nearly 30 years of development and construction, Pudong Xinqu has significant advantages with respect to infrastructure, investment, international trade, and livability. The regions with the lowest average vitality values are Chongming, Fengxian, Qingpu, and Jinshan. All of these are suburban areas of Shanghai, far from the city center and lacking geographical advantages. Jacobs has noted that the diversity of urban life is an important factor in creating urban vitality [6]. These areas do not have this advantage.
With respect to the growth in each region, the largest increase in value occurred in Jinshan. Its average vitality level was low, at 0.48 over most of the study decade; however, it reached 0.62 in 2019; this is an encouraging increase compared to the 0.34 value in 2010. This change may be attributed to a series of policies announced by the Jinshan government related to optimizing its industrial structure; these policies focus on promoting industrial structure optimization, remediating polluting enterprises, managing rivers, and protecting the environment [60]. The regions with the smallest value were Baoshan and Songjiang. These are suburban areas of Shanghai, and while geographically superior to Jinshan, they did not have favorable conditions to promote economic development.
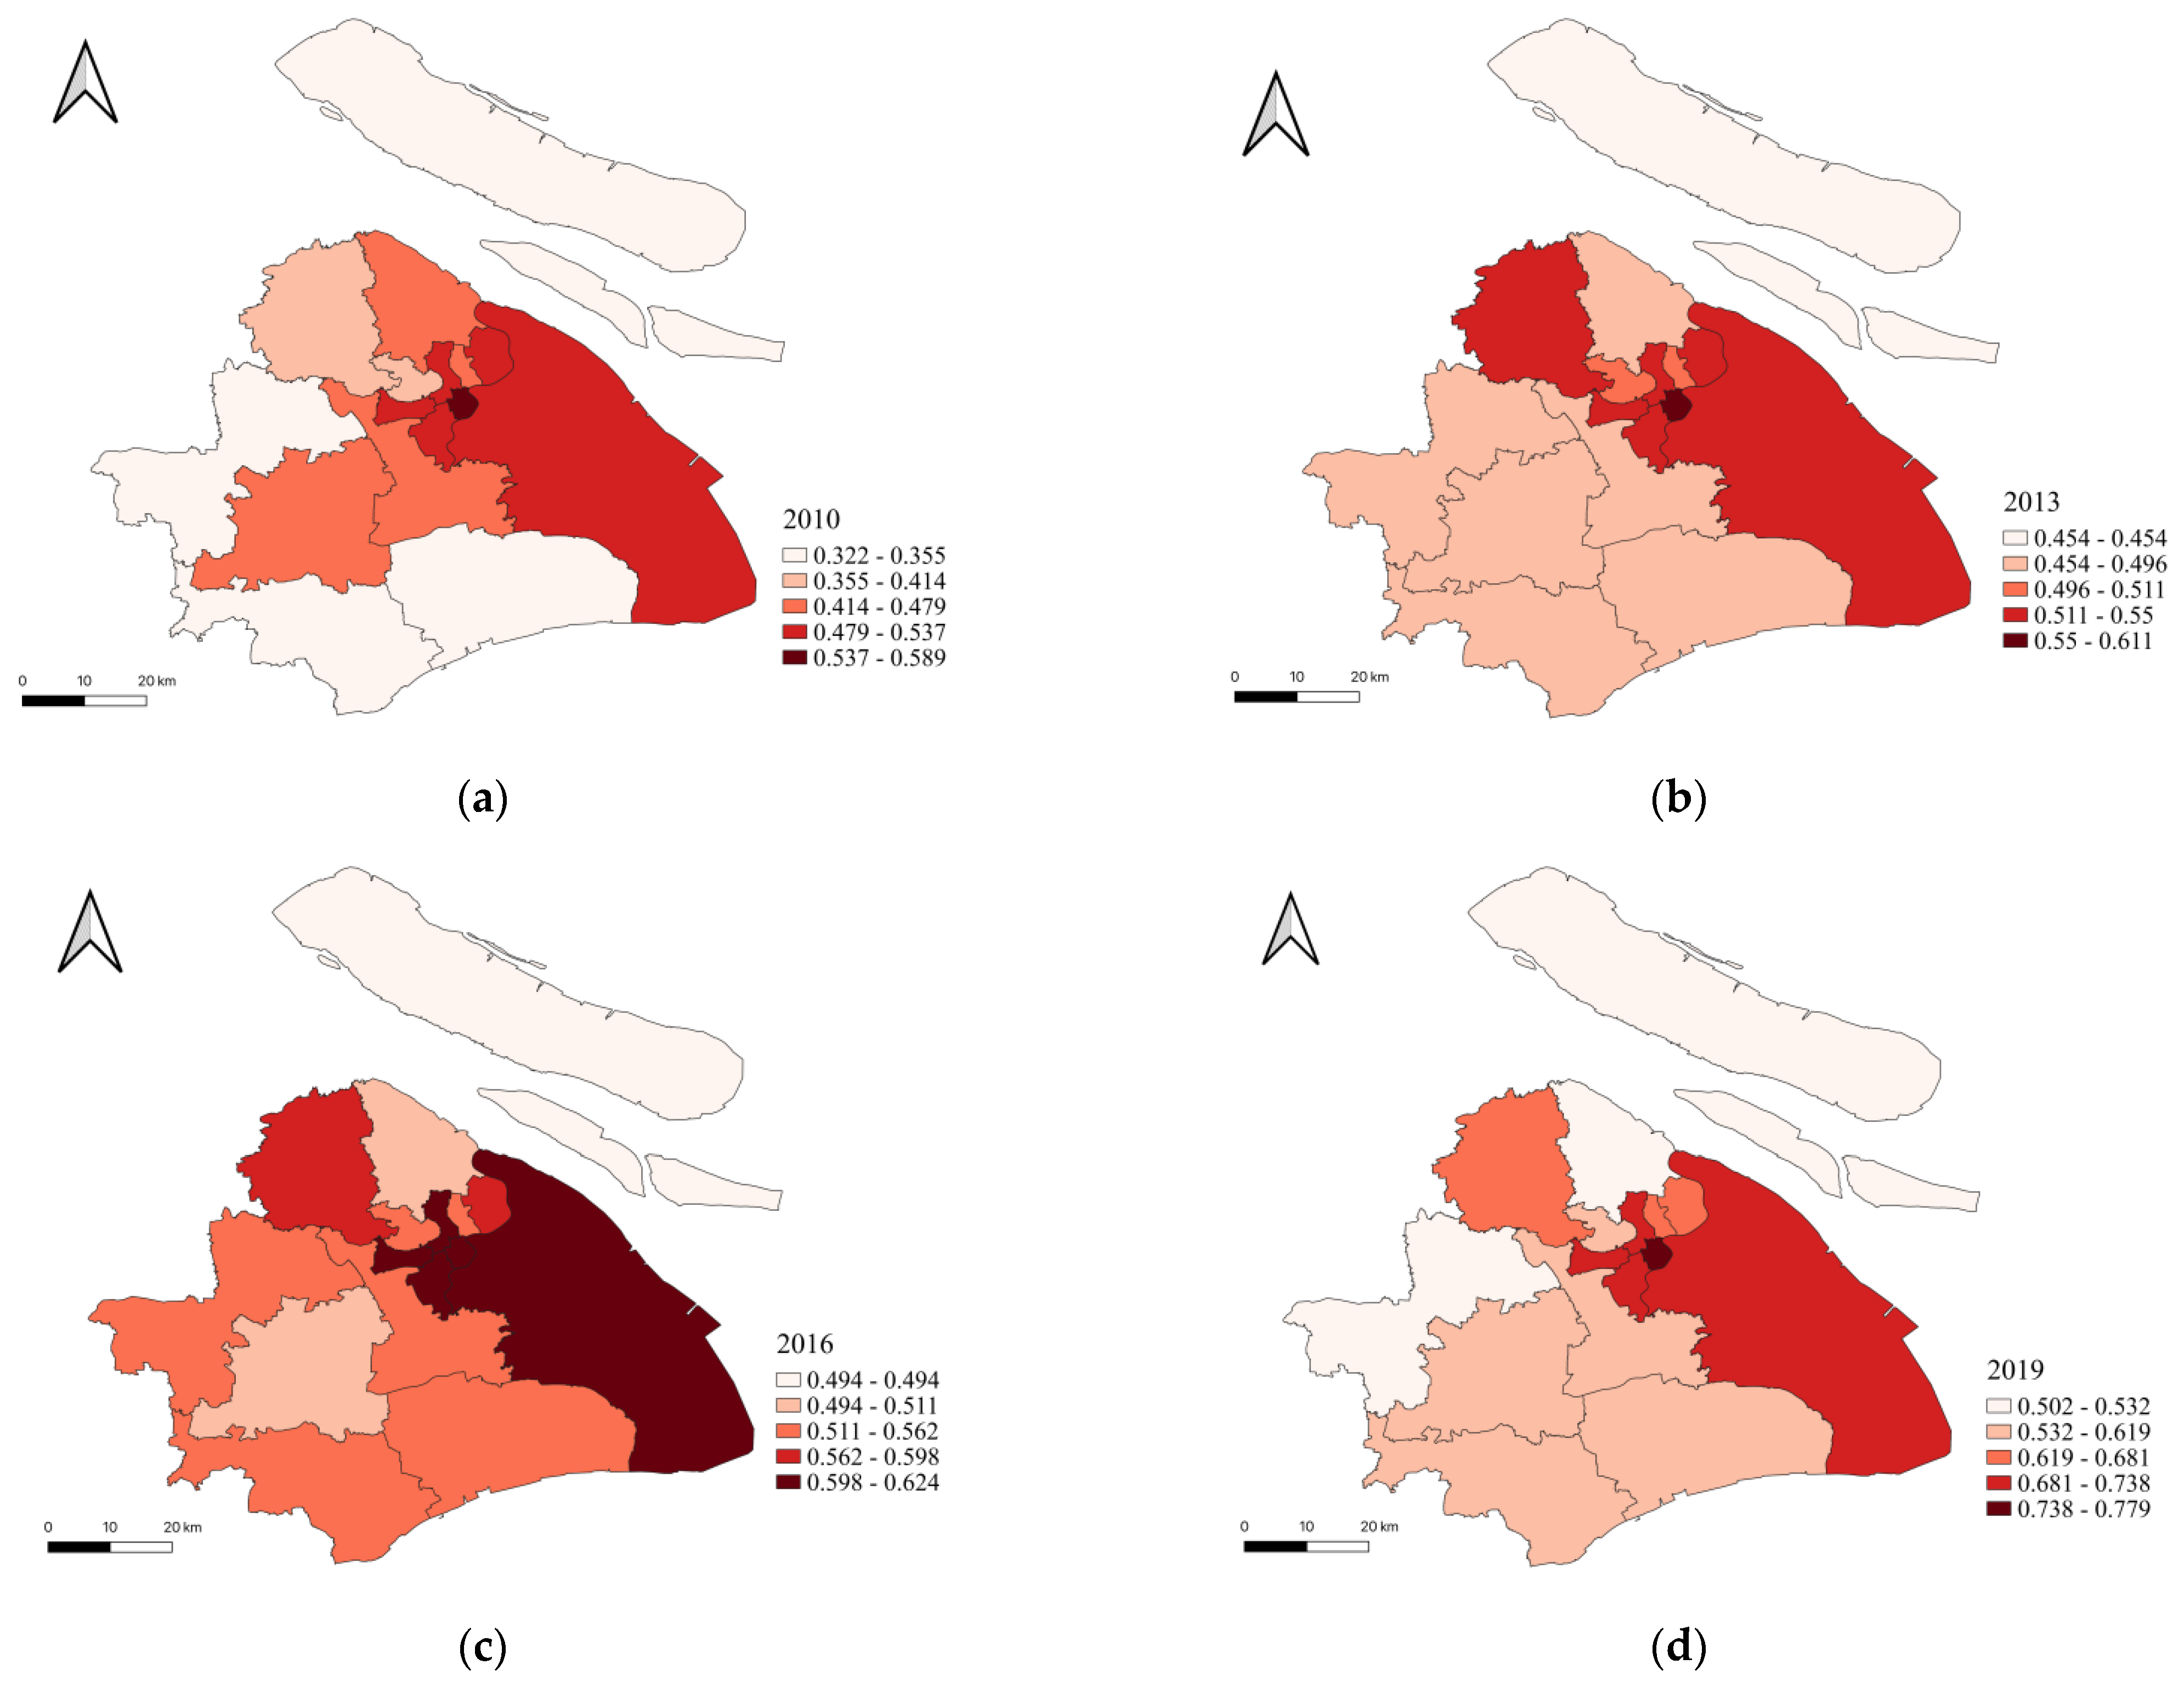
To reflect the spatial distribution characteristics of urban vitality of Shanghai more intuitively, this paper selects the calculated results of four years, 2010, 2013, 2016, and 2019, to serve as cross-sectional data. Figure 4 displays these results as pictures using QGIS software (https://www.qgis.org/en/site/, accessed on 1 Jun 2021, version 3.20); QGIS is open-source GIS software, which has been widely used in academic research [61]. In QGIS, cross-sectional data are divided into five intervals by applying the principle of the natural breakpoint method. The five intervals are defined as: the highest value, higher value, medium value, lower value, and the lowest value.

Figure 4.
Spatial distribution of urban vitality of Shanghai. (a) Spatial distribution of urban vitality in 2010. (b) Spatial distribution of urban vitality in 2013. (c) Spatial distribution of urban vitality in 2016. (d) Spatial distribution of urban vitality in 2019.
Figure 4 shows that the regional vitality of Shanghai follows a monocentric vital pattern, with urban vitality declining from the central urban core to the city periphery. This result is consistent with the findings of other scholars [28]. The regions included in the highest value intervals include Huangpu, Jing’an, Changning, Xuhui, and Pudong Xinqu. The final four in this list were only in the highest value intervals in 2016. The lowest value intervals are seen for Chongming, Qingpu (2010, 2019), Jinshan (2013), Fengxian (2013), and Baoshan (2019).
3.3. Spatial Analysis of Urban Vitality in Shanghai
3.3.1. Global Spatial Autocorrelation Analysis
Based on the evaluation results of urban vitality of 16 regions in Shanghai, GeoDa (http://geodacenter.github.io, accessed on 15 May 2021, version 1.18) software was used to analyze the spatial correlation [62,63]. This part of the study used the cross-sectional data for the four years of 2010, 2013, 2016, and 2019. Table 5 presents the Moran’s I index and p-values for these years. The Moran’s I index was positive in all years, and the p-values of the Moran’s I index test were less than 0.05. These results demonstrated there is a positive spatial correlation in space (between regions), and the vitality level of each region is significantly influenced by the neighboring regions. Further, another trend emerged: the Moran’s I indices for 2013, 2016, and 2019 increase year by year, signaling a strengthening in the agglomeration of regional vitality levels in Shanghai.
Table 5.
Results of the global spatial autocorrelation analysis in Shanghai.
3.3.2. Local Space Autocorrelation Analysis
The Moran’s I index measures the overall spatial correlation of urban vitality but does not reveal its spatial heterogeneity patterns. As such, local space autocorrelation analysis is used to explore the local distribution characteristics of urban vitality. This paper presents the results in the form of a table, shown in Table 6.
Table 6.
Moran scatterplot urban distribution in Shanghai.
In terms of distribution characteristics, the “High–High” agglomerations are mainly distributed in the central areas of Shanghai and include Huangpu, Xuhui, Hongkou (2010, 2019), and Changning (2016). These areas are characterized as having high levels of urban vitality and are surrounded by areas with high levels of urban vitality. Geographically, the districts located in the “High–High” agglomeration are adjacent to each other, forming a linked area that supports each other and reflecting significant spatial diffusion effects [64]. “High–Low” agglomerations include Songjiang (2010) and Jiading (2019). These are areas with a high level of urban vitality but are surrounded by regions with relatively low urban vitality levels. A “Low–High” agglomeration includes Hongkou (2013), which is located in central Shanghai. This area has the favorable geographical advantage of “being diffused” and belongs to the transitional area. A “Low–Low” agglomeration includes Songjiang (2013); in 2013, Songjiang and its surrounding areas were among the areas with low urban vitality levels and experienced low-speed growth.
4. Conclusions
This study explores the changes in Shanghai’s urban vitality and its spatial characteristics from 2010 to 2019. To do this, we evaluated the urban vitality of Shanghai and 16 administrative regions, and identified the spatial and temporal evolution of urban vitality from 2010 to 2019. In the decade, Shanghai’s comprehensive index of urban vitality showed an increasing trend, illustrating improvements in the urban vitality and the strengthening of Shanghai’s competitiveness. The urban vitality of Shanghai shows a monocentric spatial pattern, gradually decreasing from the central urban core to the periphery of the city. The centers with high vitality are mainly concentrated in Huangpu, Jing’an, Xuhui, Changning, and Pudong Xinqu. The spatial correlation analysis results reveal that the urban vitality of Shanghai showed a significant positive spatial correlation in space. The regional vitality was influenced by the neighboring regions.
In the future development process, the Shanghai government should take effective measures to enhance the vitality level of the suburbs, such as focusing on developing suburban commerce and trade, increasing investment in social security, education, and technology to attract the population, and building more urban green spaces and public spaces to meet the needs of people’s activities.
In contrast to other studies that have evaluated urban vitality, this paper proposes a new evaluation index system that reveals temporal and spatial changes in urban vitality based on historical statistics and conducts a spatial correlation analysis of urban vitality. The research framework of this paper provides a new perspective for the study of urban vitality, which can make us better understand the connotations and evolution of urban vitality. The effectiveness of the new evaluation method is also verified. This evaluation system and research method provide a reference to support the development of other cities, and the results can provide a basis for government decision-making when developing relevant policies.
Like all studies, this one has certain limitations. For example, the method proposed here focuses on the past and present status of urban vitality and does not predict the future development trends. Expanding the method to facilitate the modeling of future trends is a promising area for future studies.
Author Contributions
Conceptualization, J.S.; Writing—Original Draft Preparation, Data Curation, W.M.; Writing—Review and Editing, H.S.; Software, T.L. All authors have read and agreed to the published version of the manuscript.
Funding
This research was funded by the National Social Science Foundation of a China(19BGL274). And the APC was funded by Wei Miao.
Institutional Review Board Statement
Not applicable.
Informed Consent Statement
Not applicable.
Data Availability Statement
Not applicable.
Acknowledgments
All authors have confirmed.
Conflicts of Interest
The authors declare no conflict of interest.
References
- Ranking of Cities with More Than One Million People in the World. Available online: http://www.360doc.com/content/16/1215/01/8527076_614787911.shtml (accessed on 9 October 2021).
- Batty, M. Empty buildings, shrinking cities and ghost towns. Environ. Plan. B Plan. Des. 2016, 43, 3–6. [Google Scholar]
- Deng, C.; Ma, J. Viewing urban decay from the sky: A multi-scale analysis of residential vacancy in a shrinking U.S. city. Landsc. Urban Plan. 2015, 141, 88–99. [Google Scholar] [CrossRef]
- Hamidi, S.; Ewing, R. A longitudinal study of changes in urban sprawl between 2000 and 2010 in the United States. Landsc. Urban Plan. 2014, 128, 72–82. [Google Scholar] [CrossRef]
- Fang, W.; Quan, T.; Lei, W. Post-Katrina population loss and uneven recovery in New Orleans, 2000–2010. Geogr. Rev. 2014, 104, 310–327. [Google Scholar]
- Jacobs, J. The Death and Life of American Cities; Vintage: New York, NY, USA, 1992. [Google Scholar]
- Jacobs, J. The Life of Cities; Random House: New York, NY, USA, 1969. [Google Scholar]
- Maas, P.R. Towards a Theory of Urban Vitality; University of British Columbia: Vancouver, BC, USA, 1984. [Google Scholar]
- Montgomery, J. Urban vitality and the culture of cities. Plan. Pract. Res. 1995, 10, 101–110. [Google Scholar] [CrossRef]
- Yokohari, M.; Takeuchi, K.; Watanabe, T.; Yokota, S. Beyond greenbelts and zoning: A new planning concept for the environment of Asian mega-cities. Landsc. Urban Plan. 2000, 47, 159–171. [Google Scholar] [CrossRef]
- Still, B.; Simmonds, D. Parking restraint policy and urban vitality. Transp. Rev. 2000, 20, 291–316. [Google Scholar] [CrossRef]
- Bromley, R.D.F.; Thomas, C.J. Food shopping and town centre vitality: Exploring the link. Int. Rev. Retail. Distrib. Consum. Res. 2002, 12, 109–130. [Google Scholar] [CrossRef]
- Smith, T.; Nelischer, M.; Perkins, N. Quality of an urban community: A framework for understanding the relationship between quality and physical form. Landsc. Urban Plan. 1997, 39, 229–241. [Google Scholar]
- Lopes, M.N.; Camanho, A.S. Public green space use and consequences on urban vitality: An assessment of European cities. Soc. Indic. Res. 2013, 113, 751–767. [Google Scholar] [CrossRef]
- Marquet, O.; Miralles-Guasch, C. Neighbourhood vitality and physical activity among the elderly: The role of walkable environments on active ageing in Barcelona, Spain. Soc. Sci. Med. 2015, 135, 24–30. [Google Scholar] [CrossRef] [PubMed]
- Faria, J.R.; Ogura, L.M.; Sachsida, A. Crime in a planned city: The case of Brasília. Cities 2013, 32, 80–87. [Google Scholar] [CrossRef]
- Putnam, S.; Quinn, A. Jane Jacobs and urban health. J. Urban Health 2007, 84, 1–2. [Google Scholar] [CrossRef] [Green Version]
- Montgomery, J. Making a City: Urbanity. Vitality and Urban Design. J. Urban Des. 1998, 3, 93–116. [Google Scholar] [CrossRef]
- Li, S.; Wu, C.; Lin, Y.; Li, Z.; Du, Q. Urban Morphology Promotes Urban Vibrancy from the Spatiotemporal and Synergetic Perspectives: A Case Study Using Multisource Data in Shenzhen, China. Sustainability 2020, 12, 4829. [Google Scholar]
- Liu, S.; Zhang, L.; Long, Y.; Long, Y.; Xu, M. A New Urban Vitality Analysis and Evaluation Framework Based on Human Activity Modeling Using Multi-Source Big Data. ISPRS Int. J. Geo-Inf. 2020, 9, 617. [Google Scholar]
- Shi, J.; Miao, W.; Si, H. Visualization and Analysis of Mapping Knowledge Domain of Urban Vitality Research. Sustainability 2019, 11, 988. [Google Scholar]
- Wang, S.L.; Li, D.; Ye, X.M.; Chen, Q.; Jiang, X. Fuzzy comprehensive evaluation on the urban vitality: A case of the main cities in Hubei Province. J. Huazhong Norm. Univ. 2013, 6, 441–445. [Google Scholar]
- Ye, Y.; Zhuang, Y.; Zhang, L.Z. Designing Urban Spatial Vitality from Morphological Perspective—A Study Based on Quantified Urban Morphology and Activities’ Testing. Urban Plan. Int. 2016, 1, 26–33. [Google Scholar]
- Xu, Y.F.; Zheng, S.Q.; Wang, J.H. Urban vitality: The demand and supply of local consumption amenities. New Archit. 2016, 1, 27–31. [Google Scholar]
- Wu, J.; Ta, N.; Song, Y.; Lin, J.; Chai, Y. Urban form breeds neighborhood vibrancy: A case study using a GPS-based activity survey in suburban Beijing. Cities 2017, 74, 100–108. [Google Scholar]
- De Nadai, M.; Staiano, J.; Larcher, R.; Sebe, N.; Quercia, D.; Lepri, B. The death and life of great Italian cities: A mobile phone data perspective//International World Wide Web Conferences Steering Committee. In Proceedings of the 25th International Conference on World Wide Web, Montreal, QC, Canada, 11–15 April 2016; ACM Press: Montreal, QC, Canada, 2016; pp. 413–423. [Google Scholar]
- Yue, Y.; Zhuang, Y.; Yeh, A.G.-O.; Xie, J.-Y.; Ma, C.-L.; Li, Q.-Q. Measurements of POI-based mixed use and their relationships with neighborhood vibrancy. Int. J. Geogr. Inf. Sci. 2016, 31, 658–675. [Google Scholar]
- Yue, W.; Chen, Y.; Zhang, Q.; Liu, Y. Spatial explicit assessment of urban vitality using multi-source data: A case of Shanghai, China. Sustainability 2019, 11, 638. [Google Scholar] [CrossRef] [Green Version]
- Long, Y.; Huang, C. Does block size matter? The impact of urban design on economic vitality for Chinese cities. Environ. Plan. B Urban Anal. City Sci. 2019, 46, 406–422. [Google Scholar] [CrossRef] [Green Version]
- Florida, R. The Rise of the Creative Class, 2nd ed.; Basic Books: New York, NY, USA, 2012. [Google Scholar]
- Markusen, A. Fuzzy concepts, proxy data: Why indicators would not track creative placemaking success. Int. J. Urban Sci. 2013, 17, 291–303. [Google Scholar]
- Gang, L.; Lan, Y.; Jianxiong, H.; Chen, X.; Xue, S. The Spatial Pattern and Organization Relation of the Pickup Points Based on POI Data in Xi’an: Focus on Cainiao Stations. Sci. Geo-Graph. Sin. 2018, 38, 2024–2030. [Google Scholar]
- Weihua, L.; Xin, N. Spatial Association Analysis for Urban Service Based on Big Data. Sci. Geo-Graph. Sin. 2017, 37, 1310–1317. [Google Scholar]
- Zikirya, B.; He, X.; Li, M.; Zhou, C. Urban Food Takeaway Vitality: A New Technique to Assess Urban Vitality. Int. J. Environ. Res. Public Health 2021, 18, 3578. [Google Scholar] [CrossRef]
- Zarin, S.; Niroomand, M.; Heidari, A. Physical and social aspects of vitality case study: Traditional street and modern street in Tehran. Procedia Soc. Behav. Sci. 2015, 170, 659–668. [Google Scholar] [CrossRef] [Green Version]
- Yong, W.; Qingqing, Z.; Guangbin, L. Public Space Construction of Urban Resettlement Community Based on Analysis of Vitality Characteristics: Taking the 6 Resettlement Communities of Suzhou as Examples. Sci. Geo-Graph. Sin. 2018, 38, 747–754. [Google Scholar]
- Lu, S.; Huang, Y.; Shi, C.; Yang, X. Exploring the associations between urban form and neighborhood vibrancy: A case study of Chengdu, China. ISPRS Int. J. Geo-Inf. 2019, 8, 165. [Google Scholar] [CrossRef] [Green Version]
- Tingting, Z.; Wei, T.; Yang, Y.; Chen, Z.; Tianhong, Z.; Qiuping, L.; Qingquan, L. Sensing urban vibrancy using geo-tagged data. Acta Geod. Cartogr. Sin. 2020, 49, 365–374. [Google Scholar]
- Jackson, M.R.; Kabwasa-Green, F.; Herranz, J. Cultural Vitality in Communities: Interpretation and Indicators; The Urban Institute: Washington, DC, USA, 2006. [Google Scholar]
- Montalto, V.; Moura, C.J.T.; Langedijk, S.; Saisana, M. Culture counts: An empirical approach to measure the cultural and creative vitality of European cities. Cities 2019, 89, 167–185. [Google Scholar]
- Hongbo, Z.; Difei, Y.; Changhong, M.; Li, G.H.; Feng, Y.B.; Bie, Q.L. The Location Distribution Characteristics and Influencing Factors of Cultural Facilities in Zhengzhou Based on POI Data. Sci. Geo-Graph. Sin. 2018, 38, 1525–1534. [Google Scholar]
- Chion, M. Producing urban vitality: The case of dance in San Francisco. Urban Geogr. 2013, 30, 416–439. [Google Scholar] [CrossRef]
- Dong, H.; Chang, D.L. On Vitality of Urban Culture: Exploration and Excavation of Theoretical Resources. J. Huazhong Univ. Sci. Technol. 2011, 3, 21–27. [Google Scholar]
- He, Q.; He, W.; Song, Y.; Wu, J.; Yin, C.; Mou, Y. The impact of urban growth patterns on urban vitality in newly built-up areas based on an association rules analysis using geographical ‘big data’. Land Use Policy 2018, 78, 726–738. [Google Scholar] [CrossRef]
- Zeng, C.; Song, Y.; He, Q.; Shen, F. Spatially explicit assessment on urban vitality: Case studies in Chicago and Wuhan. Sustain. Cities Soc. 2018, 40, 296–306. [Google Scholar]
- Ye, Y.; Li, D.; Liu, X. How block density and typology affect urban vitality: An exploratory analysis in Shenzhen, China. Urban Geogr. 2018, 39, 631–652. [Google Scholar]
- Qu, B.; Leng, J.W. Intensive evaluation and analysis of urban block based on DEA model: A case study of Xinjiekou District, Nanjing. Plan. Des. 2019, 4, 83–91. [Google Scholar]
- Kim, Y.L. Seoul Wi-Fi hotspots: Wi-Fi access points as an indicator of urban vitality. Comput. Environ. Urban Syst. 2018, 72, 13–24. [Google Scholar]
- Liou, J.J.H.; Tzeng, G.H. Comments on “Multiple criteria decision making (MCDM) methods in economics: An overview”. Technol. Econ. Dev. Econ. 2012, 18, 672–695. [Google Scholar]
- Zavadskas, E.K.; Turskis, Z. Multiple criteria decision making (MCDM) methods in economics: An overview. Technol. Econ. Dev. Econ. 2011, 17, 397–427. [Google Scholar] [CrossRef] [Green Version]
- Yi, P.; Dong, Q.; Li, W. Evaluation of City Sustainability Using the Deviation Maximization Method. Sustain. Cities Soc. 2019, 50, 101529. [Google Scholar] [CrossRef]
- Li, L.; Lun, X.Y.; Shanhu, J.; Qingming, W. Evaluation of Urban Vitality Based on Fuzzy Matter-Element Model. Geogr. Geo-Inf. Sci. 2010, 1, 74–76. [Google Scholar]
- Weisheng, M.; Yexi, Z. Spatial pattern and influencing factors of urban vitality in the middle reaches of the Yangtze River. World Reg. Stud. 2020, 29, 86–95. [Google Scholar]
- YanJie, J. Study on Urban Economic Vatality Index in China. Sci. Geogr. Sin. 2007, 27, 10–16. [Google Scholar]
- Hai, W.; Difei, J. Evaluation system research on vitality of urban public space. J. Railw. Sci. Eng. 2012, 9, 56–60. [Google Scholar]
- Kang, C.; Fan, D.; Jiao, H. Validating activity, time, and space diversity as essential components of urban vitality. Environ. Plan. B Urban Anal. City Sci. 2021, 48, 1180–1197. [Google Scholar]
- Guo, Y.J. Comprehensive Evaluation Theory, Method and Application; Science Press: Beijing, China, 2007. [Google Scholar]
- Yiping, X.; Yanlin, Y.; Yan, S. Comprehensive evaluation on urbanization quality and its spatial and temporal characteristics in China. China Popul. Resour. Environ. 2018, 28, 112–122. [Google Scholar]
- Shanghai City Master Plan. Available online: https://www.supdri.com/2035/ (accessed on 9 October 2021).
- Jinshan District Continues to Increase Industrial Restructuring Efforts and Focus on Improving the Regional Ecological Environment. Available online: https://www.jinshan.gov.cn/ywdt-zhxx/20200713/705185.html (accessed on 9 October 2021).
- Duarte, L.; Teodoro, A.C.; Gonçalves, J.A.; Dias, A.J.G.; Marques, J.E. A dynamic map application for the assessment of groundwater vulnerability to pollution. Environ. Earth Sci. 2015, 74, 2315–2327. [Google Scholar] [CrossRef]
- Zhao, H.; Duan, X.; Stewart, B.; You, B.; Jiang, X. Spatial correlations between urbanization and river water pollution in the heavily polluted area of Taihu Lake Basin, China. J. Geogr. Sci. 2013, 23, 735–752. [Google Scholar] [CrossRef]
- Wu, Z.; Zhang, F.; Di, D.; Wang, H. Study of spatial distribution characteristics of river eco-environmental values based on emergy-GeoDa method. Sci. Total Environ. 2022, 802, 149679. [Google Scholar]
- Ke, X.; Wang, X.; Guo, H.; Yang, C.; Zhou, Q.; Mougharbel, A. Urban ecological security evaluation and spatial correlation research-based on data analysis of 16 cities in Hubei Province of China. J. Clean. Prod. 2021, 311, 127613. [Google Scholar] [CrossRef]

Publisher’s Note: MDPI stays neutral with regard to jurisdictional claims in published maps and institutional affiliations. |
© 2021 by the authors. Licensee MDPI, Basel, Switzerland. This article is an open access article distributed under the terms and conditions of the Creative Commons Attribution (CC BY) license (https://creativecommons.org/licenses/by/4.0/).