Abstract
The main objective of the study is to estimate the shear resistance mobilized on the slope surface under large deformation and to identify the failure mechanism of the landslide through the simulation model. The field investigations were carried out using Geophysical tests, and the laboratory tests were conducted to identify the engineering properties of the soil with weathering characteristics of the parent rock. The residual shear strength parameters from Torsional ring shear tests were used in LS-RAPID numerical simulation software to study the mechanism of the landslide. The critical pore water pressure ratio (ru = 0.32) required for the initiation of a landslide was obtained. The increase in pore water pressure reduces the soil matric suction and thereby results in the reduction of the shear strength of the soil. The progressive failure mechanism and the three landslide processes (initiation, run out and deposition) are investigated. The velocity of the moving landslide mass in the role of demolishing the building is studied and helps in finding suitable remedial measures for the nearby building. The empirical rainfall threshold based on the antecedent rainfall was developed and revealed that either a high daily rainfall intensity of 142 mm without any antecedent rainfall, or an antecedent rainfall of 151 mm for a cumulative period of 5 days with even continuous normal rainfall can initiate landslide.
1. Introduction
Rainfall-induced landslides are one of the major disasters experienced all around the globe. Many researchers have studied the causative mechanisms of landslides by considering the effects of rainfall [1,2,3,4,5]. Globally, many researchers have discussed rainfall-induced landslides [6,7]. The total landmass of India comes under a landslide-prone hazardous zone [8,9,10]. From one study, it has been shown that rainfall-induced landslides are caused by the development of excess pore water pressure and seepage force [11,12,13]. The development of pore water pressure reduces matric suction potential and results in decreased effective stress [14,15]. The decline in effective stress induces the landslide.
Kerala, a state in India, is located between the Arabian sea and Western ghats. Idukki district in Kerala has 97% of its total area covered with mountains and forests. Idukki region is a high-to-moderate landslide hazard zone according to the landslide hazard zonation map prepared by the state disaster management authority, Kerala [16,17,18]. The Geological profile in the mountainous slopes of Idukki consists predominantly of crystalline rocks such as biotite gneiss, hornblende biotite gneiss, and pyroxene granulite. The district receives plenty of rainfall from both the southwest monsoon during June-August and the northeast monsoon from October to November. Typically, the southwest monsoon produces more rainfall than the northeast monsoon. Kerala, during 2018, experienced the most severely extreme rainfall since 1924. The torrential rainfall triggered many landslides and floods, causing extensive damage to property [19,20,21,22,23].
Vertically cut, steep slopes, heavy rainfall, unplanned urbanization, loss of vegetation, and toe erosion are the major factors responsible for landslides in the Western Ghats [11]. Idukki district suffered social and economic breakdowns due to the 2018 floods [21,24,25]. Due to the vastness in the topography of the region, a study based on the landslide forecast using rainfall thresholds in the Western Ghats was carried out [8,26,27]. There were many instances of landslides occurring in the Idukki district, as reported by various researchers [24,25,26,27,28]. The Windward side of the Western Ghats is one of the most commonly affected areas due to landslides [29]. These are rugged hills characterized by steep slopes covered by loose unconsolidated soils [30,31]. Although many studies are based on landslide susceptibility and early warning of rainfall threshold, no detailed investigation based on the failure mechanisms of the landslide area in Kerala has been studied to date. The investigation aids in finding detailed site-specific probabilistic hazard zonation near the study area and the proper site-specific remedial measures to be implemented in the site to prevent possible reactivation of landslides.
The main objectives of this study are (1) identifying the subsurface profile of the soil and their influence on the landslides, (2) geotechnical properties of the soil in identifying the classification of landslide, (3) the influence of weathering in the failure of landslide, (4) the shear resistance mobilized on the slip surface under large deformation, (5) the failure mechanism of the landslide through a simulation model, and (6) the region-specific threshold based on the daily rainfall and antecedent rainfall for possible early warning.
2. Slope Failure in Upputhode
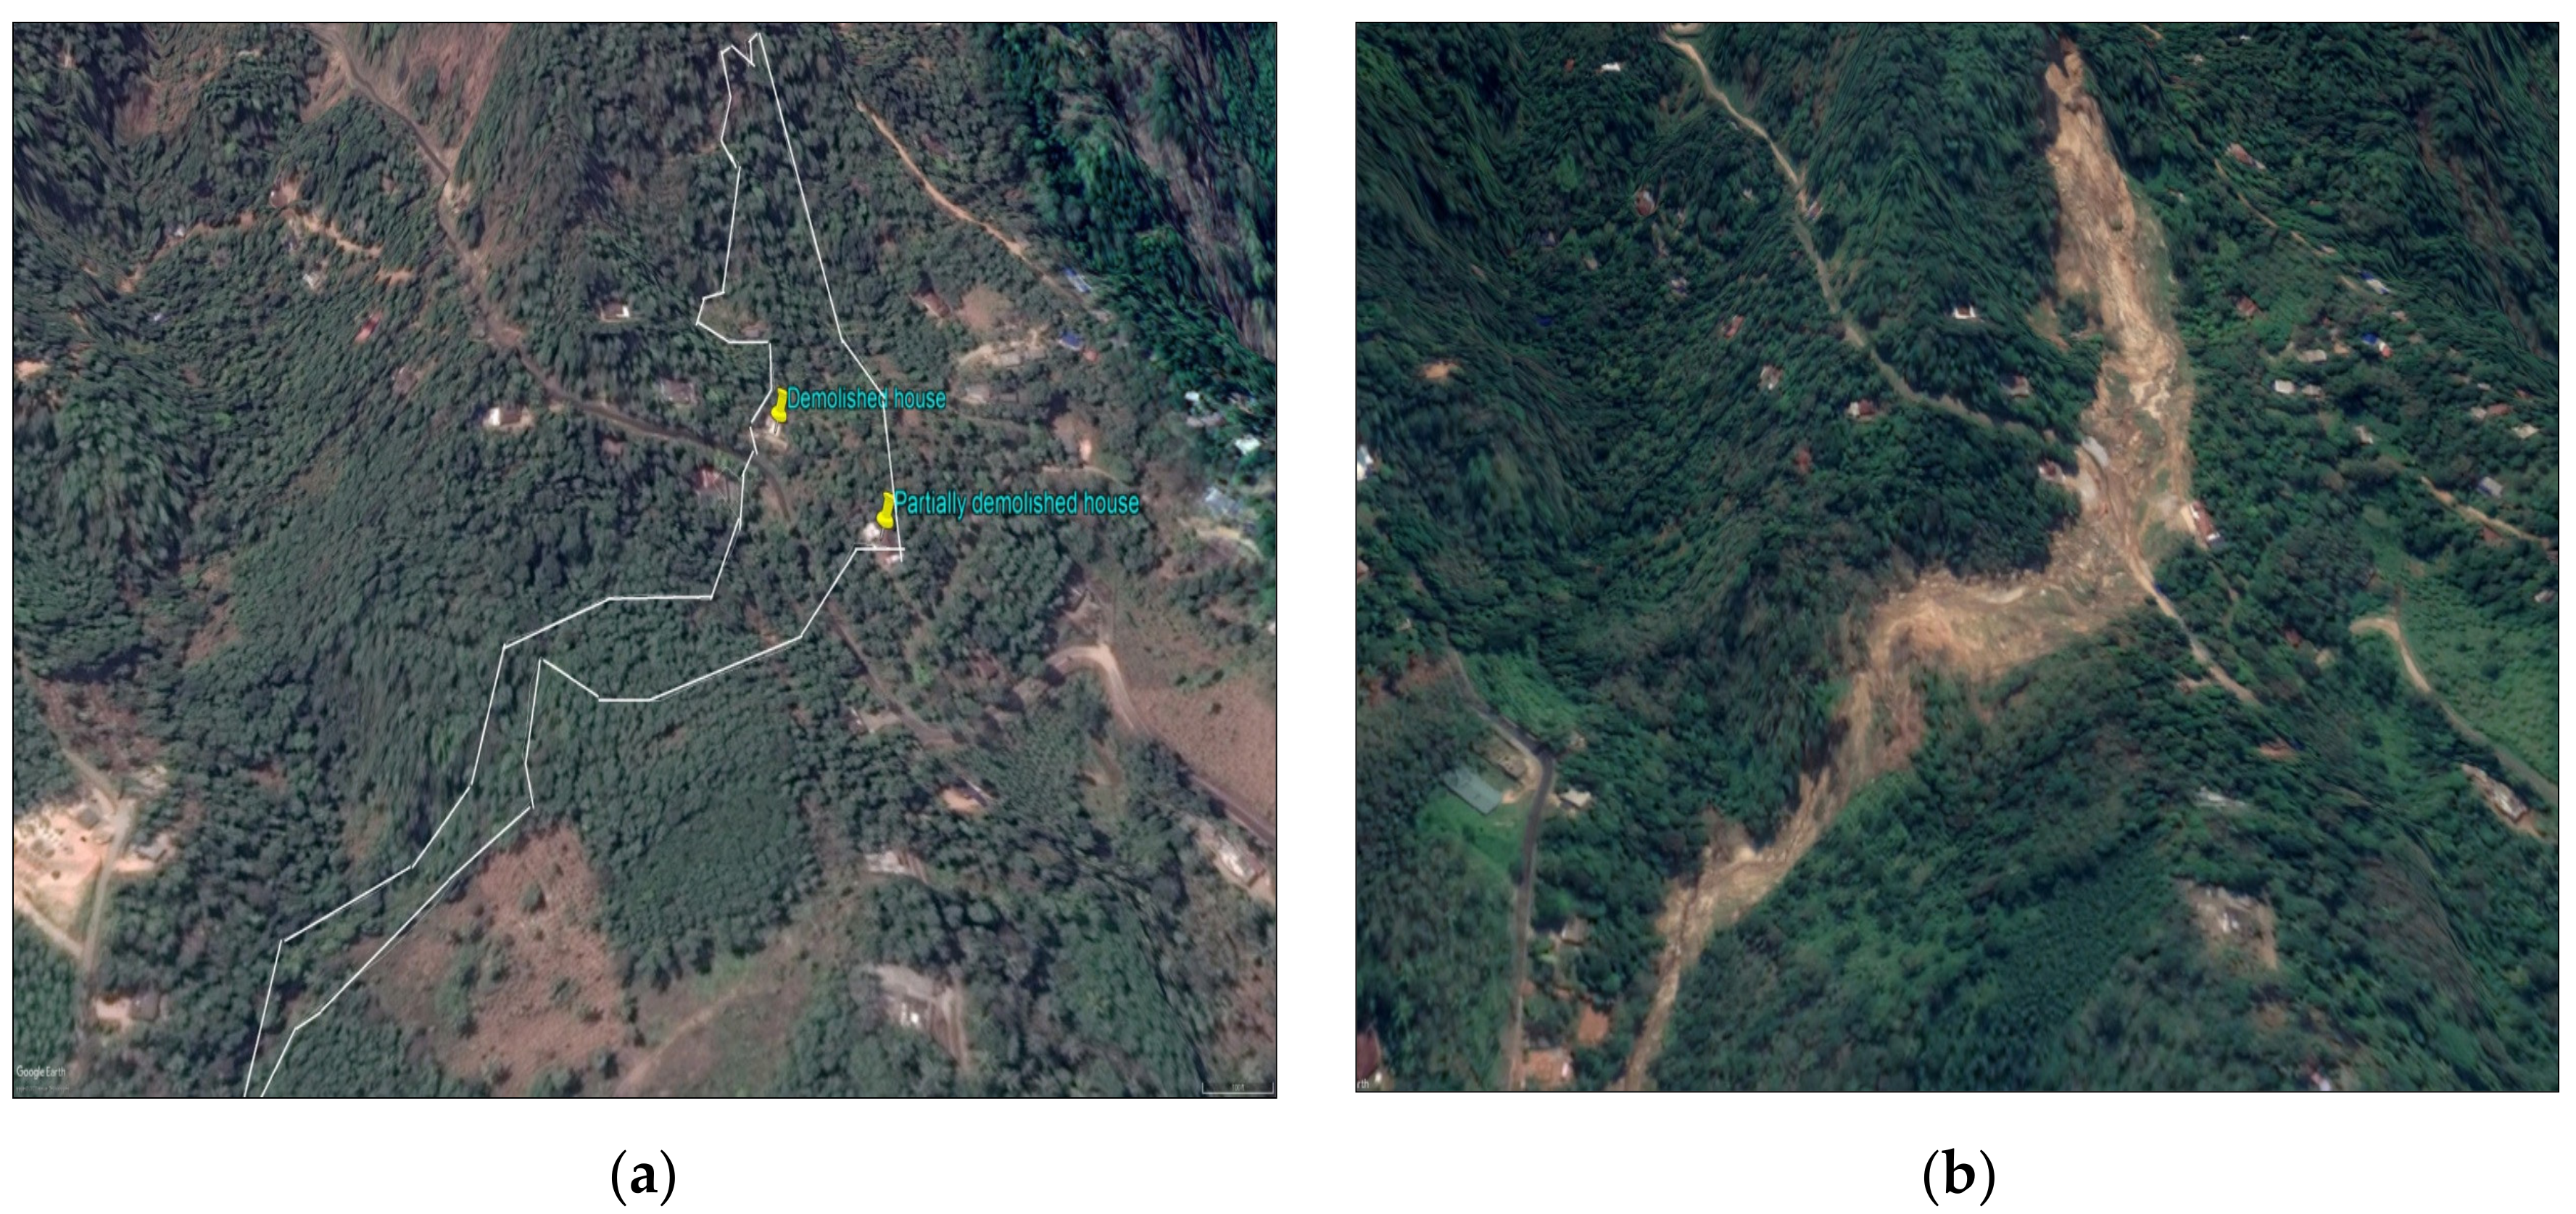
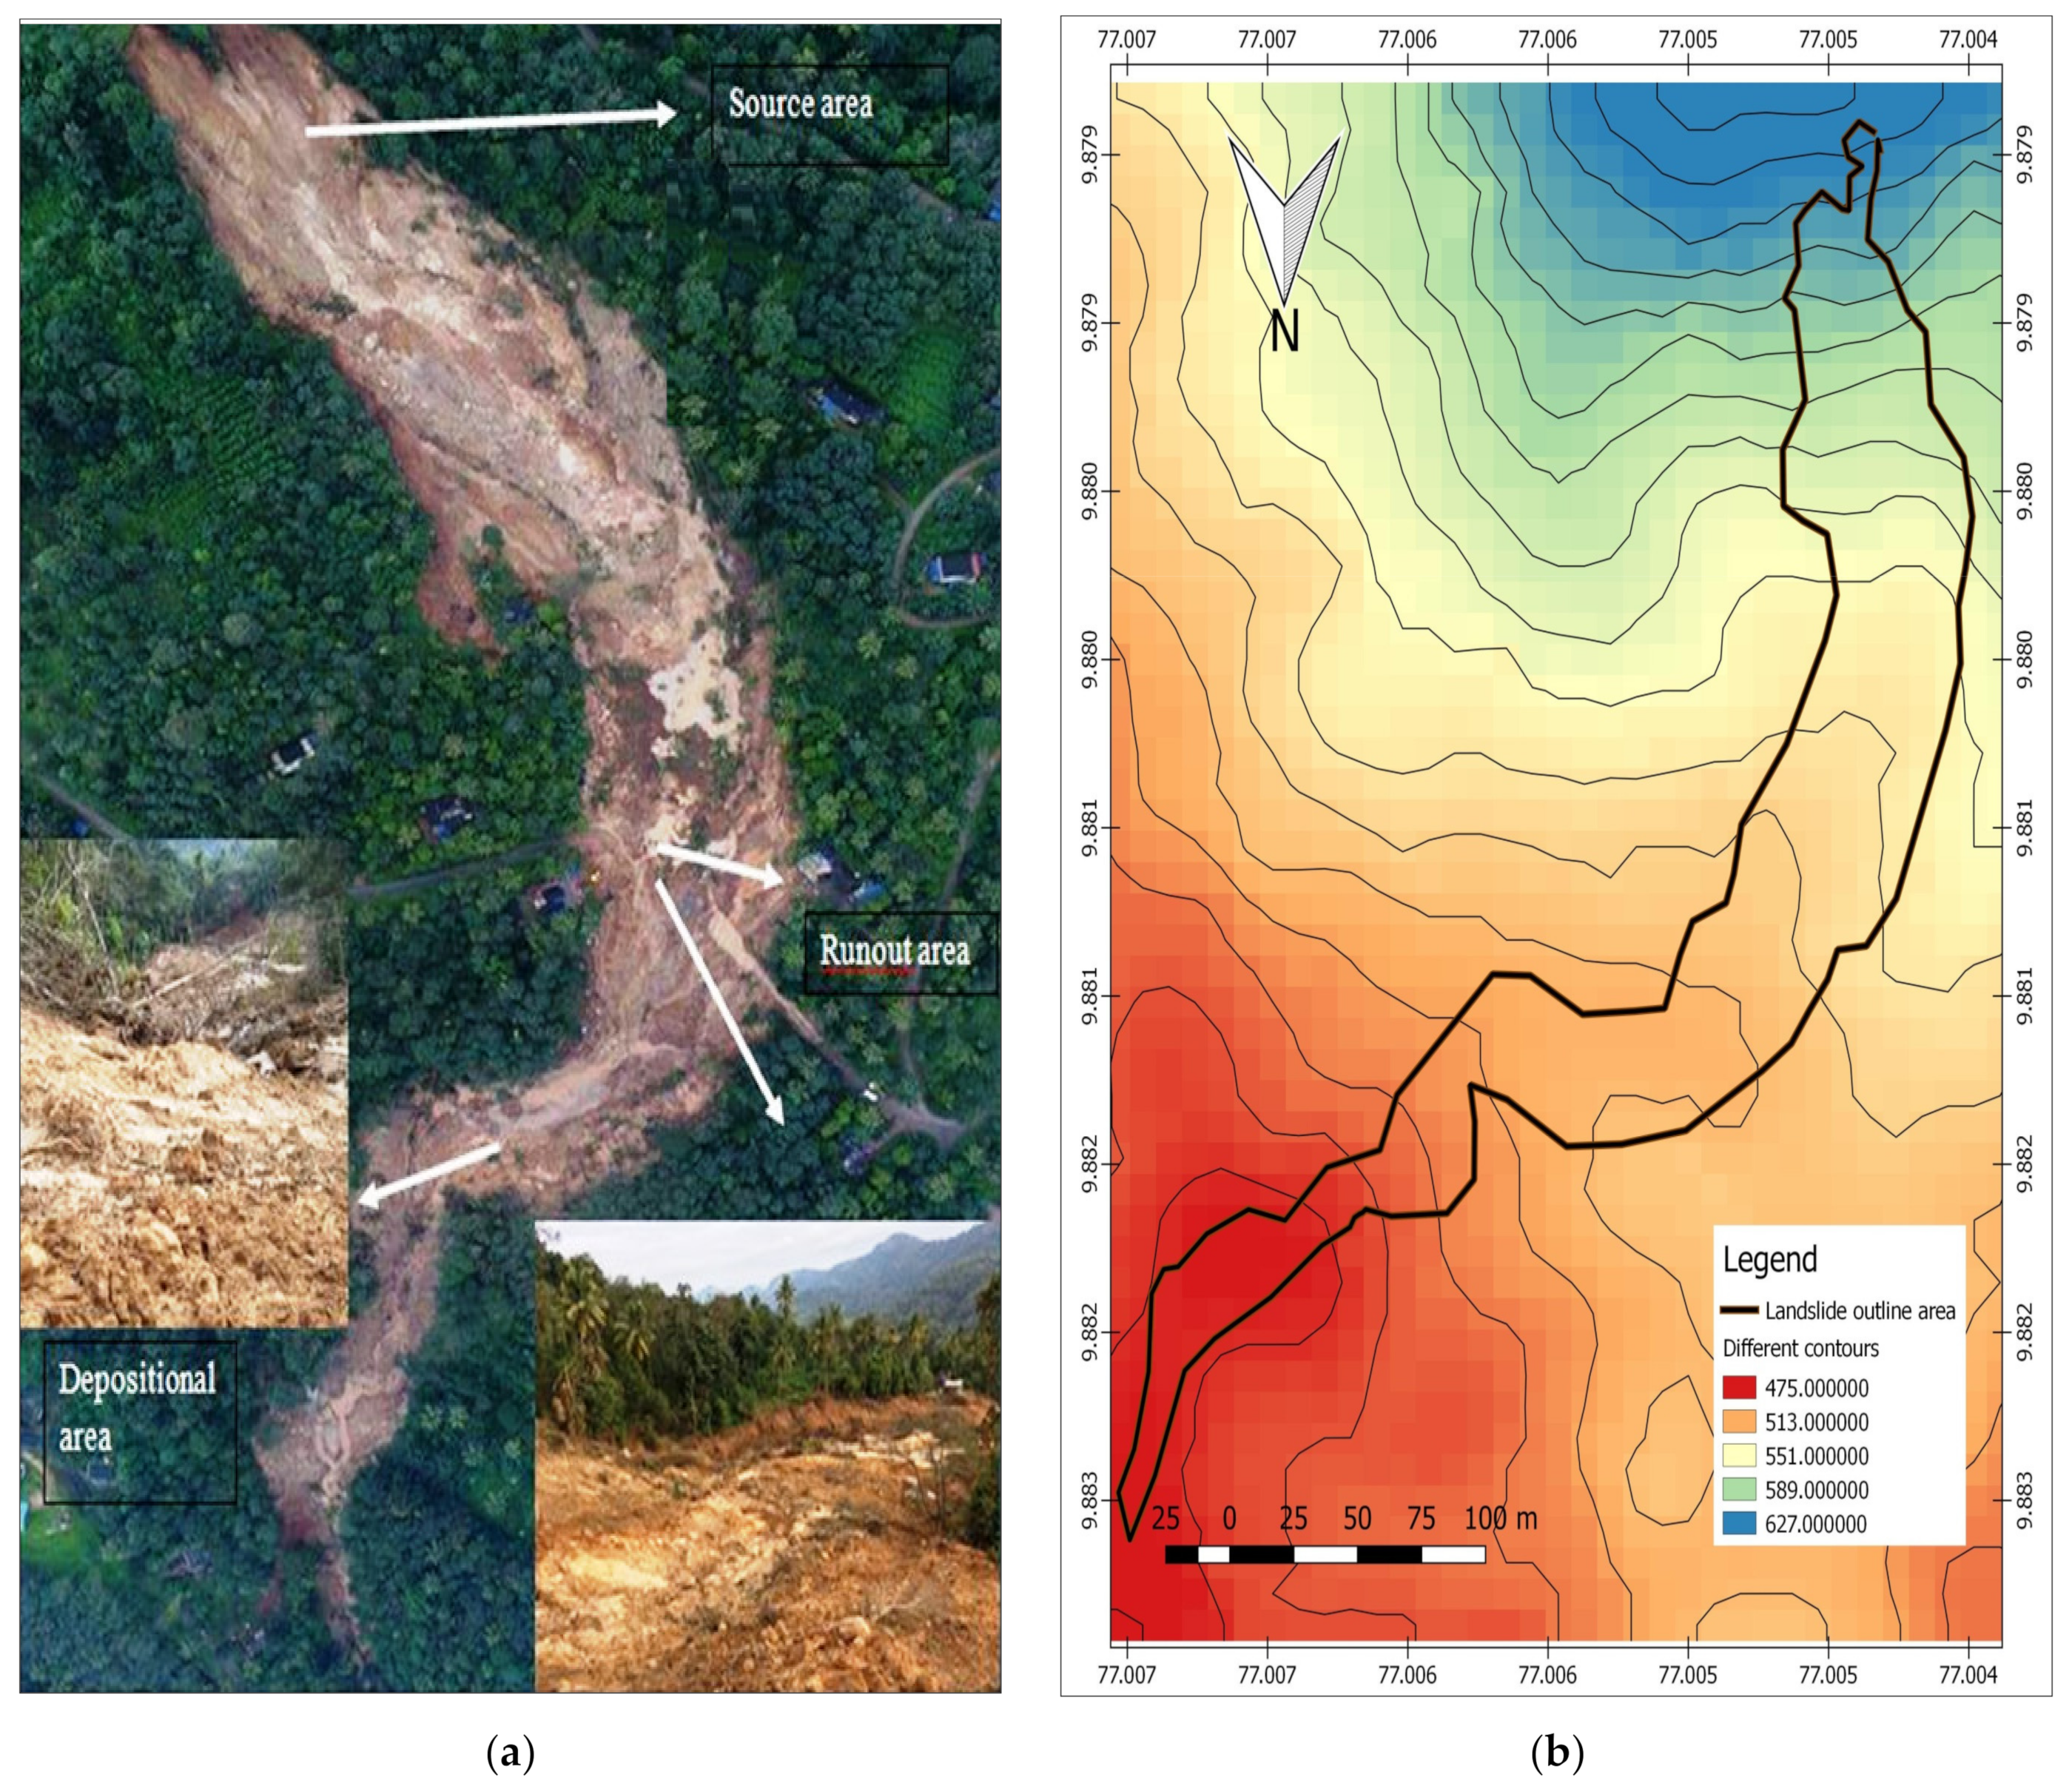
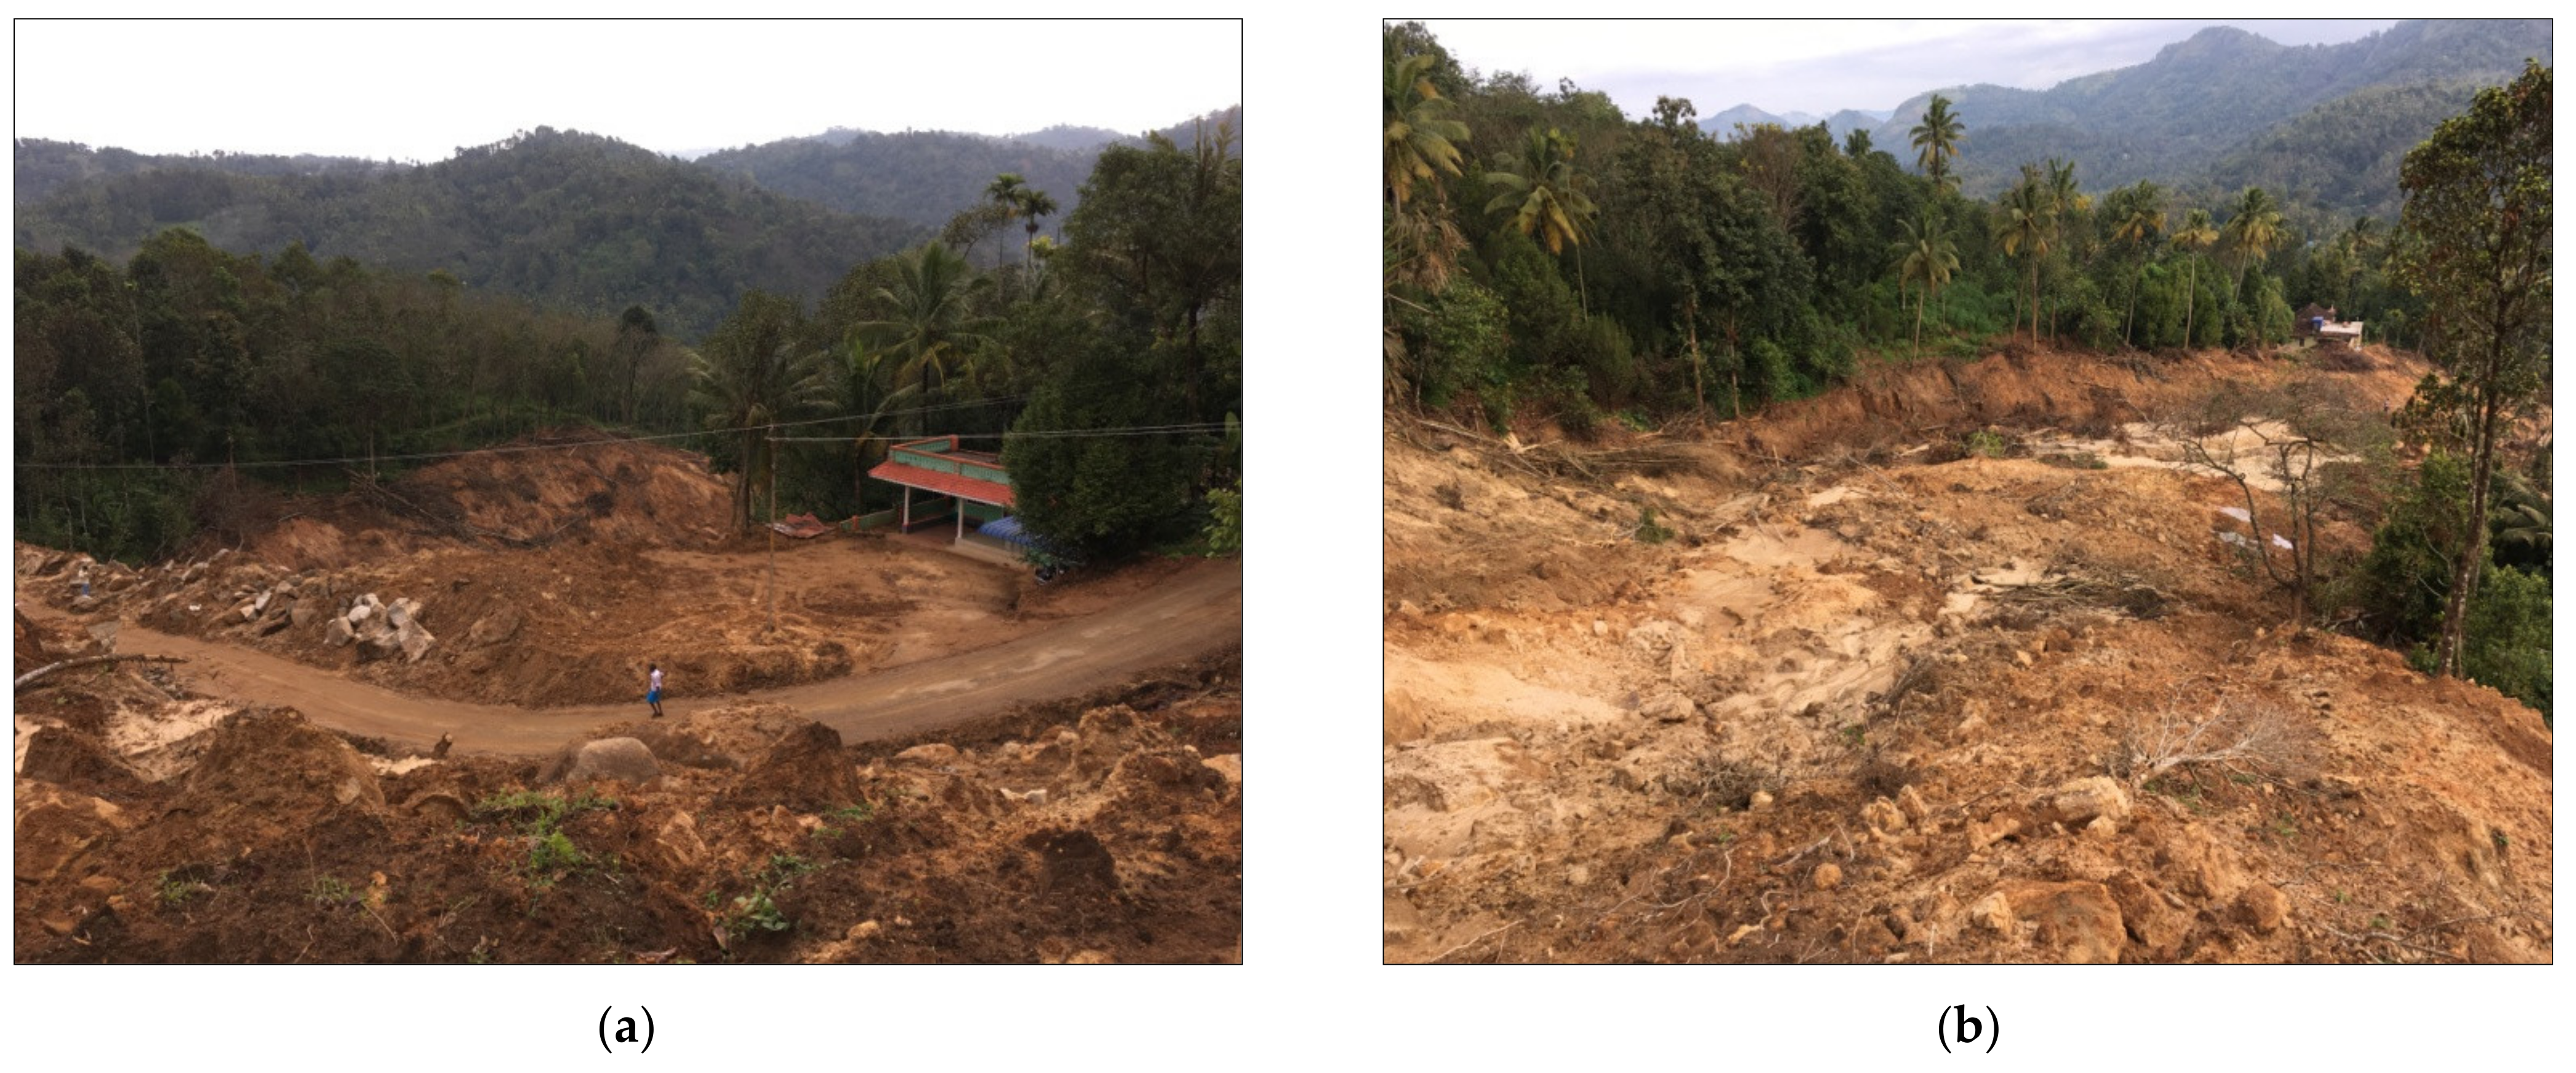
The latitude and longitude of the Upputhode landslide area are 9°52′52.77″ N and 77° 00′15.91″ E (Figure 1). Google earth images of the affected site before and after the landslide are shown in Figure 2a,b. The Upputhode landslide is classified based on the material and movement. The material involved in the landslide was found to be silty sand and poorly graded sand. The type of movement observed was sand-type flow. Based on [32], it was classified as a sand flowslide. The slide observed in Upputhode was classified as a debris flow. The slide occurred in the early morning of 17 August 2018 and entirely damaged one house and partially damaged another. It resulted in the killing of four people and many livestock in the process. The main triggering factor for the slide was the continuous heavy rainfall in the location. The source area, runout, and depositional area of the slide are shown in Figure 3a. As seen in Figure 3a, the landslide started from the mountain top and the soil mass deposited in the valley. The survey profile of the landslide area is presented in Figure 3b. The crown and toe portions of the landslide area are 627 and 475 m, respectively, above MSL (mean sea level). Figure 4a,b shows the overall view and the runout portion of the slide. Figure 4c shows the crown portion of the landslide area. The slip surface commenced at a depth of 1 m below the top-level, as shown in Figure 4d. The runout path of the slide terminated in the valley beneath the slope (Figure 4e).
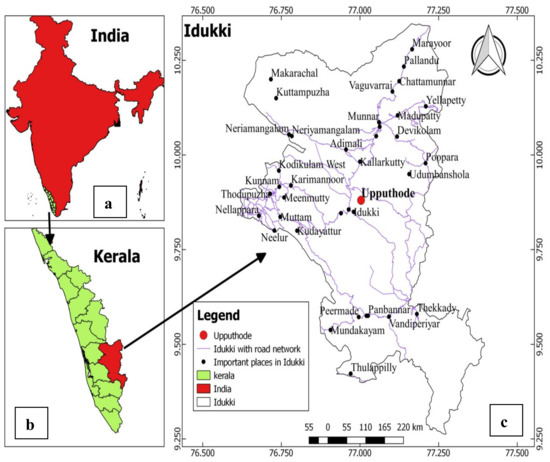
Figure 1.
Location map: (a) India, (b) Kerala, (c) Idukki and Upputhode (study area).
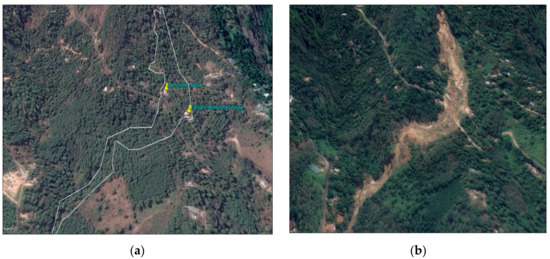
Figure 2.
Photos of the affected site (a) before and (b) after the landslide (From Google Earth).

Figure 3.
Landslide area with (a) aerial view of the source, runout and depositional area and (b) contour map.

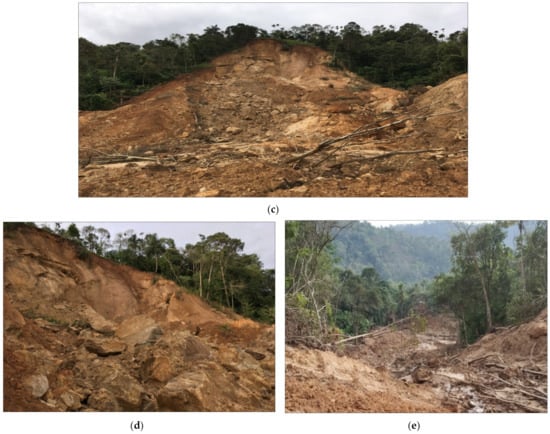
Figure 4.
View of landslide in study area. (a) Overall view of the landslide, (b) run-out portion of the slide, (c) crown portion of the slide, (d) slip surface of the slide, (e) deposition area of the slide.
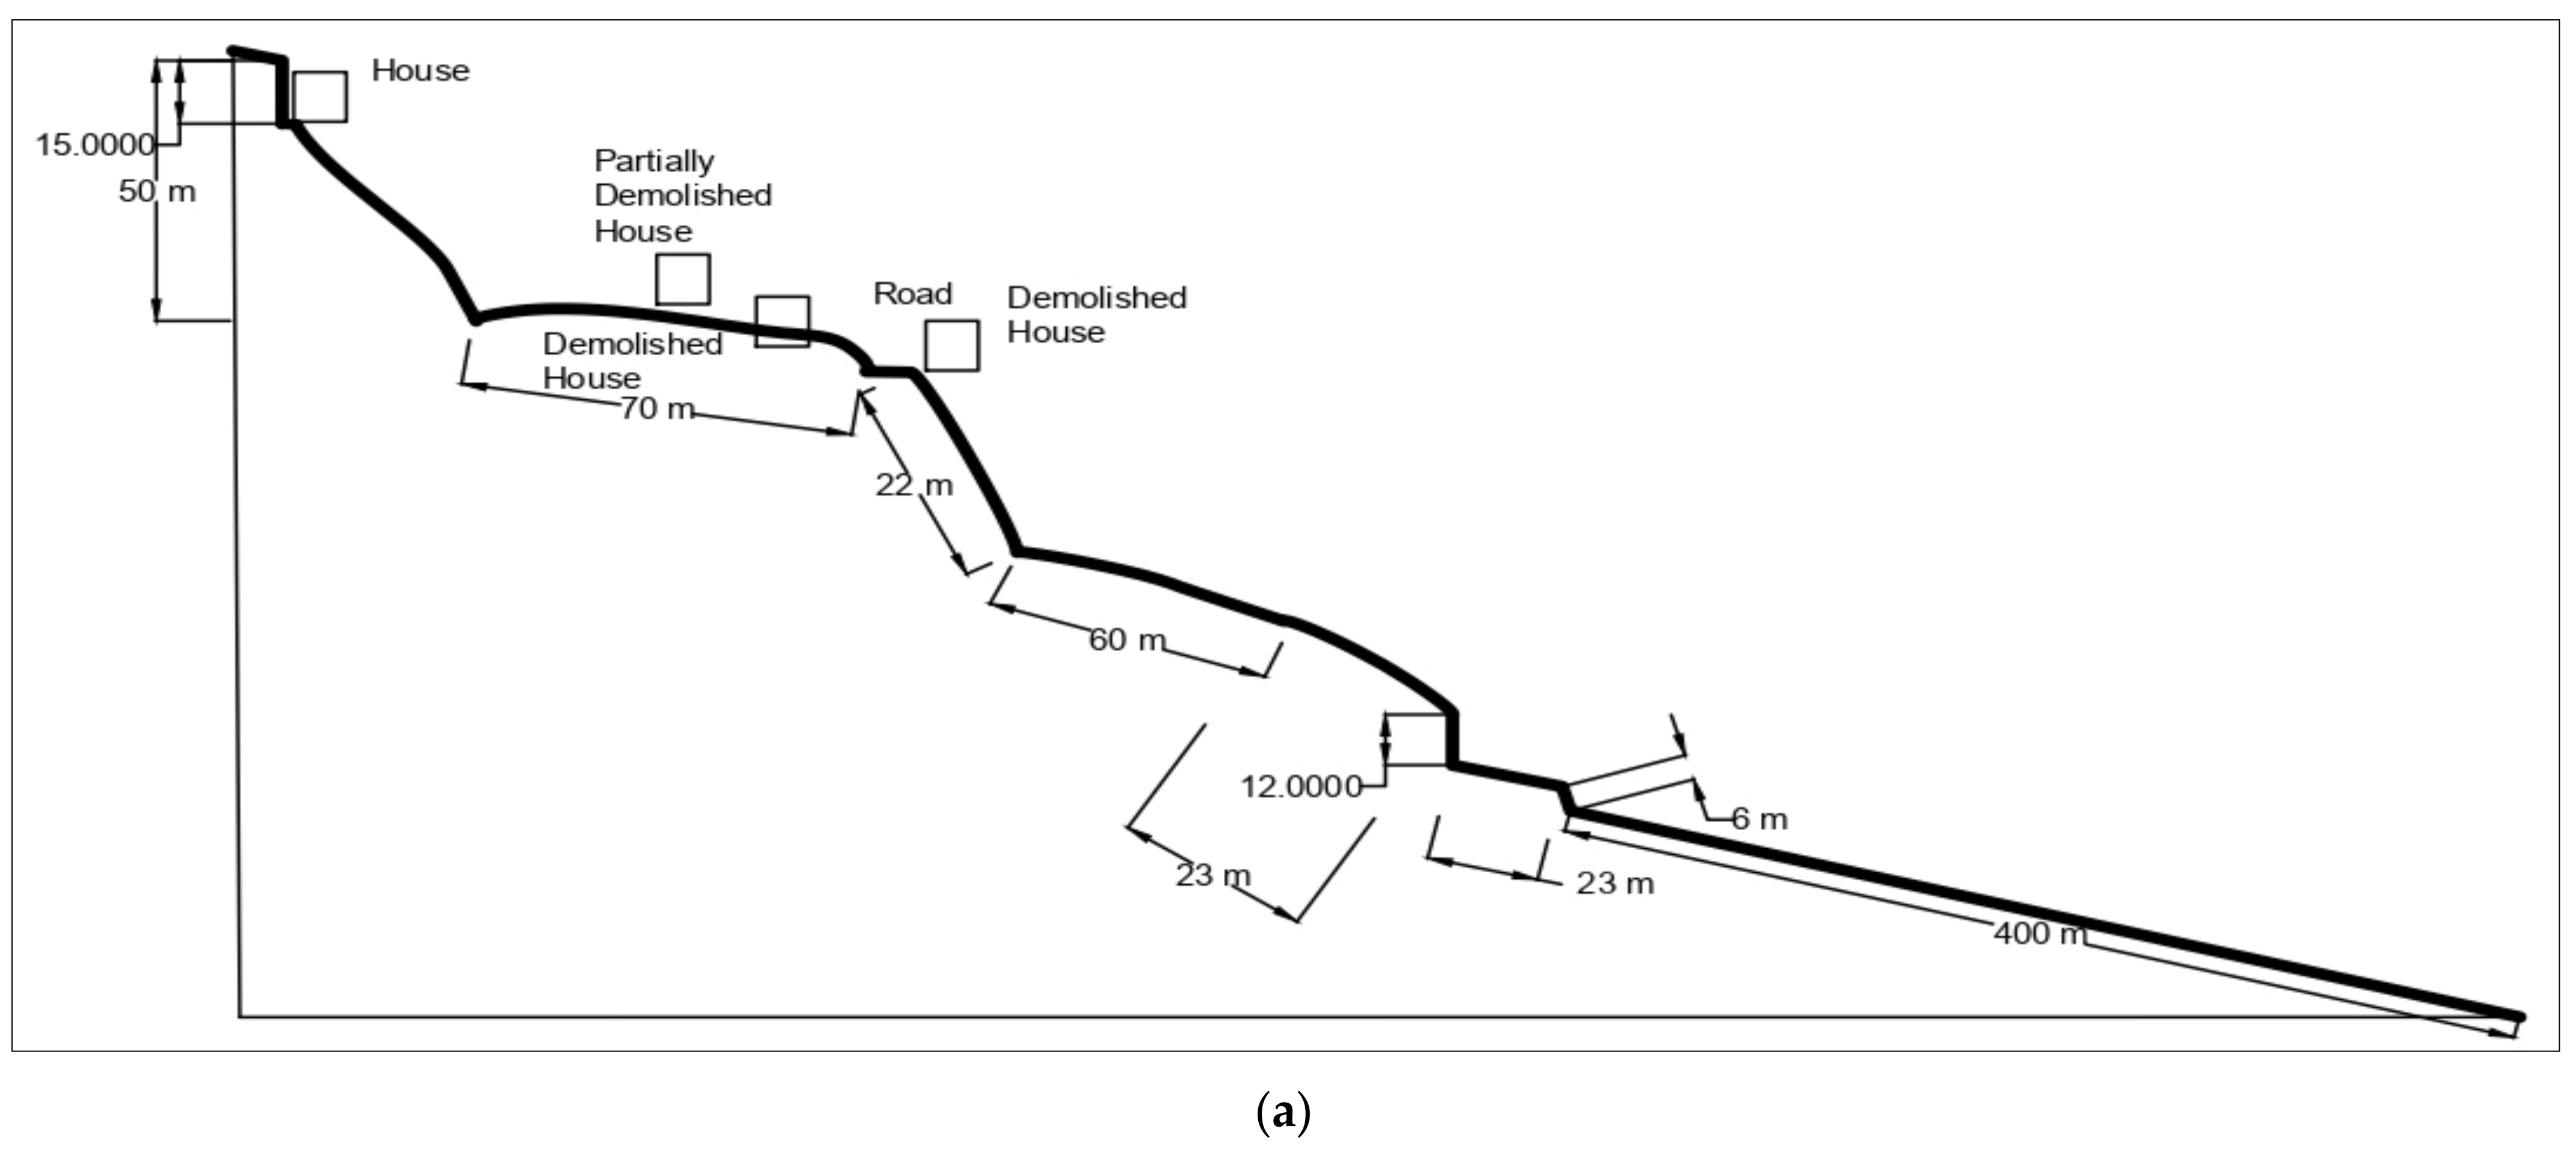
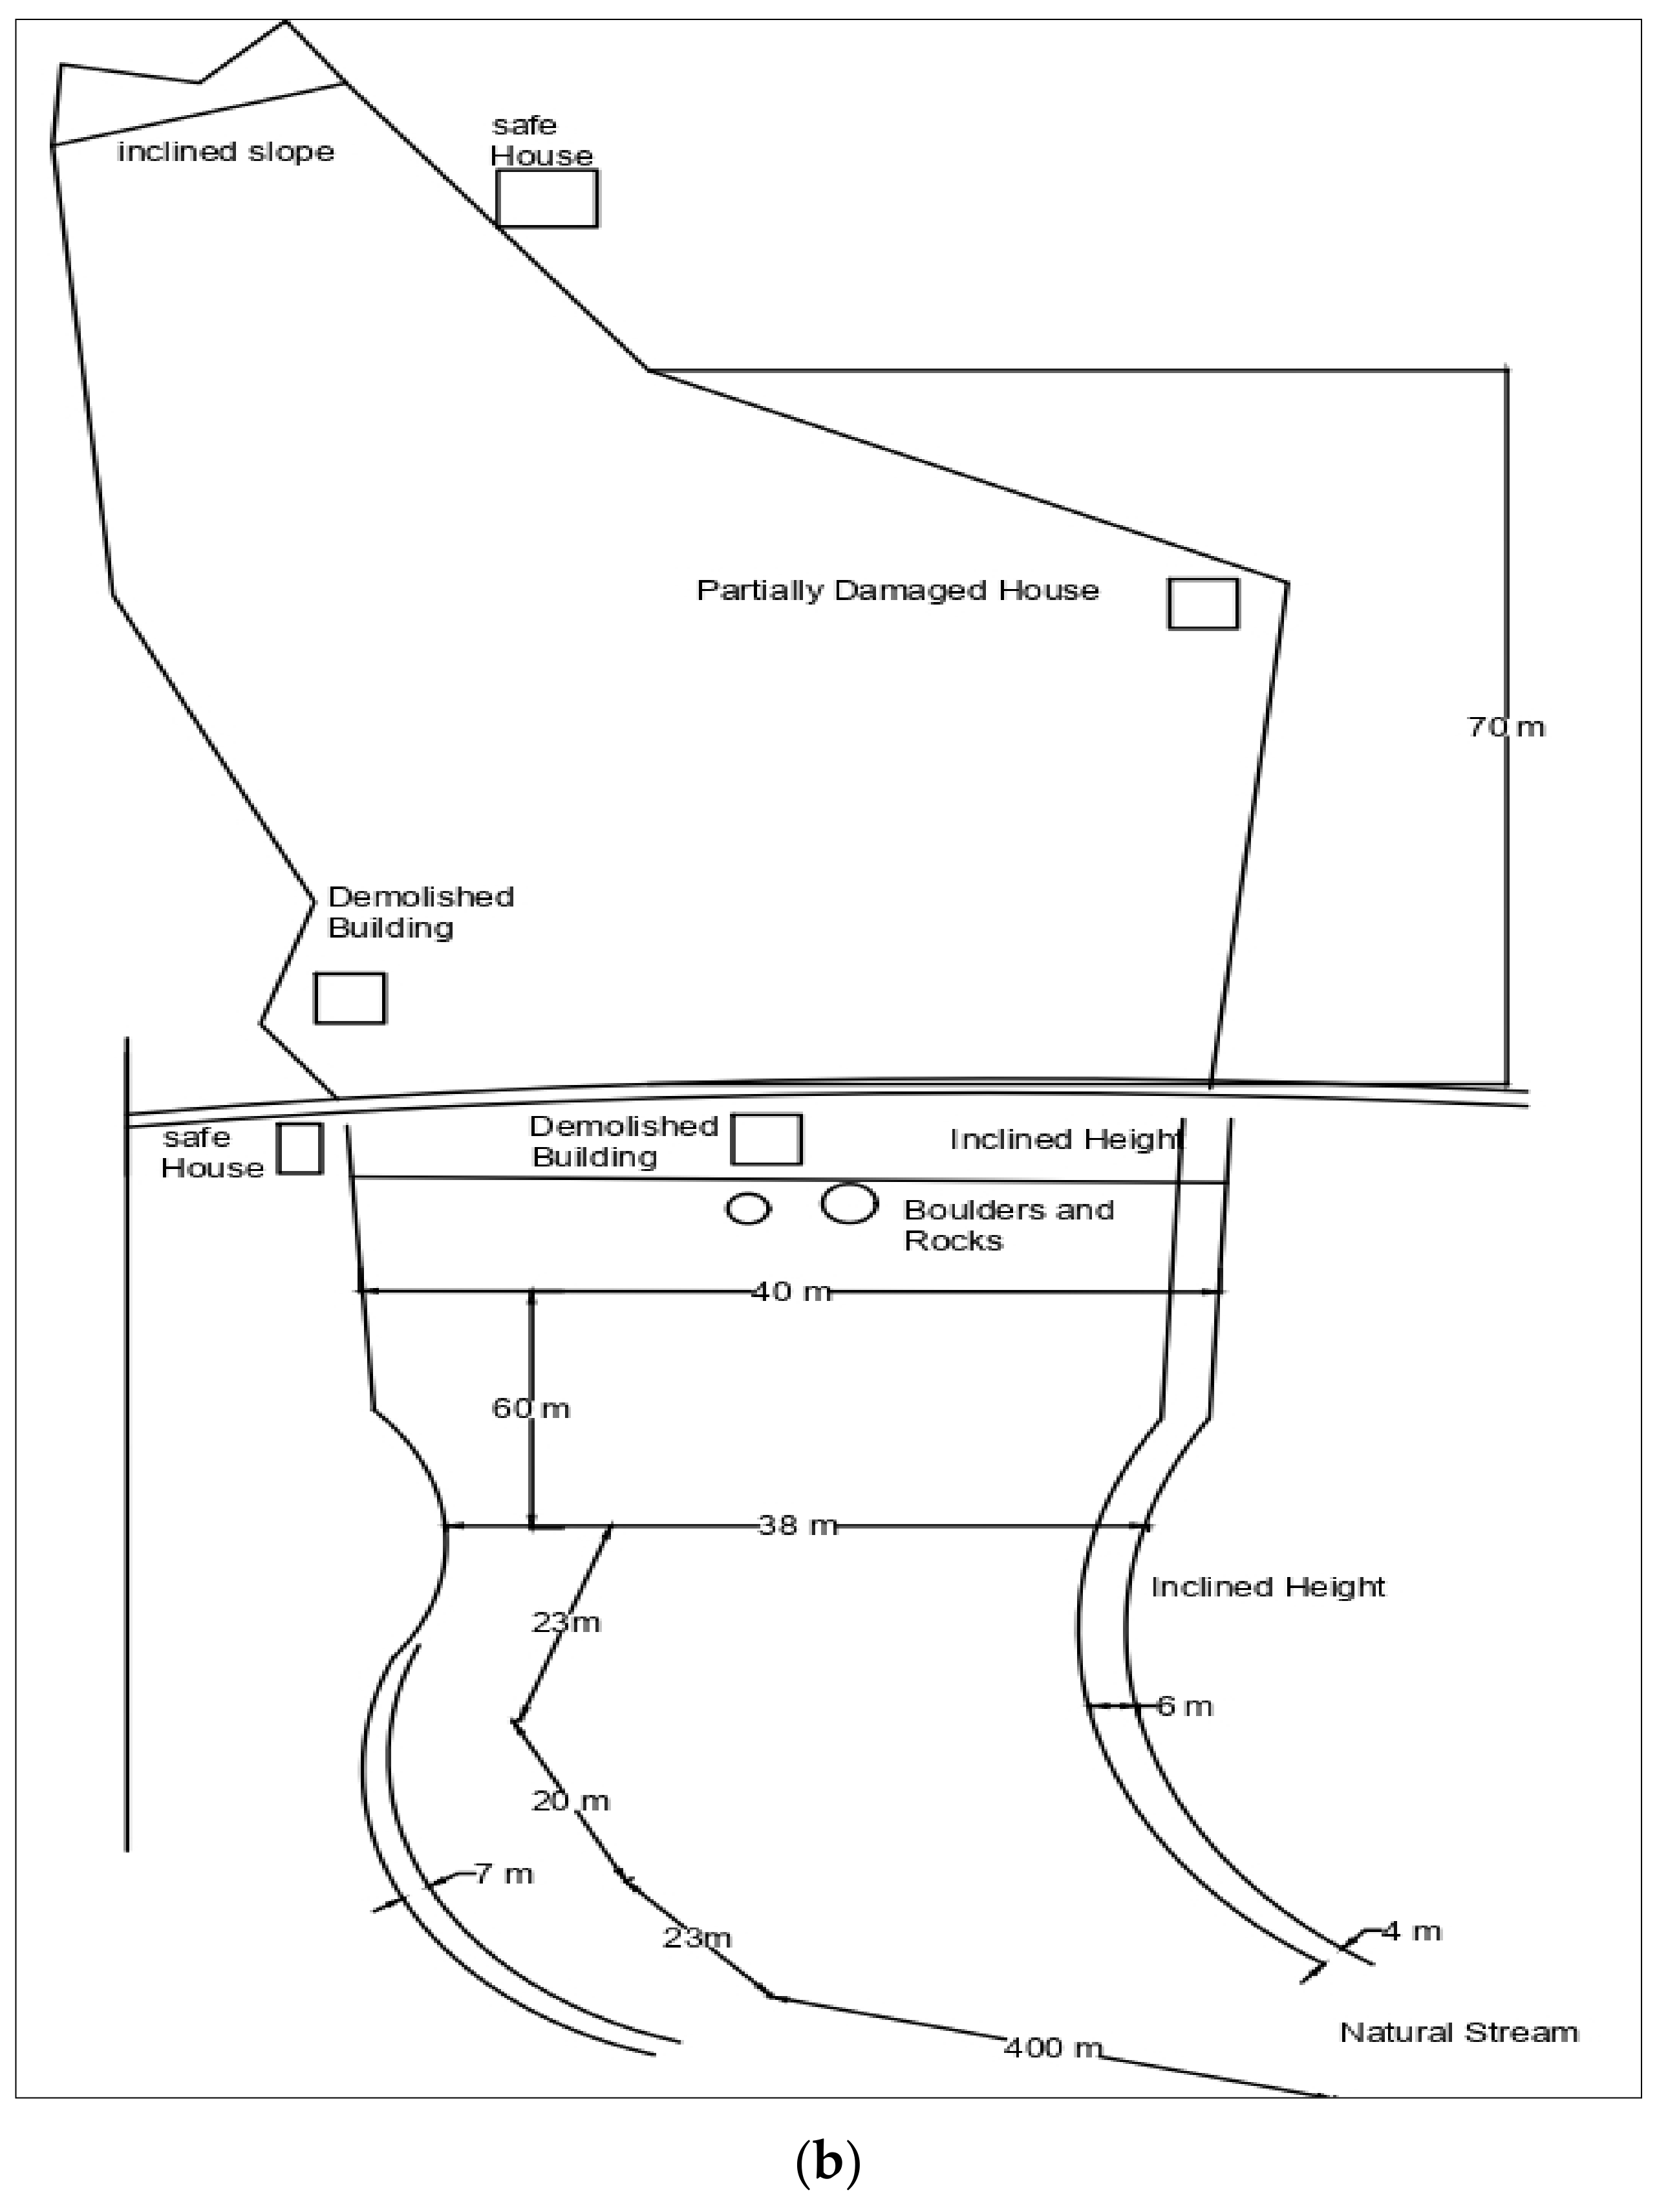
The landslide had a great impact on livestock and property. Approximately 10 acres of agricultural land were destroyed, and many livestock were killed as a result of the moving landmass. On hearing the noise of moving soil mass, the church bell was alerted, which helped the nearby residents to overcome the dangerous situation [33]. The overall longitudinal and plan sections of the slope are shown in Figure 5a,b, respectively. The runout length of the landslide was approximately 800 m. The width of the silt debris flowslide was 40 m in the middle runout portion (Figure 5a,b). The rainfall occurred in two stages, with the nominal rainfall experienced from 1 June to 30 July of 2018. The second stage was the rainfall from 1 August to 19 August 2018. The total time taken for the landslide to occur was 1 min, and this is the main cause for the demise of four family members, as the time taken to cross the building was less than 25 s.

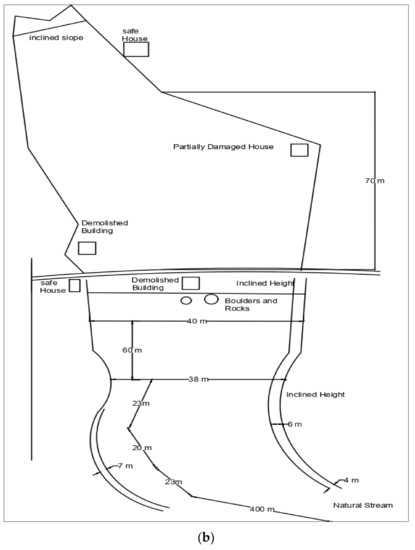
Figure 5.
Sketch view of (a) longitudinal section and (b) plan of slope geometry.
3. Rainfall
Kerala gets its majority of rainfall from the southeast monsoon [34]. The rain gauge station nearby the Upputhode site is the Idukki rain gauge station (Figure 6a), and the rainfall data were obtained from the Indian Meteorological Department [35]. The average rainfall for 50 years and the actual rainfall for the Idukki district in 2018 are shown in Figure 6b. It is observed from the figure that the rainfall during the southwest monsoon of 2018 was 45% greater than the average rainfall. Figure 6c shows the rainfall data for the month of August 2018 recorded at the Idukki rain gauge station. The rainfall exceeded 250 mm on 16 and 17 of August 2018 [35]. The importance of rainfall in triggering the landslide can be observed as the extremely heavy rainfall on the event day and preceding day (17 and 16 August 2021). The antecedent rainfall before the event day 14–15 and 9–12 of August 2018 received heavy rainfall and very heavy rainfall, respectively [35].
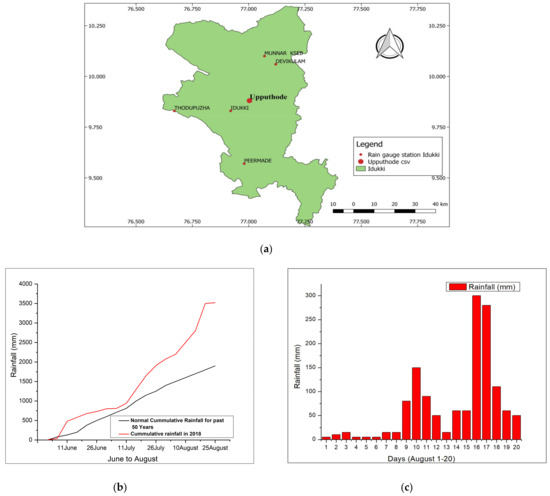
Figure 6.
Rainfall data. (a) Rain gauge stations in Idukki. (b) Cumulative rainfall for southwest monsoon 2018 (after IMD 2018). (c) Daily rainfall recorded at the Idukki rain gauge station in August 2018 (after IMD 2018).
4. Field and Laboratory Test
4.1. Field Test
A multi-channel analysis of surface waves (MASW) test is one of the non-destructive techniques used in site characterization. It is useful and cost-effective in characterizing the sub-surface soils [36,37]. Weathering is a major triggering factor for landslides in subtropical regions [28,38]. A geophysical test was conducted in the study area to acquire the sub-surface profile of the slopes. The test was carried out near the source area to identify the sub-surface profile of the source area.
An MASW test was carried out using 24 PASI vertical 4.5HZ geophones (Italy make) and a GEA-24 seismic recorder (Italy make) with interface software. The geophones have a natural frequency of 4.5 HZ and are used to measure the waves generated by an 8.5 kg sledgehammer source (Figure 7). The surface waves develop only after a small distance from the source. The amplitude of the surface waves dominates the fundamental mode over a higher frequency. The fundamental frequency depends upon the layer parameters and the offset. Therefore, it is optimal to set the source’s distance to the geophone receivers not to exceed 100 m (Figure 7) [39,40]. The source and receivers are connected to the recorder. The tests are repeated with sources at the front, middle and end of the receivers for the correct interpretation of field data. The transformation of the wavefield creates the dispersion curve by mapping the surface waves, which are in the offset-time domain (x-t), to the dispersion curve (phase velocity vs. frequency domain (v-w)) [41]. The dispersion curve is inversed to find the suitable shear wave velocity of the earth layers.
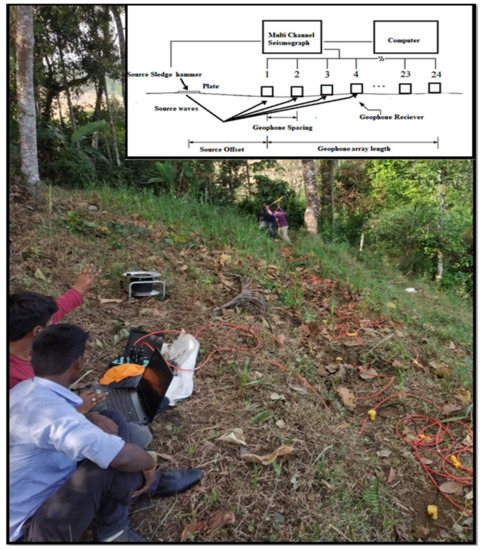
Figure 7.
Pictorial representation of multi-channel analysis of surface waves (MASW) test.
4.2. Laboratory Tests
The topsoil consists of a soil cover for a depth of 2 m from the crown portion of the slide. In the second layer, the soil in the sliding part consists of weathered soil, ranging from fully weathered to partially weathered soil. The slide is accompanied by massive boulders moving along the run-out path. When they start to move, the loose unconsolidated topsoil creates an additional load on the weathered non-cohesive soil. This helps in the development of a progressive landslide.
The soil samples are collected from the top portion at a depth of 2 m from the crown, which is the slip surface, to carry out the laboratory tests (Figure 4c). Index and engineering properties of the soil samples are evaluated by carrying out laboratory tests as per ASTM standards.
4.3. Study on Weathering Characteristics
The mineral composition was identified by X-ray diffraction analysis (XRD) and energy dispersive X-ray spectrum (EDX). The microfabric nature of the soil was determined by Thermo Fisher FEI QUANTA 250 FEG, Field emission scanning electron microscopy (FE-SEM) (Waltham, MA, USA make). The soil samples were collected from the slip surface to study the weathering characteristics of the parent rock. This helps in identifying the minerals that aid in the initiation of the landslide and studying the other mechanisms behind it. The XRD and EDX were carried out to study the soil mineralogy to know the degree of weathering from the parent rocks. The FE-SEM was used in finding the microfabric structure of the soil, which helps in finding out the reason behind the physical and mechanical properties of the soil [42,43,44,45].
5. Evaluation of Residual Shear Strength Parameters of Soil at Slip Surface through Ring Shear Test
The shear strength of the soil before and after the landslide was studied to know the mechanism of landslides. The shear strength of the soil in the landslide slope was investigated through the Bromhead drained shear strength apparatus (Wykeham Farrance (27-WF2202), Controls group, Italy) [46,47,48]. The inner diameter, outer diameter and thickness of the soil specimen dimensions are 70, 100 and 5 mm. Since the landslide was initiated at the top portion of the mountain, the slip surface commenced in the top layer. This paved the way for the progressive landslide, and hence the soil was collected from the slip surface. The top soil layer, namely silty sand (SM), was sieved through a No. 200 sieve and used to calculate the peak and residual shear strength parameters [46]. As the rainfall gets infiltrated to the slip surface, the soil used for the test was saturated at the liquid limit [49]. Since the LS-RAPID simulation model is based on effective stress parameters, the test was conducted under drained conditions under a slow shearing rate [46] to develop the peak friction angle (φp), steady-state shear resistance (τss) and residual friction angle (φm). The consolidated drained condition based on a single-stage test procedure was performed in the ring shear test [47]. The test was carried out for four normal stresses (49, 98, 147 and 196 kPa). The single-stage test procedure was conducted for the sample, and hence, a new sample was used for each test [46]. The sample was consolidated for each normal stress to attain complete consolidation. The sample was then sheared at a very slow shearing rate (0.052 mm/min) to minimize the pore water pressure developed during the test [46]. The slow shear displacement rate was calculated based on Equation (1) [46]:
where dr, df and t50 are the displacement rate (mm/min), estimated failure shear displacement (mm) and time required for 50% consolidation, respectively.
6. Integrated Landslide Simulation Model Using LS-RAPID
The Upputhode landslide was simulated using LS-RAPID (Sassa et al. 2018). The integrated landslide simulation model (LS-RAPID) was used to study the stable slope state, initiation of failure, strength reduction of the soil at failure and the soil mass deposition due to either rainfall, earthquake or the combination of both [50,51]. The unstable mass is subjected to increased pore water pressure, causing the zone of failure to increase around the soil mass at the crown [50]. The LS-RAPID model was based on the Kinematic motion and continuity behavior of the material during landslide motion [52]. The equation considered for the LS-RAPID was the Saint-Venant equation, which includes both continuity and equations of motion.
The model was based on a finite-difference to calculate the volume and velocity of the landslide mass at different time intervals. The model considers the pore-water ratio as a triggering parameter for the initiation of the landslide mass. The other parameters considered for the simulation are lateral earth pressure (k), friction angle inside landslide mass (φa), peak friction angle (φp), peak cohesion (cp) at the sliding surface, cohesion (cm) and friction angles (φm) at motion, steady-state shear resistance at the sliding surface (τss), shear displacement at the start (DL) and end (DU) of the strength reduction and soil unit weight (γ) [50,51,53,54,55]. The analysis was carried out based on strength reduction. The strength reduction starts when the shear displacement reaches DL and reducing the peak shear strength parameters (φp, cp) to shear strength parameters at the residual state (φm, cm). The motion of the landslide starts once the shear displacement reaches DU. The pore water pressure increases in the rainfall season, and this causes the stresses acting on the landslide mass to vary [50]. This causes the effective stress path to match the peak failure line (φp), and the landslide motion starts at this point. The stress path further moves down to residual shear strength (φm) due to the increase in pore water pressure. The strength reduction is stopped as the steady-state shear resistance is achieved [50]. The apparent friction coefficient and the steady-state shear resistance are expressed as:
where τss = steady-state shear stress; σss = steady-state effective normal stress; and tan φa(ss) = steady-state apparent friction coefficient. From Equation (2), the steady-state apparent friction coefficient can be expressed as the total normal stress (σ) based on the soil weight at a depth of the slip surface [50].
τss = σss tan(φm) = σ0 tan φa(ss)
The simulation area was divided into meshes from the digital elevation model in LS-RAPID. The digital elevation model from the Cartosat-I satellite was purchased from the National Remote Sensing Centre (NRSC) a centre of Indian Space Research Organization (ISRO), with a spatial resolution of 10 m, from which elevation values for each mesh are obtained.
Parametric Study of Landslide Using Landslide Depth and Pore Water Pressure Ratio
The parameters used for the simulation are obtained from the Bromhead ring shear test, and other laboratory investigations. Jaky’s formula is used for estimating lateral earth pressure (Sassa 1988). The pore water pressure generation rate (Bss) under dry state and under fully saturated conditions is zero and one, as Sassa et al. [50] reported. The analysis is carried out by defining the source area of the landslide. This is carried out either by fixing the sliding surface of the landslide or by recovery of the landslide source area through deposition or filling of soil. The effects of source area depth and steady-state shear resistance were checked for the landslide simulation. The source area depth was increased to study its effect on the steady-state shear resistance of the soil and pore water pressure ratio. Then the source depth was fixed to check the effect of pore water pressure in the total amount of soil displacement and deposition.
7. Deterministic Analysis of Probable Landslide in Nearby Area Using LS-RAPID
The work was extended to the nearby area to study the unstable region in the same mountain at the coordinates 9°52′40.12″ N and 77°00′ 21.59″ E. The same parameters were used to find the unstable mass. The depth of soil land cover was obtained from soil grid projects [56]. The land cover for the topsoil extends above 1.7 m, and hence, there is a huge probability of landslide when there is excess rainfall in the region. The Upputhode landslide occurred at a pore water ratio of 0.32; therefore, when it is greater, there will be a large probability of landslide occurrence at the observed site. Google Earth photos of 2020 and 2021 of the probable landslide location indicate that the initiation of the source area was at a small depth, and hence, there is again forest cover growing in the area.
8. Threshold Analysis
Threshold Based on Antecedent Rainfall
The rainfall data from previous landslides in the area were collected to develop the rainfall threshold. This threshold value helps to identify the possible landslide indication in the vicinity of the affected area. The maximum intensity or duration required to cause the landslide is called rainfall threshold (RT) [57]. The rainfall threshold can be attained either through empirical or physical models [9,58,59,60,61]. For more accurate values, the rainfall threshold is taken as a local threshold value, as the rainfall occurrence differs from region to region [62,63,64]. An empirical regional model is considered based on the antecedent rainfall to develop the rainfall threshold value in the present study [65,66].
Depending on the landslide types and geo-environmental settings, the antecedent rainfall days may vary from 3 days for a shallow slide to 30 days for a deep-seated landslide [67]. Further studies in a similar type of landslide at Erumakolli tea estate, near Meppadi in Wayanad district, Kerala, revealed that an average antecedent rainfall of 5 days is suitable for analysis [68]. The rainfall data are collected from the rain gauge stations located in the Idukki district, close to the study area. The major and minor landslides near the site were considered for the analysis to determine the rainfall threshold. There were about eighteen instances of major and minor landslides observed in the past 25 years around the site. The average daily rainfall and the antecedent rainfall for all the eighteen landslide events were obtained from the Geological Society of India’s (GSI) reports and studies [69,70,71].
9. Results
9.1. Results of Field and Laboratory Test
9.1.1. Field Test
The multi-channel analysis of surface waves test was carried out in the crown portion of the hill to study the subsurface profiling of the landslide area. The receiver collected the raw seismogram from the source. The offset was placed at a suitable distance to have a proper signal-to-noise ratio and a well-developed seismogram. The maximum array was set at a distance of 24 m, with a 1 m geophone spacing. The source was kept at a distance of 2 m from the first geophone [72]. This helps in the attainment of a good signal-to-noise ratio and subsequently results in the development of fundamental surface waves [39]. The seismogram was obtained from the field and processed in two steps. The data was first muted for any noises developed in the plot. Then the dispersion curve was obtained by carefully plotting the phase velocity and frequency values for the fundamental mode (Figure 8a). The data were inverted using winMASW software (winMASW 2019) to obtain the velocity model. Figure 8b shows the velocity of the layered earth at different depths and shows that the velocity was below 180 m/s up to a depth of 2 m. NEHRP [73] provided the shear wave velocity for various earth layers and classified the soil as shown in Table 1. The soil at 2 to 5 m depth shows a shear wave velocity of 350 m/s, which from the NEHRP site classification was identified as stiff sand. The shear wave velocity of the next earth layer was 600 m/s to a depth of 18 m and was identified as a weathered rock layer from NEHRP [73]. The post-landslide site revealed that the soil had loose boulders in the run-out path, as shown in Figure 3a.
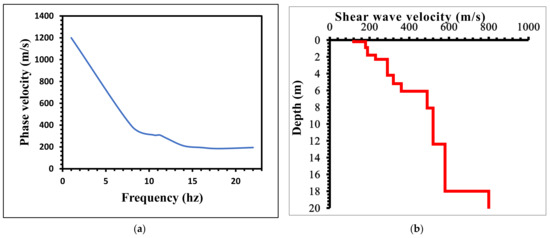
Figure 8.
Multi-channel analysis of surface waves (MASW) test. (a) Dispersion curve, (b) 1D inversion analysis of dispersion curve.

Table 1.
Properties of soil.
9.1.2. Laboratory Test
The laboratory tests were conducted to study the mechanical and engineering properties of the soil. Sedimentation analysis was carried out to identify the amount of clay and silt content. The properties of the soil estimated from lab tests are presented in Table 1. The topsoil is recognized as silty sand (SM), and the bottom soil is classified as poorly graded sand (SP), as per USCS classification [74]. The uniformity co-efficient and co-efficient of curvature for the second layer were 4.8125 and 0.99, respectively. The hydraulic conductivity of the soil sample was evaluated as per the Indian Standard code [75]. The permeability value for the topsoil sample was in the range of 10−7, which is comparatively low. The second layer had a permeability value in the range of 10−4 m/s. The Proctor compaction test was carried out to find out the maximum dry density of the soil. Consolidated drained (CD) direct shear tests on the soil samples were conducted as per [76]. The effective shear strength parameters from the tests are presented in Table 1.
9.1.3. Weathering Characteristics
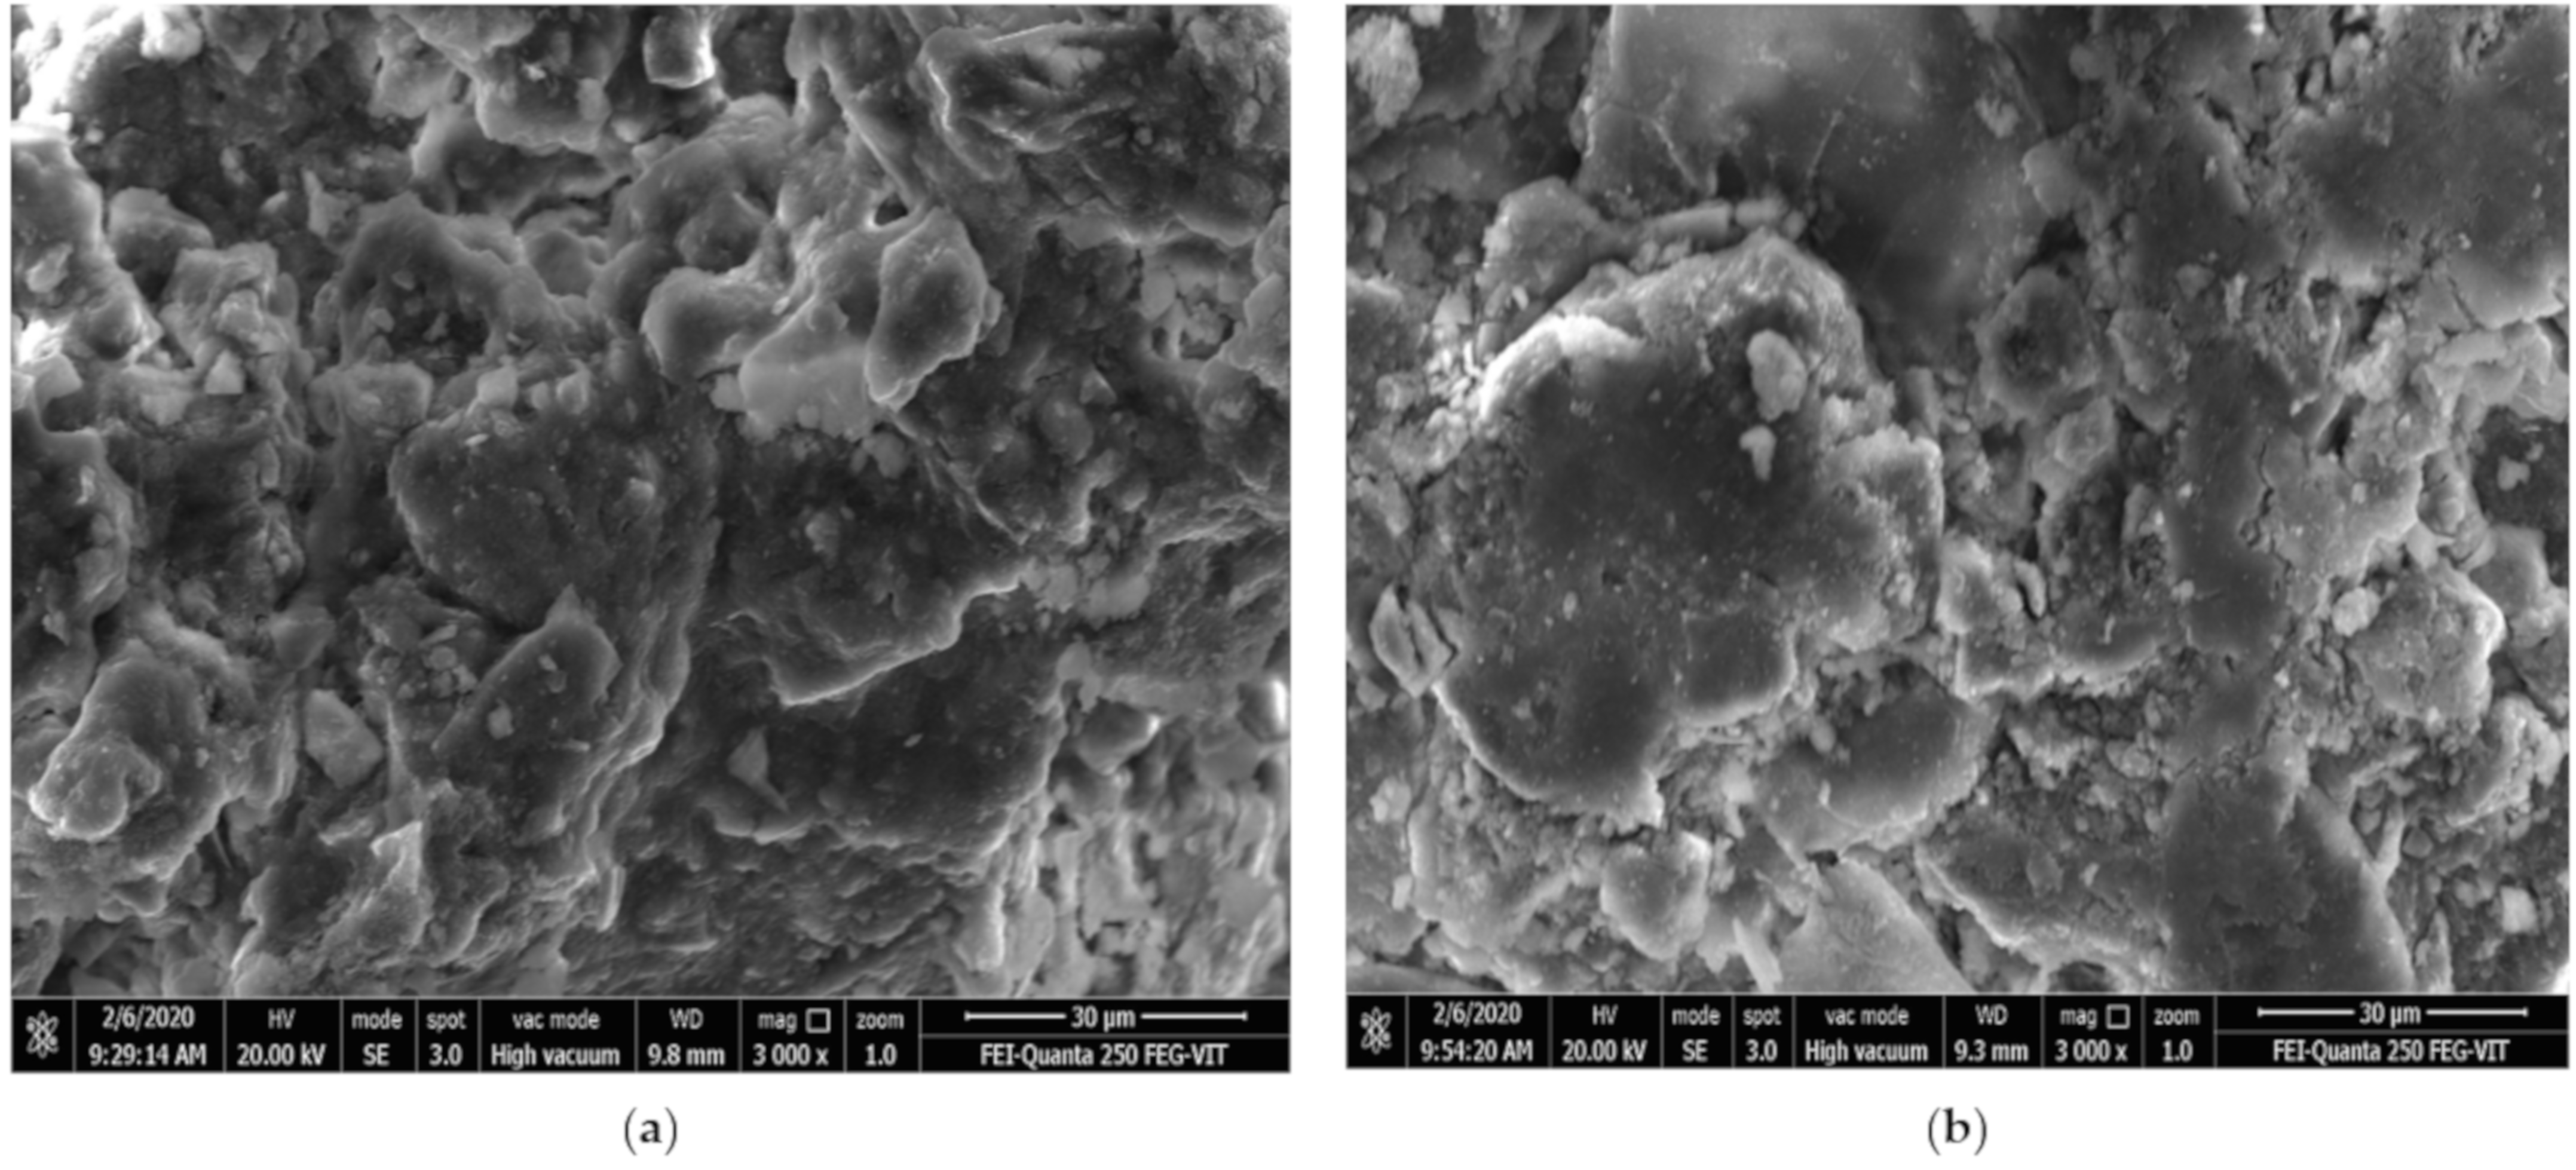
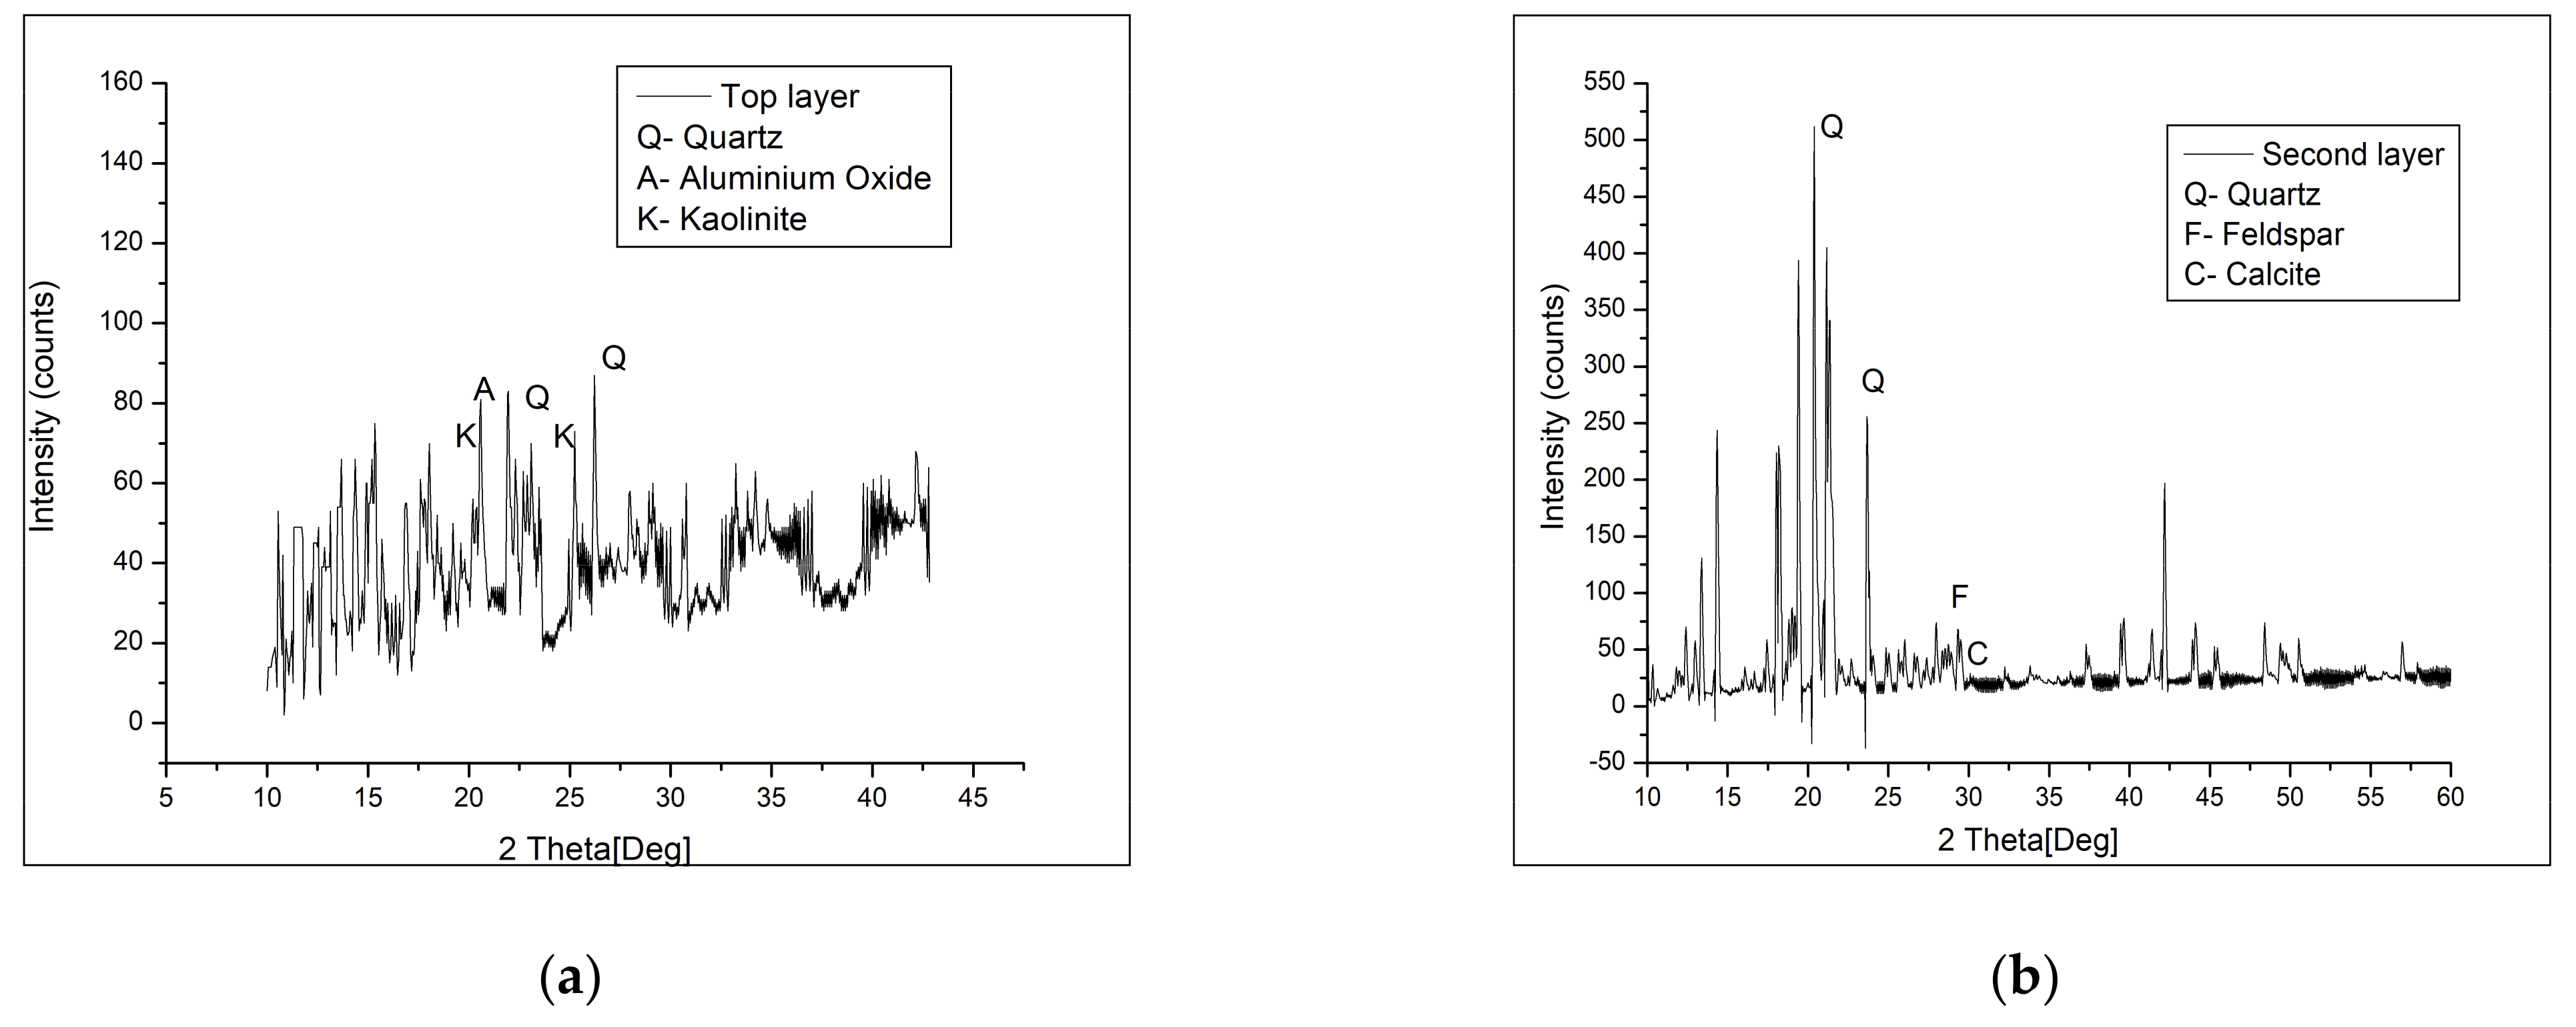
The FE-SEM images indicate the presence of the Kaolinite clay matrix (Al2Si2O5(OH)4) along with quartz minerals (Figure 9a,b). XRD and EDX spectral patterns indicate kaolinite clay mineral presence with quartz and aluminum oxide in the soil (Figure 10a and Figure 11a). This is due to the massive weathering action of the parent biotite gneiss rock. The partially weathered parent granite biotite gneiss rock resulted in the development of grus [77]. Grus is the coarse-grained particles resulting primarily from the disintegration of granite rocks [78]. The grus consisted of a majority of quartz and feldspar minerals [79]. Feldspar paves the way for the increase in aluminum content along with a trace presence of potassium [80]. There is also a trace amount of calcite in the sample, as shown in XRD and EDX images (Figure 10b and Figure 11b).

Figure 9.
Field emission scanning electron microscopy (FE-SEM) images of (a) topsoil, (b) second layer soil.
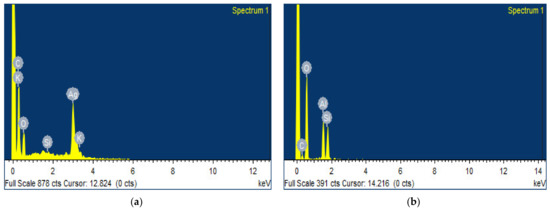
Figure 10.
Energy-dispersive X-ray spectrum for (a) the topsoil layer; (b) the bottom soil layer.

Figure 11.
X-ray diffraction pattern for (a) the topsoil layer; (b) the bottom soil layer.
The bedrock of the site area was classified as hornblende biotite gneiss. Hornblende biotite gneiss is formed by the retrogressive metamorphism of charnockites due to the emplacement of Munnar granite [81]. The general mineral assemblage of this gneiss comprises quartz, K-feldspar, oligoclase, biotite and hornblende
9.2. Results of Ring Shear Test
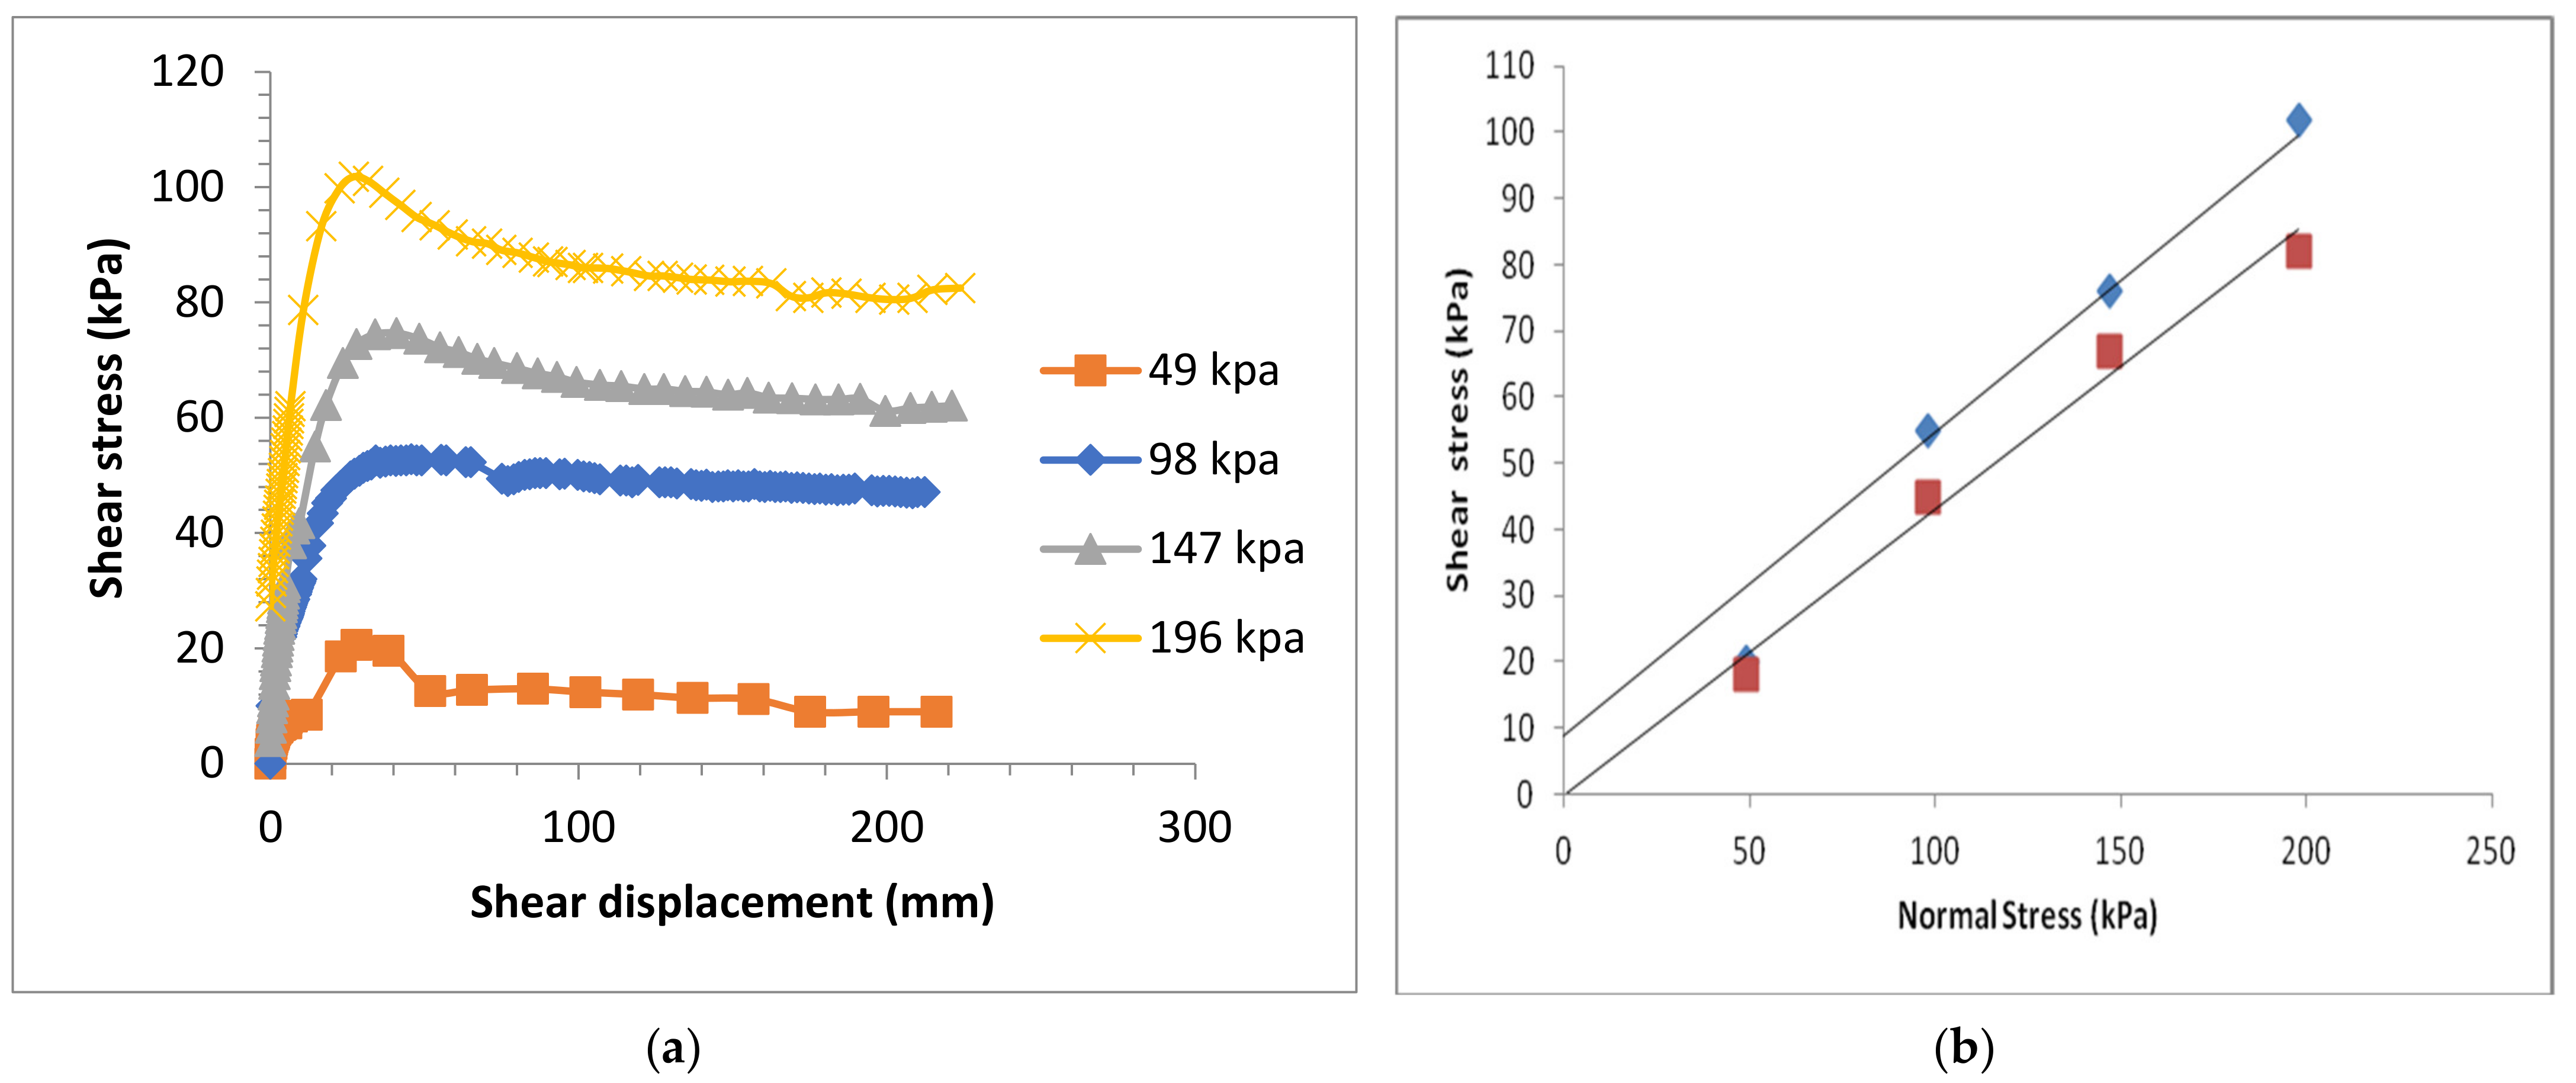
The Ring shear test results are presented in Figure 12. Figure 12a indicates the plot between the shear stress and shear displacement for each normal stress. The failure envelopes of both peak and residual shear resistance for each normal stress are presented in Figure 12b. The peak and residual friction angle (φp and φm) values were estimated as 26° and 21.8°, respectively. The peak cohesion (cp) was found to be 9 kPa. The residual cohesion was usually zero, as the movement of the soil results in the residual failure envelope passing through the origin [82]. The steady-state shear resistance for the soil (τSS) at the slip surface was estimated as 8.75 kPa. The start and end of the strength reduction show the shear displacement values of DL = 28 mm and DU = 190 mm (Figure 12a). Since the tests were conducted under drained conditions, no excess pore water pressure development was observed during shearing [46]. The excess pore water pressure in the simulation model is considered by increasing the pore water pressure to match the measurements in the field in terms of runout distance and depth [50,53,54,55].
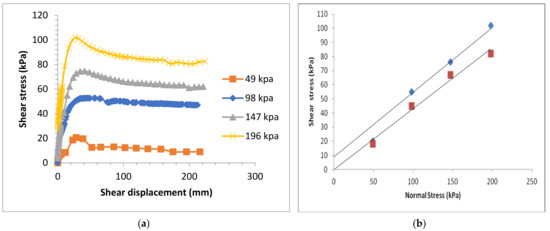
Figure 12.
Estimation of shear strength parameters from drained ring shear test for Upputhode topsoil samples. (a) Shear stress (vs.) shear displacement plot. (b) Peak and residual failure envelope.
9.3. Results of Simulation Analysis
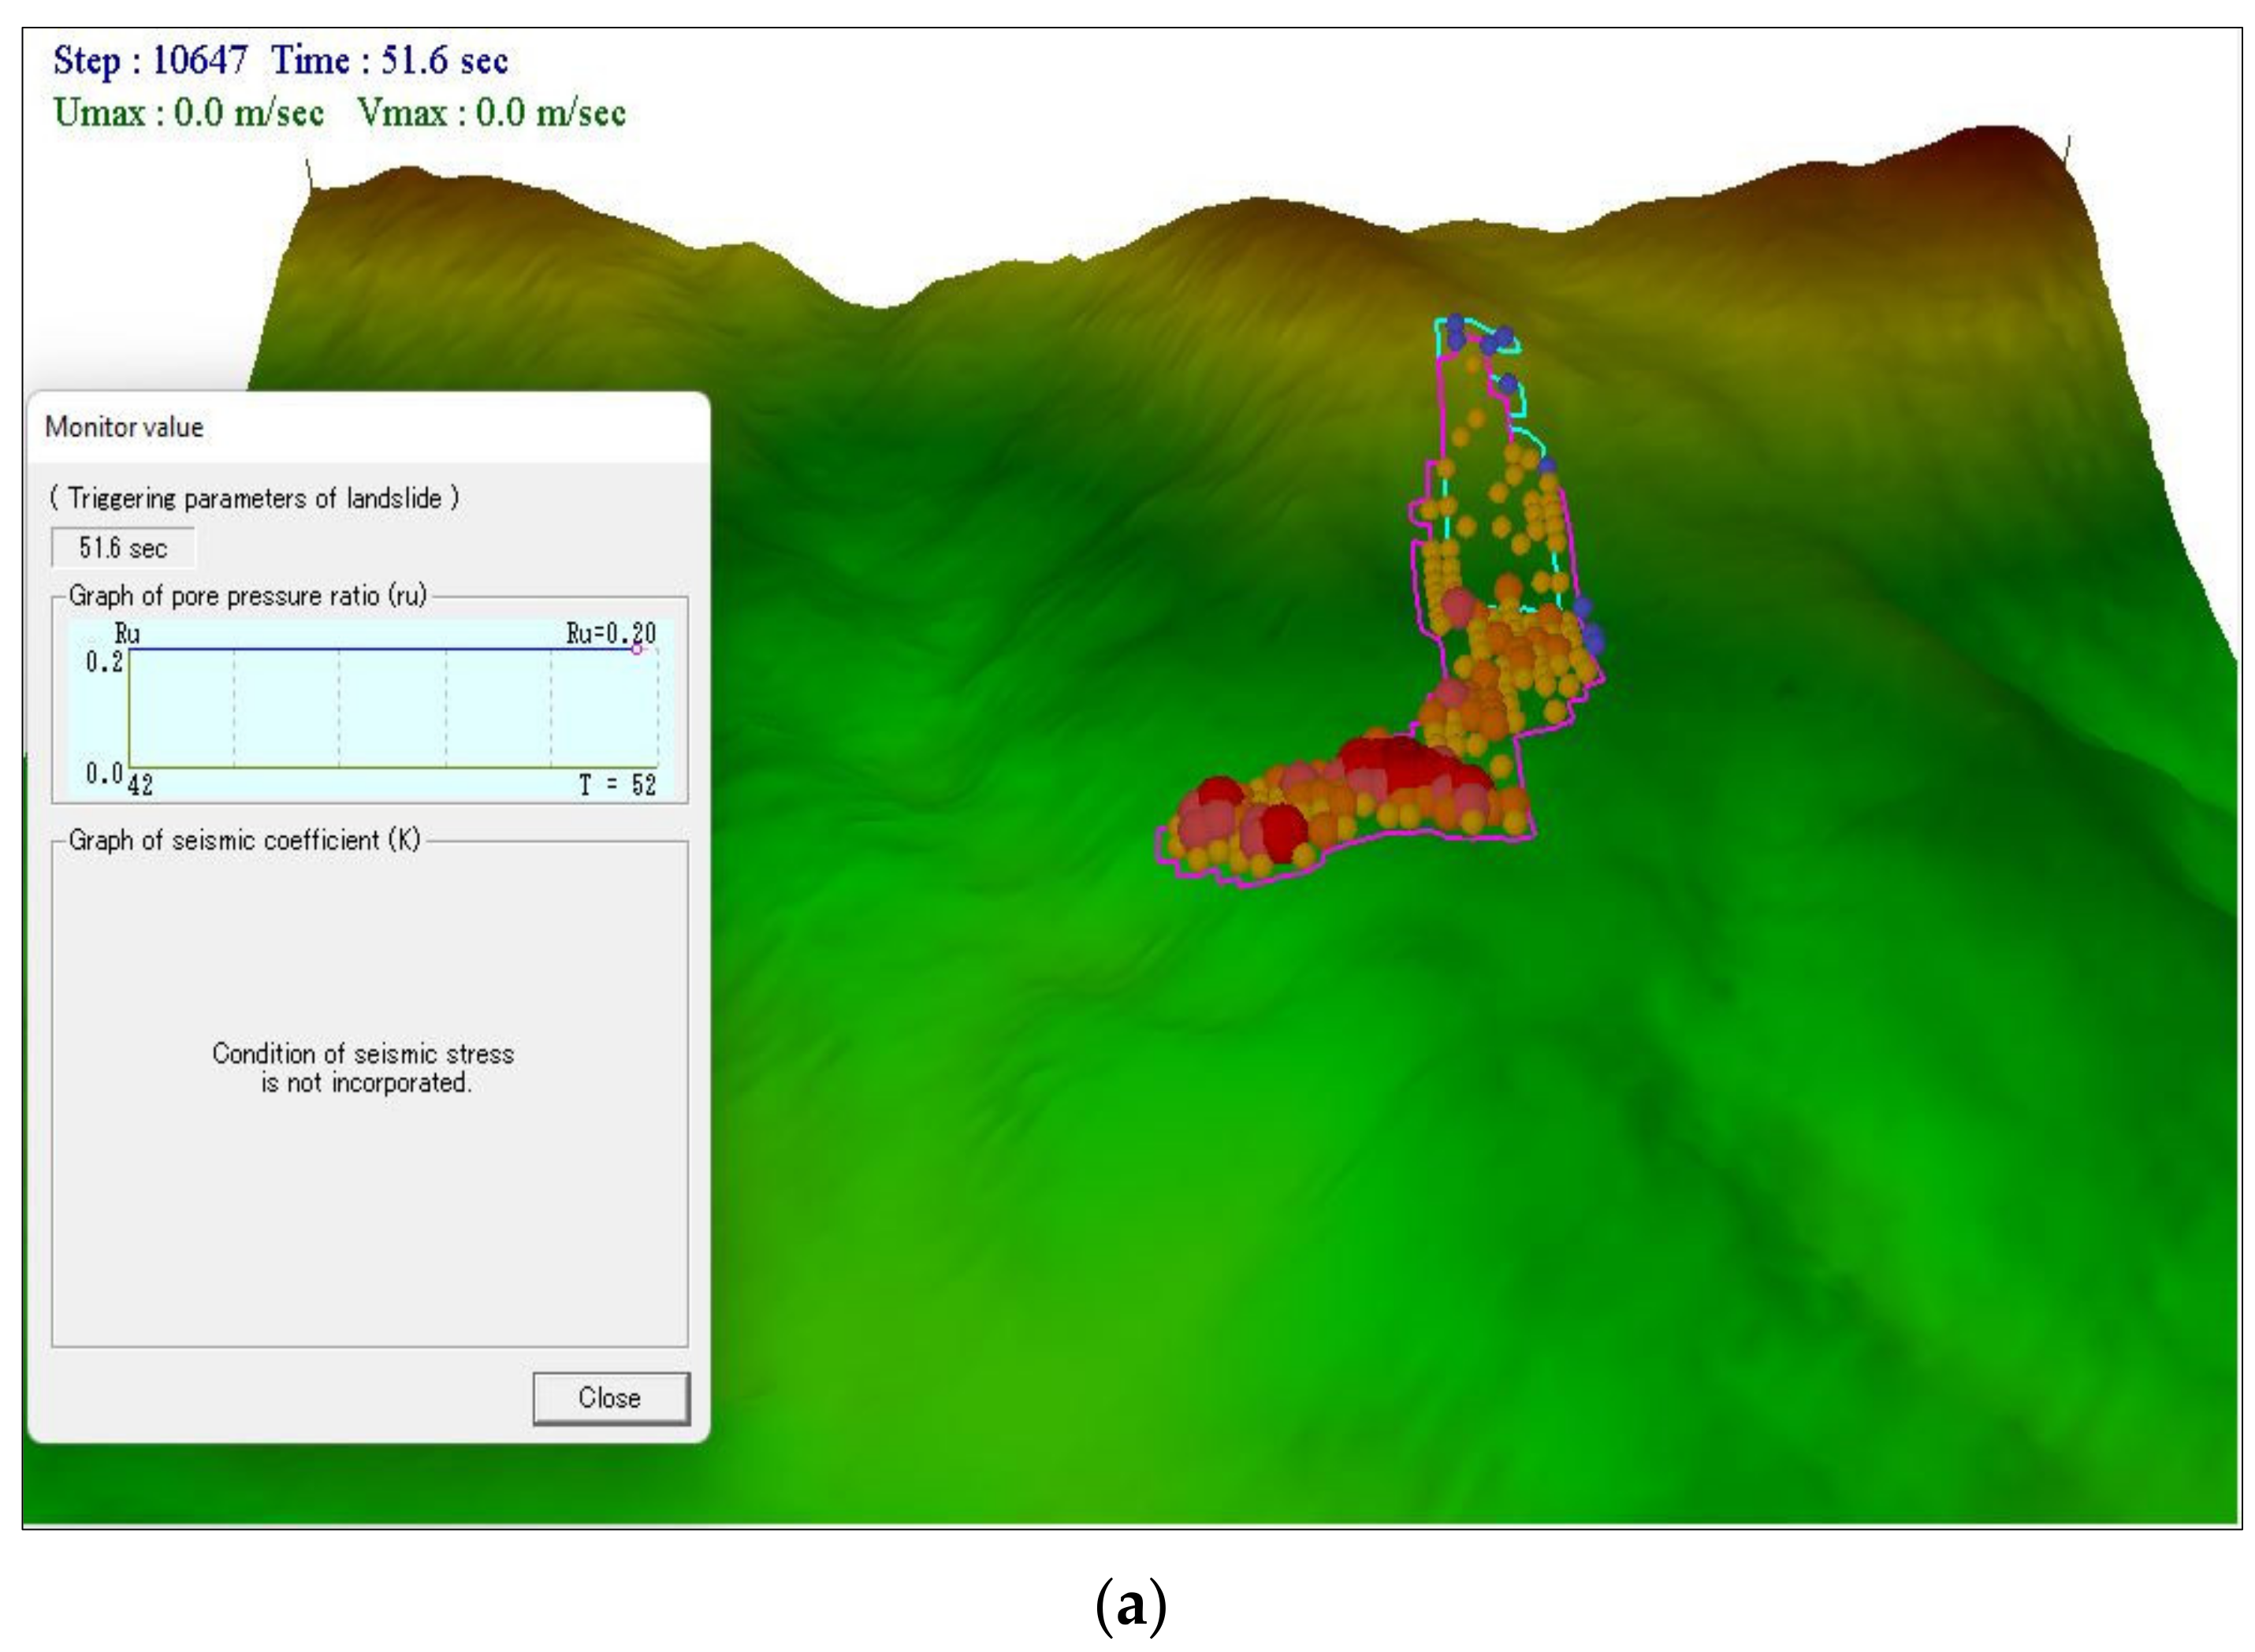
The soil was taken from the slip surface, the depth of the slip surface from the ground surface was calculated to be 2 m, and the initial normal stress was found to be 37.1 kPa (γ × Z, which is 18.55 × 2 = 37.1 kPa). The steady-state residual shear at failure was calculated from Figure 11a, which is 8.75 kpa (Table 2). When increased to a depth of 10 m, the steady-state shear resistance required for the failure of the landslide mass was found to be 15 Kpa. The pore water pressure ratio required for the soil to be unstable was found to be 0.5. As the landslide source depth is known to be 6 m from the site investigation, the depth of soil mass transported is calculated by considering the worst-case scenario. The worst-case scenario was calculated by considering the depth of the water table at the ground surface ru = 0.52 (Zw = Zs, ru = , Zw and Zs are the depth of water and total depth of soil respectively) [7]. The landslide depth was varied by 0.45 m to find the volume of the total displaced soil. The landslide volumes for different depths for the maximum pore water pressure ratio were calculated and are presented in Table 3. The ideal depth of the moving soil mass was found to be 2 m, as shown in Table 3. After fixing the depth, the ru value was varied from 0.2 to study the effect of rainfall on the slope (Figure 13). The volumes of soil displaced for various pore water pressures are shown in Table 3. The boundary of the landslide for ru = 0.32 matched the real landslide boundary, and the volume of soil displaced was found to be 96,621 m3 (Table 3 and Figure 13). Thus, when the pore water pressure ratio reaches a value of 0.32, the soil becomes unstable and about to fail. The excess pore water pressure ratio (ru) was varied up to 0.32, at which the landslide initiation and motion occurred due to the progressive landslide.
Table 2.
Properties used in the simulation.
Table 3.
Landslide volume for various landslide depths and pore water pressure ratios.


Figure 13.
Numerical simulation for fixing the optimum pore water pressure ratio (ru): (a) 0.2ru; (b) 0.3ru; and (c) 0.32ru.
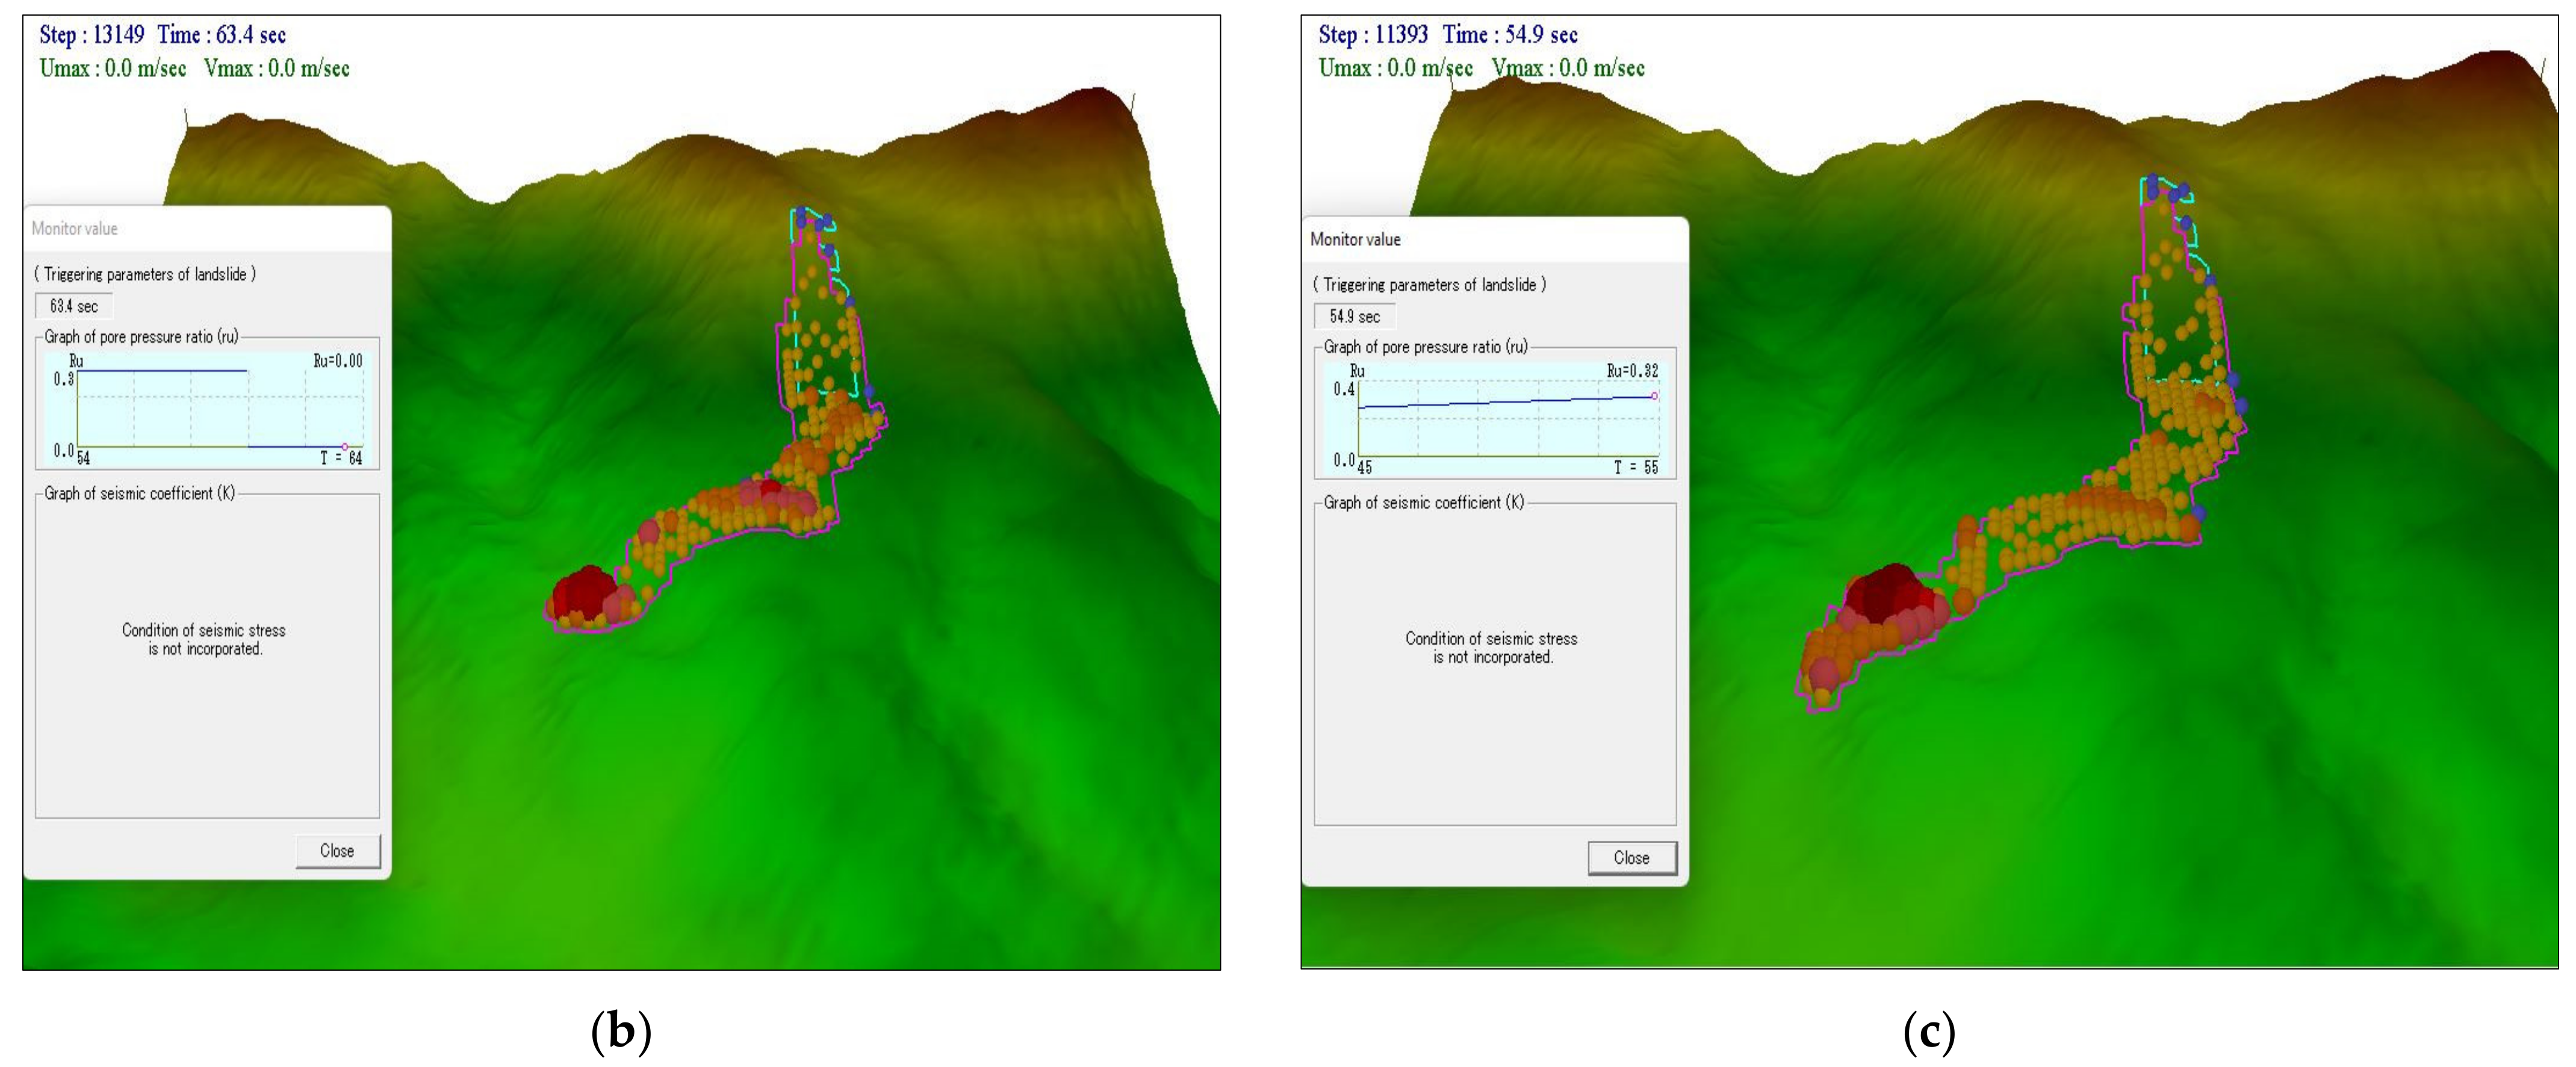
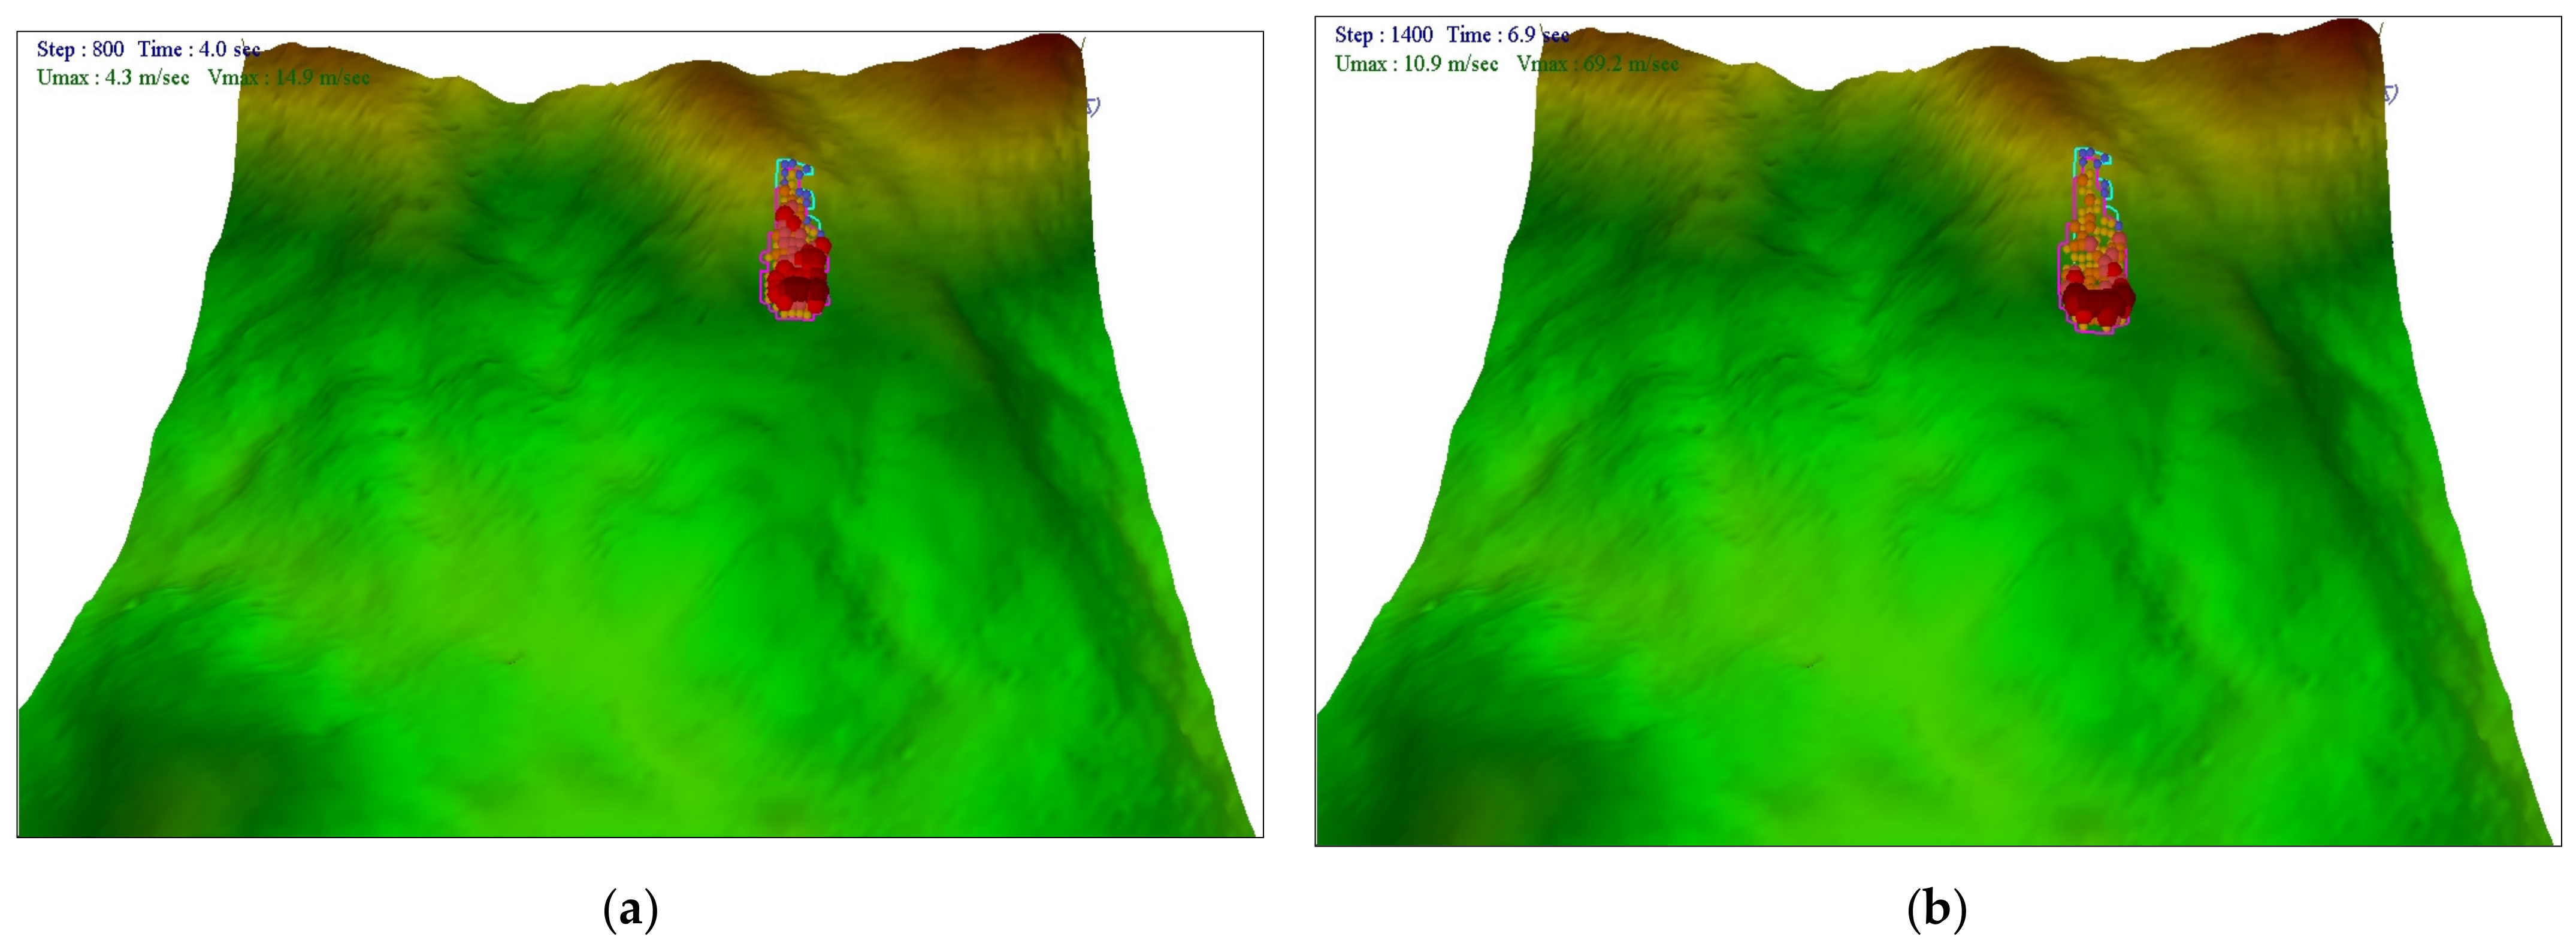
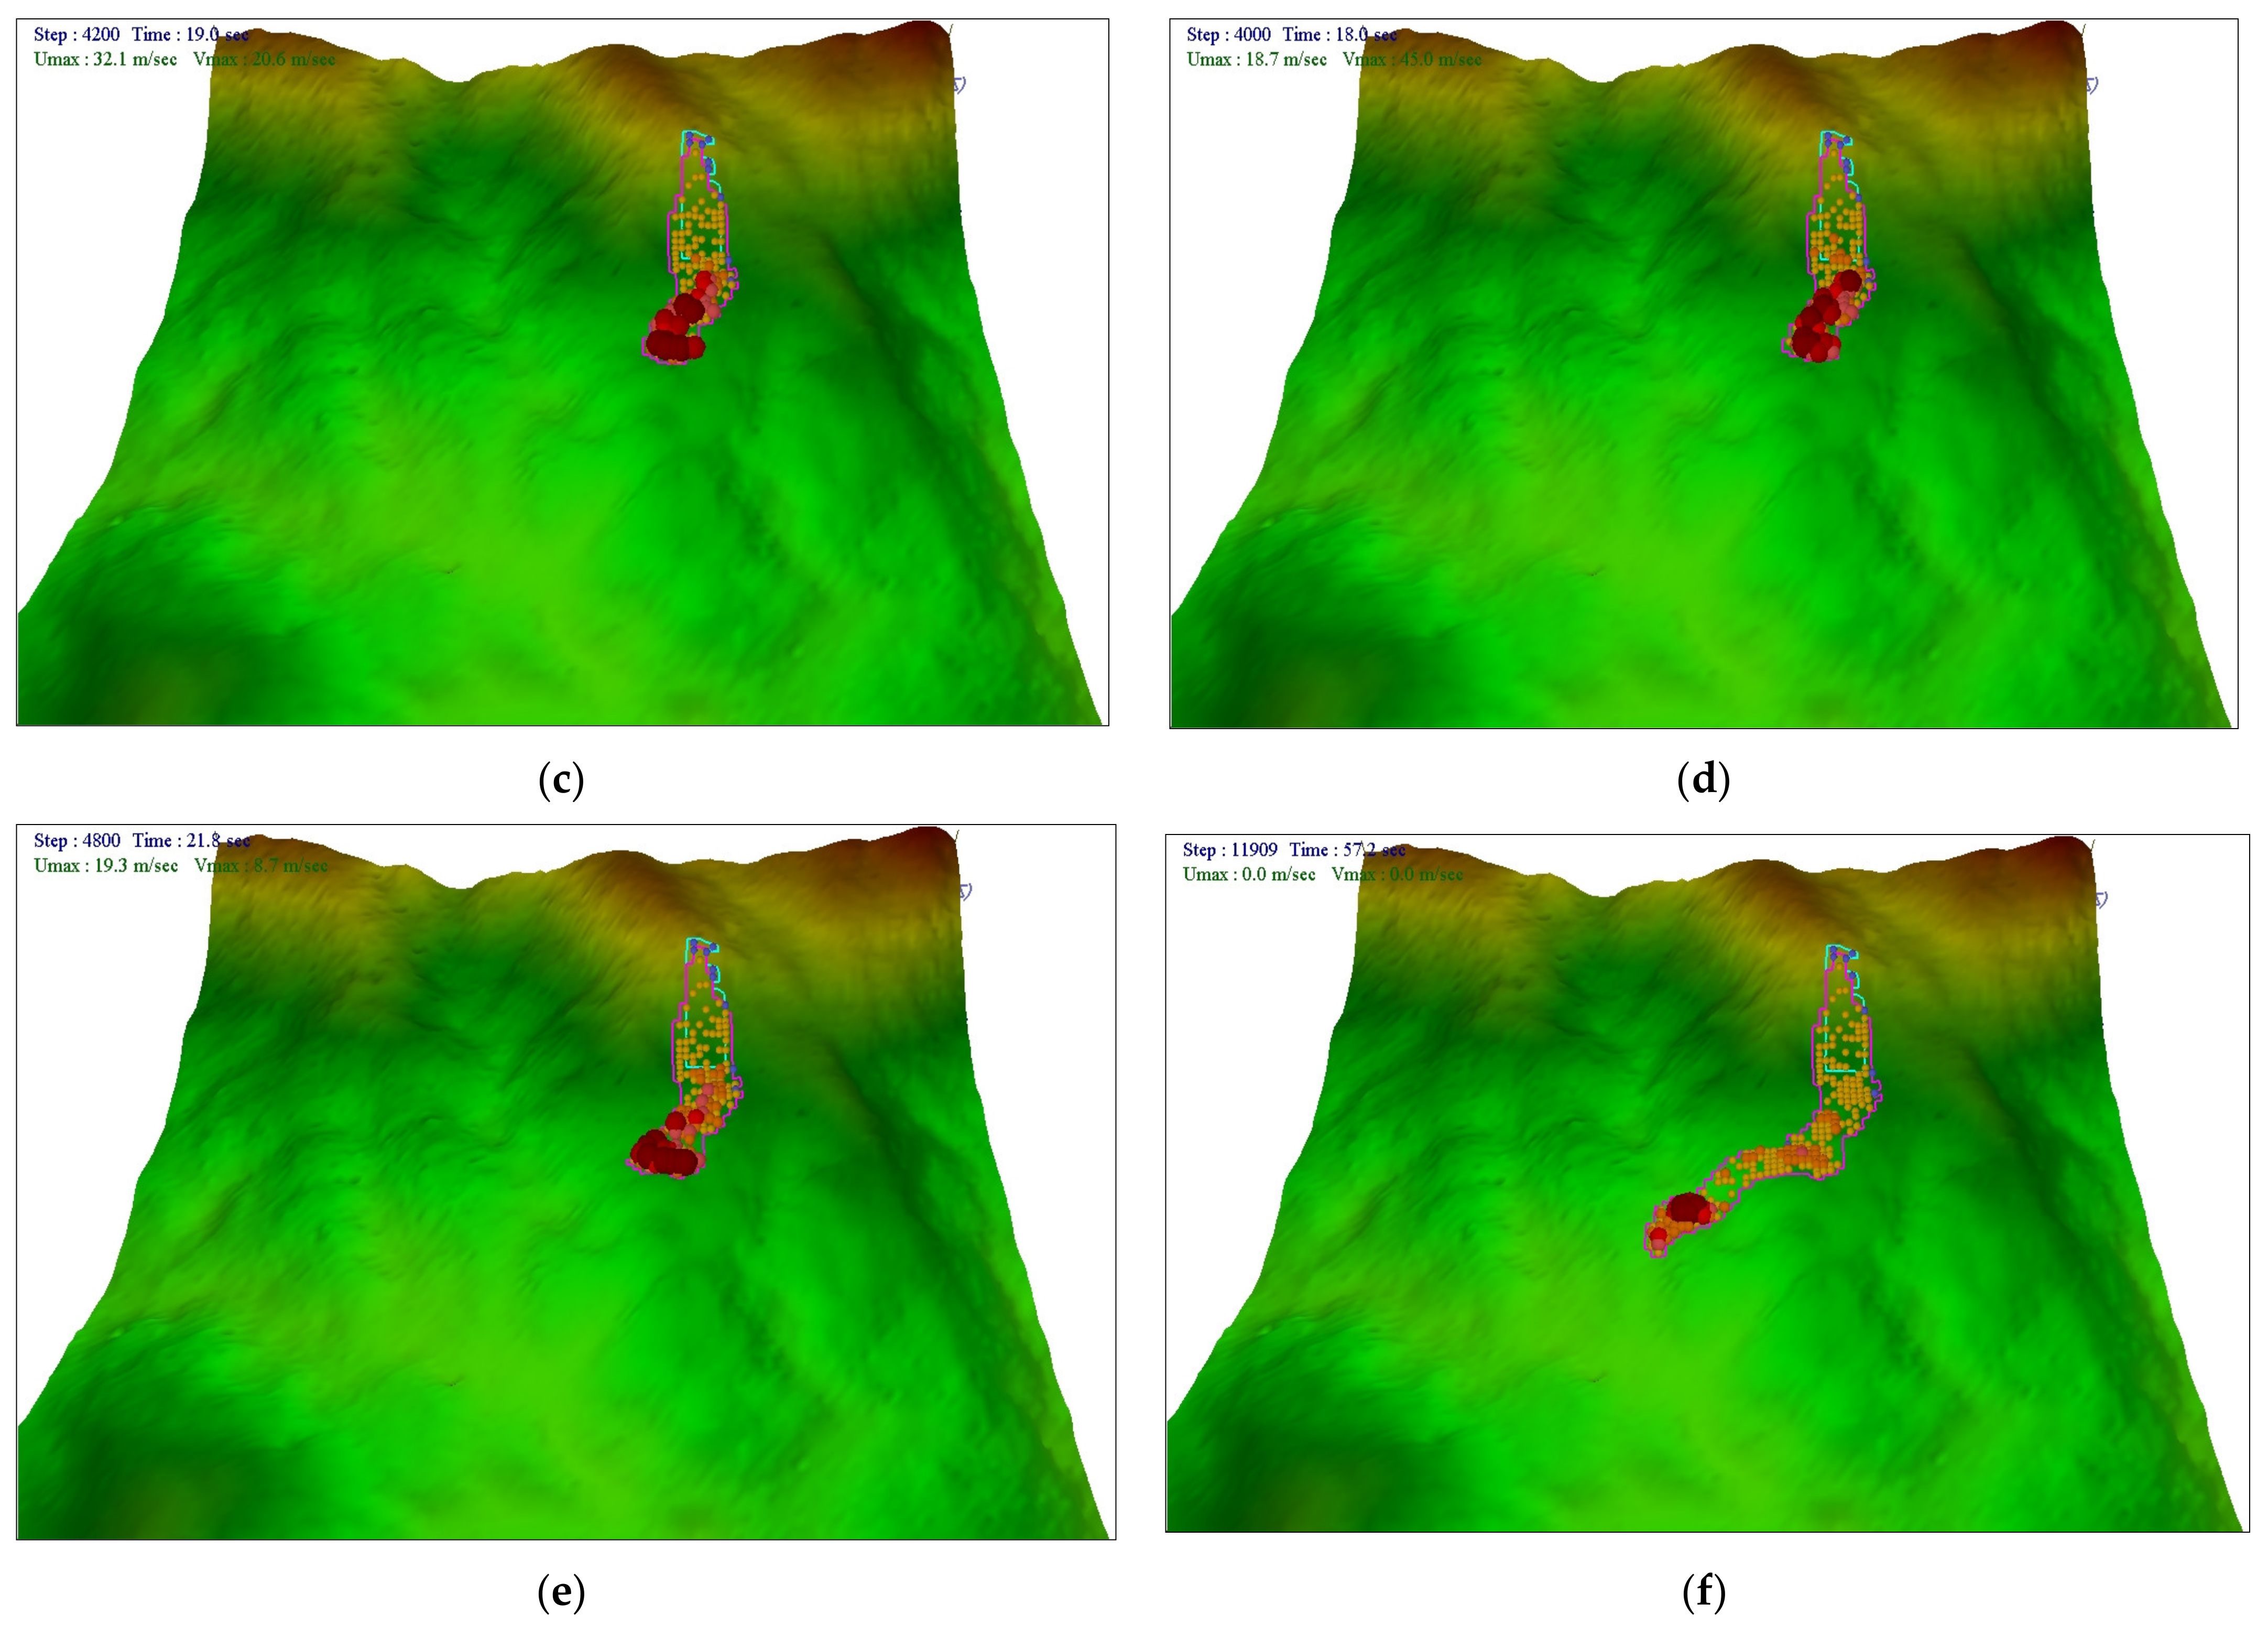
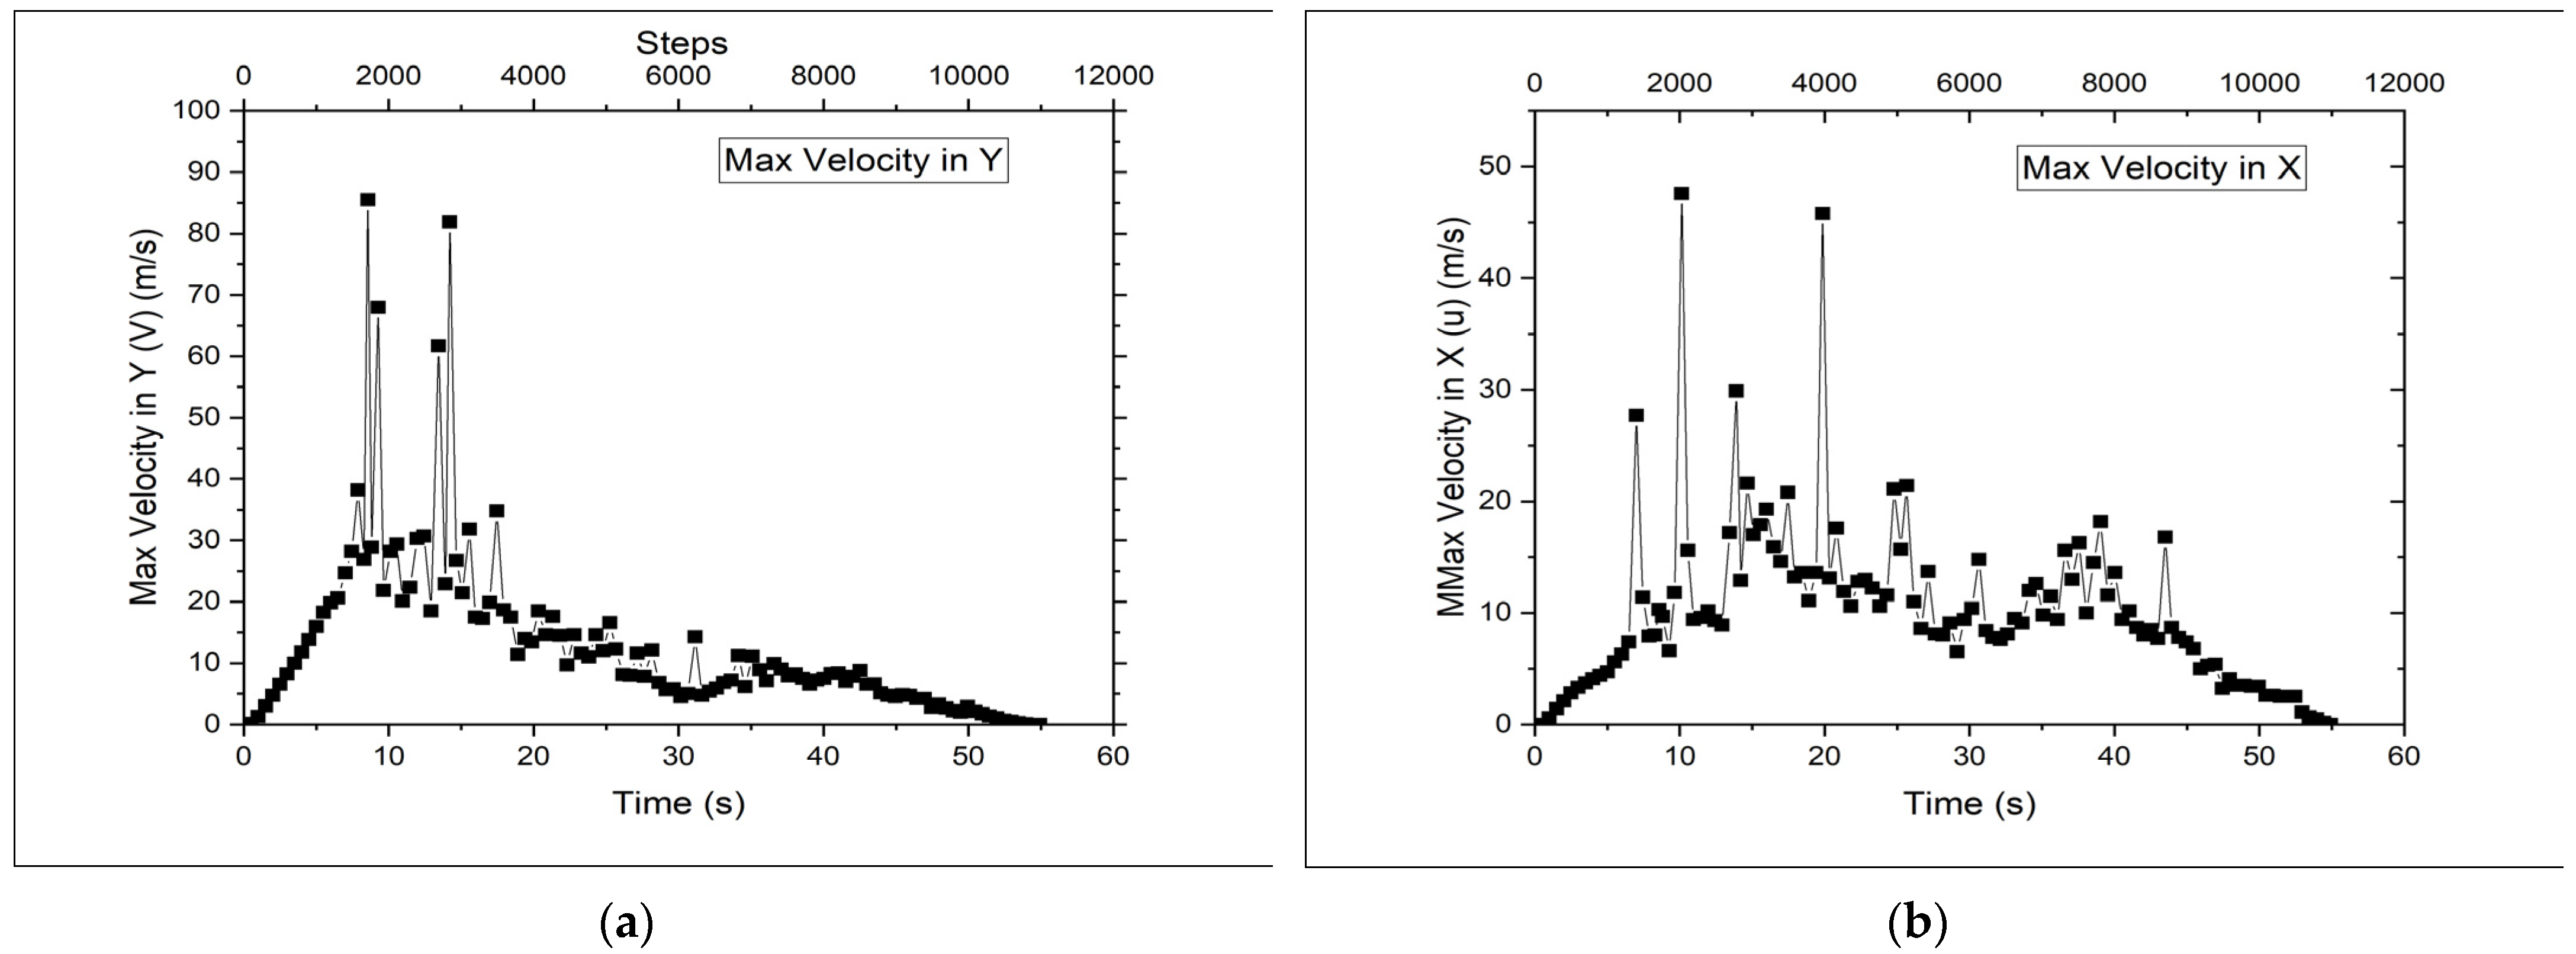
The results of the simulation analysis for ru = 0.32 are shown in Figure 14. Landslide initiation, motion and deposition are depicted in the figure, which shows the presence of an unstable soil mass in the slope (Figure 14a–f). The landslide initiation occurred at 4 s, and the motion started after initiation. This is the point where both strength reduction and shear displacement started to occur (cp and φp changes to cm and φm). After the initiation of the landslide, the unstable soil mass started to move at a velocity of Vmax = 14.9 m/s (Figure 14a). Thus, the strength reduction begins, and the velocity of the unstable mass increases as the slope tends to move downwards (Figure 14b). During this period, the velocity of the landslide mass increased to 32.1 m/s and 45 m/s in the x- and y-directions, respectively (Figure 14c,d). This destroyed the building (Figure 2a). The strength reduction stops as there is no movement observed in the source area, and so the soil develops only deformation with constant shear resistance (Figure 14e). The moving mass velocity reduces, and the soil gets deposited, as shown in Figure 4 and Figure 13f. The runout distance and the simulated landslide boundary matched with the Upputhode landslide (Figure 2a,b). The velocity profile in the x- and y-directions (Figure 15a,b) show a maximum velocity in both profiles at 19 s; this was the main reason for the demolition of the house. The profile in both directions shows that the velocity comes to a halt at 54.9 s, as shown in Figure 2.


Figure 14.
Simulation of Upputhode landslide for finding the mechanisms of (a) landslide initiation, (b–d) landslide motion and (e,f) deposition of debris mass.
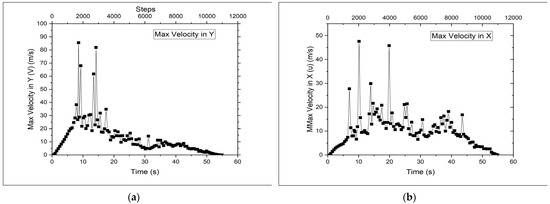
Figure 15.
Average velocity of landslide mass in the (a) vertical direction (y-direction) and (b) horizontal direction (x-direction).
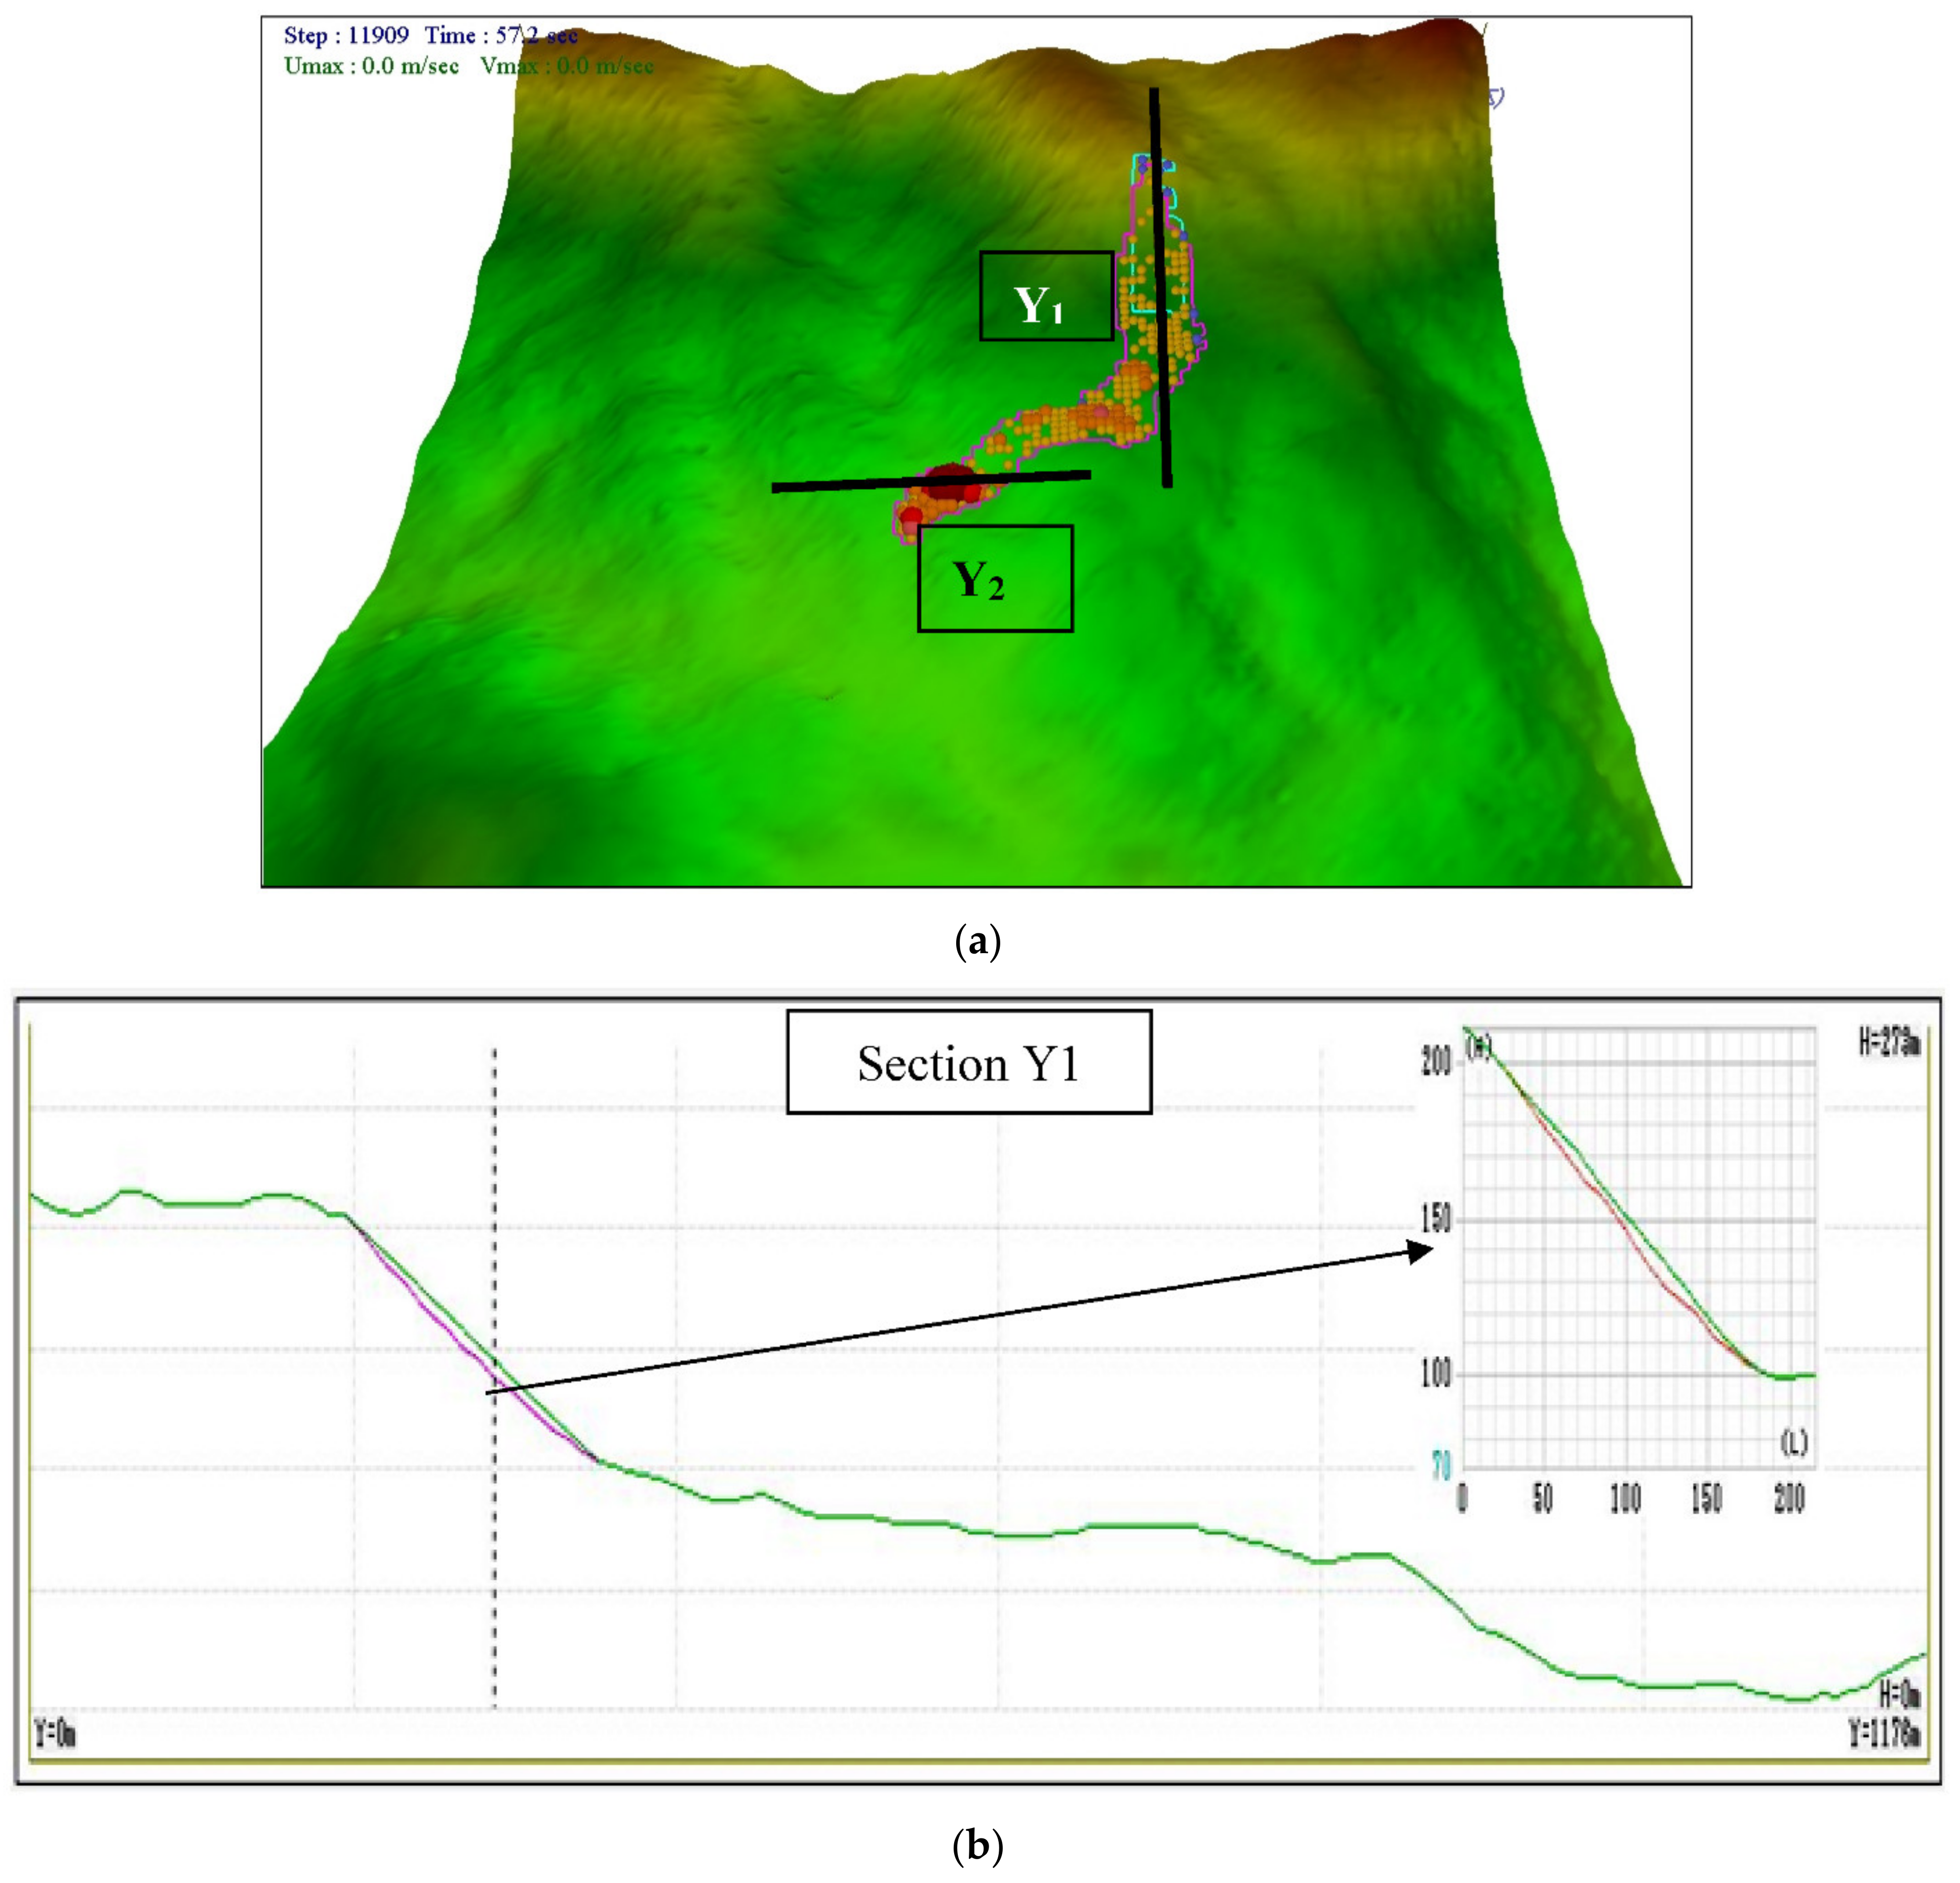
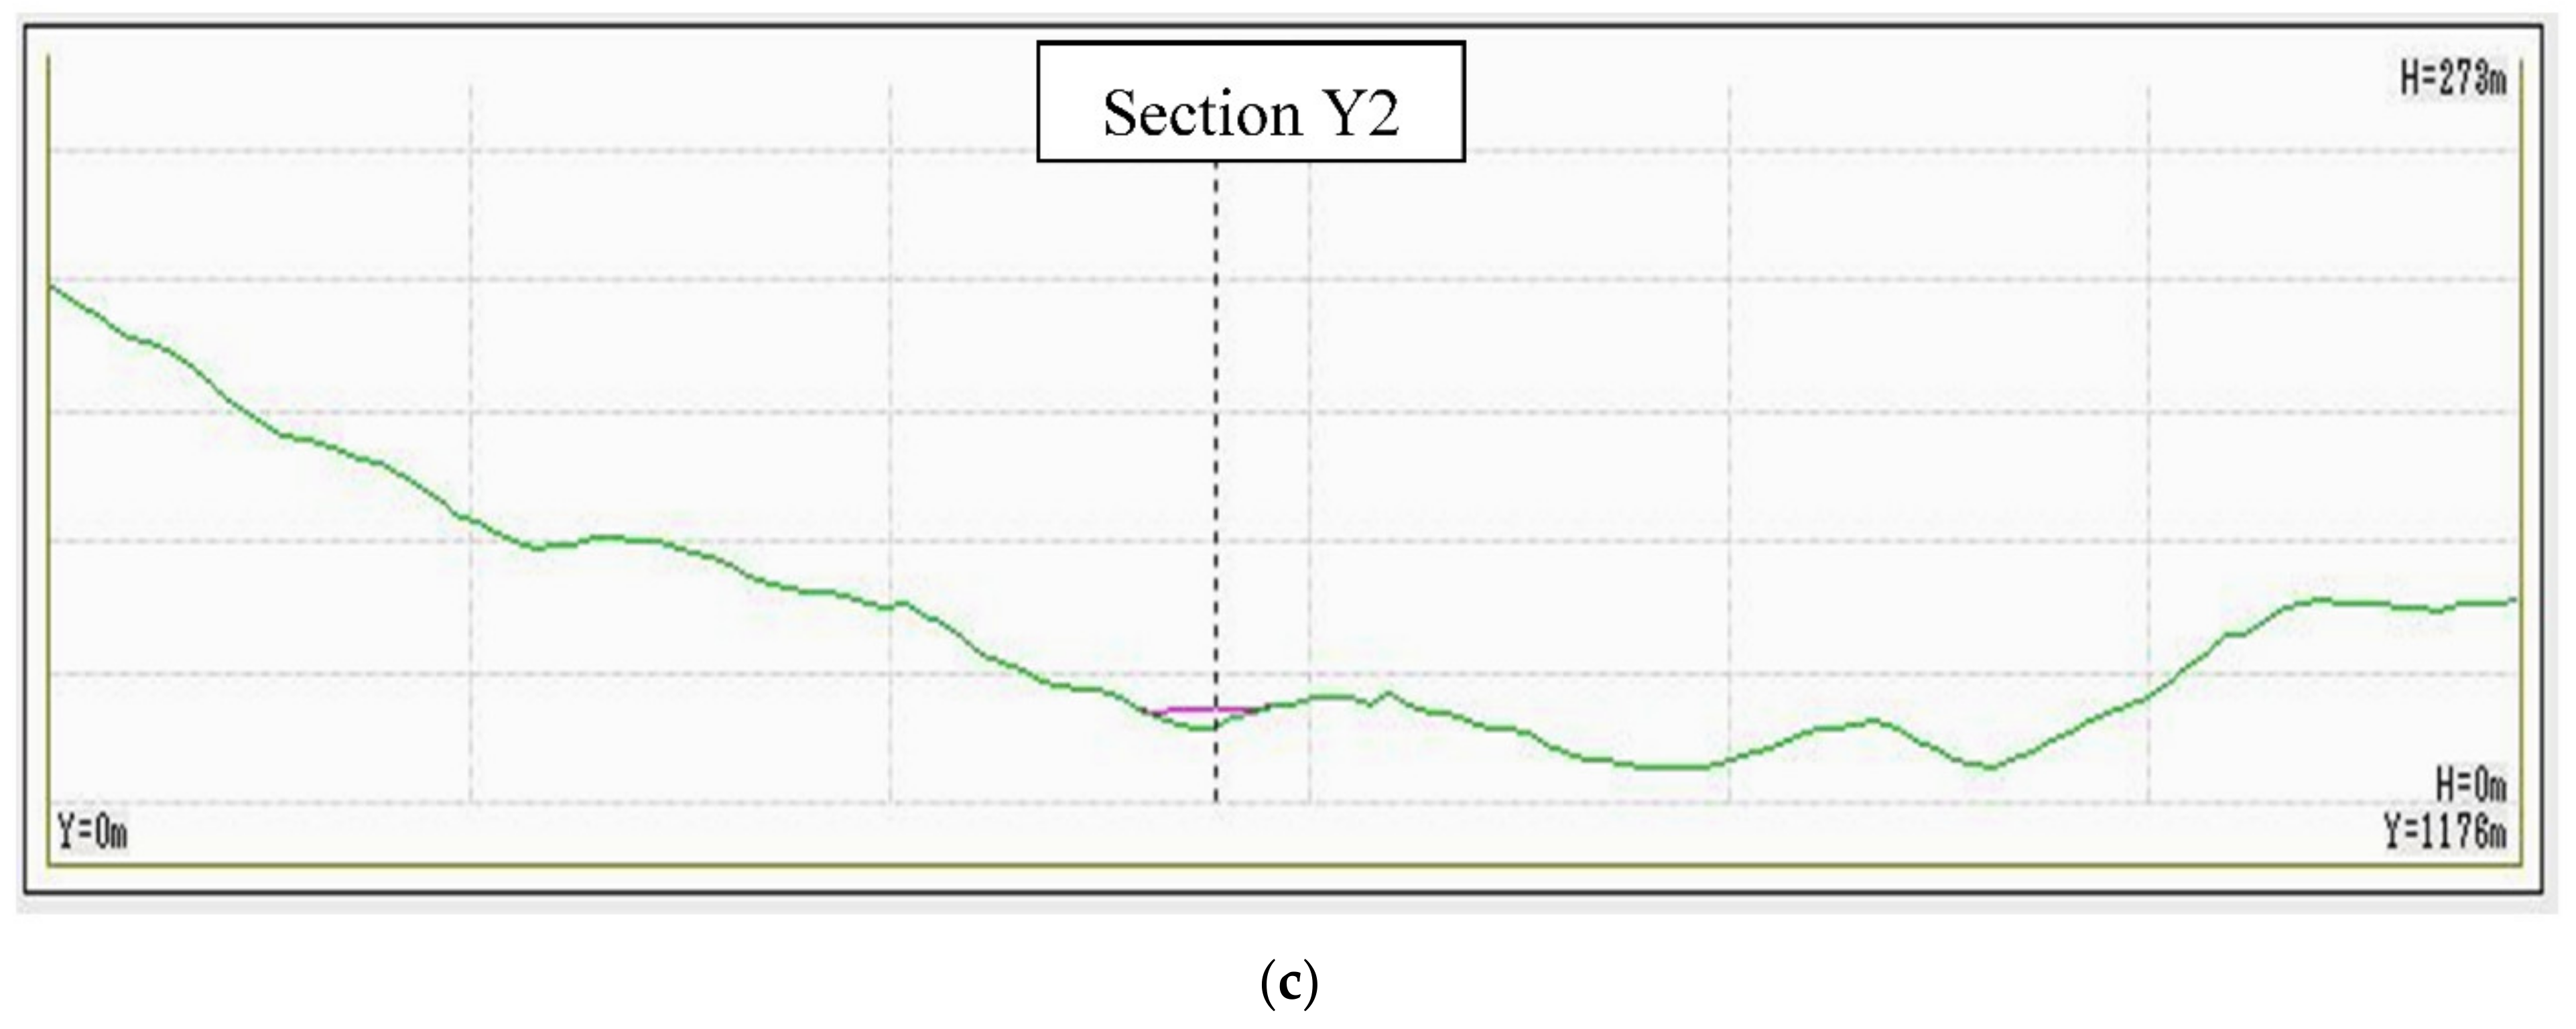
The post-failure longitudinal section of the landslide shows the source area and the depositional area (Figure 16). This can be interpreted with the depth of the source area and the depositional area in the site (Figure 3a). Figure 16a shows the simulated area after the landslide with section y1 at the source area and section y2 at the place of deposition. The landslide depth at the source area during the simulation was found to be 6 m, and this well satisfies the landslide depth in the site (Figure 4b,c). The slope angle seems to be the same after the length of 100 m, and hence, the velocity increases to a greater value after 100 m (Figure 4a,d,e and Figure 16b). The velocity of the landslide mass was found to be greater after a period of 19 s, and the depositional area of the landslide area was found at the bottom with more depositional mass (Figure 16c). The deposited depth of the landslide mass was found to be 7.5 m. There was deposition of the soil mass along the runout (Figure 4a); the values of the deposited depth along the landslide runout are given in Table 4.
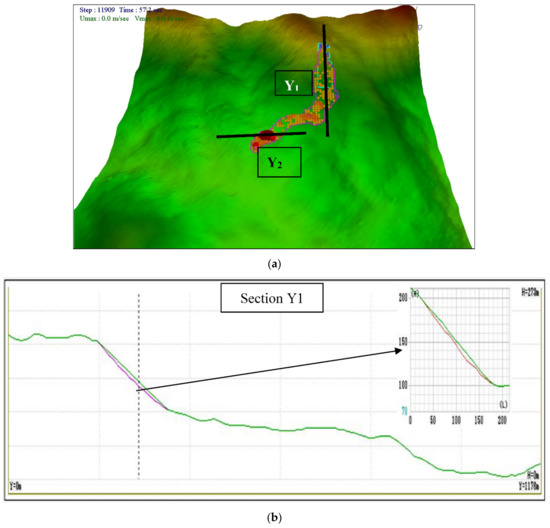
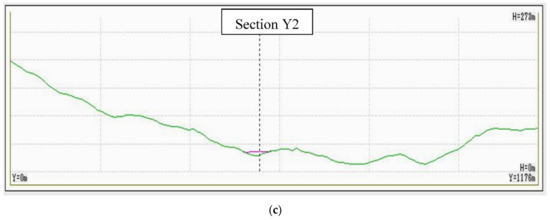
Figure 16.
Simulated landslide topography: (a) view of landslide runout; (b) longitudinal section profile along Y1; (c) longitudinal section profile along Y2.
Table 4.
Effect of soil in building collapse (from LS RAPID).
The effect of the landslide on the building was studied to know the response of the structure that led to the death of four residents in the house. The soil mass deposited in the building area after the landslide was found to be above 1 m, as seen in Figure 4a (Table 4). The maximum velocity of the landslide soil mass on the building and the mass of soil movement from the building location was found to be 400 m/s and 100 m, respectively. The slabs and beams of the building were found several meters away from the original position of the building.
9.4. Deterministic Analysis through LS-RAPID
The source area was analyzed in LS-RAPID with a depth of 5–6 m to see the effect of runout length in the site (Figure 17). It can be concluded that when the depth of the source area is more than 2 m, it can create a huge landslide; this can be justified with numerical simulation using LS-RAPID. The simulation result shows that the runout goes through a populated area in the site. The simulation analysis was carried out using a pore water pressure ratio ranging from 0.35–0.4 to study the effect of a moving landmass in the surrounding environment [54]. The study was carried out with the same landslide runout depth used for the Upputhode landslide (1.7–2 m). The simulation results show that the predicted landslide area reaches the depositional area of the Upputhode landslide. Detailed parametric analysis for the new landslide area was not carried out as it was carried out for the Upputhode landslide study. As shown in Figure 16, the area predicted by LS-RAPID as unstable is of major concern as a shallow landslide of source depth < 1 m had already taken place, and there can be a major landslide event if the pore water pressure ratio crosses above 0.35–0.4.
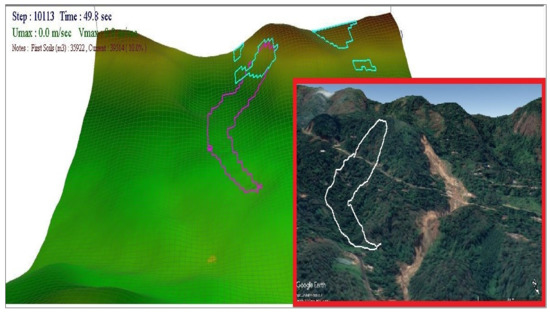
Figure 17.
Simulation results of the probable landslide area analyzed in LS-RAPID.
9.5. Threshold Based on Antecedent Rainfall
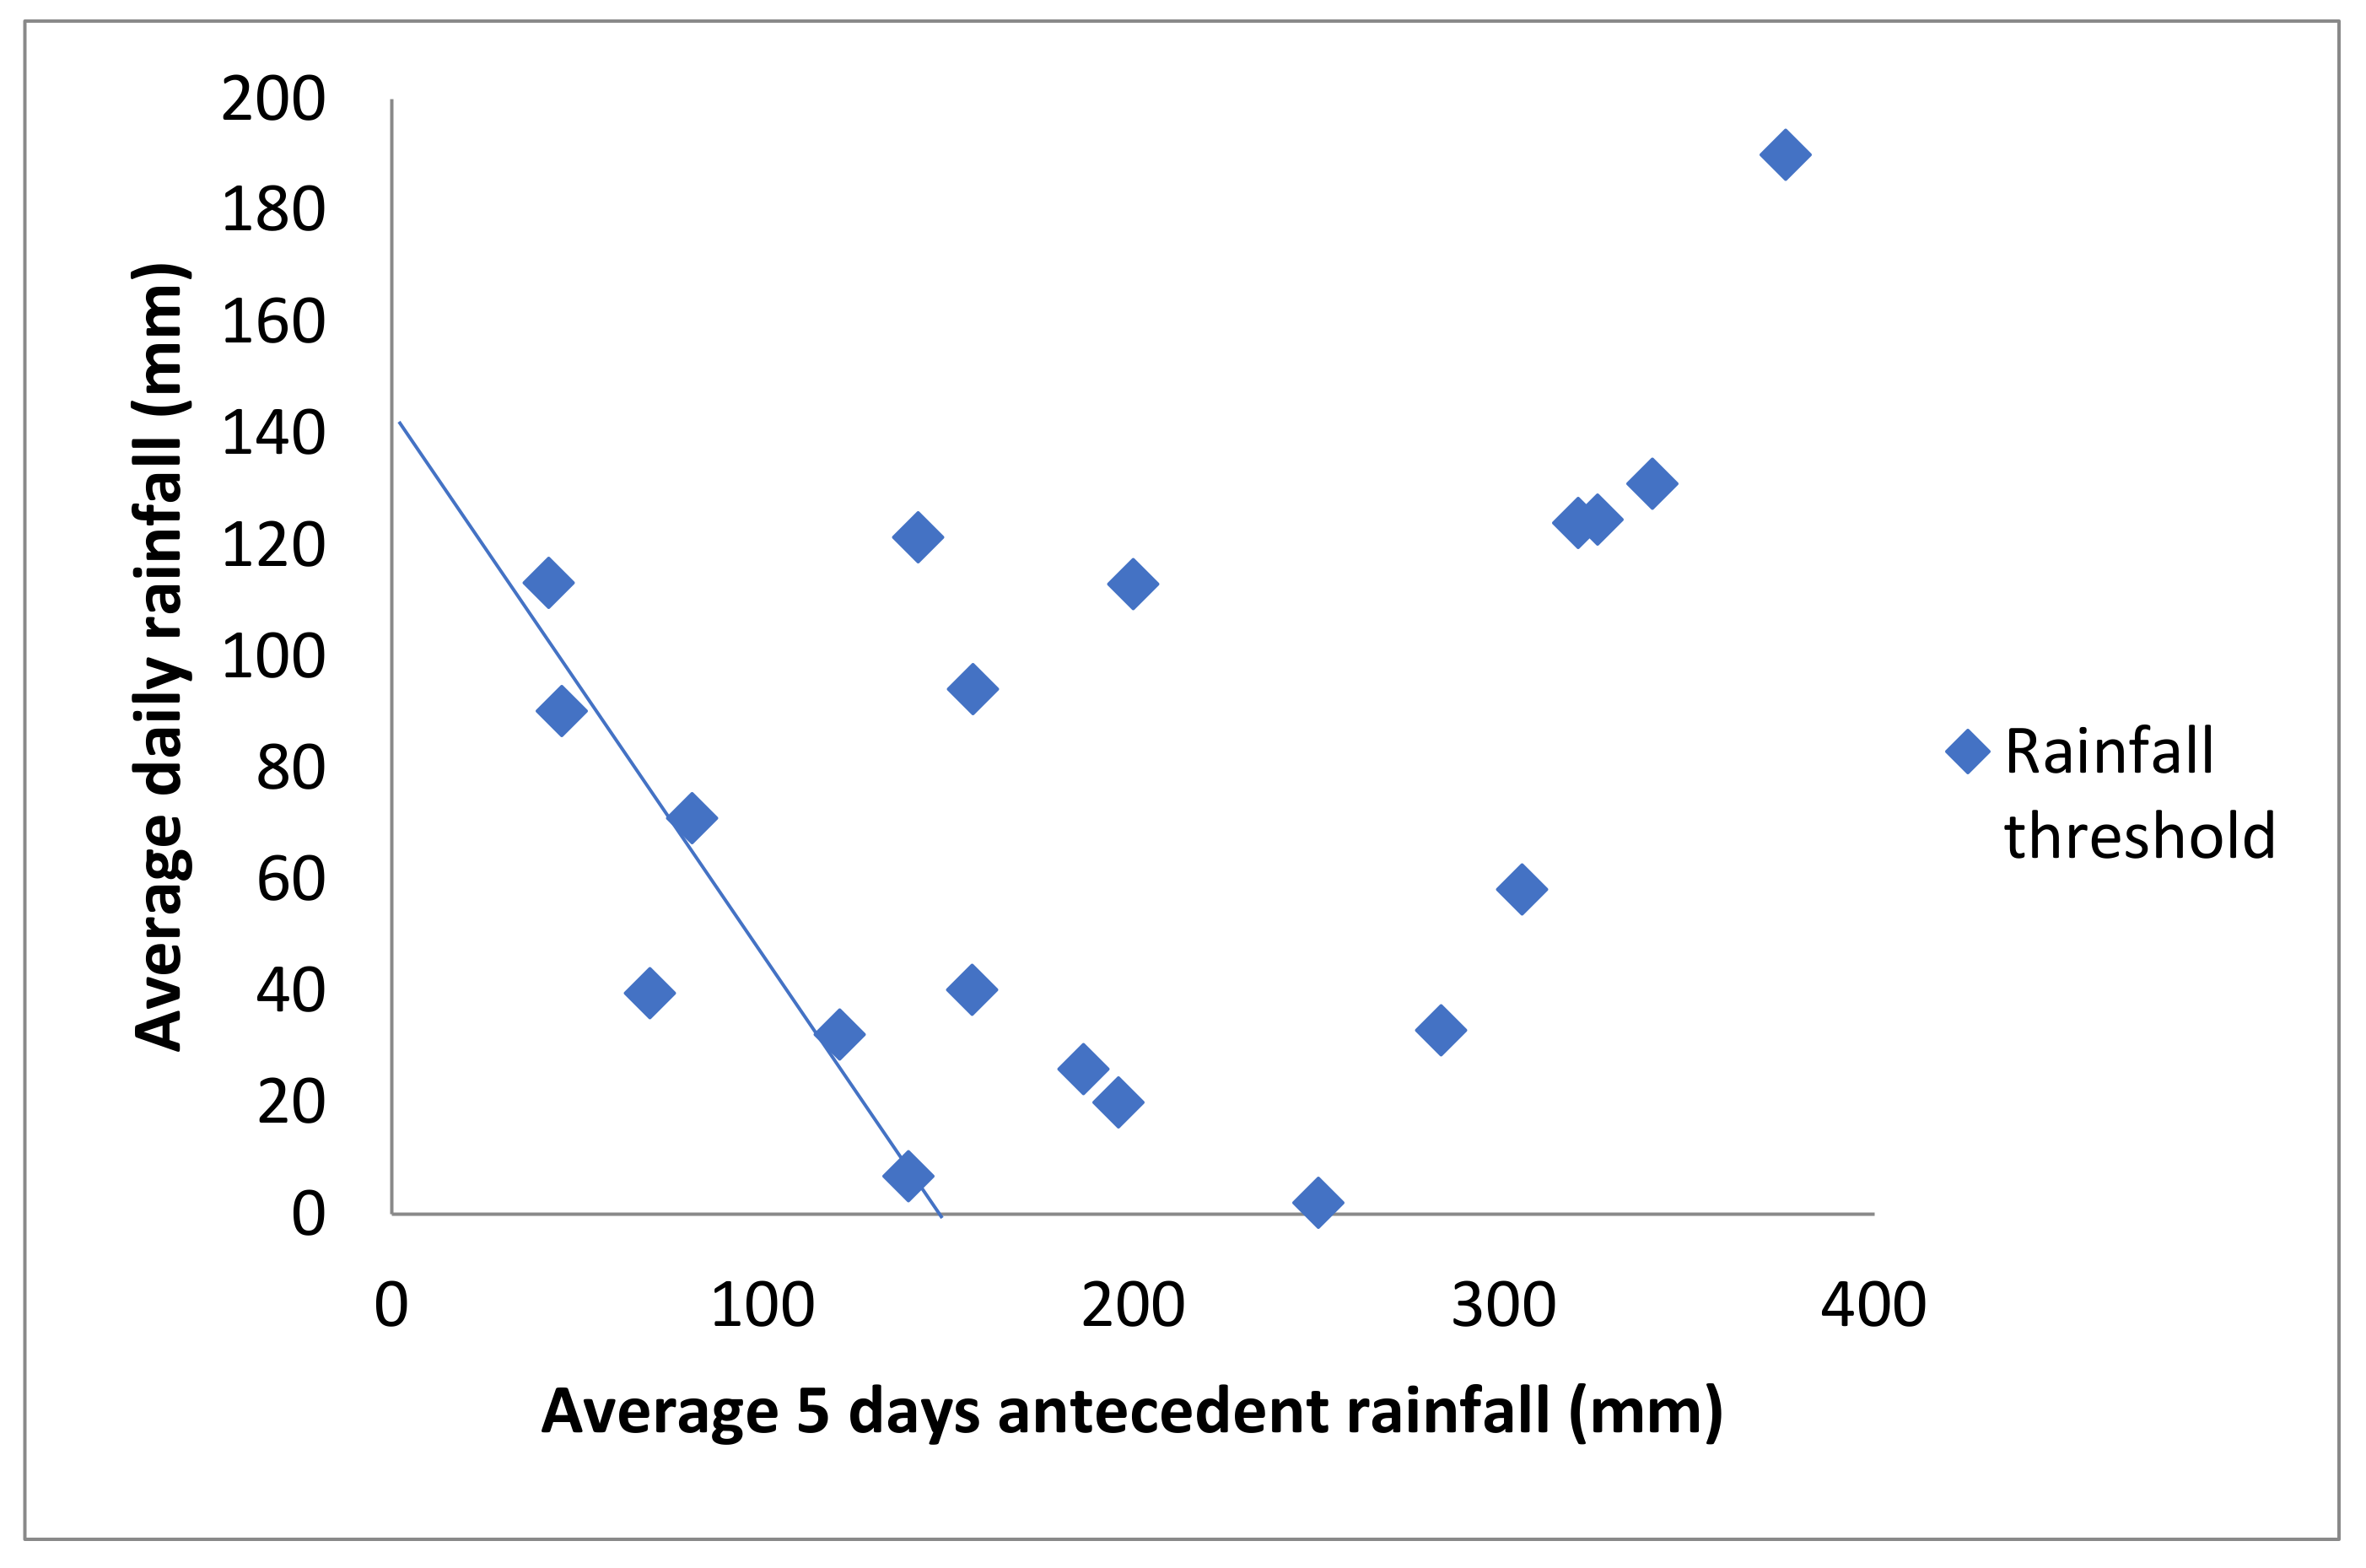
The amount of rainfall on the day of landslide and the corresponding 5-day antecedent rainfall for 18 different landslides were considered in the analysis. The regression analyses were carried out, and the mathematical equation for the rainfall threshold was:
RT = 142 − 0.94R5ad
A total of 18 landslide events up to 2018 were collected near the landslide location to develop the rainfall threshold equation. Since many areas were found to have a 5-day antecedent rainfall of less than 200 mm, the equation that was developed attained a value of 151 mm. The area where the 5-day antecedent rainfall is less is due to the steep slopes in the region [83]. The equation shows that either a high daily rainfall intensity of 142 mm without any antecedent rainfall, or an antecedent rainfall of 151 mm for a cumulative period of 5 days with even continuous normal rainfall can initiate landslide (Figure 18). The present study area experienced very heavy antecedent rainfall (Figure 6b), and this antecedent rainfall is sufficient to trigger the landslide without any amount of daily rainfall.

Figure 18.
Rainfall threshold with average 5-day antecedent rainfall and average daily rainfall.
10. Discussions
Though it is an important case study, the main objective of this work was to find the mechanism of the observed landslide. It was carried out with comprehensive geotechnical characteristics in solving the problem.
The weathering characteristics of the soil were studied to know the effect of weathering on the initiation of landslides. The parent rock was identified as biotite gneiss rock. The weathering action of the parent rock was identified from the microfabric and mineralogical composition of the soil. The field emission scanning electron microscopy (FE-SEM) depicted a highly porous structure due to weathering. The presence of clay minerals and the pore volume decreased with depth. The X-Ray diffraction (XRD) of the topsoil showed the presence of kaolinite clay mineral and aluminum oxide. This is due to the presence of feldspar and gibbsite in the parent rock and the second layer of soil, which, when weathered, is reduced to clay components and aluminum oxide in the soil. When the iron oxide (in the form of hematite (Fe2O3)) reacts with the aluminum oxide in the presence of water for a long period of time, they precipitate into aluminum silicates or ferroaluminum silicates. This crystallized reaction will bind two adjacent particles forming a solidified product in the dry season. This makes the soil stiff in the dry season.
The critical pore water pressure ratio required for the initiation of the landslide is obtained. The progressive failure mechanism involving the three processes of landslide (initiation, runout and deposition) were evaluated. The shear parameters of the soil at the slip surface are investigated to know the peak and residual shear strength in the failure of the soil. The soil loses its shear strength due to the infiltration of water in the soil. The stress path of the soil from the peak to the residual state is initiated by strength reduction. At the end of the residual state, the displacement increases with the steady-state shear strength. The residual shear strength parameters were used for the landslide simulation study.
The effect of soil erosion and deposition in the role of the demolition of the building was studied. The pore water pressure increases to start the landslide initiation, and then the strength reduction of the soil takes place and stops at constant steady-state shear resistance. This helps in studying the effect of soil in the demolition of the building. The velocity with the depth and pore water pressure required for the building demolition is studied.
The parameters used for the study were extended to the nearby landslide location to know the area susceptible to landslide. It was found that a pore water pressure ratio of 0.35–0.4 is required for the initiation of the landslide in the location, and the same steady-state shear resistance was used for the analysis. The details of the velocity pore water pressure ratio and the steady-state shear resistance in the probable site can be used for any remedial measures as there are many houses in the locality.
The local or regional thresholds are more accurate than the global threshold as the rainfall occurrence shall differ from region to region [62,63,64]. As the present study concentrates on the Upputhode landslide and considering the availability of regional-level data (rainfall data and past landslide records), the authors developed a regional rainfall threshold, which gives accurate results that can be used as an early warning for landslide occurrence in the region.
11. Conclusions
The landslide in the Upputhode region caused severe damages to the properties and killed four people. Studies were carried out to find the causes and mechanisms of landslides, and the following conclusions were drawn:
- The subsurface profile of the landslide was studied to know the depth of the soil layers. From the MASW test of geophysical investigation, the subsurface profile of the landslide mass was obtained. The topsoil was classified as silty sand (SM), which is loose and unconsolidated in nature. The second layer was classified as stiff sand (SP). The presence of stiff sand extended up to 6 m, and this can be clearly visible in the after-event of a landslide, as the landslide is classified as a shallow landslide.
- The field investigation and geotechnical characterization of the soil in the slip surface revealed that the soil is silty sand (SM) with a considerable amount of kaolinite clay particles due to the intense weathering of the parent biotite gneiss. The increase in fine soil helps in the increase in pore water pressure in the soil and thereby reduces the matric suction. The X-ray diffraction (XRD) of the topsoil shows the presence of kaolinite clay and aluminum oxide. This is due to the presence of feldspar and gibbsite in the parent rock and the second layer of soil, which, when weathered, is reduced to clay components and aluminum oxide in the soil. When the iron oxide in the form of hematite (Fe2O3) reacts with the aluminum oxide in the presence of water for a long period of time, they precipitate into aluminum silicates or ferroaluminum silicates. This crystallized reaction will bind two adjacent particles, forming a solidified product in the dry season. This makes the soil stiff in the dry season.
- The steady-state shear resistance of this type of soil in the slip surface is estimated from the ring shear test. This helps in modeling the landslide in the region as there will be only deformation observed without any resistance. This was due to an increase in the pore water pressure in the soil due to the prolonged rainfall.
- The numerical simulation of the landslide revealed that the initiation of the landslide was caused by the increase in pore water pressure of the soil. The soil displacement occurs when the pore water pressure attains a point where the strength is reduced to the residual shear strength. The soil slope failed in a pore water pressure ratio of ru = 0.32, and it can be seen from the simulation that the velocity of the soil down the slope is greater due to the steep gradient. The soil was saturated due to the antecedent rainfall along the slope, which caused the soil to slide.
- The probabilistic location of the landslide nearby the Upputhode landslide area was studied through LS-RAPID. It was found that there is an unstable landmass in the location at 9°52′40.12″ N and 77°00′21.59″ E. The probabilistic landslide shows that the run-out length extends to the nearby locality if the pore water pressure ratio crosses 0.35–0.4.
- The rainfall threshold analysis revealed that to trigger the landslide, either a high daily rainfall intensity of 142 mm is required without any antecedent rainfall or a continuous low-intensity rainfall of 151 mm for a cumulative period of 5 days with normal continuous rainfall can initiate landslide.
This paper highlights the importance of the different stages of failure (pre-failure, failure and post-failure) in the analysis of slope stability. The failure mechanism was found to be sand-type flow failure due to an increase in pore water pressure. The progressive failure mechanism of the landslide shows the runout length, velocity, depth of flow and deposition area of the landslide, which helps in finding the behavior of building along the runout length. This can help in the techniques to properly plan to reduce the impact on society. The influence of the climatic interaction in the failure of the slopes was studied, and it was found that the very high to extreme antecedent rainfall can trigger landslides even with normal continuous rainfall.
Author Contributions
Conceptualization, R.A. and S.S.C.; methodology, R.A.; software and validation, R.A.; writing—review and editing, R.A.; supervision and project administration, S.S.C. All authors have read and agreed to the published version of the manuscript.
Funding
This research received no external funding.
Institutional Review Board Statement
Not applicable.
Informed Consent Statement
Not applicable.
Data Availability Statement
Not applicable.
Acknowledgments
The authors thank VIT for providing ‘VIT SEED GRANT’ for carrying out this research work.
Conflicts of Interest
The authors declare no conflict of interest.
References
- Cho, S.E. Stability analysis of unsaturated soil slopes considering water-air flow caused by rainfall infiltration. Eng. Geol. 2016, 211, 184–197. [Google Scholar] [CrossRef]
- Ering, P.; Babu, G.L.S. Probabilistic back analysis of rainfall induced landslide—A case study of Malin landslide, India. Eng. Geol. 2016, 208, 154–164. [Google Scholar] [CrossRef]
- Sun, D.-M.; Li, X.-M.; Feng, P.; Zang, Y.-G. Stability analysis of unsaturated soil slope during rainfall infiltration using coupled liquid-gas-solid three-phase model. Water Sci. Eng. 2016, 9, 183–194. [Google Scholar] [CrossRef]
- Gofar, N.; Rahardjo, H. Saturated and unsaturated stability analysis of slope subjected to rainfall infiltration. MATEC Web Conf. 2017, 101, 5004. [Google Scholar] [CrossRef] [Green Version]
- Yang, K.H.; Uzuoka, R.; Lin, G.L.; Nakai, Y. Coupled hydro-mechanical analysis of two unstable unsaturated slopes subject to rainfall infiltration. Eng. Geol. 2017, 216, 13–30. [Google Scholar] [CrossRef]
- Morgenstern, N.R.; Martin, C.D. Landslides: Seeing the ground. Landslides Eng. Slopes. Past Futur. Two Vol. 2008, 25–46. [Google Scholar] [CrossRef]
- Huy, L.D.; Sassa, K.; Fukuoka, H.; Sato, Y.; Takara, K.; Setiawan, H.; Pham, T.; Dang, K. TXT-tool 3.081-1.4 initiation mechanism of rapid and long run-out landslide and simulation of hiroshima landslide disasters using the integrated simulation model (LS-rapid). In Landslide Dynamics: ISDR-ICL Landslide Interactive Teaching Tools; Springer: Cham, Switzerland , 2018; Volume 2. [Google Scholar]
- Thennavan, E.; Pattukandan Ganapathy, G. Evaluation of landslide hazard and its impacts on hilly environment of the Nilgiris District—A geospatial approach. Geoenviron. Disasters 2020, 7, 1–14. [Google Scholar] [CrossRef]
- Kanungo, D.; Sharma, S. Rainfall thresholds for prediction of shallow landslides around Chamoli-Joshimath region, Garhwal Himalayas. Landslides 2014, 11, 629–638. [Google Scholar] [CrossRef]
- Harilal, G.T.; Madhu, D.; Ramesh, M.V.; Pullarkatt, D. Towards establishing rainfall thresholds for a real-time landslide early warning system in Sikkim, India. Landslides 2019, 16, 2395–2408. [Google Scholar] [CrossRef]
- Senthilkumar, S.; Maji, V.; Chandrasekaran, V. Geotechnical characterization and analysis of rainfall—induced 2009 landslide at Marappalam area of Nilgiris district, Tamil Nadu state, India. Landslides 2017, 14, 1803–1814. [Google Scholar] [CrossRef]
- Vadivel, S.; Sennimalai, C.S. Failure Mechanism of Long-Runout Landslide Triggered by Heavy Rainfall in Achanakkal, Nilgiris, India. J. Geotech. Geoenviron. Eng. 2019, 145, 04019047. [Google Scholar] [CrossRef]
- Yang, H.; Wang, F.; Vilímek, V.; Araiba, K.; Asano, S. Investigation of rainfall-induced shallow landslides on the northeastern rim of Aso caldera, Japan, in July 2012. Geoenviron. Disasters 2015, 2, 1–14. [Google Scholar] [CrossRef] [Green Version]
- Lu, N.; Likos, W.J. Suction stress characteristic curve for unsaturated soil. J. Geotech. Geoenviron. Eng. 2006, 132, 131–142. [Google Scholar] [CrossRef] [Green Version]
- Rahardjo, H.; Kim, Y.; Satyanaga, A. Role of unsaturated soil mechanics in geotechnical engineering. Int. J. Geo-Eng. 2019, 10, 1–23. [Google Scholar] [CrossRef] [Green Version]
- Jeggle, T.; Boggero, M. Post-Disaster Needs Assessment; World Bank: Washington, DC, USA, 2018. [Google Scholar]
- Sajinkumar, K.S.; Asokakumar, M.R.; Sajeev, R.; Venkatraman, N. V A potential headward retreat landslide site at Munnar, Kerala. J. Geol. Soc. India 2017, 89, 183–191. [Google Scholar] [CrossRef]
- Weidner, L.; Oommen, T.; Escobar-Wolf, R.; Sajinkumar, K.S.; Samuel, R.A. Regional-scale back-analysis using TRIGRS: An approach to advance landslide hazard modeling and prediction in sparse data regions. Landslides 2018, 15, 2343–2356. [Google Scholar] [CrossRef]
- Agarwal, R. Original Research Article Lesson Learned from Killer Floods in Kerala: Time for Retrospection. Manag. Econ. Res. J. 2018, 4, 268–280. [Google Scholar] [CrossRef]
- Megha, V.; Joshi, V.; Kakde, N.; Jaybhaye, A.; Dhoble, D. Flood Mapping and Analysis using Sentinel Application Platform (SNAP)-A Case Study of Kerala. Int. J. Res. Eng. Sci. Manag. 2019, 2, 486–488. [Google Scholar]
- Vishnu, C.L.; Sajinkumar, K.S.; Oommen, T.; Coffman, R.A.; Thrivikramji, K.P.; Rani, V.R.; Keerthy, S. Satellite-based assessment of the August 2018 flood in parts of Kerala, India. Geomat. Nat. Hazards Risk 2019, 10, 758–767. [Google Scholar] [CrossRef] [Green Version]
- Sankar, G. Monsoon Fury in Kerala—A Geo-environmental Appraisal. J. Geol. Soc. India 2018, 92, 383–388. [Google Scholar] [CrossRef]
- Mishra, V.; Aaadhar, S.; Shah, H.; Kumar, R.; Pattanaik, D.R.; Tiwari, A.D. The Kerala flood of 2018: Combined impact of extreme rainfall and reservoir storage. Hydrol. Earth Syst. Sci. Discuss. 2018, 2018, 1–13. [Google Scholar] [CrossRef] [Green Version]
- Krishnanath, R.; Sreenath, G.; Biju Abraham, P. Seepage Modeling and Slope Stability analysis at Devikulam–Manale profile along Kumili–Munnar road in Idukki district, Kerala. Indian Jour. Environ. Pollut. 1996, 3, 215–220. [Google Scholar]
- Krishnanath, R.; Sreekumar, S. Identification and location of slide prone areas in certain hard rock profiles of Western Ghats. Indian Geotech. J. 1996, 26, 407–416. [Google Scholar]
- Sreekumar, S.; Krishnanath, R. Stability of Lateritic profiles in parts of Western Ghats, India. In Landslides Research: Theory and Practice; Thomas Telford Ltd.: London, UK, 2000; Volume 3, pp. 1395–1400. [Google Scholar]
- Sankar, S. Investigation of landslides in Kodaranji and Kurachundu; Calicut District Report CESS: Trivandrum, India, 1991. [Google Scholar]
- Sajinkumar, K.S.; Anbazhagan, S.; Pradeepkumar, A.P.; Rani, V.R. Weathering and landslide occurrences in parts of Western Ghats, Kerala. J. Geol. Soc. India 2011, 78, 249–257. [Google Scholar] [CrossRef]
- Sajinkumar, K.S. Geoinformatics in Landslide Risk Assessment and Management in Parts of Western Ghats, Central Kerala, South India. Unpubl. Ph. D. Thesis, Indian Institute of Technology (IIT), Mumbai, India, 2005. [Google Scholar]
- Biju Abraham, P.; Shaji, E. Landslide hazard zonation in and around Thodupuzha-Idukki-Munnar road, Idukki district, Kerala: A geospatial approach. J. Geol. Soc. India 2013, 82, 649–656. [Google Scholar] [CrossRef]
- Sajinkumar, K.S.; Anbazhagan, S. Geomorphic appraisal of landslides on the windward slope of Western Ghats, southern India. Nat. Hazards 2015, 75, 953–973. [Google Scholar] [CrossRef]
- Hungr, O.; Leroueil, S.; Picarelli, L. The Varnes classification of landslide types, an update. Landslides 2014, 11, 167–194. [Google Scholar] [CrossRef]
- IndianExpress News. Available online: http://www.Indianexpress.in (accessed on 15 August 2018).
- Kuriakose, S.L.; Jetten, V.G.; van Westen, C.J.; Sankar, G.; van Beek, L.P.H. Pore Water Pressure as a Trigger of Shallow Landslides in the Western Ghats of Kerala, India: Some Preliminary Observations from an Experimental Catchment. Phys. Geogr. 2008, 29, 374–386. [Google Scholar] [CrossRef]
- India Meteorological Department. IMD Malappuram District Rainfall for Last Five Years. Available online: http://www.imd.gov.in/section/hydro/distrainfall/webrain/Kerala/Malappuram (accessed on 15 August 2018).
- Park, C.B.; Miller, R.D.; Xia, J. Multichannel analysis of surface waves. Geophysics 1999, 64, 800–808. [Google Scholar] [CrossRef] [Green Version]
- Dey, A. Subsurface Profiling using MASW: Aspects of Data Acquisition, Dispersion and Inversion Analyses 1 Introduction 2 Multichannel Analysis of Surface waves. In Proceedings of the QIP-STC on Challenges and Recent Advances in Geotechnical Engineering Research and Practices, Guwahati, India, 13 March 2015; pp. 1–17. [Google Scholar]
- Regmi, A.D.; Yoshida, K.; Dhital, M.R.; Devkota, K. Effect of rock weathering, clay mineralogy, and geological structures in the formation of large landslide, a case study from Dumre Besei landslide, Lesser Himalaya Nepal. Landslides 2013, 10, 1–13. [Google Scholar] [CrossRef] [Green Version]
- Park, C.B.; Miller, R.D.; Miura, H. Optimum field parameters of an MASW survey. Proc. Soc. Explor. Geophys. Jpn. Tokyo 2002, 22, 23. [Google Scholar]
- Foti, S.; Hollender, F.; Garofalo, F.; Albarello, D.; Asten, M.; Bard, P.Y.; Comina, C.; Cornou, C.; Cox, B.; Di Giulio, G.; et al. Guidelines for the good practice of surface wave analysis: A product of the InterPACIFIC project. Bull. Earthq. Eng. 2018, 16, 2367–2420. [Google Scholar] [CrossRef]
- Park, C.B.; Miller, R.D.; Xia, J. Imaging dispersion curves of surface waves on multi-channel record. In Proceedings of the 1998 SEG Annual Meeting, New Orleans, LA, USA, 13 September 1998. [Google Scholar] [CrossRef]
- Cuisinier, O.; Auriol, J.C.; Le Borgne, T.; Deneele, D. Microstructure and hydraulic conductivity of a compacted lime-treated soil. Eng. Geol. 2011, 123, 187–193. [Google Scholar] [CrossRef]
- Cetin, H. Soil-particle and pore orientations during consolidation of cohesive soils. Eng. Geol. 2004, 73, 1–11. [Google Scholar] [CrossRef]
- Al-Mukhtar, M.; Khattab, S.; Alcover, J.F. Microstructure and geotechnical properties of lime-treated expansive clayey soil. Eng. Geol. 2012, 139–140, 17–27. [Google Scholar] [CrossRef]
- Alonso, E.; Pinyol, N.; Gens, A. Compacted soil behaviour: Initial state, structure and constitutive modelling. Géotechnique 2013, 63, 463–478. [Google Scholar] [CrossRef] [Green Version]
- ASTM. 6467: Standard Test Method for Torsional Ring Shear Test to Determine Drained Residual Shear Strength of Cohesive Soils; ASTM: West Conshohocken, PA, USA, 2013. [Google Scholar]
- Stark, T.D.; Vettel, J.J. Bromhead ring shear test procedure. Geotech. Test. J. 1992, 15, 24–32. [Google Scholar]
- Stark, T.D.; Contreras, I.A. Constant volume ring shear apparatus. Geotech. Test. J. 1996, 19, 3–11. [Google Scholar]
- Li, D.; Yin, K.; Glade, T.; Leo, C. Effect of over-consolidation and shear rate on the residual strength of soils of silty sand in the Three Gorges Reservoir. Sci. Rep. 2017, 7, 1–11. [Google Scholar]
- Sassa, K.; Nagai, O.; Solidum, R.; Yamazaki, Y.; Ohta, H. An integrated model simulating the initiation and motion of earthquake and rain induced rapid landslides and its application to the 2006 Leyte landslide. Landslides 2010, 7, 219–236. [Google Scholar]
- Sassa, K.; Setiawan, H.; He, B.; Gradiški, K.; Dang, K. TXT-tool 3.081-1.5: Manual for the LS-RAPID software. In Landslide dynamics: ISDR-ICL Landslide Interactive Teaching Tools; Springer: Berlin/Heidelberg, Germany, 2018; pp. 191–224. [Google Scholar]
- Wang, F.; Sassa, K. Landslide simulation by a geotechnical model combined with a model for apparent friction change. Phys. Chem. Earth Parts A/B/C 2010, 35, 149–161. [Google Scholar] [CrossRef]
- Dang, K.; Sassa, K.; Fukuoka, H.; Sakai, N.; Sato, Y.; Takara, K.; Quang, L.H.; Loi, D.H.; Van Tien, P.; Ha, N.D. Mechanism of two rapid and long-runout landslides in the 16 April 2016 Kumamoto earthquake using a ring-shear apparatus and computer simulation (LS-RAPID). Landslides 2016, 13, 1525–1534. [Google Scholar] [CrossRef]
- Dugonjić Jovančević, S.; Nagai, O.; Sassa, K.; Arbanas, Ž. TXT-tool 3.385-1.2: Deterministic Landslide Susceptibility Analyses Using LS-Rapid Software. In Landslide Dynamics: ISDR-ICL Landslide Interactive Teaching Tools; Sassa, K., Tiwari, B., Liu, K.-F., McSaveney, M., Strom, A., Setiawan, H., Eds.; Springer: Cham, Switzerland, 2018; Volume 2, Testing, Risk Management and Country Practices; pp. 169–179. ISBN 978-3-319-57777-7. [Google Scholar]
- Setiawan, H.; Sassa, K.; Takara, K.; Oštrić, M.; Miyagi, T.; Fukuoka, H. TXT-tool 4.081-1.2: Mechanism of the Aratozawa Large-Scale Landslide Induced by the 2008 Iwate-Miyagi Earthquake. In Landslide Dynamics: ISDR-ICL Landslide Interactive Teaching Tools; Springer: Cham, Switzerland, 2018; pp. 819–831. [Google Scholar]
- Soilgrids.org. Available online: http://www.soilgrids.org (accessed on 20 August 2021).
- Varnes, D.J. Slope movement types and processes. Spec. Rep. 1978, 176, 11–33. [Google Scholar]
- Guidicini, G.; Iwasa, O.Y. Tentative correlation between rainfall and landslides in a humid tropical environment. Bull. Int. Assoc. Eng. Geol. 1977, 16, 13–20. [Google Scholar] [CrossRef]
- Corominas, J.; Moya, J. Historical landslides in the Eastern Pyrenees and their relation to rainy events. In Proceedings of the Eight International Conference and Field Trip on Landslides, Granada, Spain, 27–28 September 1996; pp. 125–132. [Google Scholar]
- Guzzetti, F.; Peruccacci, S.; Rossi, M.; Stark, C.P. Rainfall thresholds for the initiation of landslides in central and southern Europe. Meteorol. Atmos. Phys. 2007, 98, 239–267. [Google Scholar]
- Sengupta, A.; Gupta, S.; Anbarasu, K. Rainfall thresholds for the initiation of landslide at Lanta Khola in north Sikkim, India. Nat. Hazards 2010, 52, 31–42. [Google Scholar] [CrossRef]
- Crosta, G. Regionalization of rainfall thresholds: An aid to landslide hazard evaluation. Environ. Geol. 1998, 35, 131–145. [Google Scholar] [CrossRef]
- Thiebes, B. Landslide Analysis and Early Warning Systems: Local and Regional Case Study in the Swabian Alb, Germany; Springer: Berlin/Heidelberg, Germany, 2012; ISBN 3642275265. [Google Scholar]
- Crozier, M.J. Prediction of rainfall-triggered landslides: A test of the Antecedent Water Status Model. Earth Surf. Process. Landforms 1999, 24, 825–833. [Google Scholar] [CrossRef]
- Rahardjo, H.; Li, X.W.; Toll, D.G.; Leong, E.C. The effect of antecedent rainfall on slope stability. In Unsaturated Soil Concepts and Their Application in Geotechnical Practice; Toll, D.G., Ed.; Springer Netherlands: Dordrecht, The Netherlands, 2001; pp. 371–399. ISBN 978-94-015-9775-3. [Google Scholar]
- Jaiswal, P.; Westen, C.J. Van Quantitative assessment of landslide hazard along transportation lines using historical records. Landslides 2011, 8, 279–291. [Google Scholar] [CrossRef]
- Zêzere, J.L.; Trigo, R.M.; Trigo, I.F. Shallow and deep landslides induced by rainfall in the Lisbon region (Portugal): Assessment of relationships with the North Atlantic Oscillation. Nat. Hazards Earth Syst. Sci. 2005, 5, 331–344. [Google Scholar] [CrossRef]
- Sajinkumar, K.S.; Castedo, R.; Sundarajan, P.; Rani, V.R. Study of a partially failed landslide and delineation of piping phenomena by vertical electrical sounding (VES) in the Wayanad Plateau, Kerala, India. Nat. Hazards 2015, 75, 755–778. [Google Scholar] [CrossRef]
- Kuriakose, S.L.; Sankar, G.; Muraleedharan, C. History of landslide susceptibility and a chorology of landslide-prone areas in the Western Ghats of Kerala, India. Environ. Geol. 2009, 57, 1553–1568. [Google Scholar] [CrossRef]
- Muraleedharan, C.; Sajinkumar, K.S. Landslide inventory of Kerala. In Government of India Geological Survey of India LANDSLIDE; Geological Survey of India: Kolkata, India, 2010; pp. 1–77. [Google Scholar]
- Sanjeev, R.; Maruthi, K.V.; Sajinkumar, K.S. Detailed Site Specific Study of Konnathadi Debris Avalanche, Idukki District, Kerala; GSI Thiruvananthapuram: Thiruvananthapuram, India, 2013.
- Ivanov, J.; Park, C.B.; Miller, R.D.; Xia, J.; Overton, R. Modal Separation Before Dispersion Curve Extraction by MASW Method. In Proceedings of the 14th EEGS Symposium on the Application of Geophysics to Engineering and Environmental Problems, Denver, CO, USA, 4–7 March 2001. [Google Scholar]
- NEHRP. NEHRP Recommended Provisions for Seismic Regulations for New Buildings and Other Structures (Fema 450); NEHRP: Washington, DC, USA, 2003.
- ASTM D2487-11. In Standard Practice for Classification of Soils for Engineering Purposes (Unified Soil Classification System); American Society for Testing and Materials: West Conshohocken, PA, USA, 2011; p. 5.
- IS2720(17) Indian Standard Methods of Tests for Soils: Laboratory Determination of Permeability; Bureau of Indian Standards: New Delhi, India, 1986.
- ASTM. D18 Committee Test Method for Direct Shear Test of Soils Under Consolidated Drained Conditions; ASTM: West Conshohocken, PA, USA, 1900. [Google Scholar]
- Le Pera, E.; Arribas, J.; Critelli, S.; Tortosa, A. The effects of source rocks and chemical weathering on the petrogenesis of siliciclastic sand from the Neto River (Calabria, Italy): Implications for provenance studies. Sedimentology 2001, 48, 357–378. [Google Scholar] [CrossRef]
- Glossary of Geology. Soil Sci. Soc. Am. J. 1974, 38, 4–6. [CrossRef]
- Wakatsuki, T.; Tanaka, Y.; Matsukura, Y. Soil slips on weathering-limited slopes underlain by coarse-grained granite or fine-grained gneiss near Seoul, Republic of Korea. Catena 2005, 60, 181–203. [Google Scholar] [CrossRef]
- White, A.F.; Bullen, T.D.; Schulz, M.S.; Blum, A.E.; Huntington, T.G.; Peters, N.E. Differential rates of feldspar weathering in granitic regoliths. Geochim. Cosmochim. Acta 2001, 65, 847–869. [Google Scholar] [CrossRef]
- Rajan, P.K.; Santosh, M.; Ramachandran, K.K. Geochemistry and petrogenetic evolution of the diatexites of Central Kerala, India. Proc. Indian Acad. Sci. Earth Planet. Sci. 1984, 93, 57–69. [Google Scholar] [CrossRef] [Green Version]
- Skempton, A.W. Residual strength of clays in landslides, folded strata and the laboratory. Geotechnique 1985, 35, 3–18. [Google Scholar] [CrossRef]
- Jaiswal, P.; van Westen, C.J. Estimating temporal probability for landslide initiation along transportation routes based on rainfall thresholds. Geomorphology 2009, 112, 96–105. [Google Scholar] [CrossRef]


Publisher’s Note: MDPI stays neutral with regard to jurisdictional claims in published maps and institutional affiliations. |
© 2021 by the authors. Licensee MDPI, Basel, Switzerland. This article is an open access article distributed under the terms and conditions of the Creative Commons Attribution (CC BY) license (https://creativecommons.org/licenses/by/4.0/).