
Rate of Fen-Peat Soil Subsidence Near Drainage Ditches (Central Poland)


Abstract
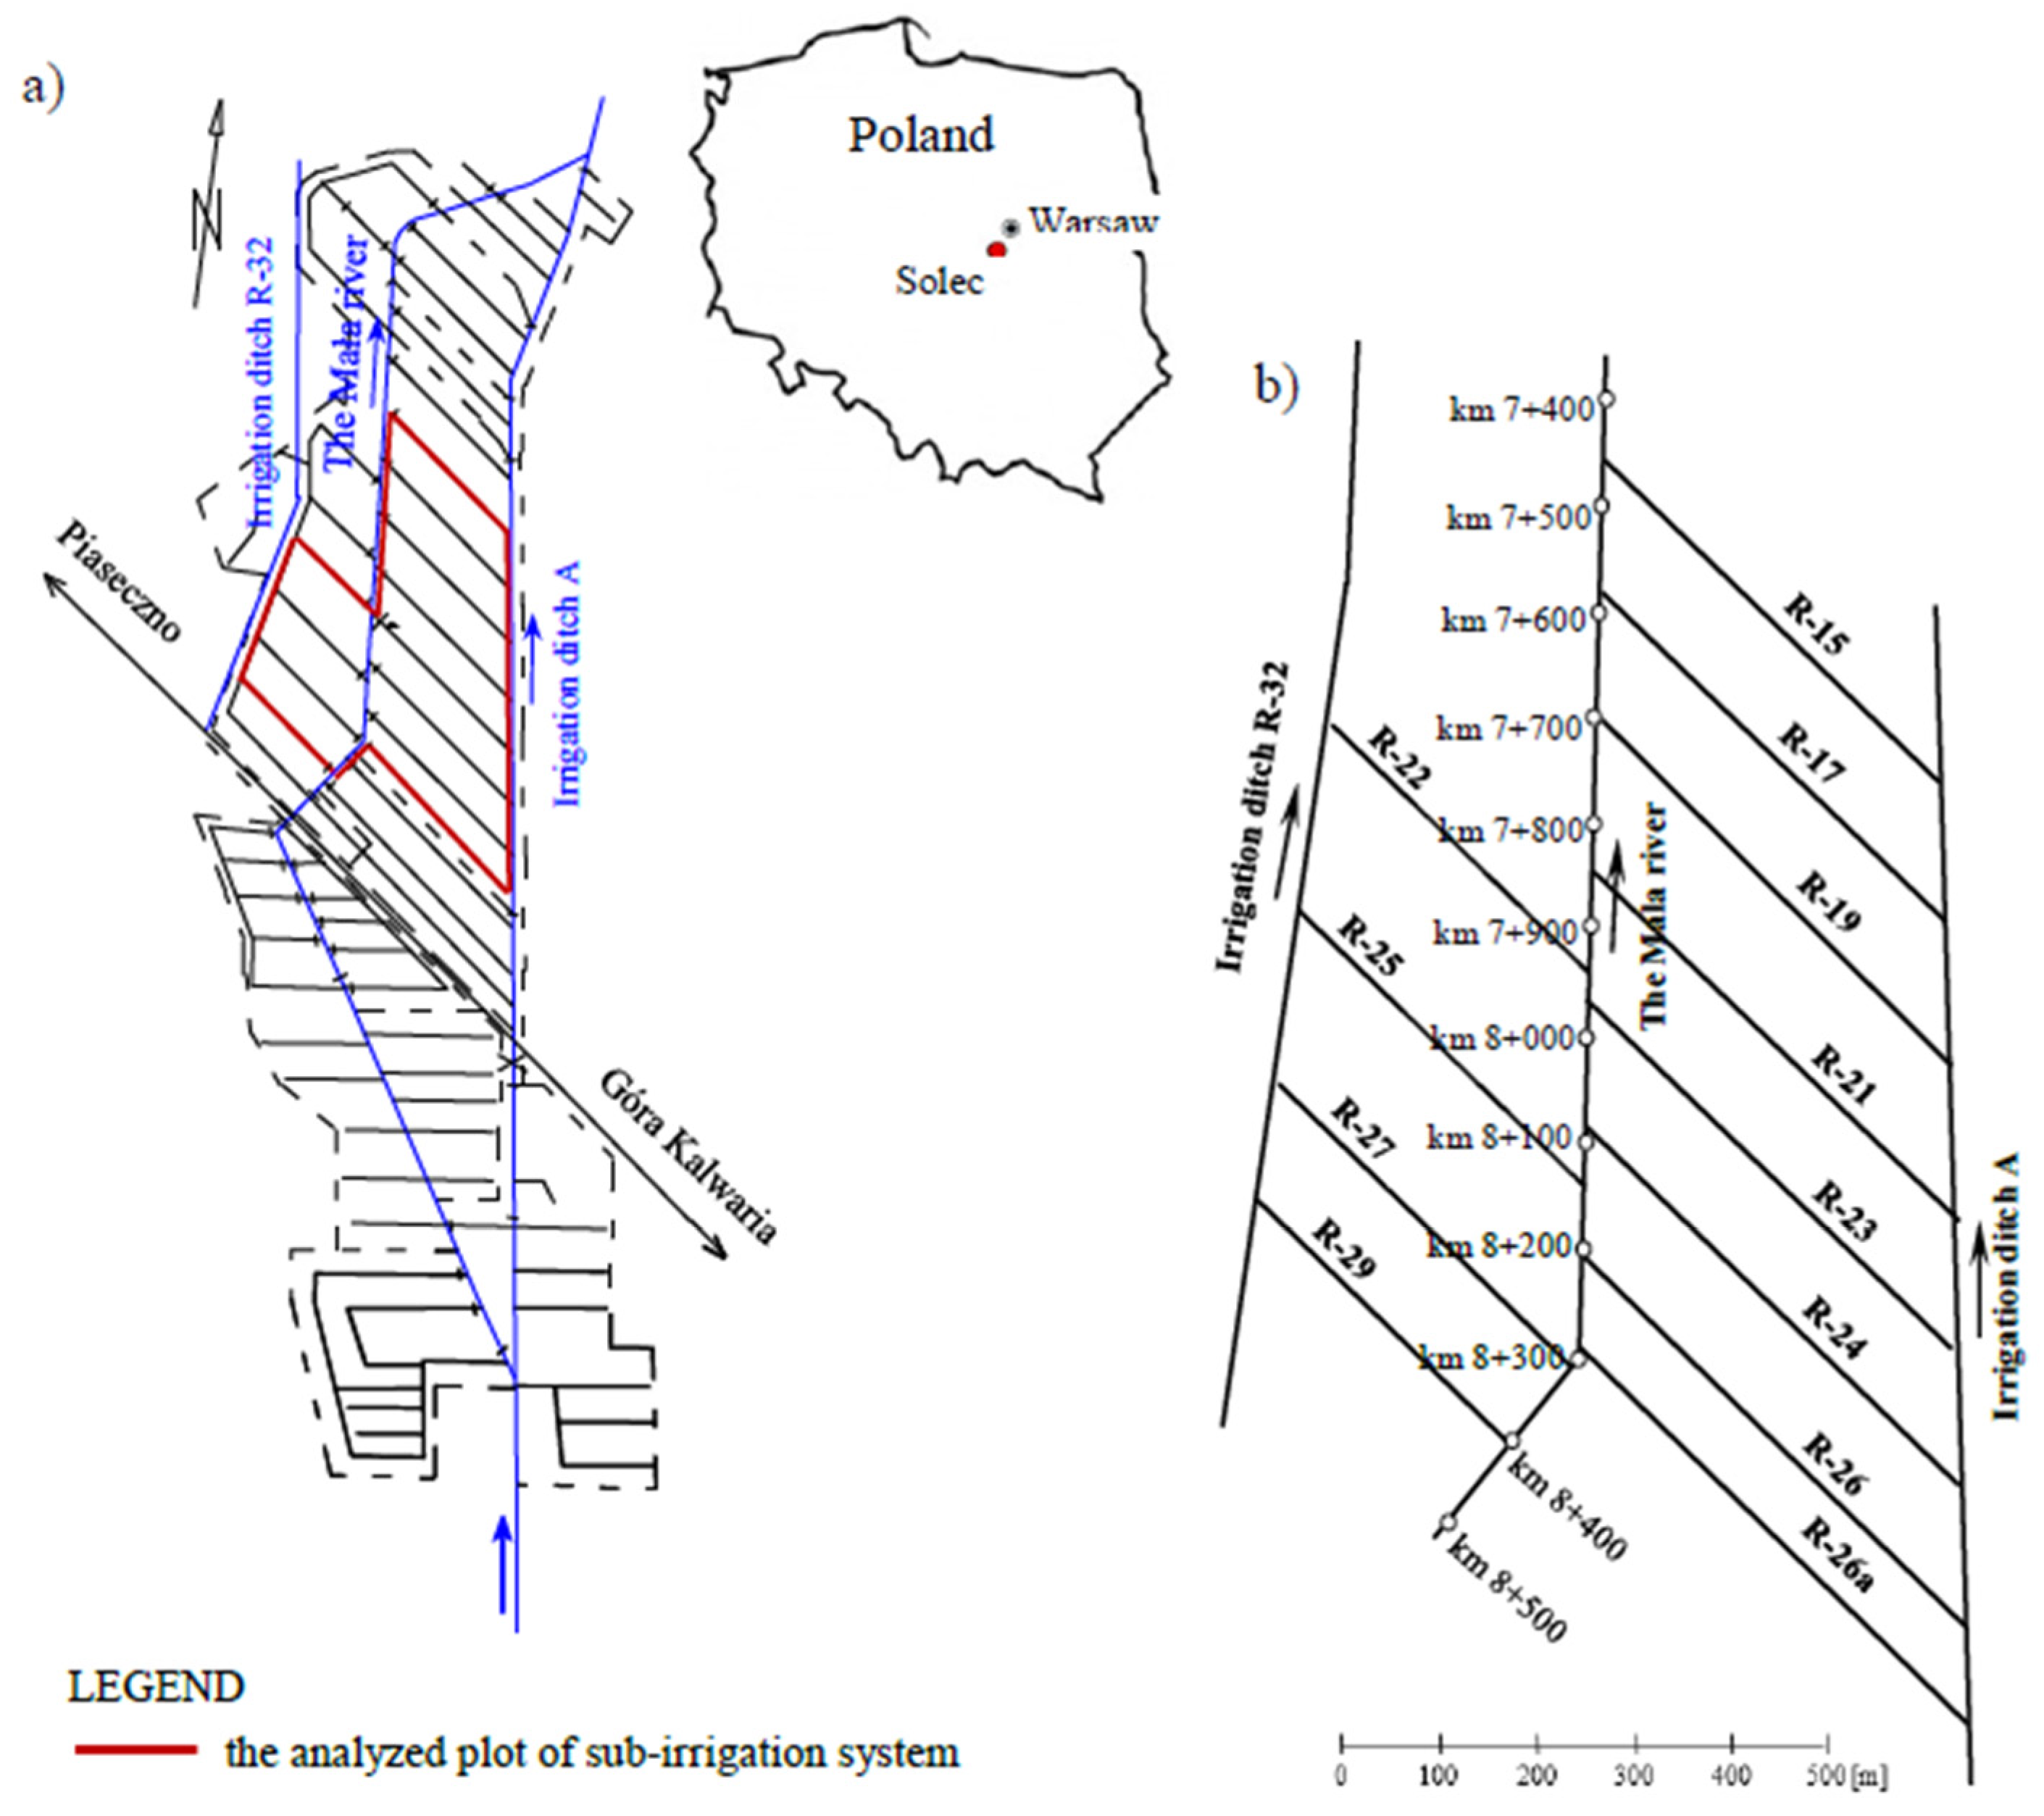
:1. Introduction
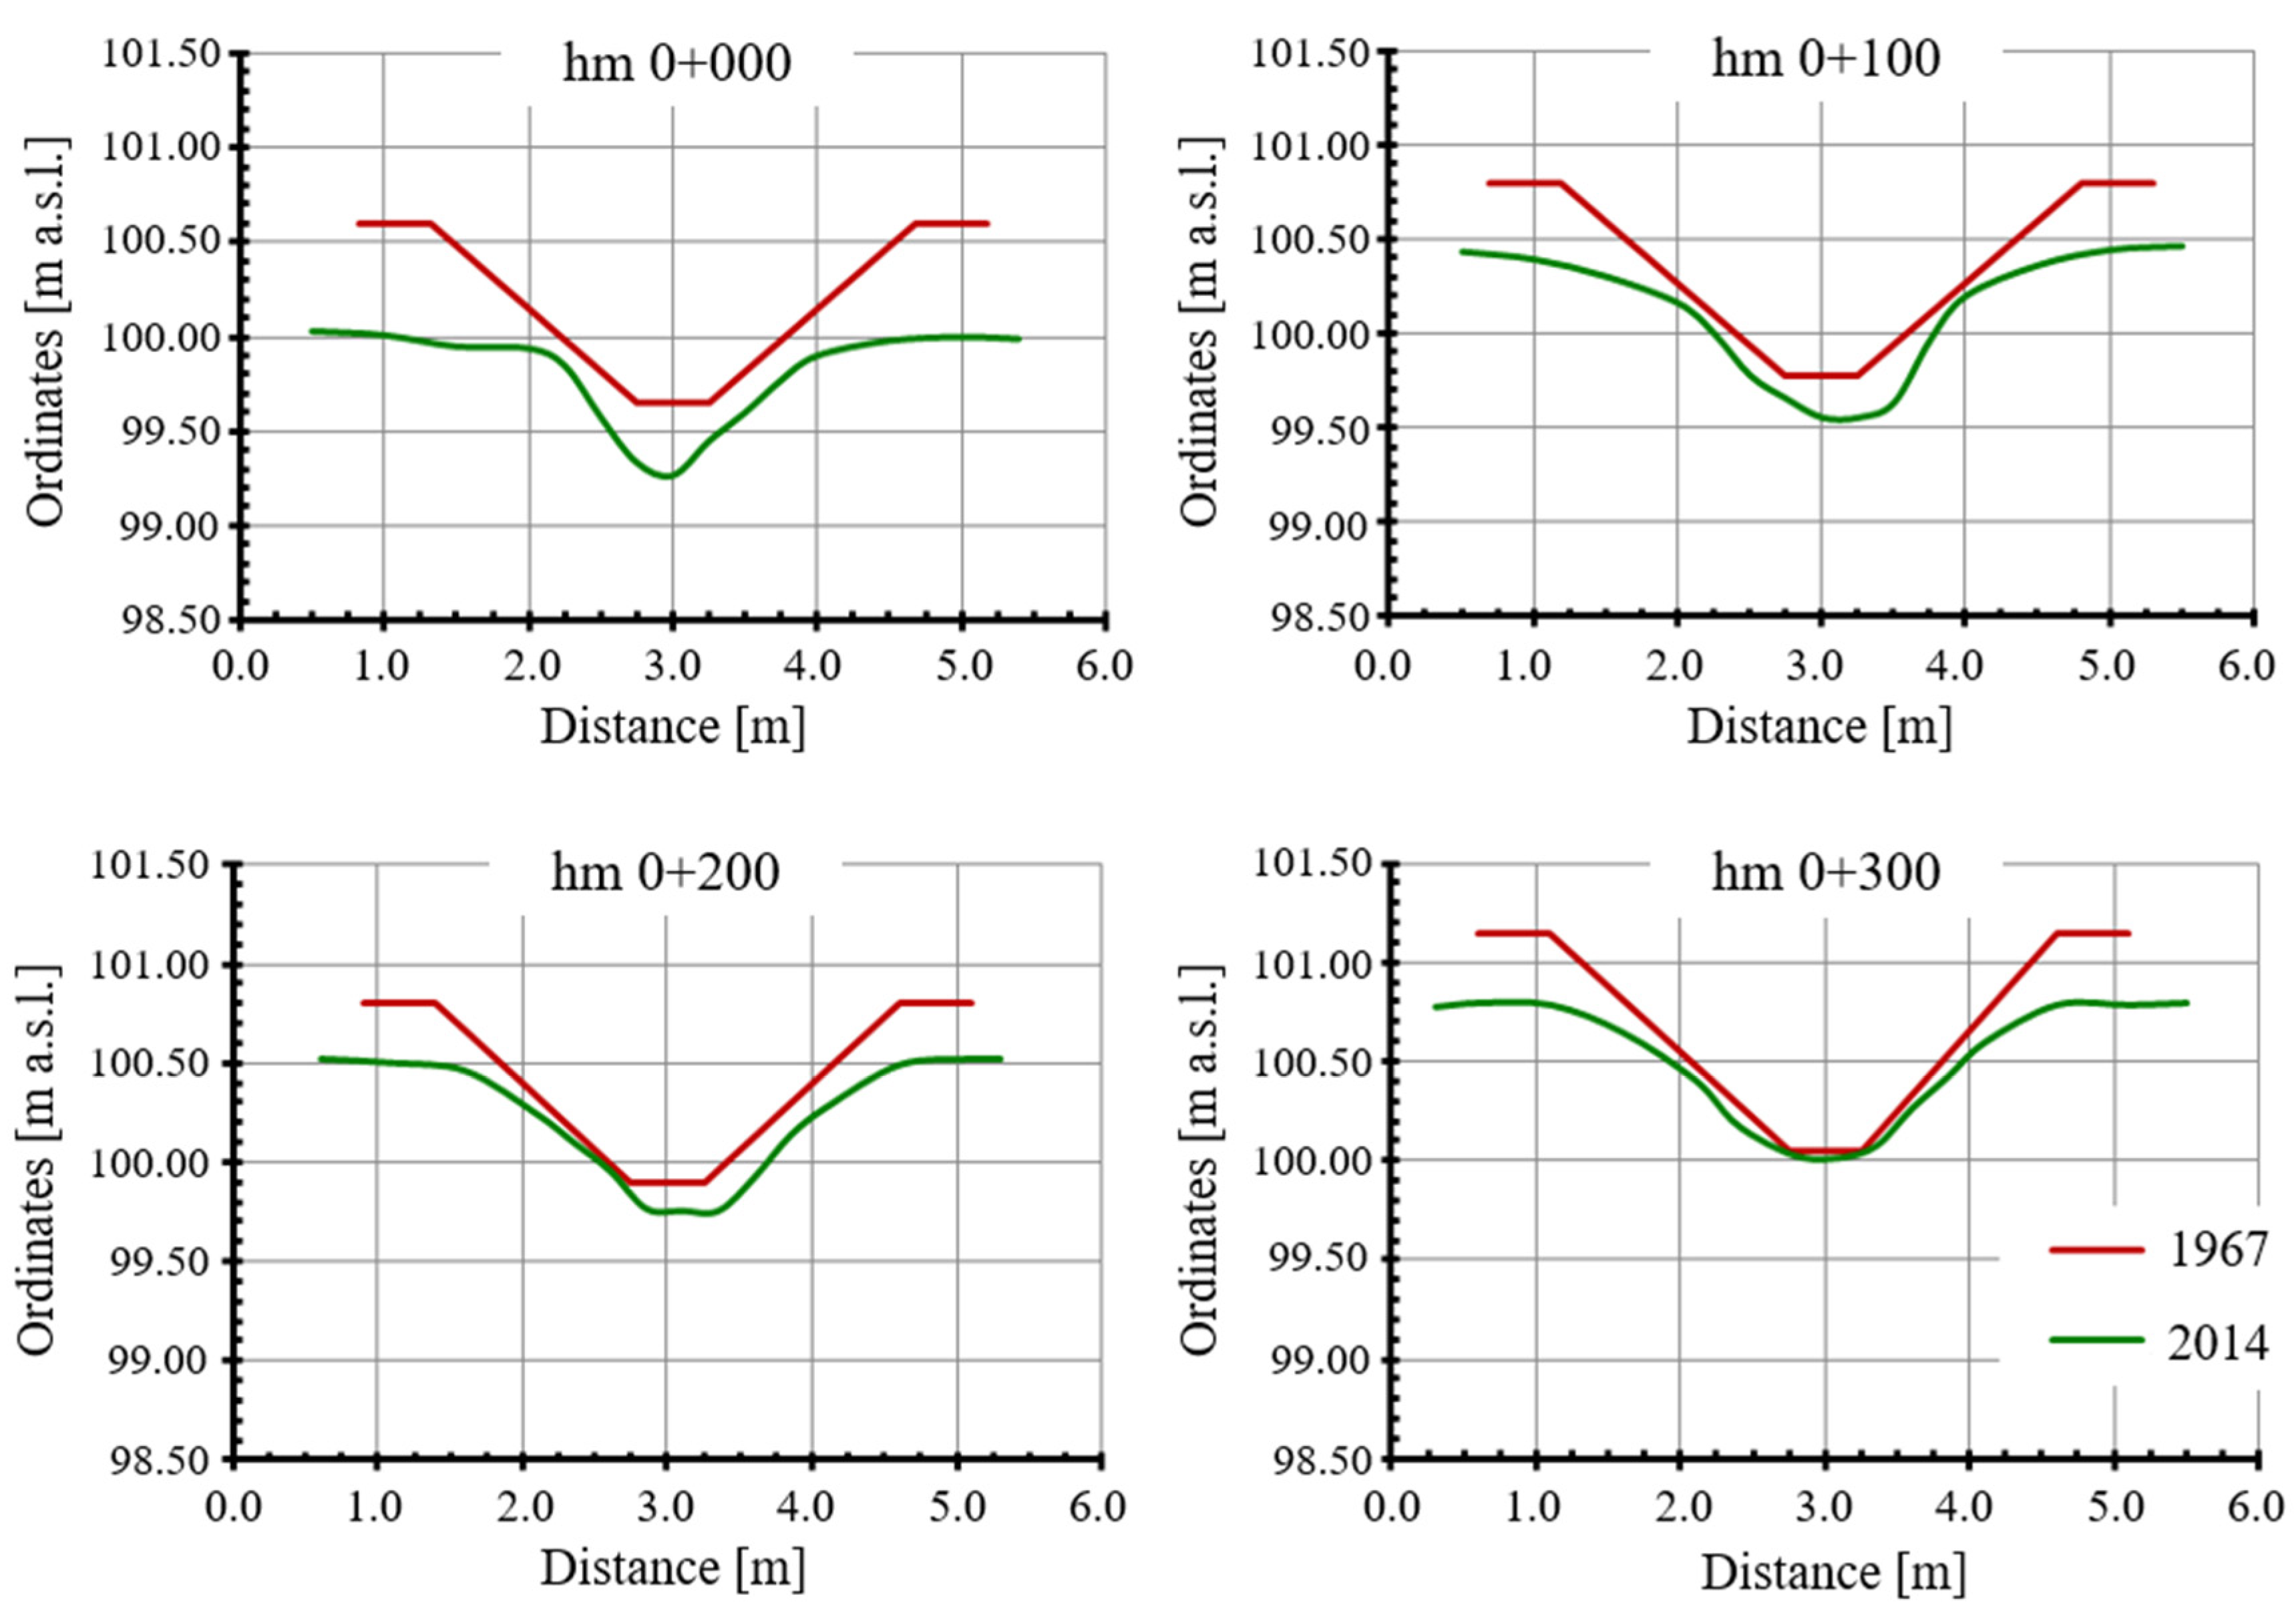
- Determination of the depth of ditches after subsidence (t) in relation to the designed depth (to), determination of the amount of their shallowing (d = to − t), and the ratio (d/t) in the analyzed period;
- Determination of the magnitude and average annual rate of subsidence of the peat soil surface near the measurement points along the analyzed ditches;
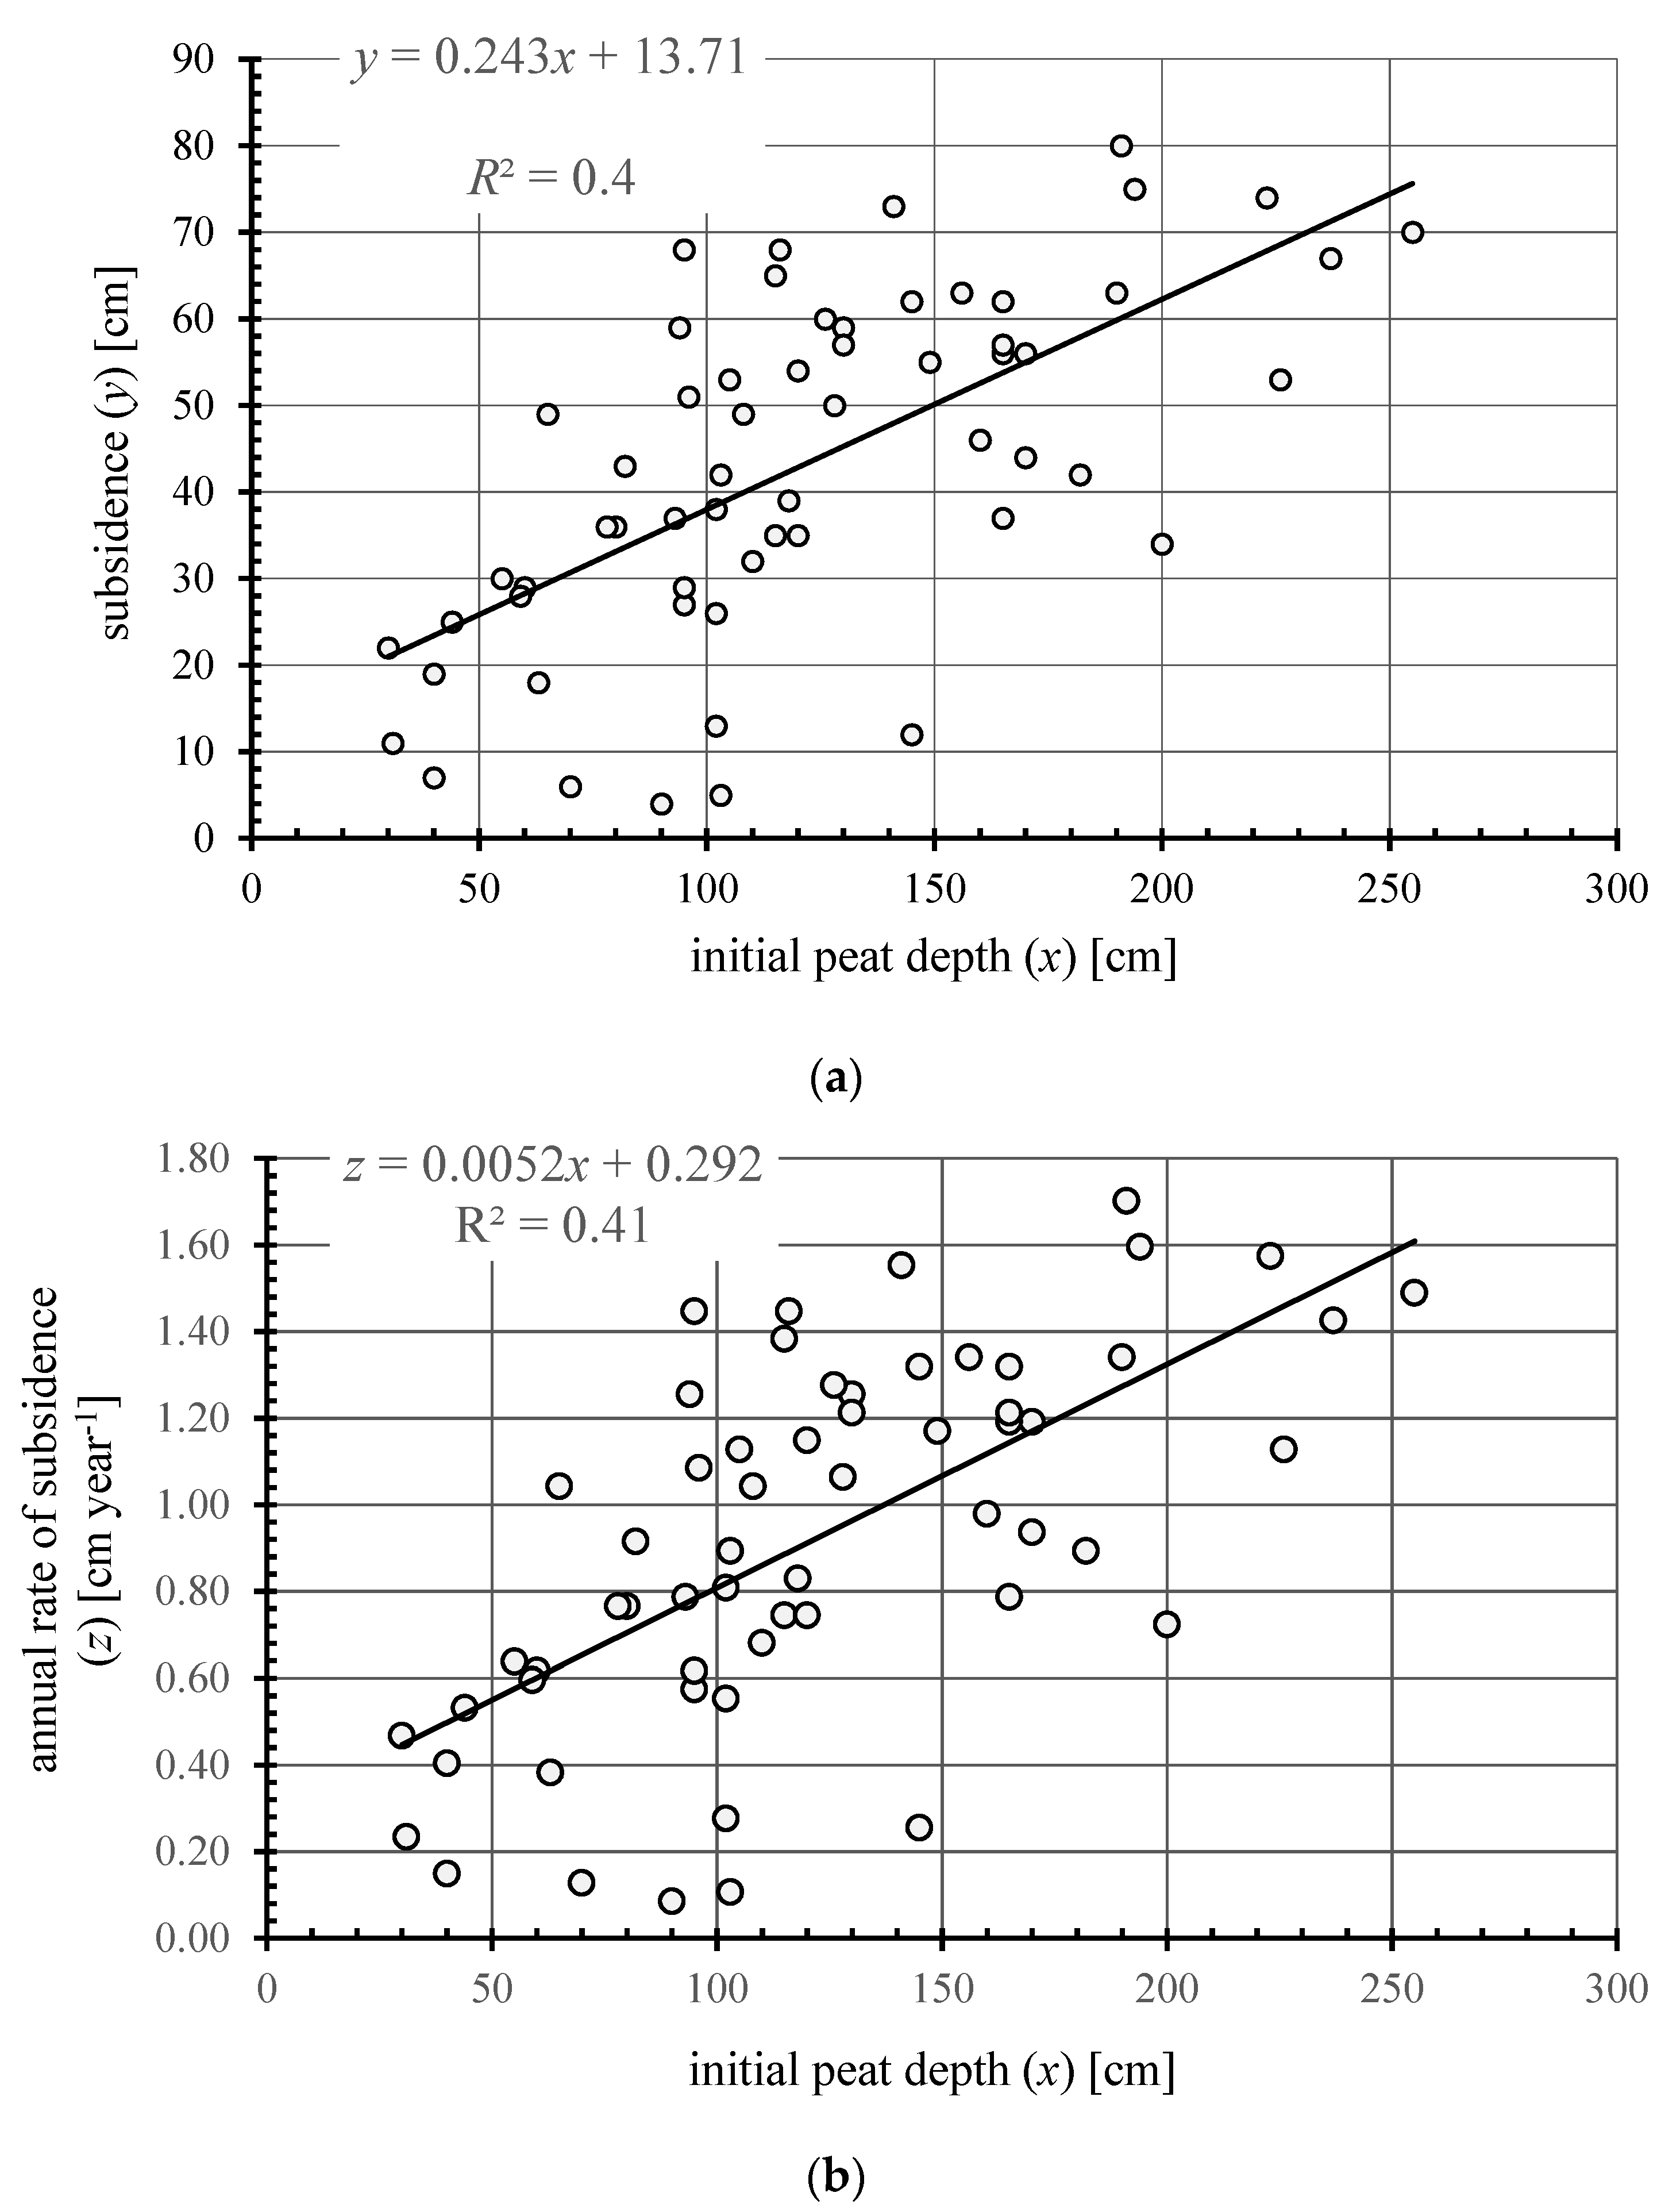
- Development of empirical relationships between the amount of subsidence (y) and the rate of average annual surface subsidence of a drained peat deposit (z), and its original (initial) thickness (x) in the vicinity of drainage ditches;
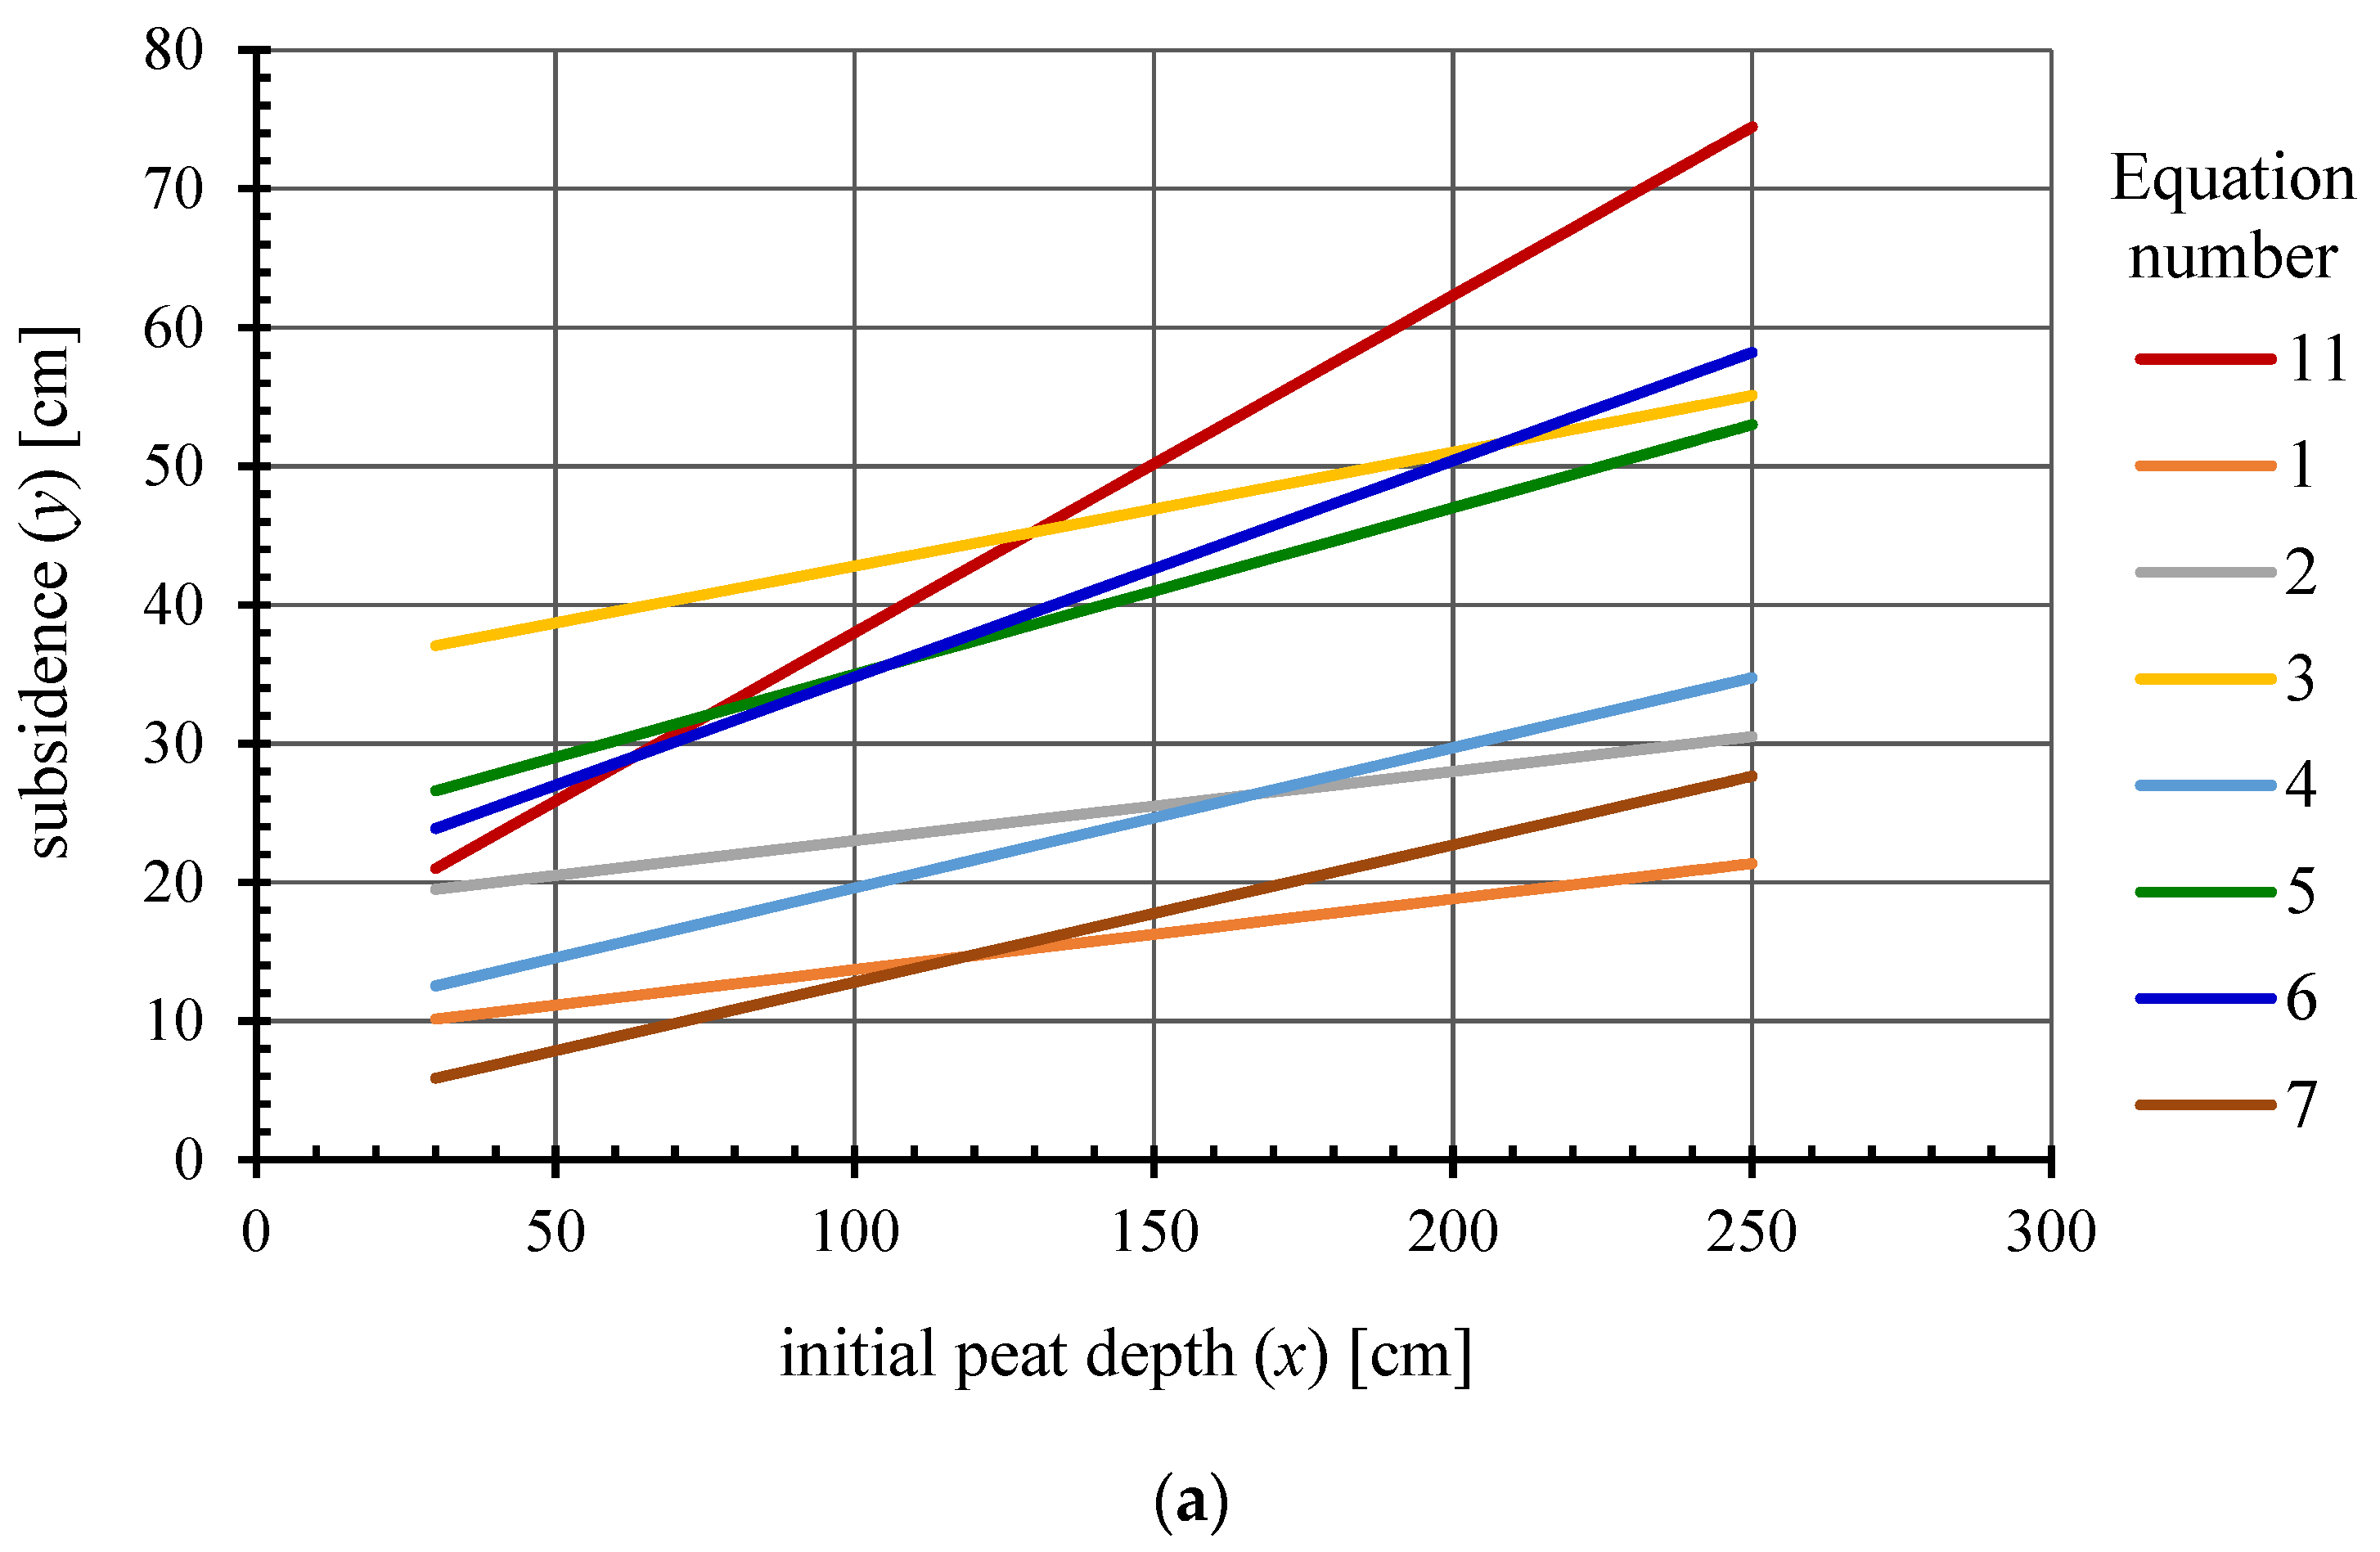
- Comparison of the results of calculating the amount of subsidence/subsidence rate using the proposed empirical relationships with the results obtained from 10 empirical equations of this type published in the literature.
2. Material and Methods
3. Results
4. Discussion of Results
5. Conclusions
- Over the period of 47 years (1967–2014) in the analyzed fragment of the Solec fen drainage site near the route of 12 ditches, there were significant changes in the position of their banks and bottoms in relation to the initial values. The effect of these changes reduced the depth of the ditches from their design depths. As a result of the subsidence processes of their banks and bottom, the designed depth of the ditches within the range of 0.73–1.35 m decreased to the values within the range of 0.40–1.05 m. The ditch banks have subsided by about 42 cm on average, and the bottom by about 17 cm on average. As a result, they have been shallowed by about 26 cm on average over a period of 47 years.
- The ratio of the amount of ditch shallowing to its depth after subsidence (d/t), which is associated with the degree of peat decomposition, was 0.41 in the analyzed peatland section, indicating a medium degree of decomposition. This was confirmed by the results of previous independent, long-term field and laboratory studies at the site.
- The mean annual subsidence rate of 0.92 cm year−1 in the fen-peat soil studied along the route of the drainage ditches was about 48% higher compared to the average of the entire area, confirming the higher intensity of drainage and subsidence of soils near the ditches.
- The two empirical equations proposed to estimate the amount of subsidence and the average annual subsidence rate of the peatland surface near the route of drainage ditches were applied to a fen with an average degree of organic matter decomposition in area with an initial peat deposit thickness of up to 250 cm.
Supplementary Materials
Author Contributions
Funding
Institutional Review Board Statement
Informed Consent Statement
Data Availability Statement
Conflicts of Interest
References
- Moore, P.D. The future of cool temperate bogs. Environ. Conserv. 2002, 29, 3–20. [Google Scholar] [CrossRef]
- Oleszczuk, R.; Regina, K.; Szajdak, L.; Höper, H.; Maryganowa, V. Impacts of agricultural utilization of peat soils on the greenhouse gas balance. In Peatlands and Climate Change; Strack, M., Ed.; International Peat Society: Jyväskylä, Finland, 2008; pp. 70–97. [Google Scholar]
- Post, W.M.; Emanuel, W.R.; Zinke, P.J.; Stangenberger, A.G. Soil carbon pools and world life zones. Nature 1982, 298, 156–159. [Google Scholar] [CrossRef]
- Byrne, K.A.; Chonjicki, B.; Christensen, T.R.; Drosler, M.; Freibauer, A.; Friborg, T.; Frolking, S.; Lindroth, A.; Mailhammer, J.; Malmer, N.; et al. EU peatlands: Current carbon stocks and trace gas fluxes. In Report 4/2004 to ‘Concerted Action: Synthesis of the European Greenhouse Gas Budget’; Geosphere-Biosphere Centre, University of Lund: Lund, Sweden, 2004; p. 58. [Google Scholar]
- Jadczyszyn, J.; Bartosiewicz, B. Soil drainage and degradation processes. Studia i Raporty IUNG-PIB. Puławy 2020, 64, 49–60. [Google Scholar]
- Kudlicki, Ł. Desertification threat in Poland. Bezpieczeństwo Nar. 2006, 1, 201–211. [Google Scholar]
- Couwenberg, J. Greenhouse gas emissions from managed peat soils: Is the IPCC reporting guidance realistic? Mires Peat 2011, 8, 1–10. [Google Scholar]
- Okruszko, H. The effect of land reclamation on organic soils within Poland conditions. Zesz. Probl. Post Nauk. Roln. 1976, 177, 159–204. [Google Scholar]
- Okruszko, H.; Ilnicki, P. The moorsh horizons as quality indicators of reclaimed organic soils. In Organic Soils and Peat Materials for Sustainable Agriculture. Parent, L.E., Ilnicki, P., Eds.; CRC Press: Boca Raton, FL, USA, 2003; p. 205. [Google Scholar]
- Doroszewski, A.; Jóźwicki, T.; Wróblewska, W.; Kozyra, J. Agricultural drought in Poland in the years 1961–2010; Institute of Soil Science and Plant Cultivation. State Reaserch Institute: Puławy, Poland, 2014; p. 144. [Google Scholar]
- Fenner, N.; Freeman, C. Drought-induced carbon loss in peatlands. Nature Geosci. 2011, 4, 895–900. [Google Scholar] [CrossRef]
- Koza, P.; Łopatka, A.; Jadczyszyn, J.; Wawer, R.; Doroszewski, A.; Siebielec, G. Raport IUNG-PIB: Delimitation of Areas at Varying Degrees of risk of Drought in Poland for the Purposes of Implementing the Operation “Modernization of Agricultural Farms” in the Rural Development Program for 2014–2020; IUNG: Puławy, Poland, 2019; p. 43. [Google Scholar]
- Brandyk, T.; Szatyłowicz, J.; Oleszczuk, R.; Gnatowski, T. Water–related physical attributes of organic soils. In Organic Soils and Peat Materials for Sustainable, Agriculture; Parent, L.E., Ilnicki, P., Eds.; CRC Press: Boca Raton, FL, USA, 2003; pp. 33–66. [Google Scholar]
- Gebhard, S.; Fleige, H.; Horn, R. Anisotropic shrinkage of mineral and organic soils and its impact on soil hydraulic properties. Soil Till. Res. 2012, 125, 96–104. [Google Scholar] [CrossRef]
- Hooijer, A.; Page, S.; Jauhiainen, J.; Lee, W.A.; Lu, X.X.; Idris, A.; Anshari, G. Subsidence and carbon loss in drained tropical peatlands. Biogeosciences 2012, 9, 1053–1071. [Google Scholar] [CrossRef] [Green Version]
- Okruszko, H. Transformation of fen-peat soils under the impact of draining. Zesz. Probl. Post. Nauk. Roln. 1993, 40, 3–73. [Google Scholar]
- Peng, X.; Horn, R. Anisotropic shrinkage and swelling of some organic and inorganic soils. Eur. J. Soil Sci. 2007, 58, 98–107. [Google Scholar] [CrossRef]
- Silins, U.; Rothwell, R.L. Forest peatland drainage and subsidence affect soil water retention and transport properties in an Alberta peatland. Soil Sci. Soc. Am. J. 1998, 62, 1048–1056. [Google Scholar] [CrossRef]
- Snyder, G.H. Everglades agricultural area soil subsidence and land use projections. Annu. Proc. Soil Crop Sci. Soc. Fla. 2005, 64, 44–51. [Google Scholar]
- Eggelsmann, R. Subsidence of peatland caused by drainage, evaporation and oxidation. In Land Subsidence, Proceedings of the Third International Symposium on Land Subsidence Held in Venice, Italy, 19–25 March 1984; IAHS Publication No. 151; Johnson, A.I., Carbognin, L., Ubertini, L., Eds.; Institute of Hydrology, Wallingford: Oxfordshire, UK, 1986; pp. 497–505. [Google Scholar]
- Hillman, G.H. Effects of engineered drainage on water tables and peat subsidence in an Alberta Treed Fen. In Northern Forested Wetlands Ecology and Management; Carl, C., Ed.; CRC Lewis Publishers: Boca Raton, FL, USA, 1997; pp. 253–272. [Google Scholar]
- Jurczuk, S. The influence of water regulations on subsidence and mineralisation of organic soils. In Biblioteczka Wiadomości IMUZ; IMUZ: Falenty, Poland, 2000; Volume 96, p. 120. [Google Scholar]
- Krzywonos, K. The subsidence of peatlands after drainage near ZD IMUZ Biebrza. Wiadomości IMUZ Falenty 1974, 12, 151–169. [Google Scholar]
- Lipka, K.; Zając, E.; Wdowik, W. The effect of land use on the disappearance of peat-moorsh soils in the Mrowla River valley near Rzeszów. Zesz Probl Post Nauk Roln 2005, 507, 349–355. [Google Scholar]
- Schothorst, C.J. Subsidence of low moor peat soils in the western Netherlands. Geoderma 1977, 17, 265–291. [Google Scholar] [CrossRef]
- Wösten, J.H.M.; Ismail, A.B.; van Wijk, A.L.M. Peat subsidence and its practical implications: A case study in Malaysia. Geoderma 1997, 78, 25–36. [Google Scholar] [CrossRef]
- Ikkala, L.; Ronkanen, A.-K.; Utriainen, O.; Kløve, B.; Marttila, H. Peatland subsidence enhances cultivated lowland flood risk. Soil Till Res 2021, 212, 105078. [Google Scholar] [CrossRef]
- Lipka, K.; Zając, E.; Hlotov, V.; Siejka, Z. Disappearance rate of a peatland in Dublany near Lviv (Ukraine) drained in 19th century. Mires Peat 2017, 19, 1–15. [Google Scholar]
- Maslov, B.S.; Kolganov, A.V.; Kreshtapova, V.N. Peat Soils and Their Change under Amelioration; Rossel’khozizdat: Moskva, Russia, 1996. [Google Scholar]
- Berglund, Ö.; Berglund, K. Distribution and cultivation intensity of agricultural peat and gyttja soils in Sweden and estimation of greenhouse gas emissions from cultivated peat soils. Geoderma 2010, 154, 173–180. [Google Scholar] [CrossRef] [Green Version]
- Camporese, M.; Gamolati, G.; Putti, M.; Teatini, P. Peatland Susidence in the Venice Watershed. In Peatlands: Evolution and Records of Environmental and Climate Changes; Martini, I.P., Martinez Cortizas, A., Chesworth, W., Eds.; Elsevier: Amsterdam, The Netherlands, 2006; pp. 529–550. [Google Scholar]
- Ilnicki, P. Restoration of Carbon Sequestrating Capacity and Biodiversity in Abandoned Grassland on Peatland in Poland. Monography; August Cieszkowski Agricultural University Press of Poznań: Poznań, Poland, 2002; p. 170. [Google Scholar]
- Kasimir-Klemedtsson, A.; Klemedtsson, L.; Berglund, K.; Martikainen, P.; Silvola, J.; Oenema, O. Greenhouse gas emissions from farmed organic soils: A review. Soil Use Manag. 1997, 13, 245–250. [Google Scholar] [CrossRef]
- Kechavarzi, C.; Dawson, Q.; Leeds-Harrison, P.B.; Szatyłowicz, J.; Gnatowski, T. Water–table management in lowland UK peat soils and its potential impact on CO2 emission. Soil Use Manag. 2007, 23, 359–367. [Google Scholar] [CrossRef]
- Schipper, L.A.; McLeod, M. Subsidence rates and carbon loss in peat soils following conversion to pasture in the Waikato region, New Zealand. Soil Use Manag. 2002, 18, 91–93. [Google Scholar] [CrossRef]
- Van den Akker, J.J.H.; Jansen, P.C.; Hendriks, R.F.A.; Hoving, I.; Pleijter, M. Submerged infiltration to halve subsidence and GHG emissions of agricultural peat soils. In Proceedings of the 14th International Peat Congress, Extended abstract No. 383, Stockholm, Sweden, 3–8 June 2012; p. 6. [Google Scholar]
- Gąsowska, M. The Influence of Change in Meadow Use on Physical–Water Properties of Organic Soils. Case Study: Łąki Soleckie. Ph.D. Thesis, Warsaw University of Life Sciences–SGGW, Warsaw, Poland, 2017. [Google Scholar]
- Organic Soils and Peat Materials for Sustainable Agriculture; Parent, L.E.; Ilnicki, P. (Eds.) CRC Press: Boca Raton, FL, USA, 2003; p. 205. [Google Scholar]
- Truba, M.; Oleszczuk, R. An analysis of some basic chemical and physical properties of drained fen peat and moorsh soil layers. Ann Wars. Univ. Life Sci.-SGGW Land Reclam. 2014, 46, 69–78. [Google Scholar] [CrossRef]
- Dawson, Q.; Kechavarzi, C.; Leeds-Harrison, P.B.; Burton, R.G.O. Subsidence and degradation of agricultural peatlands in the Fenlands of Norfolk, UK. Geoderma 2010, 154, 181–187. [Google Scholar] [CrossRef]
- Deverel, S.J.; Ingrum, T.; Leighton, D. Present-day oxidative subsidence of organic soils and mitigation in the Sacramento-San Joaquin Delta, California, USA. Hydrogeol. J. 2016, 24, 569–586. [Google Scholar] [CrossRef] [PubMed] [Green Version]
- Evans, C.D.; Williamson, J.M.; Kacaribu, F.; Irawan, D.; Suardiwerianto, Y.; Hidayat, M.F.; Laurén, A.; Page, S.E. Rates and spatial variability of peat subsidence in Acacia plantation and forest landscapes in Sumatra, Indonesia. Geoderma 2019, 338, 410–421. [Google Scholar] [CrossRef]
- Hoogland, T.; van den Akker, J.J.H.; Brus, D.J. Modeling the subsidence of peat soils in the Dutch coastal area. Geoderma 2012, 171–172, 92–97. [Google Scholar] [CrossRef]
- Ilnicki, P.; Szajdak, L.W. Peatland Disappearance; PTPN Press: Poznań, Poland, 2016; p. 312. [Google Scholar]
- Oleszczuk, R.; Zając, E.; Urbański, J. Verification of empirical equations describing subsidence rate of peatland in Central Poland. Wetl. Ecol Manag. 2020, 2, 495–507. [Google Scholar] [CrossRef]
- Zanello, F.; Teatini, P.; Putti, M.; Gambolati, J. Long term peatland subsidence: Experimental study and modeling scenarios in the Venice coastland. J. Geophys. Res. 2011, 116, 1–14. [Google Scholar] [CrossRef]
- Ciepielowski, A.; Włodarczyk, A. Hydrotechnical structures in protected areas. Acta Sci. Pol. Arch. 2004, 3, 3–21. [Google Scholar]
- Murat-Błażejewska, S.; Zbierska, J.; Ławniczak, A.; Kanclerz, J.; Kupiec, J.; Sojka, M. Exploitation of water infrastructure in aspect of water resources of lowland river catchment. Acta Sci. Pol. Arch. 2008, 7, 13–22. [Google Scholar]
- Oleszczuk, R.; Gąsowska, M.; Guz, G.; Urbański, J.; Hewelke, E. The influence of subsidence and disappearance of organic moorsh soils on longitudinal sub-irrigation ditch profiles. Acta Sci Pol. Cir. 2017, 16, 3–13. [Google Scholar] [CrossRef] [Green Version]
- Brandyk, T. Principles of Moisture Management for Shallow Water Table Soils. In Treatises and Monographs; Warsaw Agricultural University Press: Warsaw, Poland, 1990; Volume 116, p. 120. [Google Scholar]
- Kaca, E. Mathematical Model of Ground Water Rising in Sub-Irrigation System. Ph.D. Thesis, Institute of Land Reclamation and Water Management, Warsaw Agricultural Unviersity, Warsaw, Poland, 1981; p. 192. [Google Scholar]
- Brożek, W. The Description of the Technical Project of Land Reclamation of the Grassland Mała River Site; CBSiPWM: Warsaw, Poland, 1967; p. 45, unpublished work. [Google Scholar]
- Ostromęcki, J. The Drainage of Grasslands. Guide–Book. Warsaw Agricultural University Press: Warsaw, Poland, 1971; p. 163. [Google Scholar]
- Pierzgalski, E. Land Reclamation of Grassland–Sub-Irrigation Systems. Guide–Book; Warsaw Agricultural University Press: Warsaw, Poland, 1996; p. 200. [Google Scholar]
- Ilnicki, P. Subsidence of Fenland Areas in the Noteć Valley under Longterm Agricultural Use Depending on Their Structure and Drainage Intensity. Doctoral Dissertation, Agricultural University, Szczecin, Poland, 1972; p. 63. [Google Scholar]
- Van den Akker, J.J.H.; Hendriks, R.F.A.; Pleijter, M. CO2 emissions from peat soils in agricultural use: Calculation and prevention. Agrociencia 2012, 16, 43–50. [Google Scholar]
- Grzywna, A. Peatlands surface subsidence in drainage grassland Polesie Lubelskie. Acta Sci. Pol. Cir. 2016, 15, 81–89. [Google Scholar] [CrossRef] [Green Version]
- Grzywna, A. The degree of peatland subsidence resulting from drainage of land. Environ. Earth Sci. 2017, 76, 1–8. [Google Scholar] [CrossRef] [Green Version]
- Brandyk, A.; Oleszczuk, R.; Urbański, J. Estimation of organic soils subsidence in the vicinity of hydraulic structures—Case study of a subirrigation system in Central Poland. J. Ecol. Eng. 2020, 21, 64–74. [Google Scholar] [CrossRef]
- Querner, E.P.; Jansen, P.C.; van den Akker, J.J.H.; Kwakernaak, C. Analysing water level strategies to reduce soil subsidence in Dutch peat meadows. J. Hydrol. 2012, 446–447, 59–69. [Google Scholar] [CrossRef]
- Van den Hardeveld, H.A.; Driessen, P.P.J.; Schot, P.P.; Wassen, M.J. An integrated modelling framework to assess long-term impacts of water management strategies steering soil subsidence in peatlands. Environ. Impact Asses. Rev. 2017, 66, 66–77. [Google Scholar] [CrossRef]
- Van den Hardeveld, H.A.; de Jong, H.; Knepfle, M.; de Lange, T.; Schot, P.P.; Spanjers, B.; Teurlincx, S. Integrated impact assessment of adaptive management strategies in a Dutch peatland polder. In Proceedings of IAHS Proceedings of the International Association of Hydrological Sciences (PIAHS), Copernicus Publications, Gottingen, Germany, 2020; Volume 382, pp. 553–557.
- Clark, D.; Rieley, J. (Eds.) Strategy for Responsible Peatland Management; International Peat Society: Jyväskylä, Finland, 2010; p. 39. [Google Scholar]
- Joosten, H.; Clarke, D. Wise Use of Mires and Peatlands-Background and Principles Including a Framework for Decision-Making; International Mire Conservation Group and International Peat Society: Saarijärvi, Finland, 2002; p. 304. [Google Scholar]
- Urzainki, I.; Laurén, A.; Palviainen, M.; Haahti, K.; Budiman, A.; Basuki, I.; Netzer, M.; Hökkä, H. Canal blocking optimization in restoration of drained peatlands. Biogeosciences 2020, 17, 4769–4784. [Google Scholar] [CrossRef]
- Gąsowska, M.; Oleszczuk, R.; Urbański, J. The estimation of the subsidence rate of drained peatland and verification of empirical equations of this process. Sci. Rev.—Eng. Environ. Sci. 2019, 28, 95–104. [Google Scholar]


| Site (Source) | Equation (Number) | Explanations of Symbols acc. to Sources | |
|---|---|---|---|
Noteć River Valley; drainage intensity of peatlands:
| (1) (2) (3) (4) | y—surface subsidence [cm] x—initial peat depth [cm] | |
| Peatlands in Central Europe (Ilnicki 1972) | (5) | y—surface subsidence [cm] x—initial peat depth [cm] | |
| Peatland of Moscow Research Station (Stankiewicz and Karelin 1965 after Ilnicki 1972) | (6) | y—surface subsidence [cm] x—initial peat depth [cm] | |
| Biebrza River Valley; Kuwasy I fen (Krzywonos 1974) | (7) | y—surface subsidence [cm] x—initial peat depth [cm] | |
Noteć River Valley; drainage intensity of peatlands:
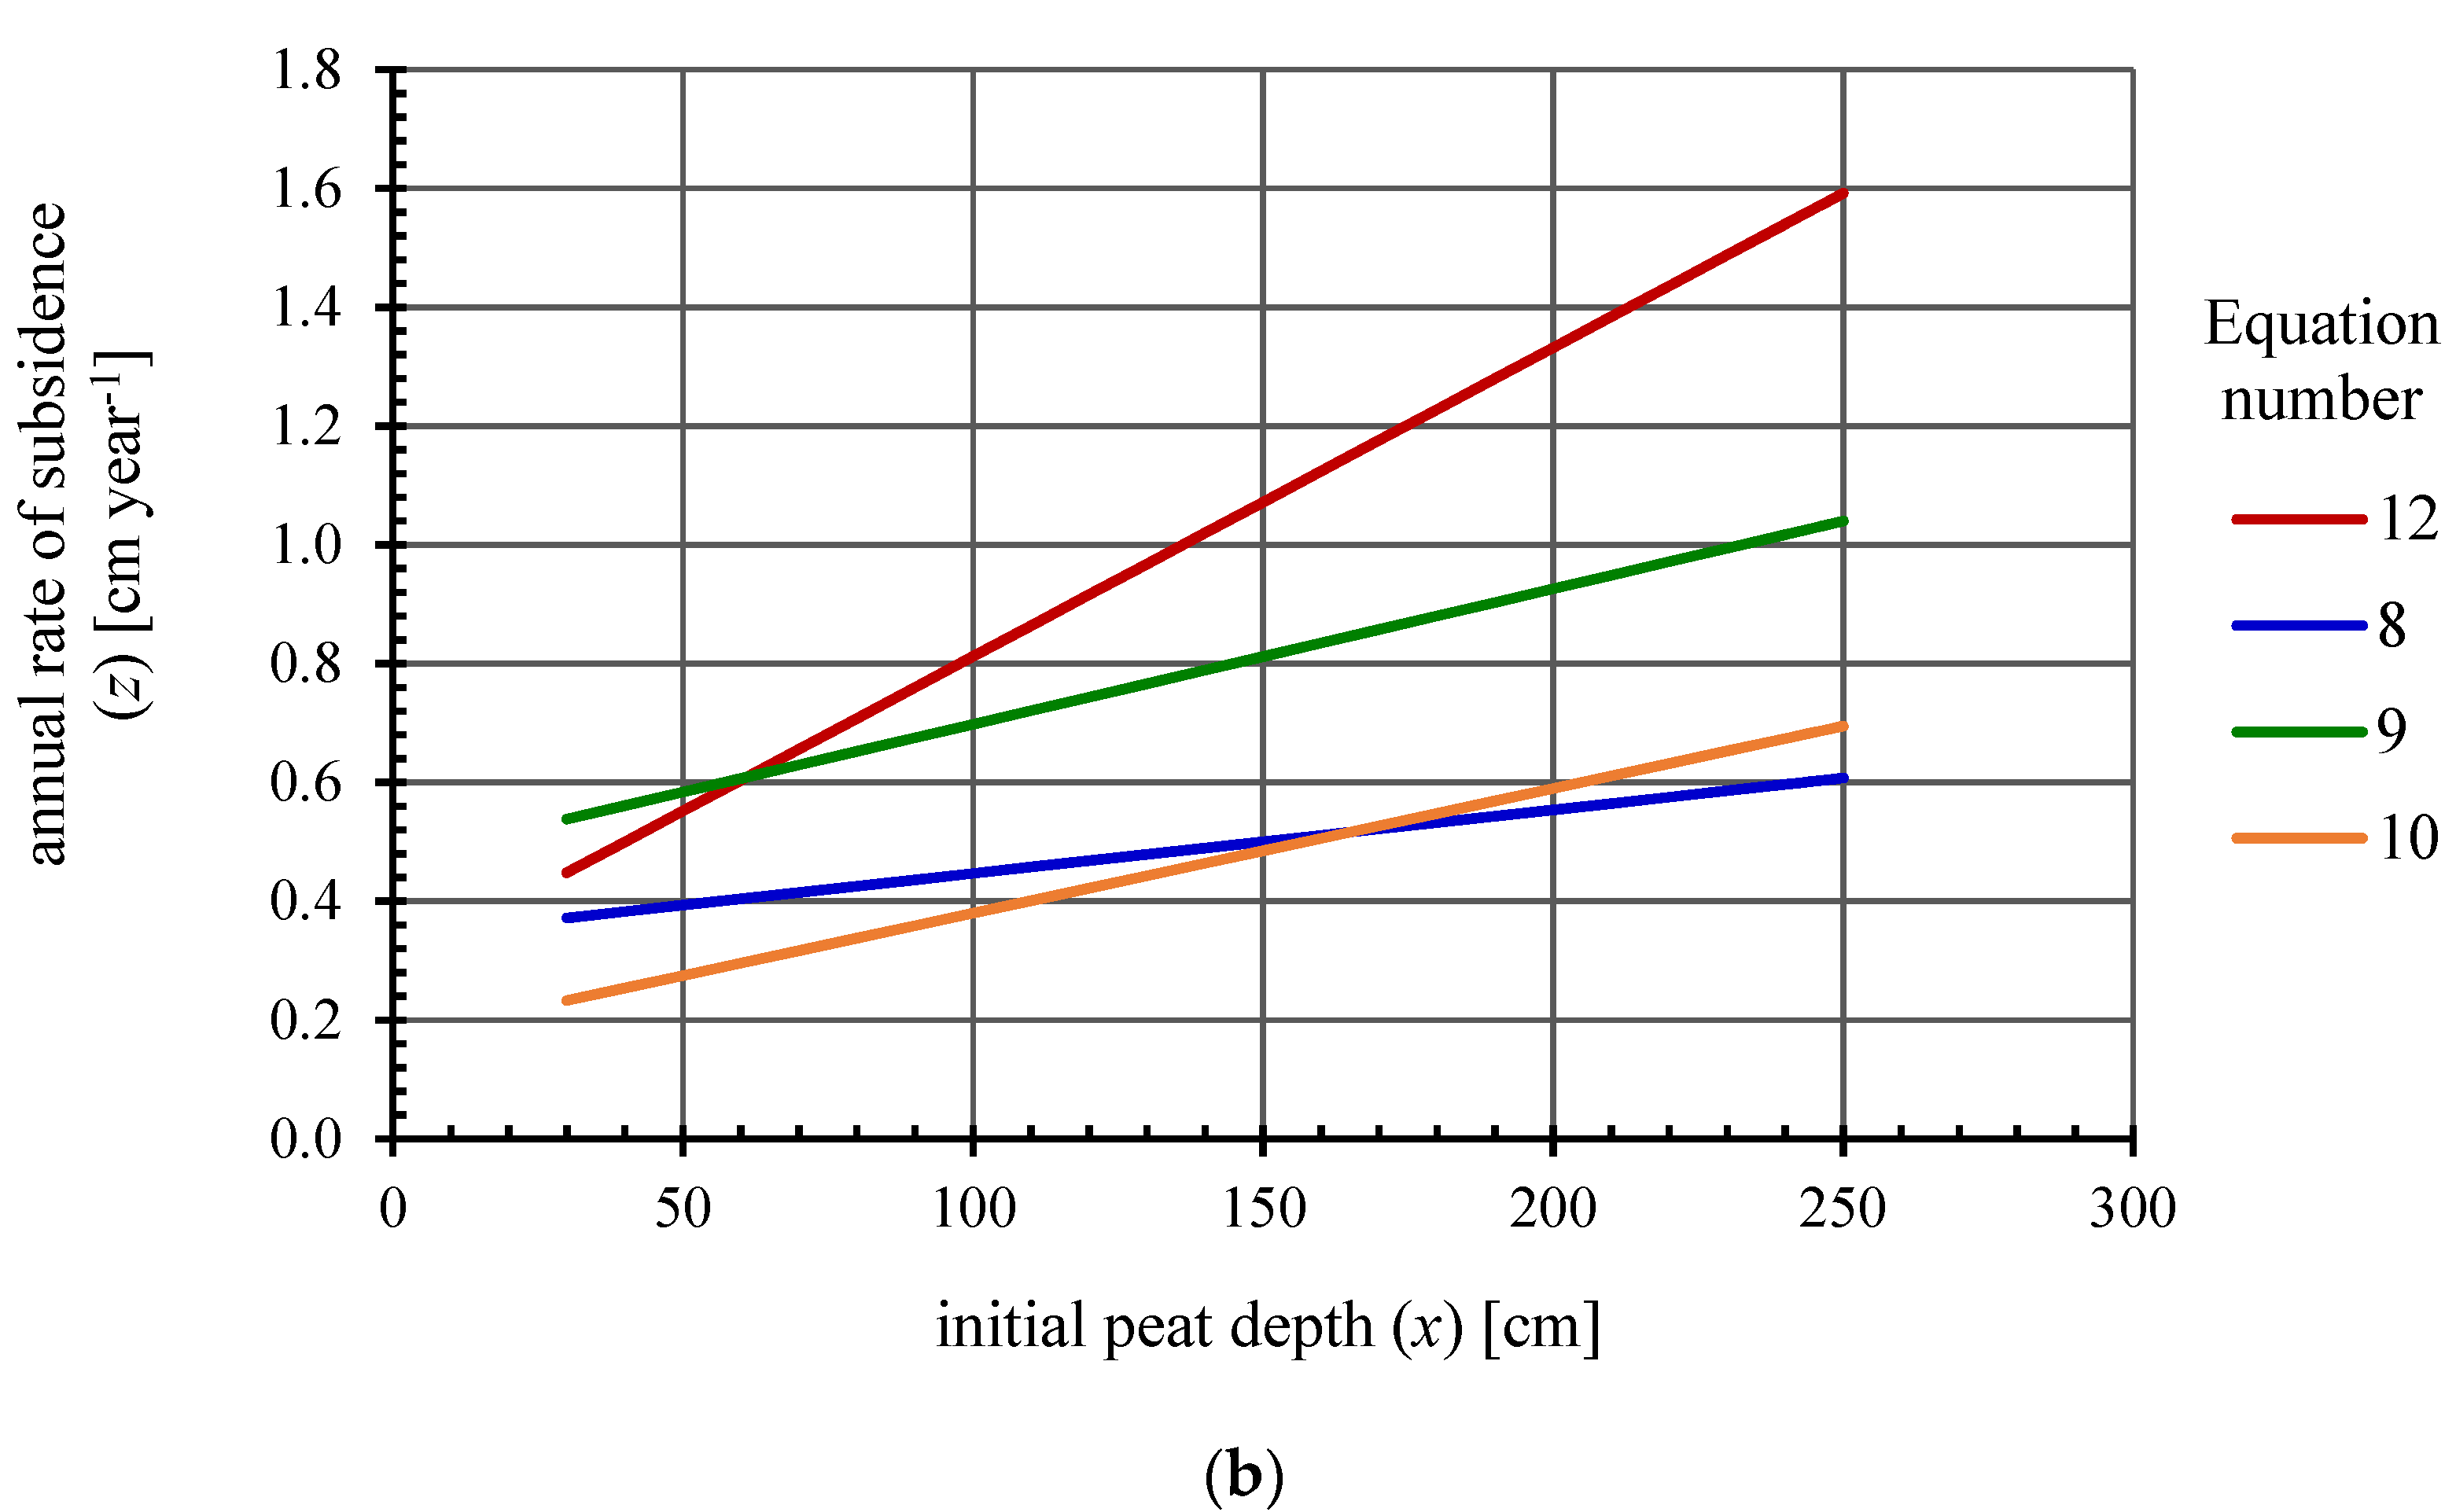
| (8) (9) (10) | z—average annual rate of soil surface subsidence [cm year−1] x—initial peat depth [cm] | |
| Ditch No. | Peat Depth (cm) | Ditch Shallowing (cm) | d/t Ratio (cm) | Subsidence (cm) | ||
|---|---|---|---|---|---|---|
| 1967 t0 | 2014 t | d = t0 − t | Banks | Bottom | ||
| R 15 | 0.89 (0.73–1.15) | 0.55 (0.40–0.75) | 0.35 (0.19–0.44) | 0.66 (0.35–1.00) | 0.63 (0.51–0.70) | 0.29 (0.24–0.32) |
| R 17 | 0.94 (0.81–1.09) | 0.75 (0.63–0.82) | 0.20 (0.09–0.34) | 0.27 (0.13–0.54) | 0.40 (0.26–0.63) | 0.20 (0.04–0.36) |
| R 19 | 1.10 (1.03–1.15) | 0.71 (0.56–0.94) | 0.38 (0.20–0.56) | 0.59 (0.22–0.95) | 0.61 (0.49–0.75) | 0.23 (0.00–0.38) |
| R 21 | 1.02 (0.93–1.06) | 0.71 (0.57–1.00) | 0.31 (0.05–0.40) | 0.47 (0.05–0.70) | 0.59 (0.42–0.80) | 0.28 (0.19–0.41) |
| R 22 | 1.18 (0.94–1.35) | 0.69 (0.50–0.85) | 0.49 (0.44–0.53) | 0.73 (0.59–0.88) | 0.55 (0.49–0.590 | 0.06 (0.05–0.07) |
| R 23 | 0.97 (0.88–1.13) | 0.58 (0.42–0.72) | 0.39 (0.21–0.51) | 0.73 (0.31–1.67) | 0.60 (0.42–0.74) | 0.21 (0.04–0.40) |
| R 24 | 0.98 (0.76–1.12) | 0.83 (0.65–1.05) | 0.15 (0.01–0.38) | 0.20 (0.01–0.58) | 0.23 (0.04–0.50) | 0.08 (0.03–0.12) |
| R 25 | 0.81 (0.73–0.89) | 0.72 (0.68–0.77) | 0.10 (0.04–0.12) | 0.14 (0.06–0.18) | 0.21 (0.11–0.29) | 0.11 (0.07–0.17) |
| R 26 | 0.99 (0.79–1.10) | 0.75 (0.54–0.94) | 0.23 (0.02–0.46) | 0.36 (0.03–0.85) | 0.35 (0.06–0.56) | 0.11 (0.03–0.21) |
| R 26a | 0.92 (0.85–1.00) | 0.71 (0.60–0.85) | 0.21 (0.07–0.30) | 0.31 (0.09–0.43) | 0.34 (0.22–0.44) | 0.13 (0.10–0.15) |
| R 27 | 0.85 (0.75–0.95) | 0.75 (0.61–0.93) | 0.10 (0.02–0.16) | 0.15 (0.02–0.25) | 0.26 (0.07–0.36) | 0.16 (0.05–0.27) |
| R 29 | 0.98 (0.90–1.10) | 0.79 (0.76–0.87) | 0.19 (0.03–0.32) | 0.24 (0.03–0.41) | 0.40 (0.28–0.57) | 0.20 (0.04–0.38) |
| Total | 0.97 (0.73–1.35) | 0.71 (0.40–1.05) | 0.26 (0.01–0.56) | 0.41 (0.01–1.17) | 0.43 (0.04–0.80) | 0.18 (0.00–0.41) |
| Ditch No. | L (m) | Peat Depth 1967 | Subsidence | Average Annual Subsidence Rate | |
|---|---|---|---|---|---|
| (cm) | y (cm) | y(%) (%) | z (cm year−1) | ||
| R 15 | 450 | 141.2 (95–255) | 63.2 (51–70) | 50.3 (27.5–71.6) | 1.34 (1.09–1.49) |
| R 17 | 470 | 135.6 (102–200) | 40.0 (26–63) | 30.6 (17.0–40.4) | 0.85 (0.55–1.34) |
| R 19 | 490 | 163.6 (108–226) | 61.0 (49–75) | 39.2 (23.5–62.8) | 1.30 (1.04–1.60) |
| R 21 | 500 | 152.0 (82–237) | 58.5 (42–80) | 42.7 (23.1–62.8) | 1.24 (0.89–1.70) |
| R 22 | 260 | 120.0 (65–165) | 55.0 (49–59) | 51.8 (34.5–75.4) | 1.17 (1.04–1.26) |
| R 23 | 500 | 150.3 (103–223) | 60.3 (42–74) | 42.3 (33.2–58.6) | 1.28 (0.89–1.57) |
| R 24 | 510 | 114.8 (63–160) | 22.5 (4–50) | 19.0 (4.4–39.1) | 0.48 (0.09–1.06) |
| R 25 | 310 | 52.5 (31–95) | 21.0 (11–29) | 42.6 (30.5–56.8) | 0.45 (0.23–0.62) |
| R 26 | 510 | 120.3 (70–170) | 35.3 (6–56) | 26.9 (8.6–45.0) | 0.75 (0.13–1.19) |
| R 26a | 540 | 109.2 (30–170) | 33.8 (22–44) | 39.3 (22.4–73.3) | 0.72 (0.47–0.94) |
| R 27 | 370 | 72.5 (40–110) | 26.0 (7–36) | 35.0 (17.5–48.3) | 0.55 (0.15–0.77) |
| R 29 | 324 | 90.0 (59–130) | 39.5 (28–57) | 44.3 (39.8–47.5) | 0.84 (0.60–1.21) |
| Total | - | 121.7 (30–255) | 43.3 (4–80) | 37.7 (4.4–75.4) | 0.92 (0.09–1.70) |
Publisher’s Note: MDPI stays neutral with regard to jurisdictional claims in published maps and institutional affiliations. |
© 2021 by the authors. Licensee MDPI, Basel, Switzerland. This article is an open access article distributed under the terms and conditions of the Creative Commons Attribution (CC BY) license (https://creativecommons.org/licenses/by/4.0/).
Share and Cite
Oleszczuk, R.; Zając, E.; Urbański, J.; Jadczyszyn, J. Rate of Fen-Peat Soil Subsidence Near Drainage Ditches (Central Poland). Land 2021, 10, 1287. https://doi.org/10.3390/land10121287
Oleszczuk R, Zając E, Urbański J, Jadczyszyn J. Rate of Fen-Peat Soil Subsidence Near Drainage Ditches (Central Poland). Land. 2021; 10(12):1287. https://doi.org/10.3390/land10121287
Chicago/Turabian StyleOleszczuk, Ryszard, Ewelina Zając, Janusz Urbański, and Jan Jadczyszyn. 2021. "Rate of Fen-Peat Soil Subsidence Near Drainage Ditches (Central Poland)" Land 10, no. 12: 1287. https://doi.org/10.3390/land10121287