Article

Evaluating the Dominant Controls of Water Erosion in Three Dry Valley Types Using the RUSLE and Geodetector Method

1
Research Center for Digital Mountain and Remote Sensing Application, Institute of Mountain Hazards and Environment, Chinese Academy of Sciences, Chengdu 610041, China
2
College of Resources and Environment, University of Chinese Academy of Sciences, Beijing 100049, China
*
Author to whom correspondence should be addressed.
Land 2021, 10(12), 1289; https://doi.org/10.3390/land10121289
Submission received: 15 October 2021 / Revised: 14 November 2021 / Accepted: 18 November 2021 / Published: 24 November 2021

Abstract

:
The dry valley is a unique geographic phenomenon in Southwest China with severe water erosion. However, little is known regarding its dominant controls and the discrepancies between dry valley subtypes, leading to the poor management of water erosion. To solve these problems, the revised universal soil loss equation (RUSLE) and Geodetector method were used in a dry temperate (DT), dry warm (DW), and dry hot (DH) valley. Results indicated that dry valleys suffer severe water erosion with a value of 64.78, 43.85, and 33.81 t·ha−1·yr−1. The Geodetector method is proven to be an efficient tool to quantify the dominant factor of water erosion. It was established that land use types (LUT) have the closest relationship with water erosion. The controls for water erosion could be better explained by multi-factor interactions analysis, particularly for the combination of slope and LUT in DW (q = 0.71) and DH (q = 0.66). Additionally, regions at high risk of water erosion were characterized by steep slope (>30°) and low vegetation coverage (<50%) in DT, while the opposite is shown in DH. These findings could provide insight for guiding soil erosion management and ecological restoration strategies that balance economic and environmental sustainability.

1. Introduction

Water erosion caused primarily by anthropogenic disturbances and related land use changes is a critical environmental problem that has substantially influenced ecosystem deterioration, diminished the productivity of cultivated land, and caused detrimental economic impact [1,2]. The global area of water erosion is 11 million km2 and it can be manifested on various scales from a slowly developing process to a flash flood disaster [3,4,5]. Throughout the world, the fight against water erosion has represented a core and frontier topic and is reflected in numerous global initiatives [6,7]. To assess water erosion correctly and precisely at different spatial and temporal scales, 435 distinct models and model variants have been developed (e.g., Water Erosion Prediction Project, WEPP; Chinese Soil Loss Equation, CSLE; European Soil Erosion Model, EUROSEM), of which the empirical revised universal soil loss equation (RUSLE) model is by far the most widely used [8,9]. According to previous studies, it has been estimated that soil losses in Mediterranean regions exceed 50 t·ha−1·yr−1 because of steep slopes and fragile soils [10]. The European Union Environment Directorate estimated that the mean annual soil loss across northern and southern Europe was 8 and 30 t·ha−1·yr−1 in 2000, respectively [11]. In China, the total area of water erosion exceeded 1.29 × 10⁶ km2, of which 17.32% was in Southwest China (Sichuan and Yunnan Province) and the average rate of water erosion across the country was 5.02 t·ha−1·yr−1 according to the fourth national formal scientific survey [12]. The high erosion intensity hotspot was mainly concentrated in Southwest China and the water erosion rate was 25.77 t·ha−1·yr−1.
The dry valley area, located in the first and second step transition belt of Southwest China, represents a unique physiographical region [13,14]. This area is considered a typical monsoon climate zone owing to the complex interplay between the topography and atmospheric circulation [15]. The dry valley is a unique geographic phenomenon in the Himalayan Mountains, where a dry and hot environment at the bottom of a valley is surrounded by a humid environment owing to the deeply incised alpine gorge landforms. Warm deciduous broadleaved thicket is the most representative vegetation in this area [16,17]. In general, the dry valley has low annual precipitation (500–900 mm), high temperature (mean annual temperature > 10 °C), and high evapotranspiration (precipitation less than evapotranspiration). Additionally, 90% of annual total precipitation falls in the wet season (from mid-May to mid-October). The dry valley area is the most serious area of water erosion in the southwest due to the dense population (23.6 people per km2), sparse vegetation, unique climate and fragmented topography. Lin et al. [18] and Duan et al. [19] determined the relationship between water erosion and vegetation succession and soil productivity in dry valleys. He et al. [20] estimated that the water erosion rate was 45.06 t·ha−1·yr−1 in dry valley conditions using a runoff plot positioning observation method. Xin et al. [21] and Jiang et al. [22] established the water erosion rate as 48.89 and 22.75 t·ha−1·yr−1 in upper reaches of Min River and Dadu River catchment using RUSLE. However, the formation of dry valleys is generally complex, leading to various subtypes such as dry–temperate (DT), dry–warm (DW), and dry–hot (DH) valleys. Understanding the water erosion process of this unique geographic zone in relation to the regional climatic background has been severely hindered.
Quantitative clarification of the influence of these factors on water erosion is essential to guide soil erosion management and ecological restoration. Several recent studies have shown that land use type (LUT) is the principal influencing parameter of erosion via its impact on soil properties [23,24]. Apollonio et al. [25] demonstrated that perennial herbaceous plants have a significant effect on reducing water erosion and runoff coefficients. Stanchi et al. [26] studied the effects of different soil management approaches on water erosion and fertility loss in a sloping vineyard, on which permanent grassing and buffering strips reduced water erosion considerably with respect to weeding. Rainfall has also been found to be another parameter that directly triggers water erosion [27,28]. However, traditional management of soil and water control has little effect on this region owing to the lack of clarity regarding the dominant influencing factors.
The Geodetector method, which includes four detectors, was developed to quantitatively calculate a coefficient value representing the strength of the relationship between potential impact factors and an event, based on statistical principles [29]. Chu et al. [30] established the individual dominant control factors and the interactive dominant control factors in the Three Gorges Reservoir Area. Liang et al. [31] evaluated the contribution of six impact factors to water erosion using the Geodetector method, which suggested that vegetation coverage and the interaction between vegetation coverage and slope has a close relationship with water erosion in the Qiantang River catchment, respectively. Yu et al. [32] explored the relationship between water erosion and four natural factors (vegetation coverage, slope, elevation, and annual precipitation) in Central Yunnan Province. Zhao et al. [33] showed that the effect size of interaction between two impact factors was higher than that of a single factor and cultivated land was recognized as a high-risk zone. Although many studies have been conducted to determine the dominant factor affecting water erosion, the relative contribution of each erosion factor in dry valley area remains unclear.
Previous studies on water erosion have primarily been conducted at the small watershed scale. However, few studies have performed comparative assessment of water erosion in different valley subtypes and quantitative assessment of the contributions of the influencing factors of water erosion in ecologically fragile landscapes, especially the dry valley region of Southwest China. Accordingly, the objectives of our study were as follows: (1) to determine and compare the water erosion rate in the three typical dry valley subtypes, (2) to quantify the contributions and interacting influences of each dominant factor on water erosion using the Geodetector method, and (3) to predict regions at high risk of water erosion. The findings provide insight into the water erosion process and represent scientific reference for policy makers regarding soil and water management in the dry valley region of China.

2. Materials and Methods
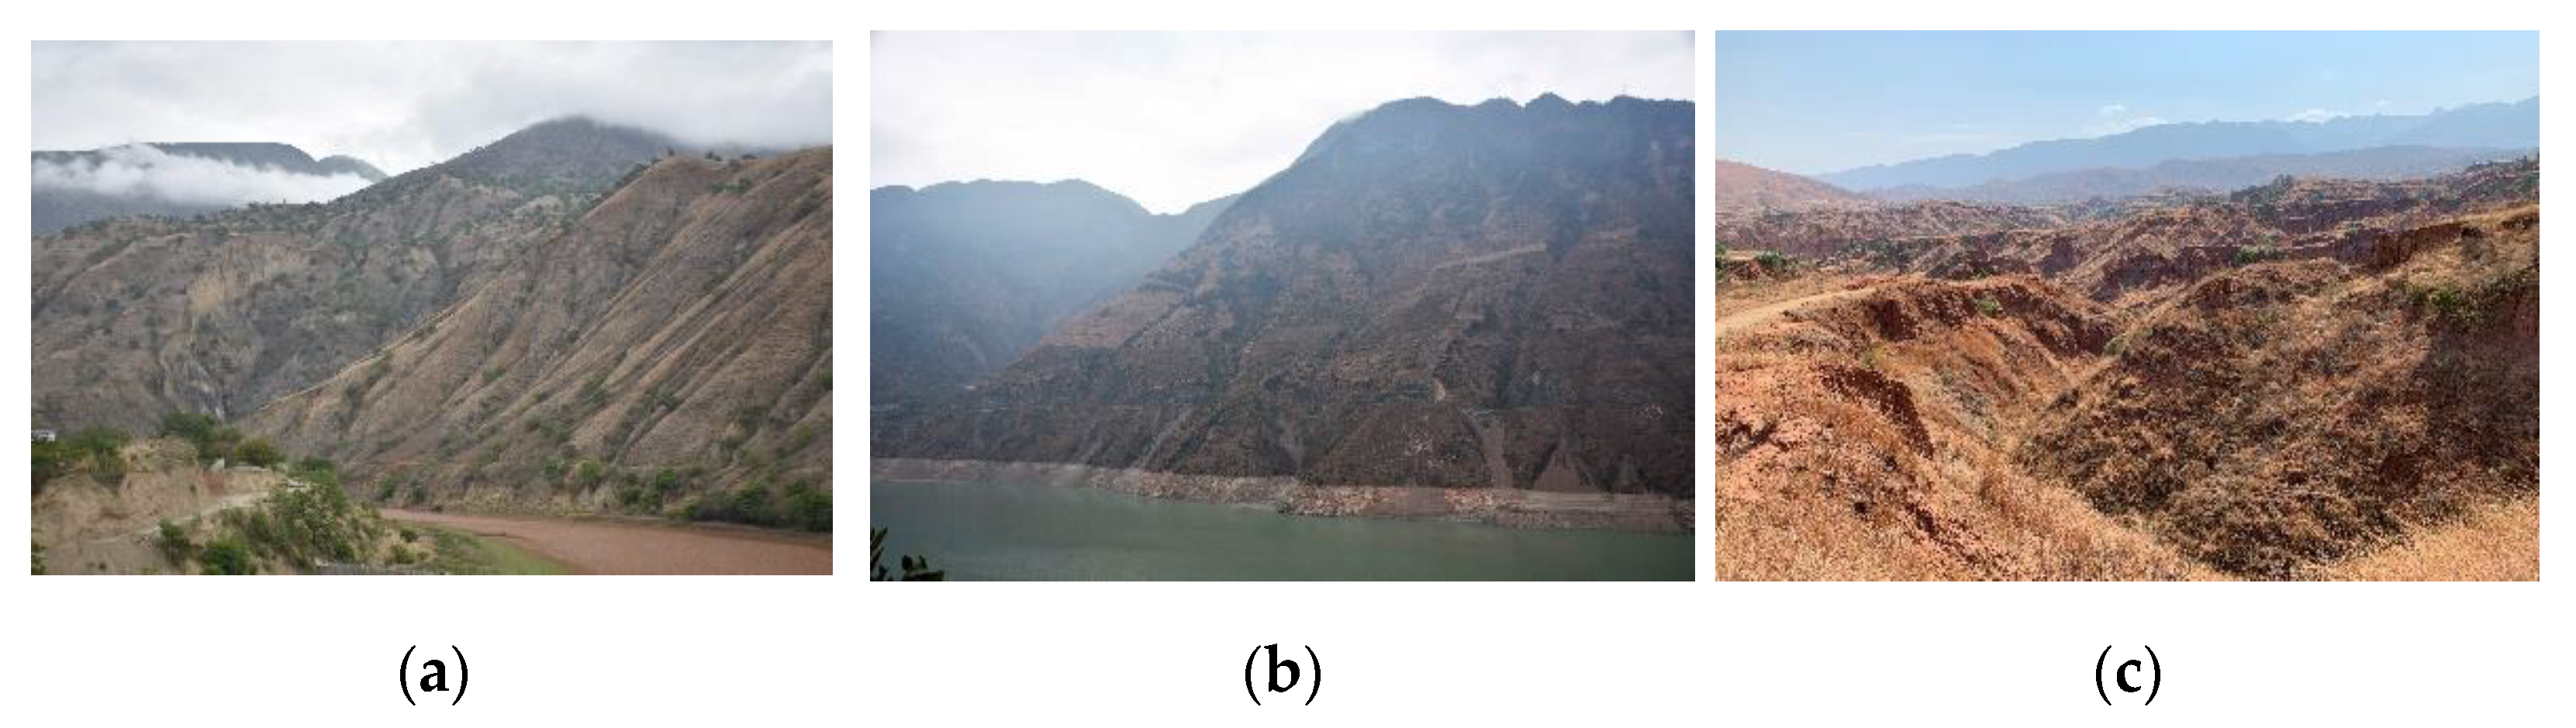
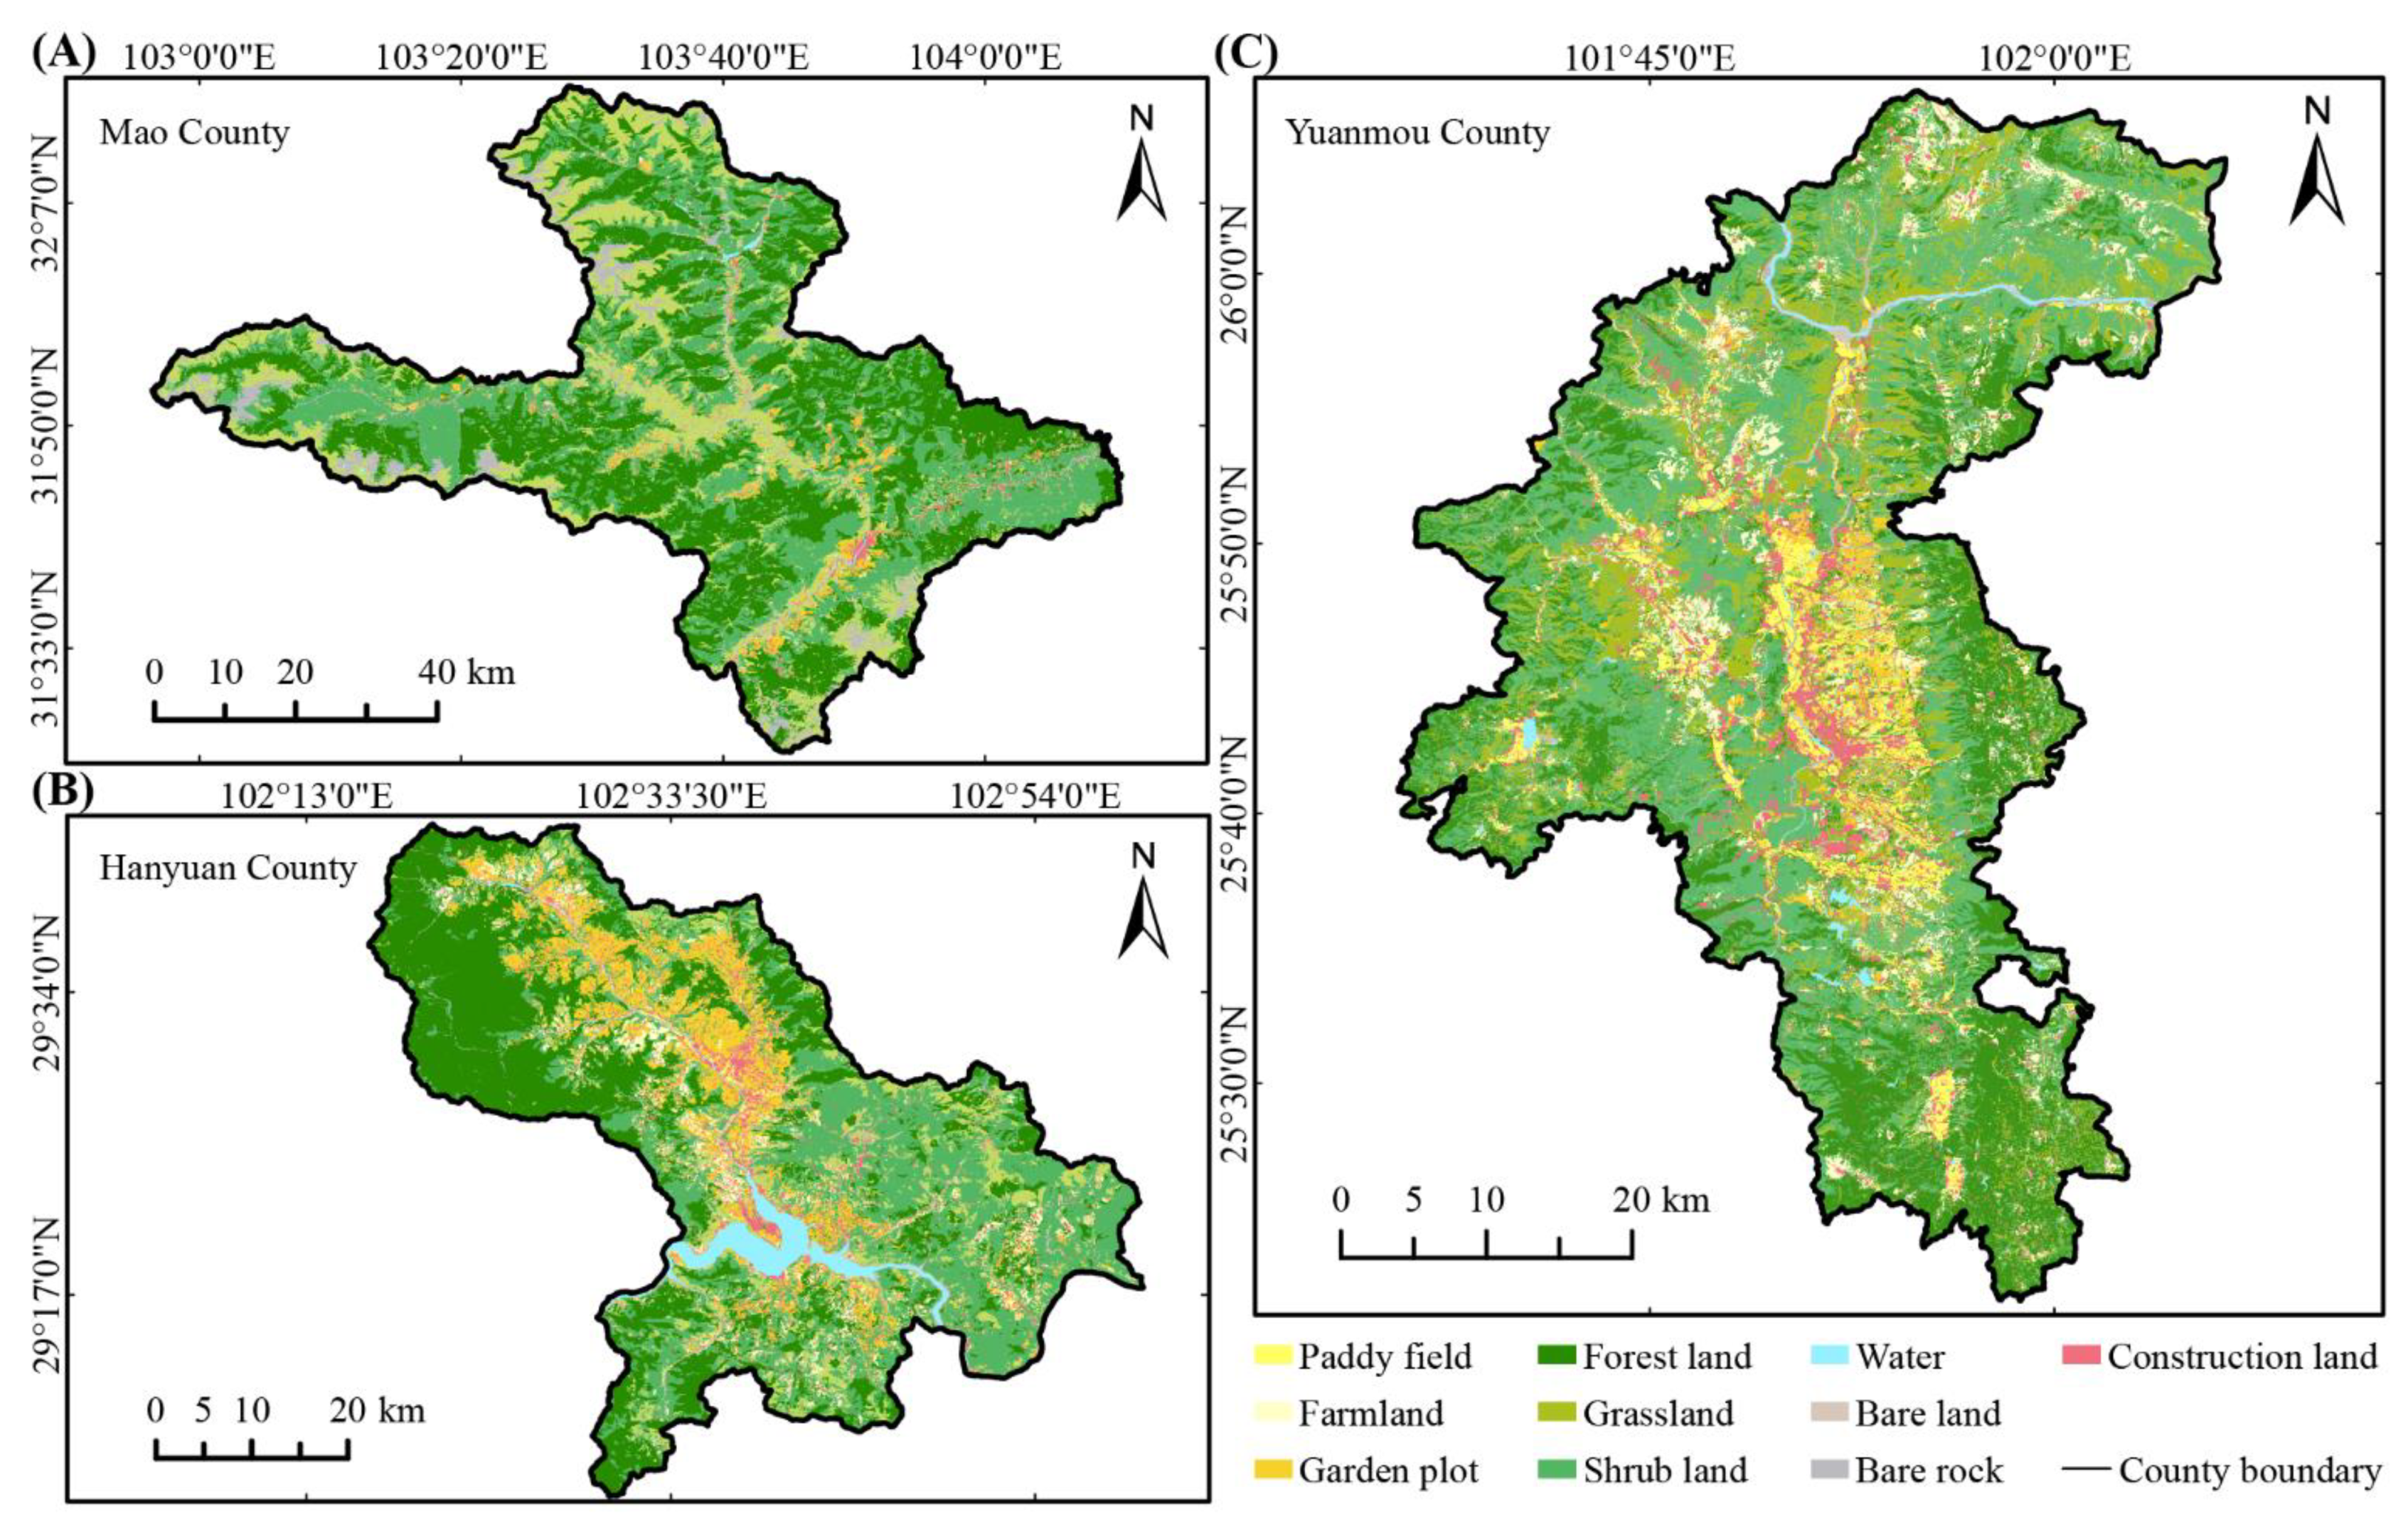
2.1. Study Area

The dry valley region includes three valley subtypes (dry–temperate (DT), dry–warm (DW), and dry–hot (DH) valleys) arranged from south to north according to variations in physical and anthropogenic factors [34]. This study on the dry valley region of Southwest China focused on DT, DW, and DH valley subtypes located in Mao County (31°14′–32°27′ N, 102°53′–104°13′ E), Hanyuan County (29°05′–29°43′ N, 102°16′–103°00′ E), and Yuanmou County (25°23′–26°06′ N, 101°35′–102°06′ E), respectively (Figure 1 and Figure 2). Geographical information on the three counties can be seen in Table 1.
Mao County covers an area of 3896.65 km2 on the southeastern edge of the Qinghai–Tibet Plateau. The mean annual temperature is 11.20 °C and the mean annual precipitation is 486.30 mm. The mean steepness is 34.08° and the watershed average slope length is 20.20 m. It is a typical V-shaped valley with a mean bottom width of 0.41 km. Geologically, Mao County is controlled by the Jiaochang arc structure, Minjiang Fault, and Minshan Block. The main outcropping rock formations belong to the Triassic Zagunao Group, comprising metamorphic sandstone interbedded with slate and partial limestone and phyllite [35]. Soil types show obvious vertical distribution in Mao County, comprising cinnamon soils (1370–3840 m), brown soils (1270–4700 m), and dark-brown soils (1640–4490 m). The yellow-brown soils (910–2640 m) and subalpine meadow soil (2620–4980 m) are distributed mainly in eastern and western parts of the study area, respectively.
Hanyuan County, which is located in the middle of the Dadu River Basin and on the eastern edge of the Hengduan Mountain Region, has a total area of 2214.80 km2. The topography is high in the northwest and low in the southeast. The mean annual temperature is 17.90 °C and the mean annual precipitation is 741.80 mm. The mean steepness is 29.98° and the watershed average slope length is 18.60 m. It is a typical U-shaped valley with a mean bottom width of 1.89 km. Geologically, Hanyuan County is located at the intersection of the Central Sichuan Block, Sichuan–Qinghai Block and Sichuan–Yunnan Block. The geological structure in this region is extremely complex, consisting of a series of northwest–southeast folds and fractures, among which the Jinping Fault, Hanyuan–Ganluo Fault, Liusha River Hidden Fault, and Yiping–Wanping Fault are active fractures, although activity has been weak since the Holocene [36]. The soil-forming parent material in Hanyuan County can be divided into four categories: purple rock, magmatic rock, limestone, and quaternary new/old alluvial deposits, and the soil types can be divided into six areas: purplish soils in Yidong, limestone soils, brown soils, and yellow-brown soils on the southwest slopes of Daxiangling, red soils, limestone soils, and paddy soils in Dadu valley, brown soils, limestone soils, and mountain meadow soils in Huangmu, yellow-brown soils and limestone soils in Shaijing, and dark-brown soils and podzolic soils in Feiyueling.
Yuanmou County is in the center of the Yunnan–Guizhou Plateau on the lower reaches of the Jinsha River. The elevation of the terrain is lower in the central area and higher in the border regions, with a general south–north incline. The elevation ranges from 898 to 2835.5 m (a.s.l.) but fluctuates widely, with a relative height difference of 1937.5 m [37]. The mean annual temperature is 21.90 °C and the mean annual precipitation is 613.80 mm. The mean steepness is 20.64° and the watershed average slope length is 14.50 m. It is a basin with a mean bottom width of 5.97 km. The mean annual potential evaporation in Yuanmou County is ca. 3900 mm, which is 6.4 times greater than the amount of precipitation. Along the eastern margin of the Yuanmou Basin, the Yuanmou–Dongshan Fault (fracture zone) extends in a north–south direction and borders the Jurassic Fengjiahe and Cretaceous Matoushan formations [38]. The soil in Yuanmou County is classified into a group composed of nine soil types, 14 soil subgroups, 25 soil genera, and 51 species, and purplish soil is distributed mainly in the hilly area [37].

2.2. Data and Methods

The dataset used in this study comprised a high-resolution digital elevation model derived from topographic maps (1:50,000), normalized difference vegetation index and fractional vegetation coverage (FVC) data derived from cloud-free Landsat-8 Operational Land Imager images taken during the growing season in 2017, soil property data from the Harmonized World Soil Database (version 1.1, 1-km resolution; Table 2), daily rainfall data recorded at 12 national meteorological stations in 2017 and obtained from the China Meteorological Data Service Center (http://data.cma.cn/, accessed on 15 August 2020), dry valley boundaries taken from Fan et al. [39], and LUT data from the second national land survey that were revised according to the Landsat-8 Operational Land Imager images acquired in the same year (Figure 3).
The RUSLE model, which is one of the most popular empirical soil erosion models, has been applied widely because of the progress in geographic information science, availability of large-scale temporal and spatial data, and need for ecological management. The mathematical expression of the RUSLE model is shown in Equation (1):
A = R K L S C P
where A is the annual soil erosion rate (t·ha−1·yr−1); R is the rainfall erosivity factor (MJ·mm·ha−1·MJ−1·mm−1); K is the soil erodibility factor (t·ha·h·ha−1·MJ−1·mm−1); L and S are the slope length and steepness factors (dimensionless), respectively; C is the vegetation cover management practice factor (dimensionless); and P is the conservation and support factor (dimensionless).
In this study, the erosion/productivity impact calculator model was used to calculate K; rainfall observations could not be obtained directly due to the lack of meteorological stations in this study area. Therefore, the daily rainfall erosivity model [40] was used to calculated R from the daily observations of the meteorological stations around each study area. Then they were interpolated using the IDW method [41]; L was calculated using the slope length, angle, and steepness derived from the high-resolution digital elevation model [42]; and S was estimated by implementing step coupling methods [43] and revised to 9.9 for slopes >30°. The Wenner method employed in this research has been proven an effective empirical formula for calculating P [44]. C was assigned according to the land use type, growth stage of that vegetation and vegetation cover percentage. In this study, the C values of different types and states of land use classes were obtained by field investigation, vegetation cover percentage from NDVI according to the study of Cai et al. [45], and former research in the similar study area (Table 3). The C values of paddy field, water, and bare rock were 0. The C values of construction land and bare land were 0.01 and 0.70, respectively. Additionally, the C value of farmland was calculated using Equation (2), and the dimidiate pixel model was used to calculate FVC:
C f a r m l a n d = { 0.221 0.595 log f 0.05 f 1 1 f 0.05
where f is the FVC value (dimensionless).
The mathematical expression of the Geodetector method is shown in Equation (3):
q = 1 h = 1 L N h σ h 2 N σ 2
where h indicates the impact factor of water erosion, and its total number is L; N and Nh represent the number of units in the entire region and in the h-th stratum, respectively; σ 2 and σ h 2 represent the variance of water erosion in the entire region and in the h-th stratum, respectively.
The factor detector estimates the spatial differentiation of events (e.g., soil erosion, pollution, or poverty) and determines the proportional contributions of relevant impact factors, which can be quantified using the q value ([0,1]) [46]. If q is equal to 1, the input factor can completely explain the event; conversely, if q is equal to 0, the input factor is completely irrelevant to the event. The risk detector is used to search areas that are potentially at high risk, and the interaction detector is used to characterize the complex interplay of two impact factors in an event [46]. In this study, four impact factors closely related to soil erosion were selected as input parameters. All continuous variables that included rainfall, slope, and FVC were discretized into strata data. Rainfall and slope were discretized into nine classes, whereas the FVC data were divided into seven categories: <0.4, 0.4–0.5, 0.5–0.6, 0.6–0.7, 0.7–0.8, 0.8–0.9, and 0.9–1.

3. Results

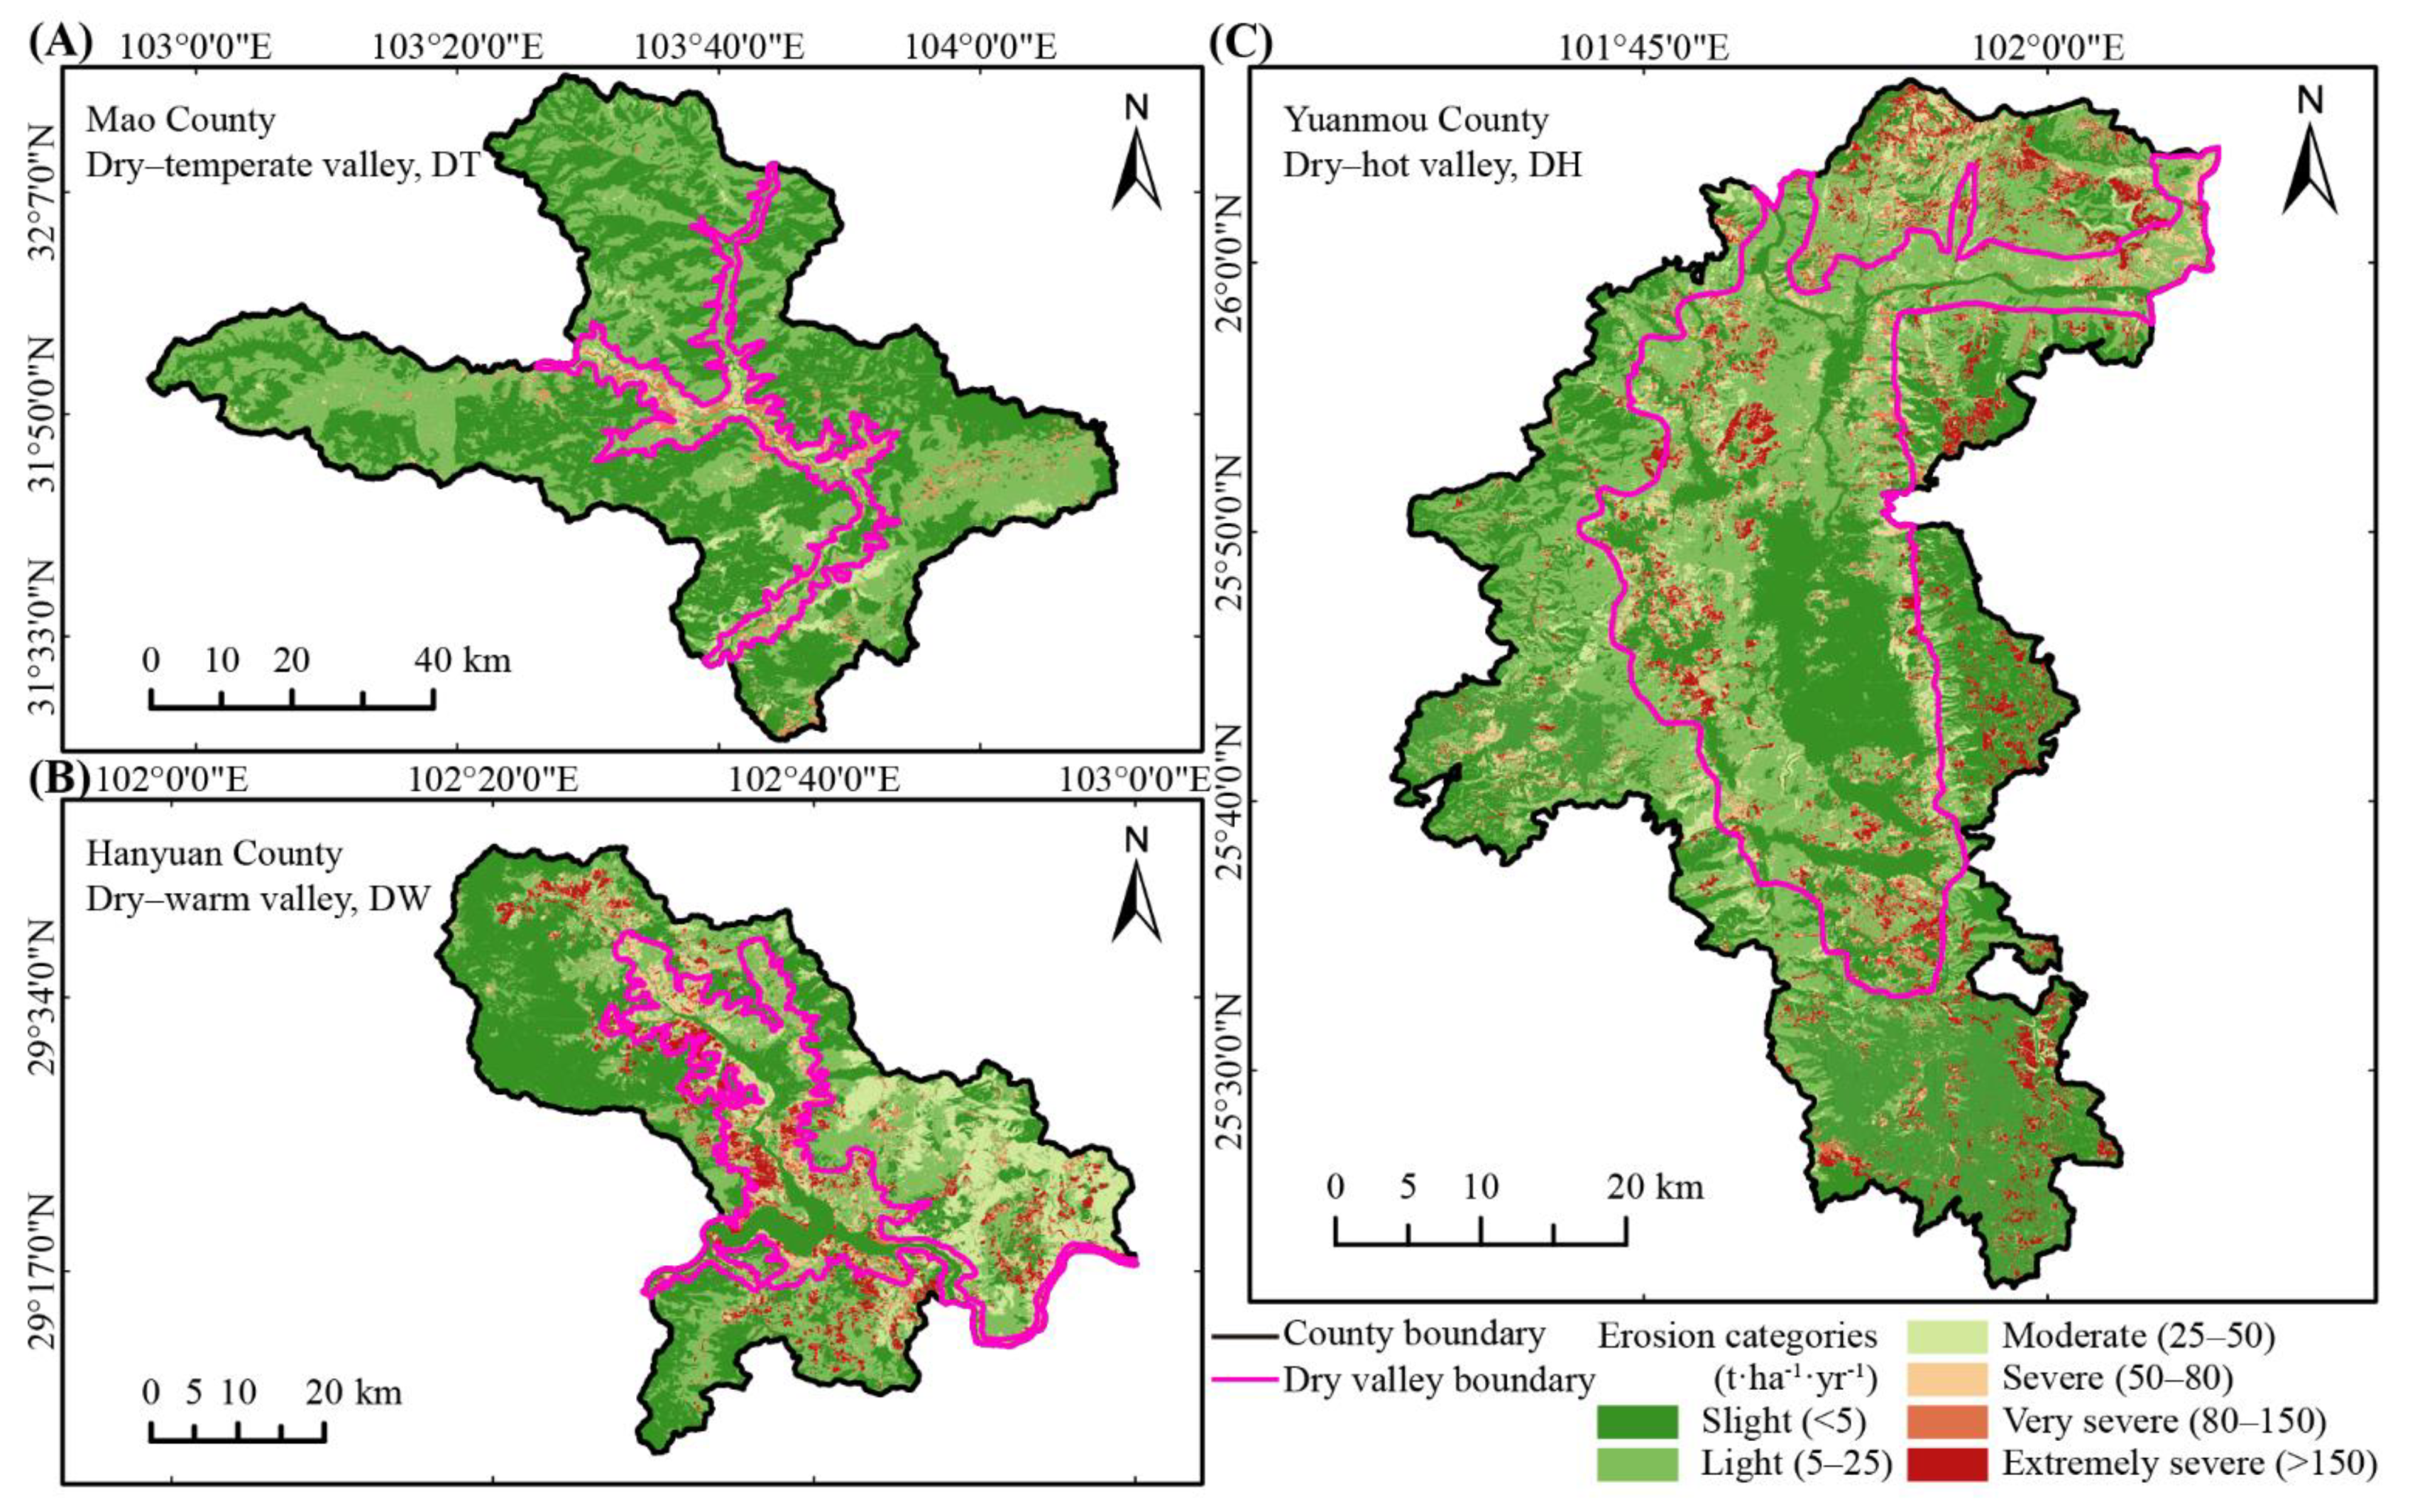
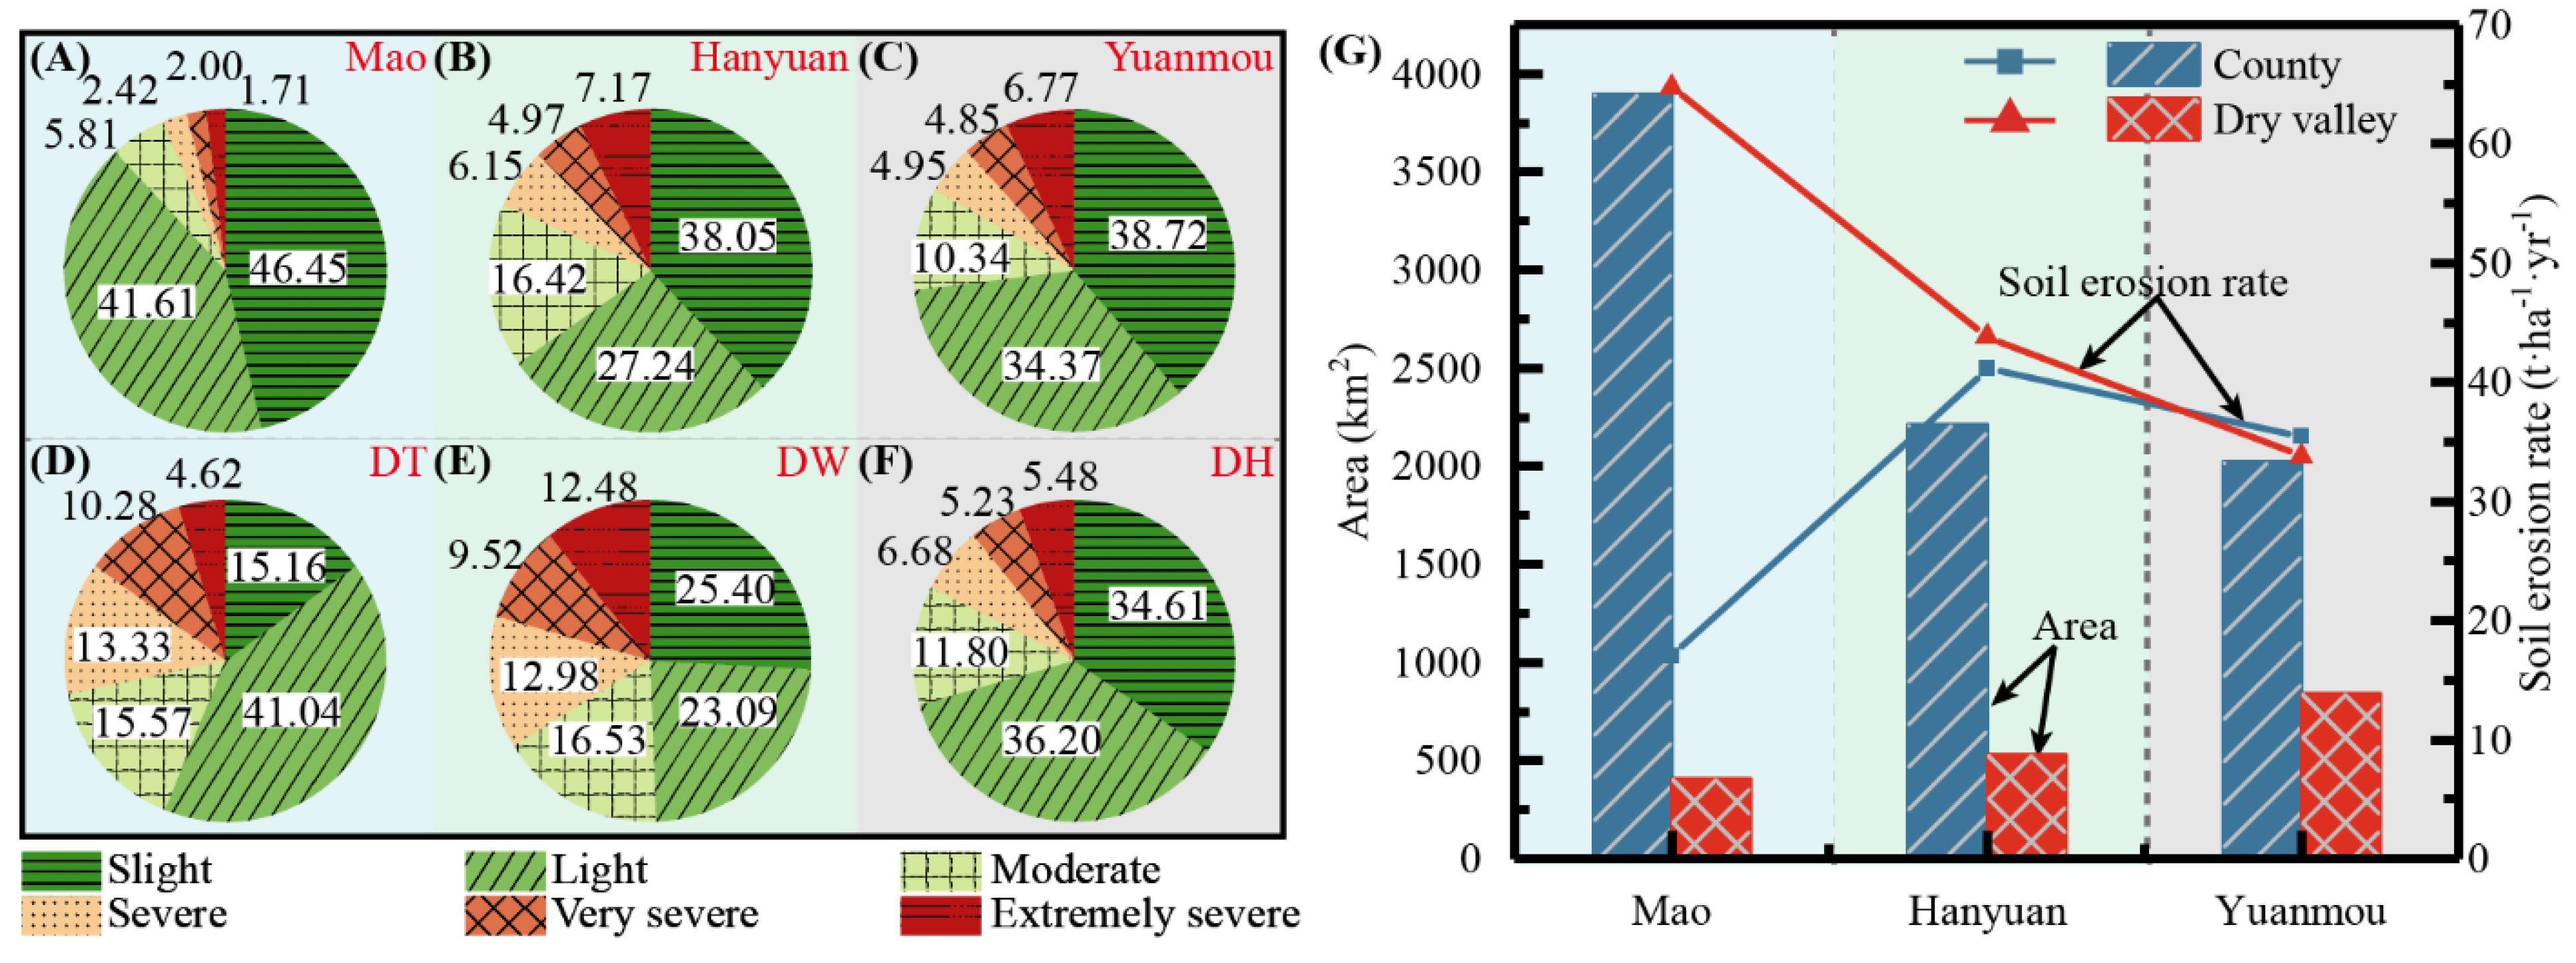
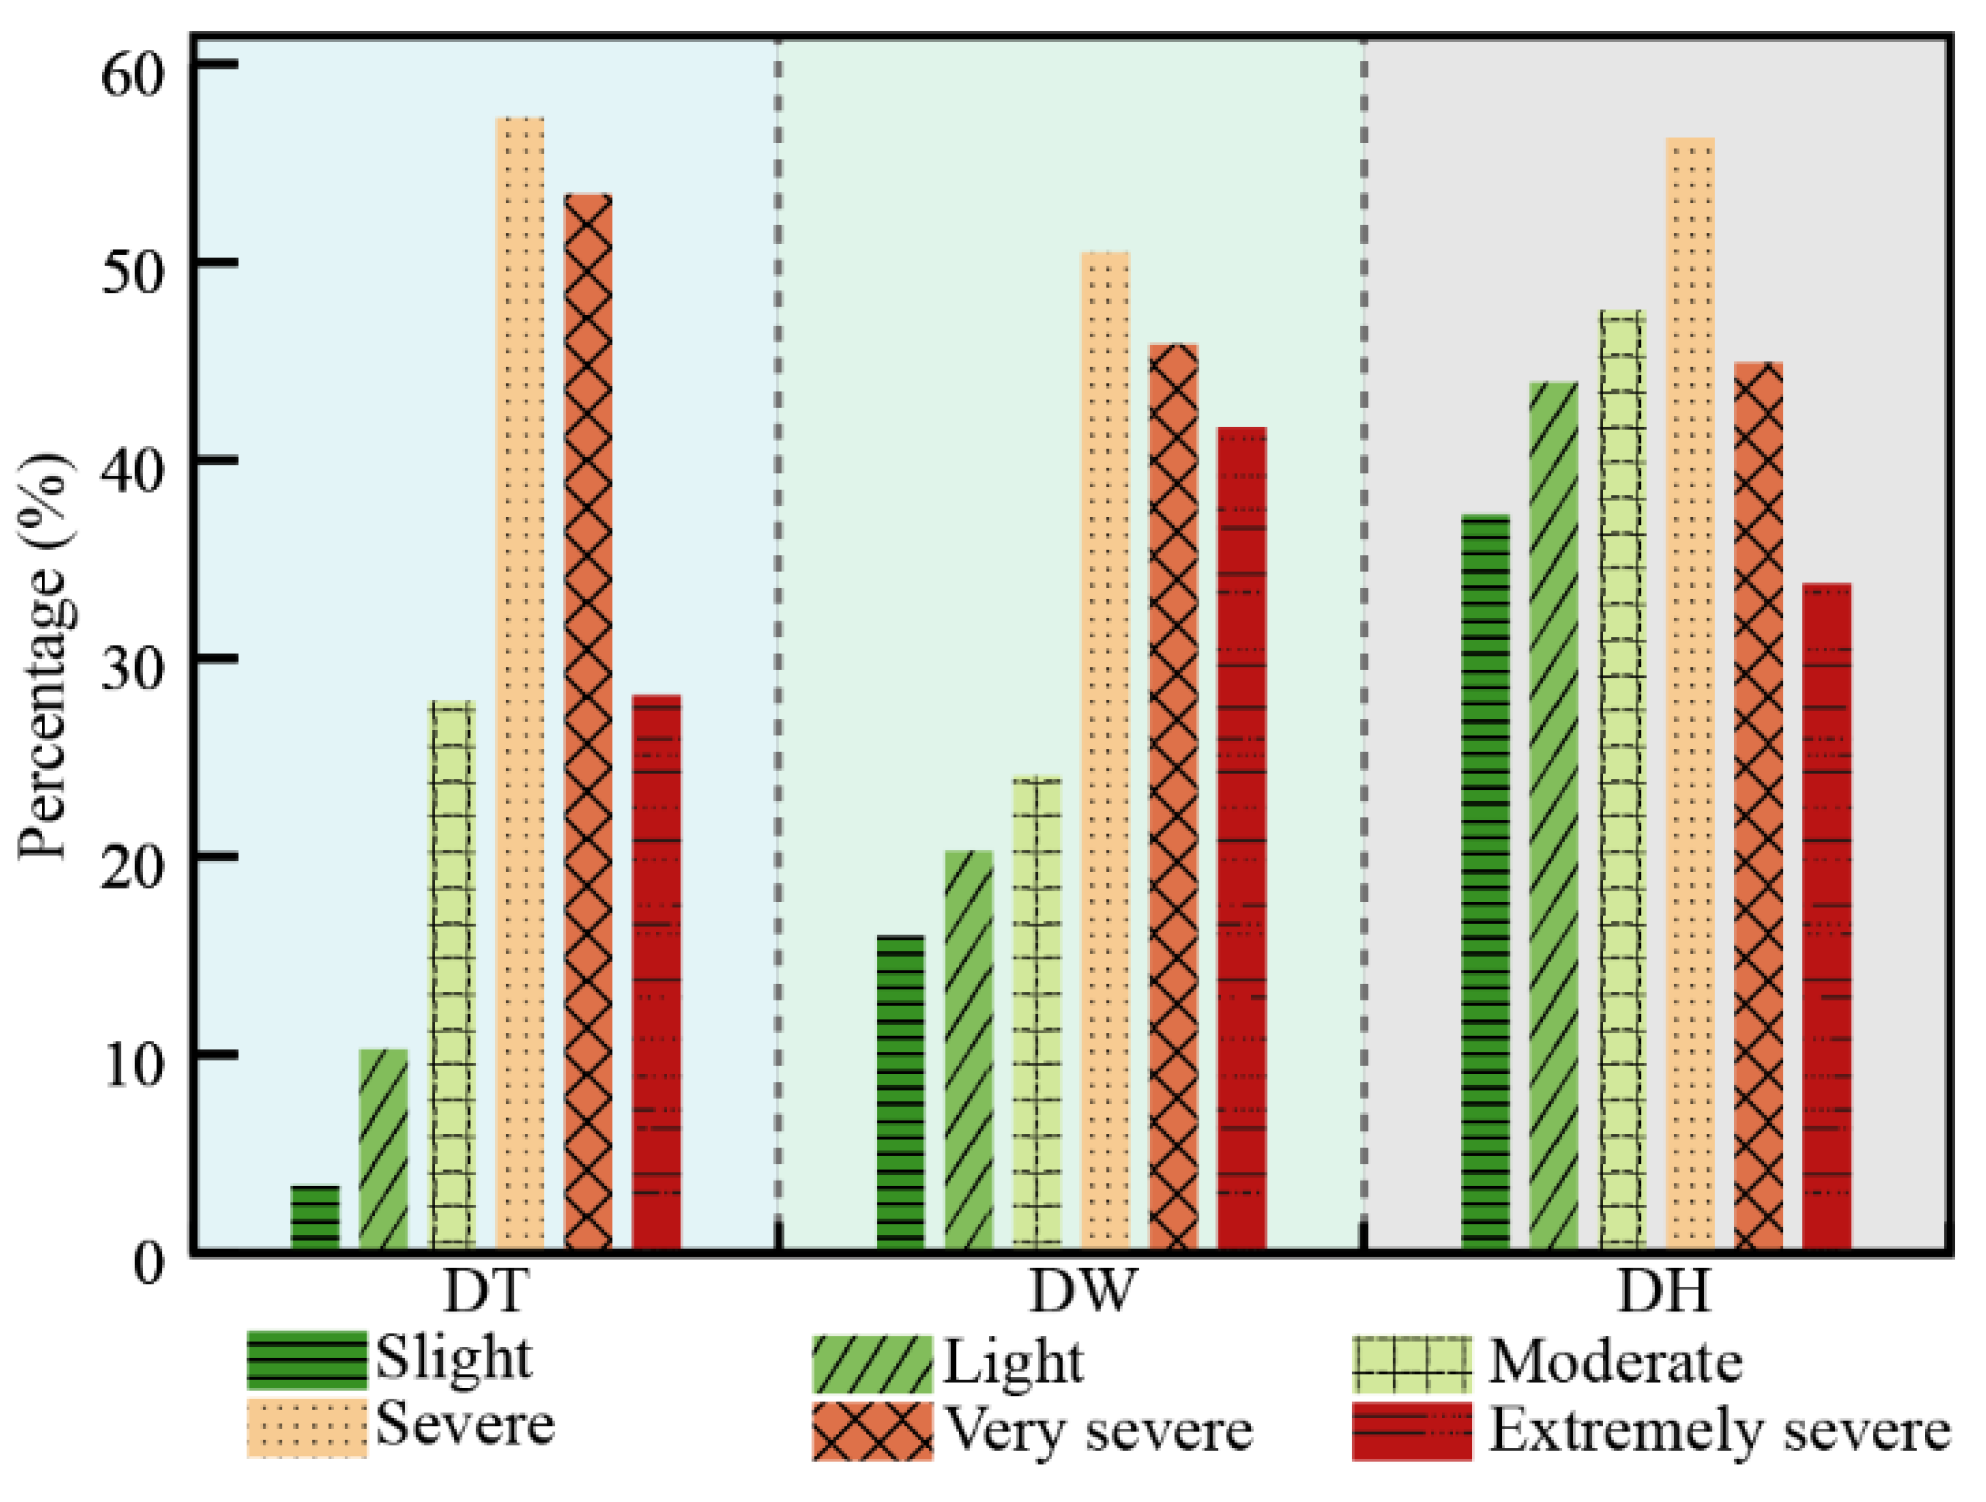
3.1. Characteristics of Water Erosion in the Three Dry Valley Subtypes

Annual soil erosion intensity was categorized into six grades in accordance with the Standards for Classification and Gradation of Soil Erosion SL190-2007, issued by the Ministry of Water Resources of China: slight (<5 t·ha−1·yr−1), light (5–25 t·ha−1·yr−1), moderate (25–50 t·ha−1·yr−1), severe (50–80 t·ha−1·yr−1), very severe (80–150 t·ha−1·yr−1), and extremely severe (>150 t·ha−1·yr−1). The calculated annual mean soil erosion rate was 17.02, 41.17, and 35.49 t·ha−1·yr−1 in Mao County, Hanyuan County, and Yuanmou County, respectively. With reference to the soil erosion rate, these regions are classified as having light, severe, and moderate soil erosion, respectively.
As shown in Figure 4, the regions experiencing the most serious water erosion were dispersed mainly on the steep slopes on both sides along the valley in both Mao County and Hanyuan County. However, they were concentrated on the steep slopes surrounding the Yuanmou Basin and on the northern bank of the Jinsha River in Yuanmou County.
The area with moderate and higher erosion intensity accounted for 93.87%, 81.71%, and 83.43% of the entire area of Mao County, Hanyuan County, and Yuanmou County, respectively (Figure 5A–C), while it accounted for 71.77%, 65.02%, and 82.61% of the DT, DW, and DH valley area, respectively (Figure 5D–F). The areas and water erosion rates of the dry valleys and the counties are shown in Figure 5G. The dry valley area accounted for 10.39%, 23.93%, and 41.69% of Mao County, Hanyuan County, and Yuanmou County, respectively. Additionally, the soil erosion rate in the DT, DW, and DH valley subtypes was 64.78, 43.85, and 33.81 t·ha−1·yr−1, i.e., 3.8, 1.16, and 0.95 times greater than that of Mao County, Hanyuan County, and Yuanmou County, respectively. These results indicate that the dry valley regions were the main “source” zones of soil loss.

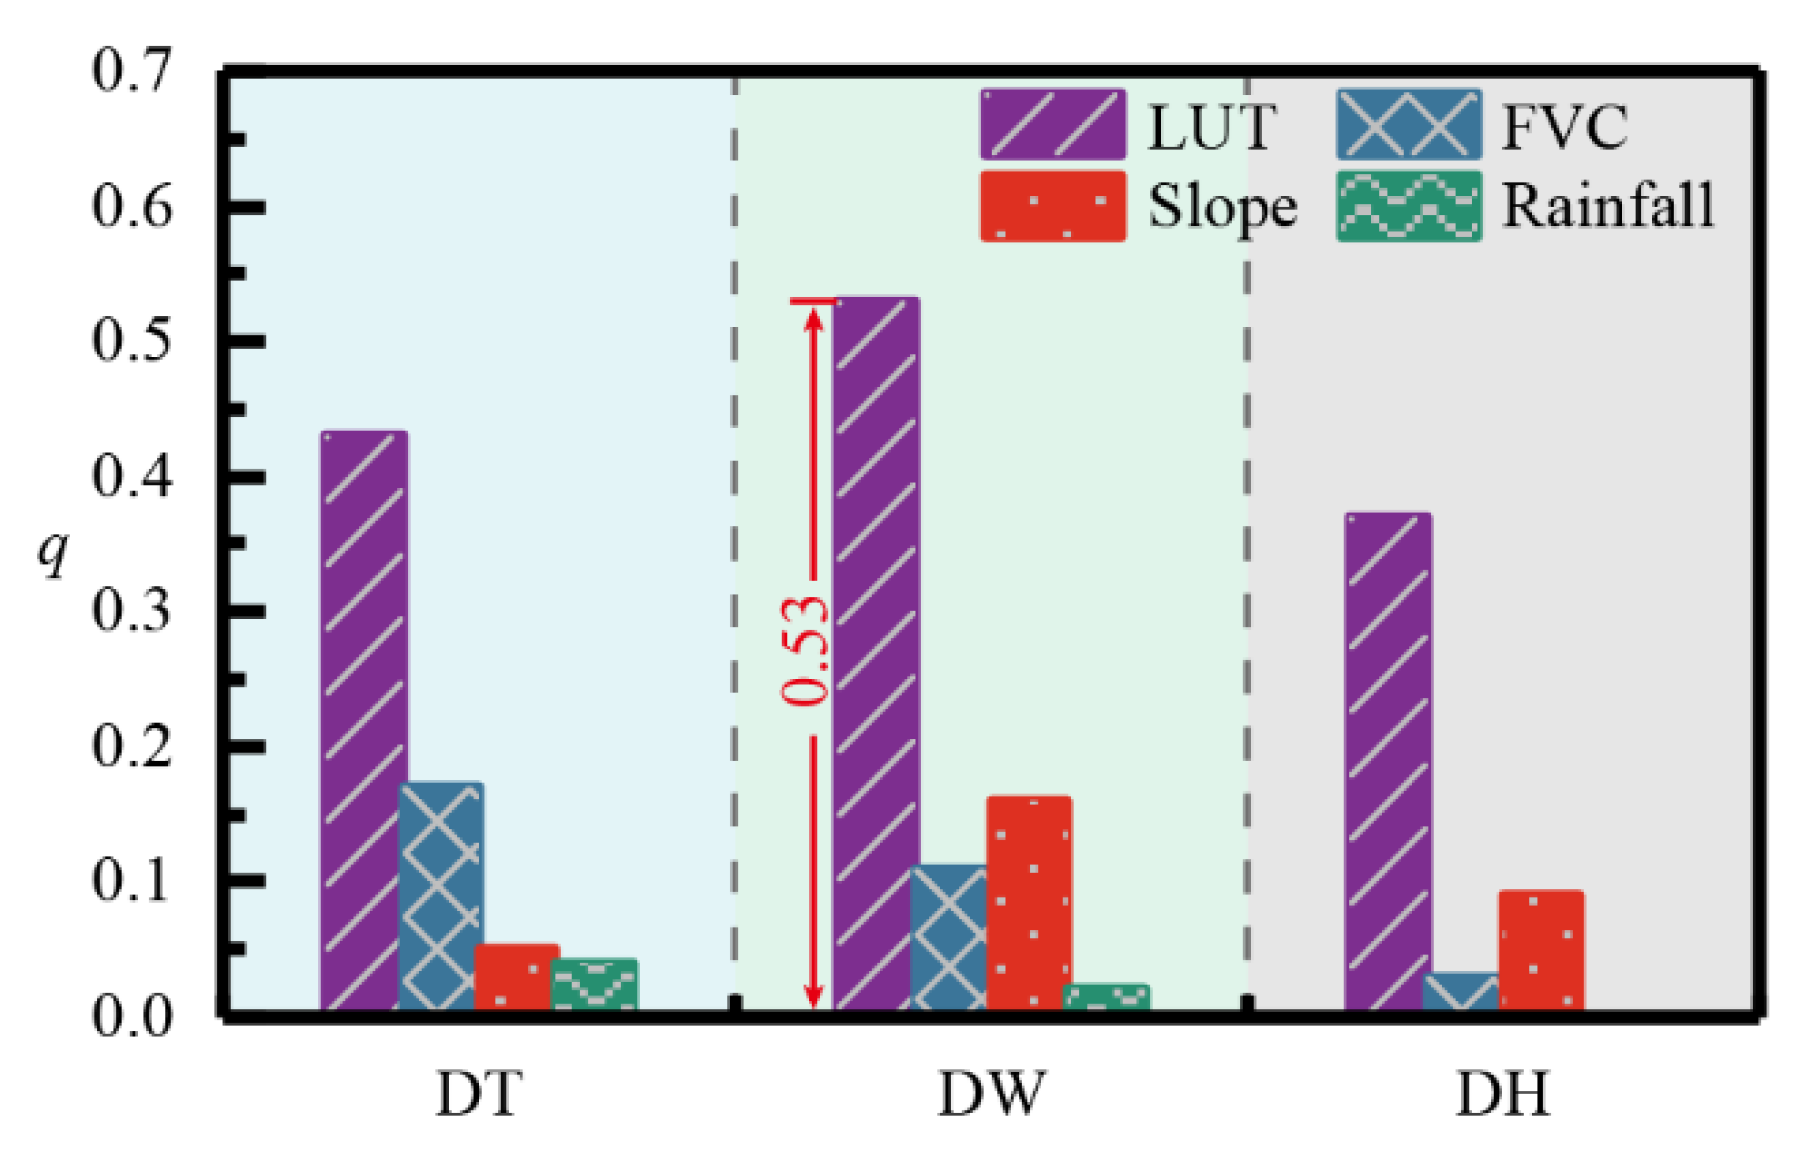
3.2. Dominant Controls and Discrepancies of Water Erosion in the Dry Valley Subtypes

The dominant driving force influencing water erosion and the q values of those factors varied greatly among the three dry valley subtypes (Figure 6). In the three dry valley subtypes, the LUT and rainfall factors had the strongest and weakest explanatory power for water erosion with q values of >0.37 and <0.05, respectively. Additionally, the explanatory power of the slope factor was greater than that of the FVC factor in the DW and DH valleys, but the opposite result was observed in the DT valley.
Factor combinations and q values for the three dry valley subtypes are shown in Figure 7. The interaction between the factors related to the LUT factor (the first column for each of the three subtypes) had a close relationship with water erosion, with q values of >0.36, but there was no significant close relationship between water erosion and the interaction of the other two factors, with q values of <0.30 (the final two columns for each of the three subtypes). In the first column for each of the three subtypes, the combination of LUT and rainfall factors had the weakest relationship with water erosion, with q values of <0.56. The strongest relationship was found in the combination of LUT and slope factors for both the DW valley (q = 0.71; Figure 7b) and the DH valley (q = 0.66; Figure 7c). Furthermore, the maximum q value (FVC ∩ LUT) was 1.51 and 3.82 times greater than that of the single LUT and FVC factors in the DT valley, respectively. Similarly, the maximum q value (Slope ∩ LUT) was 4.44 and 1.34 times greater than that of the single slope and LUT factors in the DW valley, and 7.33 and 1.78 times greater than that of the single slope and LUT factors in the DH valley, respectively.

3.3. Identification of High-Risk Regions in Relation to Water Erosion

The potential distribution of areas at high risk of water erosion was further predicted using the risk detector (Table 4). In the three dry valley subtypes, farmland suffered the most serious water erosion, but with a descending trend of water erosion rate from the DT valley to the DH valley. The rainfall interval triggering strong soil loss can be categorized as a process of first increase and then decrease from the DT valley to the DH valley, and a similar regular pattern was also found in the water erosion rate. The slope range with strong water erosion showed a decreasing trend from the DT valley to the DH valley, but the opposite result was found in the FVC range. However, the water erosion rate presented a decreasing trend in relation to these two factors. It is noted that serious water erosion could occur in areas with gentle slope (i.e., <20°) or with less rainfall (i.e., 651 mm) in the DH valley.

4. Discussion

4.1. Model Validation

In our study, three typical dry valleys were selected to investigate the water erosion status. Due to the lack of field sampling conditions, the results of the previous studies in adjacent watersheds were used as a validation. As shown in Table 5, the water erosion rate in Mao County is 17.02 t·ha−1·yr−1, which is slightly smaller than the result of Jiang et al. [22] (22.75 t·ha−1·yr−1), and close to the result of Yang et al. [47] (16.73 t·ha−1·yr−1). The water erosion rate in Hanyuan County is 41.17 t·ha−1·yr−1, which is slightly smaller than the result of Guo et al. [48] (43.42 t·ha−1·yr−1) and Xin et al. [21] (48.89 t·ha−1·yr−1). The water erosion rate in Yuanmou County is 35.49 t·ha−1·yr−1, which is smaller than the result of He et al. [20] (45.06 t·ha−1·yr−1). Despite the differences among the water erosion rate, they still belong to the same erosion categories. Additionally, these differences are negligible when the water erosion rate is converted to soil loss thickness, indicating that the results evaluated using the RUSLE in this study are reliable. The results were influenced by several factors using RUSLE. The main reason is that each erosion factor in the RUSLE can be determined using different methods [44]. Differences in the scope and timing of the survey were another important influencing factor.
Recently, the Geodetector method has been used extensively in the fields of social sciences and natural environmental sciences, and it has been proven to have very broad application prospects owing to its several advantages. Chu et al. [30] concluded that slope, land use and vegetation coverage were the individual dominant control factors and the combinations of land use type and slope and vegetation coverage and slope were the interactive dominant control factors. A similar result has also been obtained in this study. Liang et al. [31] evaluated that vegetation coverage and the interaction between vegetation coverage and slope explains 7.28% and 32.69% of water erosion in the Qiantang River catchment, respectively. The same trigger factor and combination could explain 17.02% and 29.30% of water erosion in this study. Yu et al. [32] demonstrated that the vegetation coverage factor (q = 0.28) and slope factor (q = 0.13) are the top two influencing factors on water erosion. It is larger than result of vegetation coverage factor (q = 0.03) and slope factor (q = 0.09) in the DH valley. Zhao et al. [33] showed that the effect size of interaction between two impact factors was higher than that of a single factor and the cultivated land was recognized as the high-risk zones. These findings are also confirmed in this study, indicating the results are reliable.

4.2. Spatial Pattern of Soil Erosion

The dry valley areas in Mao County and Hanyuan County accounted for <24% of the total area of each county, but the soil erosion rate of the dry valleys was 25% higher than the mean soil erosion rate of each county. Although the dry valley area in Yuanmou County accounted for 41.69% of the total area, the soil erosion yield in this region accounted for 39.72% of the total yield. The main reason for this is the flatter topography within the DH valley because Yuanmou County has basin topography, i.e., areas with slope of <5° account for 22.60% of the entire area of the county. Further analysis demonstrated that the annual mean soil erosion rate (ignoring these “flat” zones) was 41.23 t·ha−1·yr−1, i.e., greater than that of the entire county. The annual mean water erosion rate of the three dry valleys was 47.48 t·ha−1·yr−1, which is higher than that of the karst region (12.22 t·ha−1·yr−1), Yellow River Basin (27.77 t·ha−1·yr−1), and Hexi Corridor region (31.01 t·ha−1·yr−1), but slightly less than that of the black soil region (58.49 t·ha−1·yr−1) [49,50,51,52].
The proportion of areas of different erosion intensity in the dry valley regions to the areas of the same erosion intensity within each county is shown in Figure 8. The proportion of areas experiencing severe and higher erosion intensity is greater than that of areas experiencing moderate and lower erosion intensity. The proportion of areas experiencing severe and very severe erosion intensity in the DT valley and that of areas experiencing severe erosion intensity in the DW and DH valleys accounted for >50% of the county area with the same erosion intensity. Therefore, water erosion in the dry valleys should receive greater attention in future research.
The water erosion rate differed over different land use type (Table 6). It was the highest in farmland, followed by those in shrub land, grassland, forest land, garden plot, bare land, construction land and paddy field.

4.3. Driving Factors of Water Erosion

In this study, the explanatory power of each of four parameters affecting water erosion was evaluated by estimating their q values. The LUT factor had the most significant impact on water erosion in the three dry valleys, especially the DW valley, with q value of 0.53. Although Dai et al. [53] and Wang et al. [54] both demonstrated that land use changes affect soil loss, they failed to evaluate the quantitative relationship between LUT and water erosion. The rainfall factor had the weakest explanatory power in relation to water erosion in the three dry valley areas. This could be attributable to the small extent of the study areas and to the fact that the rainfall data were interpolated from surrounding meteorological stations, leading to insignificant differences in rainfall between layers. The slope factor played a key role in water erosion in the DT and DH valleys, but vegetation coverage also had an important impact in the DT valley. The major reason for this was that the vegetation type in the DT valley consists mainly of near-desert vegetation owing to the underlying hydrothermal factors, which provides limited protection to the soil [39]. Moreover, the spatial distribution of vegetation across the upper reaches of the Min River is characterized by obvious vertical zonation owing to the narrow and deeply incised valley [55]. Consequently, there were major differences in the soil erosion yield between the layers with different vegetation coverage. In contrast, there were no significant differences in the controlling effects of vegetation in the different layers in the DW and DH valleys. Therefore, the second important impact factor changed from the FVC factor in the DT valley to the slope factor in the DW and the DH valleys.
The occurrence and development of surface processes are affected by more than one factor, and interaction between multiple factors could either improve or aggravate water erosion. In this study, interaction between two parameters enhanced the explanatory power in relation to water erosion. Additionally, this result was consistent with the outcomes of the single-factor analysis. The combination of factors with the strongest explanatory power involved the two factors with the highest q values in the single-factor analysis for each dry valley subtype. Moreover, water erosion was predominantly controlled by both the LUT and the FVC parameters in the DT valley (q = 0.65), but by both the LUT and the slope parameters in the DW (q = 0.71) and DH (q = 0.66) valleys. A possible reason for this is that the higher temperatures in the DW and DH valleys cause diminished vegetation coverage in the dry valleys, while the slope parameter exhibits greater control on water erosion. Moreover, land use changes are accompanied by severe cultivation disturbances and destruction of soil stability, while the slope factor determines the external potential kinetic energy during the soil erosion process [27,56]. Therefore, soil loss control measures should prioritize land use change and the prohibition of steep slope reclamation in the DT and DH valleys, but promote LUT change and afforestation in the DT valley. Another similar study conducted in the karst area [57] confirmed that LUT greatly and directly affects the surface water erosion process (Table 7).
In this study, farmland was expected to be the region with the most severe soil loss in the three dry valley regions owing to the massive impact of anthropogenic activities. From the DT valley to the DH valley, the slope of the distribution range of high-risk areas decreased successively, while the vegetation coverage increased successively. Changes in the slope and vegetation coverage parameters were mainly influenced by topography and vegetation community type. The DT, DW, and DH valleys reflect canyon, wide valley, and basin topography, respectively, and their main vegetation community types belong to near-desert vegetation, foliar shrub, and savanna shrub and valley-type succulent shrub, respectively. The steep slopes (large than 30 degree) were predicted as the high-risk area in DT, which were consistent with Wang et al. [57] and Huang et al. [58]. The high-risk zone of rainfall showed a trend of initial increase and then decrease, attributable to differences in soil type.

4.4. Challenges and Perspectives

Several aspects of this study will be further improved and refined in the future research. Although the RUSLE is a well-known and universally accepted and implemented model, it has some limitations. It is applicable to the investigation of sheet erosion, but not to gully erosion. Therefore, this erosion form is not considered in this study, and will be studied later. Field sampling work will be strengthened to support more rigorous validation. Portable precipitation observation equipment will be installed in the study area to obtain data directly, and the effects of intense rainfall will be further studied. Long time series of water erosion in the study area will be further monitored to analyze the change and trend of impact factors. The impact of the implementation of some key national projects (e.g., Natural Forest Protection Project) and integrated small watershed management projects should be further studied. The inability to perform such detailed analysis in this study was due to the low-resolution data source (Harmonized World Soil Database; 1-km resolution). As the research continues, more detailed soil maps will be applied to improve the accuracy of K. The interval division methods of the potential impact factors also affected the final results. Therefore, this method should be considered carefully and a more suitable way to delineate the intervals of the explanatory variables proposed in further research.

5. Conclusions

Intense water erosion can occur in the fragile dry valleys of Southwest China, triggering repeated ecological destruction. In this study, we used the RUSLE to estimate the water erosion rate in DT, DW, DH valleys, and quantified and explained the discrepancies of trigger factors between the three dry valley subtypes. The results are:
(1) The dry valley regions were the areas in each of their counties that were affected most severely by soil loss. The water erosion rates were 64.78, 43.85, and 33.81 t·ha−1·yr−1 in the DT, DW and DH valley.
(2) LUT was closely related to water erosion with q value of 0.42, 0.53, and 0.38 in the three dry valley subtypes.
(3) Water erosion in the DT valley was predominantly controlled by both the LUT and FVC parameters (q = 0.65), rather than by the combination of LUT and slope parameters, as in the case of the DW (q = 0.71) and DH (q = 0.66) valleys.
(4) Farmland was predicted to be particularly at high risk in three dry valley subtypes. The high-risk area in the DT valley is characterized by steep slope (>30 degree) and low vegetation coverage (<50%), while the opposite phenomenon is shown in the DH valley. The predicted rainfall intervals of high-risk areas show no significant regular pattern.
(5) The soil loss control measures should prioritize land use change and the prohibition of steep slope reclamation in the DT and DH valleys, but promote LUT change and afforestation in the DT valley.

Author Contributions

Conceptualization, C.Y.; methodology, C.Y.; software, C.Y.; writing—original draft preparation, C.Y.; writing—review and editing, C.Y., J.L. and F.X.; data curation, X.Z.; funding acquisition, J.F. All authors have read and agreed to the published version of the manuscript.

Funding

This research was funded by the second Tibetan Plateau Scientific Expedition and Research Program (STEP) (2019QZKK0603), and the National Key Research and Development Program of China (2017YFC0505104).

Institutional Review Board Statement

Not applicable.

Informed Consent Statement

Not applicable.

Data Availability Statement

Not applicable.

Acknowledgments

We are grateful to National Meteorological Information Center (http://data.cma.cn, accessed on 15 August 2020) for providing meteorological data and United States Geological Survey (USGS) (https://earthexplorer.usgs.gov/, accessed on 1 August 2020) for providing satellite images. We thank James Buxton MSc for editing the English text of a draft of this manuscript.

Conflicts of Interest

The authors declare no conflict of interest.

References

  1. Borrelli, P.; Robinson, D.A.; Fleischer, L.R.; Lugato, E.; Ballabio, C.; Alewell, C.; Meusburger, K.; Modugno, S.; Schütt, B.; Ferro, V.; et al. An assessment of the global impact of 21st century land use change on soil erosion. Nat. Commun. 2017, 8, 2013. [Google Scholar] [CrossRef] [PubMed] [Green Version]
  2. Fu, B.; Tian, T.; Liu, Y.; Zhao, W. New Developments and Perspectives in Physical Geography in China. Chin. Geogr. Sci. 2019, 29, 363–371. [Google Scholar] [CrossRef] [Green Version]
  3. Koirala, P.; Thakuri, S.; Joshi, S.; Chauhan, R. Estimation of Soil Erosion in Nepal Using a RUSLE Modeling and Geospatial Tool. Geosciences 2019, 9, 147. [Google Scholar] [CrossRef] [Green Version]
  4. Zhang, G.; Cui, P.; Yin, Y.; Liu, D.; Jin, W.; Wang, H.; Yan, Y.; Ahmed, B.N.; Wang, J. Real-time monitoring and estimation of the discharge of flash floods in a steep mountain catchment. Hydrol. Process. 2019, 33, 3195–3212. [Google Scholar] [CrossRef]
  5. Zhang, G.; Cui, P.; Jin, W.; Zhang, Z.; Wang, H.; Bazai, N.A.; Li, Y.; Liu, D.; Pasuto, A. Changes in hydrological behaviours triggered by earthquake disturbance in a mountainous watershed. Sci. Total Environ. 2021, 760, 143349. [Google Scholar] [CrossRef] [PubMed]
  6. Phinzi, K.; Ngetar, N.S. The assessment of water-borne erosion at catchment level using GIS-based RUSLE and remote sensing: A review. Int. Soil Water Conserv. Res. 2019, 7, 27–46. [Google Scholar] [CrossRef]
  7. Borrelli, P.; Alewell, C.; Alvarez, P.; Anache, J.A.A.; Baartman, J.; Ballabio, C.; Bezak, N.; Biddoccu, M.; Cerdà, A.; Chalise, D.; et al. Soil erosion modelling: A global review and statistical analysis. Sci. Total Environ. 2021, 780, 146494. [Google Scholar] [CrossRef]
  8. Alewell, C.; Borrelli, P.; Meusburger, K.; Panagos, P. Using the USLE: Chances, challenges and limitations of soil erosion modelling. Int. Soil Water Conserv. Res. 2019, 7, 203–225. [Google Scholar] [CrossRef]
  9. Panagos, P.; Ballabio, C.; Borrelli, P.; Meusburger, K.; Klik, A.; Rousseva, S.; Tadić, M.P.; Michaelides, S.; Hrabalíková, M.; Olsen, P.; et al. Rainfall erosivity in Europe. Sci. Total Environ. 2015, 511, 801–814. [Google Scholar] [CrossRef] [Green Version]
  10. Grillakis, M.G.; Polykretis, C.; Alexakis, D.D. Past and projected climate change impacts on rainfall erosivity: Advancing our knowledge for the eastern Mediterranean island of Crete. Catena 2020, 193, 104625. [Google Scholar] [CrossRef]
  11. Stoate, C.; Boatman, N.; Borralho, R.; Carvalhob, C.R.; Snoo, G.; Eden, P. Ecological impacts of arable intensification in Europe. J. Environ. Manag. 2001, 63, 337–365. [Google Scholar] [CrossRef] [PubMed]
  12. Liu, B.; Xie, Y.; Li, Z.; Liang, Y.; Zhang, W.; Fu, S.; Yin, S.; Wei, X.; Zhang, K.; Wang, Z.; et al. The assessment of soil loss by water erosion in China. Int. Soil Water Conserv. Res. 2020, 8, 430–439. [Google Scholar] [CrossRef]
  13. Wang, Y.; Dai, E.; Yin, L.; Ma, L. Land use/land cover change and the effects on ecosystem services in the Hengduan Mountain region, China. Ecosyst. Serv. 2018, 34, 55–67. [Google Scholar] [CrossRef]
  14. Su, Z.; Xiong, D.; Zhang, J.; Zhou, T.; Yang, H.; Dong, Y.; Fang, H.; Shi, L. Variation in the vertical zonality of erodibility and critical shear stress of rill erosion in China’s Hengduan Mountains. Earth Surf. Process. Landf. 2018, 44, 88–97. [Google Scholar] [CrossRef]
  15. Zhu, G.-F.; Yang, L.; Qin, D.-H.; Tong, H.-L.; Liu, Y.-F.; Li, J.-F. Spatial and temporal variation of drought index in a typical steep alpine terrain in Hengduan Mountains. J. Mt. Sci. 2016, 13, 1186–1199. [Google Scholar] [CrossRef]
  16. Schweinfurth, U. Mapping mountains: Vegetation in the Himalaya. GeoJournal 1992, 27, 73–83. [Google Scholar] [CrossRef]
  17. Wangda, P.; Ohsawa, M. Gradational Forest Change along the Climatically Dry Valley Slopes of Bhutan in the Midst of Humid Eastern Himalaya. Plant Ecol. 2006, 186, 109–128. [Google Scholar] [CrossRef]
  18. Lin, Y.-M.; Cui, P.; Ge, Y.-G.; Chen, C.; Wang, D.-J.; Wu, C.-Z.; Li, J.; Yu, W.; Zhang, G.-S.; Lin, H. The succession characteristics of soil erosion during different vegetation succession stages in dry-hot river valley of Jinsha River, upper reaches of Yangtze River. Ecol. Eng. 2014, 62, 13–26. [Google Scholar] [CrossRef]
  19. Duan, X.; Liu, B.; Gu, Z.; Rong, L.; Feng, D. Quantifying soil erosion effects on soil productivity in the dry-hot valley, southwestern China. Environ. Earth Sci. 2016, 75, 1164. [Google Scholar] [CrossRef]
  20. He, Z.Y.; Su, Z.A.; Xiong, D.H.; Wang, Y.; Yang, H.K. Effects of Agave americana on soil and water conservation of slope in dry-hot valley of Jinsha River. Mount. Res. 2018, 36, 731–739. [Google Scholar] [CrossRef]
  21. Xin, Z.-Y.; Xia, J.-G. Soil erosion calculation in the hydro-fluctuation belt by adding water erosivity factor in the USLE model. J. Mt. Sci. 2020, 17, 2123–2135. [Google Scholar] [CrossRef]
  22. Jiang, L.; Bian, J.H.; Li, A.N.; Lei, G.B.; Nan, X.; Feng, W.L.; Li, G. Spatial-temporal changes of soil erosion in the upper reachers of Minjiang River from 2000 to 2010. J. Soil Water Conserv. 2014, 28, 18–25. [Google Scholar] [CrossRef]
  23. Perović, V.; Jakšić, D.; Jaramaz, D.; Koković, N.; Čakmak, D.; Mitrović, M.; Pavlović, P. Spatio-temporal analysis of land use/land cover change and its effects on soil erosion (Case study in the Oplenac wine-producing area, Serbia). Environ. Monit. Assess. 2018, 190, 675. [Google Scholar] [CrossRef]
  24. Gioia, D.; Amodio, A.M.; Maggio, A.; Sabia, C. Impact of Land Use Changes on the Erosion Processes of a Degraded Rural Landscape: An Analysis Based on High-Resolution DEMs, Historical Images, and Soil Erosion Models. Land 2021, 10, 673. [Google Scholar] [CrossRef]
  25. Apollonio, C.; Petroselli, A.; Tauro, F.; Cecconi, M.; Biscarini, C.; Zarotti, C.; Grimaldi, S. Hillslope Erosion Mitigation: An Experimental Proof of a Nature-Based Solution. Sustainability 2021, 13, 6058. [Google Scholar] [CrossRef]
  26. Stanchi, S.; Zecca, O.; Hudek, C.; Pintaldi, E.; Viglietti, D.; D’Amico, M.E.; Colombo, N.; Goslino, D.; Letey, M.; Freppaz, M. Effect of Soil Management on Erosion in Mountain Vineyards (N-W Italy). Sustainability 2021, 13, 1991. [Google Scholar] [CrossRef]
  27. Panagos, P.; Ballabio, C.; Borrelli, P.; Meusburger, K. Spatio-temporal analysis of rainfall erosivity and erosivity density in Greece. Catena 2016, 137, 161–172. [Google Scholar] [CrossRef]
  28. Ballabio, C.; Borrelli, P.; Spinoni, J.; Meusburger, K.; Michaelides, S.; Beguería, S.; Klik, A.; Petan, S.; Janeček, M.; Olsen, P.; et al. Mapping monthly rainfall erosivity in Europe. Sci. Total Environ. 2017, 579, 1298–1315. [Google Scholar] [CrossRef] [PubMed] [Green Version]
  29. Wang, J.F.; Xu, C.D. Geodetector: Principle and prospective. Acta Geogr. Sin. 2017, 72, 116–134. [Google Scholar]
  30. Chu, L.; Sun, T.; Wang, T.; Li, Z.; Cai, C. Temporal and Spatial Heterogeneity of Soil Erosion and a Quantitative Analysis of Its Determinants in the Three Gorges Reservoir Area, China. Int. J. Environ. Res. Public Health 2020, 17, 8486. [Google Scholar] [CrossRef] [PubMed]
  31. Liang, S.X.; Fang, H. Quantitative analysis of driving factors in soil erosion using geographic detectors in Qiantang River catckment, Southeast China. J. Soils Sediments 2020, 1, 134–147. [Google Scholar] [CrossRef]
  32. Yu, Y.; Shen, Y.; Wang, J.; Wei, Y.; Liu, Z. Simulation and mapping of drought and soil erosion in Central Yunnan Province, China. Adv. Space Res. 2021, 68, 4556–4572. [Google Scholar] [CrossRef]
  33. Zhao, Y.; Liu, L.; Kang, S.; Ao, Y.; Han, L.; Ma, C. Quantitative Analysis of Factors Influencing Spatial Distribution of Soil Erosion Based on Geo-Detector Model under Diverse Geomorphological Types. Land 2021, 10, 604. [Google Scholar] [CrossRef]
  34. Sun, L.; Cai, Y.; Yang, W.; Yi, Y.; Yang, Z. Climatic variations within the dry valleys in southwestern China and the influences of artificial reservoirs. Clim. Chang. 2019, 155, 111–125. [Google Scholar] [CrossRef]
  35. Hu, K.; Wu, C.; Tang, J.; Pasuto, A.; Li, Y.; Yan, S. New understandings of the June 24th 2017 Xinmo Landslide, Maoxian, Sichuan, China. Landslides 2018, 15, 2465–2474. [Google Scholar] [CrossRef] [Green Version]
  36. Bai, C.; Kang, G.; Gao, G. Distribution of the Crustal Magnetic Field in Sichuan-Yunnan Region, Southwest China. Sci. World J. 2014, 2014, 854769. [Google Scholar] [CrossRef] [PubMed]
  37. Yang, C.; Su, Z.-A.; Fan, J.-R.; Fang, H.-D.; Shi, L.-T.; Zhang, J.-H.; He, Z.-Y.; Zhou, T.; Wang, X.-Y. Simulation of the landform change process on a purple soil slope due to tillage erosion and water erosion using UAV technology. J. Mt. Sci. 2020, 17, 1333–1344. [Google Scholar] [CrossRef]
  38. Urabe, A.; Nakaya, H.; Muto, T.; Katoh, S.; Hyodo, M.; Xue, S.R. Lithostratigraphy and depositional history of the Late Ce-nozoic hominid-bearing successions in the Yuanmou Basin, southwest China. Quat. Sci. Rev. 2001, 20, 1671–1681. [Google Scholar] [CrossRef]
  39. Fan, J.R.; Yang, C.; Bao, W.K.; Liu, J.L.; Li, X. Distribution Scope and District Statistical Analysis of Dry Valleys in Southwest China. Mount. Res. 2020, 38, 303–313. [Google Scholar]
  40. Zhang, W.B.; Fu, J.S. Rainfall erosivity estimation under different rainfall amount. Resour. Sci. 2003, 25, 35–41. [Google Scholar]
  41. Zhu, D.; Xiong, K.; Xiao, H.; Gu, X. Variation characteristics of rainfall erosivity in Guizhou Province and the correlation with the El Niño Southern Oscillation. Sci. Total Environ. 2019, 691, 835–847. [Google Scholar] [CrossRef]
  42. Benavidez, R.; Jackson, B.; Maxwell, D.; Norton, K. A review of the (Revised) Universal Soil Loss Equation ((R)USLE): With a view to increasing its global applicability and improving soil loss estimates. Hydrol. Earth Syst. Sci. 2018, 22, 6059–6086. [Google Scholar] [CrossRef] [Green Version]
  43. Liu, B.Y.; Nearing, M.A.; Shi, P.J.; Jia, Z.W. Slope gradient effects on soil loss for steep slopes. Trans. ASAE 1994, 37, 1835–1840. [Google Scholar] [CrossRef]
  44. Ghosal, K.; Das Bhattacharya, S. A Review of RUSLE Model. J. Indian Soc. Remote Sens. 2020, 48, 689–707. [Google Scholar] [CrossRef]
  45. Cai, C.F.; Ding, S.W.; Shi, Z.H.; Hang, L.; Zhang, G.Y. Study of applying USLE and geographical information system IDRISI to predict soil erosion in small watershed. J. Soil. Water Conserv. 2000, 14, 19–23. [Google Scholar]
  46. Wang, J.F.; Zhang, T.L.; Fu, B.J. A measure of spatial stratified heterogeneity. Ecol. Indic. 2016, 67, 250–256. [Google Scholar] [CrossRef]
  47. Yang, M.; Li, X.; Hu, Y.; He, X. Assessing effects of landscape pattern on sediment yield using sediment delivery distributed model and a landscape indicator. Ecol. Indic. 2012, 22, 38–52. [Google Scholar] [CrossRef]
  48. Guo, B.; Liu, L.F.; Jiang, L.; Fan, Y.W.; Zhang, H.; He, T.L. Analysis of tempo-spatial of erosion intensity in Dadu River Catchment. J. Shandong Univ. Technol. (Nat. Sci. Ed.) 2019, 33, 7–13. [Google Scholar] [CrossRef]
  49. Gao, J.; Wang, H. Temporal analysis on quantitative attribution of karst soil erosion: A case study of a peak-cluster depression basin in Southwest China. Catena 2019, 172, 369–377. [Google Scholar] [CrossRef]
  50. Lin, J.; Guan, Q.; Tian, J.; Wang, Q.; Tan, Z.; Li, Z.; Wang, N. Assessing temporal trends of soil erosion and sediment redistribution in the Hexi Corridor region using the integrated RUSLE-TLSD model. Catena 2020, 195, 104756. [Google Scholar] [CrossRef]
  51. Yang, X.; Guo, B.; Lu, Y.F.; Zhang, R.; Zhang, D.F.; Zhen, X.Y.; Chen, S.T.; Wu, H.W.; Wei, C.X.; Yang, L.A.; et al. Spatial–temporal evolution patterns of soil erosion in the Yellow River Basin from 1990 to 2015: Impacts of natural factors and land use change. Geomat. Nat. Hazards Risk 2021, 12, 103–122. [Google Scholar] [CrossRef]
  52. Fang, H. Impacts of rainfall and soil conservation measures on soil, SOC, and TN losses on slopes in the black soil region, northeastern China. Ecol. Indic. 2021, 129, 108016. [Google Scholar] [CrossRef]
  53. Dai, E.; Yin, L.; Wang, Y.; Ma, L.; Tong, M. Quantitative Assessment of the Relative Impacts of Land Use and Climate Change on the Key Ecosystem Services in the Hengduan Mountain Region, China. Sustainability 2020, 12, 4100. [Google Scholar] [CrossRef]
  54. Wang, J.; Zhang, W.; Zhang, Z. Impacts of Land-Use Changes on Soil Erosion in Water–Wind Crisscross Erosion Region of China. Remote Sens. 2019, 11, 1732. [Google Scholar] [CrossRef] [Green Version]
  55. Chen, L.; Fan, M.; Wang, Q. Spatial priority conservation areas for vegetation habitat across the Upper Reaches of Min River located in Sichuan Province, China. Glob. Ecol. Conserv. 2019, 17, e00578. [Google Scholar] [CrossRef]
  56. Panagos, P.; Borrelli, P.; Meusburger, K.; Yu, B.; Klik, A.; Lim, K.J.; Yang, J.E.; Ni, J.; Miao, C.; Chattopadhyay, N.; et al. Global rainfall erosivity assessment based on high-temporal resolution rainfall records. Sci. Rep. 2017, 7, 4175. [Google Scholar] [CrossRef] [PubMed] [Green Version]
  57. Wang, H.; Gao, J.; Hou, W. Quantitative attribution analysis of soil erosion in different geomorphological types in karst areas: Based on the geodetector method. J. Geogr. Sci. 2019, 29, 271–286. [Google Scholar] [CrossRef] [Green Version]
  58. Huang, S.W.; Li, J.; Zhang, J.X.; Deng, L.; Zhang, J. Analysis of spatial and temporal changes in soil erosion in Henan Province over the last ten years. J. Agric. Resour. Environ. 2021, 38, 232–240. [Google Scholar] [CrossRef]
Figure 1. (a) Map showing location of the study area, and three Landsat images showing (b) dry–temperate (DT) valley in Mao County, (c) dry–warm (DW) valley in Hanyuan County, and (d) dry–hot (DH) valley in Yuanmou County.
Land 10 01289 g001
Figure 2. Typical landscapes of water erosion in the dry valley area of Southwest China: (a) a dry–temperate valley (DT) in Mao County, (b) a dry–warm valley (DW) in Hanyuan County, and (c) a dry–hot valley (DH) in Yuanmou County.
Land 10 01289 g002
Figure 3. Spatial distribution of land use types in (A) Mao County, (B) Hanyuan County, and (C) Yuanmou County.
Land 10 01289 g003
Figure 4. Annual mean soil erosion intensity: (A) Mao County (dry–temperate valley, DT), (B) Hanyuan County (dry–warm valley, DW), and (C) Yuanmou County (dry–hot valley, DH).
Land 10 01289 g004
Figure 5. Areas and annual mean soil erosion rates of the three counties and the three dry valley subtypes: (AC) and (DF) area proportions of the three counties and the three dry valley subtypes with different erosion intensity, respectively. (G) areas and annual mean water erosion rates of the three counties and the three dry valley subtypes.
Land 10 01289 g005
Figure 6. The q values of four factors in the three dry valley subtypes (DT: dry–temperate valley, DW: dry–warm valley, and DH: dry–hot valley).
Land 10 01289 g006
Figure 7. Effect of interactive impact on water erosion: (a) dry–temperate valley (DT), (b) dry–warm valley (DW), and (c) dry–hot valley (DH).
Land 10 01289 g007
Figure 8. Areal proportions of six erosion intensities between dry valleys and counties (DT: dry–temperate valley, DW: dry–warm valley, and DH: dry–hot valley).
Land 10 01289 g008
Table 1. Geographical information for the three counties.
CountyMaoHanyuanYuanmou
Area (km2)3896.652214.802021.69
VegetationWarm needle-leaved forest and deciduous broadleaved forestWarm deciduous broadleaved thicket, evergreen sclerophyllous forest and evergreen broadleaved thicketSavanna and succulent thicket
WatershedUpper Reaches of Min RiverDadu River CatchmentJinsha River Catchment
Annual mean precipitation (mm)486.30714.80613.80
Annual mean temperature (°C)11.2017.9021.90
Mean steepness (°)34.0829.9820.64
Mean lengths of slope (m)20.2018.6014.50
Valley shapeV-shaped valleyU-shaped valleyBasin
Mean width of the bottoms of valleys (km)0.411.895.97
Table 2. Soil texture, organic carbon and soil bulk density.
Land-Use TypeSand (%)Silt (%)Clay (%)Organic Carbon (%)Soil Bulk Density (kg·dm−3)
Ferric Lixisols2330471.381.34
Humic Acrisols5027231.801.31
2822503.071.27
Gelic Leptosols563861.411.30
Eutric Regosols4734190.981.21
Haplic Acrisols2725481.241.25
Haplic Luvisols4137220.741.43
828100.401.43
3122471.201.31
Eutric Leptosols4634201.131.39
Gelic Cambisols3149202.021.39
Mollic Leptosols3545203.021.14
Eutric Cambisols2329481.171.28
4236221.001.37
Dystric Regosols4237211.391.33
Chromic Luvisols2727461.201.37
Calcaric Regosols4435210.751.37
Humic Cambisols4136232.721.10
Dystric Cambisols4238201.451.30
Ferralic Cambisols5126231.021.29
Calcaric Cambisols3643210.651.41
Chromic Cambisols4928230.981.31
2129501.431.23
Cumulic Anthrosols2950211.121.41
Table 3. C values of different land use types considering the FVC.
Land Use TypeFVC (%)
<1010–3030–5050–7070–90>90
Forest land0.1000.0800.0600.0200.0040.001
Shrub land0.4000.2200.1400.0850.0400.011
Garden plot0.4500.2400.1500.0900.0430.011
Grassland0.4200.2300.1400.0890.0420.011
Table 4. Regions at high risk of water erosion in the three dry valley subtypes.
Dry Valley SubtypesSlope FactorLUT FactorRainfall FactorFVC Factor
Slope (°)ALUTARainfall (mm)AFVC (%)A
DT valley35–4012.26Farmland26.86506–5666.5240–5011.85
DW valley30–355.39Farmland24.10782–8428.4360–7011.17
DH valley15–205.20Farmland12.93651–7117.3370–805.86
Table 5. Comparative validation of soil erosion rates in different studies.
Study AreaMethodWater Erosion Rate (t·ha−1·yr−1)Erosion CategoriesReferences
Upper Reaches of Min RiverRUSLE22.75LightJiang L. et al. [22]
RUSLE16.73LightYang M. et al. [47]
Dadu River CatchmentDRBSLE43.42ModerateGuo B. et al. [48]
Modified USLE48.89ModerateXin Z.Y. et al. [21]
Yuanmou CountyRunoff plot45.06ModerateHe Z.Y. et al. [20]
Mao County 1RUSLE17.02LightIn this study
Hanyuan County 2RUSLE41.17ModerateIn this study
Yuanmou CountyRUSLE35.49ModerateIn this study
1 Mao County is located in the upper reaches of Min River. 2 Hanyuan County is located in the Dadu River Catchment.
Table 6. Water erosion rates over different land use types.
Land Use TypeArea (km2)Water Erosion Rate (t·ha−1·yr−1)
DTDWDHDTDWDH
Paddy field0.0419.84102.120.400.483.49
Farmland11.5366.66106.4225.5529.6133.20
Garden plot83.96176.8651.876.138.368.66
Forest land34.9427.9591.0615.0614.1219.16
Grassland136.5536.72138.3120.4619.1230.61
Shrub land101.4893.11269.1223.0229.0632.16
Bare land0.090.373.765.145.275.11
Construction land17.8437.4054.574.275.114.50
Table 7. Discrepancies among different studies that used the Geodetector method.
Study AreaSingle FactorInteraction between Two Factors
Dry valley areasDry-temperate valleyLand-use typeLand-use type ∩ FVC
Dry-warm valleyLand-use type ∩ Slope
Dry-hot valley
Karst areasMiddle elevation plainLand-use typeLand-use type ∩ Rainfall
Middle elevation terraceLand-use type ∩ Slope
Middle elevation hill
Small relief mountain
Middle relief mountain
Publisher’s Note: MDPI stays neutral with regard to jurisdictional claims in published maps and institutional affiliations.

