Abstract
Drivers of urban flood disaster risk may be related to many factors from nature and society. However, it is unclear how these factors affect each other and how they ultimately affect the risk. From the perspective of risk uncertainty, flood inundation risk is considered to be the probability of inundation consequences under the influence of various factors. In this paper, urban flood inundation risk assessment model is established based on Bayesian network, and then key disaster-causing factors chains are explored through influence strength analysis. Jingdezhen City is selected as study area, where the flood inundation probability is calculated, and the paths of these influential factors are found. The results show that the probability of inundation in most areas is low. Risk greater than 0.8 account for about 9%, and most of these areas are located in the middle and southern section of the city. The influencing factors interact with each other in the form of factor chain and, finally, affect the flood inundation. Rainfall directly affects inundation, while river is the key factor on inundation which is influenced by elevation and slope. In addition, in the chain of socio-economic factors, the population will determine the pipe density through affecting gross domestic product (GDP), and lead to the inundation. The approach proposed in this study can be used to find key disaster-causing factors chains, which not only quantitatively reveal the formation of risks but also provide reference for early warning.
1. Introduction
Flooding is considered as one of the most widespread and devastating disasters affecting lives, infrastructures, and society, economy, and local ecosystems, especially in urban areas. In the past few decades, urban flood has become a global challenge, threatening social security, and hindering the development of urban economy [1,2]. With the rapid urbanization and land use change, the frequency and intensity of urban flooding will increase in the future due to climate change and the occurrence of extreme weather events [3]. Generally, flood disaster risk is affected by natural and economic and social factors, such as climate change, land use change, land cover change, poor drainage systems, expansion of impervious area, insufficient infiltration or storage capacity, population explosion, rapid urbanization, and so on. However, these factors are a complex system that interact with each other, directly or indirectly, affecting flood risk. Therefore, it is very important to explore the relationship between factors and how they affect the risk.
Risk is the probability of an outcome having a negative effect on people, systems, or assets, which is typically depicted as being a function of the combined effects of hazards, the assets, or people exposed to hazard and the vulnerability of those exposed elements [4]. Flood inundation risk is usually measured by the probability of flood inundation occurrence and its potential consequences. Regardless of the consequences of disasters, it is a common believe that risk is the probability of an event. According to the direct or indirect relationship between the factors affecting flood inundation, the existing research can be classified into two categories: one is that the influencing factors directly affect the flood inundation, including qualitative evaluation methods. For example, Li et al. [5], Danumah et al. [6], and Abhishek and Kumar [7] use the analytic hierarchy process (AHP) to build an assessment model to conduct flood disaster risk assessment in designated research areas. The AHP, as a multi-criteria analysis method, allows multiple elements to be integrated under multiple criteria (hazard, vulnerability, and exposure) for flood risk assessment and mapping. Some AHP extension methods are also used to assess flood risk [8,9,10]. Qualitative evaluation methods also include: constant sum scale [11], entropy [12], additive weighting [13], or multi-criteria analysis approach [14,15]. There are also other methods, such as quantitative evaluation methods, many hydrological and hydrodynamic models [16,17,18,19], and a series of flood risk simulation models, such as random forest [20], gradient boosting decision tree [21], genetic algorithm [2], simulated annealing [22], rapid urban flood inundation and damage assessment model [1], meteorological research and prediction model [23], alternate decision tree [24], etc. However, due to the complex nature of urban flood, these models cannot deal with every problem. And the quantitative evaluation methods are overly dependent on a huge amount of data with high precision, which is difficult to be obtained, limiting its application to urban areas to some degree. Therefore, it is necessary to simplify these models.
A Bayesian network (BN) is one of several simplified models [25]. Naïve Bayes [26] and weighted naïve Bayes [27] are both simple Bayesian methods, which are also used to study the direct influence of factors on flood inundation. But the reality is that the relationship among influencing factors of urban flood inundation is complex and uncertain, and the influencing factors are interdependent, which directly or indirectly affect the occurrence of flood inundation. BN further analyzes the relationship between influencing factors of urban flood inundation [28,29]. BN is a popular approach to estimate uncertainty in risk evaluation in terms of the likelihood of disasters [30], which can quantify uncertainty and capture the potential relationship among risk factors to evaluate urban flood inundation risk objectively [31,32]. Abebe et al. [33] propose an urban flood vulnerability assessment model based on the coupling of geographic information system (GIS) and Bayesian belief network, and assess the flood risk in Toronto. Wu et a. [34] use BN model to assess the flood risk in Zhengzhou, China. In addition to urban flood risk assessment, BN is widely used in river basin flood risk assessment [35], coastal hazard assessment [36], flood detection [3], and early warning for urban flood [37]. Although BN can also be used to analyze the disaster chain [38,39], there is no research on the disaster-causing factors chains based on the BN model to explore the path through which the factors affect the inundation. Referring to the concept of disaster chain, the dependence relationship among the influencing factors constitutes the factor chain [40], they influence each other in the form of the factor chain, and ultimately affect the results. However, the previous research results did not demonstrate the quantitative relationship from the perspective of probability.
Qualitative methods are highly subjective, and the results are also affected by the experts’ preferences. Moreover, quantitative methods, especially flood simulation methods, rely too much on data, which are difficult to obtain. Whether direct or indirect impact study, including BN, there are still some questions and hypothesis that need to be resolved and verified: (1) how these factors ultimately affect the risk? (2) How these factors affect each other? What is the influence strength between factors? (3) Which factors are important factors that need to be focused on? (4) Which disaster-causing factors chains are key? In this paper, the purpose is to reveal the risk formation process under the interaction of multiple factors. We propose a methodology based on BN and GIS technology that can quantify the relationship between flood inundation risk factors and perform probabilistic reasoning under uncertain conditions. Then, the model is applied to our study area, Jingdezhen City, to evaluate the flood inundation risk and to identify the key disaster-causing factors chains.
2. Methodology
2.1. Framework of Research Methods
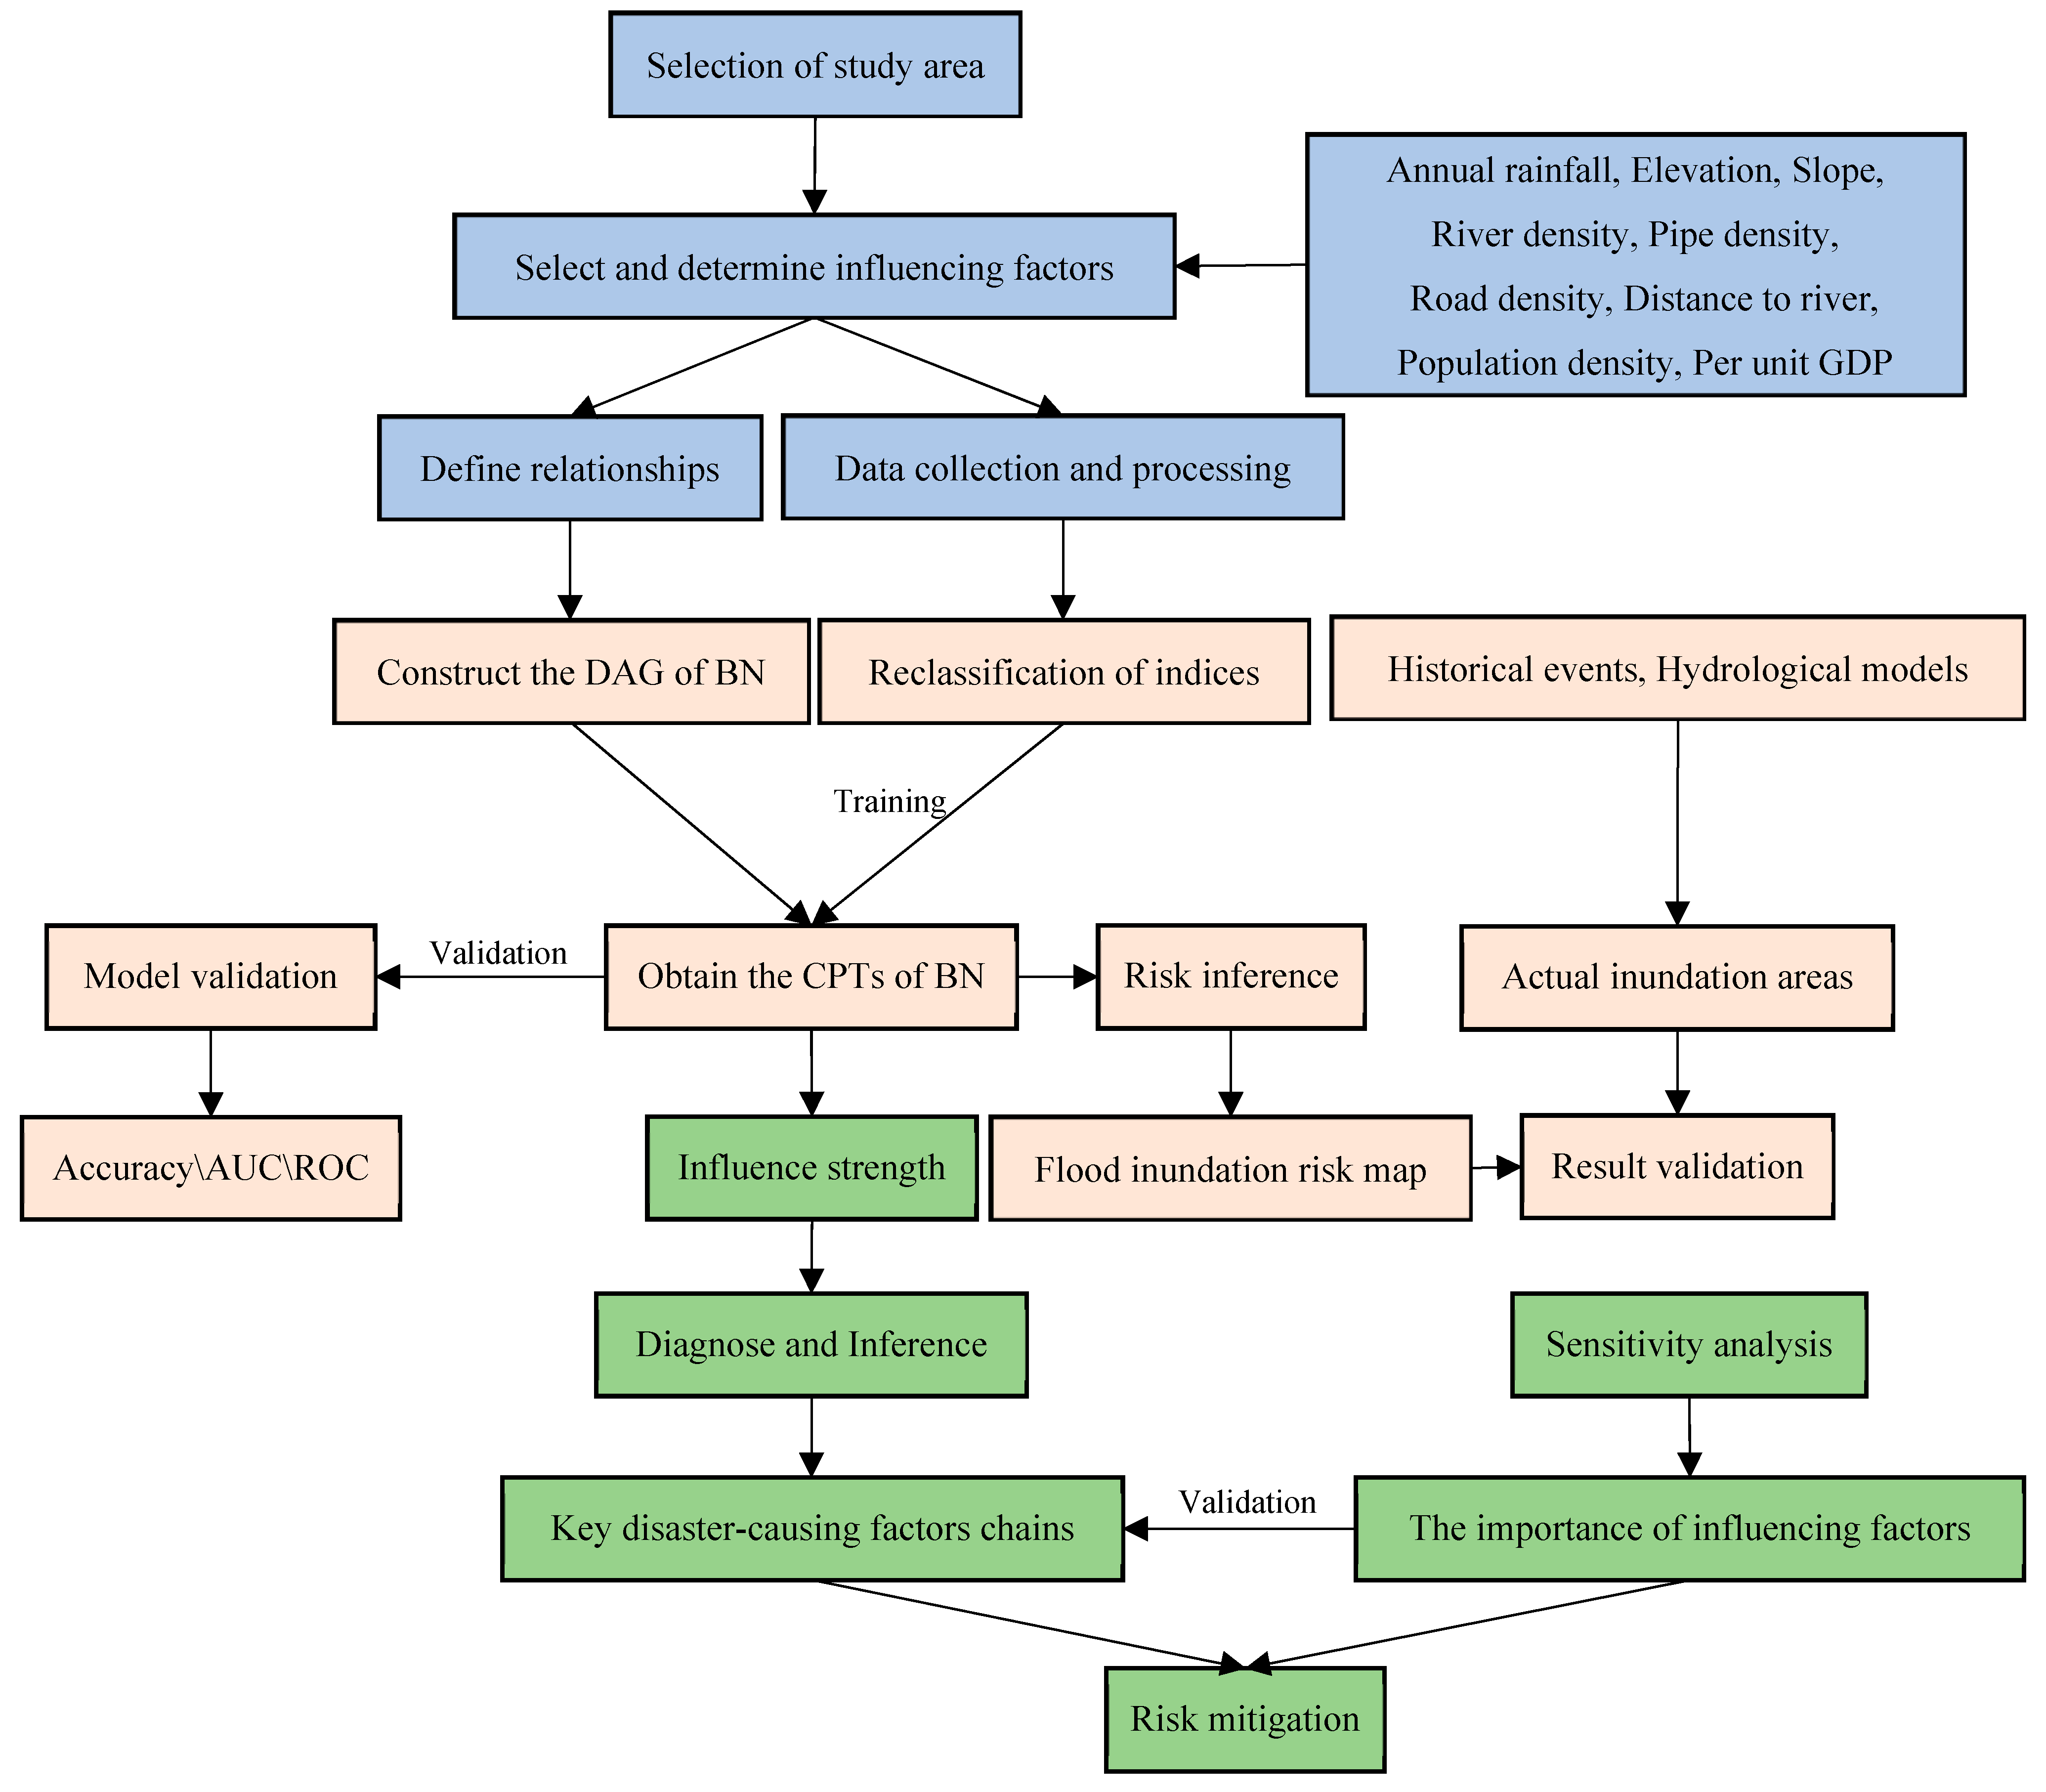
In this study, key disaster-causing factors chains are explored through an urban flood inundation risk assessment model which is established based on BN (Figure 1). The construction of the flood inundation risk assessment model based on BN includes two main parts: structure learning and parameter learning. The specific steps are as follows: (1) Select the study area and analyze its characteristics. According to the experts’ knowledge and relevant literature, the influencing factors of urban flood inundation are identified and presented as the nodes of BN, type and state value of each factors are determined based on the nature of factors. Through field investigation and historical research, the relationships among the influencing factors are determined [41], and they are synthesized to construct the directed acyclic graph (DAG) of BN. (2) The data collection and pre-processing of the study area are carried out (Section 3). Due to the different measurement scales of these data, it is necessary to classify and rescale the factors data. These processed data are imported into the BN structure for parameter training and learning to obtain the conditional probability table (CPT) of each node by using a learning algorithm, such as expectation maximization (EM) [42]. An urban flood inundation risk assessment model is established, and the performance of the model is verified through validation. Then, the established model is used to make causal inference to obtain the probability value of inundation risk of each grid square in the study area, so that the urban flood inundation risk map is drawn by ArcGIS 10.2. Compared with the actual inundation map, the availability and practicability of the model are verified.
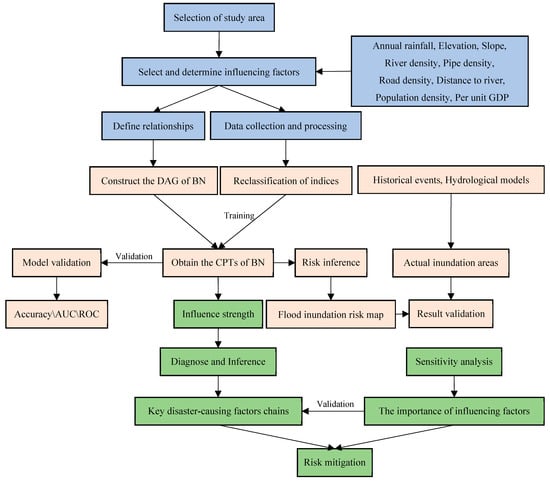
Figure 1.
Framework of the proposed method.
According to the evaluation results of the above model, influence strength analysis is carried out to understand how the influencing factors interact through the form of a factor chain and, finally, how to modify the inundation. Then, through reverse derivation, the key disaster-causing factors chains are found. Sensitivity analysis is used to obtain the order of importance of the influencing factors and to verify the results of disaster-causing factors chains. Finally, some mitigation measures for disaster reduction and chain-breaking are put forward to reduce the probability of future risk occurrence.
2.2. Selection of Criteria and Risk Factors
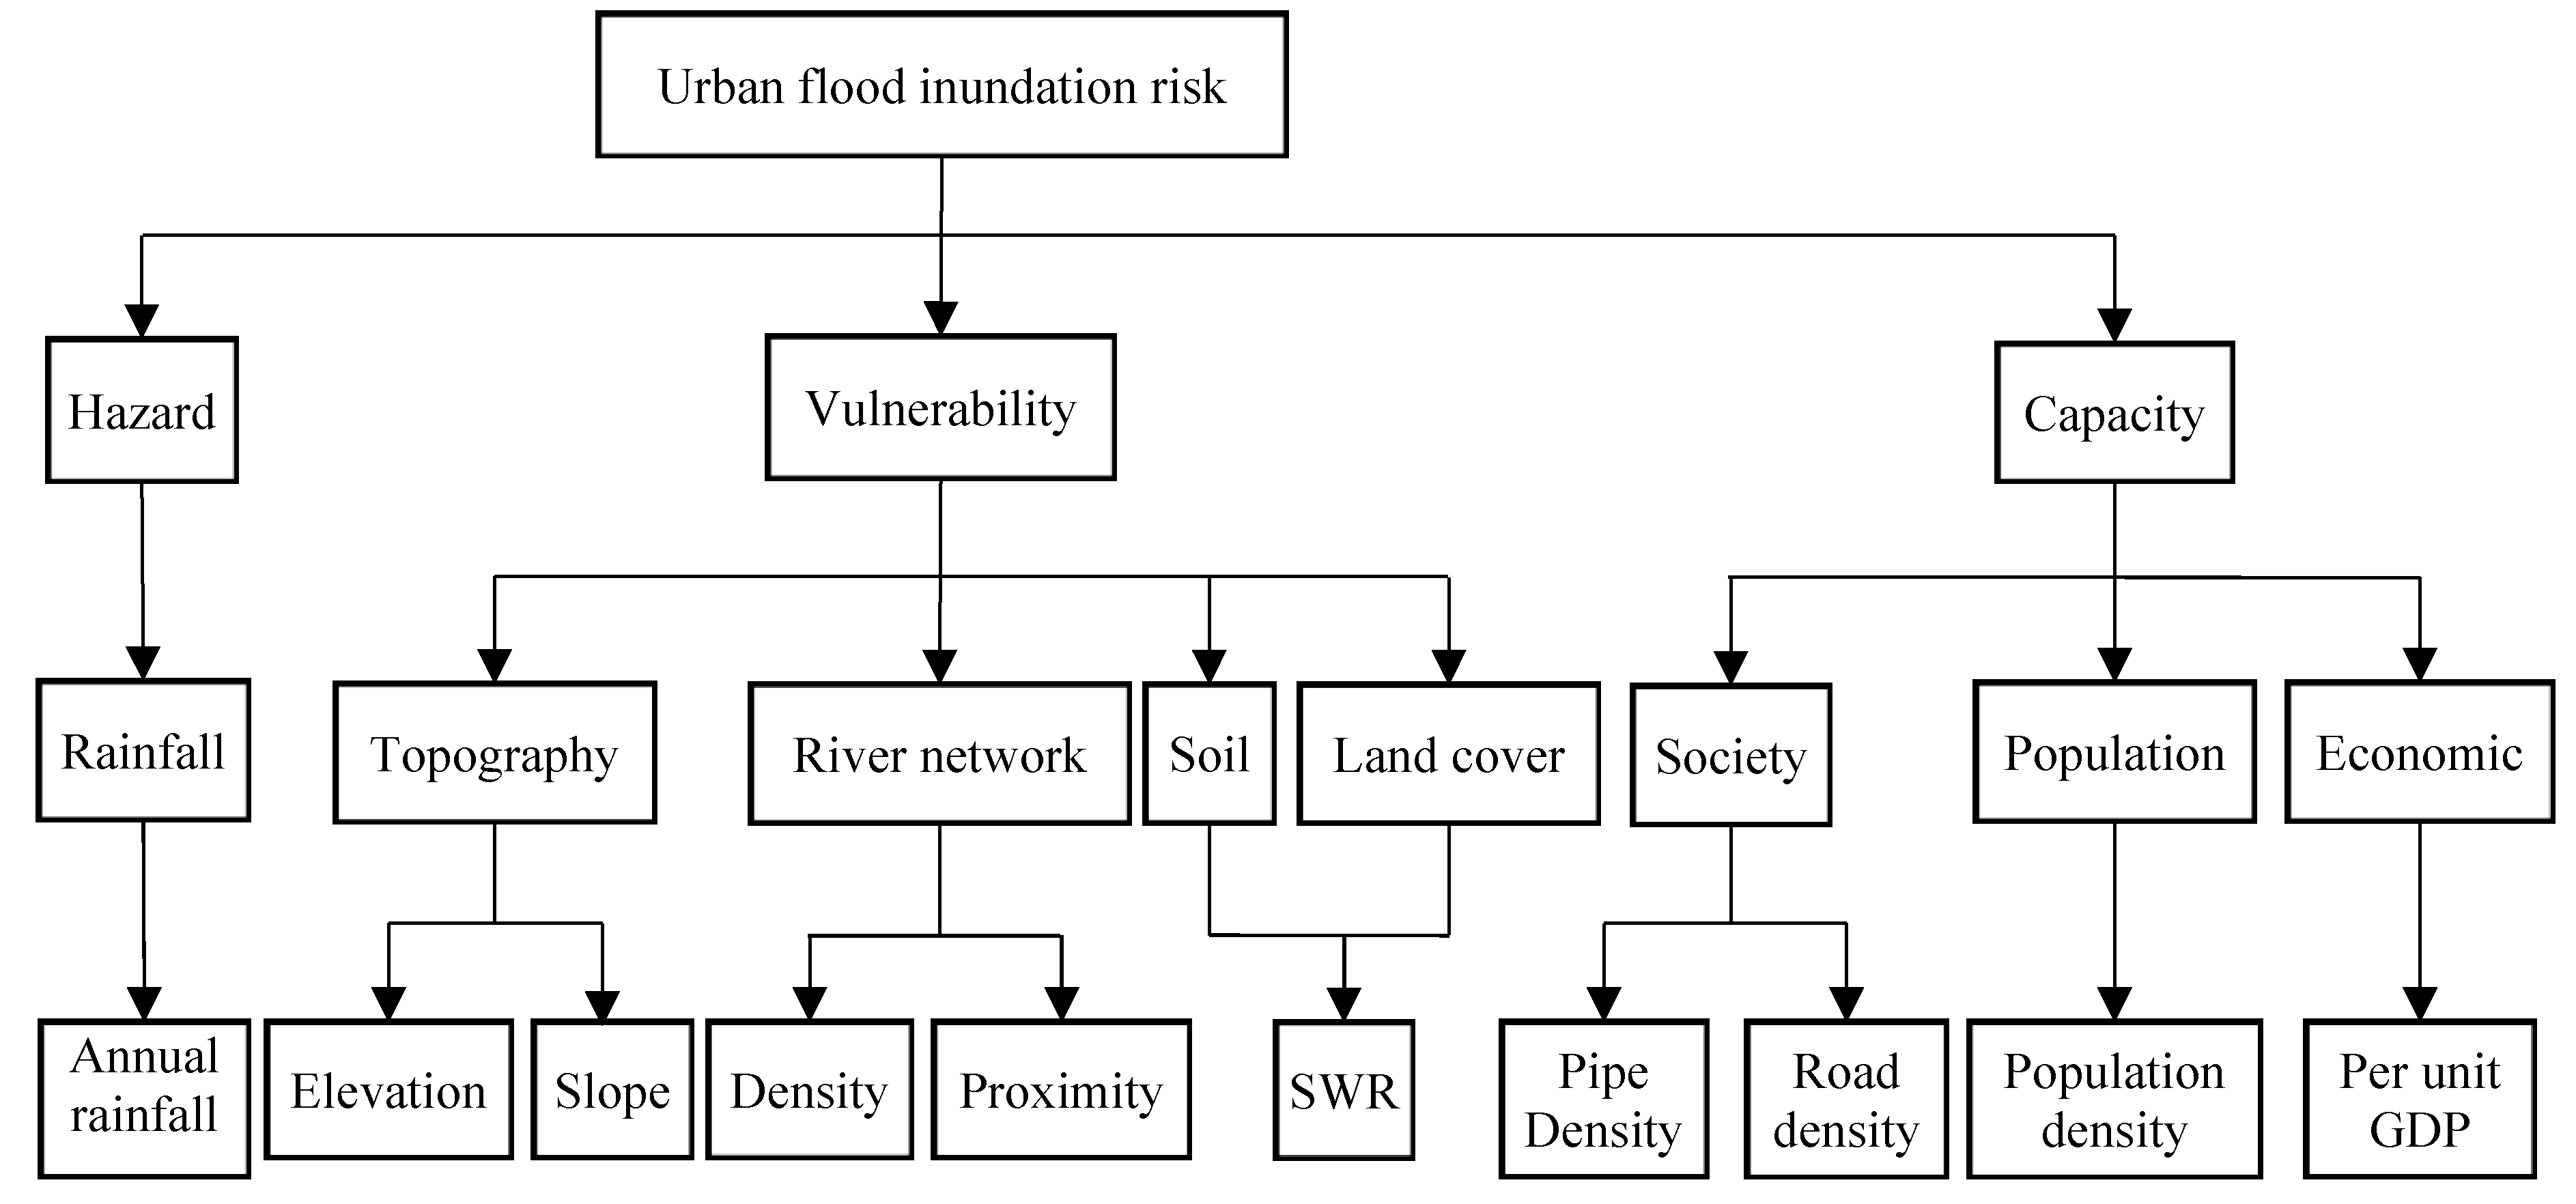
There is no unified guiding principle for the selection of the influencing factors of urban flood inundation risk, and the negative impact of natural and social factors has led to an urgent need for flood risk management. Disaster risk is generally a combination of three factors: potential hazard, vulnerability, and insufficient coping capacity under complex and uncertain conditions in reality [32]. Sendai Framework also considers that disaster risk management should be based on an understanding of disaster risk in all its dimensions of vulnerability, capacity, exposure of persons and assets, hazard characteristics and the environment [43]. In this study, there are three types of flood inundation risk factors, each of which contains a series of sub-factors: Hazard is defined as urban flood inundation caused by extreme rainfall, which is the driving factor of risk. Vulnerability is defined as the disaster-induced environment determined by forming factors. It mainly refers to other climate variables and underlying surface, including topography, river network, vegetation, and soil, which plays a vital role in the flood redistribution. Urban flood coping capacity is an aspect of resilience and cope with the effects of vulnerability that shows actions taken within the current capacity under socio-economic conditions, such as pipelines, road networks, population, and economy. All these factors interact with each other and control the dynamic process of flood.
Ten factors are selected to evaluate urban flood inundation risk and determine inundation-prone areas in the study area according to previous studies [1,2,11,14,32,33,34,41,44], the actual situation of the study area, the availability of data, as well as experts’ knowledge and experience. The hazard factor is annual rainfall; the vulnerability factors are elevation, slope, soil water retention (SWR), river density, distance to river; the capacity factors are pipe density, road density, population density, and per unit GDP (Figure 2).
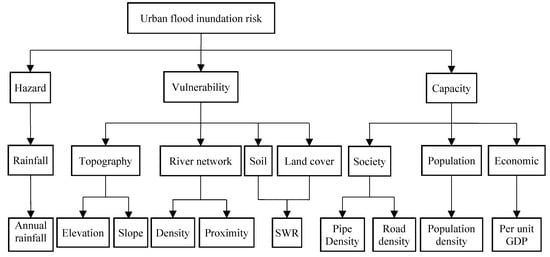
Figure 2.
Influencing factors of urban flood inundation risk.
2.3. Bayesian Network
Bayesian network, also known as Bayesian Belief Network, is defined as a stochastic graphical model that can express the relationship between variables even if there is uncertainty [45,46]. The structure of BN consists of two components: one is the DAG, where random variables are denoted as eigenvector nodes. An arc represents the probabilistic dependence between two nodes. Each node must have at least two states and must represent all values that the node can accept. The DAG comprises a set of random variables (nodes) and conditional dependencies (arrows) between nodes, which can be constructed from domain knowledge or data learning. The other is CPT, which is used to specify the dependency relationship between nodes in the DAG. The strength of the relationships among the variables is defined in the CPT attached to each node. The CPTs are mainly derived from the learning of historical data and obtained through empirical statistics.
The principle of BN relies on Bayes’ theorem, which is mathematically expressed as follows:
where is the total probability formula, which can deduce the probability value of the relevant states. B is an event, Ai refers to all the possible causes of event B, P(Ai) refers to the prior probabilities derived from priori data, and i represents a specific variable.
2.4. Sensitivity and Influence Strength Analysis Method
Because of the different contributions of various factors to the evaluation object, sensitivity analysis of parameter is required. Sensitivity analysis of finding nodes can be used to study the sensitivity of model performance to minor changes, which demonstrates that the posterior probability in BN varies with the change of probability parameters. The sensitivity of nodes can be quantified by variance reduction, mutual information, or belief variance [33,44]. The higher the sensitivity value obtained through the following derivative functions (2) and (3), the more significantly the parameters affect the flood inundation risk. The derivatives functions help the decision makers recognize and estimate the contribution of each factor to the total risk [47]. The specific step is to give a set of target nodes and use the derivative function to effectively calculate the complete derivative of the posterior probability distribution of the target nodes with respect to each numerical parameter in BN, to obtain the sensitivity value of all nodes.
where x is a probability parameter, y is a query, and e is the evidence entered into BN. The posterior probability p(y/e)(x) is a fraction of two linear functions of x.
The interaction among factors forms the inundation risk factors chains [40,48,49]. Multiple interaction factors chains of flood inundation risk can be extracted from urban flood events, for example, Elevation → Slope → SWR → Inundation is an interaction chain extracted from urban flood events. Through the influence strength analysis, the influence degree between the parent and child nodes is determined. The strength is expressed as the Euclidean distance between the conditional probability distribution of a given parent node and the prior probability of the node. The influence strength value is derived from the CPT of the child node by using the following formula (4) [40,50].
where Pn denotes the nth component of the discrete probability distribution P. Since P is a unit length vector, the maximum distance between Pn(node/parent) and Pn(node) is equal to when the two vectors are orthogonal. Therefore, division by ensures that the resulting distance is between 0 and 1.
In this study, the BN model is constructed using a software GeNIe development tool [51], a graphical interface to SMILE (Structural Modeling, Inference and Learning Engine). These steps of influence strength and sensitivity analysis are implemented in GeNIe, including calculation and result visualization.
3. Study Area and Data
3.1. Study Area
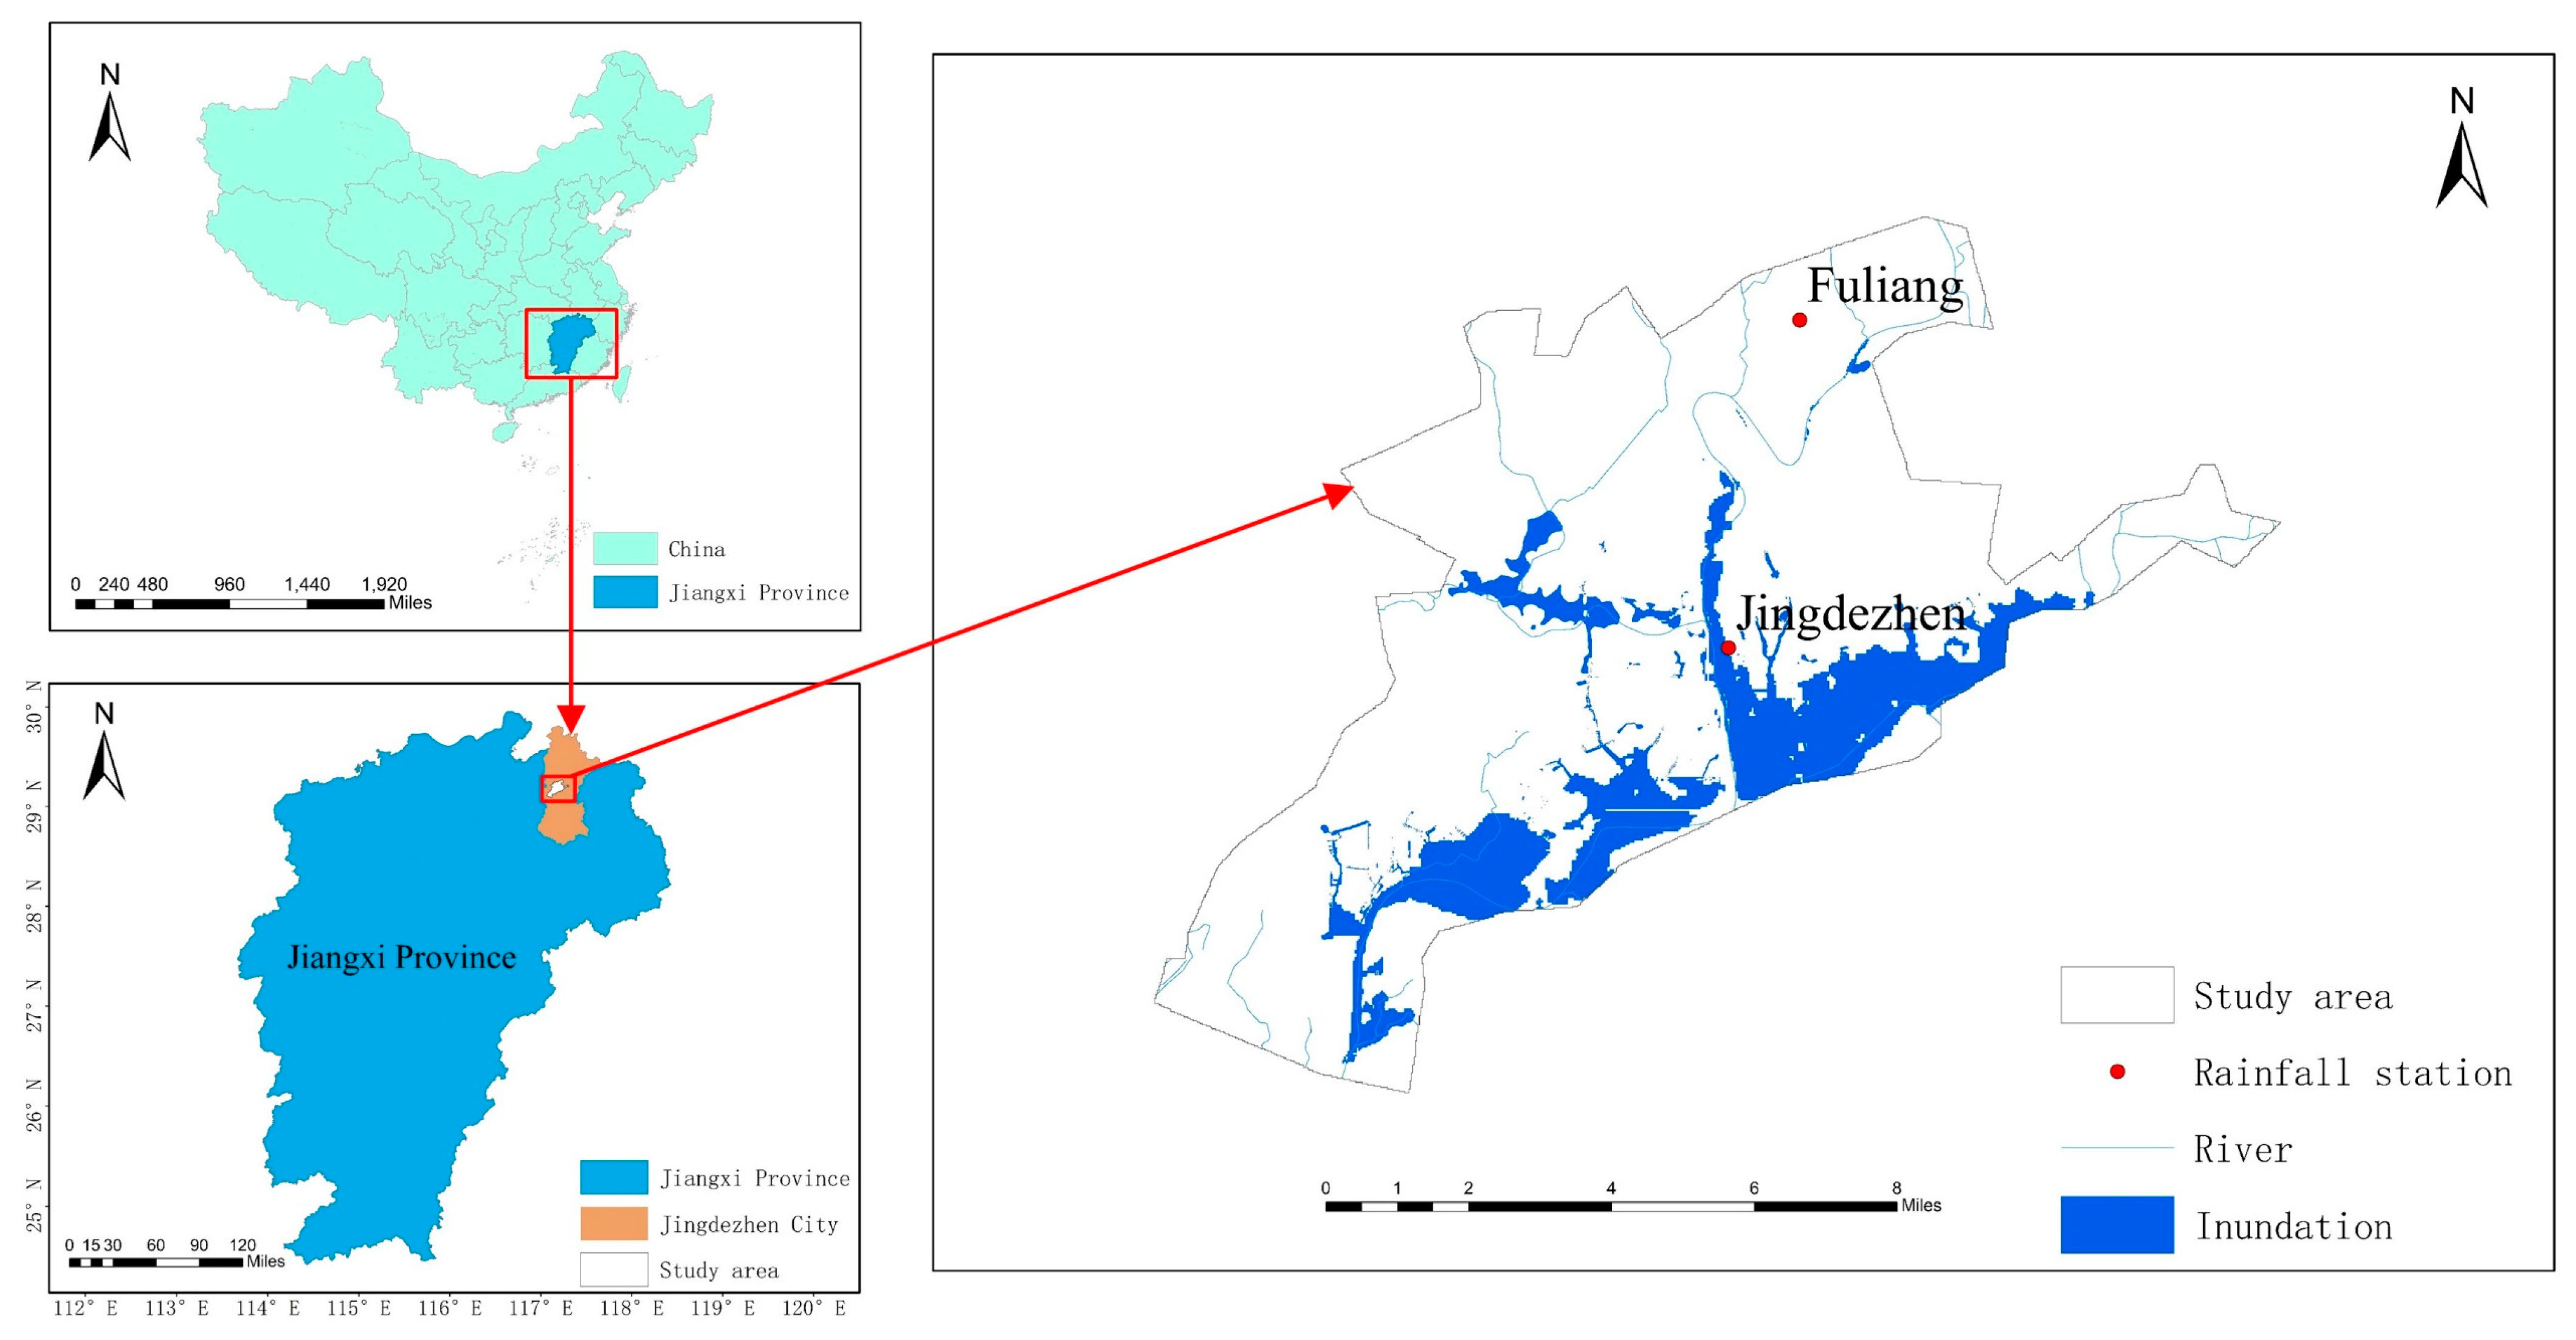
Jingdezhen City is located in the northeast of Jiangxi Province, the transition zone of Yellow Mountain, Huaiyu Mountain and Poyang Lake Plain. Our target study area is the urban area of Jingdezhen (Figure 3), with an area of about 192 km2. The terrain is high around and low in the middle, resembling a basin, thus its being prone to flood with continuous heavy rainfall. The main rivers are the Changjiang River, and its tributaries, Nanhe River and Xihe River. The area predominantly has a mid-subtropical monsoon climate, affected by the climate of the Poyang Lake Basin, the annual distribution of precipitation in Jingdezhen is rather uneven, and the average annual precipitation from April to June accounts for about 46% of the annual precipitation, annual precipitation 1763.5 mm. Jingdezhen is one of the fast-growing cities in the Poyang Lake Basin, the average growth rate of GDP in the past ten years has exceeded 10%. The flood disaster caused by rainstorm is the most devastating natural disaster in Jingdezhen. According to record on June 19, 2016, the affected population is about 528,700, and the direct economic loss is about 1,895.44 million Yuan, accounting for 2.26% of the GDP of that year.
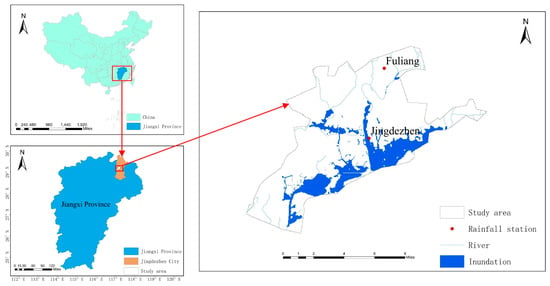
Figure 3.
Jingdezhen City and 100-year return period inundation area.
3.2. Data Collection and Preparation
The factors’ data collected from different sources can be summarized into three categories: (1) raster data, Digital Elevation Model (DEM), soil, land cover; (2) vector data, the boundary of the study area, river network, road network, and pipe network; (3) the statistical data, the population, GDP, and the annual rainfall. Data of the study area are collected from 2005 to 2010, the data of the first five years (2005–2009) as the training set, and the data in 2010 are used for prediction and comparison verification. Data collection and processing are discussed in detail below.
Obtaining the historical inundation area is the key to the evaluation of the flood inundation risk in BN to explain the correlation between flood inundation risk and influencing factors [25,34]. In this study, the 100-year return period inundation area is derived from the report of the World Bank Loan Project, as the maximum inundation range of the study area. As a result, 33,872 points are identified as inundation areas in the study area (Figure 2). The inundation area and non-inundation area are assigned a code of 1 and 0, respectively, to simplify the research.
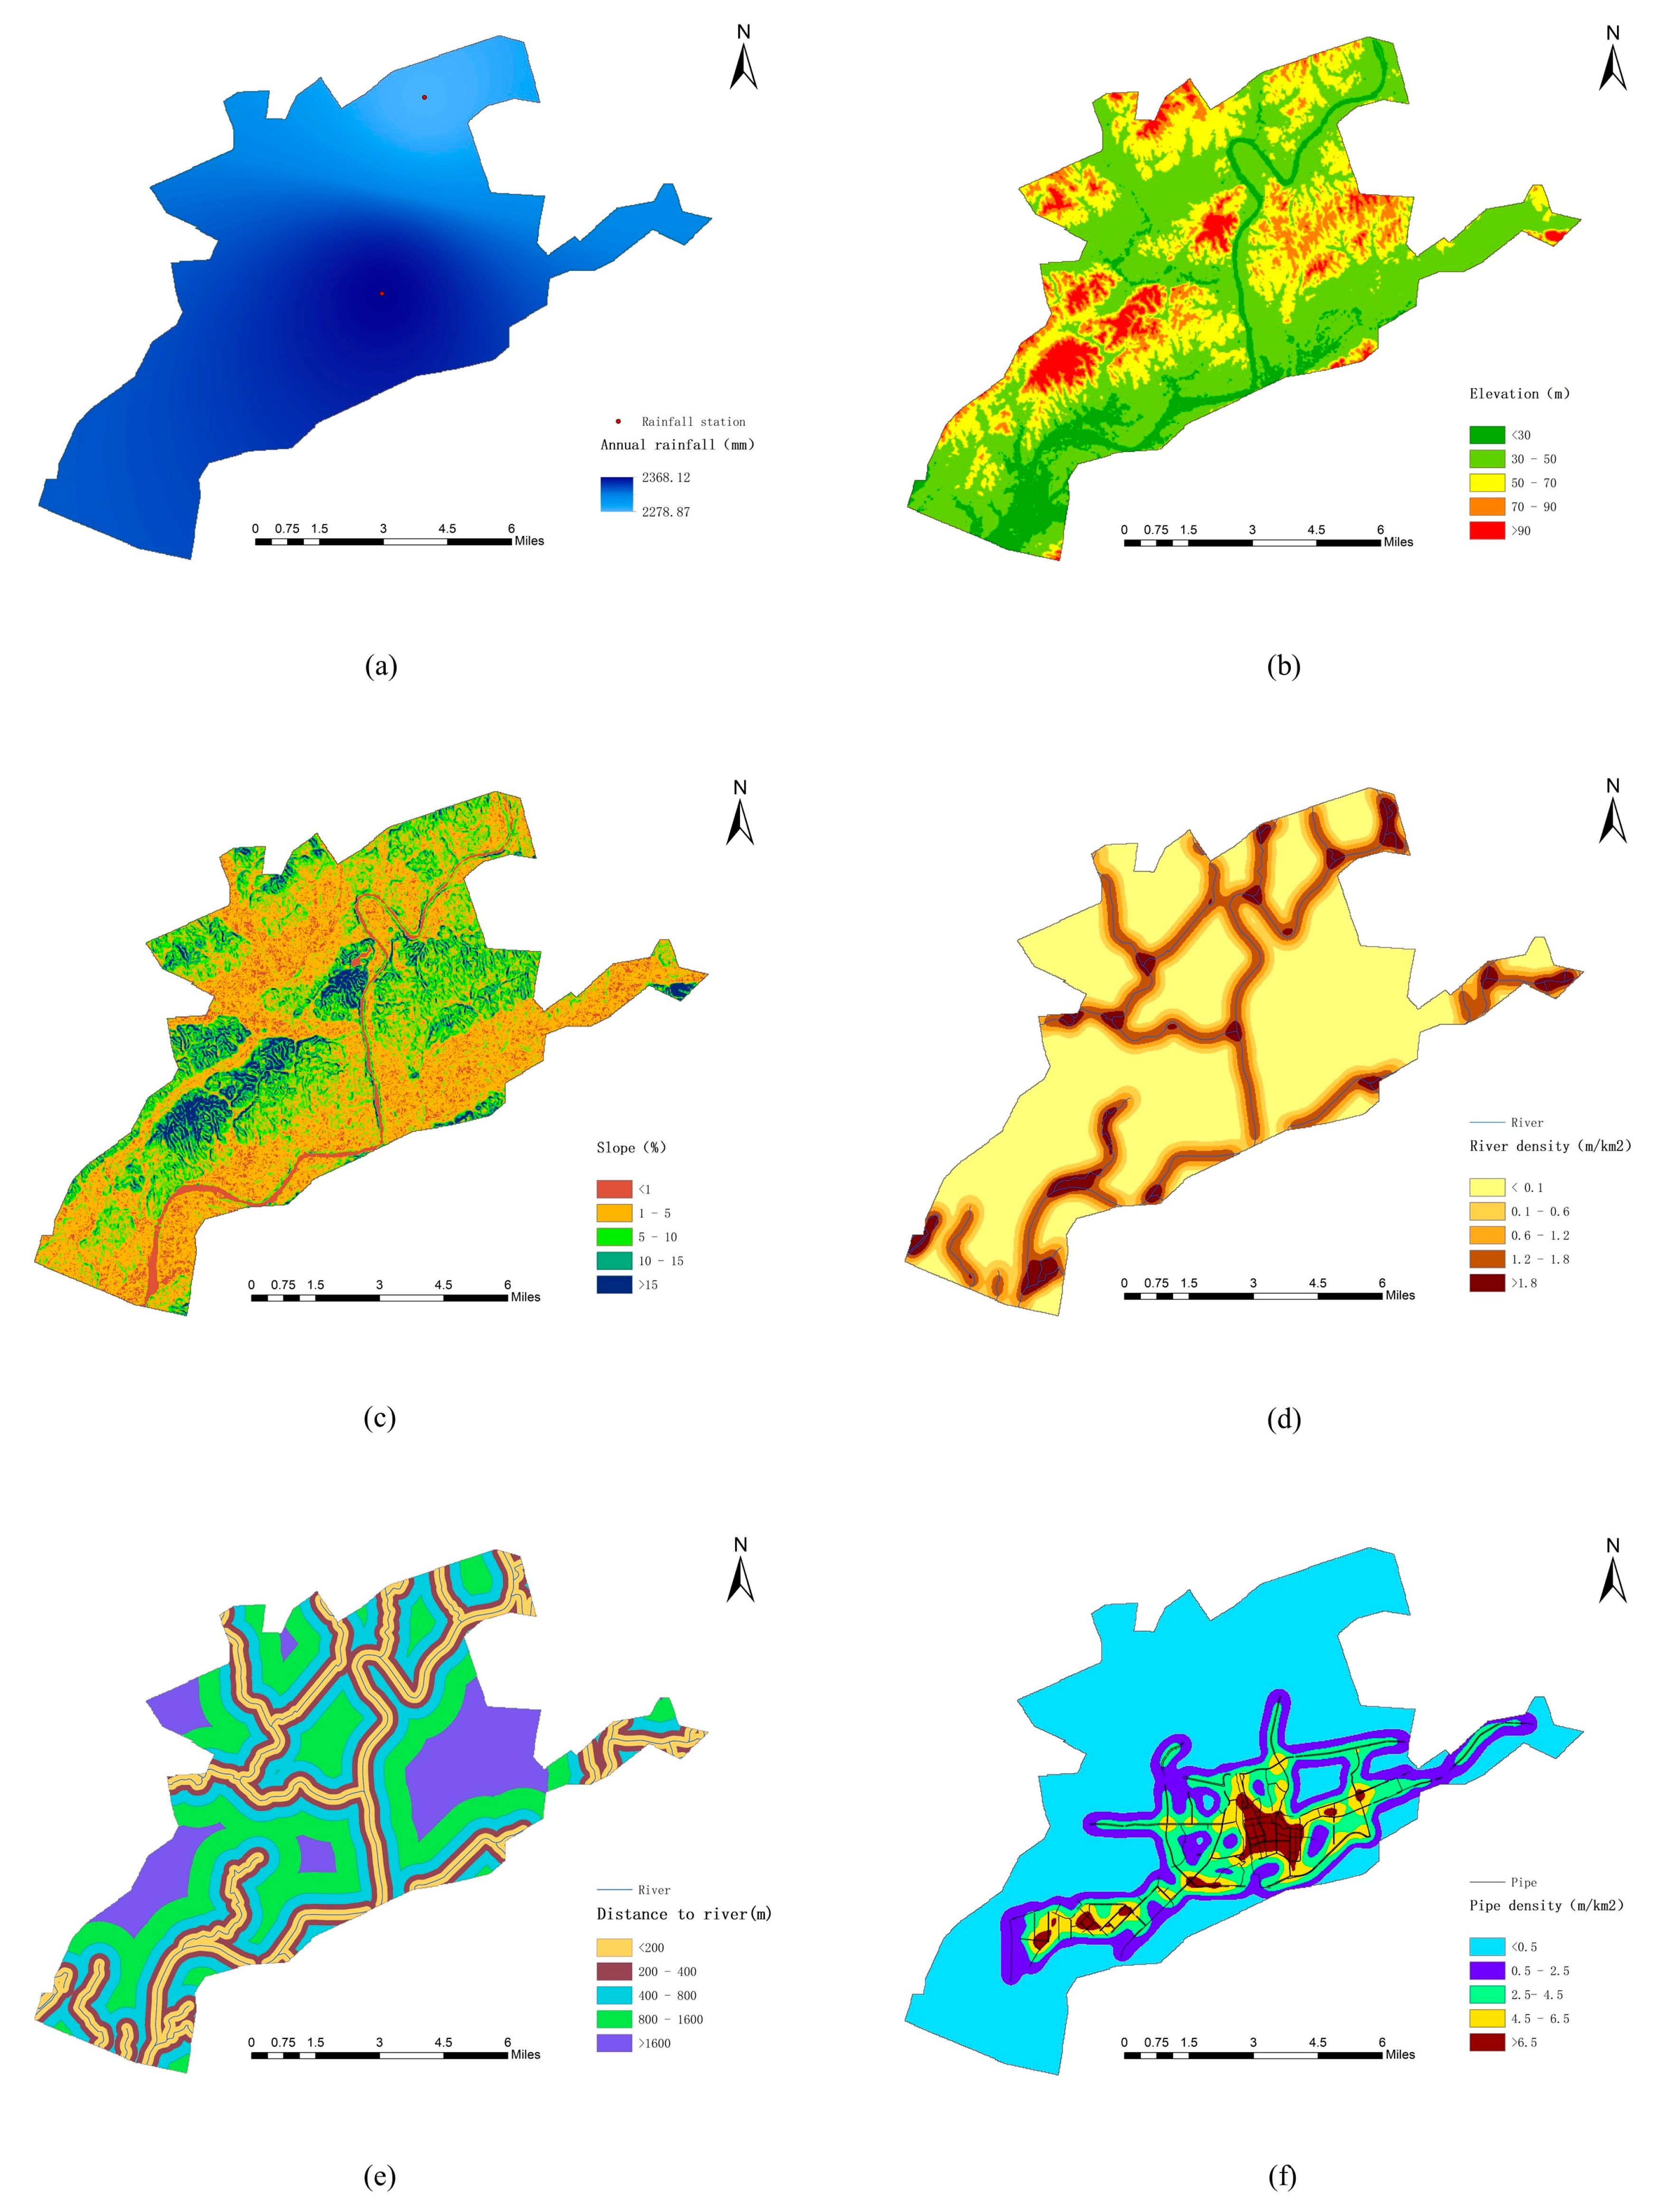
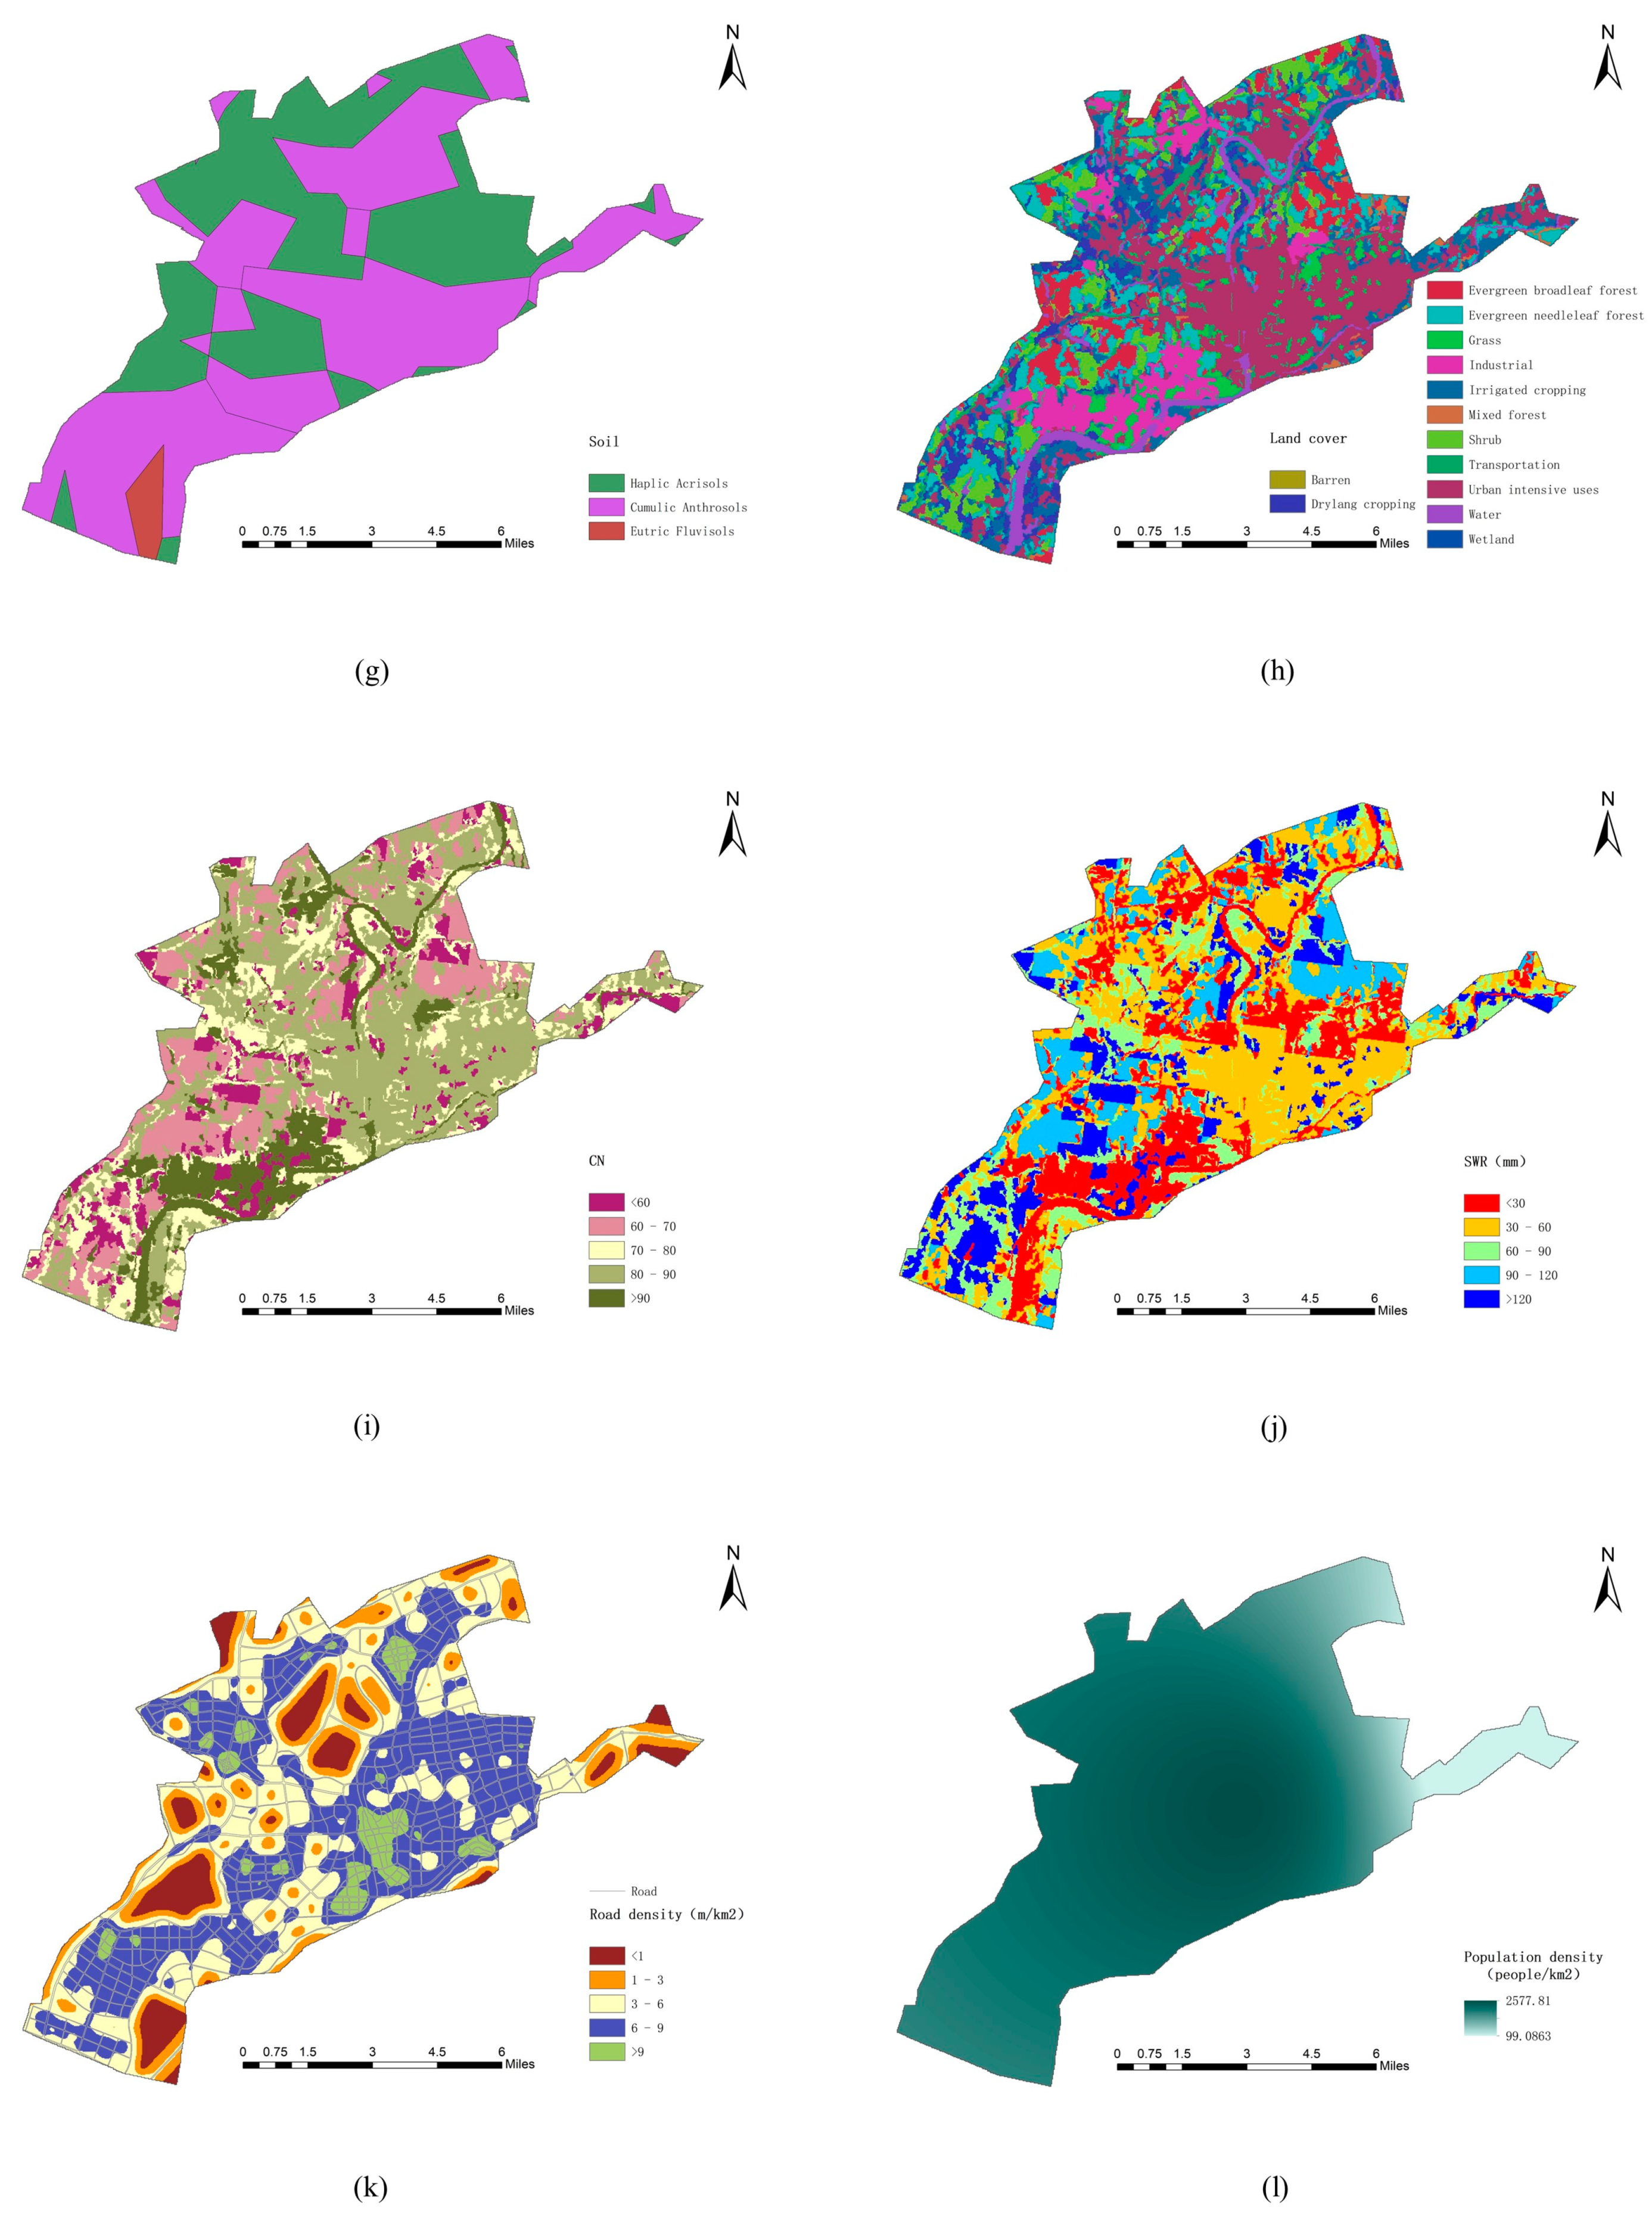
Rainfall is one of the main important causes of urban flood inundation. The greater the rainfall, the greater the flood inundation risk. These rainfall data are obtained from the China Meteorological Data Network (http://data.cma.cn) and rainfall monitoring stations in Jingdezhen City. A rainfall map (Figure 4a) is created using the mean annual rainfall of 5 years (2005–2009) by the inverse distance weighting method in ArcGIS.
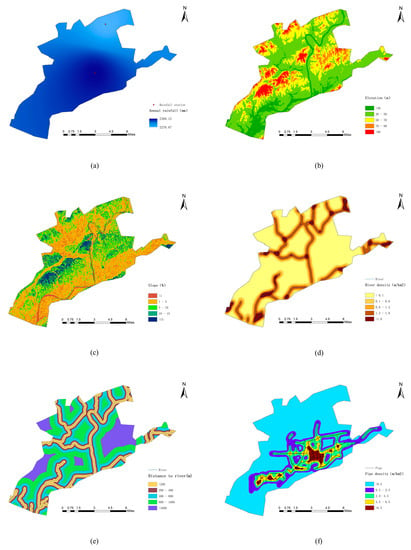
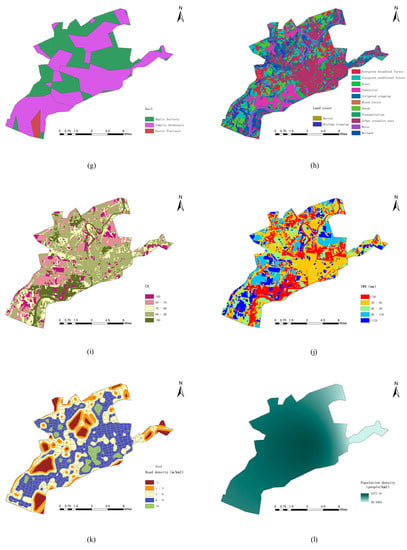
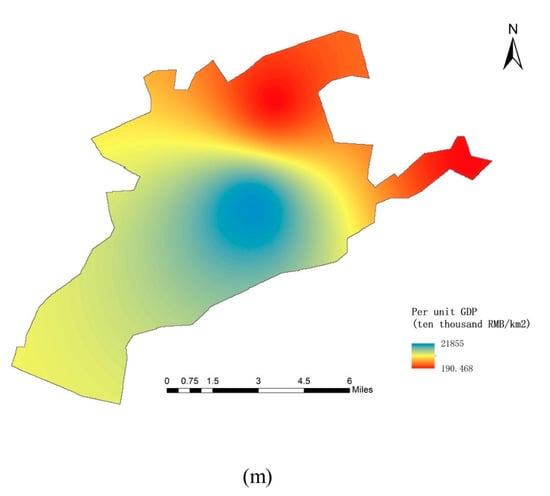
Figure 4.
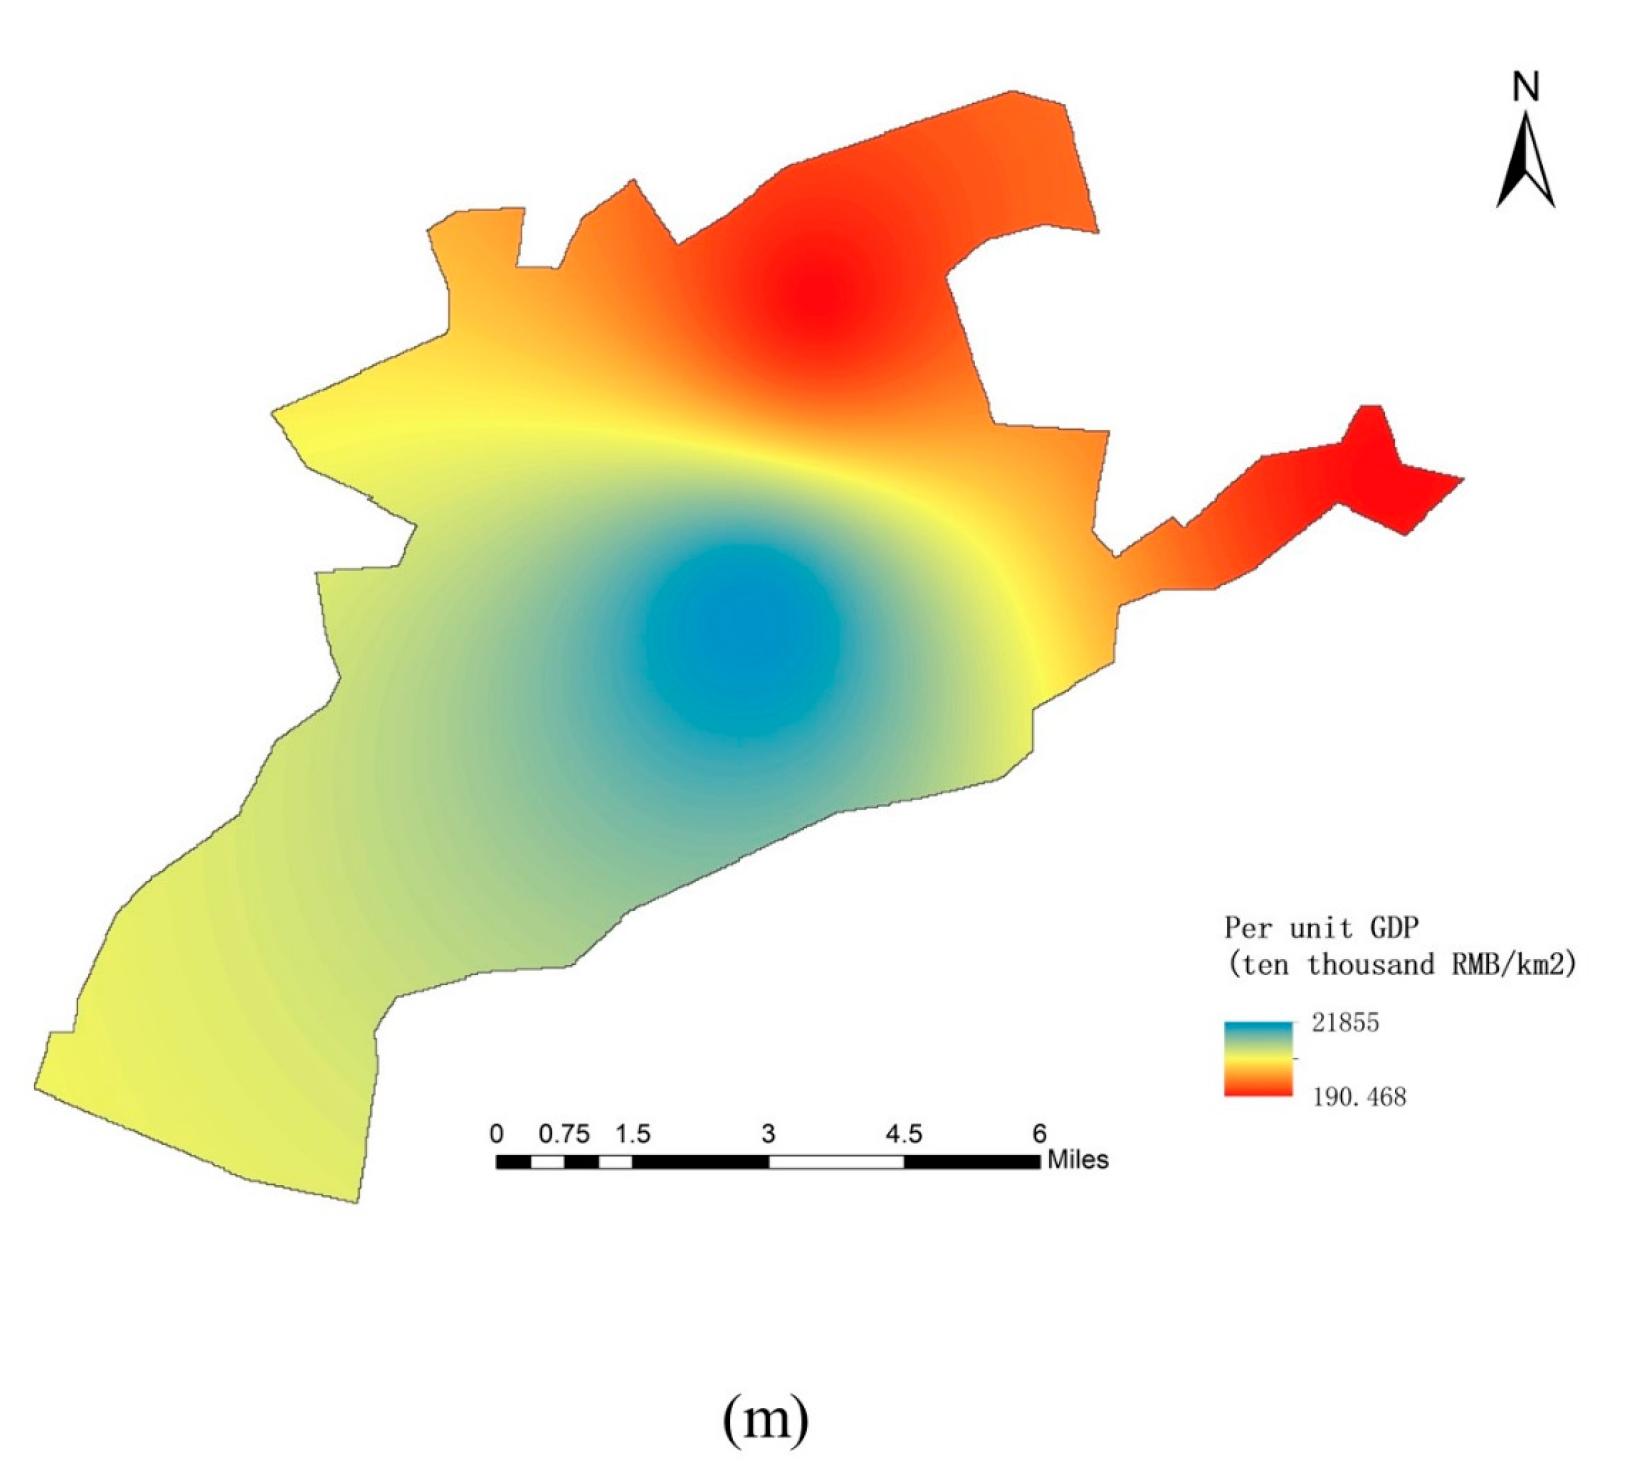
Spatial distribution data in study area: (a) Annual rainfall; (b) Elevation; (c) Slope; (d) River density; (e) Distance to river; (f) Pipe density; (g) Soil; (h) Land cover; (i) Curve Number (CN); (j) soil water retention (SWR); (k) Road density; (l) Population density; (m) Per unit gross domestic product (GDP).
Elevation is commonly represented by the vertical distance from certain surface to the reference basement in the DEM, which reflects the surface of the terrain. Generally speaking, the lower the elevation, the easier to be inundated because rainfall easily flows from highlands to lowlands under natural conditions. The elevation (Figure 4b) is generated from the DEM with 30-m resolution downloaded from the Geospatial Data Cloud (http://www.gscloud.cn).
Slope is used to reflect the degree of terrain change with distance. The slope factor plays an important role in flood inundation because it affects the flow velocity. The steeper the slope, the easier the flood will flow down the slope, and the less likely it will be inundated. The slope map (Figure 4c) is also extracted and calculated from the DEM in ArcGIS to quantify topographic controls on hydrological processes.
River density is the length of the rivers per unit area, calculated from a linear density function using 1-km radius in ArcGIS (Figure 4d). The river network map data with a scale of 1:250,000 is collected from the National Basic Geographic Information Center (http://www.webmap.cn) and the Water Resources Bureau of Jingdezhen City. The occurrence of flood disasters is related to the distribution of the drainage system. Drainage system includes indicators, such as river density, distance to river, and pipe density. Many floods occur in areas with high river density due to the large runoff accumulations and low infiltration rates.
Distance to river refers to the distance from each grid to the nearest river. Distance to river is obtained by using multiple buffer operator in ArcGIS (Figure 4e). The influence of this indicator decreases as the distance increases. Areas close to the river may be prone to be inundated because of levees overrunning or breaking, while areas far from the river are safe.
Pipe density can also be generated by using the line density function using 1-km radius (Figure 4f) from underground pipe map, including urban area drains and roadside drains, which is provided by the Water Resources Bureau of Jingdezhen City. Water can be discharged quickly in areas with a dense drainage pipe network, thereby reducing the risk of flood inundation. On the contrary, when the water volume exceeds the capacity of the pipes, the water depth in low-lying areas increases, leading to inundation.
SWR is related to the occurrence of flood inundation. Soils with high SWR can absorb more water and reduce the risk of flood inundation. Flood inundation risk is also affected by previous floods and the amount of water stored in the soil. Long-term and severe droughts have depleted soil moisture, which means that flood require more water. Different vegetation types and soil properties have different infiltration capacity and SWR. The potential maximum SWR is calculated by using the spatial hydrological simulation method, driven by the Soil Conservation Service Curve Number (SCS-CN) method [52]. The value of CN is determined by soil hydrological characteristics and land cover conditions, referenced from the list of CN publications [25,44]. Soil texture data with 30-m resolution (Figure 4g) are obtained from Nanjing Institute of Soil Science, Chinese Academy of Sciences (http://www.issas.ac.cn). The land cover data with 1-km resolution (Figure 4h) are acquired from the utilization plan of Jingdezhen City. Soil and land cover data are interconnected to decide the spatial distribution of CN using ArcGIS (Figure 4i). Based on the SCS-CN method and the value of CNi, the maximum potential SWR at grid i is calculated by function (5).
where the CNi is an integer, 0 < CNi < 100. The derived spatial distribution of SWR index is shown in Figure 4j.
Road density is used to express the ratio of the total length of the road network to the area in a certain area. The road network data with a scale of 1:250,000 are provided by the road plan of Jingdezhen City and the Water Resources Bureau of Jingdezhen City. Road density can be calculated and displayed by kernel density method in ArcGIS (Figure 4k). Areas with convenient transportation are more adaptable to flood disasters, so the higher the road density, the lower the flood inundation risk.
Population density represents the resilience and adaptability of different regions. Population data are provided from the Jingdezhen Statistical Yearbook, and population density map is exhibited by using the inverse distance weighting method in ArcGIS (Figure 4l). Urban flood inundation disasters are closely related to the process of urbanization. In densely populated areas, the damage caused by floods is more serious than in other areas, and the risk is high.
Per unit GDP is also an indicator of resilience and adaptability in different regions. Per unit GDP is a measure of the economic situation of a specific region, reflecting the economic strength of the area. The GDP data are provided by the Jingdezhen Statistical Yearbook and is displayed using by using the inverse distance weighting method ArcGIS (Figure 4m). Economically developed areas are highly adaptable to flood inundation disasters, with low risks, and vice versa.
The study area is divided into 213,878 30-m grid squares, and the raw data is generalized into each grid cell. The vector dataset is rasterized. Then, all data sets are projected, resampled to 30-m grid cells, cropped to the study area, and registered so that all input grids accurately cover the same projection, cell size, and range.
3.3. Classification of Indices
From the indicator system in Section 3.2, heterogeneous data collected from different sources have different metrics. Moreover, the BN-based model generally deals with the probabilities of discrete data. Therefore, it is necessary to reclassify these indicator date into a limited set of state with corresponding probability values to simplify the evaluation process and improve the efficiency of spatial data processing. However, there is currently no general method to classify flood influencing factor indicators [15]. The discretization and reclassification of input indicators have a significant impact on the results of flood inundation risk. In this study, we reclassify the input indicators data combined with the actual local conditions based on the literature and the domain knowledge of experts [27,33,44]. The indicator data is rescaled into five levels: Very_low, Low, Moderate, High, and Very_high, as summarized in Table 1.

Table 1.
Factors divided into five classes using the manual classification method.
4. Results
4.1. Prior Probability of Risk Factors
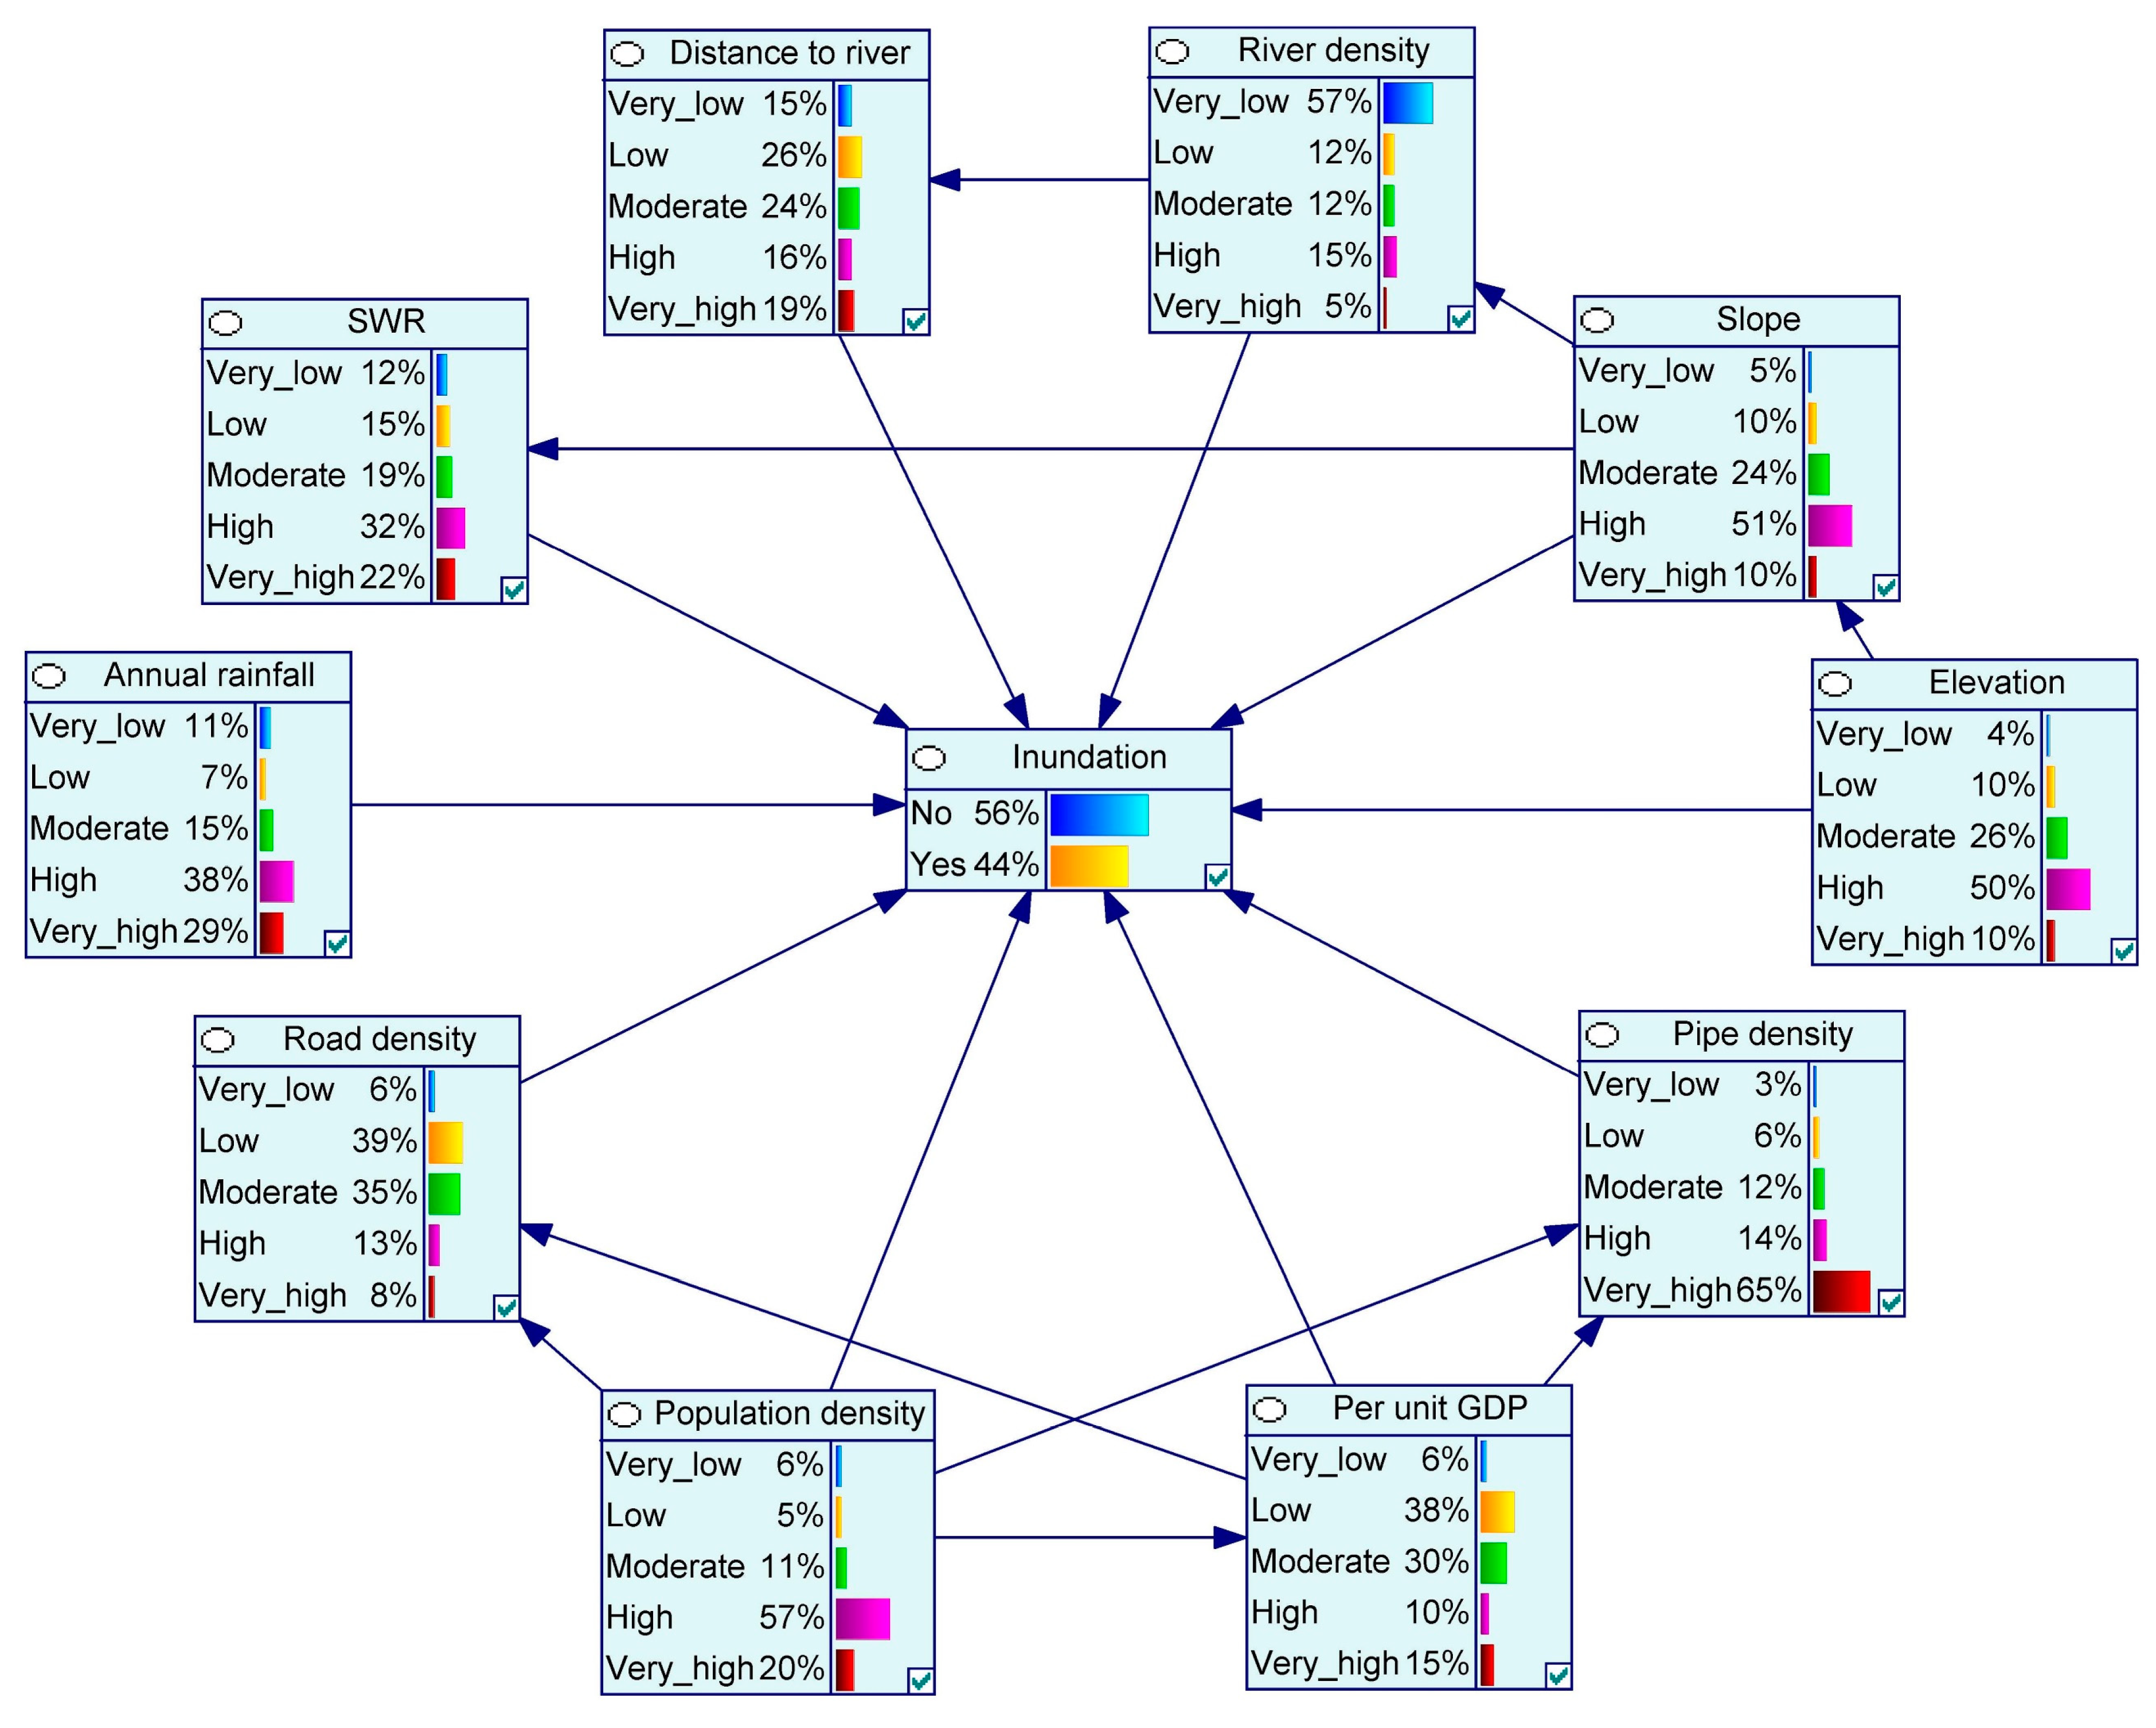
The DAG of BN is synthesized by investigating the study area and referring to the relevant historical literature to select and determine the influencing factors and their relationships. As mentioned in Section 2.2 and Section 3 above, the indicators data of the influencing factors are collected and processed. The whole preprocessed data are randomly separated into 70% (including 23,710 inundation grids and 126,004 non-inundation grids) for training and learning and the other 30% (including 10,162 inundation grids and 54,002 non-inundation grids) for verifying the predictive capability of the model. Then, all data is imported into GeNIe to establish the BN model for urban flood risk assessment (Figure 5) through carrying out EM method. It can be seen that the states of these nodes are represented by bar, and the bars represent the probability of the state, expressed as percentage. For example, referring to the risk classification defined in Table 1, 4% of the “Elevation” is below 30 m, which is represented by the “Very_low” state; “Low” means that the elevation is between 30 and 50 m, with a probability of 10%; “Moderate” indicates that the elevation ranges from 50 to 70 m, and its probability of 26%; “High” means that the elevation ranges from 70 to 90 m, with a probability of 50%, and “Very_high” indicates that the probability of being over 90 m is 10%. The “Inundation” node expresses the probability of flood inundation. Through these probability values, the risk of flood inundation is divided into five levels: Very low, Low, Moderate, High, and Very high.
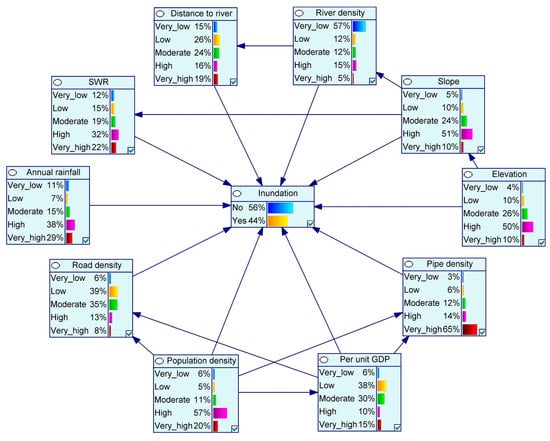
Figure 5.
Bayesian network (BN) model for urban flood inundation risk assessment.
The model clarifies the relationship among nodes and their corresponding states value, which can be queried through attributes of each variable. Accuracy and area under curve-receiver operating characteristic curves (AUC-ROC) are utilized to verify the performance of assessment model [53,54,55]. In this study, the verification results show that the accuracy is 94.40%, and the value of AUC-ROC is 0.9778, which indicates that the model has good performance and proves that that BN-based model is a feasible and reasonable method of flood inundation risk assessment.
4.2. Flood Inundation Risk Map
After obtaining the data of Jingdezhen City, the inundation risk probability values of all 213,878 research grids are deduced and predicted by using the developed model. For the simplicity and convenience of discussion and evaluation, the spatial distribution of flood inundation risk is further divided into five levels from very high risk to very low risk by using the classification method of Jenks break, which is a data classification method designed to determine the best arrangement of values into different classes.
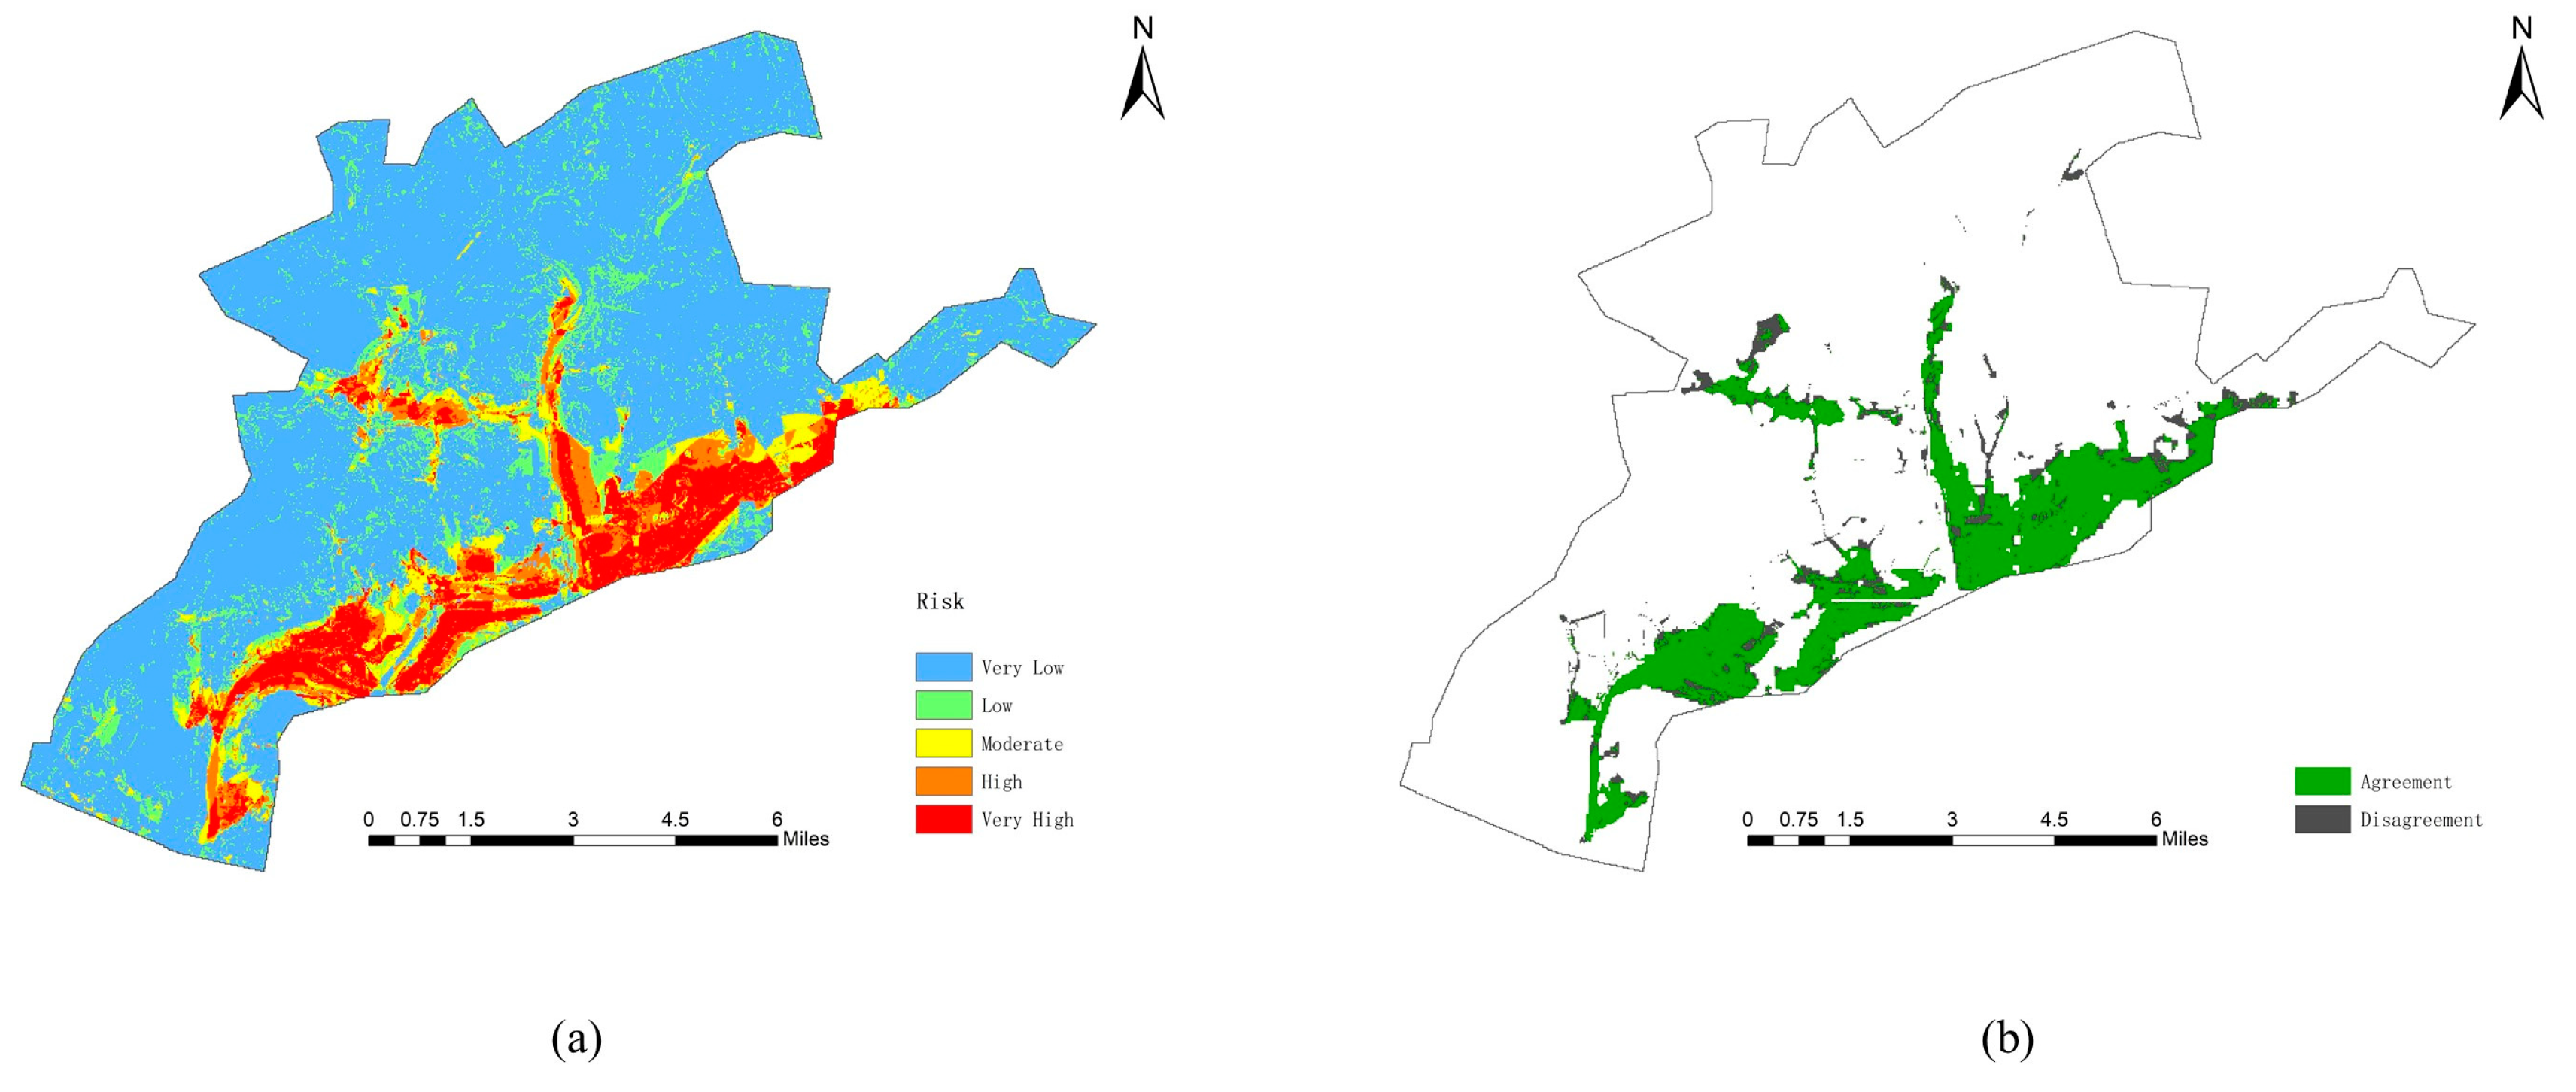
Then, the flood inundation risk map (Figure 6a) of Jingdezhen City is drawn in ArcGIS. The risk map shows that within the percentages of study area are about 8.95% at very high risk, 5.27% high risk, 5.75% moderate risk, 12.15% low risk, and 67.87% very low risk (Table 2). The very high risk and high risk areas in Figure 4b are the red and orange, covering approximately 292 km2 and accounting for 15.22% of the total area. Overall, the high-risk areas are concentrated in the southern and central regions of the study area, distributed along the river network, with flat terrain, easy accumulation, and prone to flood inundation in the case of heavy rainfall. Low-risk areas are mainly distributed in the northern part of the study area, with dense vegetation and rugged terrain, which is not prone to flood inundation. Therefore, these risk results provide baseline information that needs to be considered before formulating management plans and strategies for management, prevention, and reduction of flood disasters.
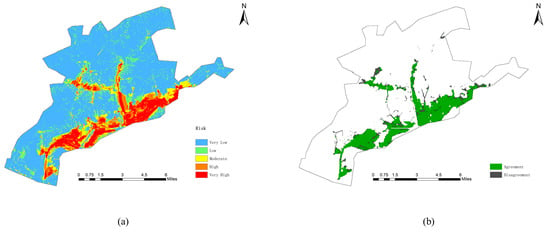
Figure 6.
Result validation: (a) Inundation risk of the study area from the model; (b) overlay comparison of modeled high-risk area against actual inundation extent.

Table 2.
Risk classification.
In order to verify the model evaluation results, the high-risk map of the predicted high risk and very high region extracted from Figure 4b is compared with the actual inundation range in the Figure 2 [34]. The matching rate between them is calculated by superposition in ArcGIS, and the matching degree between them is 92.04% (Figure 6b), which conforms basically in reasonable agreement with the actual inundation data. Moreover, through collecting the news and other information about the flood disaster in Jingdezhen City on 8 July 2010, it is found that the inundation locations in the reports is basically consistent with the predicted location of higher inundation probability. For example, Wangwangmiao Community in Changjiang District is seriously affected by flood inundation, and the inundation depth is more than one meter. The inundation probability predicted by the model in this Community is generally greater than 0.8, indicating that the probability of inundation is very high. The example further verifies the research results of the paper. But it should be worth noting that the simulated risk levels are still somewhat different from the actual inundation range. This may be due to the different methods of obtaining the actual inundation areas, or it may be related to the efficiency of the model. The above research results show that the risk predicted by the proposed risk assessment model were in good agreement with the actual flood inundation risk.
4.3. Key Disaster-Causing Factors Chains
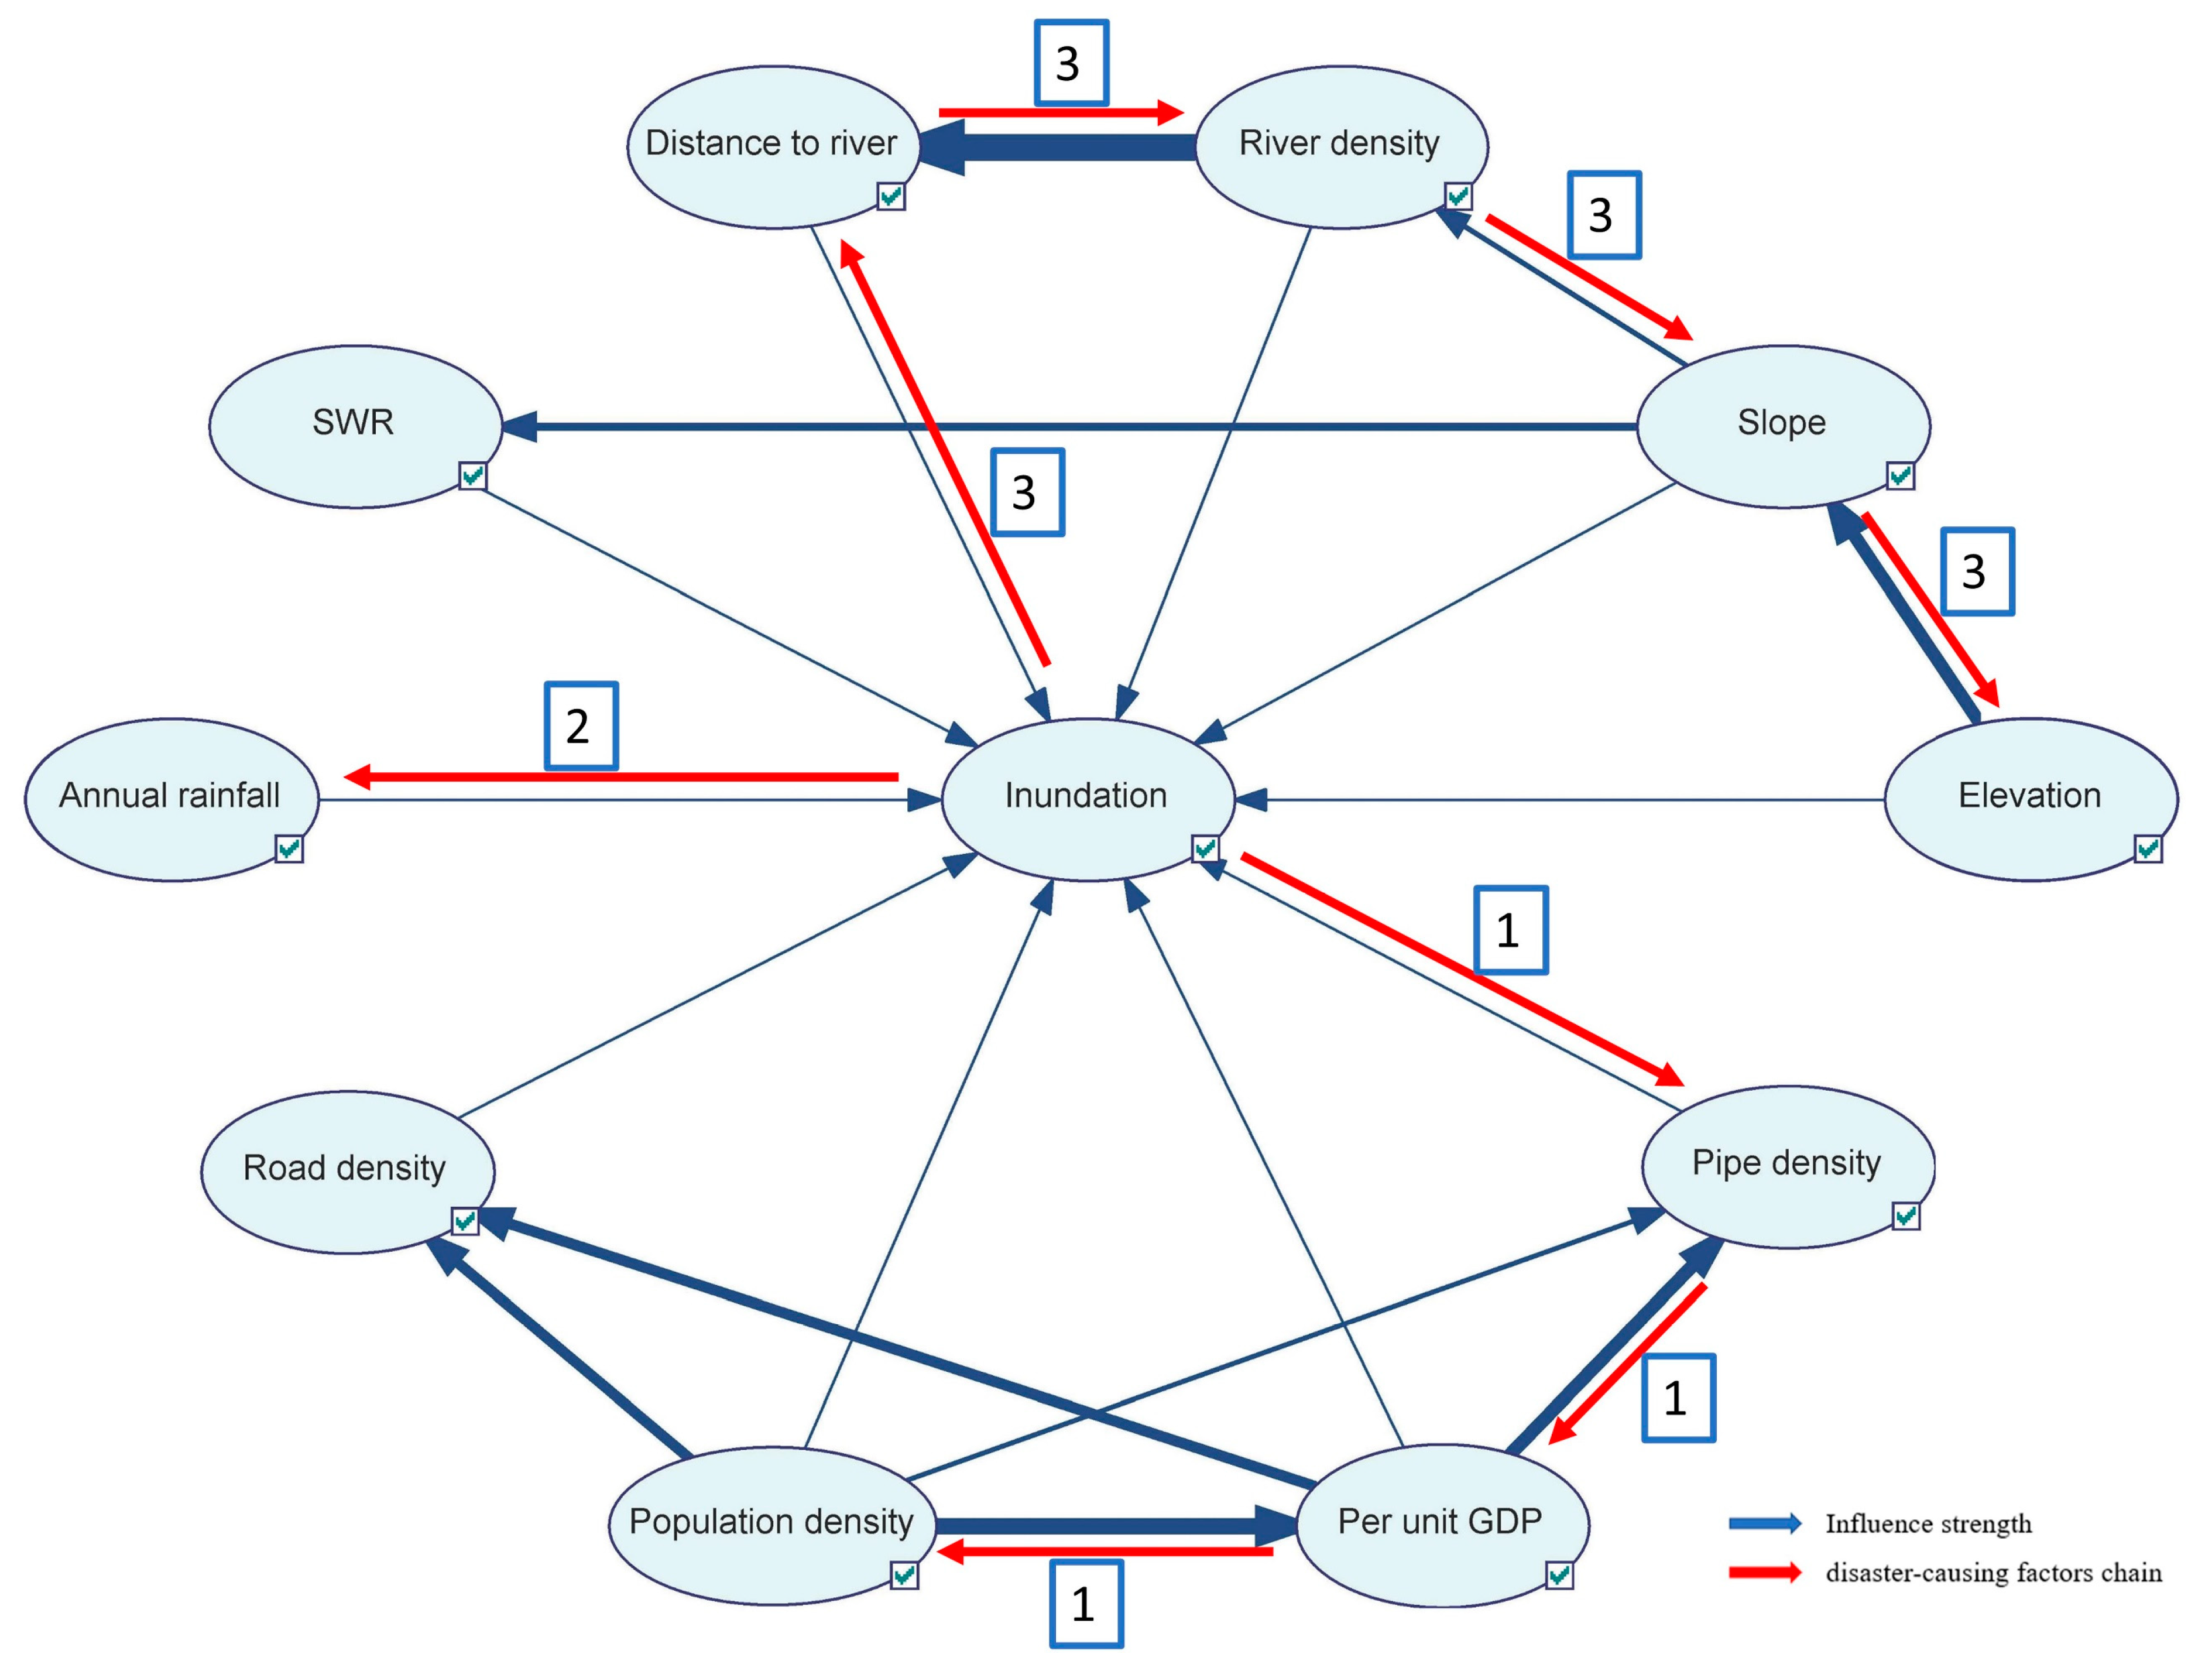
In this study, the formula (4) in Section 2.4 is used to calculate the values of influence strength between all parent and child nodes. In GeNIe, according to the influence strength between the parent and the child nodes, the connecting lines in the BN show different thicknesses. The higher the strength, the greater the influence of the parent nodes on the child nodes, and the thicker the connection line. The arc with the greatest influence strength is given as thick as possible, and the thickness of all the other arcs is proportional to the thickest arcs in BN (Figure 7, bule arcs). The list of all arcs in the model and their strength values in Table 3.
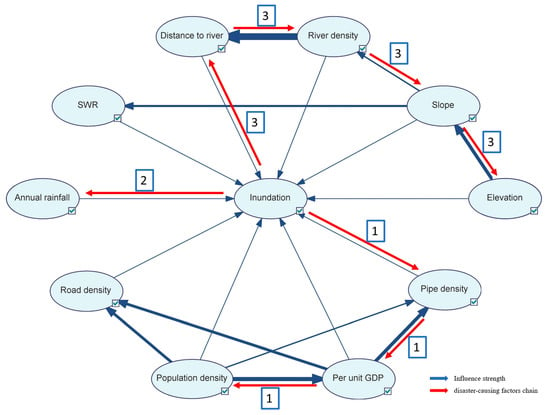
Figure 7.
Influence strengths and three key disaster-causing factors chains.

Table 3.
Influence strengths between all parent and child nodes.
There are some common nodes in the parent-child paths in Figure 7, which means that some child nodes in one path may be parent nodes in another path. According to the values of influence strength in Table 3, starting from the inundation node, different parent-child paths are matched with the public nodes, and the reverse derivation is carried out until the nodes without parent nodes, so as to identify the disaster-causing factors chains of urban inundation risk (Figure 7, red arcs). For example, starting from the target node Inundation, the parent nodes of inundation are ten factor nodes, such as Annual rainfall, Elevation, and so on. The maximum value of influence strength on node Inundation is the node Pipe density in Table 3; then, deduce Pipe density → inundation; the parent nodes of the node Pipe density have two nodes: Population density and Per unit GDP. Refer to the values of influence strength between these nodes in Table 3; the node Per unit GDP has the stronger influence strength on the node Pipe density; then, deduce Per unit GDP → Pipe density → inundation; and the node Per unit GDP only has one parent node: Population density, so infer the Population density → Per unit GDP → Pipe density → inundation. After diagnose and inference, the most likely cause chain of urban flood inundation risk is: Population density → Per unit GDP → Pipe density → inundation. The other disaster-causing factors chains can also be similarly inferred by the above method.
The first three disaster-causing factors chains obtained are considered as key disaster-causing factors chains (Figure 7 and Figure 8), which are, respectively, distributed in three aspects that affect urban flood disasters: hazard, vulnerability, and capacity.

Figure 8.
Key disaster-causing factors chains.
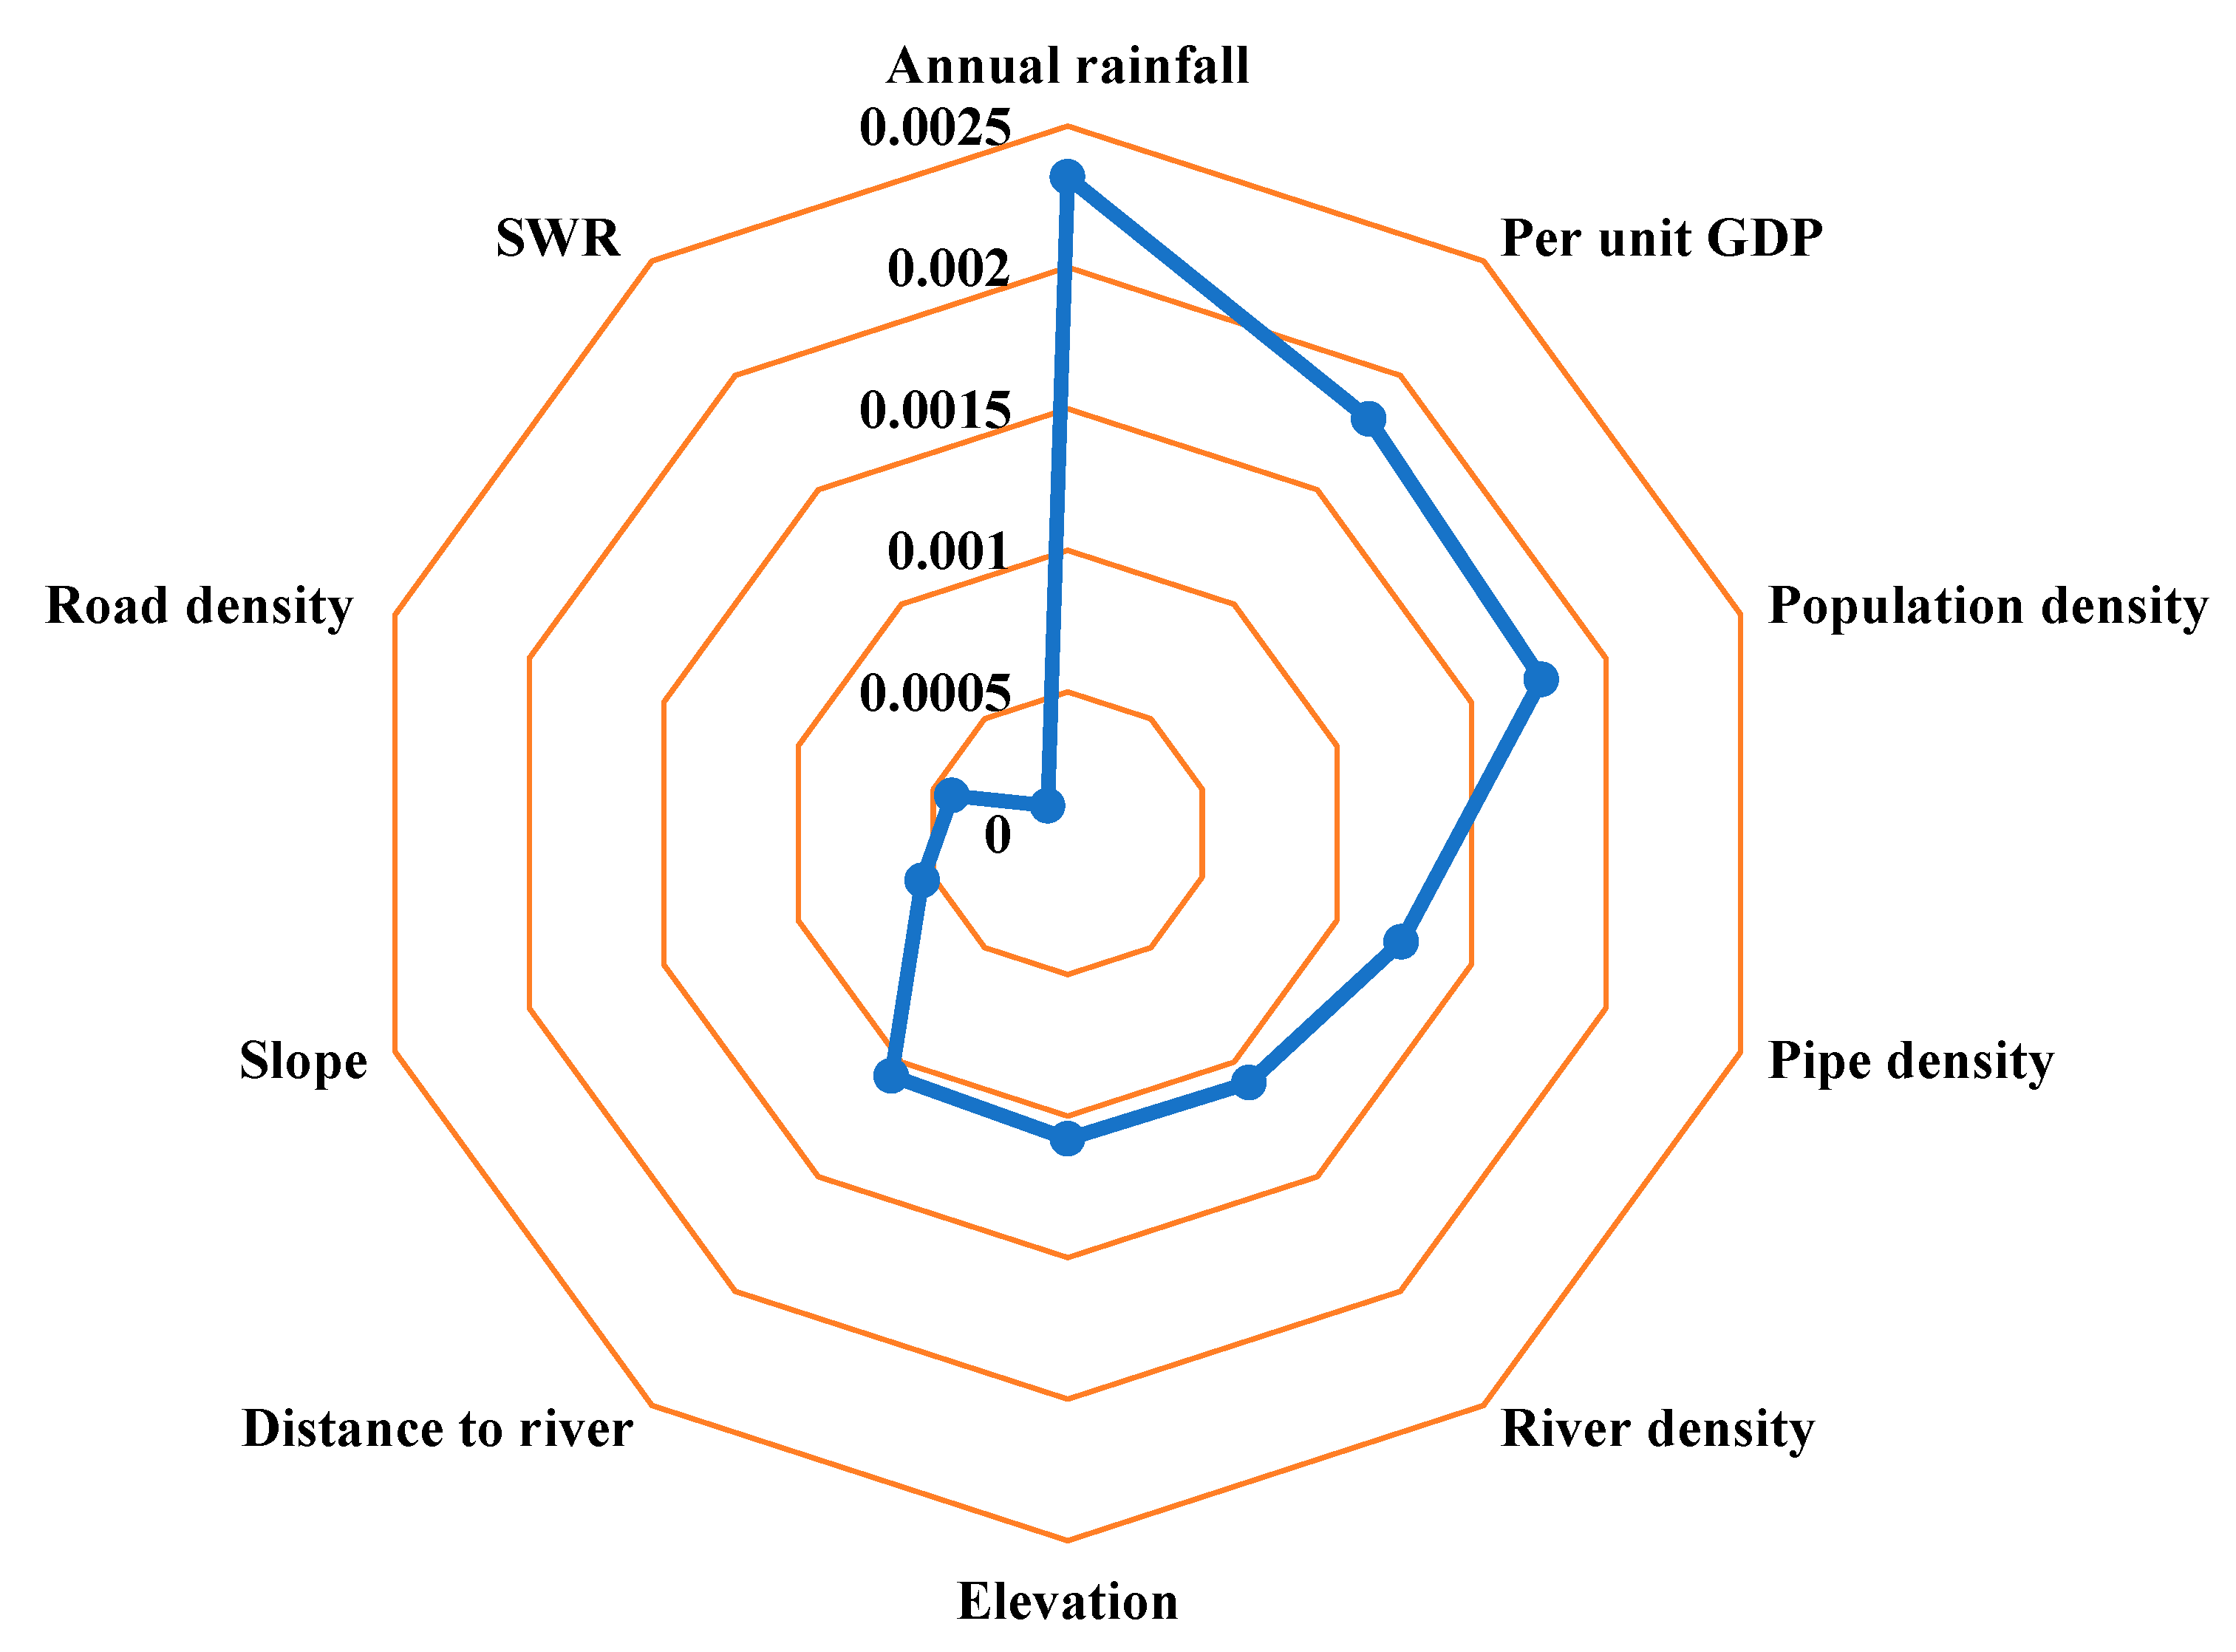
In this study, formulas (2) and (3) are used to calculate the sensitivity value of the nodes in GeNIe (Figure 9). In fact, what is most interesting is the order of importance of the influencing factors to the results. The results show that annual rainfall has the greatest impact on flood inundation. Except for road density, in the terms of the order of importance, hazard factor have the greatest impact on inundation, followed by the capacity factors and, finally, the vulnerability factors.
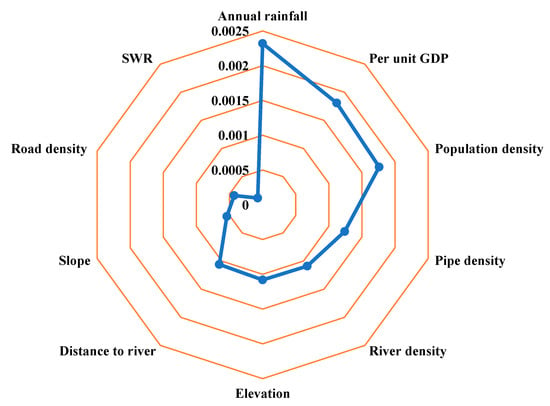
Figure 9.
Sensitivity value of the nodes.
When formulating disaster reduction strategies, we must focus on these more sensitive nodes. In addition, the results of the sensitivity analysis further verify the analysis of key disaster-causing factors chains because the factors with high sensitivity are all in the key disaster-causing factors chains.
5. Discussion
The urban flood inundation risk is affected by many complex and multiple factors, such as rainfall, topography, river network, vegetation, soil, etc. In most previous studies, it is considered that those factors effect on the inundation risk directly [12,14,26,56]. However, those influencing factors are interdependent, affecting flood inundation indirectly in the form of disaster-causing factors chains. In this study, it is believed that the correlations among the influencing factors of flood inundation are the key to flood inundation risk assessment. Based on field investigation and research on historical flood disaster events, the relationships and chain structure between them are determined according to the nature, type, and state value of each factor, and the DAG of BN is synthesized. Furthermore, a more convincing method is needed to determine the relationship between factors in the future.
The influence strength between the influencing factors is calculated based on urban flood risk assessment model, and three key disaster-causing factors chains are further discovered. Starting from the inundation result, it is reversed to derive all disaster-causing factors chains, which indicate that the influencing factors directly or indirectly affect urban flood inundation through the chain structure. Sensitivity analysis can be used to analyze the importance of influencing factors on the inundation, and verify the key disaster-causing factors chains to a certain extent. Three key disaster-causing factors chains are discovered as follows: (1) Rainfall is the main factor that directly leads to inundation. This is in agreement with the research results of others [16,44]. (2) Socio-economic development also affects the degree of inundation risk, and the results show that the influence paths of socio-economic factors not only have a direct impact but also indirectly affect flood inundation in the form of disaster-causing factors chains. Specifically, population density affects inundation through per unit GDP and pipe density: Population density → Per unit GDP → Pipe density → inundation. However, most previous studies have suggested that socioeconomic factors directly affect inundation [10,27]. (3) The results indicate that geographical environmental factors are also one of the main reasons affecting inundation. And the influence of geographical factors on inundation from the perspective of chain is further analyzed in the study. Elevation affects the size of the slope, which in turn acts on the river network and, finally, affects the inundation: Elevation → Slope → River density → Distance to river → Inundation.
Flood is a serious catastrophic event that can happen almost anywhere, with strong uncertainty. Compared with Naive Bayesian method, BN can quantify the uncertainty and capture the causal relationship among the influencing factors under uncertain conditions. Besides that, BN allows propagation of information in the form of instantiated variable states forward or backward through nodes or variables. In this study, BN is used to construct a risk assessment model and predict the inundation probability of each grid. And compared with Pourghasemi et al. [22] and Liu et al. [27], the predicted results have higher accuracy and reliability. In addition, the flood risk map of Jingdezhen City obtained using BN in this study is in agreement with results of previous studies in this area [57,58].
According to the field survey and the report of the World Bank Loan Project, so far, once in 100 years is the largest disaster, so the inundation area is considered to be the largest. In Jingdezhen City, due to the establishment of the Wuxikou Reservoir, the ability to withstand flood has increased to once in 50 years from once in 20 years [59]. In fact, climate change will change the frequency and recurrence period of flood disasters, and further research will be conducted to predict the possibility of grids flooding caused by climate change. In the study, the accuracy of inundation risk is mainly limited by the availability and accuracy of the data, so future research needs to collect more and more comprehensive data based on advanced methods while improving the resolution of raw data, for example, using drones to collect high-resolution data in order to improve the urban flood risk mapping, which can correct the risk probability map [60]. And incorporating more other cities with similar flood characteristics for training and analysis will find more general disaster-causing factors chains.
6. Conclusions
The study proposes a novel framework for spatial urban flood inundation risk assessment and key disaster-causing factors chains exploration by integrating BN and GIS. Urban flood inundation is affected by various factors, the potential relationships among factors are determined by using experts’ experience and relevant literature. The BN-based model is constructed by a large number of historical disaster data collected and processed from different sources, which is applied to explore the disaster-causing factors chains in Jingdezhen City.
The established model is used for causal inference to gain the inundation risk probability value of each grid in the study area, the results show that the probability of inundation in most areas is low, 85.77% of the areas are less than 0.547, mainly distributed in the northern position. Risk greater than 0.8 account for about 9%, and most of these areas are located in the central and southern regions. Specifically, about 8.95% is very high risk, 5.27% high risk, 5.75% moderate risk, 12.15% low risk, and 67.87% very low risk. There is 92.04% overlap ratio between predicted high-risk and actual inundation to verify the efficiency of the model.
The influence strength analysis finds out the disaster-causing factors chains. Rainfall affects inundation directly in natural conditions, river is the key factor on inundation which is influenced by elevation and slope in geographical environment, and, in the socio-economic environment, the population will determine the pipe density through affecting GDP, and lead to the inundation. Specifically, three key chains are identified: (1) Annual rainfall → inundation; (2) Population density → Per unit GDP → Pipe density → inundation; (3) Elevation → Slope → River density → Distance to river → Inundation. These chains are consistent with the actual situation in Jingdezhen City. Sensitivity analysis of the node inundation is carried out on to diagnosis the importance of influencing factors, indicating that the rainfall has the greatest impact on inundation disasters, followed by geographic factors and, finally, vulnerability factors. The sensitivity analysis also verifies the key disaster-causing factors chains to a certain extent.
The research results provide a scientific reference for urban planning and flood prevention management. The disaster reduction and prevention measures include two aspects, paying special attention to highly sensitive factors and cutting off the key disaster-causing factor chains. For each chain, the prevention of one factor in the chain cuts off the transmission of chain risks, eliminating the subsequent risks in the chain. Therefore, the prevention strategies should be taken as early as possible, especially those force majeure factors which can only be predicted to some extent and cannot be prevented. Specific strategies include strengthening the rainstorm forecast in the future, enhancing corporate and public awareness of the possible damage, and improving urban land use planning and reducing the impervious area, thereby reducing the damage caused by extreme flood events.
Author Contributions
Conceptualization, J.H. and H.W.; Methodology, S.H. and J.S.; Software, S.H.; Validation, J.H., Y.X. and J.S.; Formal Analysis, S.H.; Data Curation, S.H.; Writing—Original Draft Preparation, S.H.; Writing—Review & Editing, J.H. and Y.X.; Visualization, S.H.; Supervision, J.H. and H.W.; Project Administration, H.W.; Funding Acquisition, H.W. All authors have read and agreed to the published version of the manuscript.
Funding
This research was funded by National Natural Science Foundation of China (No. 91846203, No. 71601070).
Data Availability Statement
The collection and preprocessing of data are in Section 3.2. Due to government restrictions, these data not publicly available, such as the data of pipe network and road network. Data provided by the local government and other model-simulated data in this paper are available from the authors upon request (heartseahuang@163.com).
Acknowledgments
The authors thank BayesFusion, LLC, for using GeNIe software. The authors would like to express our gratitude to Jingdezhen Water Conservancy for their data support. The support from World Bank is also appreciated. All the anonymous reviewers are appreciated for their valuable and constructive comments which have improved the quality of the paper.
Conflicts of Interest
The authors declare no conflict of interest.
References
- Jamali, B.; Löwe, R.; Bach, P.M.; Urich, C.; Arnbjerg-Nielsen, K.; Deletic, A. A rapid urban flood inundation and damage assessment model. J. Hydrol. 2018, 564, 1085–1098. [Google Scholar] [CrossRef]
- Darabi, H.; Choubin, B.; Rahmati, O.; Torabi Haghighi, A.; Pradhan, B.; Kløve, B. Urban flood risk mapping using the GARP and QUEST models: A comparative study of machine learning techniques. J. Hydrol. 2019, 569, 142–154. [Google Scholar] [CrossRef]
- D’Addabbo, A.; Refice, A.; Pasquariello, G.; Lovergine, F.P.; Capolongo, D.; Manfreda, S. A Bayesian Network for Flood Detection Combining SAR Imagery and Ancillary Data. IEEE Trans. Geosci. Remote Sens. 2016, 54, 3612–3625. [Google Scholar] [CrossRef]
- UNDRR. Understanding Risk. 2015. Available online: https://www.undrr.org/building-risk-knowledge/understanding-risk (accessed on 8 February 2021).
- Li, J.; Chen, H.; Liu, Z.; Zou, C. Integrated GIS/AHP-based flood disaster risk assessment and zonation: A case study of Henan Province, China. Proc. SPIE 2010. [Google Scholar] [CrossRef]
- Danumah, J.H.; Odai, S.N.; Saley, B.M.; Szarzynski, J.; Thiel, M.; Kwaku, A.; Kouame, F.K.; Akpa, L.Y. Flood risk assessment and mapping in Abidjan district using multi-criteria analysis (AHP) model and geoinformation techniques, (cote d’ivoire). Geoenviron. Disasters 2016, 3, 10. [Google Scholar] [CrossRef]
- Abhishek, G.; Kumar, K.S. Application of analytical hierarchy process (AHP) for flood risk assessment: A case study in Malda district of West Bengal, India. Nat. Hazard. 2018, 94, 349–368. [Google Scholar] [CrossRef]
- Zou, Q.; Zhou, J.; Zhou, C.; Song, L.; Guo, J. Comprehensive flood risk assessment based on set pair analysis-variable fuzzy sets model and fuzzy AHP. Stochastic Environ. Res. Risk Assess. 2013, 27, 525–546. [Google Scholar] [CrossRef]
- Lyu, H.; Sun, W.; Shen, S.; Arulrajah, A. Flood risk assessment in metro systems of mega-cities using a GIS-based modeling approach. Sci. Total Environ. 2018, 626, 1012–1025. [Google Scholar] [CrossRef]
- Lin, L.; Hu, C.; Wu, Z. Assessment of Flood Hazard Based on Underlying Surface Change by Using GIS and Analytic Hierarchy Process. Geo-Spatial Knowl. Intell. 2017, 698, 589–599. [Google Scholar] [CrossRef]
- Joo, H.; Choi, C.; Kim, J.; Kim, D.; Kim, S.; Kim, H.S. A Bayesian Network-Based Integrated for Flood Risk Assessment (InFRA). Sustainability 2019, 11, 3733. [Google Scholar] [CrossRef]
- Xu, H.; Ma, C.; Lian, J.; Xu, K.; Chaima, E. Urban flooding risk assessment based on an integrated k-means cluster algorithm and improved entropy weight method in the region of Haikou, China. J. Hydrol. 2018, 563, 975–986. [Google Scholar] [CrossRef]
- Jato-Espino, D.; Lobo, A.; Ascorbe-Salcedo, A. Urban flood risk mapping using an optimised additive weighting methodology based on open data. J. Flood Risk Manag. 2019, 12, e12533. [Google Scholar] [CrossRef]
- Mahmoud, S.H.; Gan, T.Y. Multi-criteria approach to develop flood susceptibility maps in arid regions of Middle East. J. Clean. Prod. 2018, 196, 216–229. [Google Scholar] [CrossRef]
- Shadmehri Toosi, A.; Calbimonte, G.H.; Nouri, H.; Alaghmand, S. River basin-scale flood hazard assessment using a modified multi-criteria decision analysis approach: A case study. J. Hydrol. 2019, 574, 660–671. [Google Scholar] [CrossRef]
- Zhao, G.; Pang, B.; Xu, Z.; Peng, D.; Xu, L. Assessment of urban flood susceptibility using semi-supervised machine learning model. Sci. Total Environ. 2018, 659, 940–949. [Google Scholar] [CrossRef] [PubMed]
- Chen, A.S.; Evans, B.; Djordjevi, S.; Savi, D.A. Multi-layered coarse grid modelling in 2D urban flood simulations. J. Hydrol. 2012, 470–471, 1–11. [Google Scholar] [CrossRef]
- Zhang, S.; Pan, B. An urban storm-inundation simulation method based on GIS. J. Hydrol. 2014, 517, 260–268. [Google Scholar] [CrossRef]
- Lhomme, J.; Sayers, P.; Gouldby, B.; Samuels, P.G.; Wills, M. Recent development and application of a rapid flood spreading method. In Floodrisk-Flood Risk Management; Research & Practice: Oxford, UK, 2008. [Google Scholar]
- Wang, Z.; Lai, C.; Chen, X.; Yang, B.; Zhao, S.; Bai, X. Flood hazard risk assessment model based on random forest. J. Hydrol. 2015, 527, 1130–1141. [Google Scholar] [CrossRef]
- Wu, Z.; Zhou, Y.; Wang, H.; Jiang, Z. Depth prediction of urban flood under different rainfall return periods based on deep learning and data warehouse. Sci. Total Environ. 2020, 716, 137077. [Google Scholar] [CrossRef] [PubMed]
- Pourghasemi, H.R.; Razavi-Termeh, S.V.; Kariminejad, N.; Hong, H.; Chen, W. An assessment of metaheuristic approaches for flood assessment. J. Hydrol. 2020, 582, 124536. [Google Scholar] [CrossRef]
- Goodarzi, L.; Banihabib, M.E.; Roozbahani, A. A decision-making model for flood warning system based on ensemble forecasts. J. Hydrol. 2019, 573, 207–219. [Google Scholar] [CrossRef]
- Chen, W.; Li, Y.; Xue, W.; Shahabi, H.; Li, S.; Hong, H.; Wang, X.; Bian, H.; Zhang, S.; Pradhan, B.; et al. Modeling flood susceptibility using data-driven approaches of naive Bayes tree, alternating decision tree, and random forest methods. Sci. Total Environ. 2020, 701, 134979. [Google Scholar] [CrossRef] [PubMed]
- Tang, X.; Shu, Y.; Lian, Y.; Zhao, Y.; Fu, Y. A spatial assessment of urban waterlogging risk based on a Weighted Naive Bayes classifier. Sci. Total Environ. 2018, 630, 264–274. [Google Scholar] [CrossRef] [PubMed]
- Liu, R.; Chen, Y.; Wu, J.; Gao, L.; Barrett, D.; Xu, T.; Li, L.; Huang, C.; Yu, J. Assessing spatial likelihood of flooding hazard using naïve Bayes and GIS: A case study in Bowen Basin, Australia. Stochastic Environ. Res. Risk Assess. 2015, 30, 1575–1590. [Google Scholar] [CrossRef]
- Liu, R.; Chen, Y.; Wu, J.; Gao, L.; Barrett, D.; Xu, T.; Li, X.; Li, L.; Huang, C.; Yu, J. Integrating Entropy-Based Naive Bayes and GIS for Spatial Evaluation of Flood Hazard. Risk Anal. 2017, 37, 756–773. [Google Scholar] [CrossRef] [PubMed]
- Li, L.; Wang, J.; Leung, H. Using spatial analysis and Bayesian network to model the vulnerability and make insurance pricing of catastrophic risk. Int. J. Geog. Inf. Sci. 2010, 24, 1759–1784. [Google Scholar] [CrossRef]
- Wu, Z.; Shen, Y.; Wang, H.; Wu, M. Urban flood disaster risk evaluation based on ontology and Bayesian Network. J. Hydrol. 2020, 583, 124596. [Google Scholar] [CrossRef]
- Aguilera, P.A.; Fernández, A.; Ropero, R.F.; Molina, L. Groundwater quality assessment using data clustering based on hybrid Bayesian networks. Stochastic Environ. Res. Risk Assess. 2013, 27, 435–447. [Google Scholar] [CrossRef]
- Hosseini, F.S.; Choubin, B.; Mosavi, A.; Nabipour, N.; Shamshirband, S.; Darabi, H.; Haghighi, A.T. Flash-flood hazard assessment using ensembles and Bayesian-based machine learning models: Application of the simulated annealing feature selection method. Sci. Total Environ. 2020, 711, 135161. [Google Scholar] [CrossRef]
- Rana, I.A.; Routray, J.K. Integrated methodology for flood risk assessment and application in urban communities of Pakistan. Nat. Hazard. 2017, 91, 239–266. [Google Scholar] [CrossRef]
- Abebe, Y.; Kabir, G.; Tesfamariam, S. Assessing urban areas vulnerability to pluvial flooding using GIS applications and Bayesian Belief Network model. J. Clean. Prod. 2018, 174, 1629–1641. [Google Scholar] [CrossRef]
- Wu, Z.; Shen, Y.; Wang, H.; Wu, M. Assessing urban flood disaster risk using Bayesian network model and GIS applications. Geomat. Nat. Hazard. Risk 2019, 10, 2163–2184. [Google Scholar] [CrossRef]
- Julia Flores, M.; Ropero, R.F.; Rumi, R. Assessment of flood risk in Mediterranean catchments: An approach based on Bayesian networks. Stochastic Environ. Res. Risk Assess 2019, 33, 1991–2005. [Google Scholar] [CrossRef]
- Sanuy, M.; Jiménez, J.A.; Plant, N. A Bayesian Network methodology for coastal hazard assessments on a regional scale: The BN-CRAF. Coast. Eng. 2020, 157. [Google Scholar] [CrossRef]
- Balbi, S.; Villa, F.; Mojtahed, V.; Hegetschweiler, K.T.; Giupponi, C. A spatial Bayesian network model to assess the benefits of early warning for urban flood risk to people. Nat. Hazards Earth Syst. Sci. 2016, 16, 1323–1337. [Google Scholar] [CrossRef]
- Ma, Z.; Xie, Z. Evolution Mechanism of Earthquake-induced Urban Disasters Based on Bayesian Networks. J. Catastrophology 2012, 27, 1–5. (In Chinese) [Google Scholar] [CrossRef]
- Si, H.; Zhang, J.; Guo, E.; Rina, W.U.; Qiyun, M.A.; Wang, Y. Study on inference model of the grassland drought and snow disaster chain based on Bayesian networks. J. Nat. Disasters 2016, 25, 20–29. (In Chinese) [Google Scholar] [CrossRef]
- Xu, H.; Zhang, Y.; Li, H.; Skitmore, M.; Yang, J.; Yu, F. Safety risks in rail stations: An interactive approach. J. Rail Transp. Plann. Manag. 2019, 11, 100148. [Google Scholar] [CrossRef]
- Wu, Z.; Shen, Y.; Wang, H.; Wu, M. An ontology-based framework for heterogeneous data management and its application for urban flood disasters. Earth Sci. Inf. 2020, 13, 377–390. [Google Scholar] [CrossRef]
- Vogel, K.; Riggelsen, C.; Korup, O.; Scherbaum, F. Bayesian network learning for natural hazard analyses. Nat. Hazard. Earth Syst. Sci. 2014, 14, 2605–2626. [Google Scholar] [CrossRef]
- UNDRR. The Sendai Framework for Disaster Risk Reduction 2015–2030. 2015. Available online: https://www.preventionweb.net/files/resolutions/N1516715.pdf (accessed on 8 February 2021).
- Chen, Y.; Liu, R.; Barrett, D.; Gao, L.; Zhou, M.; Renzullo, L.; Emelyanova, I. A spatial assessment framework for evaluating flood risk under extreme climates. Sci. Total Environ. 2015, 538, 512–523. [Google Scholar] [CrossRef]
- Pearl, J. Probabilistic Reasoning in Intelligent Systems: Networks of Plausible Inference; Morgan Kaufmann: San Francisco, CA, USA, 1988. [Google Scholar]
- Chen, S.H.; Pollino, C.A. Good practice in Bayesian network modelling. Environ. Modell. Softw. 2012, 37, 134–145. [Google Scholar] [CrossRef]
- Laskey, K.B. Sensitivity analysis for probability assessments in Bayesian networks. IEEE Trans. Syst. Man Cybern. Syst. 1993, 25, 901–909. [Google Scholar] [CrossRef]
- Zhang, S.; Guo, H.; Zhu, K.; Yu, S.; Li, J. Multistage assignment optimization for emergency rescue teams in the disaster chain. Knowl. Syst. 2017, 137, 123–137. [Google Scholar] [CrossRef]
- Han, S.; Coulibaly, P. Bayesian flood forecasting methods: A review. J. Hydrol. 2017, 551, 340–351. [Google Scholar] [CrossRef]
- Theijssen, D.; ten Bosch, L.; Boves, L.; Cranen, B.; van Halteren, H. Choosing alternatives: Using Bayesian Networks and memory-based learning to study the dative alternation. Corpus Ling. Ling. Theory 2013, 9, 227–262. [Google Scholar] [CrossRef]
- BayesFusion. GeNIe. 2019. Available online: https://www.bayesfusion.com/ (accessed on 15 April 2020).
- Shadeed, S.; Almasri, M. Application of GIS-based SCS-CN method in West Bank catchments, Palestine. Water Sci. Eng. 2010, 3, 1–13. [Google Scholar] [CrossRef]
- Chen, W.; Xie, X.; Peng, J.; Shahabi, H.; Hong, H.; Bui, D.T.; Duan, Z.; Li, S.; Zhu, A.X. GIS-based landslide susceptibility evaluation using a novel hybrid integration approach of bivariate statistical based random forest method. CATENA 2018, 164, 135–149. [Google Scholar] [CrossRef]
- Chapi, K.; Singh, V.P.; Shirzadi, A.; Shahabi, H.; Bui, D.T.; Pham, B.T.; Khosravi, K. A novel hybrid artificial intelligence approach for flood susceptibility assessment. Environ. Modell. Softw. 2017, 95, 229–245. [Google Scholar] [CrossRef]
- Jiménez-Valverde, A. Insights into the area under the receiver operating characteristic curve (AUC) as a discrimination measure in species distribution modelling. Global Ecol. Biogeogr. 2012, 21, 498–507. [Google Scholar] [CrossRef]
- Wu, Z.; Shen, Y.; Wang, H. Assessing Urban Areas’ Vulnerability to Flood Disaster Based on Text Data: A Case Study in Zhengzhou City. Sustainability 2019, 11, 4548. [Google Scholar] [CrossRef]
- Sun, D.; Wang, H.; Huang, J.; Liu, G. Analysis of Urban Flood Disaster Risk in the Poyang Lake Basin and Land Type Adjustment Strategy Study —A Case Study of Jingdezhen City. Resour. Emviron. Yangtze Basin 2018, 27, 2856–2866. (In Chinese) [Google Scholar] [CrossRef]
- Hong, H.; Tsangaratos, P.; Ilia, I.; Liu, J.; Zhu, A.-X.; Chen, W. Application of fuzzy weight of evidence and data mining techniques in construction of flood susceptibility map of Poyang County, China. Sci Total Environ. 2018, 625, 575–588. [Google Scholar] [CrossRef] [PubMed]
- Maria, P.; Han, D.; Anna, L.J.; Risi, R.D.; Agarwal, J.; Huang, J. Resilient infrastructures for reducing urban flooding risks. In Water-Wise Cities and Sustainable Water Systems: Concepts, Technologies, and Applications; Wang, X.C., Fu, G., Eds.; IWA Publishing: London, UK, 2020; pp. 181–200. [Google Scholar]
- Granados-Bolaños, S.; Quesada-Román, A.; Alvarado, G.E. Low-cost UAV applications in dynamic tropical volcanic landforms. J. Volcanol. Geotherm. Res. 2020, 107143. [Google Scholar] [CrossRef]
Publisher’s Note: MDPI stays neutral with regard to jurisdictional claims in published maps and institutional affiliations. |
© 2021 by the authors. Licensee MDPI, Basel, Switzerland. This article is an open access article distributed under the terms and conditions of the Creative Commons Attribution (CC BY) license (http://creativecommons.org/licenses/by/4.0/).

